Morrison, CO Map & Demographics
Morrison Map
Morrison Overview
$45,474
PER CAPITA INCOME
$140,625
AVG FAMILY INCOME
$126,250
AVG HOUSEHOLD INCOME
29.5%
WAGE / INCOME GAP [ % ]
70.5¢/ $1
WAGE / INCOME GAP [ $ ]
0.33
INEQUALITY / GINI INDEX
393
TOTAL POPULATION
187
MALE POPULATION
206
FEMALE POPULATION
90.78
MALES / 100 FEMALES
110.16
FEMALES / 100 MALES
58.0
MEDIAN AGE
2.9
AVG FAMILY SIZE
2.2
AVG HOUSEHOLD SIZE
163
LABOR FORCE [ PEOPLE ]
45.0%
PERCENT IN LABOR FORCE
11.7%
UNEMPLOYMENT RATE
Morrison Zip Codes
Morrison Area Codes
Income in Morrison
Income Overview in Morrison
Per Capita Income in Morrison is $45,474, while median incomes of families and households are $140,625 and $126,250 respectively.
| Characteristic | Number | Measure |
| Per Capita Income | 393 | $45,474 |
| Median Family Income | 53 | $140,625 |
| Mean Family Income | 53 | $153,977 |
| Median Household Income | 114 | $126,250 |
| Mean Household Income | 114 | $128,075 |
| Income Deficit | 53 | $0 |
| Wage / Income Gap (%) | 393 | 29.45% |
| Wage / Income Gap ($) | 393 | 70.55¢ per $1 |
| Gini / Inequality Index | 393 | 0.33 |
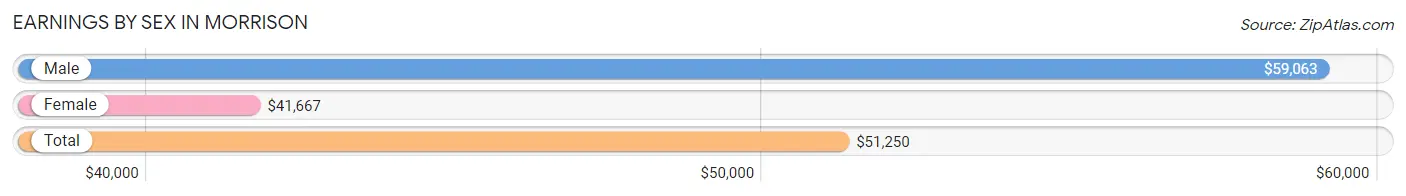
Earnings by Sex in Morrison
Average Earnings in Morrison are $51,250, $59,063 for men and $41,667 for women, a difference of 29.4%.
| Sex | Number | Average Earnings |
| Male | 104 (59.1%) | $59,063 |
| Female | 72 (40.9%) | $41,667 |
| Total | 176 (100.0%) | $51,250 |
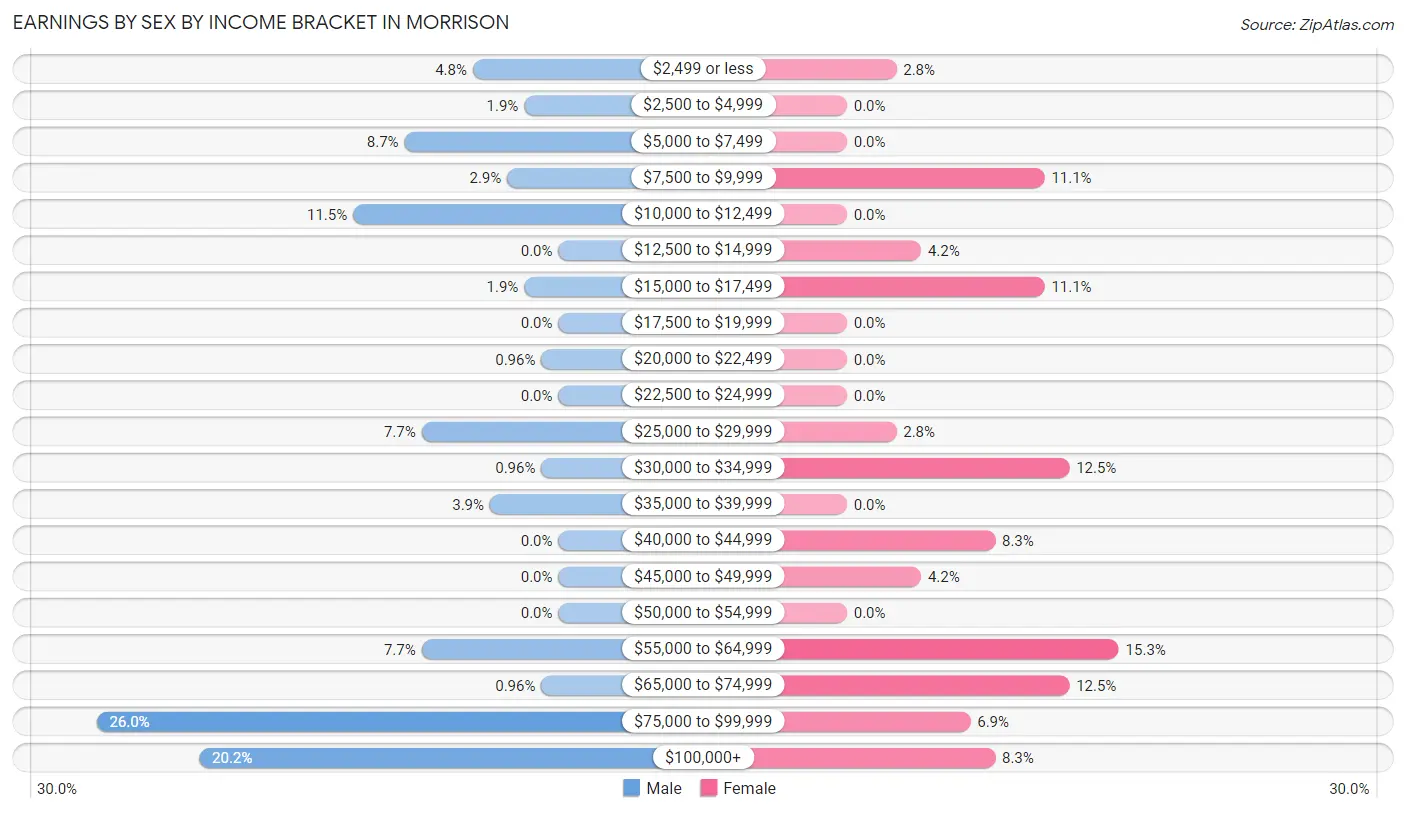
Earnings by Sex by Income Bracket in Morrison
The most common earnings brackets in Morrison are $75,000 to $99,999 for men (27 | 26.0%) and $55,000 to $64,999 for women (11 | 15.3%).
| Income | Male | Female |
| $2,499 or less | 5 (4.8%) | 2 (2.8%) |
| $2,500 to $4,999 | 2 (1.9%) | 0 (0.0%) |
| $5,000 to $7,499 | 9 (8.6%) | 0 (0.0%) |
| $7,500 to $9,999 | 3 (2.9%) | 8 (11.1%) |
| $10,000 to $12,499 | 12 (11.5%) | 0 (0.0%) |
| $12,500 to $14,999 | 0 (0.0%) | 3 (4.2%) |
| $15,000 to $17,499 | 2 (1.9%) | 8 (11.1%) |
| $17,500 to $19,999 | 0 (0.0%) | 0 (0.0%) |
| $20,000 to $22,499 | 1 (1.0%) | 0 (0.0%) |
| $22,500 to $24,999 | 0 (0.0%) | 0 (0.0%) |
| $25,000 to $29,999 | 8 (7.7%) | 2 (2.8%) |
| $30,000 to $34,999 | 1 (1.0%) | 9 (12.5%) |
| $35,000 to $39,999 | 4 (3.8%) | 0 (0.0%) |
| $40,000 to $44,999 | 0 (0.0%) | 6 (8.3%) |
| $45,000 to $49,999 | 0 (0.0%) | 3 (4.2%) |
| $50,000 to $54,999 | 0 (0.0%) | 0 (0.0%) |
| $55,000 to $64,999 | 8 (7.7%) | 11 (15.3%) |
| $65,000 to $74,999 | 1 (1.0%) | 9 (12.5%) |
| $75,000 to $99,999 | 27 (26.0%) | 5 (6.9%) |
| $100,000+ | 21 (20.2%) | 6 (8.3%) |
| Total | 104 (100.0%) | 72 (100.0%) |
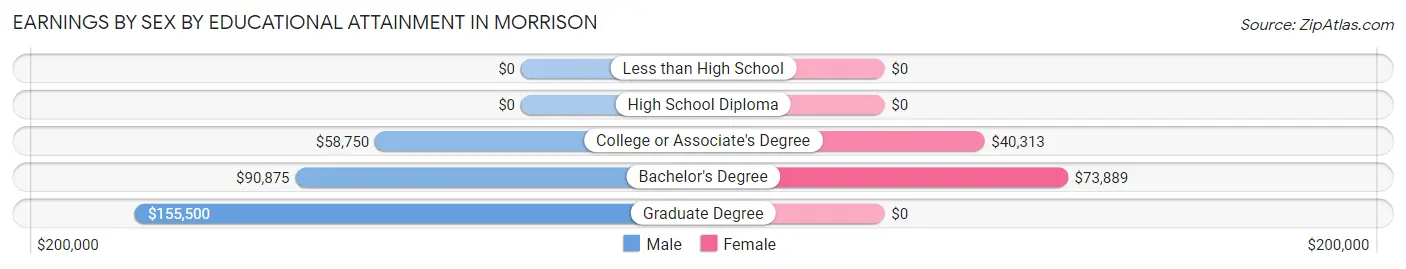
Earnings by Sex by Educational Attainment in Morrison
Average earnings in Morrison are $88,438 for men and $42,083 for women, a difference of 52.4%. Men with an educational attainment of graduate degree enjoy the highest average annual earnings of $155,500, while those with college or associate's degree education earn the least with $58,750. Women with an educational attainment of bachelor's degree earn the most with the average annual earnings of $73,889, while those with college or associate's degree education have the smallest earnings of $40,313.
| Educational Attainment | Male Income | Female Income |
| Less than High School | - | - |
| High School Diploma | - | - |
| College or Associate's Degree | $58,750 | $40,313 |
| Bachelor's Degree | $90,875 | $73,889 |
| Graduate Degree | $155,500 | $0 |
| Total | $88,438 | $42,083 |
Family Income in Morrison
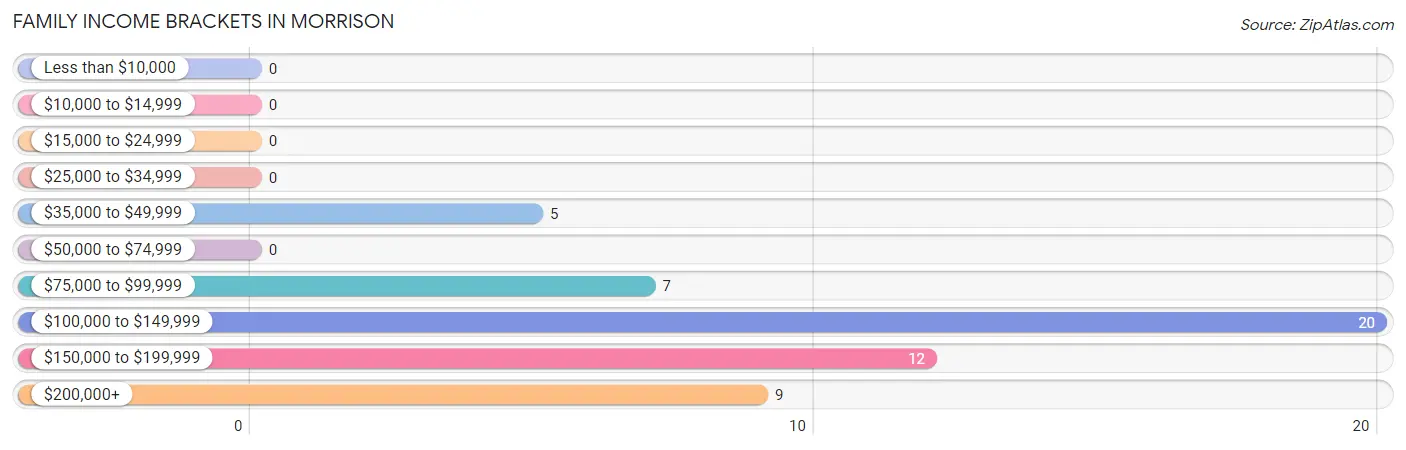
Family Income Brackets in Morrison
According to the Morrison family income data, there are 20 families falling into the $100,000 to $149,999 income range, which is the most common income bracket and makes up 37.7% of all families.
| Income Bracket | # Families | % Families |
| Less than $10,000 | 0 | 0.0% |
| $10,000 to $14,999 | 0 | 0.0% |
| $15,000 to $24,999 | 0 | 0.0% |
| $25,000 to $34,999 | 0 | 0.0% |
| $35,000 to $49,999 | 5 | 9.4% |
| $50,000 to $74,999 | 0 | 0.0% |
| $75,000 to $99,999 | 7 | 13.2% |
| $100,000 to $149,999 | 20 | 37.7% |
| $150,000 to $199,999 | 12 | 22.6% |
| $200,000+ | 9 | 17.0% |
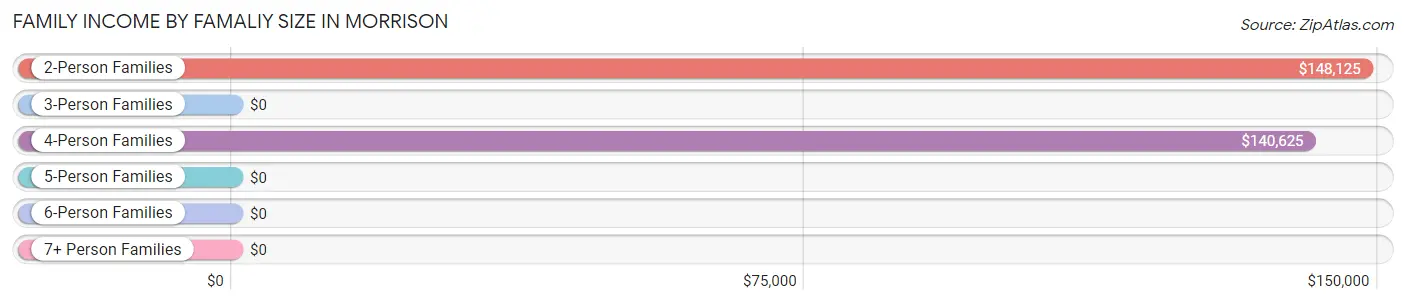
Family Income by Famaliy Size in Morrison
2-person families (32 | 60.4%) account for the highest median family income in Morrison with $148,125 per family, while 2-person families (32 | 60.4%) have the highest median income of $74,062 per family member.
| Income Bracket | # Families | Median Income |
| 2-Person Families | 32 (60.4%) | $148,125 |
| 3-Person Families | 5 (9.4%) | $0 |
| 4-Person Families | 11 (20.7%) | $140,625 |
| 5-Person Families | 5 (9.4%) | $0 |
| 6-Person Families | 0 (0.0%) | $0 |
| 7+ Person Families | 0 (0.0%) | $0 |
| Total | 53 (100.0%) | $140,625 |
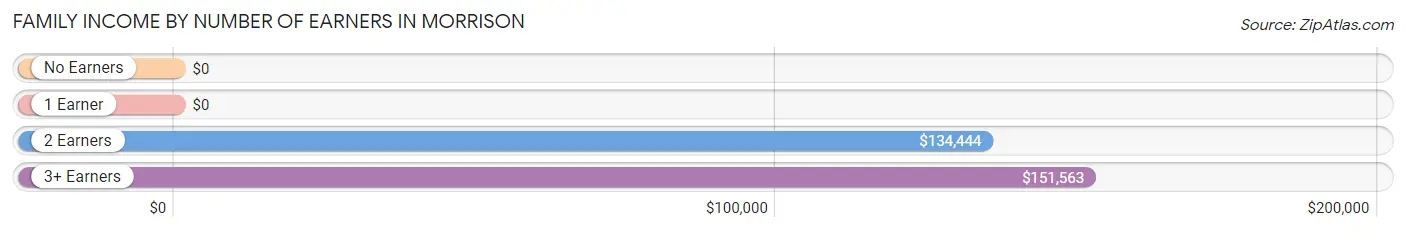
Family Income by Number of Earners in Morrison
| Number of Earners | # Families | Median Income |
| No Earners | 1 (1.9%) | $0 |
| 1 Earner | 13 (24.5%) | $0 |
| 2 Earners | 32 (60.4%) | $134,444 |
| 3+ Earners | 7 (13.2%) | $151,563 |
| Total | 53 (100.0%) | $140,625 |
Household Income in Morrison
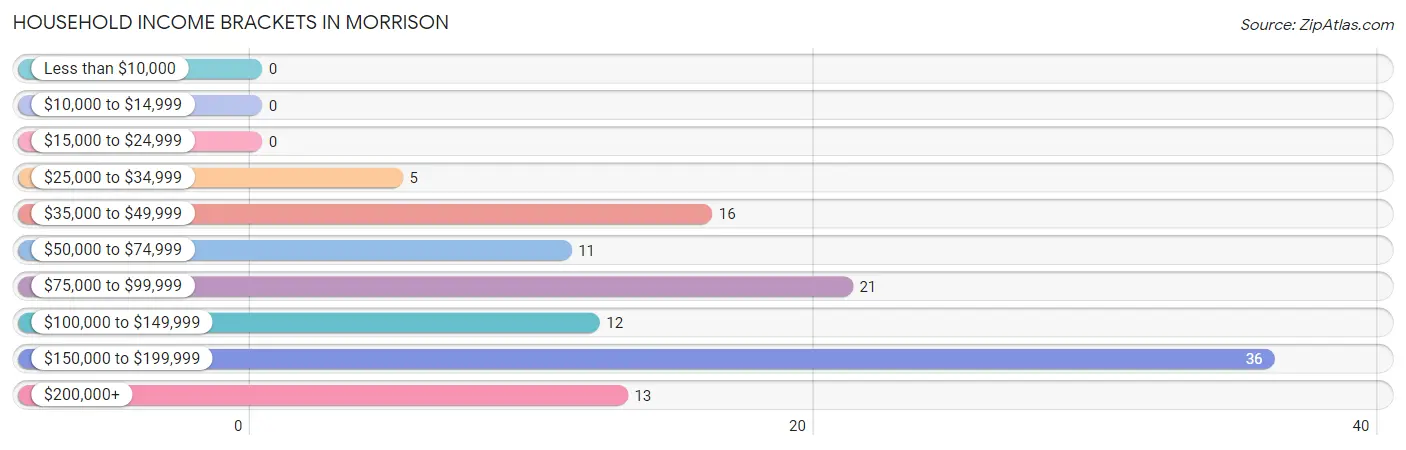
Household Income Brackets in Morrison
With 36 households falling in the category, the $150,000 to $199,999 income range is the most frequent in Morrison, accounting for 31.6% of all households.
| Income Bracket | # Households | % Households |
| Less than $10,000 | 0 | 0.0% |
| $10,000 to $14,999 | 0 | 0.0% |
| $15,000 to $24,999 | 0 | 0.0% |
| $25,000 to $34,999 | 5 | 4.4% |
| $35,000 to $49,999 | 16 | 14.0% |
| $50,000 to $74,999 | 11 | 9.6% |
| $75,000 to $99,999 | 21 | 18.4% |
| $100,000 to $149,999 | 12 | 10.5% |
| $150,000 to $199,999 | 36 | 31.6% |
| $200,000+ | 13 | 11.4% |
Household Income by Householder Age in Morrison
The median household income in Morrison is $126,250, with the highest median household income of $148,125 found in the 25 to 44 years age bracket for the primary householder. A total of 40 households (35.1%) fall into this category.
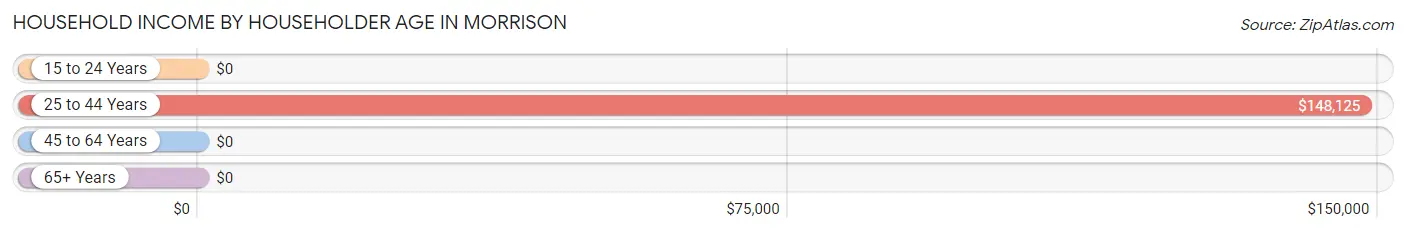
| Income Bracket | # Households | Median Income |
| 15 to 24 Years | 0 (0.0%) | $0 |
| 25 to 44 Years | 40 (35.1%) | $148,125 |
| 45 to 64 Years | 57 (50.0%) | $0 |
| 65+ Years | 17 (14.9%) | $0 |
| Total | 114 (100.0%) | $126,250 |
Poverty in Morrison
Income Below Poverty by Sex and Age in Morrison
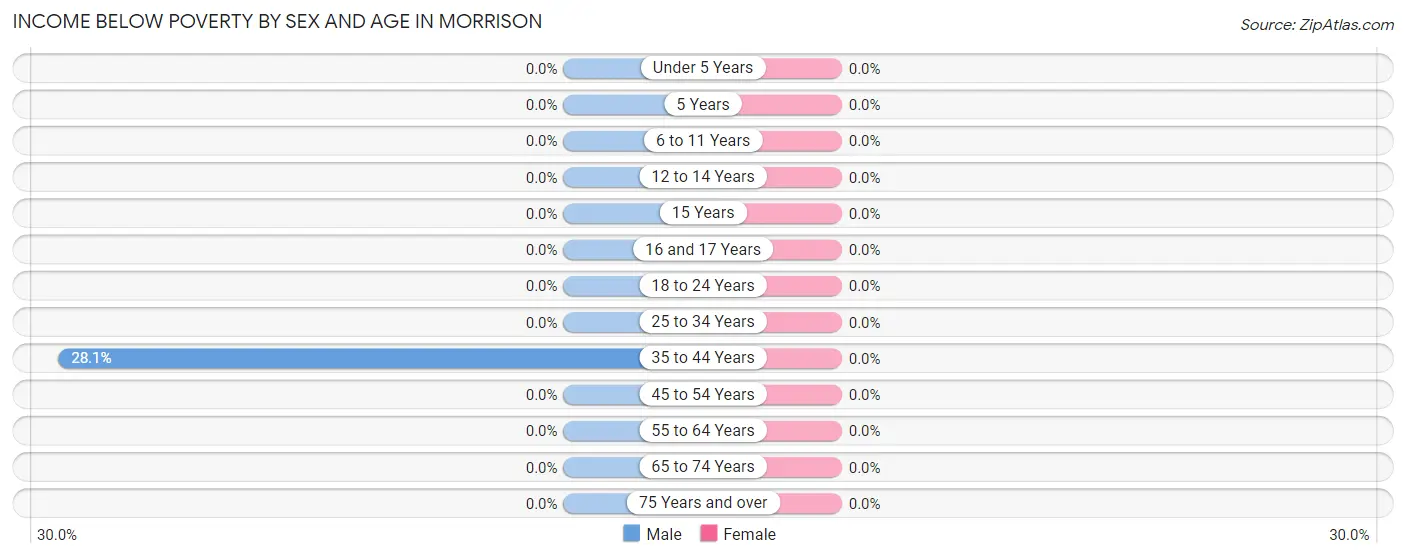
| Age Bracket | Male | Female |
| Under 5 Years | 0 (0.0%) | 0 (0.0%) |
| 5 Years | 0 (0.0%) | 0 (0.0%) |
| 6 to 11 Years | 0 (0.0%) | 0 (0.0%) |
| 12 to 14 Years | 0 (0.0%) | 0 (0.0%) |
| 15 Years | 0 (0.0%) | 0 (0.0%) |
| 16 and 17 Years | 0 (0.0%) | 0 (0.0%) |
| 18 to 24 Years | 0 (0.0%) | 0 (0.0%) |
| 25 to 34 Years | 0 (0.0%) | 0 (0.0%) |
| 35 to 44 Years | 9 (28.1%) | 0 (0.0%) |
| 45 to 54 Years | 0 (0.0%) | 0 (0.0%) |
| 55 to 64 Years | 0 (0.0%) | 0 (0.0%) |
| 65 to 74 Years | 0 (0.0%) | 0 (0.0%) |
| 75 Years and over | 0 (0.0%) | 0 (0.0%) |
| Total | 9 (5.8%) | 0 (0.0%) |
Income Above Poverty by Sex and Age in Morrison
According to the poverty statistics in Morrison, males aged under 5 years and females aged under 5 years are the age groups that are most secure financially, with 100.0% of males and 100.0% of females in these age groups living above the poverty line.
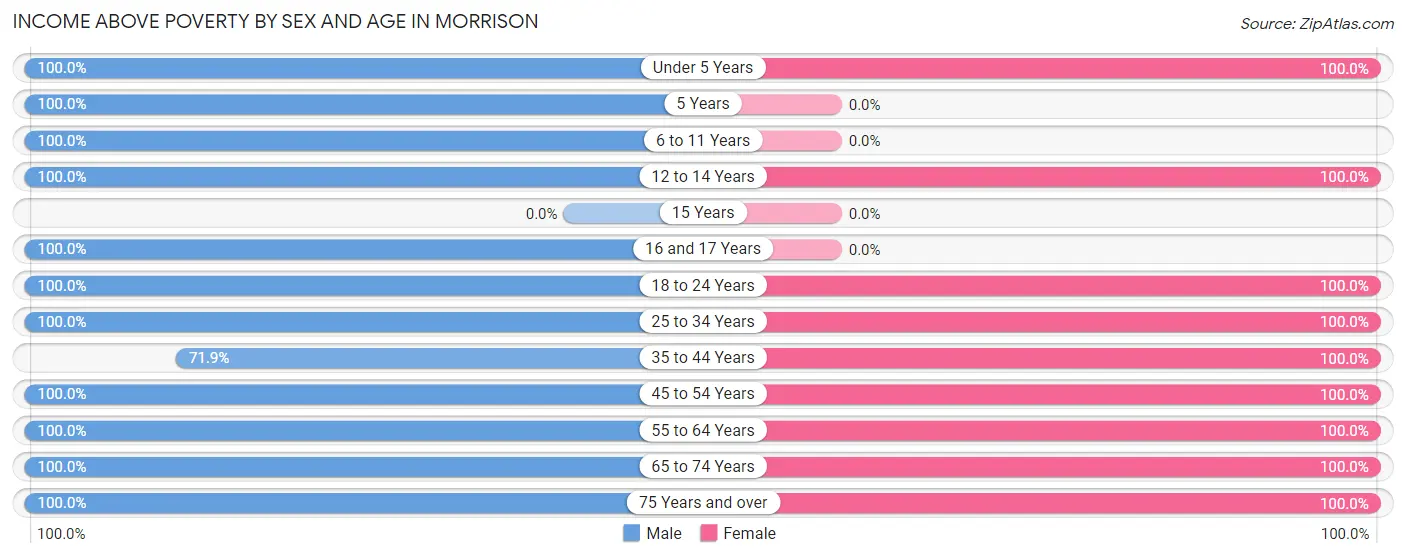
| Age Bracket | Male | Female |
| Under 5 Years | 4 (100.0%) | 7 (100.0%) |
| 5 Years | 4 (100.0%) | 0 (0.0%) |
| 6 to 11 Years | 10 (100.0%) | 0 (0.0%) |
| 12 to 14 Years | 3 (100.0%) | 3 (100.0%) |
| 15 Years | 0 (0.0%) | 0 (0.0%) |
| 16 and 17 Years | 6 (100.0%) | 0 (0.0%) |
| 18 to 24 Years | 14 (100.0%) | 2 (100.0%) |
| 25 to 34 Years | 7 (100.0%) | 16 (100.0%) |
| 35 to 44 Years | 23 (71.9%) | 26 (100.0%) |
| 45 to 54 Years | 34 (100.0%) | 6 (100.0%) |
| 55 to 64 Years | 21 (100.0%) | 22 (100.0%) |
| 65 to 74 Years | 13 (100.0%) | 4 (100.0%) |
| 75 Years and over | 7 (100.0%) | 6 (100.0%) |
| Total | 146 (94.2%) | 92 (100.0%) |
Income Below Poverty Among Married-Couple Families in Morrison
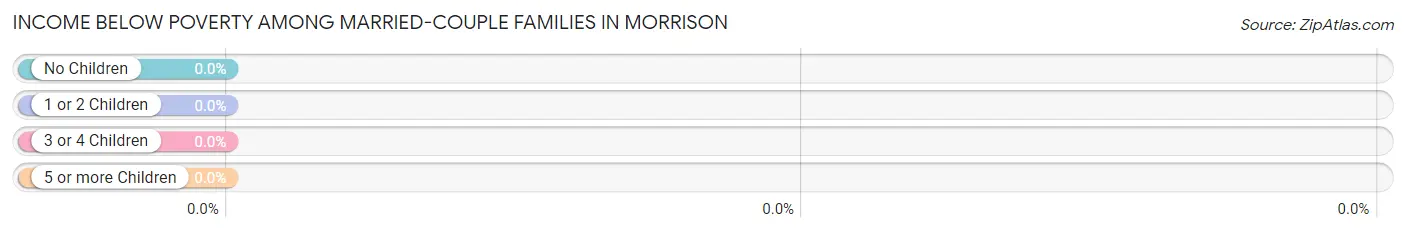
| Children | Above Poverty | Below Poverty |
| No Children | 22 (100.0%) | 0 (0.0%) |
| 1 or 2 Children | 12 (100.0%) | 0 (0.0%) |
| 3 or 4 Children | 3 (100.0%) | 0 (0.0%) |
| 5 or more Children | 0 (0.0%) | 0 (0.0%) |
| Total | 37 (100.0%) | 0 (0.0%) |
Income Below Poverty Among Single-Parent Households in Morrison
| Children | Single Father | Single Mother |
| No Children | 0 (0.0%) | 0 (0.0%) |
| 1 or 2 Children | 0 (0.0%) | 0 (0.0%) |
| 3 or 4 Children | 0 (0.0%) | 0 (0.0%) |
| 5 or more Children | 0 (0.0%) | 0 (0.0%) |
| Total | 0 (0.0%) | 0 (0.0%) |
Income Below Poverty Among Married-Couple vs Single-Parent Households in Morrison
| Children | Married-Couple Families | Single-Parent Households |
| No Children | 0 (0.0%) | 0 (0.0%) |
| 1 or 2 Children | 0 (0.0%) | 0 (0.0%) |
| 3 or 4 Children | 0 (0.0%) | 0 (0.0%) |
| 5 or more Children | 0 (0.0%) | 0 (0.0%) |
| Total | 0 (0.0%) | 0 (0.0%) |
Race in Morrison
The most populous races in Morrison are White / Caucasian (367 | 93.4%), Black / African American (9 | 2.3%), and Two or more Races (8 | 2.0%).
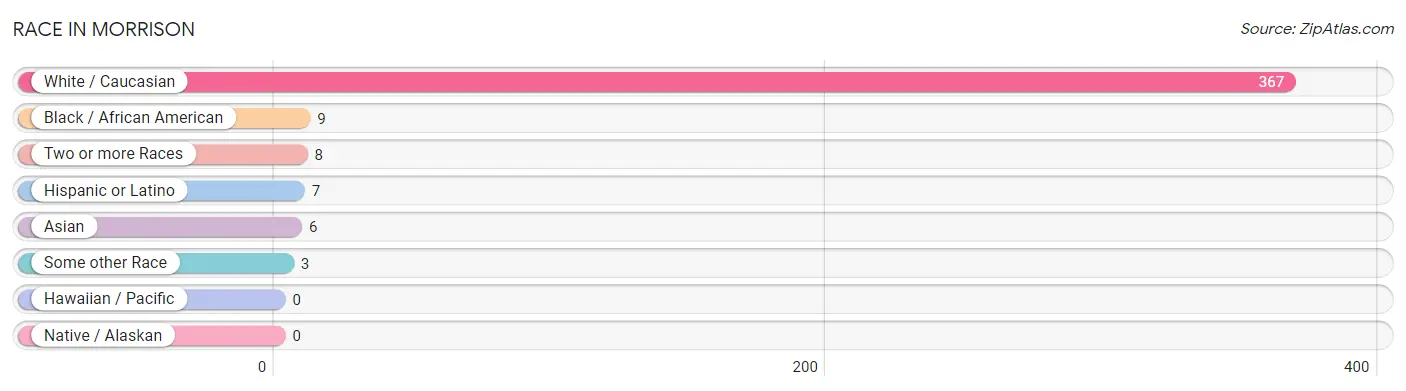
| Race | # Population | % Population |
| Asian | 6 | 1.5% |
| Black / African American | 9 | 2.3% |
| Hawaiian / Pacific | 0 | 0.0% |
| Hispanic or Latino | 7 | 1.8% |
| Native / Alaskan | 0 | 0.0% |
| White / Caucasian | 367 | 93.4% |
| Two or more Races | 8 | 2.0% |
| Some other Race | 3 | 0.8% |
| Total | 393 | 100.0% |
Ancestry in Morrison
The most populous ancestries reported in Morrison are German (70 | 17.8%), Irish (40 | 10.2%), English (36 | 9.2%), Swedish (23 | 5.9%), and Welsh (21 | 5.3%), together accounting for 48.3% of all Morrison residents.
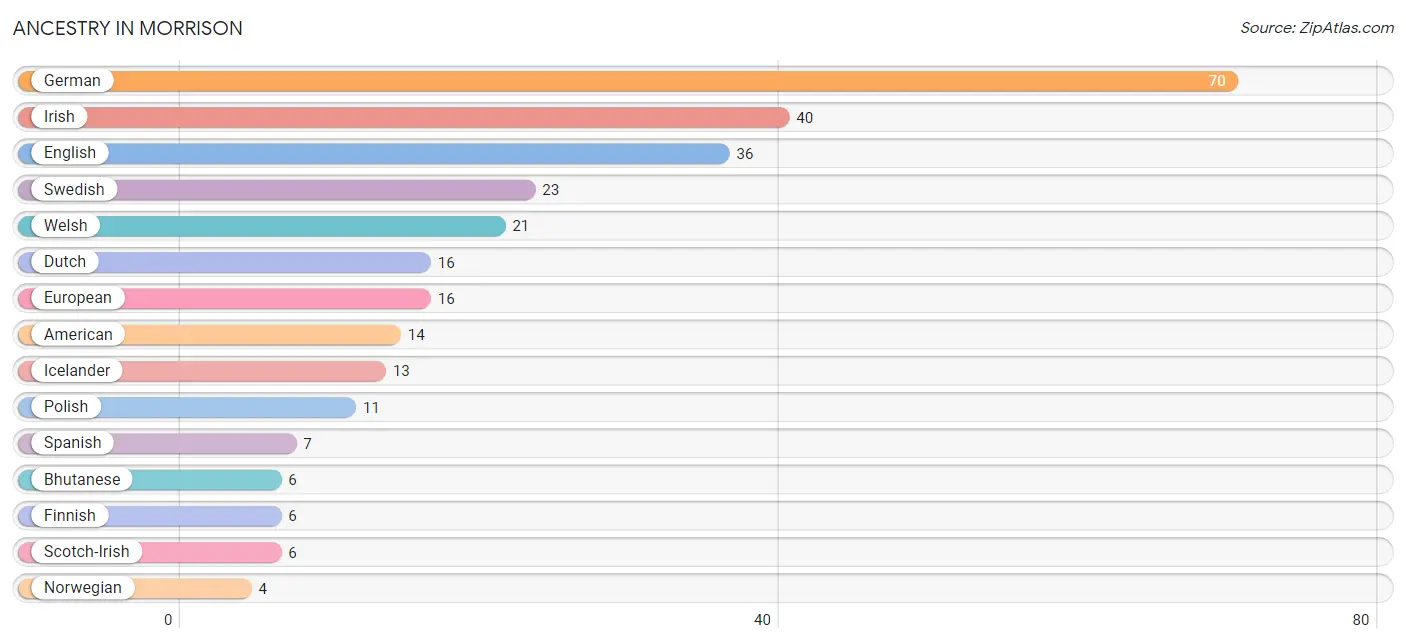
| Ancestry | # Population | % Population |
| American | 14 | 3.6% |
| Bhutanese | 6 | 1.5% |
| Cherokee | 1 | 0.3% |
| Dutch | 16 | 4.1% |
| English | 36 | 9.2% |
| European | 16 | 4.1% |
| Finnish | 6 | 1.5% |
| French | 1 | 0.3% |
| German | 70 | 17.8% |
| Icelander | 13 | 3.3% |
| Irish | 40 | 10.2% |
| Italian | 2 | 0.5% |
| Norwegian | 4 | 1.0% |
| Polish | 11 | 2.8% |
| Scotch-Irish | 6 | 1.5% |
| Scottish | 3 | 0.8% |
| Spanish | 7 | 1.8% |
| Swedish | 23 | 5.9% |
| Welsh | 21 | 5.3% | View All 19 Rows |
Immigrants in Morrison

| Immigration Origin | # Population | % Population | View All 0 Rows |
Sex and Age in Morrison
Sex and Age in Morrison
The most populous age groups in Morrison are 35 to 39 Years (35 | 18.7%) for men and 75 to 79 Years (55 | 26.7%) for women.
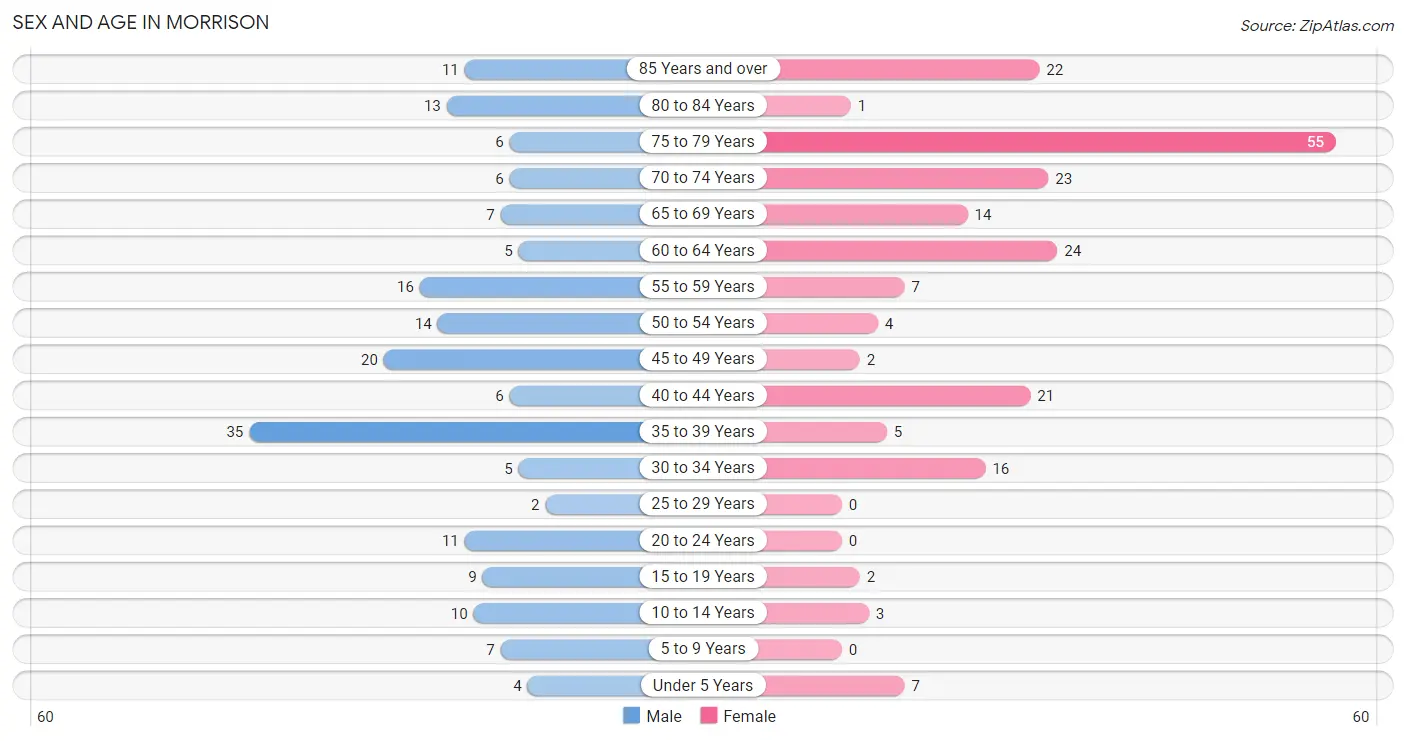
| Age Bracket | Male | Female |
| Under 5 Years | 4 (2.1%) | 7 (3.4%) |
| 5 to 9 Years | 7 (3.7%) | 0 (0.0%) |
| 10 to 14 Years | 10 (5.3%) | 3 (1.5%) |
| 15 to 19 Years | 9 (4.8%) | 2 (1.0%) |
| 20 to 24 Years | 11 (5.9%) | 0 (0.0%) |
| 25 to 29 Years | 2 (1.1%) | 0 (0.0%) |
| 30 to 34 Years | 5 (2.7%) | 16 (7.8%) |
| 35 to 39 Years | 35 (18.7%) | 5 (2.4%) |
| 40 to 44 Years | 6 (3.2%) | 21 (10.2%) |
| 45 to 49 Years | 20 (10.7%) | 2 (1.0%) |
| 50 to 54 Years | 14 (7.5%) | 4 (1.9%) |
| 55 to 59 Years | 16 (8.6%) | 7 (3.4%) |
| 60 to 64 Years | 5 (2.7%) | 24 (11.7%) |
| 65 to 69 Years | 7 (3.7%) | 14 (6.8%) |
| 70 to 74 Years | 6 (3.2%) | 23 (11.2%) |
| 75 to 79 Years | 6 (3.2%) | 55 (26.7%) |
| 80 to 84 Years | 13 (7.0%) | 1 (0.5%) |
| 85 Years and over | 11 (5.9%) | 22 (10.7%) |
| Total | 187 (100.0%) | 206 (100.0%) |
Families and Households in Morrison
Median Family Size in Morrison
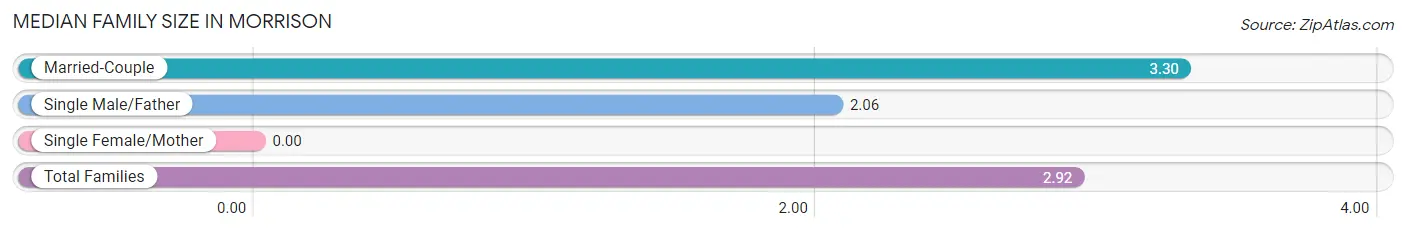
| Family Type | # Families | Family Size |
| Married-Couple | 37 (69.8%) | 3.30 |
| Single Male/Father | 16 (30.2%) | 2.06 |
| Single Female/Mother | 0 (0.0%) | - |
| Total Families | 53 (100.0%) | 2.92 |
Median Household Size in Morrison
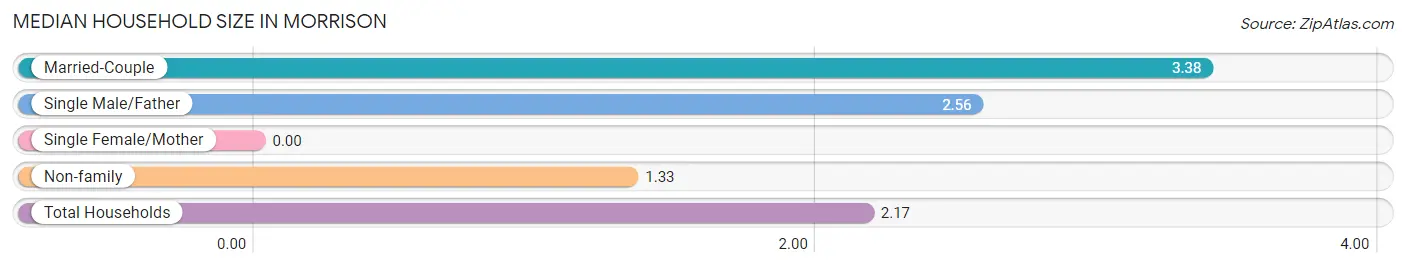
| Household Type | # Households | Household Size |
| Married-Couple | 37 (32.5%) | 3.38 |
| Single Male/Father | 16 (14.0%) | 2.56 |
| Single Female/Mother | 0 (0.0%) | - |
| Non-family | 61 (53.5%) | 1.33 |
| Total Households | 114 (100.0%) | 2.17 |
Household Size by Marriage Status in Morrison
Out of a total of 114 households in Morrison, 53 (46.5%) are family households, while 61 (53.5%) are nonfamily households. The most numerous type of family households are 2-person households, comprising 21, and the most common type of nonfamily households are 1-person households, comprising 41.
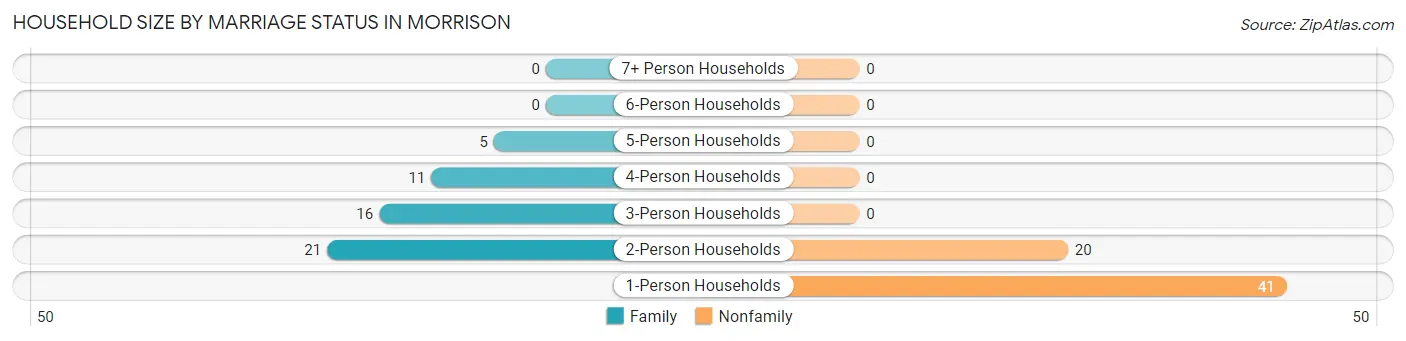
| Household Size | Family Households | Nonfamily Households |
| 1-Person Households | - | 41 (36.0%) |
| 2-Person Households | 21 (18.4%) | 20 (17.5%) |
| 3-Person Households | 16 (14.0%) | 0 (0.0%) |
| 4-Person Households | 11 (9.7%) | 0 (0.0%) |
| 5-Person Households | 5 (4.4%) | 0 (0.0%) |
| 6-Person Households | 0 (0.0%) | 0 (0.0%) |
| 7+ Person Households | 0 (0.0%) | 0 (0.0%) |
| Total | 53 (46.5%) | 61 (53.5%) |
Female Fertility in Morrison
Fertility by Age in Morrison
| Age Bracket | Women with Births | Births / 1,000 Women |
| 15 to 19 years | 0 (0.0%) | 0.0 |
| 20 to 34 years | 0 (0.0%) | 0.0 |
| 35 to 50 years | 0 (0.0%) | 0.0 |
| Total | 0 (0.0%) | 0.0 |
Fertility by Age by Marriage Status in Morrison
| Age Bracket | Married | Unmarried |
| 15 to 19 years | 0 (0.0%) | 0 (0.0%) |
| 20 to 34 years | 0 (0.0%) | 0 (0.0%) |
| 35 to 50 years | 0 (0.0%) | 0 (0.0%) |
| Total | 0 (0.0%) | 0 (0.0%) |
Fertility by Education in Morrison
| Educational Attainment | Women with Births | Births / 1,000 Women |
| Less than High School | 0 (0.0%) | 0.0 |
| High School Diploma | 0 (0.0%) | 0.0 |
| College or Associate's Degree | 0 (0.0%) | 0.0 |
| Bachelor's Degree | 0 (0.0%) | 0.0 |
| Graduate Degree | 0 (0.0%) | 0.0 |
| Total | 0 (0.0%) | 0.0 |
Fertility by Education by Marriage Status in Morrison
| Educational Attainment | Married | Unmarried |
| Less than High School | 0 (0.0%) | 0 (0.0%) |
| High School Diploma | 0 (0.0%) | 0 (0.0%) |
| College or Associate's Degree | 0 (0.0%) | 0 (0.0%) |
| Bachelor's Degree | 0 (0.0%) | 0 (0.0%) |
| Graduate Degree | 0 (0.0%) | 0 (0.0%) |
| Total | 0 (0.0%) | 0 (0.0%) |
Employment Characteristics in Morrison
Employment by Class of Employer in Morrison
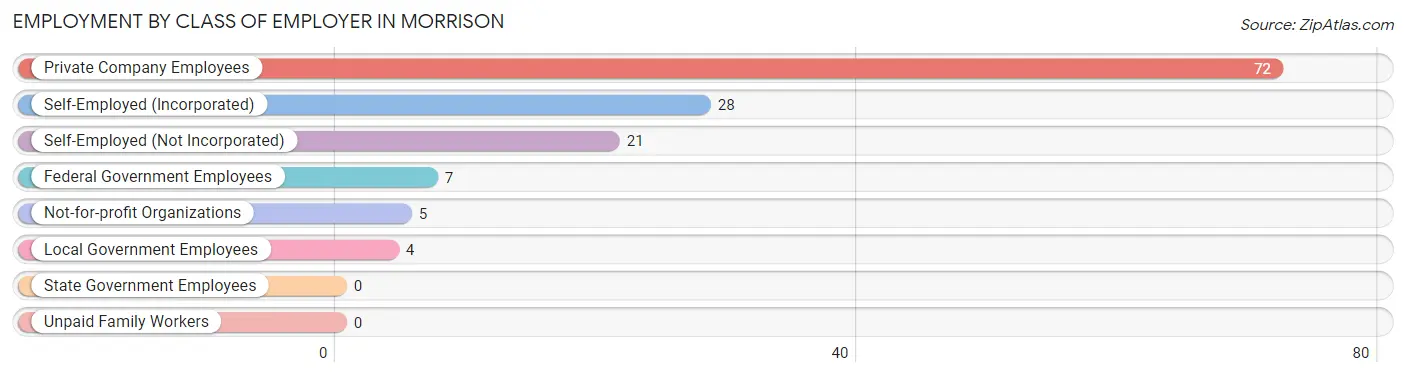
Among the 137 employed individuals in Morrison, private company employees (72 | 52.5%), self-employed (incorporated) (28 | 20.4%), and self-employed (not incorporated) (21 | 15.3%) make up the most common classes of employment.
| Employer Class | # Employees | % Employees |
| Private Company Employees | 72 | 52.5% |
| Self-Employed (Incorporated) | 28 | 20.4% |
| Self-Employed (Not Incorporated) | 21 | 15.3% |
| Not-for-profit Organizations | 5 | 3.6% |
| Local Government Employees | 4 | 2.9% |
| State Government Employees | 0 | 0.0% |
| Federal Government Employees | 7 | 5.1% |
| Unpaid Family Workers | 0 | 0.0% |
| Total | 137 | 100.0% |
Employment Status by Age in Morrison
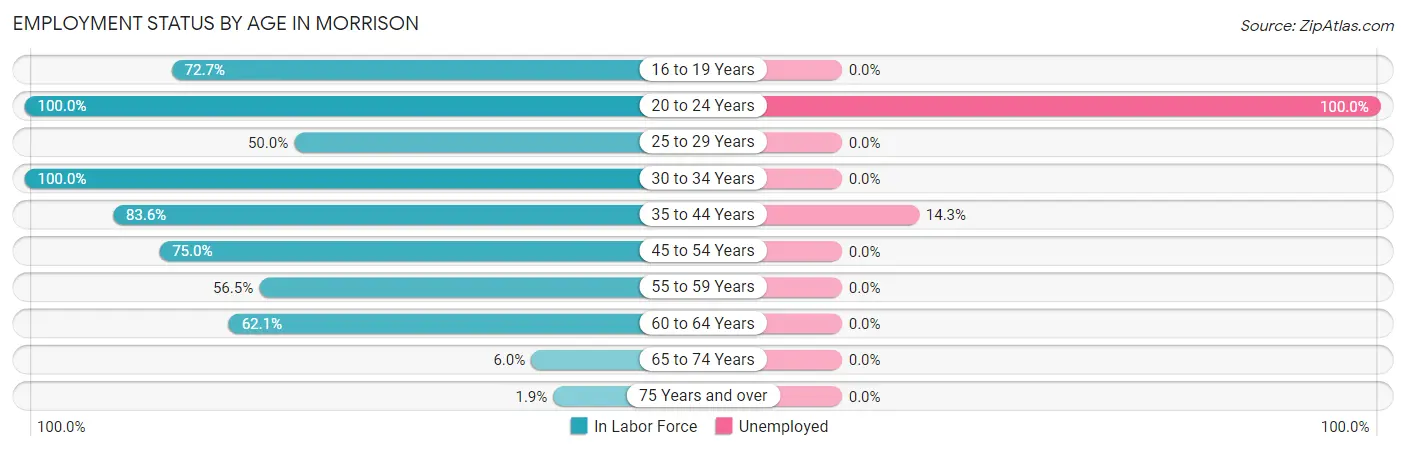
According to the labor force statistics for Morrison, out of the total population over 16 years of age (362), 45.0% or 163 individuals are in the labor force, with 11.7% or 19 of them unemployed. The age group with the highest labor force participation rate is 20 to 24 years, with 100.0% or 11 individuals in the labor force. Within the labor force, the 20 to 24 years age range has the highest percentage of unemployed individuals, with 100.0% or 11 of them being unemployed.
| Age Bracket | In Labor Force | Unemployed |
| 16 to 19 Years | 8 (72.7%) | 0 (0.0%) |
| 20 to 24 Years | 11 (100.0%) | 11 (100.0%) |
| 25 to 29 Years | 1 (50.0%) | 0 (0.0%) |
| 30 to 34 Years | 21 (100.0%) | 0 (0.0%) |
| 35 to 44 Years | 56 (83.6%) | 8 (14.3%) |
| 45 to 54 Years | 30 (75.0%) | 0 (0.0%) |
| 55 to 59 Years | 13 (56.5%) | 0 (0.0%) |
| 60 to 64 Years | 18 (62.1%) | 0 (0.0%) |
| 65 to 74 Years | 3 (6.0%) | 0 (0.0%) |
| 75 Years and over | 2 (1.9%) | 0 (0.0%) |
| Total | 163 (45.0%) | 19 (11.7%) |
Employment Status by Educational Attainment in Morrison
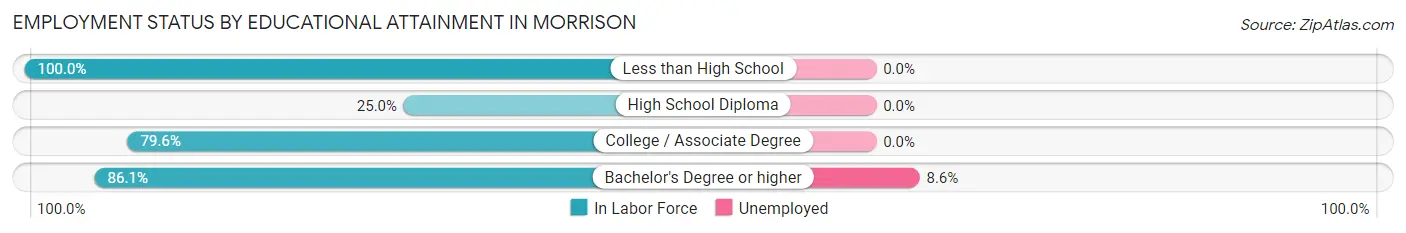
According to labor force statistics for Morrison, 76.4% of individuals (139) out of the total population between 25 and 64 years of age (182) are in the labor force, with 5.8% or 8 of them being unemployed. The group with the highest labor force participation rate are those with the educational attainment of less than high school, with 100.0% or 1 individuals in the labor force. Within the labor force, individuals with bachelor's degree or higher education have the highest percentage of unemployment, with 8.6% or 8 of them being unemployed.
| Educational Attainment | In Labor Force | Unemployed |
| Less than High School | 1 (100.0%) | 0 (0.0%) |
| High School Diploma | 6 (25.0%) | 0 (0.0%) |
| College / Associate Degree | 39 (79.6%) | 0 (0.0%) |
| Bachelor's Degree or higher | 93 (86.1%) | 9 (8.6%) |
| Total | 139 (76.4%) | 11 (5.8%) |
Employment Occupations by Sex in Morrison
Management, Business, Science and Arts Occupations
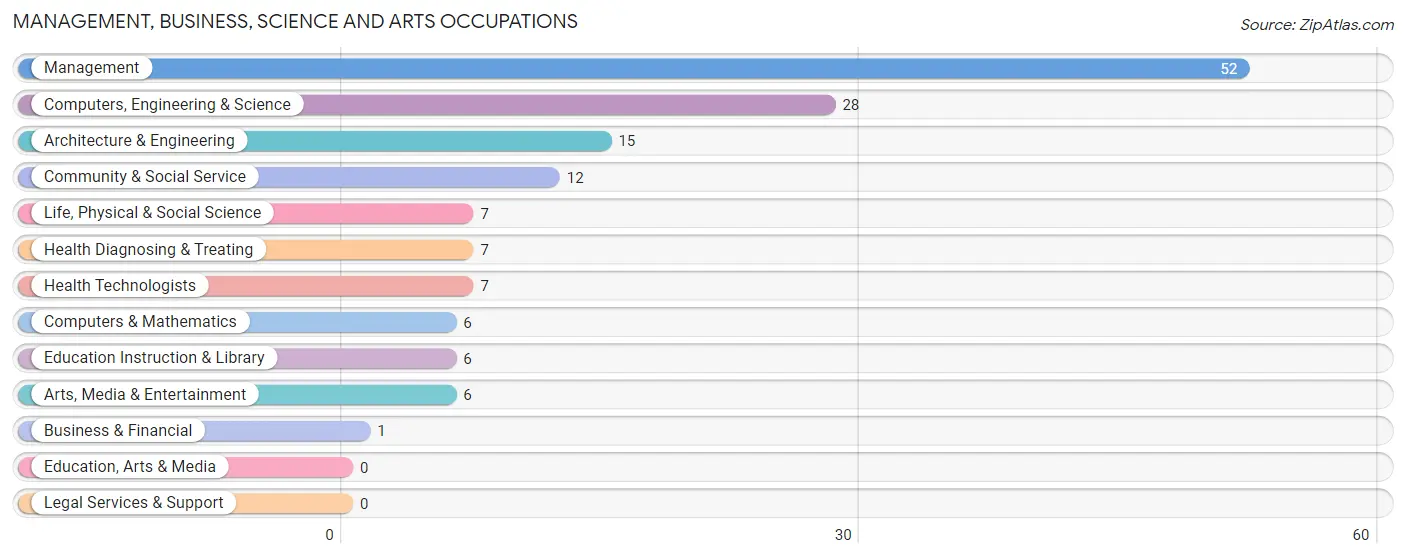
The most common Management, Business, Science and Arts occupations in Morrison are Management (52 | 36.1%), Computers, Engineering & Science (28 | 19.4%), Architecture & Engineering (15 | 10.4%), Community & Social Service (12 | 8.3%), and Life, Physical & Social Science (7 | 4.9%).
Management, Business, Science and Arts Occupations by Sex
Within the Management, Business, Science and Arts occupations in Morrison, the most male-oriented occupations are Business & Financial (100.0%), Architecture & Engineering (100.0%), and Computers, Engineering & Science (60.7%), while the most female-oriented occupations are Life, Physical & Social Science (100.0%), Health Diagnosing & Treating (71.4%), and Health Technologists (71.4%).
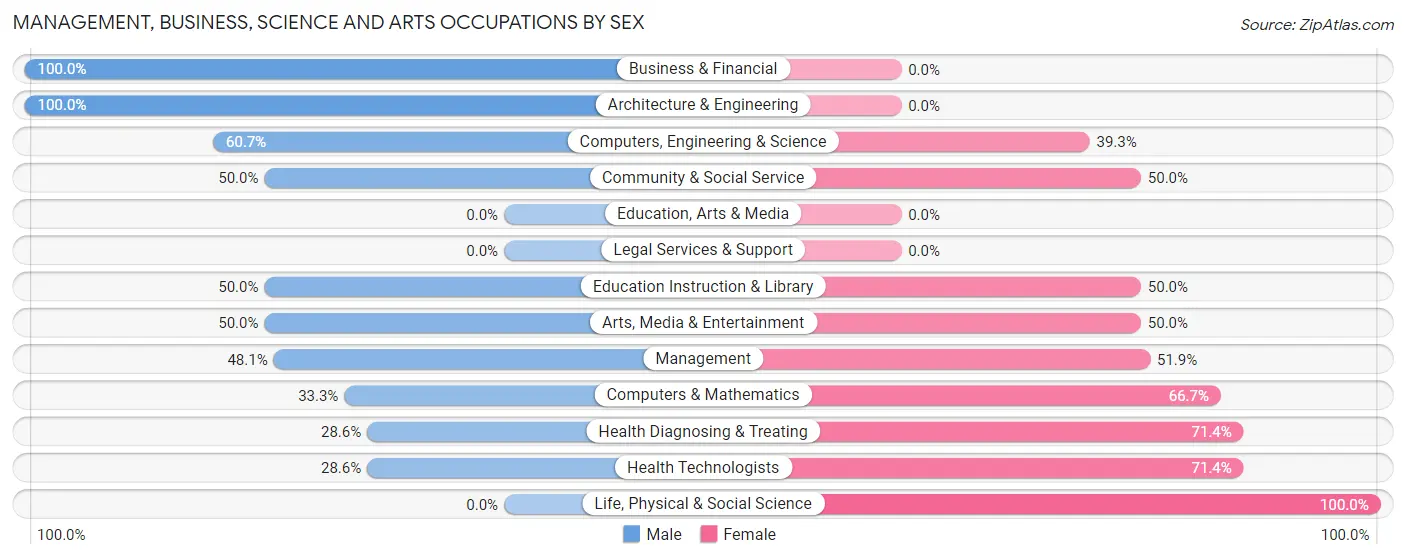
| Occupation | Male | Female |
| Management | 25 (48.1%) | 27 (51.9%) |
| Business & Financial | 1 (100.0%) | 0 (0.0%) |
| Computers, Engineering & Science | 17 (60.7%) | 11 (39.3%) |
| Computers & Mathematics | 2 (33.3%) | 4 (66.7%) |
| Architecture & Engineering | 15 (100.0%) | 0 (0.0%) |
| Life, Physical & Social Science | 0 (0.0%) | 7 (100.0%) |
| Community & Social Service | 6 (50.0%) | 6 (50.0%) |
| Education, Arts & Media | 0 (0.0%) | 0 (0.0%) |
| Legal Services & Support | 0 (0.0%) | 0 (0.0%) |
| Education Instruction & Library | 3 (50.0%) | 3 (50.0%) |
| Arts, Media & Entertainment | 3 (50.0%) | 3 (50.0%) |
| Health Diagnosing & Treating | 2 (28.6%) | 5 (71.4%) |
| Health Technologists | 2 (28.6%) | 5 (71.4%) |
| Total (Category) | 51 (51.0%) | 49 (49.0%) |
| Total (Overall) | 82 (56.9%) | 62 (43.1%) |
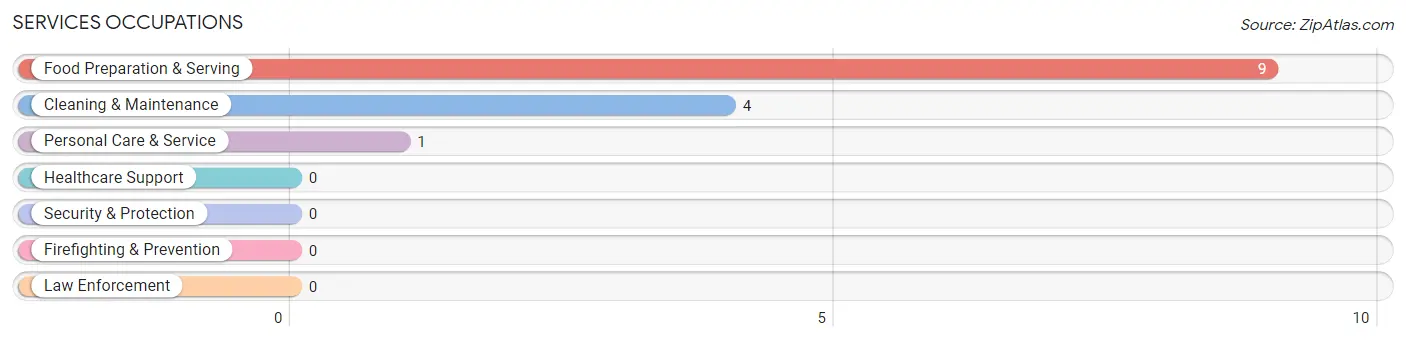
Services Occupations
The most common Services occupations in Morrison are Food Preparation & Serving (9 | 6.2%), Cleaning & Maintenance (4 | 2.8%), and Personal Care & Service (1 | 0.7%).
Services Occupations by Sex
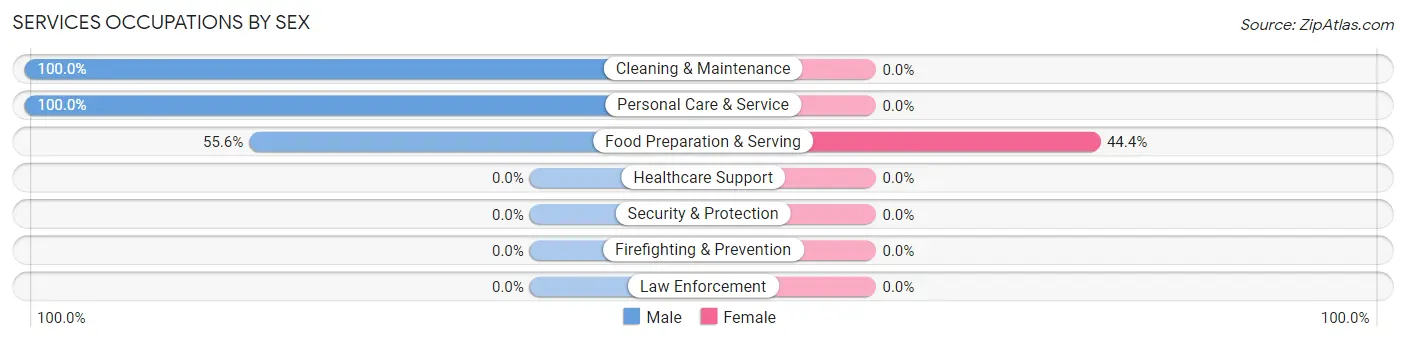
| Occupation | Male | Female |
| Healthcare Support | 0 (0.0%) | 0 (0.0%) |
| Security & Protection | 0 (0.0%) | 0 (0.0%) |
| Firefighting & Prevention | 0 (0.0%) | 0 (0.0%) |
| Law Enforcement | 0 (0.0%) | 0 (0.0%) |
| Food Preparation & Serving | 5 (55.6%) | 4 (44.4%) |
| Cleaning & Maintenance | 4 (100.0%) | 0 (0.0%) |
| Personal Care & Service | 1 (100.0%) | 0 (0.0%) |
| Total (Category) | 10 (71.4%) | 4 (28.6%) |
| Total (Overall) | 82 (56.9%) | 62 (43.1%) |
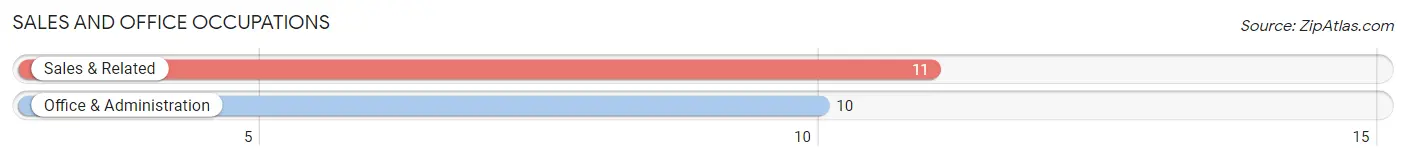
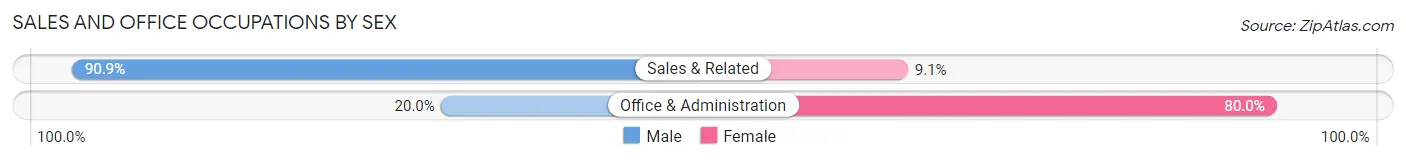
Sales and Office Occupations
The most common Sales and Office occupations in Morrison are Sales & Related (11 | 7.6%), and Office & Administration (10 | 6.9%).
Sales and Office Occupations by Sex
| Occupation | Male | Female |
| Sales & Related | 10 (90.9%) | 1 (9.1%) |
| Office & Administration | 2 (20.0%) | 8 (80.0%) |
| Total (Category) | 12 (57.1%) | 9 (42.9%) |
| Total (Overall) | 82 (56.9%) | 62 (43.1%) |
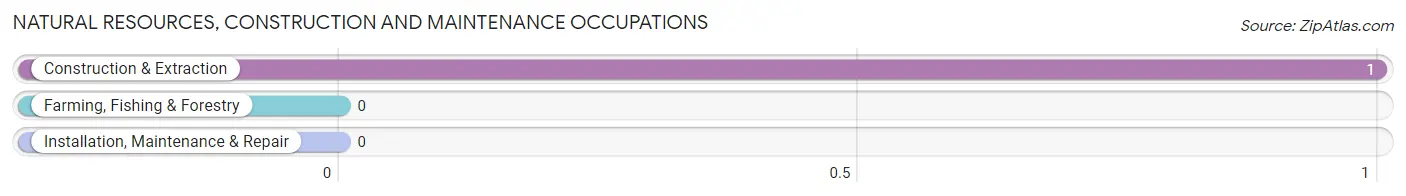
Natural Resources, Construction and Maintenance Occupations
The most common Natural Resources, Construction and Maintenance occupations in Morrison are , and Construction & Extraction (1 | 0.7%).
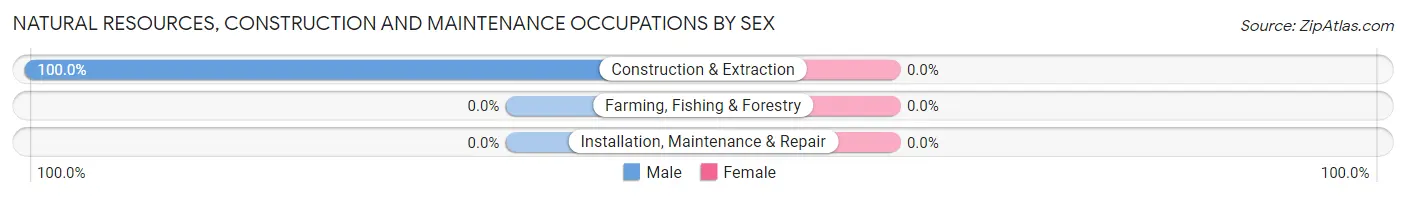
Natural Resources, Construction and Maintenance Occupations by Sex
| Occupation | Male | Female |
| Farming, Fishing & Forestry | 0 (0.0%) | 0 (0.0%) |
| Construction & Extraction | 1 (100.0%) | 0 (0.0%) |
| Installation, Maintenance & Repair | 0 (0.0%) | 0 (0.0%) |
| Total (Category) | 1 (100.0%) | 0 (0.0%) |
| Total (Overall) | 82 (56.9%) | 62 (43.1%) |
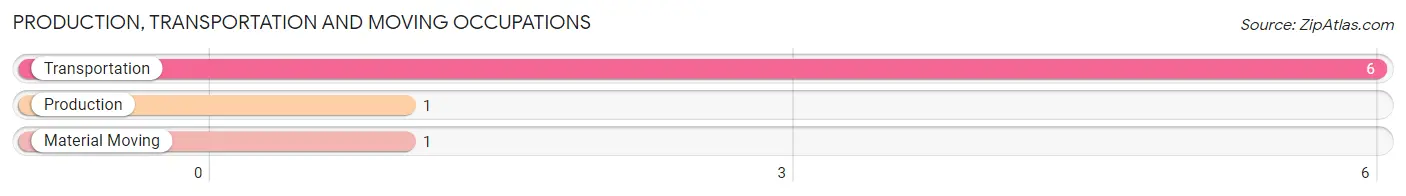
Production, Transportation and Moving Occupations
The most common Production, Transportation and Moving occupations in Morrison are Transportation (6 | 4.2%), Production (1 | 0.7%), and Material Moving (1 | 0.7%).
Production, Transportation and Moving Occupations by Sex
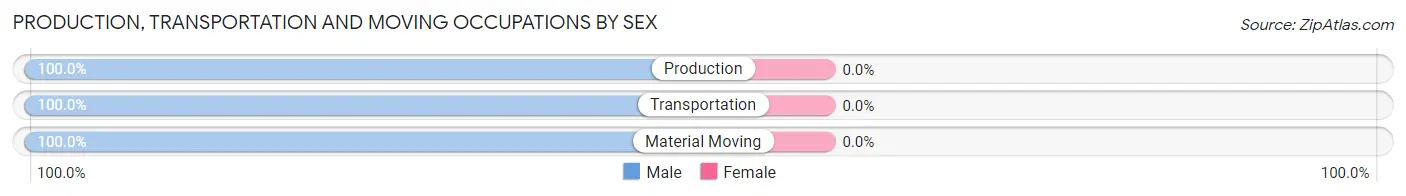
| Occupation | Male | Female |
| Production | 1 (100.0%) | 0 (0.0%) |
| Transportation | 6 (100.0%) | 0 (0.0%) |
| Material Moving | 1 (100.0%) | 0 (0.0%) |
| Total (Category) | 8 (100.0%) | 0 (0.0%) |
| Total (Overall) | 82 (56.9%) | 62 (43.1%) |
Employment Industries by Sex in Morrison
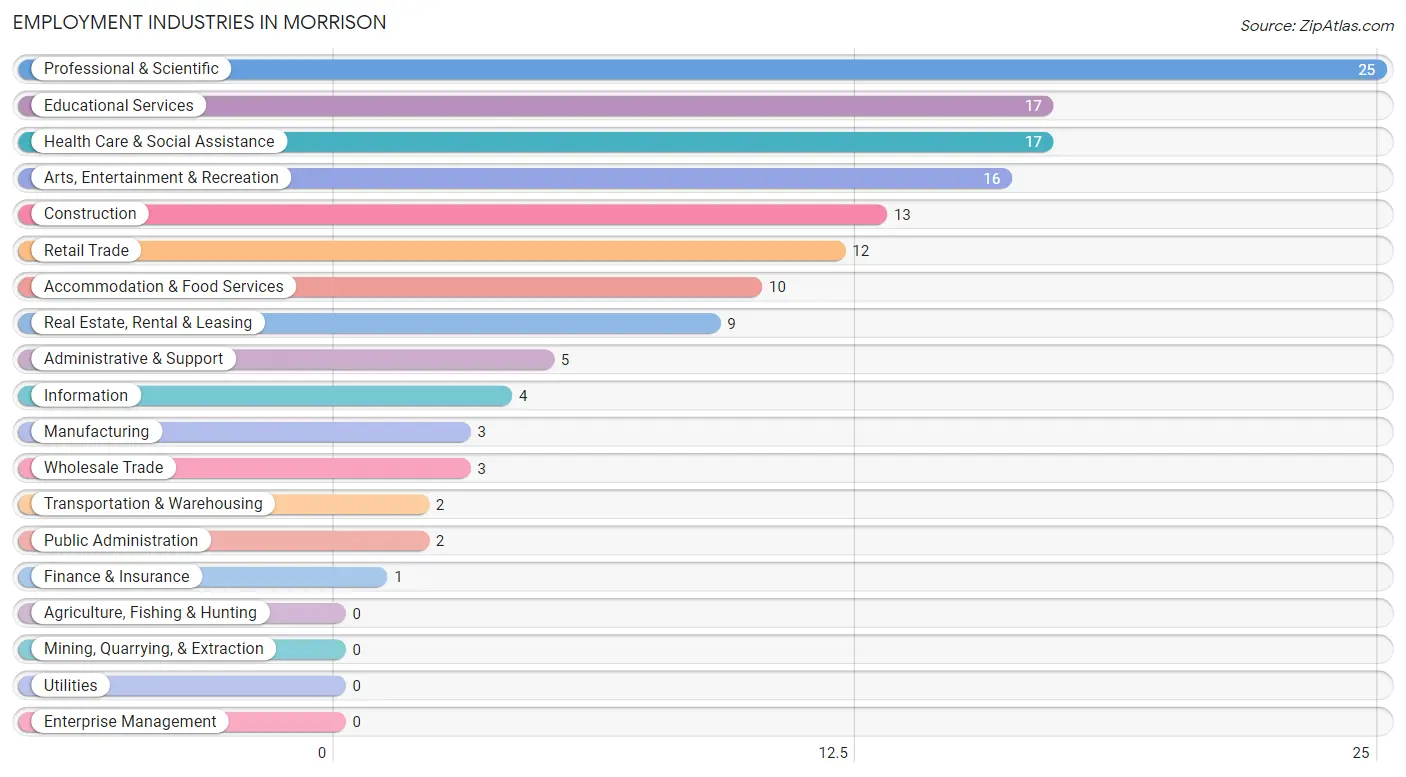
Employment Industries in Morrison
The major employment industries in Morrison include Professional & Scientific (25 | 17.4%), Educational Services (17 | 11.8%), Health Care & Social Assistance (17 | 11.8%), Arts, Entertainment & Recreation (16 | 11.1%), and Construction (13 | 9.0%).
Employment Industries by Sex in Morrison
The Morrison industries that see more men than women are Manufacturing (100.0%), Information (100.0%), and Finance & Insurance (100.0%), whereas the industries that tend to have a higher number of women are Transportation & Warehousing (100.0%), Public Administration (100.0%), and Educational Services (82.4%).
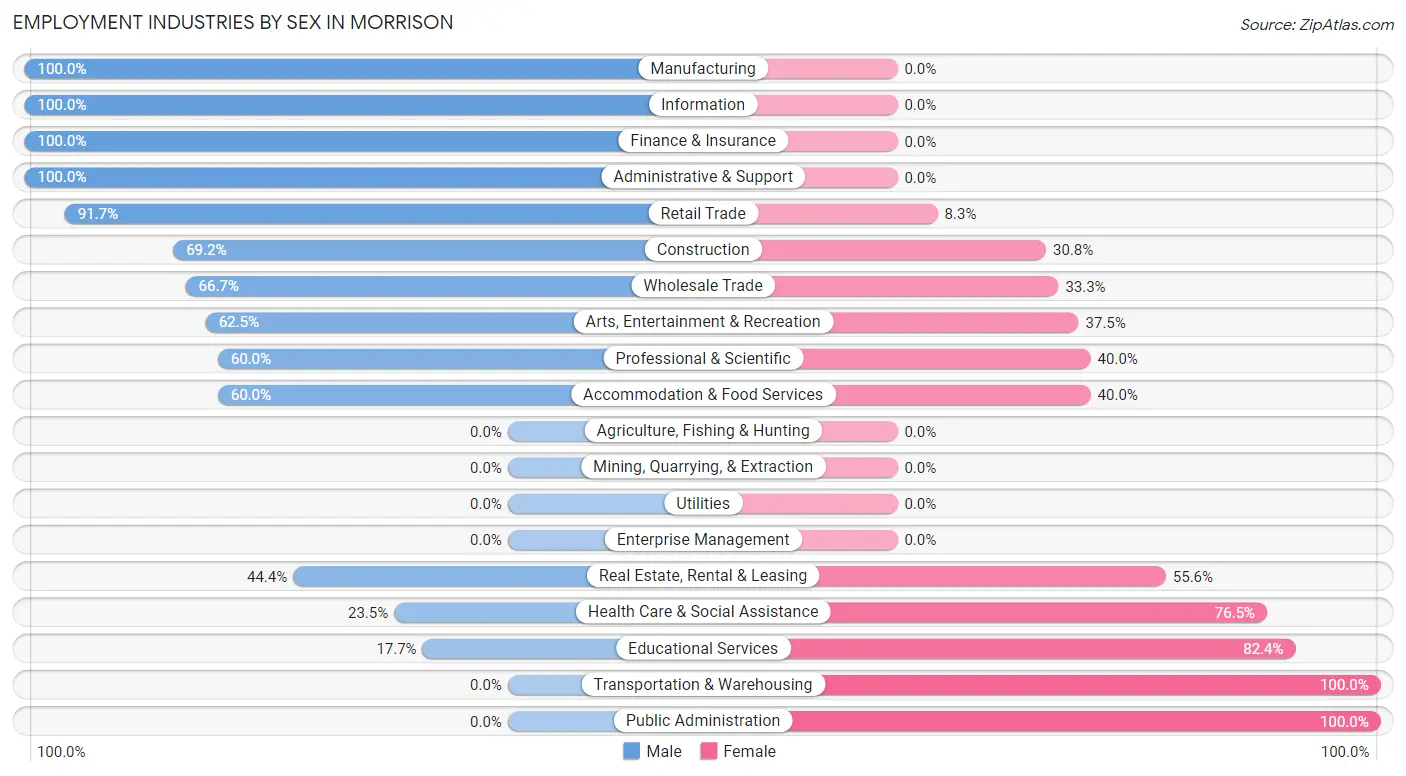
| Industry | Male | Female |
| Agriculture, Fishing & Hunting | 0 (0.0%) | 0 (0.0%) |
| Mining, Quarrying, & Extraction | 0 (0.0%) | 0 (0.0%) |
| Construction | 9 (69.2%) | 4 (30.8%) |
| Manufacturing | 3 (100.0%) | 0 (0.0%) |
| Wholesale Trade | 2 (66.7%) | 1 (33.3%) |
| Retail Trade | 11 (91.7%) | 1 (8.3%) |
| Transportation & Warehousing | 0 (0.0%) | 2 (100.0%) |
| Utilities | 0 (0.0%) | 0 (0.0%) |
| Information | 4 (100.0%) | 0 (0.0%) |
| Finance & Insurance | 1 (100.0%) | 0 (0.0%) |
| Real Estate, Rental & Leasing | 4 (44.4%) | 5 (55.6%) |
| Professional & Scientific | 15 (60.0%) | 10 (40.0%) |
| Enterprise Management | 0 (0.0%) | 0 (0.0%) |
| Administrative & Support | 5 (100.0%) | 0 (0.0%) |
| Educational Services | 3 (17.6%) | 14 (82.4%) |
| Health Care & Social Assistance | 4 (23.5%) | 13 (76.5%) |
| Arts, Entertainment & Recreation | 10 (62.5%) | 6 (37.5%) |
| Accommodation & Food Services | 6 (60.0%) | 4 (40.0%) |
| Public Administration | 0 (0.0%) | 2 (100.0%) |
| Total | 82 (56.9%) | 62 (43.1%) |
Education in Morrison
School Enrollment in Morrison
The most common levels of schooling among the 40 students in Morrison are middle school (13 | 32.5%), high school (8 | 20.0%), and nursery / preschool (7 | 17.5%).
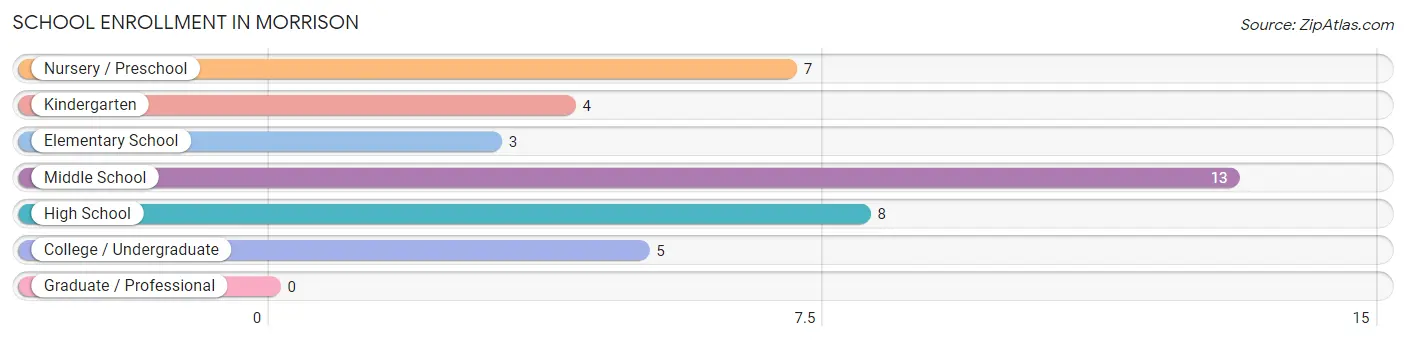
| School Level | # Students | % Students |
| Nursery / Preschool | 7 | 17.5% |
| Kindergarten | 4 | 10.0% |
| Elementary School | 3 | 7.5% |
| Middle School | 13 | 32.5% |
| High School | 8 | 20.0% |
| College / Undergraduate | 5 | 12.5% |
| Graduate / Professional | 0 | 0.0% |
| Total | 40 | 100.0% |
School Enrollment by Age by Funding Source in Morrison
Out of a total of 40 students who are enrolled in schools in Morrison, 7 (17.5%) attend a private institution, while the remaining 33 (82.5%) are enrolled in public schools. The age group of 3 to 4 year olds has the highest likelihood of being enrolled in private schools, with 7 (100.0% in the age bracket) enrolled. Conversely, the age group of 5 to 9 year old has the lowest likelihood of being enrolled in a private school, with 7 (100.0% in the age bracket) attending a public institution.
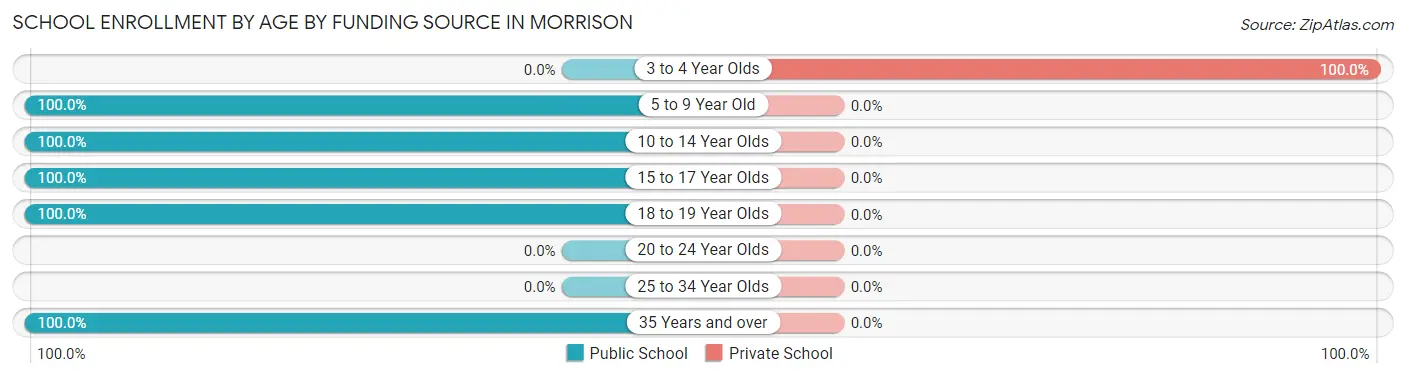
| Age Bracket | Public School | Private School |
| 3 to 4 Year Olds | 0 (0.0%) | 7 (100.0%) |
| 5 to 9 Year Old | 7 (100.0%) | 0 (0.0%) |
| 10 to 14 Year Olds | 13 (100.0%) | 0 (0.0%) |
| 15 to 17 Year Olds | 6 (100.0%) | 0 (0.0%) |
| 18 to 19 Year Olds | 5 (100.0%) | 0 (0.0%) |
| 20 to 24 Year Olds | 0 (0.0%) | 0 (0.0%) |
| 25 to 34 Year Olds | 0 (0.0%) | 0 (0.0%) |
| 35 Years and over | 2 (100.0%) | 0 (0.0%) |
| Total | 33 (82.5%) | 7 (17.5%) |
Educational Attainment by Field of Study in Morrison
Business (32 | 22.9%), education (17 | 12.1%), engineering (16 | 11.4%), literature & languages (15 | 10.7%), and communications (14 | 10.0%) are the most common fields of study among 140 individuals in Morrison who have obtained a bachelor's degree or higher.
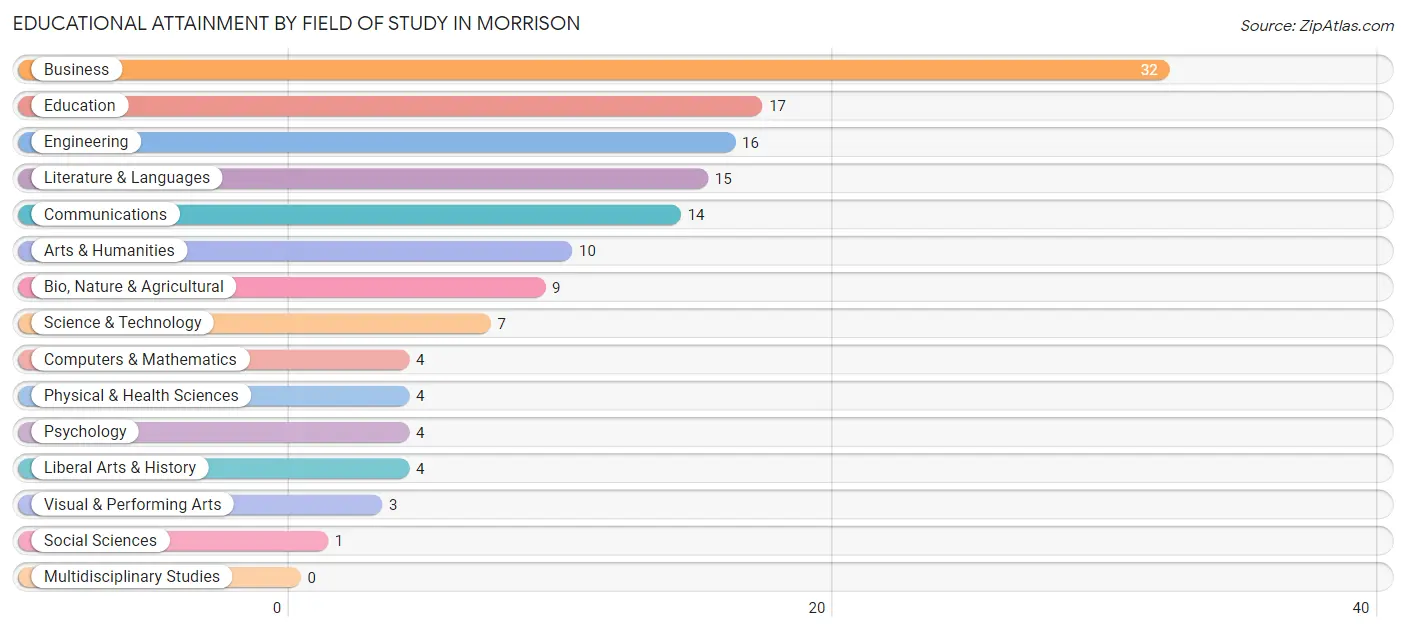
| Field of Study | # Graduates | % Graduates |
| Computers & Mathematics | 4 | 2.9% |
| Bio, Nature & Agricultural | 9 | 6.4% |
| Physical & Health Sciences | 4 | 2.9% |
| Psychology | 4 | 2.9% |
| Social Sciences | 1 | 0.7% |
| Engineering | 16 | 11.4% |
| Multidisciplinary Studies | 0 | 0.0% |
| Science & Technology | 7 | 5.0% |
| Business | 32 | 22.9% |
| Education | 17 | 12.1% |
| Literature & Languages | 15 | 10.7% |
| Liberal Arts & History | 4 | 2.9% |
| Visual & Performing Arts | 3 | 2.1% |
| Communications | 14 | 10.0% |
| Arts & Humanities | 10 | 7.1% |
| Total | 140 | 100.0% |
Transportation & Commute in Morrison
Vehicle Availability by Sex in Morrison
The most prevalent vehicle ownership categories in Morrison are males with 1 vehicle (26, accounting for 34.7%) and females with 1 vehicle (23, making up 41.9%).
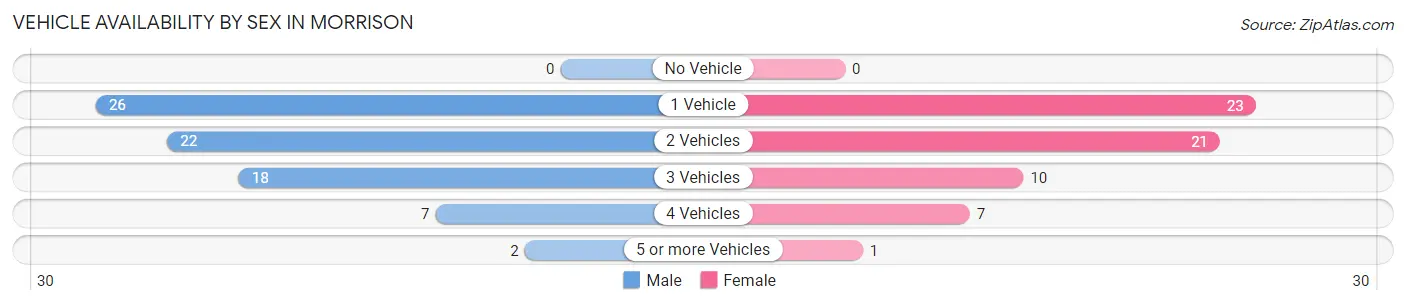
| Vehicles Available | Male | Female |
| No Vehicle | 0 (0.0%) | 0 (0.0%) |
| 1 Vehicle | 26 (34.7%) | 23 (37.1%) |
| 2 Vehicles | 22 (29.3%) | 21 (33.9%) |
| 3 Vehicles | 18 (24.0%) | 10 (16.1%) |
| 4 Vehicles | 7 (9.3%) | 7 (11.3%) |
| 5 or more Vehicles | 2 (2.7%) | 1 (1.6%) |
| Total | 75 (100.0%) | 62 (100.0%) |
Commute Time in Morrison
The most frequently occuring commute durations in Morrison are 30 to 34 minutes (27 commuters, 28.1%), 25 to 29 minutes (12 commuters, 12.5%), and 40 to 44 minutes (10 commuters, 10.4%).
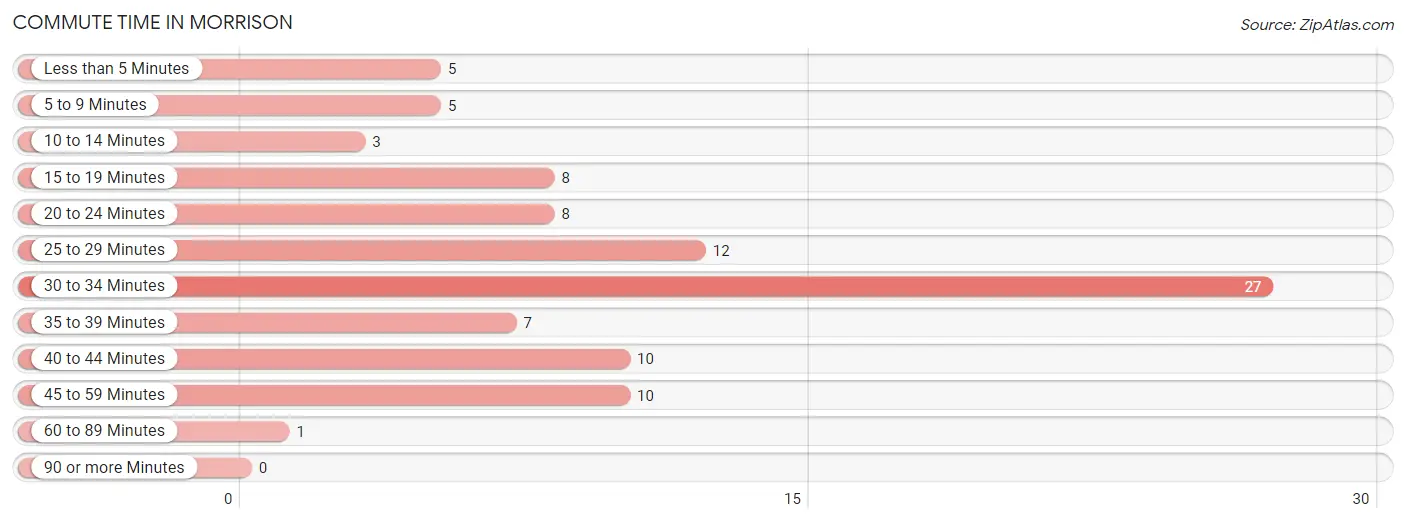
| Commute Time | # Commuters | % Commuters |
| Less than 5 Minutes | 5 | 5.2% |
| 5 to 9 Minutes | 5 | 5.2% |
| 10 to 14 Minutes | 3 | 3.1% |
| 15 to 19 Minutes | 8 | 8.3% |
| 20 to 24 Minutes | 8 | 8.3% |
| 25 to 29 Minutes | 12 | 12.5% |
| 30 to 34 Minutes | 27 | 28.1% |
| 35 to 39 Minutes | 7 | 7.3% |
| 40 to 44 Minutes | 10 | 10.4% |
| 45 to 59 Minutes | 10 | 10.4% |
| 60 to 89 Minutes | 1 | 1.0% |
| 90 or more Minutes | 0 | 0.0% |
Commute Time by Sex in Morrison
The most common commute times in Morrison are 30 to 34 minutes (14 commuters, 25.0%) for males and 30 to 34 minutes (13 commuters, 32.5%) for females.
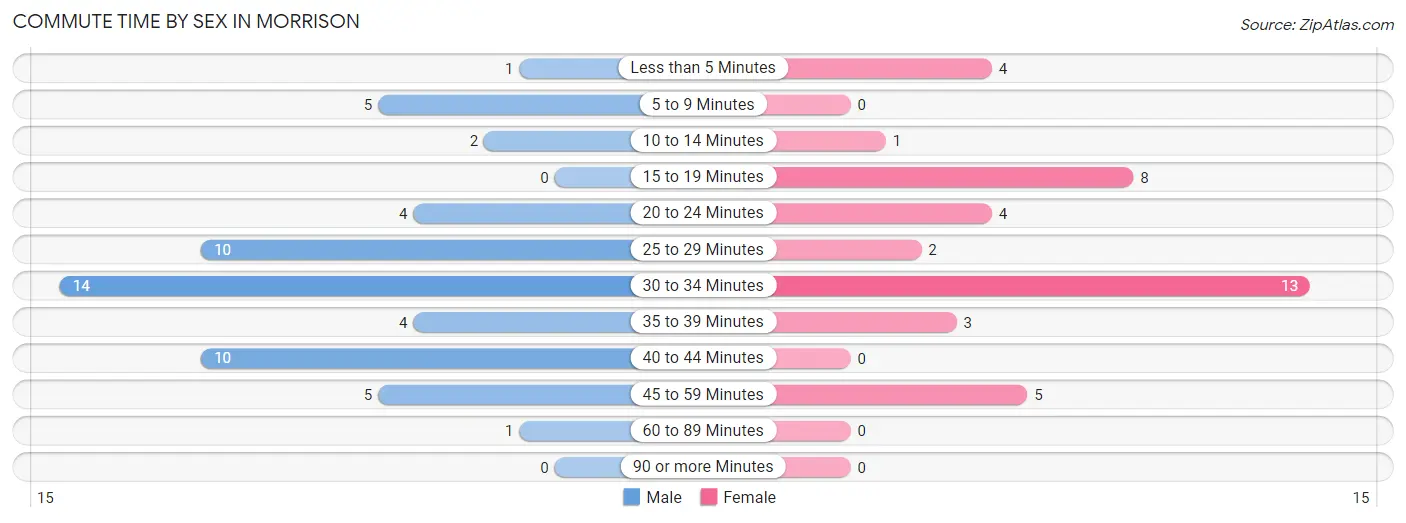
| Commute Time | Male | Female |
| Less than 5 Minutes | 1 (1.8%) | 4 (10.0%) |
| 5 to 9 Minutes | 5 (8.9%) | 0 (0.0%) |
| 10 to 14 Minutes | 2 (3.6%) | 1 (2.5%) |
| 15 to 19 Minutes | 0 (0.0%) | 8 (20.0%) |
| 20 to 24 Minutes | 4 (7.1%) | 4 (10.0%) |
| 25 to 29 Minutes | 10 (17.9%) | 2 (5.0%) |
| 30 to 34 Minutes | 14 (25.0%) | 13 (32.5%) |
| 35 to 39 Minutes | 4 (7.1%) | 3 (7.5%) |
| 40 to 44 Minutes | 10 (17.9%) | 0 (0.0%) |
| 45 to 59 Minutes | 5 (8.9%) | 5 (12.5%) |
| 60 to 89 Minutes | 1 (1.8%) | 0 (0.0%) |
| 90 or more Minutes | 0 (0.0%) | 0 (0.0%) |
Time of Departure to Work by Sex in Morrison
The most frequent times of departure to work in Morrison are 7:00 AM to 7:29 AM (22, 39.3%) for males and 7:00 AM to 7:29 AM (14, 35.0%) for females.
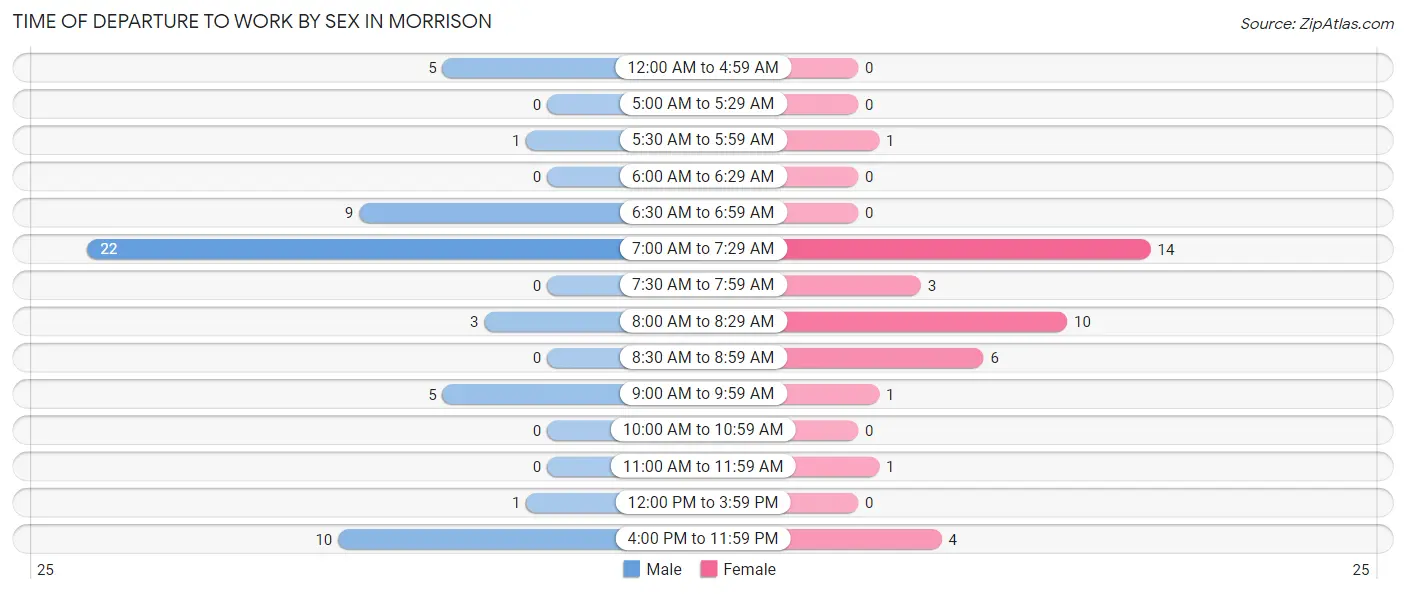
| Time of Departure | Male | Female |
| 12:00 AM to 4:59 AM | 5 (8.9%) | 0 (0.0%) |
| 5:00 AM to 5:29 AM | 0 (0.0%) | 0 (0.0%) |
| 5:30 AM to 5:59 AM | 1 (1.8%) | 1 (2.5%) |
| 6:00 AM to 6:29 AM | 0 (0.0%) | 0 (0.0%) |
| 6:30 AM to 6:59 AM | 9 (16.1%) | 0 (0.0%) |
| 7:00 AM to 7:29 AM | 22 (39.3%) | 14 (35.0%) |
| 7:30 AM to 7:59 AM | 0 (0.0%) | 3 (7.5%) |
| 8:00 AM to 8:29 AM | 3 (5.4%) | 10 (25.0%) |
| 8:30 AM to 8:59 AM | 0 (0.0%) | 6 (15.0%) |
| 9:00 AM to 9:59 AM | 5 (8.9%) | 1 (2.5%) |
| 10:00 AM to 10:59 AM | 0 (0.0%) | 0 (0.0%) |
| 11:00 AM to 11:59 AM | 0 (0.0%) | 1 (2.5%) |
| 12:00 PM to 3:59 PM | 1 (1.8%) | 0 (0.0%) |
| 4:00 PM to 11:59 PM | 10 (17.9%) | 4 (10.0%) |
| Total | 56 (100.0%) | 40 (100.0%) |
Housing Occupancy in Morrison
Occupancy by Ownership in Morrison
Of the total 114 dwellings in Morrison, owner-occupied units account for 76 (66.7%), while renter-occupied units make up 38 (33.3%).
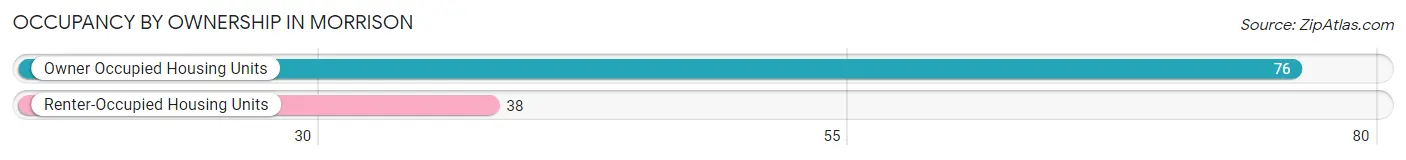
| Occupancy | # Housing Units | % Housing Units |
| Owner Occupied Housing Units | 76 | 66.7% |
| Renter-Occupied Housing Units | 38 | 33.3% |
| Total Occupied Housing Units | 114 | 100.0% |
Occupancy by Household Size in Morrison
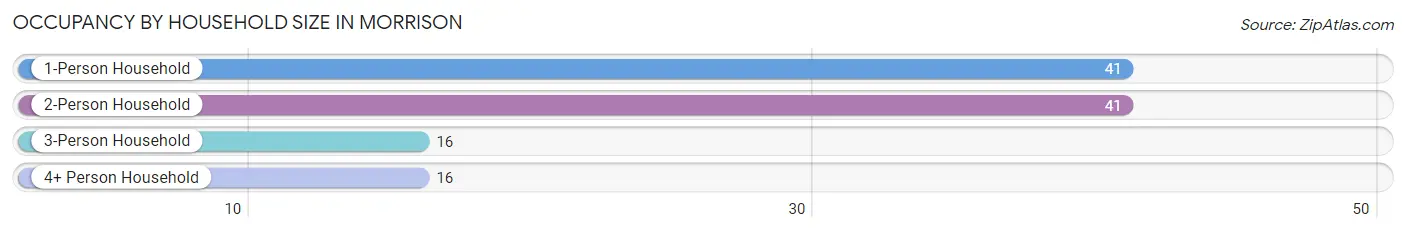
| Household Size | # Housing Units | % Housing Units |
| 1-Person Household | 41 | 36.0% |
| 2-Person Household | 41 | 36.0% |
| 3-Person Household | 16 | 14.0% |
| 4+ Person Household | 16 | 14.0% |
| Total Housing Units | 114 | 100.0% |
Occupancy by Ownership by Household Size in Morrison
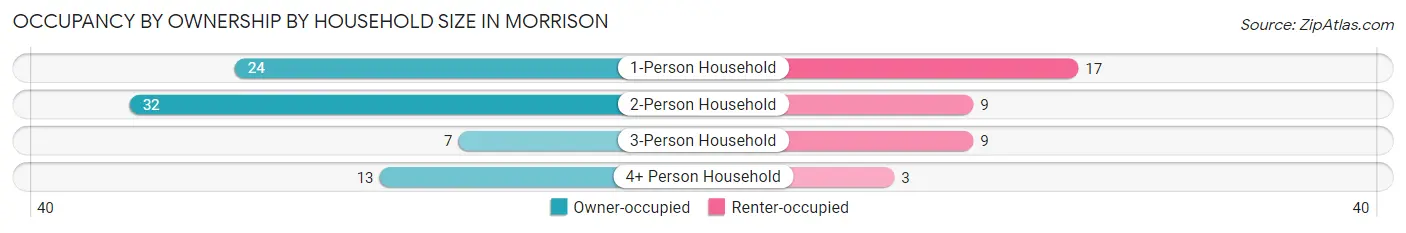
| Household Size | Owner-occupied | Renter-occupied |
| 1-Person Household | 24 (58.5%) | 17 (41.5%) |
| 2-Person Household | 32 (78.0%) | 9 (22.0%) |
| 3-Person Household | 7 (43.8%) | 9 (56.2%) |
| 4+ Person Household | 13 (81.2%) | 3 (18.8%) |
| Total Housing Units | 76 (66.7%) | 38 (33.3%) |
Occupancy by Educational Attainment in Morrison
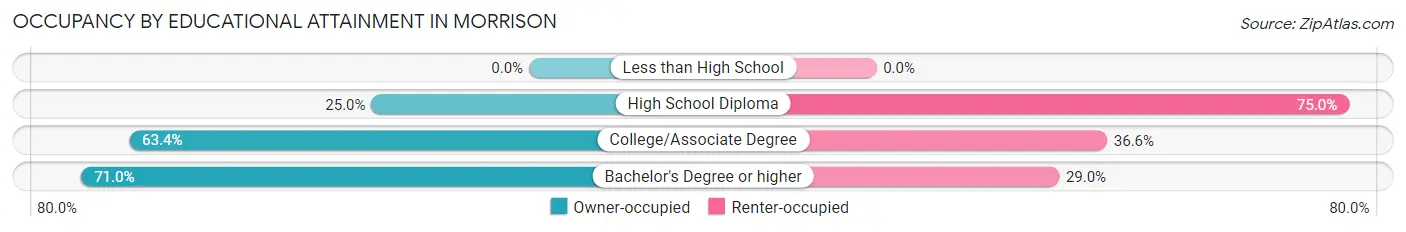
| Household Size | Owner-occupied | Renter-occupied |
| Less than High School | 0 (0.0%) | 0 (0.0%) |
| High School Diploma | 1 (25.0%) | 3 (75.0%) |
| College/Associate Degree | 26 (63.4%) | 15 (36.6%) |
| Bachelor's Degree or higher | 49 (71.0%) | 20 (29.0%) |
Occupancy by Age of Householder in Morrison
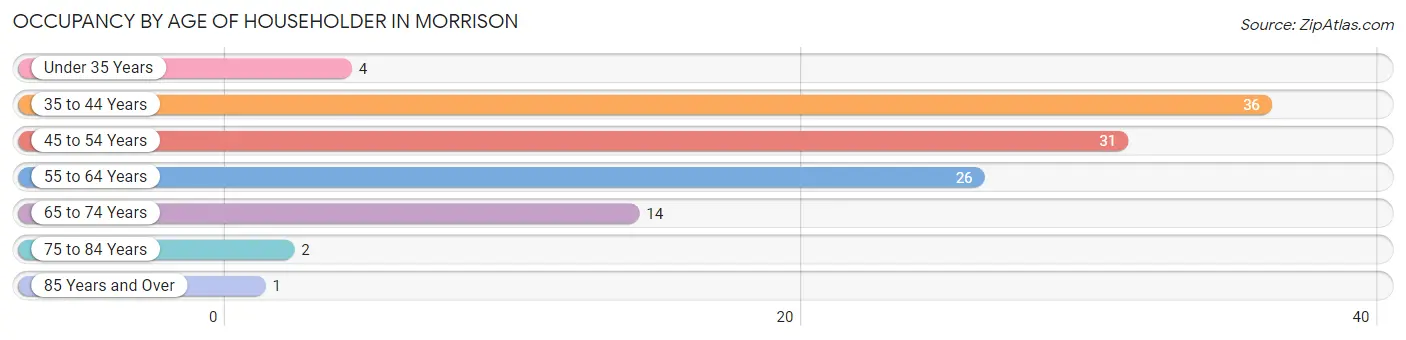
| Age Bracket | # Households | % Households |
| Under 35 Years | 4 | 3.5% |
| 35 to 44 Years | 36 | 31.6% |
| 45 to 54 Years | 31 | 27.2% |
| 55 to 64 Years | 26 | 22.8% |
| 65 to 74 Years | 14 | 12.3% |
| 75 to 84 Years | 2 | 1.8% |
| 85 Years and Over | 1 | 0.9% |
| Total | 114 | 100.0% |
Housing Finances in Morrison
Median Income by Occupancy in Morrison
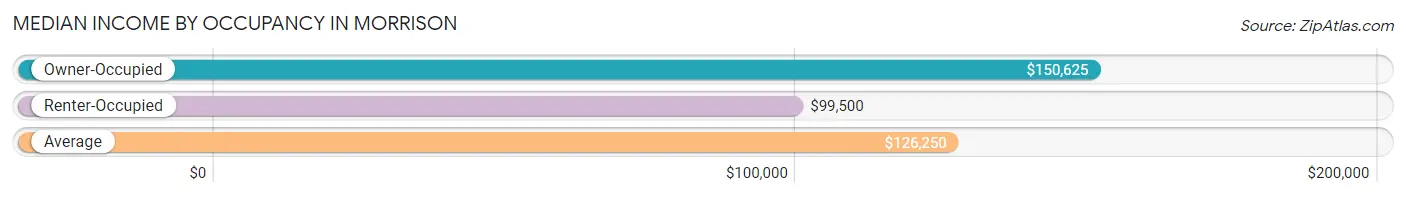
| Occupancy Type | # Households | Median Income |
| Owner-Occupied | 76 (66.7%) | $150,625 |
| Renter-Occupied | 38 (33.3%) | $99,500 |
| Average | 114 (100.0%) | $126,250 |
Occupancy by Householder Income Bracket in Morrison
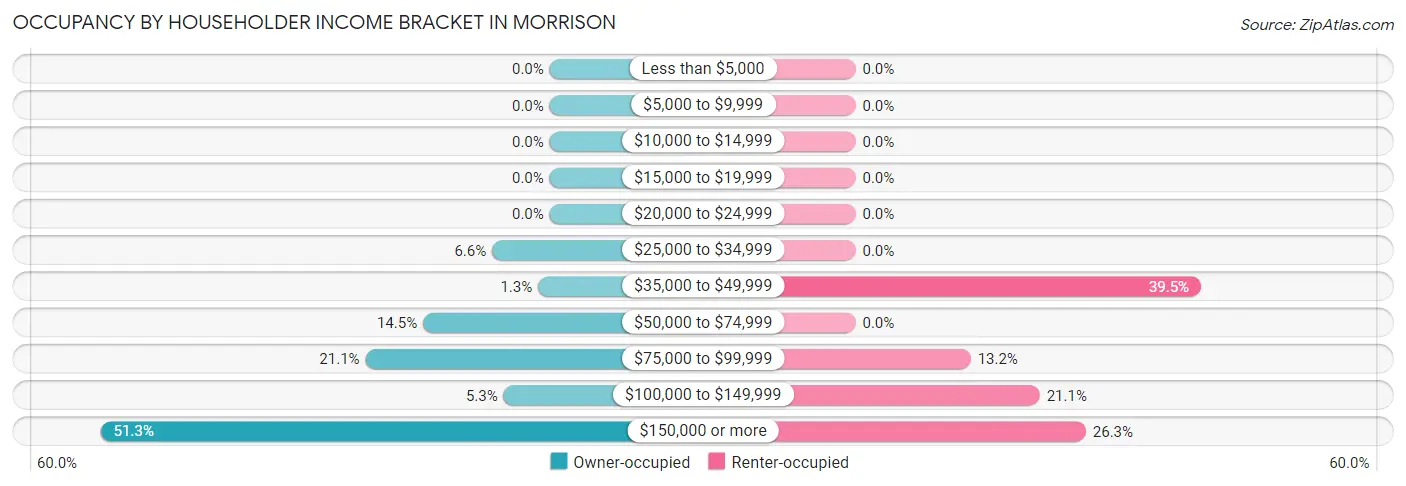
| Income Bracket | Owner-occupied | Renter-occupied |
| Less than $5,000 | 0 (0.0%) | 0 (0.0%) |
| $5,000 to $9,999 | 0 (0.0%) | 0 (0.0%) |
| $10,000 to $14,999 | 0 (0.0%) | 0 (0.0%) |
| $15,000 to $19,999 | 0 (0.0%) | 0 (0.0%) |
| $20,000 to $24,999 | 0 (0.0%) | 0 (0.0%) |
| $25,000 to $34,999 | 5 (6.6%) | 0 (0.0%) |
| $35,000 to $49,999 | 1 (1.3%) | 15 (39.5%) |
| $50,000 to $74,999 | 11 (14.5%) | 0 (0.0%) |
| $75,000 to $99,999 | 16 (21.0%) | 5 (13.2%) |
| $100,000 to $149,999 | 4 (5.3%) | 8 (21.0%) |
| $150,000 or more | 39 (51.3%) | 10 (26.3%) |
| Total | 76 (100.0%) | 38 (100.0%) |
Monthly Housing Cost Tiers in Morrison
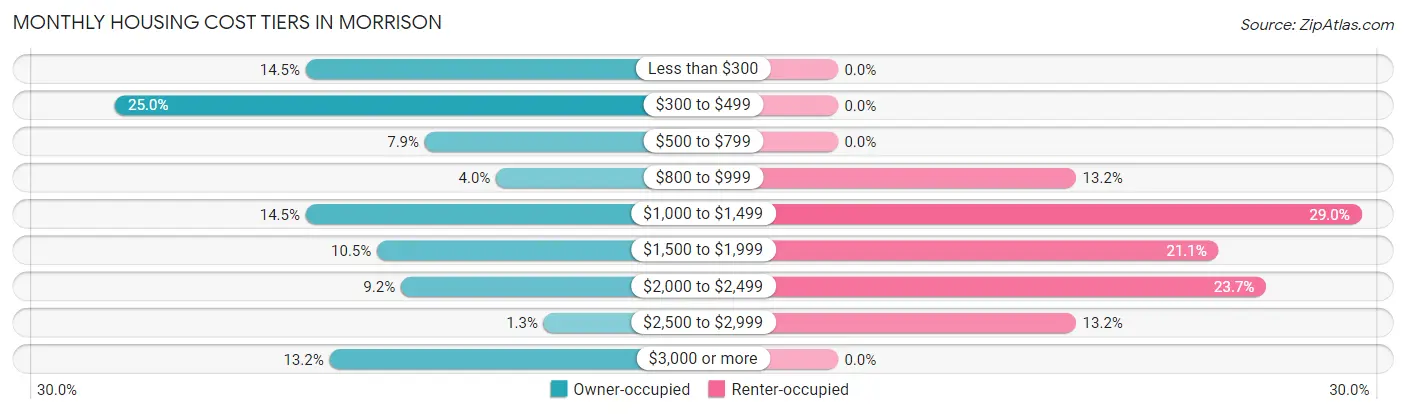
| Monthly Cost | Owner-occupied | Renter-occupied |
| Less than $300 | 11 (14.5%) | 0 (0.0%) |
| $300 to $499 | 19 (25.0%) | 0 (0.0%) |
| $500 to $799 | 6 (7.9%) | 0 (0.0%) |
| $800 to $999 | 3 (4.0%) | 5 (13.2%) |
| $1,000 to $1,499 | 11 (14.5%) | 11 (28.9%) |
| $1,500 to $1,999 | 8 (10.5%) | 8 (21.0%) |
| $2,000 to $2,499 | 7 (9.2%) | 9 (23.7%) |
| $2,500 to $2,999 | 1 (1.3%) | 5 (13.2%) |
| $3,000 or more | 10 (13.2%) | 0 (0.0%) |
| Total | 76 (100.0%) | 38 (100.0%) |
Physical Housing Characteristics in Morrison
Housing Structures in Morrison
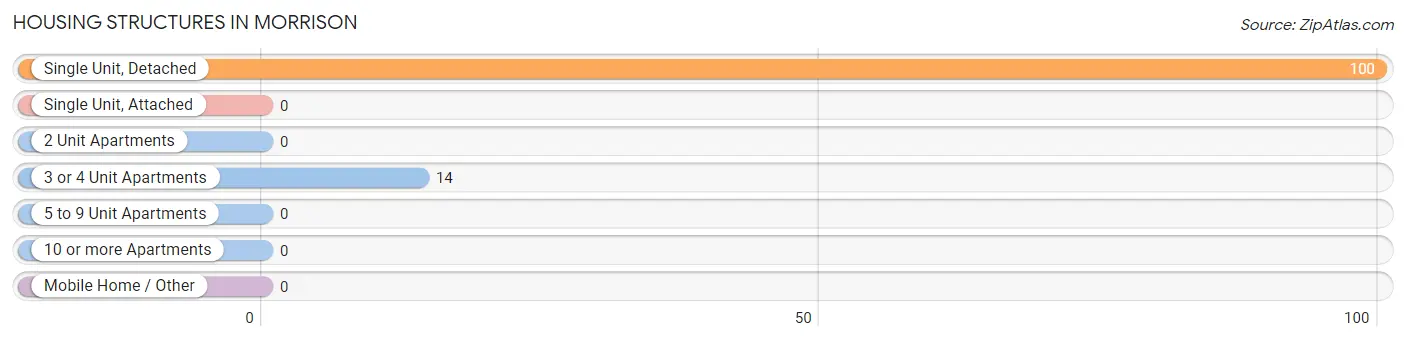
| Structure Type | # Housing Units | % Housing Units |
| Single Unit, Detached | 100 | 87.7% |
| Single Unit, Attached | 0 | 0.0% |
| 2 Unit Apartments | 0 | 0.0% |
| 3 or 4 Unit Apartments | 14 | 12.3% |
| 5 to 9 Unit Apartments | 0 | 0.0% |
| 10 or more Apartments | 0 | 0.0% |
| Mobile Home / Other | 0 | 0.0% |
| Total | 114 | 100.0% |
Housing Structures by Occupancy in Morrison
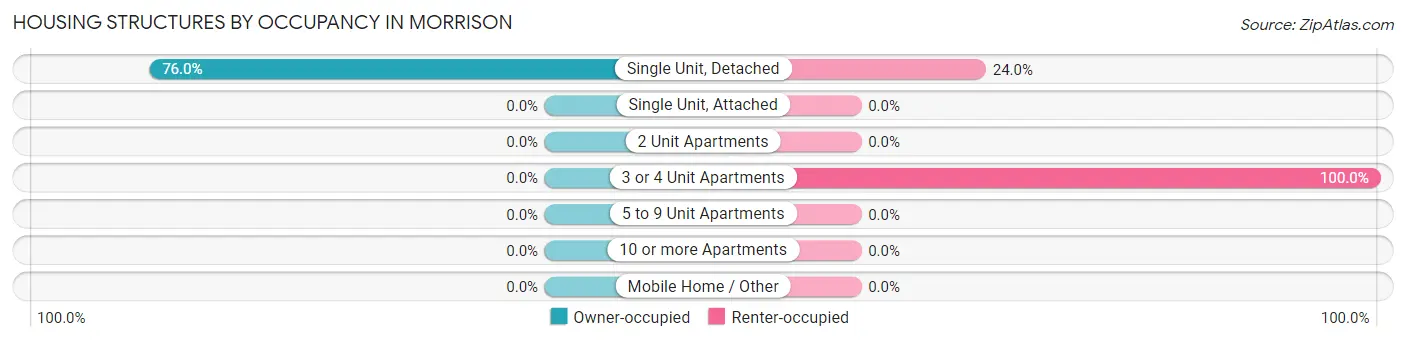
| Structure Type | Owner-occupied | Renter-occupied |
| Single Unit, Detached | 76 (76.0%) | 24 (24.0%) |
| Single Unit, Attached | 0 (0.0%) | 0 (0.0%) |
| 2 Unit Apartments | 0 (0.0%) | 0 (0.0%) |
| 3 or 4 Unit Apartments | 0 (0.0%) | 14 (100.0%) |
| 5 to 9 Unit Apartments | 0 (0.0%) | 0 (0.0%) |
| 10 or more Apartments | 0 (0.0%) | 0 (0.0%) |
| Mobile Home / Other | 0 (0.0%) | 0 (0.0%) |
| Total | 76 (66.7%) | 38 (33.3%) |
Housing Structures by Number of Rooms in Morrison
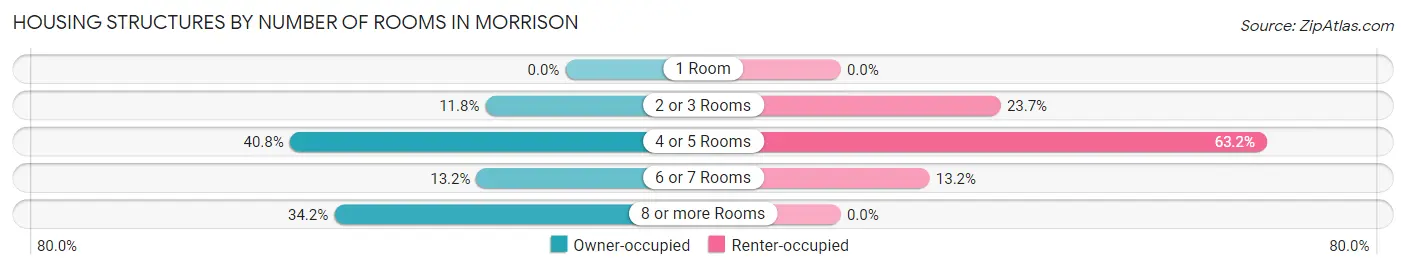
| Number of Rooms | Owner-occupied | Renter-occupied |
| 1 Room | 0 (0.0%) | 0 (0.0%) |
| 2 or 3 Rooms | 9 (11.8%) | 9 (23.7%) |
| 4 or 5 Rooms | 31 (40.8%) | 24 (63.2%) |
| 6 or 7 Rooms | 10 (13.2%) | 5 (13.2%) |
| 8 or more Rooms | 26 (34.2%) | 0 (0.0%) |
| Total | 76 (100.0%) | 38 (100.0%) |
Housing Structure by Heating Type in Morrison
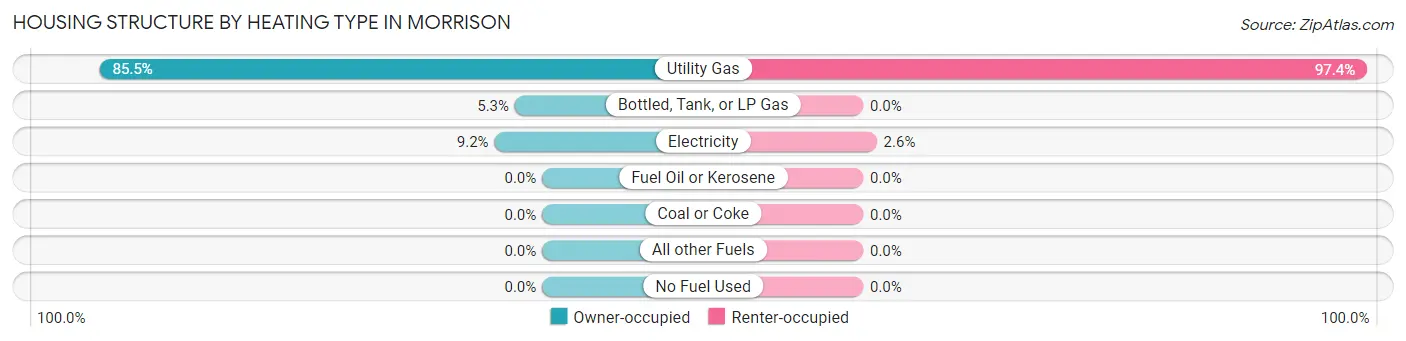
| Heating Type | Owner-occupied | Renter-occupied |
| Utility Gas | 65 (85.5%) | 37 (97.4%) |
| Bottled, Tank, or LP Gas | 4 (5.3%) | 0 (0.0%) |
| Electricity | 7 (9.2%) | 1 (2.6%) |
| Fuel Oil or Kerosene | 0 (0.0%) | 0 (0.0%) |
| Coal or Coke | 0 (0.0%) | 0 (0.0%) |
| All other Fuels | 0 (0.0%) | 0 (0.0%) |
| No Fuel Used | 0 (0.0%) | 0 (0.0%) |
| Total | 76 (100.0%) | 38 (100.0%) |
Household Vehicle Usage in Morrison
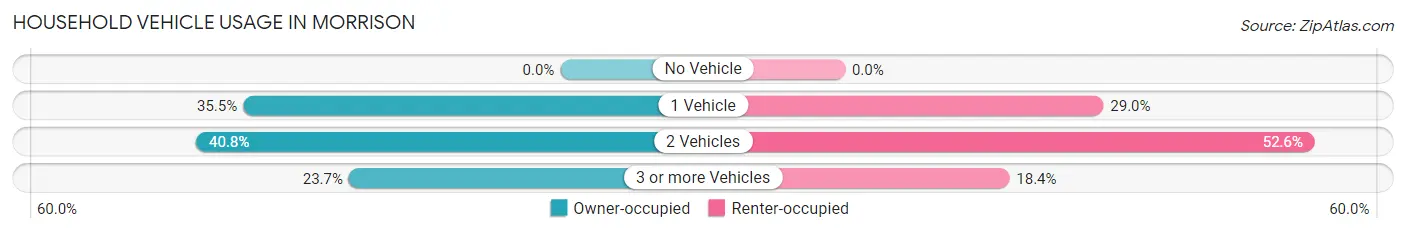
| Vehicles per Household | Owner-occupied | Renter-occupied |
| No Vehicle | 0 (0.0%) | 0 (0.0%) |
| 1 Vehicle | 27 (35.5%) | 11 (28.9%) |
| 2 Vehicles | 31 (40.8%) | 20 (52.6%) |
| 3 or more Vehicles | 18 (23.7%) | 7 (18.4%) |
| Total | 76 (100.0%) | 38 (100.0%) |
Real Estate & Mortgages in Morrison
Real Estate and Mortgage Overview in Morrison
| Characteristic | Without Mortgage | With Mortgage |
| Housing Units | 37 | 39 |
| Median Property Value | $679,300 | $708,300 |
| Median Household Income | - | - |
| Monthly Housing Costs | $347 | $10 |
| Real Estate Taxes | $2,400 | $0 |
Property Value by Mortgage Status in Morrison
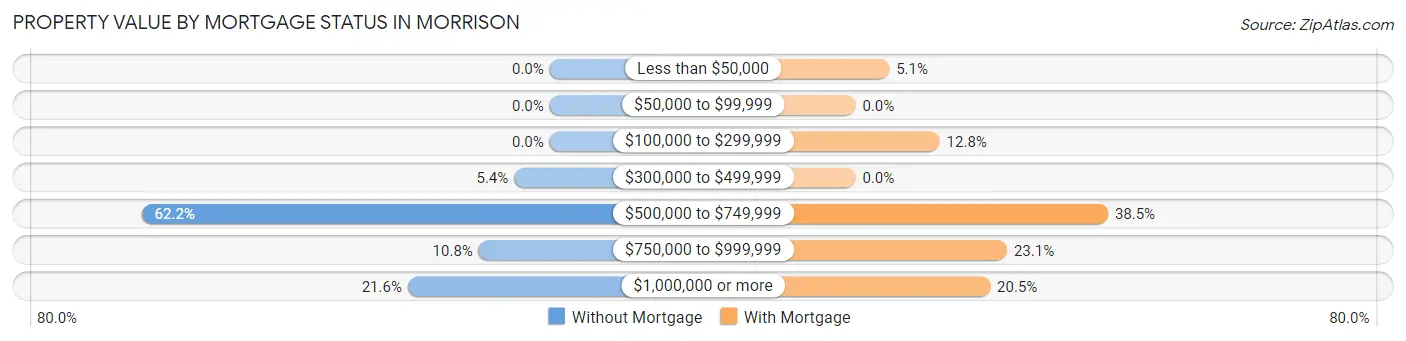
| Property Value | Without Mortgage | With Mortgage |
| Less than $50,000 | 0 (0.0%) | 2 (5.1%) |
| $50,000 to $99,999 | 0 (0.0%) | 0 (0.0%) |
| $100,000 to $299,999 | 0 (0.0%) | 5 (12.8%) |
| $300,000 to $499,999 | 2 (5.4%) | 0 (0.0%) |
| $500,000 to $749,999 | 23 (62.2%) | 15 (38.5%) |
| $750,000 to $999,999 | 4 (10.8%) | 9 (23.1%) |
| $1,000,000 or more | 8 (21.6%) | 8 (20.5%) |
| Total | 37 (100.0%) | 39 (100.0%) |
Household Income by Mortgage Status in Morrison
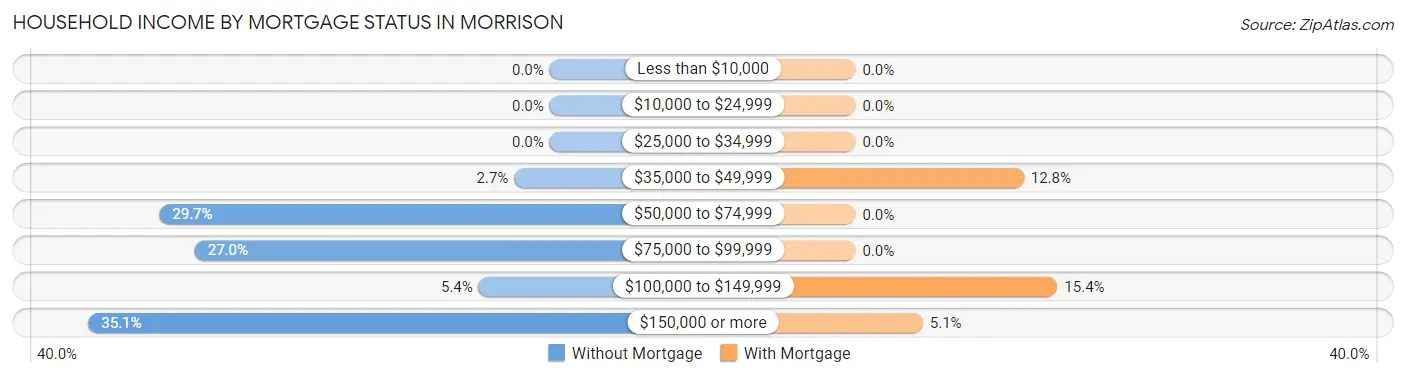
| Household Income | Without Mortgage | With Mortgage |
| Less than $10,000 | 0 (0.0%) | 0 (0.0%) |
| $10,000 to $24,999 | 0 (0.0%) | 0 (0.0%) |
| $25,000 to $34,999 | 0 (0.0%) | 0 (0.0%) |
| $35,000 to $49,999 | 1 (2.7%) | 5 (12.8%) |
| $50,000 to $74,999 | 11 (29.7%) | 0 (0.0%) |
| $75,000 to $99,999 | 10 (27.0%) | 0 (0.0%) |
| $100,000 to $149,999 | 2 (5.4%) | 6 (15.4%) |
| $150,000 or more | 13 (35.1%) | 2 (5.1%) |
| Total | 37 (100.0%) | 39 (100.0%) |
Property Value to Household Income Ratio in Morrison
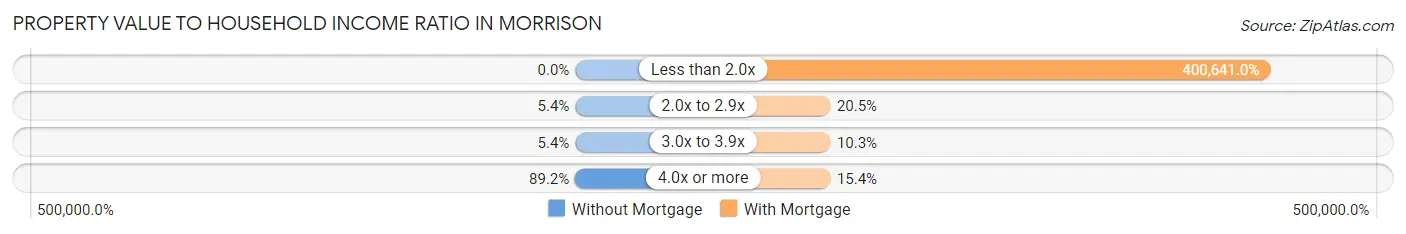
| Value-to-Income Ratio | Without Mortgage | With Mortgage |
| Less than 2.0x | 0 (0.0%) | 156,250 (400,641.0%) |
| 2.0x to 2.9x | 2 (5.4%) | 8 (20.5%) |
| 3.0x to 3.9x | 2 (5.4%) | 4 (10.3%) |
| 4.0x or more | 33 (89.2%) | 6 (15.4%) |
| Total | 37 (100.0%) | 39 (100.0%) |
Real Estate Taxes by Mortgage Status in Morrison
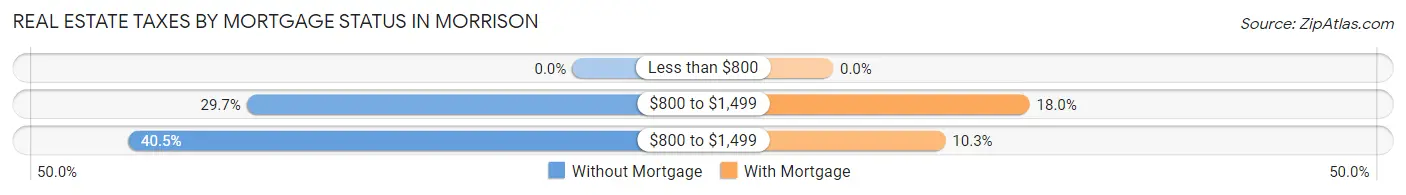
| Property Taxes | Without Mortgage | With Mortgage |
| Less than $800 | 0 (0.0%) | 0 (0.0%) |
| $800 to $1,499 | 11 (29.7%) | 7 (17.9%) |
| $800 to $1,499 | 15 (40.5%) | 4 (10.3%) |
| Total | 37 (100.0%) | 39 (100.0%) |
Health & Disability in Morrison
Health Insurance Coverage by Age in Morrison
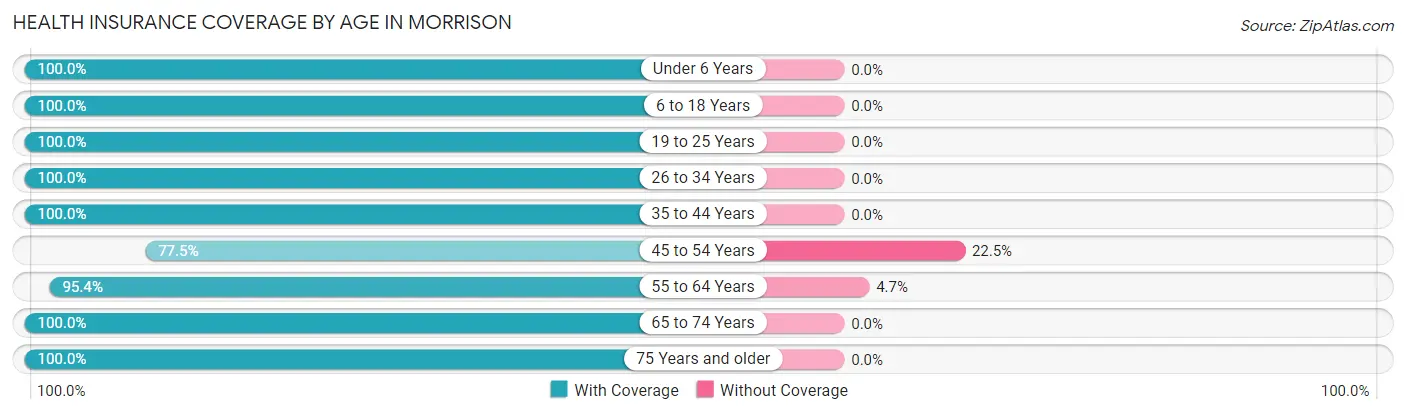
| Age Bracket | With Coverage | Without Coverage |
| Under 6 Years | 15 (100.0%) | 0 (0.0%) |
| 6 to 18 Years | 27 (100.0%) | 0 (0.0%) |
| 19 to 25 Years | 12 (100.0%) | 0 (0.0%) |
| 26 to 34 Years | 22 (100.0%) | 0 (0.0%) |
| 35 to 44 Years | 58 (100.0%) | 0 (0.0%) |
| 45 to 54 Years | 31 (77.5%) | 9 (22.5%) |
| 55 to 64 Years | 41 (95.4%) | 2 (4.6%) |
| 65 to 74 Years | 17 (100.0%) | 0 (0.0%) |
| 75 Years and older | 13 (100.0%) | 0 (0.0%) |
| Total | 236 (95.6%) | 11 (4.4%) |
Health Insurance Coverage by Citizenship Status in Morrison
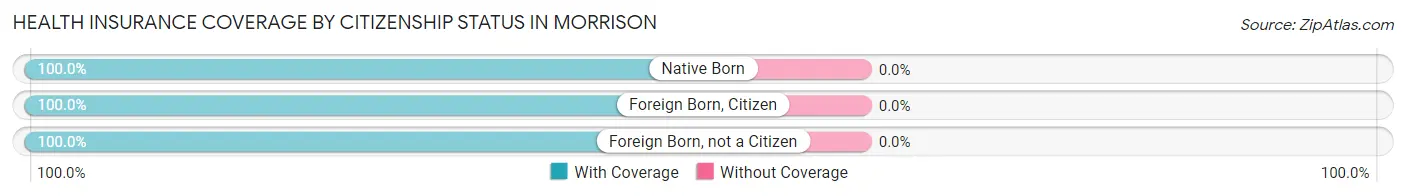
| Citizenship Status | With Coverage | Without Coverage |
| Native Born | 15 (100.0%) | 0 (0.0%) |
| Foreign Born, Citizen | 27 (100.0%) | 0 (0.0%) |
| Foreign Born, not a Citizen | 12 (100.0%) | 0 (0.0%) |
Health Insurance Coverage by Household Income in Morrison
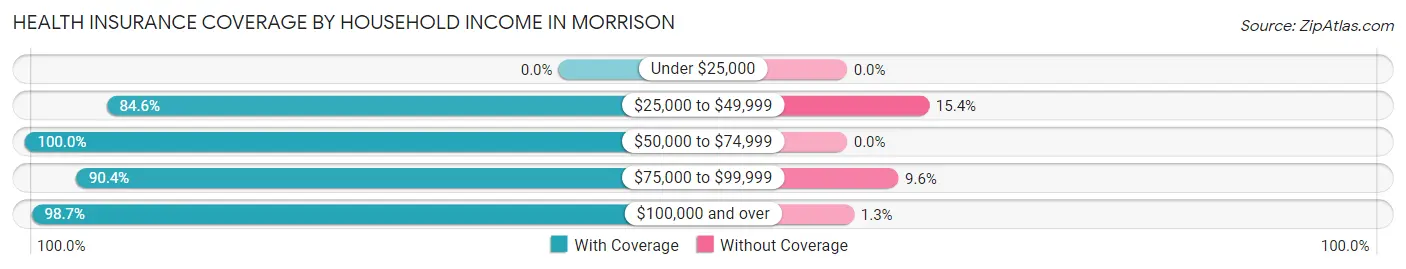
| Household Income | With Coverage | Without Coverage |
| Under $25,000 | 0 (0.0%) | 0 (0.0%) |
| $25,000 to $49,999 | 22 (84.6%) | 4 (15.4%) |
| $50,000 to $74,999 | 18 (100.0%) | 0 (0.0%) |
| $75,000 to $99,999 | 47 (90.4%) | 5 (9.6%) |
| $100,000 and over | 149 (98.7%) | 2 (1.3%) |
Public vs Private Health Insurance Coverage by Age in Morrison
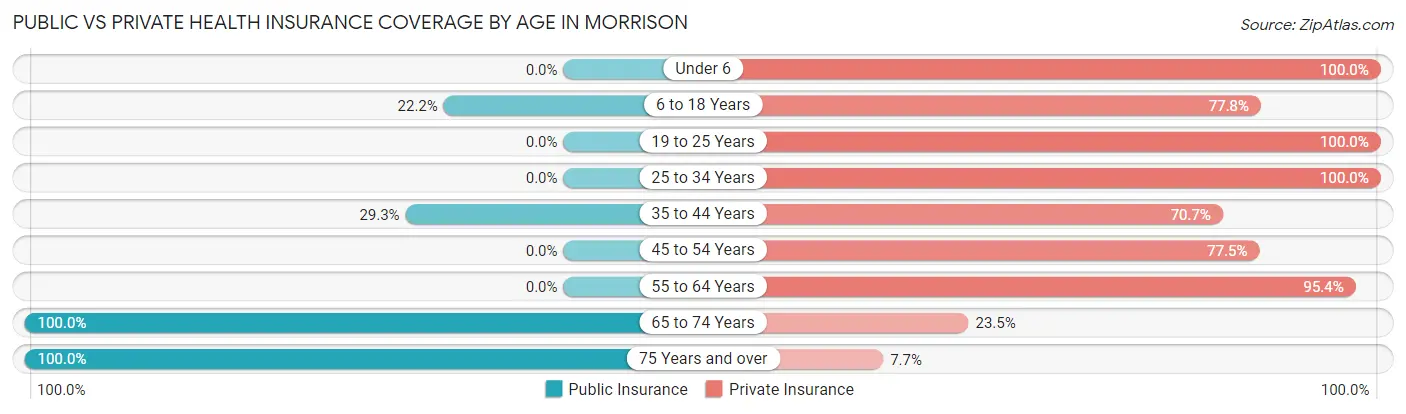
| Age Bracket | Public Insurance | Private Insurance |
| Under 6 | 0 (0.0%) | 15 (100.0%) |
| 6 to 18 Years | 6 (22.2%) | 21 (77.8%) |
| 19 to 25 Years | 0 (0.0%) | 12 (100.0%) |
| 25 to 34 Years | 0 (0.0%) | 22 (100.0%) |
| 35 to 44 Years | 17 (29.3%) | 41 (70.7%) |
| 45 to 54 Years | 0 (0.0%) | 31 (77.5%) |
| 55 to 64 Years | 0 (0.0%) | 41 (95.4%) |
| 65 to 74 Years | 17 (100.0%) | 4 (23.5%) |
| 75 Years and over | 13 (100.0%) | 1 (7.7%) |
| Total | 53 (21.5%) | 188 (76.1%) |
Disability Status by Sex by Age in Morrison
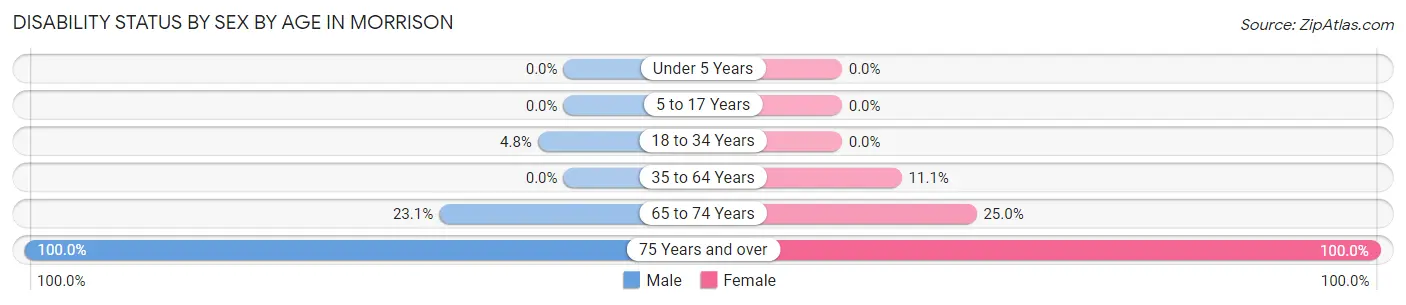
| Age Bracket | Male | Female |
| Under 5 Years | 0 (0.0%) | 0 (0.0%) |
| 5 to 17 Years | 0 (0.0%) | 0 (0.0%) |
| 18 to 34 Years | 1 (4.8%) | 0 (0.0%) |
| 35 to 64 Years | 0 (0.0%) | 6 (11.1%) |
| 65 to 74 Years | 3 (23.1%) | 1 (25.0%) |
| 75 Years and over | 7 (100.0%) | 6 (100.0%) |
Disability Class by Sex by Age in Morrison
Disability Class: Hearing Difficulty
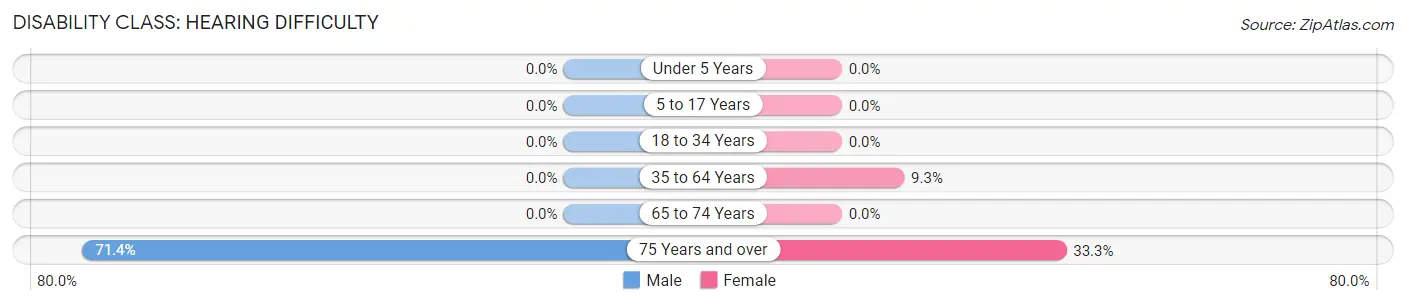
| Age Bracket | Male | Female |
| Under 5 Years | 0 (0.0%) | 0 (0.0%) |
| 5 to 17 Years | 0 (0.0%) | 0 (0.0%) |
| 18 to 34 Years | 0 (0.0%) | 0 (0.0%) |
| 35 to 64 Years | 0 (0.0%) | 5 (9.3%) |
| 65 to 74 Years | 0 (0.0%) | 0 (0.0%) |
| 75 Years and over | 5 (71.4%) | 2 (33.3%) |
Disability Class: Vision Difficulty
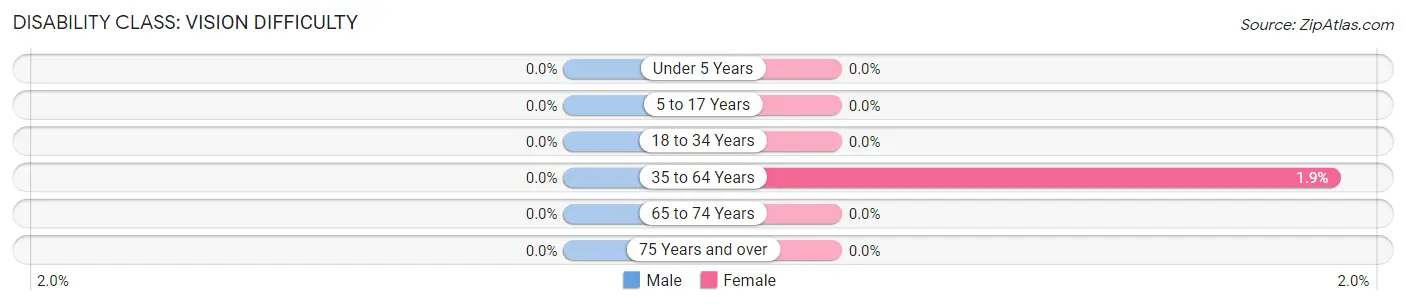
| Age Bracket | Male | Female |
| Under 5 Years | 0 (0.0%) | 0 (0.0%) |
| 5 to 17 Years | 0 (0.0%) | 0 (0.0%) |
| 18 to 34 Years | 0 (0.0%) | 0 (0.0%) |
| 35 to 64 Years | 0 (0.0%) | 1 (1.8%) |
| 65 to 74 Years | 0 (0.0%) | 0 (0.0%) |
| 75 Years and over | 0 (0.0%) | 0 (0.0%) |
Disability Class: Cognitive Difficulty
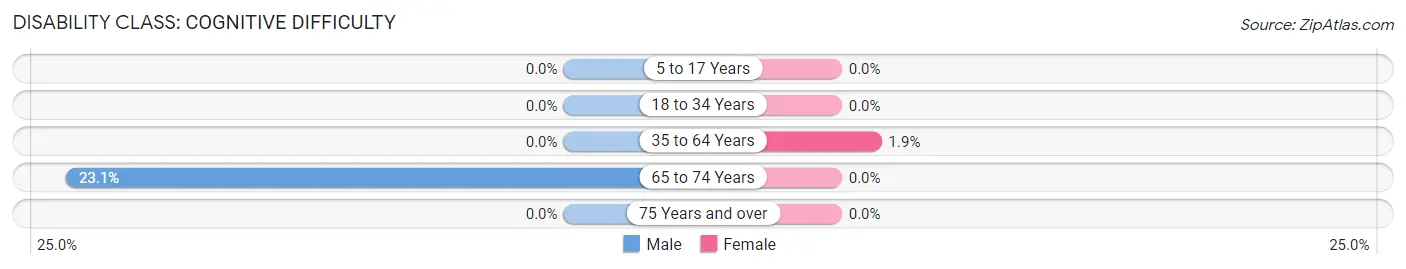
| Age Bracket | Male | Female |
| 5 to 17 Years | 0 (0.0%) | 0 (0.0%) |
| 18 to 34 Years | 0 (0.0%) | 0 (0.0%) |
| 35 to 64 Years | 0 (0.0%) | 1 (1.8%) |
| 65 to 74 Years | 3 (23.1%) | 0 (0.0%) |
| 75 Years and over | 0 (0.0%) | 0 (0.0%) |
Disability Class: Ambulatory Difficulty
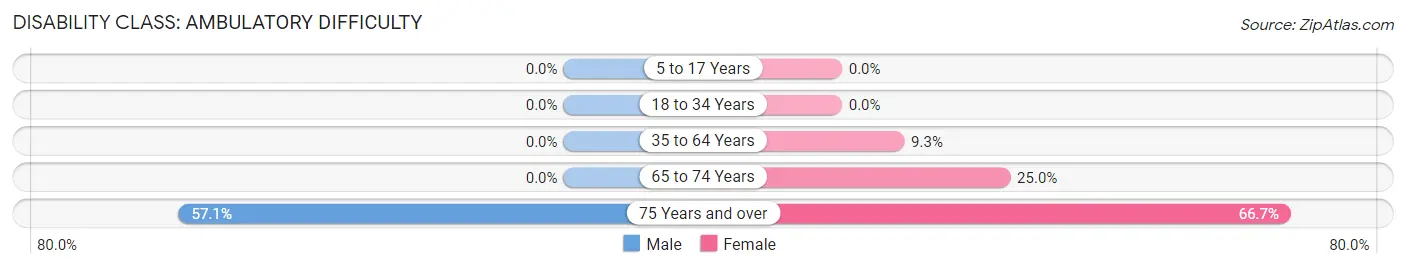
| Age Bracket | Male | Female |
| 5 to 17 Years | 0 (0.0%) | 0 (0.0%) |
| 18 to 34 Years | 0 (0.0%) | 0 (0.0%) |
| 35 to 64 Years | 0 (0.0%) | 5 (9.3%) |
| 65 to 74 Years | 0 (0.0%) | 1 (25.0%) |
| 75 Years and over | 4 (57.1%) | 4 (66.7%) |
Disability Class: Self-Care Difficulty
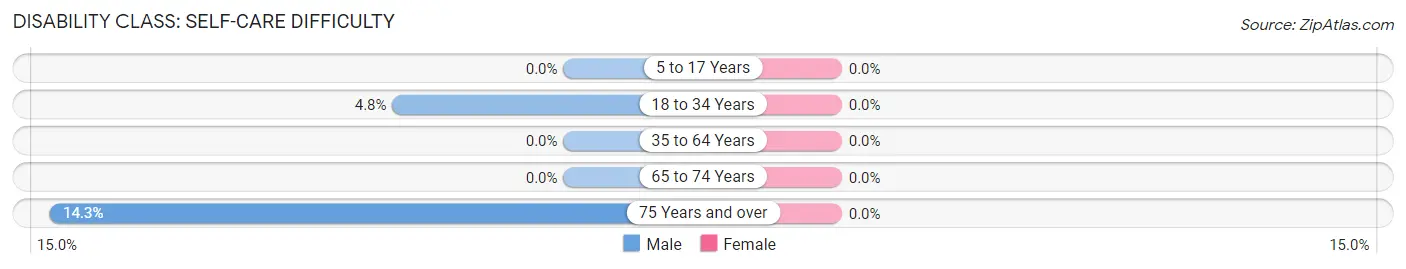
| Age Bracket | Male | Female |
| 5 to 17 Years | 0 (0.0%) | 0 (0.0%) |
| 18 to 34 Years | 1 (4.8%) | 0 (0.0%) |
| 35 to 64 Years | 0 (0.0%) | 0 (0.0%) |
| 65 to 74 Years | 0 (0.0%) | 0 (0.0%) |
| 75 Years and over | 1 (14.3%) | 0 (0.0%) |
Technology Access in Morrison
Computing Device Access in Morrison
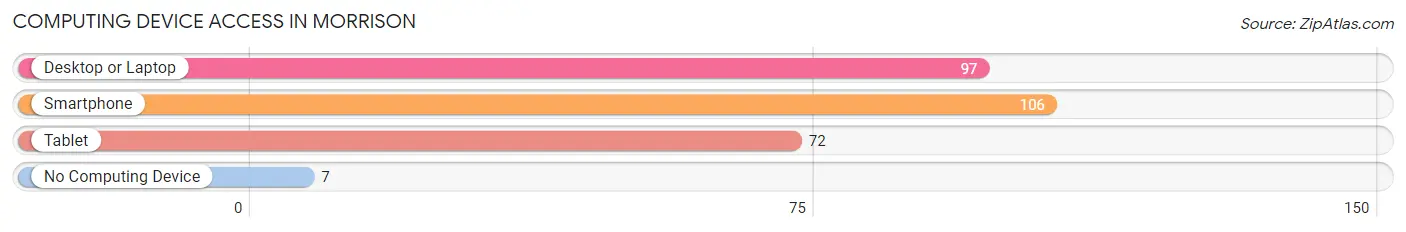
| Device Type | # Households | % Households |
| Desktop or Laptop | 97 | 85.1% |
| Smartphone | 106 | 93.0% |
| Tablet | 72 | 63.2% |
| No Computing Device | 7 | 6.1% |
| Total | 114 | 100.0% |
Internet Access in Morrison
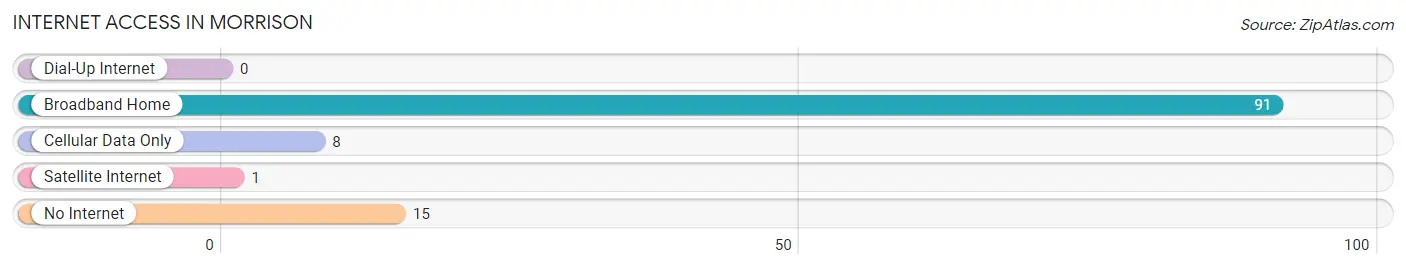
| Internet Type | # Households | % Households |
| Dial-Up Internet | 0 | 0.0% |
| Broadband Home | 91 | 79.8% |
| Cellular Data Only | 8 | 7.0% |
| Satellite Internet | 1 | 0.9% |
| No Internet | 15 | 13.2% |
| Total | 114 | 100.0% |
Morrison Summary
Morrison is a small town located in Jefferson County, Colorado, United States. It is situated in the foothills of the Rocky Mountains, approximately 15 miles southwest of Denver. The town was founded in 1874 and has a population of approximately 500 people.
History
Morrison was founded in 1874 by George Morrison, a prospector who discovered gold in the area. He named the town after himself and it quickly grew into a small mining town. The town was incorporated in 1877 and the first post office was established in 1878.
In the late 1800s, Morrison was a popular tourist destination due to its proximity to Denver and the scenic beauty of the area. The town was home to several hotels, restaurants, and other businesses catering to tourists.
In the early 1900s, Morrison began to decline as the gold rush ended and the town’s population decreased. The town was nearly abandoned by the 1940s, but was revitalized in the 1950s when the Red Rocks Amphitheater was built nearby.
Geography
Morrison is located in the foothills of the Rocky Mountains at an elevation of 6,000 feet. The town is situated on the western edge of the Denver Basin, which is a large area of flat land surrounded by mountains.
The town is located approximately 15 miles southwest of Denver and is bordered by the towns of Golden and Evergreen. The town is also close to the popular tourist destination of Red Rocks Park and Amphitheater.
The town is located in a semi-arid climate, with hot summers and cold winters. The average annual precipitation is approximately 16 inches.
Economy
The economy of Morrison is largely based on tourism. The town is home to several restaurants, hotels, and other businesses catering to tourists. The town is also home to several small businesses, including a brewery, a winery, and a distillery.
The town is also home to several large employers, including the Coors Brewing Company, which is located just outside of town.
Demographics
As of the 2010 census, the population of Morrison was 500 people. The racial makeup of the town was 95.2% White, 0.8% African American, 0.4% Native American, 0.8% Asian, 0.2% Pacific Islander, and 2.4% from other races.
The median household income in Morrison was $50,000, and the median family income was $54,000. The per capita income was $25,000. Approximately 8.5% of the population was below the poverty line.
Conclusion
Morrison is a small town located in Jefferson County, Colorado, United States. It was founded in 1874 and has a population of approximately 500 people. The town is situated in the foothills of the Rocky Mountains and is a popular tourist destination due to its proximity to Denver and the scenic beauty of the area. The economy of Morrison is largely based on tourism, and the town is home to several restaurants, hotels, and other businesses catering to tourists. The town is also home to several large employers, including the Coors Brewing Company. The population of Morrison is predominantly White, with a median household income of $50,000 and a median family income of $54,000.
Common Questions
What is Per Capita Income in Morrison?
Per Capita income in Morrison is $45,474.
What is the Median Family Income in Morrison?
Median Family Income in Morrison is $140,625.
What is the Median Household income in Morrison?
Median Household Income in Morrison is $126,250.
What is Income or Wage Gap in Morrison?
Income or Wage Gap in Morrison is 29.5%.
Women in Morrison earn 70.5 cents for every dollar earned by a man.
What is Inequality or Gini Index in Morrison?
Inequality or Gini Index in Morrison is 0.33.
What is the Total Population of Morrison?
Total Population of Morrison is 393.
What is the Total Male Population of Morrison?
Total Male Population of Morrison is 187.
What is the Total Female Population of Morrison?
Total Female Population of Morrison is 206.
What is the Ratio of Males per 100 Females in Morrison?
There are 90.78 Males per 100 Females in Morrison.
What is the Ratio of Females per 100 Males in Morrison?
There are 110.16 Females per 100 Males in Morrison.
What is the Median Population Age in Morrison?
Median Population Age in Morrison is 58.0 Years.
What is the Average Family Size in Morrison
Average Family Size in Morrison is 2.9 People.
What is the Average Household Size in Morrison
Average Household Size in Morrison is 2.2 People.
How Large is the Labor Force in Morrison?
There are 163 People in the Labor Forcein in Morrison.
What is the Percentage of People in the Labor Force in Morrison?
45.0% of People are in the Labor Force in Morrison.
What is the Unemployment Rate in Morrison?
Unemployment Rate in Morrison is 11.7%.