Milliken, CO Map & Demographics
Milliken Map
Milliken Overview
$41,822
PER CAPITA INCOME
$98,750
AVG FAMILY INCOME
$96,772
AVG HOUSEHOLD INCOME
39.9%
WAGE / INCOME GAP [ % ]
60.1¢/ $1
WAGE / INCOME GAP [ $ ]
0.36
INEQUALITY / GINI INDEX
8,438
TOTAL POPULATION
4,412
MALE POPULATION
4,026
FEMALE POPULATION
109.59
MALES / 100 FEMALES
91.25
FEMALES / 100 MALES
33.3
MEDIAN AGE
3.0
AVG FAMILY SIZE
2.7
AVG HOUSEHOLD SIZE
5,066
LABOR FORCE [ PEOPLE ]
76.1%
PERCENT IN LABOR FORCE
2.9%
UNEMPLOYMENT RATE
Milliken Zip Codes
Milliken Area Codes
Income in Milliken
Income Overview in Milliken
Per Capita Income in Milliken is $41,822, while median incomes of families and households are $98,750 and $96,772 respectively.
| Characteristic | Number | Measure |
| Per Capita Income | 8,438 | $41,822 |
| Median Family Income | 2,416 | $98,750 |
| Mean Family Income | 2,416 | $116,153 |
| Median Household Income | 3,111 | $96,772 |
| Mean Household Income | 3,111 | $112,332 |
| Income Deficit | 2,416 | $0 |
| Wage / Income Gap (%) | 8,438 | 39.86% |
| Wage / Income Gap ($) | 8,438 | 60.14¢ per $1 |
| Gini / Inequality Index | 8,438 | 0.36 |
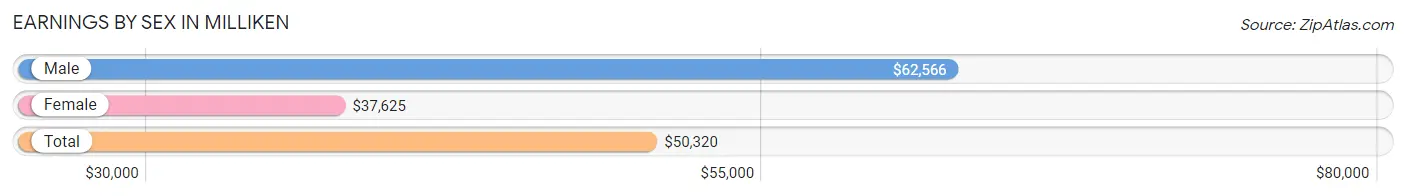
Earnings by Sex in Milliken
Average Earnings in Milliken are $50,320, $62,566 for men and $37,625 for women, a difference of 39.9%.
| Sex | Number | Average Earnings |
| Male | 3,077 (58.0%) | $62,566 |
| Female | 2,232 (42.0%) | $37,625 |
| Total | 5,309 (100.0%) | $50,320 |
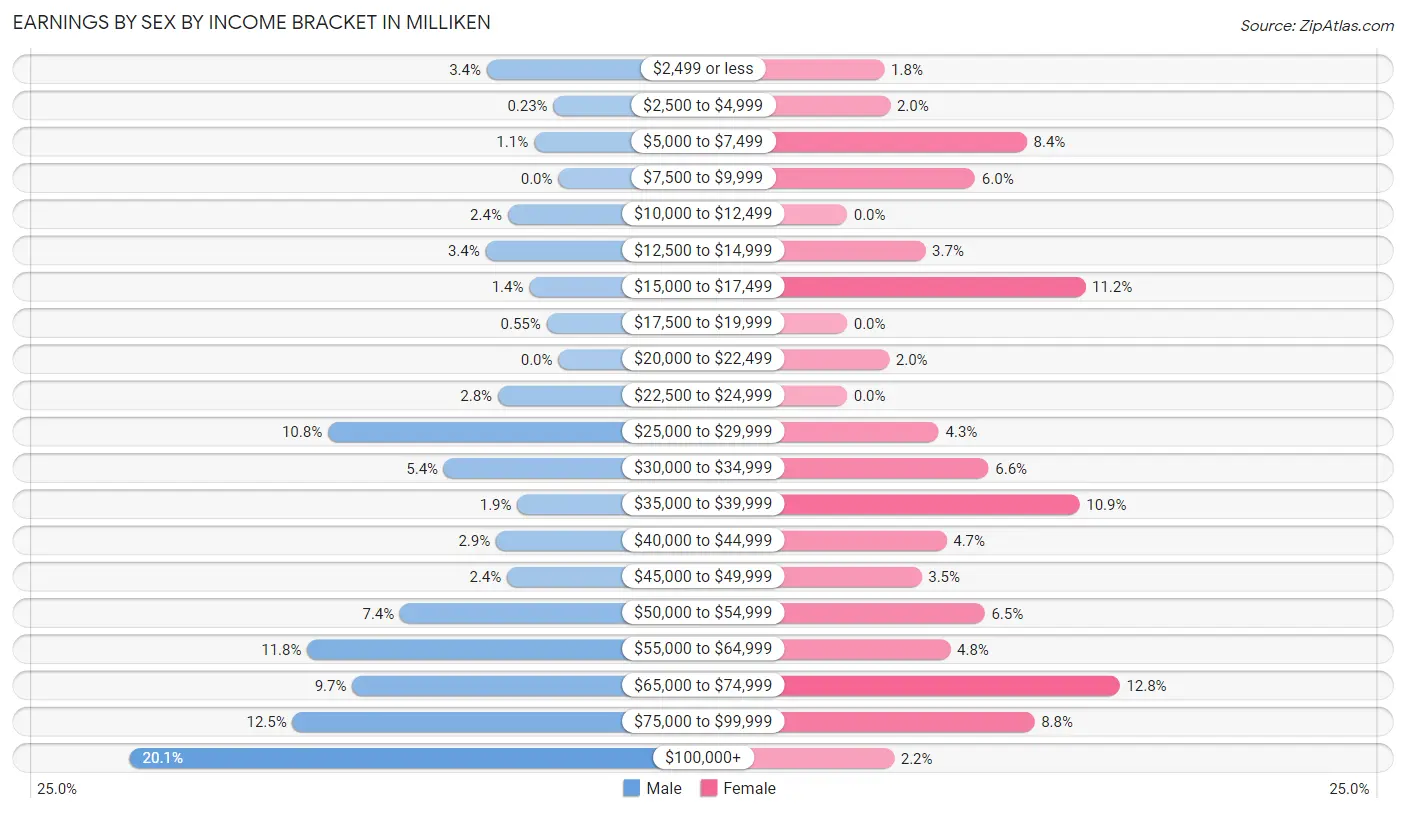
Earnings by Sex by Income Bracket in Milliken
The most common earnings brackets in Milliken are $100,000+ for men (618 | 20.1%) and $65,000 to $74,999 for women (285 | 12.8%).
| Income | Male | Female |
| $2,499 or less | 103 (3.4%) | 39 (1.8%) |
| $2,500 to $4,999 | 7 (0.2%) | 45 (2.0%) |
| $5,000 to $7,499 | 35 (1.1%) | 188 (8.4%) |
| $7,500 to $9,999 | 0 (0.0%) | 134 (6.0%) |
| $10,000 to $12,499 | 73 (2.4%) | 0 (0.0%) |
| $12,500 to $14,999 | 105 (3.4%) | 82 (3.7%) |
| $15,000 to $17,499 | 42 (1.4%) | 249 (11.2%) |
| $17,500 to $19,999 | 17 (0.5%) | 0 (0.0%) |
| $20,000 to $22,499 | 0 (0.0%) | 44 (2.0%) |
| $22,500 to $24,999 | 87 (2.8%) | 0 (0.0%) |
| $25,000 to $29,999 | 332 (10.8%) | 96 (4.3%) |
| $30,000 to $34,999 | 165 (5.4%) | 148 (6.6%) |
| $35,000 to $39,999 | 59 (1.9%) | 243 (10.9%) |
| $40,000 to $44,999 | 90 (2.9%) | 104 (4.7%) |
| $45,000 to $49,999 | 74 (2.4%) | 78 (3.5%) |
| $50,000 to $54,999 | 228 (7.4%) | 144 (6.5%) |
| $55,000 to $64,999 | 362 (11.8%) | 108 (4.8%) |
| $65,000 to $74,999 | 297 (9.7%) | 285 (12.8%) |
| $75,000 to $99,999 | 383 (12.4%) | 196 (8.8%) |
| $100,000+ | 618 (20.1%) | 49 (2.2%) |
| Total | 3,077 (100.0%) | 2,232 (100.0%) |
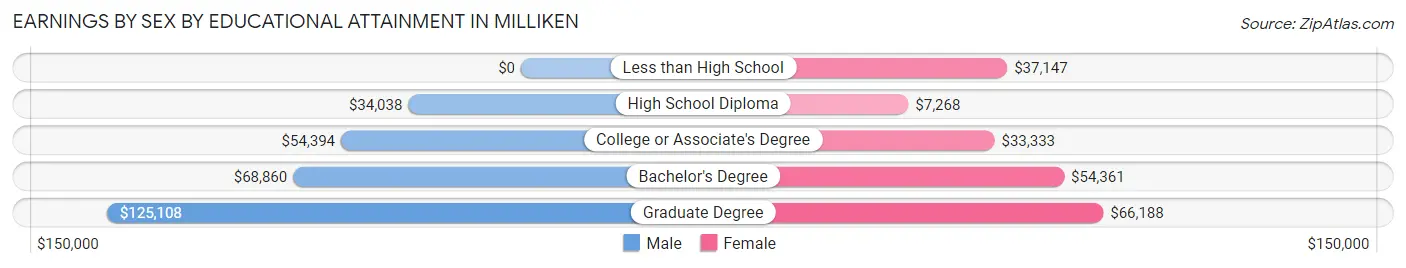
Earnings by Sex by Educational Attainment in Milliken
Average earnings in Milliken are $63,376 for men and $38,070 for women, a difference of 39.9%. Men with an educational attainment of graduate degree enjoy the highest average annual earnings of $125,108, while those with high school diploma education earn the least with $34,038. Women with an educational attainment of graduate degree earn the most with the average annual earnings of $66,188, while those with high school diploma education have the smallest earnings of $7,268.
| Educational Attainment | Male Income | Female Income |
| Less than High School | - | - |
| High School Diploma | $34,038 | $7,268 |
| College or Associate's Degree | $54,394 | $33,333 |
| Bachelor's Degree | $68,860 | $54,361 |
| Graduate Degree | $125,108 | $66,188 |
| Total | $63,376 | $38,070 |
Family Income in Milliken
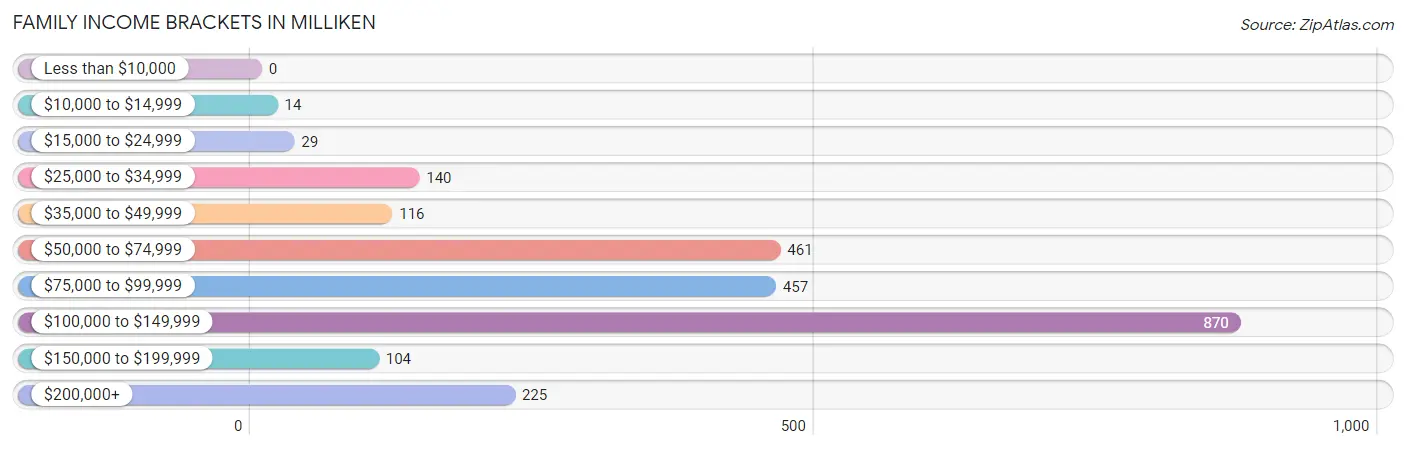
Family Income Brackets in Milliken
According to the Milliken family income data, there are 870 families falling into the $100,000 to $149,999 income range, which is the most common income bracket and makes up 36.0% of all families.
| Income Bracket | # Families | % Families |
| Less than $10,000 | 0 | 0.0% |
| $10,000 to $14,999 | 14 | 0.6% |
| $15,000 to $24,999 | 29 | 1.2% |
| $25,000 to $34,999 | 140 | 5.8% |
| $35,000 to $49,999 | 116 | 4.8% |
| $50,000 to $74,999 | 461 | 19.1% |
| $75,000 to $99,999 | 457 | 18.9% |
| $100,000 to $149,999 | 870 | 36.0% |
| $150,000 to $199,999 | 104 | 4.3% |
| $200,000+ | 225 | 9.3% |
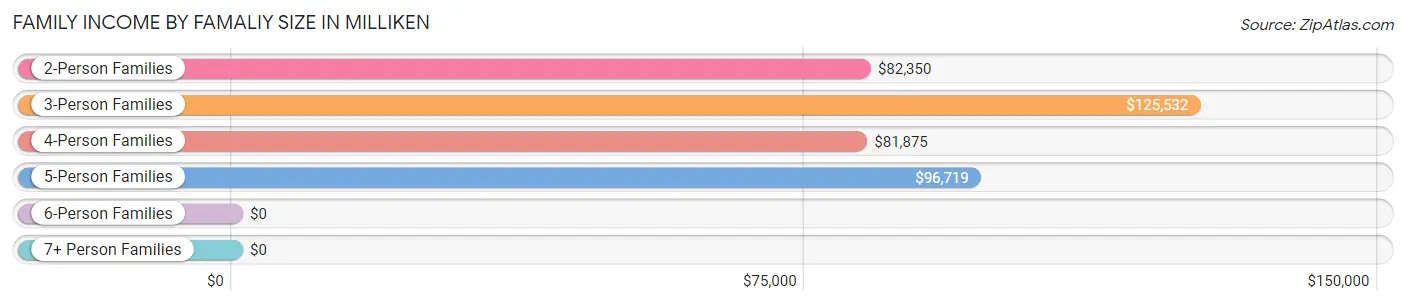
Family Income by Famaliy Size in Milliken
3-person families (875 | 36.2%) account for the highest median family income in Milliken with $125,532 per family, while 3-person families (875 | 36.2%) have the highest median income of $41,844 per family member.
| Income Bracket | # Families | Median Income |
| 2-Person Families | 953 (39.5%) | $82,350 |
| 3-Person Families | 875 (36.2%) | $125,532 |
| 4-Person Families | 313 (13.0%) | $81,875 |
| 5-Person Families | 188 (7.8%) | $96,719 |
| 6-Person Families | 23 (0.9%) | $0 |
| 7+ Person Families | 64 (2.6%) | $0 |
| Total | 2,416 (100.0%) | $98,750 |
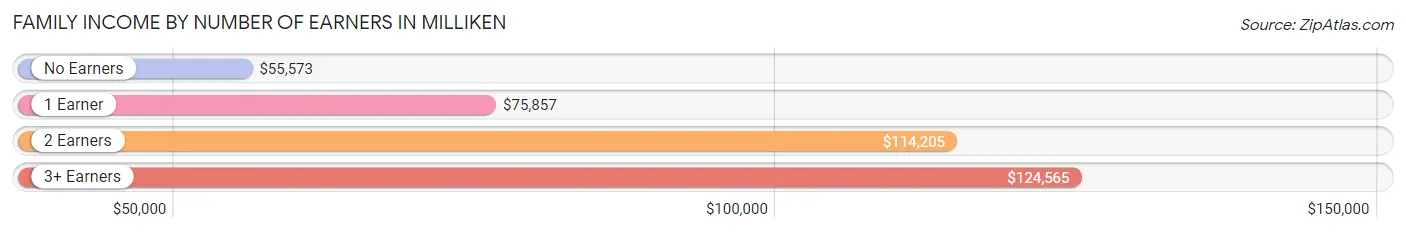
Family Income by Number of Earners in Milliken
The median family income in Milliken is $98,750, with families comprising 3+ earners (400) having the highest median family income of $124,565, while families with no earners (271) have the lowest median family income of $55,573, accounting for 16.6% and 11.2% of families, respectively.
| Number of Earners | # Families | Median Income |
| No Earners | 271 (11.2%) | $55,573 |
| 1 Earner | 398 (16.5%) | $75,857 |
| 2 Earners | 1,347 (55.7%) | $114,205 |
| 3+ Earners | 400 (16.6%) | $124,565 |
| Total | 2,416 (100.0%) | $98,750 |
Household Income in Milliken
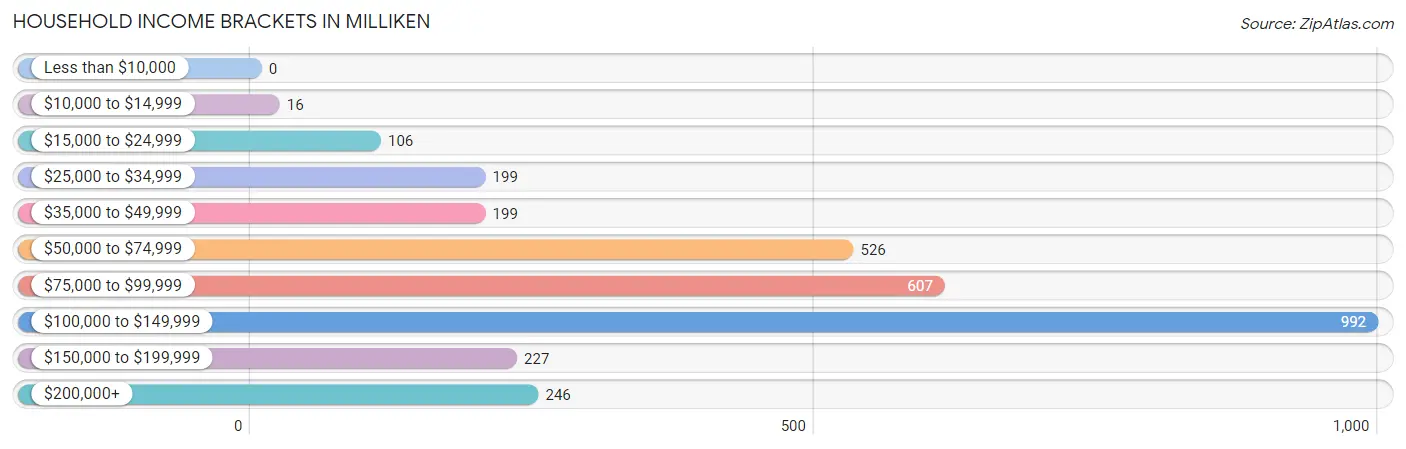
Household Income Brackets in Milliken
With 992 households falling in the category, the $100,000 to $149,999 income range is the most frequent in Milliken, accounting for 31.9% of all households.
| Income Bracket | # Households | % Households |
| Less than $10,000 | 0 | 0.0% |
| $10,000 to $14,999 | 16 | 0.5% |
| $15,000 to $24,999 | 106 | 3.4% |
| $25,000 to $34,999 | 199 | 6.4% |
| $35,000 to $49,999 | 199 | 6.4% |
| $50,000 to $74,999 | 526 | 16.9% |
| $75,000 to $99,999 | 607 | 19.5% |
| $100,000 to $149,999 | 992 | 31.9% |
| $150,000 to $199,999 | 227 | 7.3% |
| $200,000+ | 246 | 7.9% |
Household Income by Householder Age in Milliken
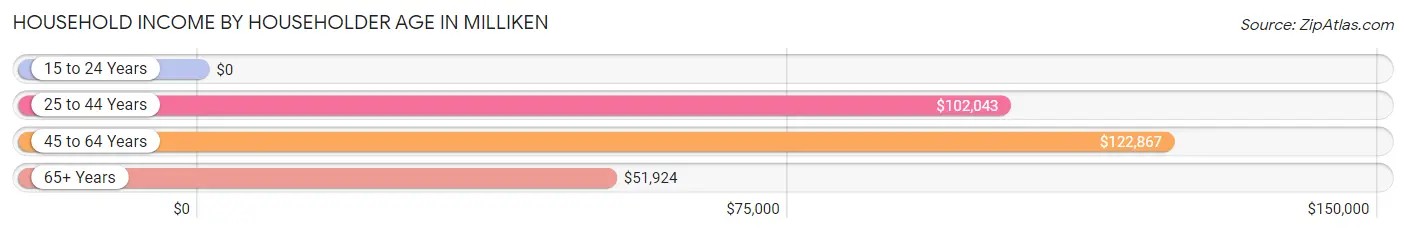
The median household income in Milliken is $96,772, with the highest median household income of $122,867 found in the 45 to 64 years age bracket for the primary householder. A total of 1,063 households (34.2%) fall into this category.
| Income Bracket | # Households | Median Income |
| 15 to 24 Years | 0 (0.0%) | $0 |
| 25 to 44 Years | 1,519 (48.8%) | $102,043 |
| 45 to 64 Years | 1,063 (34.2%) | $122,867 |
| 65+ Years | 529 (17.0%) | $51,924 |
| Total | 3,111 (100.0%) | $96,772 |
Poverty in Milliken
Income Below Poverty by Sex and Age in Milliken
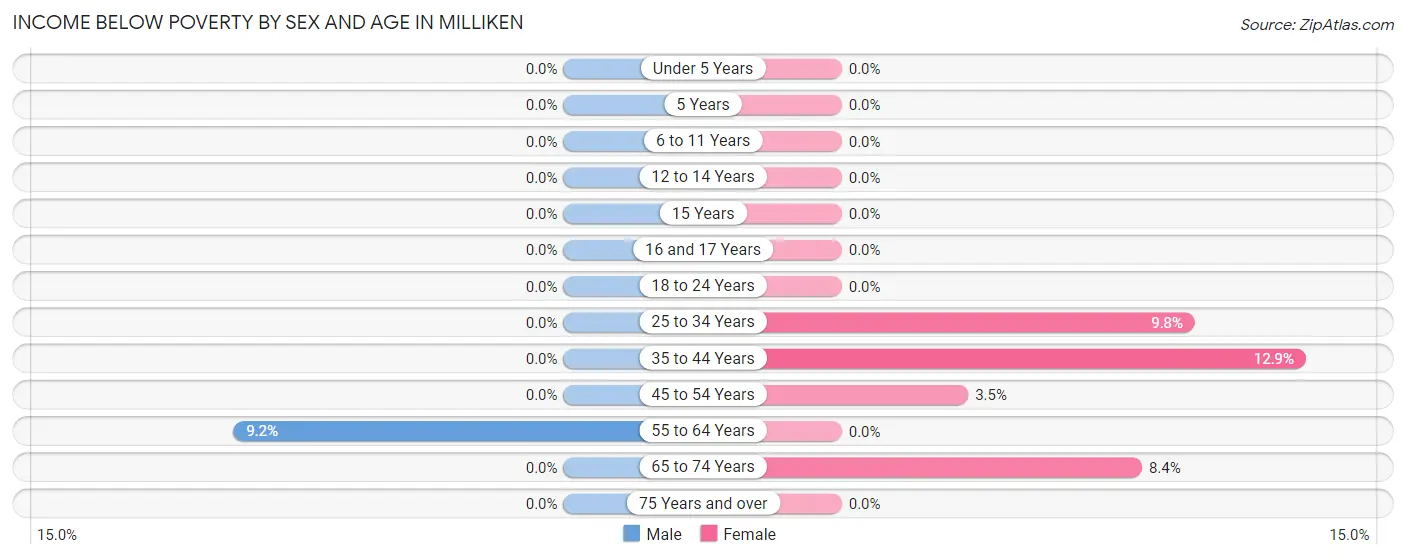
With 1.1% poverty level for males and 5.3% for females among the residents of Milliken, 55 to 64 year old males and 35 to 44 year old females are the most vulnerable to poverty, with 49 males (9.2%) and 62 females (12.9%) in their respective age groups living below the poverty level.
| Age Bracket | Male | Female |
| Under 5 Years | 0 (0.0%) | 0 (0.0%) |
| 5 Years | 0 (0.0%) | 0 (0.0%) |
| 6 to 11 Years | 0 (0.0%) | 0 (0.0%) |
| 12 to 14 Years | 0 (0.0%) | 0 (0.0%) |
| 15 Years | 0 (0.0%) | 0 (0.0%) |
| 16 and 17 Years | 0 (0.0%) | 0 (0.0%) |
| 18 to 24 Years | 0 (0.0%) | 0 (0.0%) |
| 25 to 34 Years | 0 (0.0%) | 110 (9.8%) |
| 35 to 44 Years | 0 (0.0%) | 62 (12.9%) |
| 45 to 54 Years | 0 (0.0%) | 13 (3.5%) |
| 55 to 64 Years | 49 (9.2%) | 0 (0.0%) |
| 65 to 74 Years | 0 (0.0%) | 30 (8.4%) |
| 75 Years and over | 0 (0.0%) | 0 (0.0%) |
| Total | 49 (1.1%) | 215 (5.3%) |
Income Above Poverty by Sex and Age in Milliken
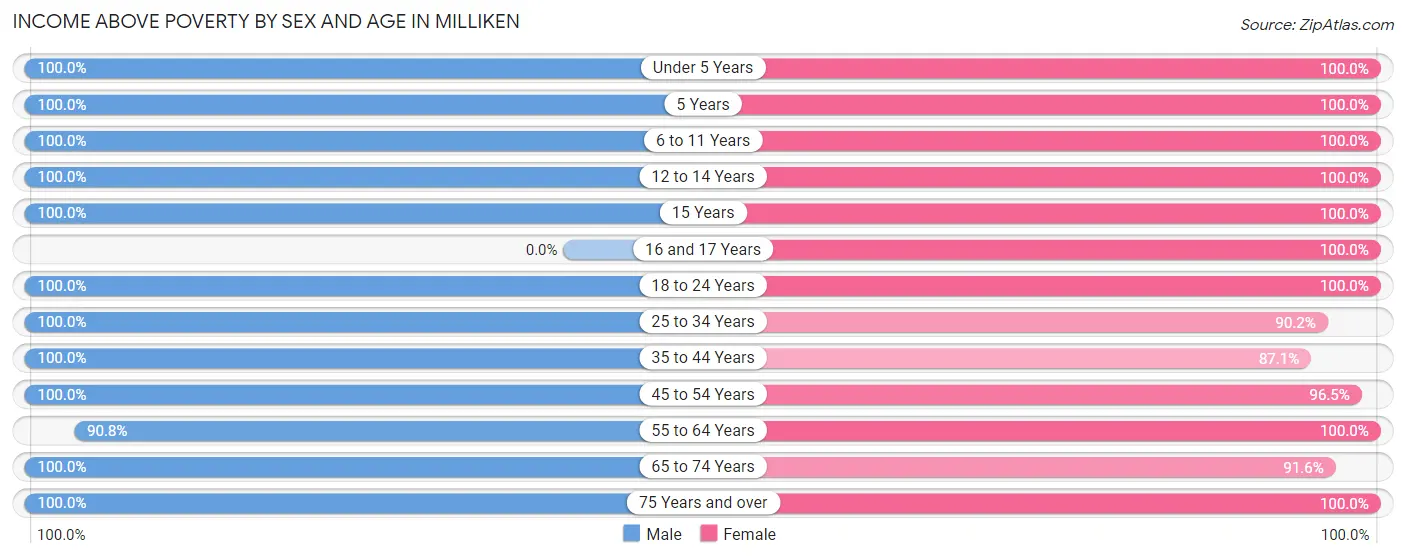
According to the poverty statistics in Milliken, males aged under 5 years and females aged under 5 years are the age groups that are most secure financially, with 100.0% of males and 100.0% of females in these age groups living above the poverty line.
| Age Bracket | Male | Female |
| Under 5 Years | 298 (100.0%) | 472 (100.0%) |
| 5 Years | 45 (100.0%) | 83 (100.0%) |
| 6 to 11 Years | 266 (100.0%) | 294 (100.0%) |
| 12 to 14 Years | 195 (100.0%) | 63 (100.0%) |
| 15 Years | 63 (100.0%) | 2 (100.0%) |
| 16 and 17 Years | 0 (0.0%) | 161 (100.0%) |
| 18 to 24 Years | 184 (100.0%) | 83 (100.0%) |
| 25 to 34 Years | 1,455 (100.0%) | 1,009 (90.2%) |
| 35 to 44 Years | 538 (100.0%) | 418 (87.1%) |
| 45 to 54 Years | 498 (100.0%) | 356 (96.5%) |
| 55 to 64 Years | 484 (90.8%) | 459 (100.0%) |
| 65 to 74 Years | 241 (100.0%) | 329 (91.6%) |
| 75 Years and over | 96 (100.0%) | 82 (100.0%) |
| Total | 4,363 (98.9%) | 3,811 (94.7%) |
Income Below Poverty Among Married-Couple Families in Milliken
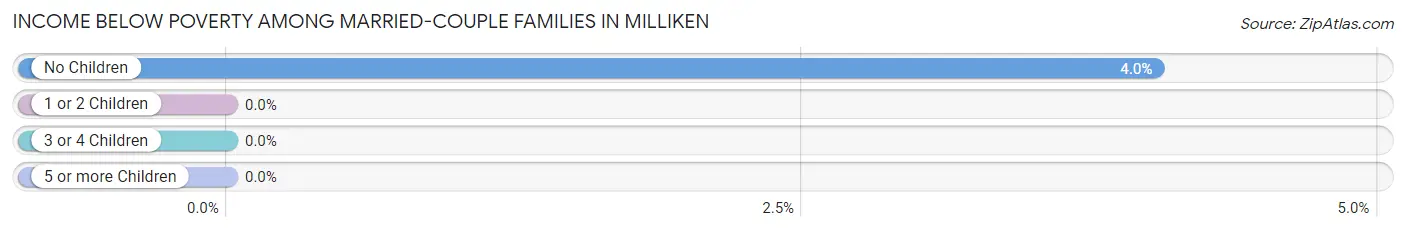
The poverty statistics for married-couple families in Milliken show that 2.1% or 44 of the total 2,131 families live below the poverty line. Families with no children have the highest poverty rate of 4.0%, comprising of 44 families. On the other hand, families with 1 or 2 children have the lowest poverty rate of 0.0%, which includes 0 families.
| Children | Above Poverty | Below Poverty |
| No Children | 1,048 (96.0%) | 44 (4.0%) |
| 1 or 2 Children | 909 (100.0%) | 0 (0.0%) |
| 3 or 4 Children | 95 (100.0%) | 0 (0.0%) |
| 5 or more Children | 35 (100.0%) | 0 (0.0%) |
| Total | 2,087 (97.9%) | 44 (2.1%) |
Income Below Poverty Among Single-Parent Households in Milliken
| Children | Single Father | Single Mother |
| No Children | 0 (0.0%) | 0 (0.0%) |
| 1 or 2 Children | 0 (0.0%) | 0 (0.0%) |
| 3 or 4 Children | 0 (0.0%) | 0 (0.0%) |
| 5 or more Children | 0 (0.0%) | 0 (0.0%) |
| Total | 0 (0.0%) | 0 (0.0%) |
Income Below Poverty Among Married-Couple vs Single-Parent Households in Milliken
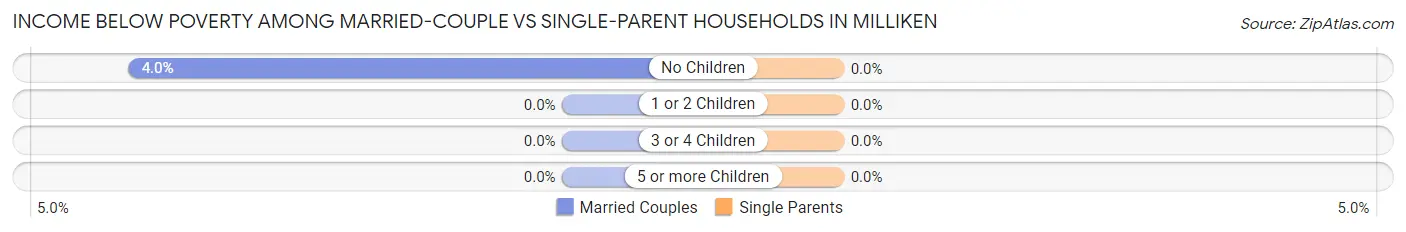
| Children | Married-Couple Families | Single-Parent Households |
| No Children | 44 (4.0%) | 0 (0.0%) |
| 1 or 2 Children | 0 (0.0%) | 0 (0.0%) |
| 3 or 4 Children | 0 (0.0%) | 0 (0.0%) |
| 5 or more Children | 0 (0.0%) | 0 (0.0%) |
| Total | 44 (2.1%) | 0 (0.0%) |
Race in Milliken
The most populous races in Milliken are White / Caucasian (7,483 | 88.7%), Hispanic or Latino (1,810 | 21.4%), and Two or more Races (685 | 8.1%).
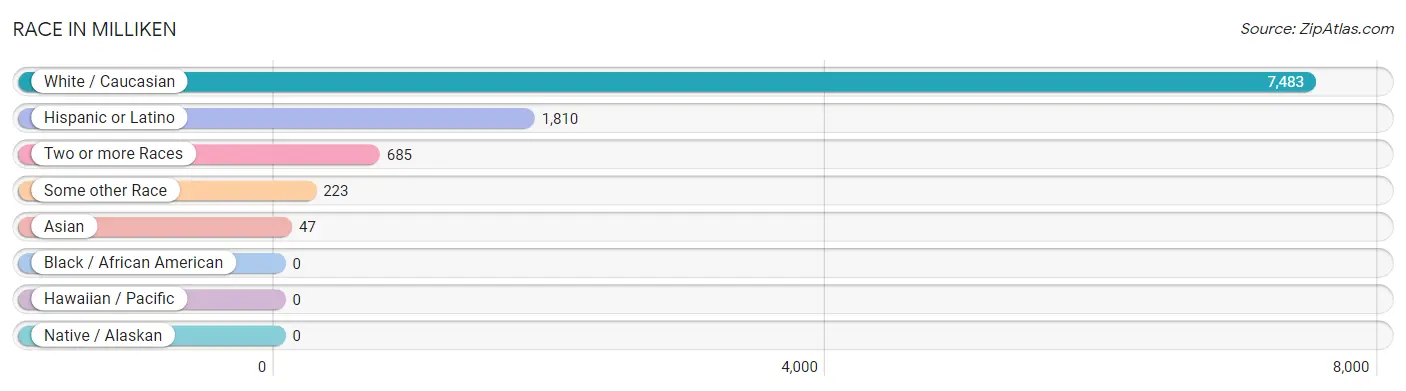
| Race | # Population | % Population |
| Asian | 47 | 0.6% |
| Black / African American | 0 | 0.0% |
| Hawaiian / Pacific | 0 | 0.0% |
| Hispanic or Latino | 1,810 | 21.4% |
| Native / Alaskan | 0 | 0.0% |
| White / Caucasian | 7,483 | 88.7% |
| Two or more Races | 685 | 8.1% |
| Some other Race | 223 | 2.6% |
| Total | 8,438 | 100.0% |
Ancestry in Milliken
The most populous ancestries reported in Milliken are German (1,662 | 19.7%), Mexican (1,385 | 16.4%), English (764 | 9.0%), Italian (750 | 8.9%), and Irish (556 | 6.6%), together accounting for 60.6% of all Milliken residents.
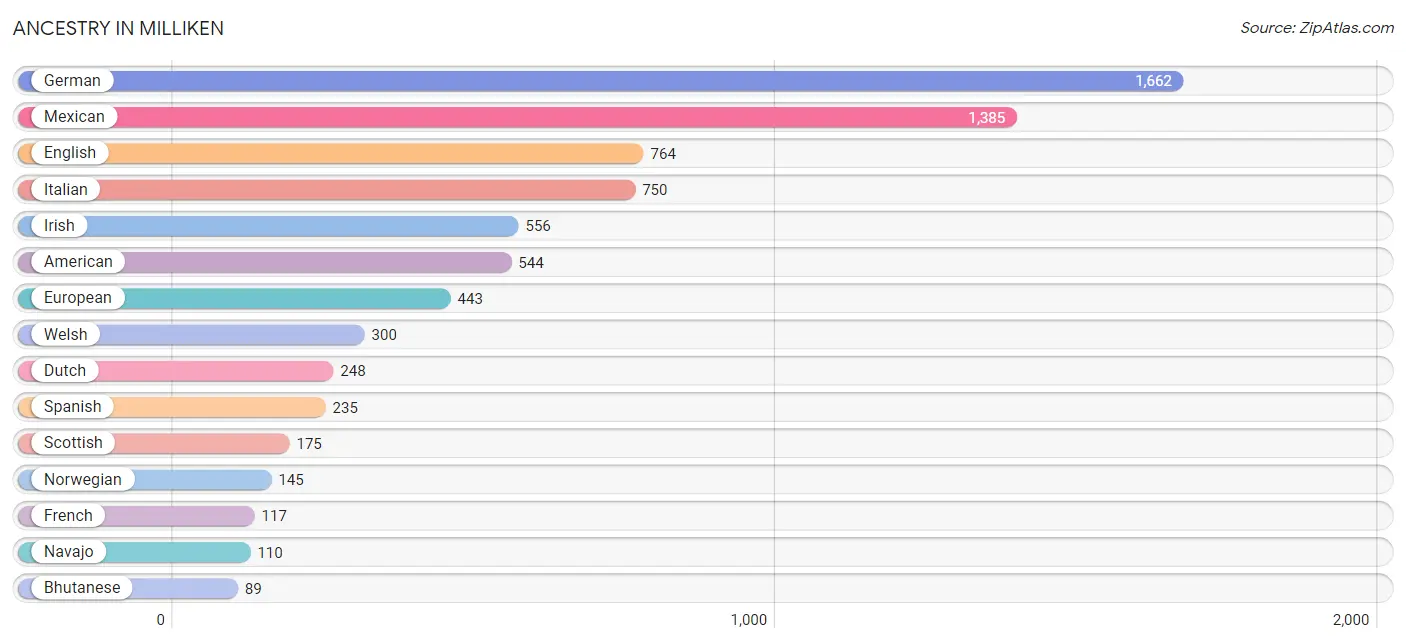
| Ancestry | # Population | % Population |
| American | 544 | 6.5% |
| Bhutanese | 89 | 1.1% |
| British | 13 | 0.2% |
| Burmese | 66 | 0.8% |
| Cherokee | 10 | 0.1% |
| Czech | 13 | 0.2% |
| Dutch | 248 | 2.9% |
| Eastern European | 23 | 0.3% |
| English | 764 | 9.0% |
| European | 443 | 5.2% |
| Finnish | 24 | 0.3% |
| French | 117 | 1.4% |
| German | 1,662 | 19.7% |
| Greek | 72 | 0.9% |
| Hungarian | 33 | 0.4% |
| Indian (Asian) | 66 | 0.8% |
| Irish | 556 | 6.6% |
| Italian | 750 | 8.9% |
| Mexican | 1,385 | 16.4% |
| Navajo | 110 | 1.3% |
| Norwegian | 145 | 1.7% |
| Polish | 24 | 0.3% |
| Russian | 14 | 0.2% |
| Scandinavian | 29 | 0.3% |
| Scotch-Irish | 87 | 1.0% |
| Scottish | 175 | 2.1% |
| Spaniard | 76 | 0.9% |
| Spanish | 235 | 2.8% |
| Sri Lankan | 13 | 0.2% |
| Swedish | 14 | 0.2% |
| Swiss | 17 | 0.2% |
| Welsh | 300 | 3.6% | View All 32 Rows |
Immigrants in Milliken
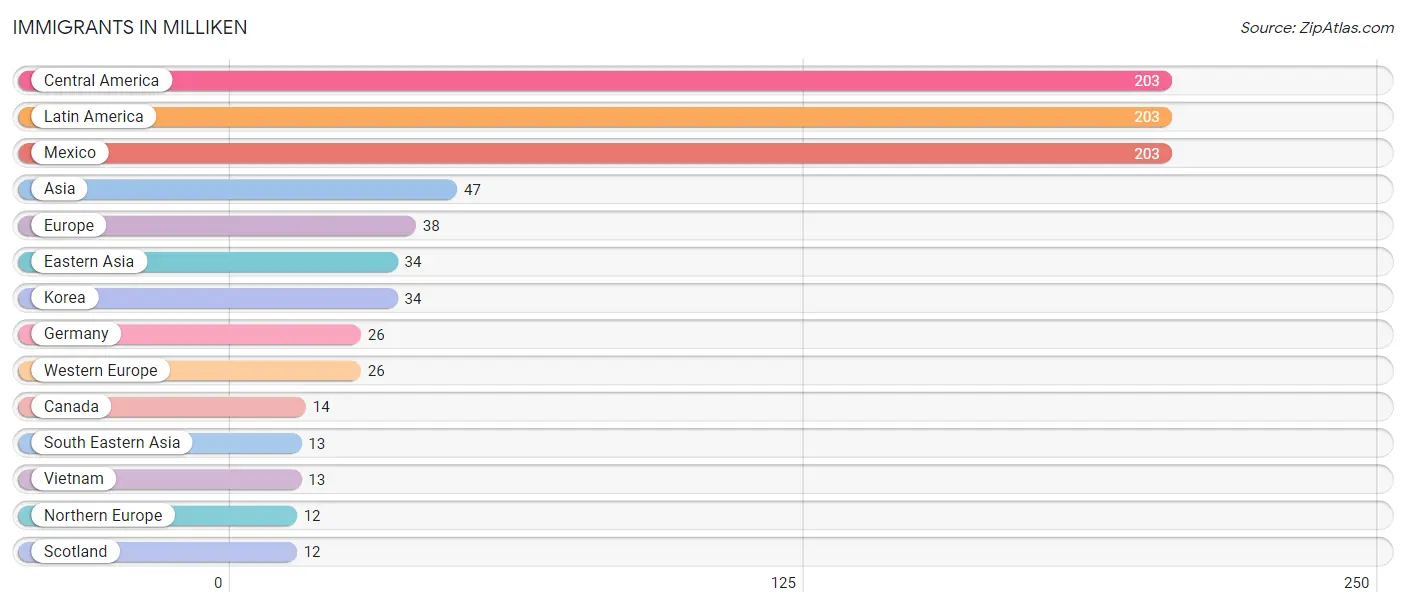
The most numerous immigrant groups reported in Milliken came from Central America (203 | 2.4%), Latin America (203 | 2.4%), Mexico (203 | 2.4%), Asia (47 | 0.6%), and Europe (38 | 0.4%), together accounting for 8.2% of all Milliken residents.
| Immigration Origin | # Population | % Population |
| Asia | 47 | 0.6% |
| Canada | 14 | 0.2% |
| Central America | 203 | 2.4% |
| Eastern Asia | 34 | 0.4% |
| Europe | 38 | 0.4% |
| Germany | 26 | 0.3% |
| Korea | 34 | 0.4% |
| Latin America | 203 | 2.4% |
| Mexico | 203 | 2.4% |
| Northern Europe | 12 | 0.1% |
| Scotland | 12 | 0.1% |
| South Eastern Asia | 13 | 0.2% |
| Vietnam | 13 | 0.2% |
| Western Europe | 26 | 0.3% | View All 14 Rows |
Sex and Age in Milliken
Sex and Age in Milliken
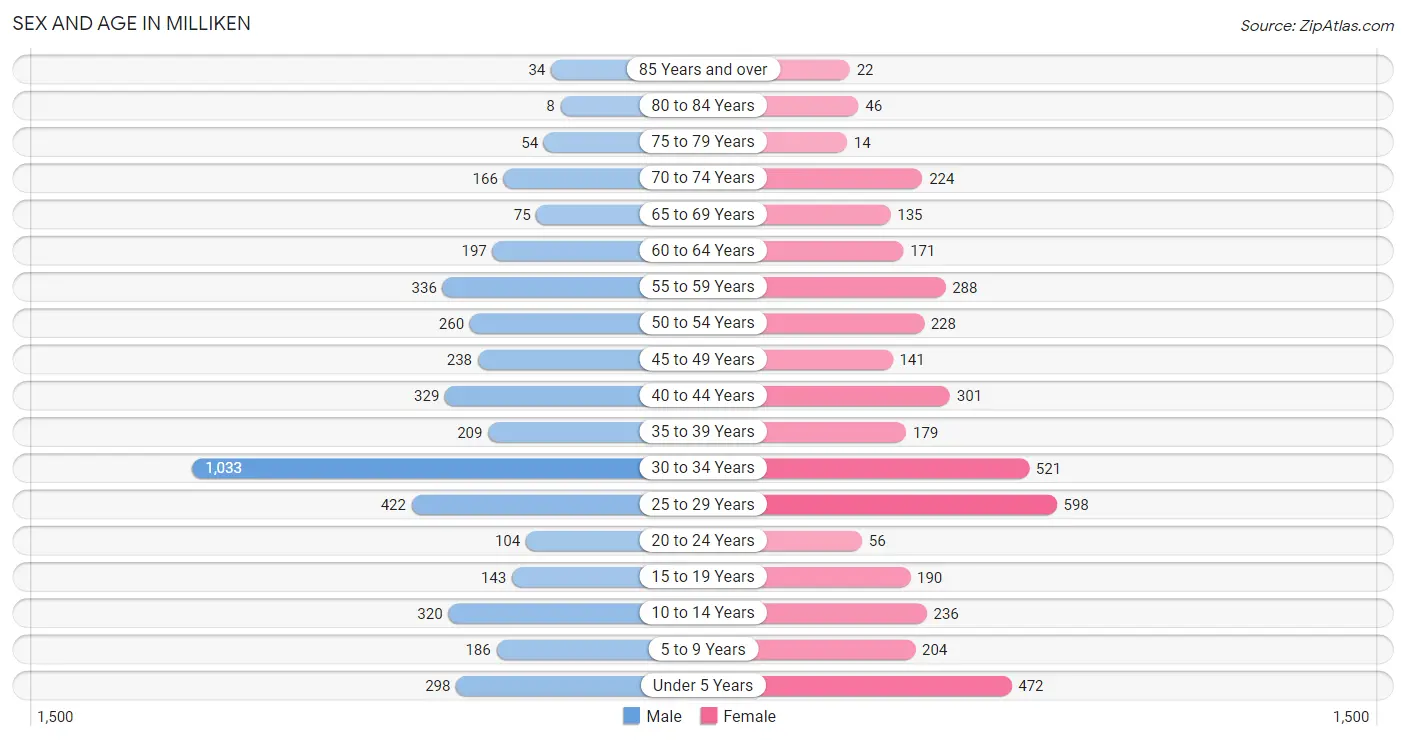
The most populous age groups in Milliken are 30 to 34 Years (1,033 | 23.4%) for men and 25 to 29 Years (598 | 14.8%) for women.
| Age Bracket | Male | Female |
| Under 5 Years | 298 (6.8%) | 472 (11.7%) |
| 5 to 9 Years | 186 (4.2%) | 204 (5.1%) |
| 10 to 14 Years | 320 (7.2%) | 236 (5.9%) |
| 15 to 19 Years | 143 (3.2%) | 190 (4.7%) |
| 20 to 24 Years | 104 (2.4%) | 56 (1.4%) |
| 25 to 29 Years | 422 (9.6%) | 598 (14.8%) |
| 30 to 34 Years | 1,033 (23.4%) | 521 (12.9%) |
| 35 to 39 Years | 209 (4.7%) | 179 (4.4%) |
| 40 to 44 Years | 329 (7.5%) | 301 (7.5%) |
| 45 to 49 Years | 238 (5.4%) | 141 (3.5%) |
| 50 to 54 Years | 260 (5.9%) | 228 (5.7%) |
| 55 to 59 Years | 336 (7.6%) | 288 (7.1%) |
| 60 to 64 Years | 197 (4.5%) | 171 (4.3%) |
| 65 to 69 Years | 75 (1.7%) | 135 (3.4%) |
| 70 to 74 Years | 166 (3.8%) | 224 (5.6%) |
| 75 to 79 Years | 54 (1.2%) | 14 (0.4%) |
| 80 to 84 Years | 8 (0.2%) | 46 (1.1%) |
| 85 Years and over | 34 (0.8%) | 22 (0.5%) |
| Total | 4,412 (100.0%) | 4,026 (100.0%) |
Families and Households in Milliken
Median Family Size in Milliken
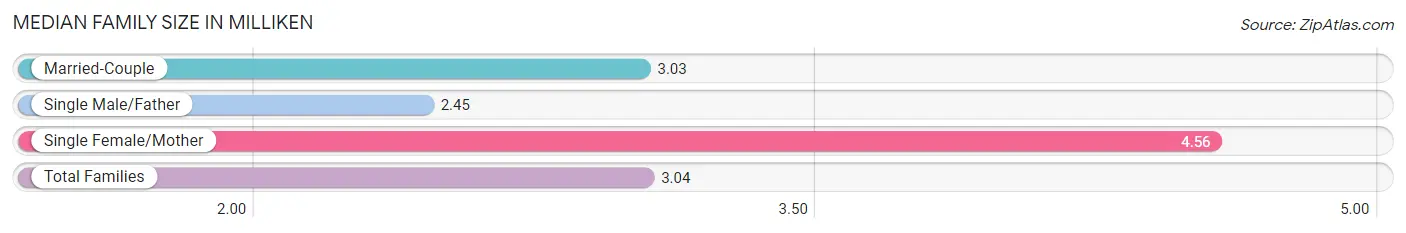
The median family size in Milliken is 3.04 persons per family, with single female/mother families (87 | 3.6%) accounting for the largest median family size of 4.56 persons per family. On the other hand, single male/father families (198 | 8.2%) represent the smallest median family size with 2.45 persons per family.
| Family Type | # Families | Family Size |
| Married-Couple | 2,131 (88.2%) | 3.03 |
| Single Male/Father | 198 (8.2%) | 2.45 |
| Single Female/Mother | 87 (3.6%) | 4.56 |
| Total Families | 2,416 (100.0%) | 3.04 |
Median Household Size in Milliken
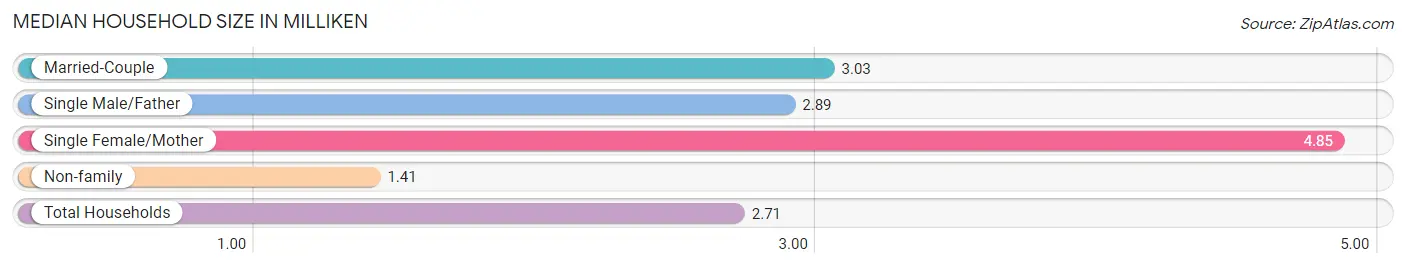
The median household size in Milliken is 2.71 persons per household, with single female/mother households (87 | 2.8%) accounting for the largest median household size of 4.85 persons per household. non-family households (695 | 22.3%) represent the smallest median household size with 1.41 persons per household.
| Household Type | # Households | Household Size |
| Married-Couple | 2,131 (68.5%) | 3.03 |
| Single Male/Father | 198 (6.4%) | 2.89 |
| Single Female/Mother | 87 (2.8%) | 4.85 |
| Non-family | 695 (22.3%) | 1.41 |
| Total Households | 3,111 (100.0%) | 2.71 |
Household Size by Marriage Status in Milliken
Out of a total of 3,111 households in Milliken, 2,416 (77.7%) are family households, while 695 (22.3%) are nonfamily households. The most numerous type of family households are 2-person households, comprising 918, and the most common type of nonfamily households are 1-person households, comprising 401.
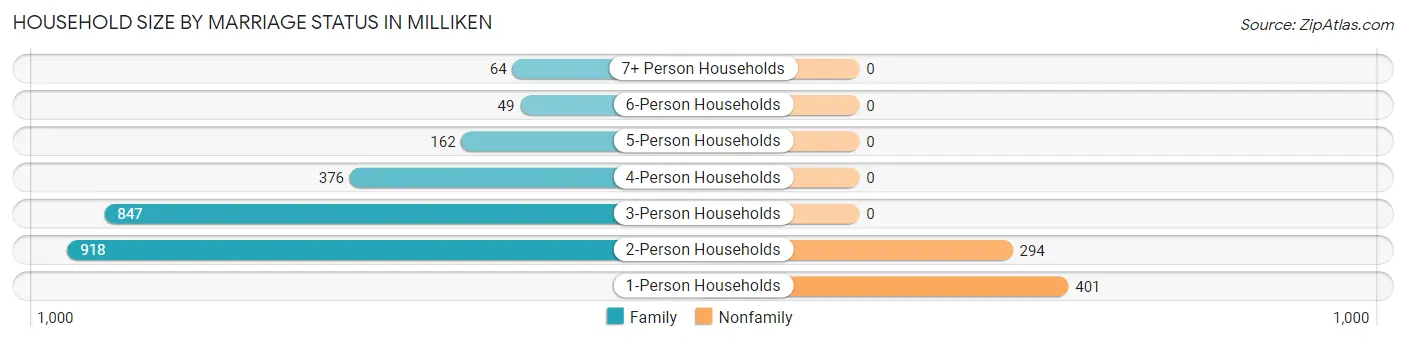
| Household Size | Family Households | Nonfamily Households |
| 1-Person Households | - | 401 (12.9%) |
| 2-Person Households | 918 (29.5%) | 294 (9.5%) |
| 3-Person Households | 847 (27.2%) | 0 (0.0%) |
| 4-Person Households | 376 (12.1%) | 0 (0.0%) |
| 5-Person Households | 162 (5.2%) | 0 (0.0%) |
| 6-Person Households | 49 (1.6%) | 0 (0.0%) |
| 7+ Person Households | 64 (2.1%) | 0 (0.0%) |
| Total | 2,416 (77.7%) | 695 (22.3%) |
Female Fertility in Milliken
Fertility by Age in Milliken
Average fertility rate in Milliken is 95.0 births per 1,000 women. Women in the age bracket of 20 to 34 years have the highest fertility rate with 146.0 births per 1,000 women. Women in the age bracket of 20 to 34 years acount for 86.0% of all women with births.
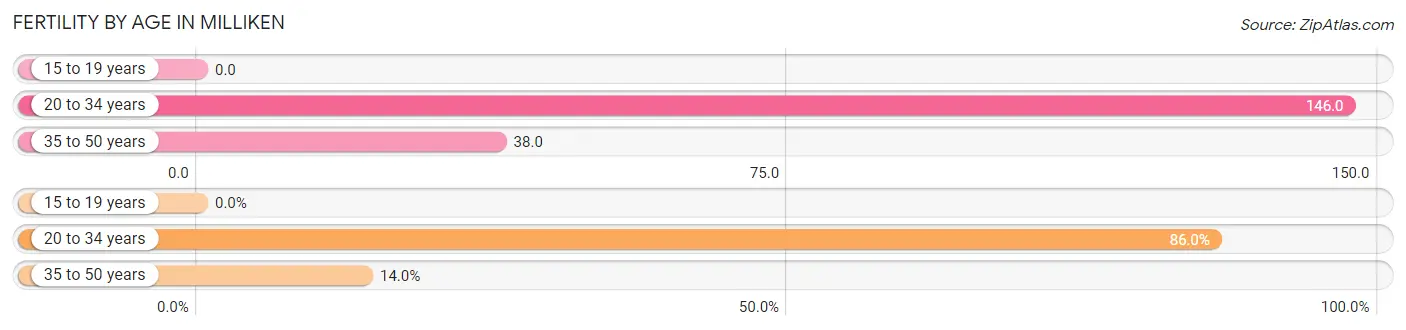
| Age Bracket | Women with Births | Births / 1,000 Women |
| 15 to 19 years | 0 (0.0%) | 0.0 |
| 20 to 34 years | 172 (86.0%) | 146.0 |
| 35 to 50 years | 28 (14.0%) | 38.0 |
| Total | 200 (100.0%) | 95.0 |
Fertility by Age by Marriage Status in Milliken
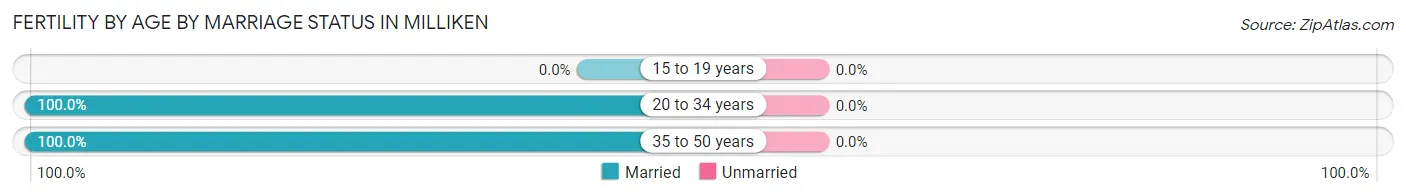
| Age Bracket | Married | Unmarried |
| 15 to 19 years | 0 (0.0%) | 0 (0.0%) |
| 20 to 34 years | 172 (100.0%) | 0 (0.0%) |
| 35 to 50 years | 28 (100.0%) | 0 (0.0%) |
| Total | 200 (100.0%) | 0 (0.0%) |
Fertility by Education in Milliken
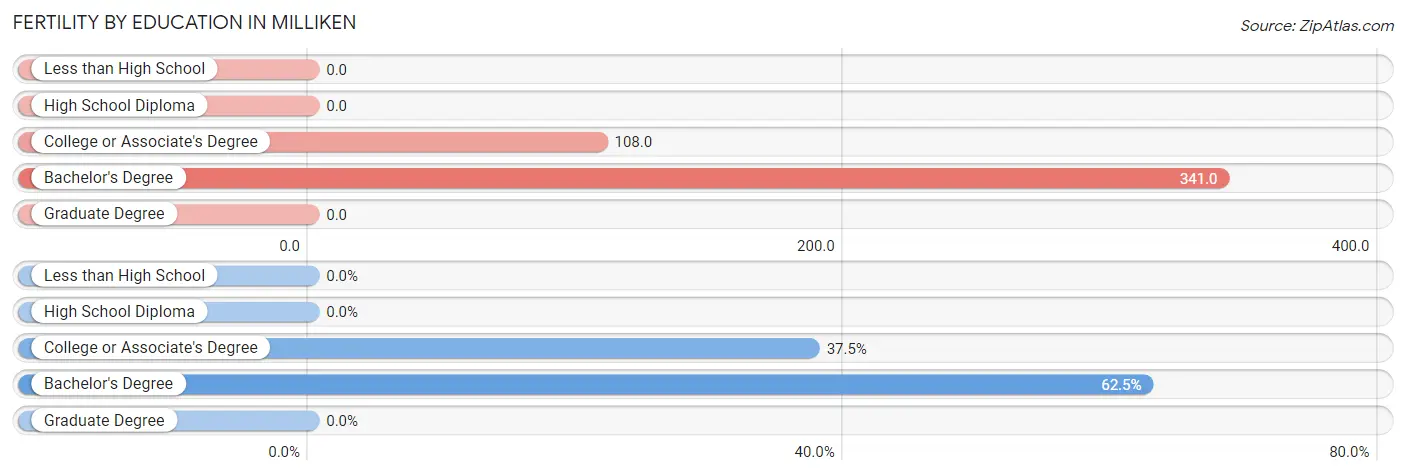
| Educational Attainment | Women with Births | Births / 1,000 Women |
| Less than High School | 0 (0.0%) | 0.0 |
| High School Diploma | 0 (0.0%) | 0.0 |
| College or Associate's Degree | 75 (37.5%) | 108.0 |
| Bachelor's Degree | 125 (62.5%) | 341.0 |
| Graduate Degree | 0 (0.0%) | 0.0 |
| Total | 200 (100.0%) | 95.0 |
Fertility by Education by Marriage Status in Milliken
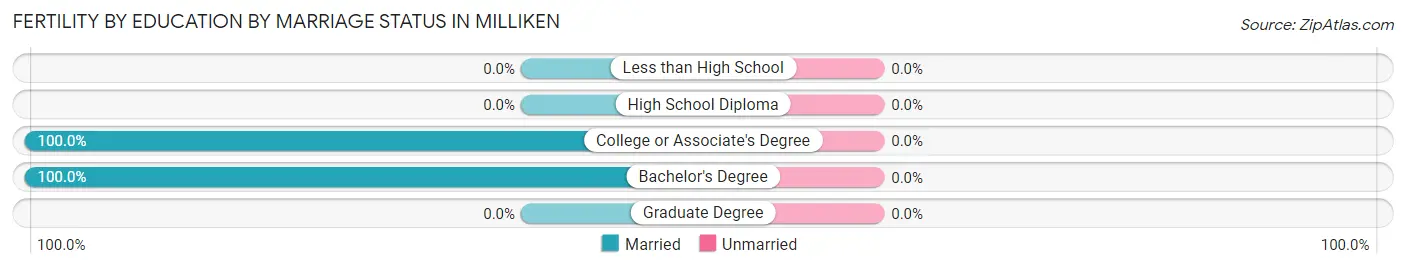
| Educational Attainment | Married | Unmarried |
| Less than High School | 0 (0.0%) | 0 (0.0%) |
| High School Diploma | 0 (0.0%) | 0 (0.0%) |
| College or Associate's Degree | 75 (100.0%) | 0 (0.0%) |
| Bachelor's Degree | 125 (100.0%) | 0 (0.0%) |
| Graduate Degree | 0 (0.0%) | 0 (0.0%) |
| Total | 200 (100.0%) | 0 (0.0%) |
Employment Characteristics in Milliken
Employment by Class of Employer in Milliken
Among the 4,722 employed individuals in Milliken, private company employees (2,946 | 62.4%), not-for-profit organizations (473 | 10.0%), and self-employed (incorporated) (451 | 9.6%) make up the most common classes of employment.
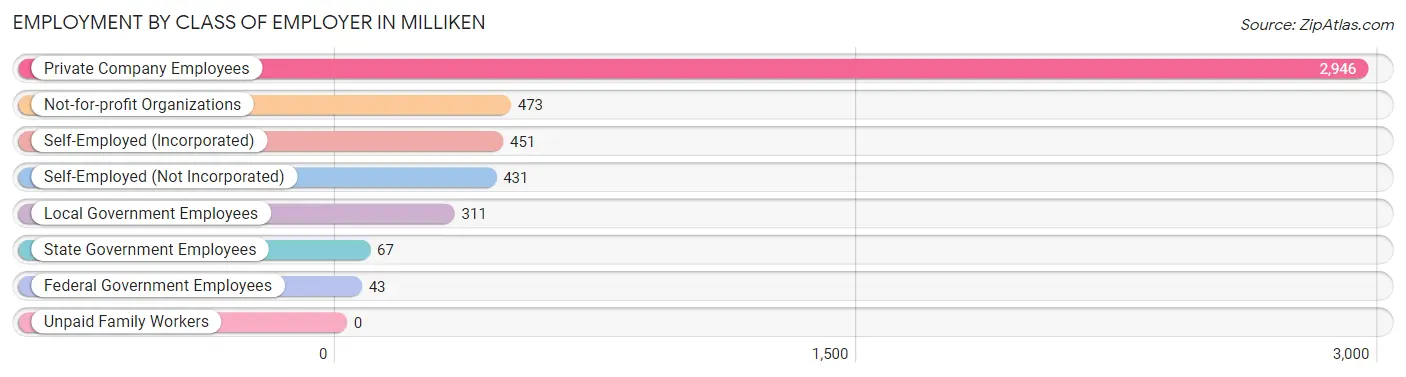
| Employer Class | # Employees | % Employees |
| Private Company Employees | 2,946 | 62.4% |
| Self-Employed (Incorporated) | 451 | 9.6% |
| Self-Employed (Not Incorporated) | 431 | 9.1% |
| Not-for-profit Organizations | 473 | 10.0% |
| Local Government Employees | 311 | 6.6% |
| State Government Employees | 67 | 1.4% |
| Federal Government Employees | 43 | 0.9% |
| Unpaid Family Workers | 0 | 0.0% |
| Total | 4,722 | 100.0% |
Employment Status by Age in Milliken
According to the labor force statistics for Milliken, out of the total population over 16 years of age (6,657), 76.1% or 5,066 individuals are in the labor force, with 2.9% or 147 of them unemployed. The age group with the highest labor force participation rate is 30 to 34 years, with 94.9% or 1,475 individuals in the labor force. Within the labor force, the 16 to 19 years age range has the highest percentage of unemployed individuals, with 32.1% or 25 of them being unemployed.
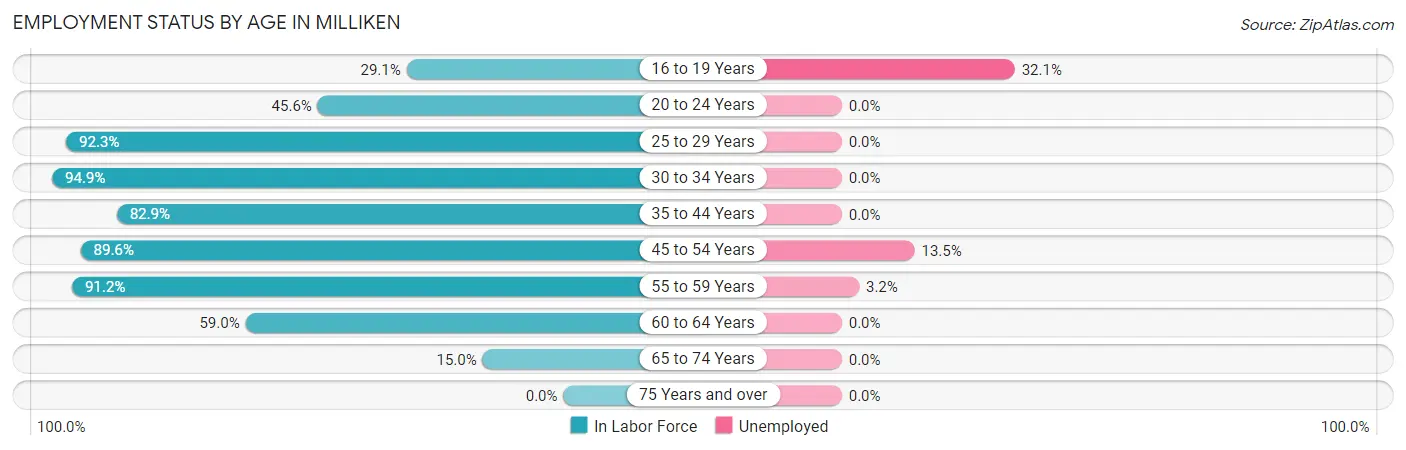
| Age Bracket | In Labor Force | Unemployed |
| 16 to 19 Years | 78 (29.1%) | 25 (32.1%) |
| 20 to 24 Years | 73 (45.6%) | 0 (0.0%) |
| 25 to 29 Years | 941 (92.3%) | 0 (0.0%) |
| 30 to 34 Years | 1,475 (94.9%) | 0 (0.0%) |
| 35 to 44 Years | 844 (82.9%) | 0 (0.0%) |
| 45 to 54 Years | 777 (89.6%) | 105 (13.5%) |
| 55 to 59 Years | 569 (91.2%) | 18 (3.2%) |
| 60 to 64 Years | 217 (59.0%) | 0 (0.0%) |
| 65 to 74 Years | 90 (15.0%) | 0 (0.0%) |
| 75 Years and over | 0 (0.0%) | 0 (0.0%) |
| Total | 5,066 (76.1%) | 147 (2.9%) |
Employment Status by Educational Attainment in Milliken
According to labor force statistics for Milliken, 88.5% of individuals (4,824) out of the total population between 25 and 64 years of age (5,451) are in the labor force, with 2.6% or 125 of them being unemployed. The group with the highest labor force participation rate are those with the educational attainment of bachelor's degree or higher, with 95.1% or 1,802 individuals in the labor force. Within the labor force, individuals with high school diploma education have the highest percentage of unemployment, with 8.8% or 91 of them being unemployed.
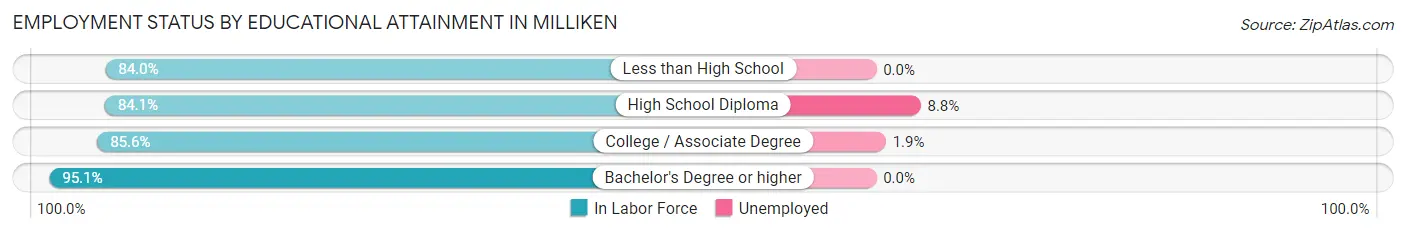
| Educational Attainment | In Labor Force | Unemployed |
| Less than High School | 325 (84.0%) | 0 (0.0%) |
| High School Diploma | 1,039 (84.1%) | 109 (8.8%) |
| College / Associate Degree | 1,655 (85.6%) | 37 (1.9%) |
| Bachelor's Degree or higher | 1,802 (95.1%) | 0 (0.0%) |
| Total | 4,824 (88.5%) | 142 (2.6%) |
Employment Occupations by Sex in Milliken
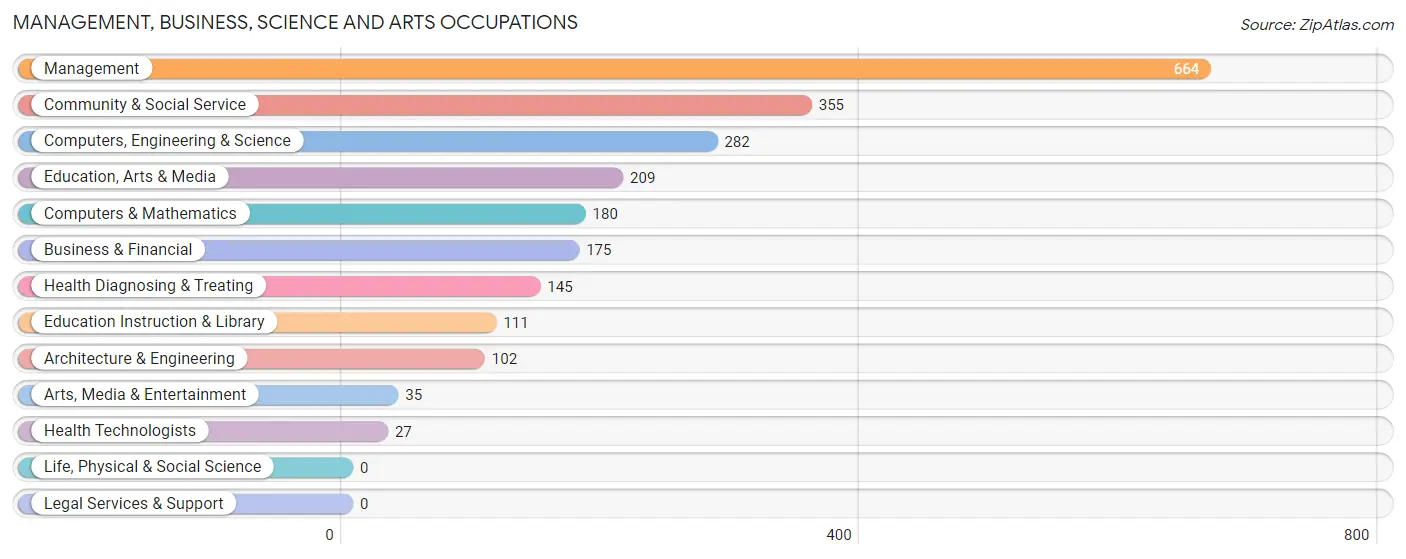
Management, Business, Science and Arts Occupations
The most common Management, Business, Science and Arts occupations in Milliken are Management (664 | 13.5%), Community & Social Service (355 | 7.2%), Computers, Engineering & Science (282 | 5.7%), Education, Arts & Media (209 | 4.3%), and Computers & Mathematics (180 | 3.7%).
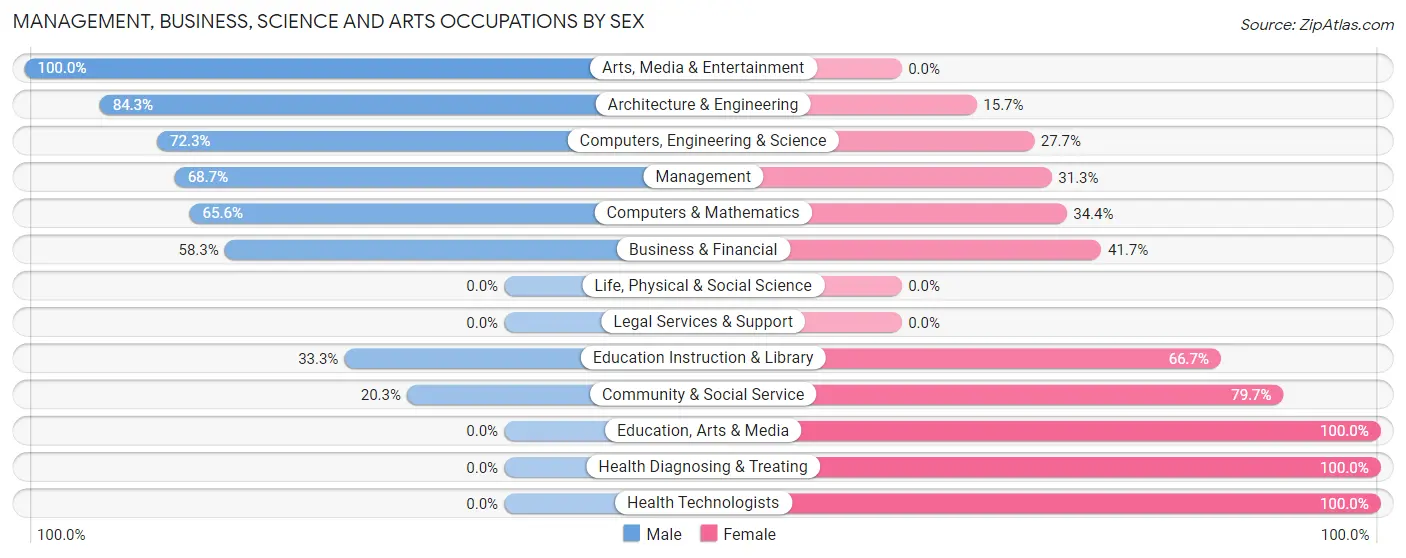
Management, Business, Science and Arts Occupations by Sex
Within the Management, Business, Science and Arts occupations in Milliken, the most male-oriented occupations are Arts, Media & Entertainment (100.0%), Architecture & Engineering (84.3%), and Computers, Engineering & Science (72.3%), while the most female-oriented occupations are Education, Arts & Media (100.0%), Health Diagnosing & Treating (100.0%), and Health Technologists (100.0%).
| Occupation | Male | Female |
| Management | 456 (68.7%) | 208 (31.3%) |
| Business & Financial | 102 (58.3%) | 73 (41.7%) |
| Computers, Engineering & Science | 204 (72.3%) | 78 (27.7%) |
| Computers & Mathematics | 118 (65.6%) | 62 (34.4%) |
| Architecture & Engineering | 86 (84.3%) | 16 (15.7%) |
| Life, Physical & Social Science | 0 (0.0%) | 0 (0.0%) |
| Community & Social Service | 72 (20.3%) | 283 (79.7%) |
| Education, Arts & Media | 0 (0.0%) | 209 (100.0%) |
| Legal Services & Support | 0 (0.0%) | 0 (0.0%) |
| Education Instruction & Library | 37 (33.3%) | 74 (66.7%) |
| Arts, Media & Entertainment | 35 (100.0%) | 0 (0.0%) |
| Health Diagnosing & Treating | 0 (0.0%) | 145 (100.0%) |
| Health Technologists | 0 (0.0%) | 27 (100.0%) |
| Total (Category) | 834 (51.4%) | 787 (48.5%) |
| Total (Overall) | 2,902 (59.0%) | 2,013 (41.0%) |
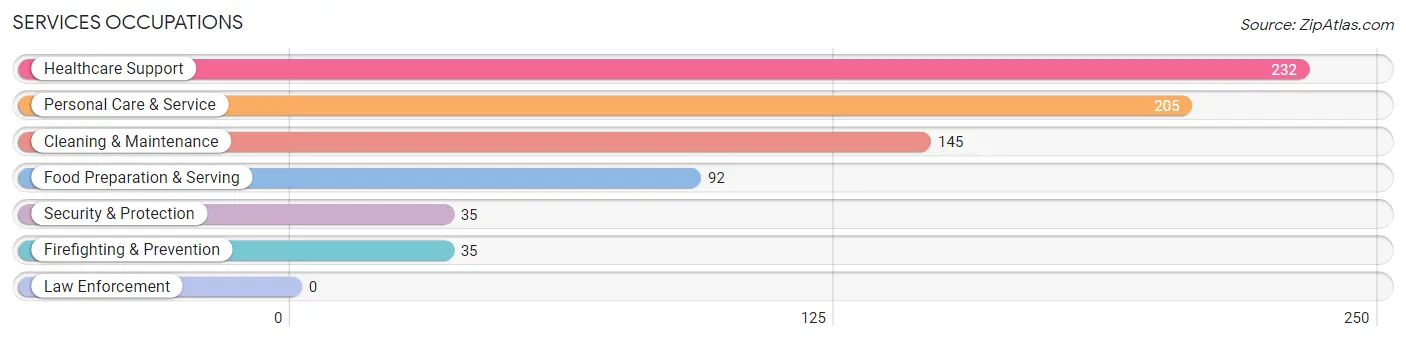
Services Occupations
The most common Services occupations in Milliken are Healthcare Support (232 | 4.7%), Personal Care & Service (205 | 4.2%), Cleaning & Maintenance (145 | 2.9%), Food Preparation & Serving (92 | 1.9%), and Security & Protection (35 | 0.7%).
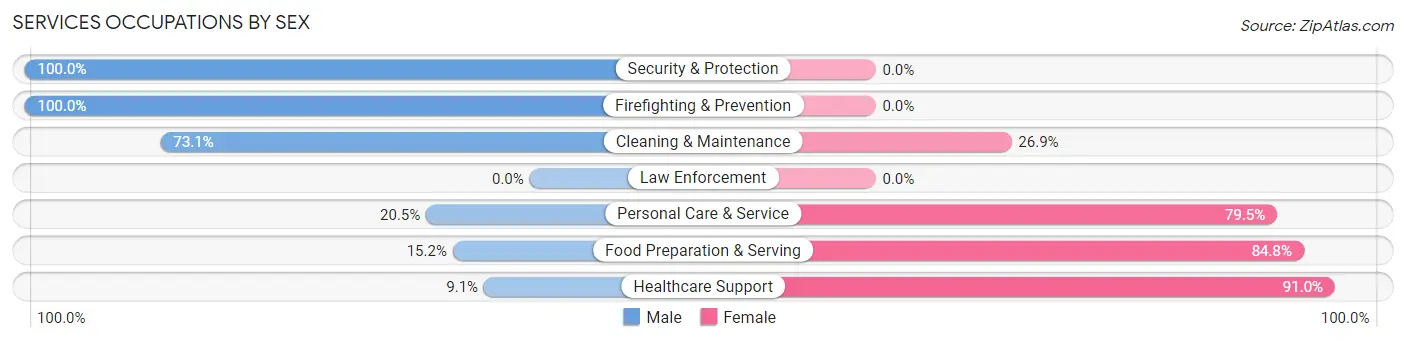
Services Occupations by Sex
Within the Services occupations in Milliken, the most male-oriented occupations are Security & Protection (100.0%), Firefighting & Prevention (100.0%), and Cleaning & Maintenance (73.1%), while the most female-oriented occupations are Healthcare Support (90.9%), Food Preparation & Serving (84.8%), and Personal Care & Service (79.5%).
| Occupation | Male | Female |
| Healthcare Support | 21 (9.0%) | 211 (90.9%) |
| Security & Protection | 35 (100.0%) | 0 (0.0%) |
| Firefighting & Prevention | 35 (100.0%) | 0 (0.0%) |
| Law Enforcement | 0 (0.0%) | 0 (0.0%) |
| Food Preparation & Serving | 14 (15.2%) | 78 (84.8%) |
| Cleaning & Maintenance | 106 (73.1%) | 39 (26.9%) |
| Personal Care & Service | 42 (20.5%) | 163 (79.5%) |
| Total (Category) | 218 (30.7%) | 491 (69.3%) |
| Total (Overall) | 2,902 (59.0%) | 2,013 (41.0%) |
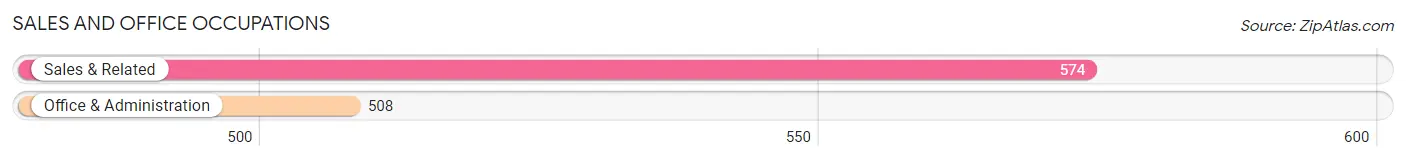
Sales and Office Occupations
The most common Sales and Office occupations in Milliken are Sales & Related (574 | 11.7%), and Office & Administration (508 | 10.3%).
Sales and Office Occupations by Sex
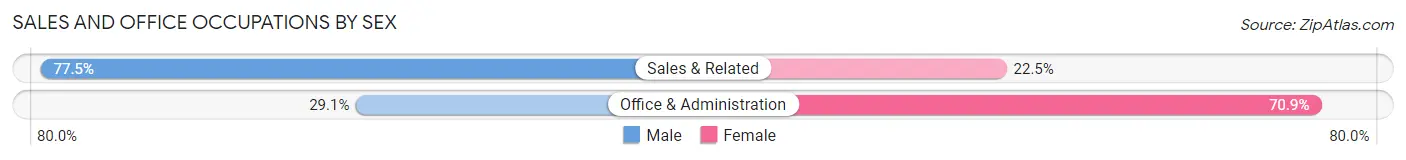
| Occupation | Male | Female |
| Sales & Related | 445 (77.5%) | 129 (22.5%) |
| Office & Administration | 148 (29.1%) | 360 (70.9%) |
| Total (Category) | 593 (54.8%) | 489 (45.2%) |
| Total (Overall) | 2,902 (59.0%) | 2,013 (41.0%) |
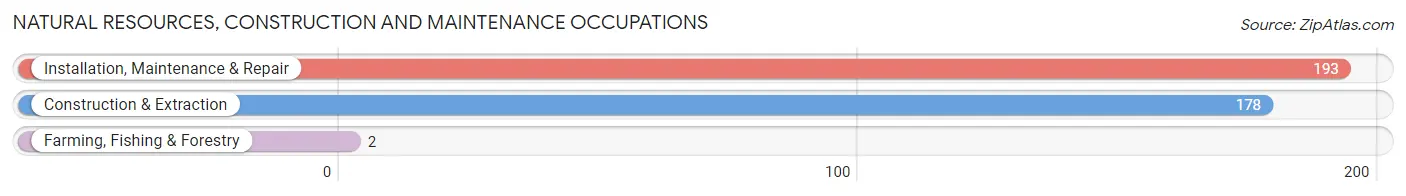
Natural Resources, Construction and Maintenance Occupations
The most common Natural Resources, Construction and Maintenance occupations in Milliken are Installation, Maintenance & Repair (193 | 3.9%), Construction & Extraction (178 | 3.6%), and Farming, Fishing & Forestry (2 | 0.0%).
Natural Resources, Construction and Maintenance Occupations by Sex
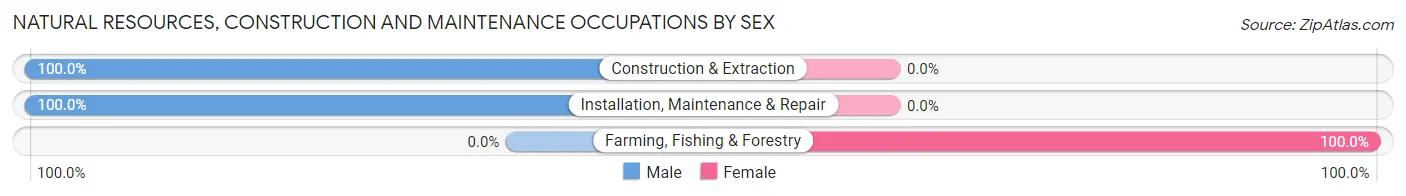
| Occupation | Male | Female |
| Farming, Fishing & Forestry | 0 (0.0%) | 2 (100.0%) |
| Construction & Extraction | 178 (100.0%) | 0 (0.0%) |
| Installation, Maintenance & Repair | 193 (100.0%) | 0 (0.0%) |
| Total (Category) | 371 (99.5%) | 2 (0.5%) |
| Total (Overall) | 2,902 (59.0%) | 2,013 (41.0%) |
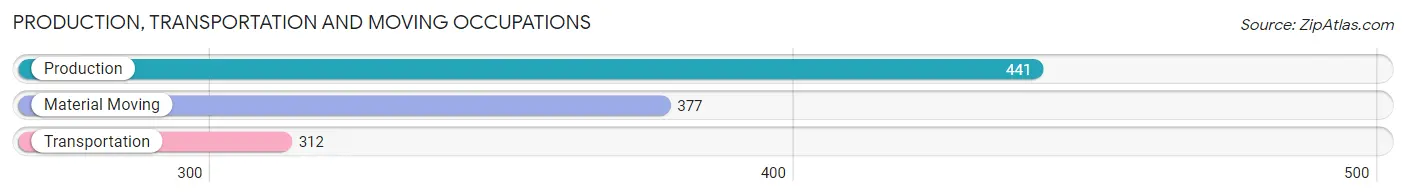
Production, Transportation and Moving Occupations
The most common Production, Transportation and Moving occupations in Milliken are Production (441 | 9.0%), Material Moving (377 | 7.7%), and Transportation (312 | 6.4%).
Production, Transportation and Moving Occupations by Sex
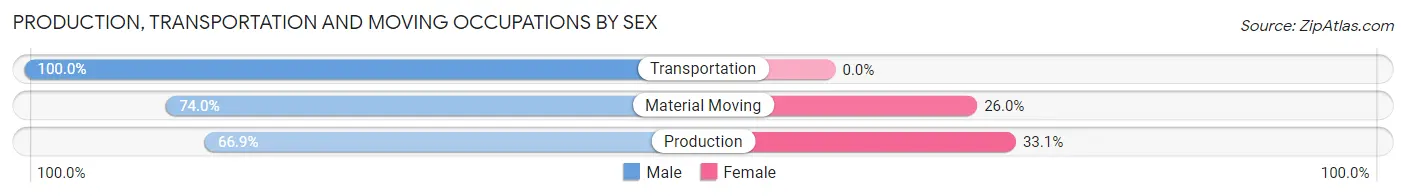
| Occupation | Male | Female |
| Production | 295 (66.9%) | 146 (33.1%) |
| Transportation | 312 (100.0%) | 0 (0.0%) |
| Material Moving | 279 (74.0%) | 98 (26.0%) |
| Total (Category) | 886 (78.4%) | 244 (21.6%) |
| Total (Overall) | 2,902 (59.0%) | 2,013 (41.0%) |
Employment Industries by Sex in Milliken
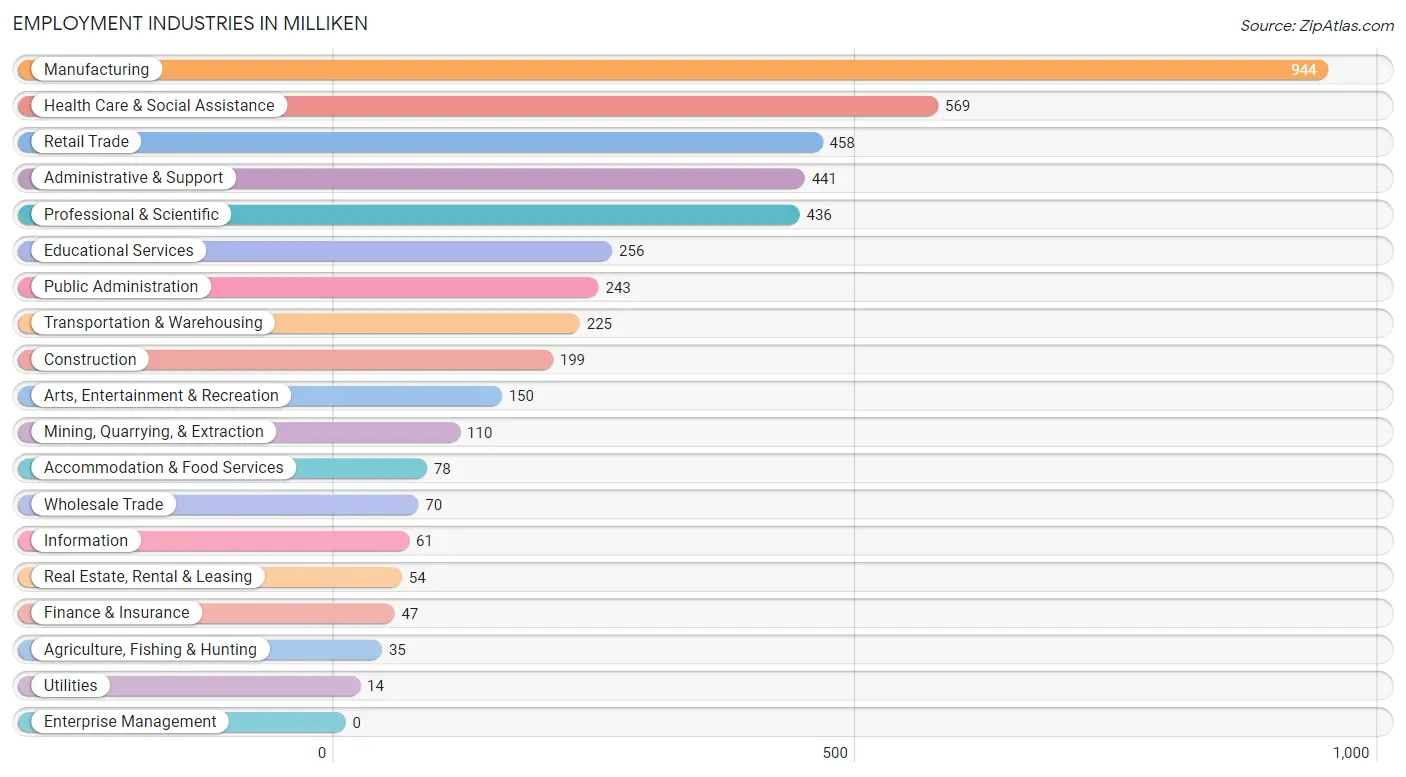
Employment Industries in Milliken
The major employment industries in Milliken include Manufacturing (944 | 19.2%), Health Care & Social Assistance (569 | 11.6%), Retail Trade (458 | 9.3%), Administrative & Support (441 | 9.0%), and Professional & Scientific (436 | 8.9%).
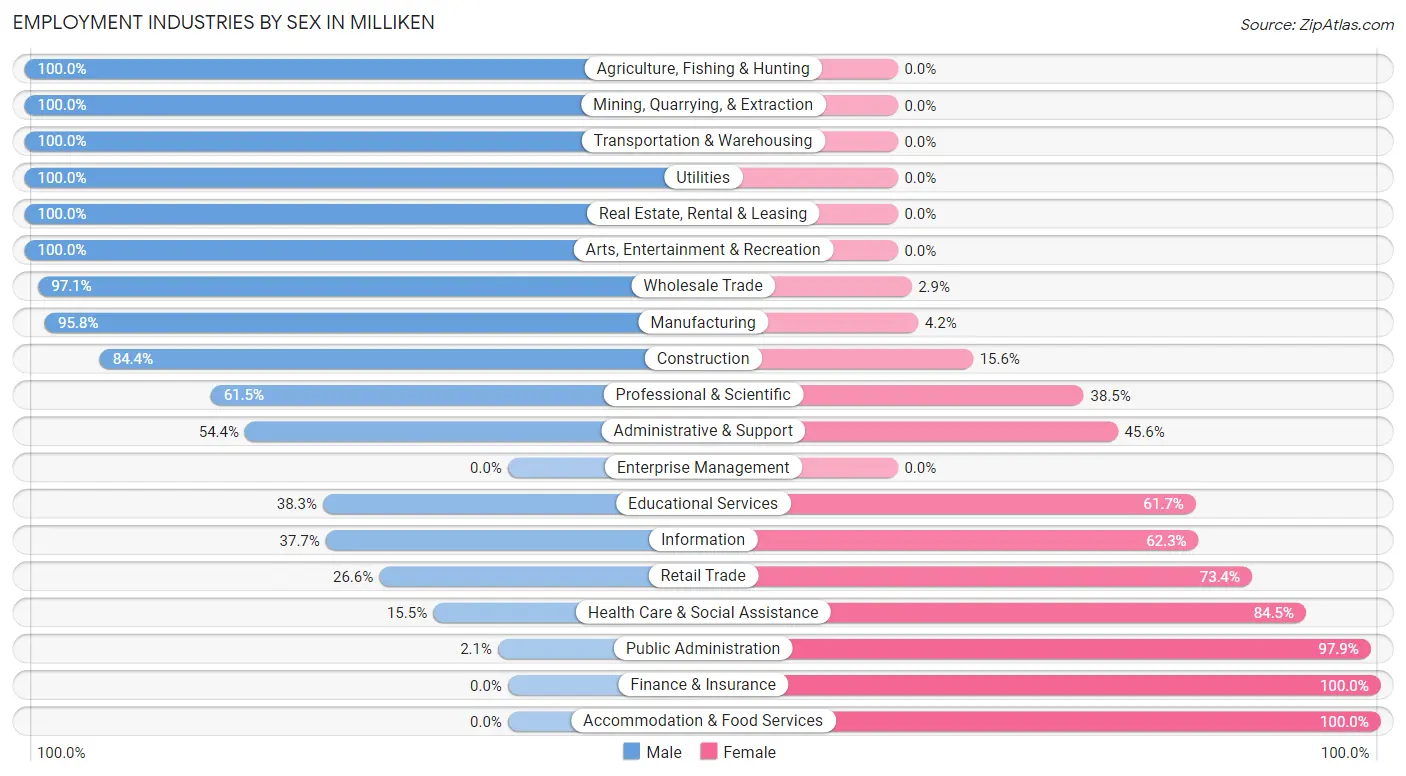
Employment Industries by Sex in Milliken
The Milliken industries that see more men than women are Agriculture, Fishing & Hunting (100.0%), Mining, Quarrying, & Extraction (100.0%), and Transportation & Warehousing (100.0%), whereas the industries that tend to have a higher number of women are Finance & Insurance (100.0%), Accommodation & Food Services (100.0%), and Public Administration (97.9%).
| Industry | Male | Female |
| Agriculture, Fishing & Hunting | 35 (100.0%) | 0 (0.0%) |
| Mining, Quarrying, & Extraction | 110 (100.0%) | 0 (0.0%) |
| Construction | 168 (84.4%) | 31 (15.6%) |
| Manufacturing | 904 (95.8%) | 40 (4.2%) |
| Wholesale Trade | 68 (97.1%) | 2 (2.9%) |
| Retail Trade | 122 (26.6%) | 336 (73.4%) |
| Transportation & Warehousing | 225 (100.0%) | 0 (0.0%) |
| Utilities | 14 (100.0%) | 0 (0.0%) |
| Information | 23 (37.7%) | 38 (62.3%) |
| Finance & Insurance | 0 (0.0%) | 47 (100.0%) |
| Real Estate, Rental & Leasing | 54 (100.0%) | 0 (0.0%) |
| Professional & Scientific | 268 (61.5%) | 168 (38.5%) |
| Enterprise Management | 0 (0.0%) | 0 (0.0%) |
| Administrative & Support | 240 (54.4%) | 201 (45.6%) |
| Educational Services | 98 (38.3%) | 158 (61.7%) |
| Health Care & Social Assistance | 88 (15.5%) | 481 (84.5%) |
| Arts, Entertainment & Recreation | 150 (100.0%) | 0 (0.0%) |
| Accommodation & Food Services | 0 (0.0%) | 78 (100.0%) |
| Public Administration | 5 (2.1%) | 238 (97.9%) |
| Total | 2,902 (59.0%) | 2,013 (41.0%) |
Education in Milliken
School Enrollment in Milliken
The most common levels of schooling among the 1,591 students in Milliken are elementary school (393 | 24.7%), middle school (346 | 21.7%), and high school (304 | 19.1%).
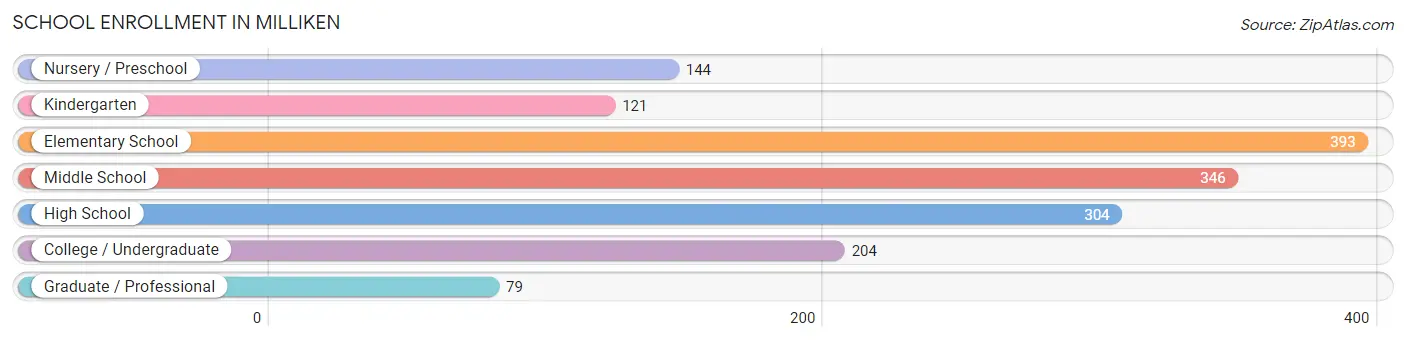
| School Level | # Students | % Students |
| Nursery / Preschool | 144 | 9.0% |
| Kindergarten | 121 | 7.6% |
| Elementary School | 393 | 24.7% |
| Middle School | 346 | 21.7% |
| High School | 304 | 19.1% |
| College / Undergraduate | 204 | 12.8% |
| Graduate / Professional | 79 | 5.0% |
| Total | 1,591 | 100.0% |
School Enrollment by Age by Funding Source in Milliken
Out of a total of 1,591 students who are enrolled in schools in Milliken, 224 (14.1%) attend a private institution, while the remaining 1,367 (85.9%) are enrolled in public schools. The age group of 25 to 34 year olds has the highest likelihood of being enrolled in private schools, with 58 (48.3% in the age bracket) enrolled. Conversely, the age group of 15 to 17 year olds has the lowest likelihood of being enrolled in a private school, with 226 (100.0% in the age bracket) attending a public institution.
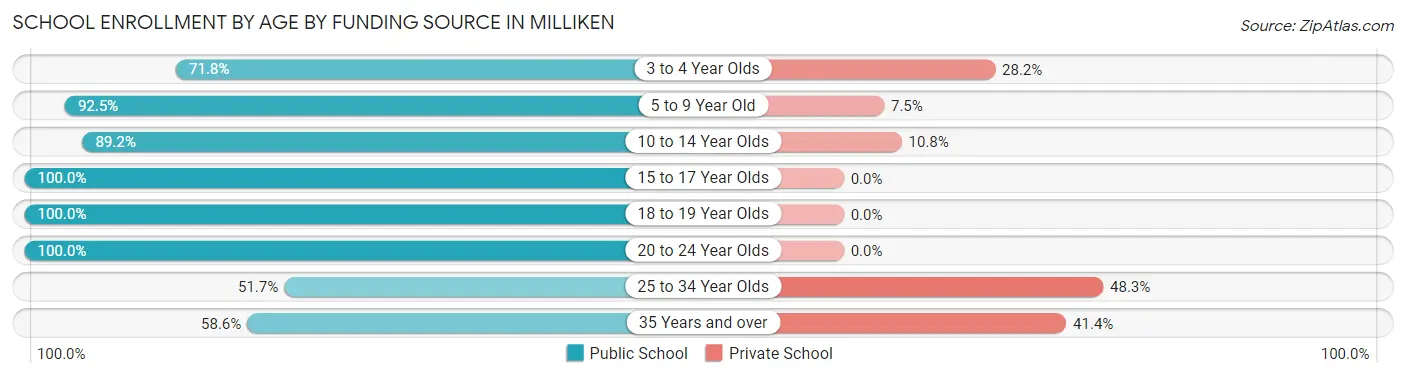
| Age Bracket | Public School | Private School |
| 3 to 4 Year Olds | 84 (71.8%) | 33 (28.2%) |
| 5 to 9 Year Old | 332 (92.5%) | 27 (7.5%) |
| 10 to 14 Year Olds | 496 (89.2%) | 60 (10.8%) |
| 15 to 17 Year Olds | 226 (100.0%) | 0 (0.0%) |
| 18 to 19 Year Olds | 76 (100.0%) | 0 (0.0%) |
| 20 to 24 Year Olds | 26 (100.0%) | 0 (0.0%) |
| 25 to 34 Year Olds | 62 (51.7%) | 58 (48.3%) |
| 35 Years and over | 65 (58.6%) | 46 (41.4%) |
| Total | 1,367 (85.9%) | 224 (14.1%) |
Educational Attainment by Field of Study in Milliken
Business (444 | 21.8%), psychology (291 | 14.3%), arts & humanities (243 | 11.9%), engineering (239 | 11.7%), and computers & mathematics (163 | 8.0%) are the most common fields of study among 2,040 individuals in Milliken who have obtained a bachelor's degree or higher.
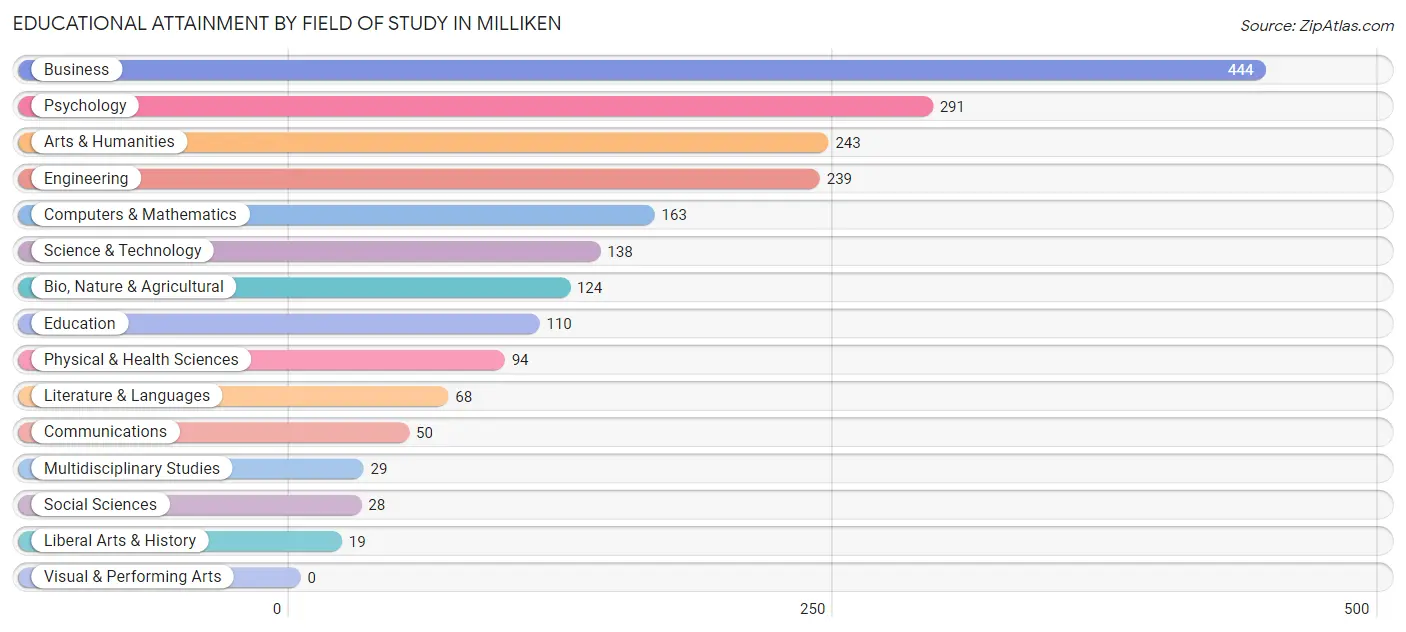
| Field of Study | # Graduates | % Graduates |
| Computers & Mathematics | 163 | 8.0% |
| Bio, Nature & Agricultural | 124 | 6.1% |
| Physical & Health Sciences | 94 | 4.6% |
| Psychology | 291 | 14.3% |
| Social Sciences | 28 | 1.4% |
| Engineering | 239 | 11.7% |
| Multidisciplinary Studies | 29 | 1.4% |
| Science & Technology | 138 | 6.8% |
| Business | 444 | 21.8% |
| Education | 110 | 5.4% |
| Literature & Languages | 68 | 3.3% |
| Liberal Arts & History | 19 | 0.9% |
| Visual & Performing Arts | 0 | 0.0% |
| Communications | 50 | 2.5% |
| Arts & Humanities | 243 | 11.9% |
| Total | 2,040 | 100.0% |
Transportation & Commute in Milliken
Vehicle Availability by Sex in Milliken
The most prevalent vehicle ownership categories in Milliken are males with 2 vehicles (1,114, accounting for 39.3%) and females with 2 vehicles (596, making up 59.0%).
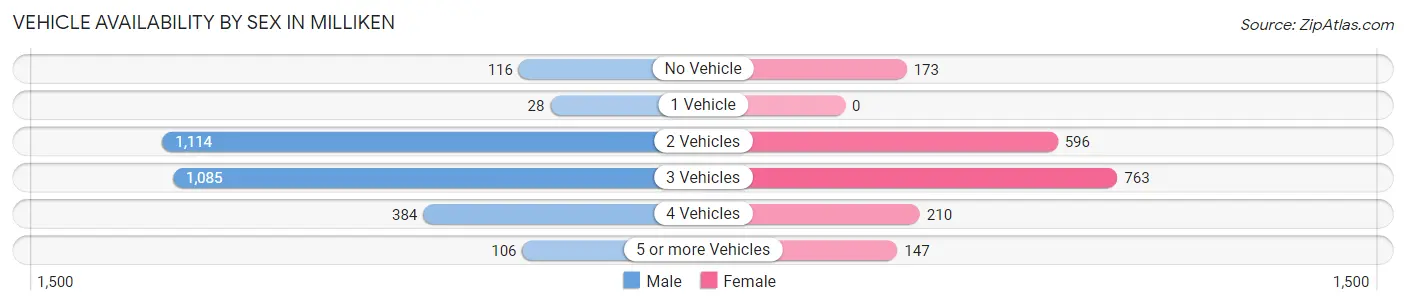
| Vehicles Available | Male | Female |
| No Vehicle | 116 (4.1%) | 173 (9.2%) |
| 1 Vehicle | 28 (1.0%) | 0 (0.0%) |
| 2 Vehicles | 1,114 (39.3%) | 596 (31.6%) |
| 3 Vehicles | 1,085 (38.3%) | 763 (40.4%) |
| 4 Vehicles | 384 (13.6%) | 210 (11.1%) |
| 5 or more Vehicles | 106 (3.7%) | 147 (7.8%) |
| Total | 2,833 (100.0%) | 1,889 (100.0%) |
Commute Time in Milliken
The most frequently occuring commute durations in Milliken are 30 to 34 minutes (1,092 commuters, 25.2%), 20 to 24 minutes (603 commuters, 13.9%), and 45 to 59 minutes (601 commuters, 13.9%).
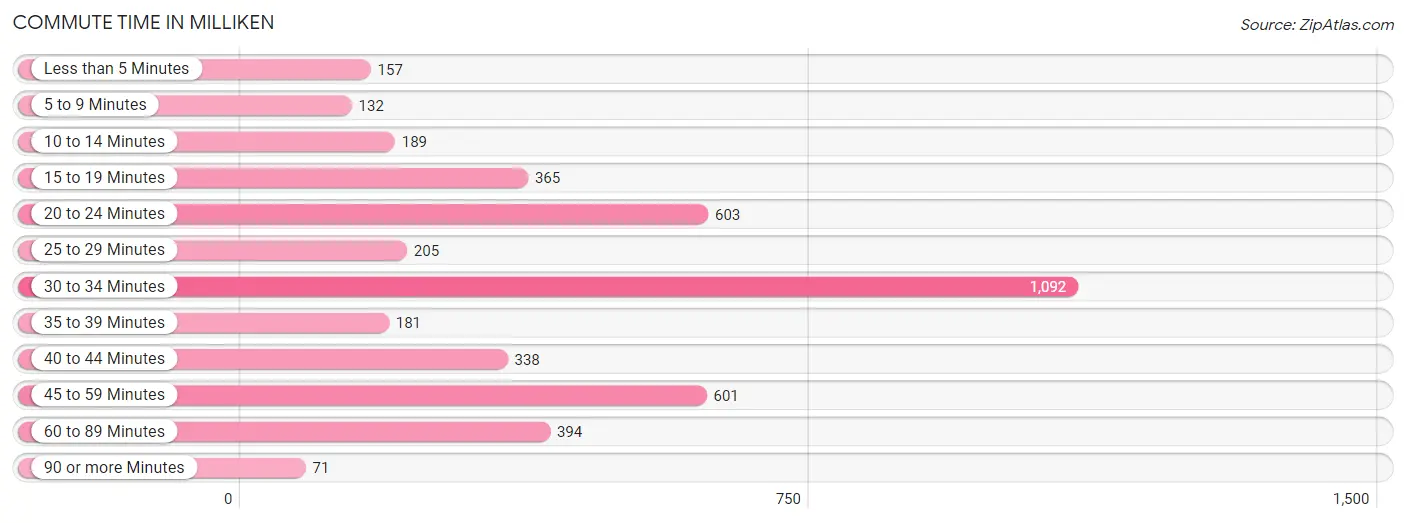
| Commute Time | # Commuters | % Commuters |
| Less than 5 Minutes | 157 | 3.6% |
| 5 to 9 Minutes | 132 | 3.0% |
| 10 to 14 Minutes | 189 | 4.4% |
| 15 to 19 Minutes | 365 | 8.4% |
| 20 to 24 Minutes | 603 | 13.9% |
| 25 to 29 Minutes | 205 | 4.7% |
| 30 to 34 Minutes | 1,092 | 25.2% |
| 35 to 39 Minutes | 181 | 4.2% |
| 40 to 44 Minutes | 338 | 7.8% |
| 45 to 59 Minutes | 601 | 13.9% |
| 60 to 89 Minutes | 394 | 9.1% |
| 90 or more Minutes | 71 | 1.6% |
Commute Time by Sex in Milliken
The most common commute times in Milliken are 30 to 34 minutes (480 commuters, 18.9%) for males and 30 to 34 minutes (612 commuters, 34.4%) for females.
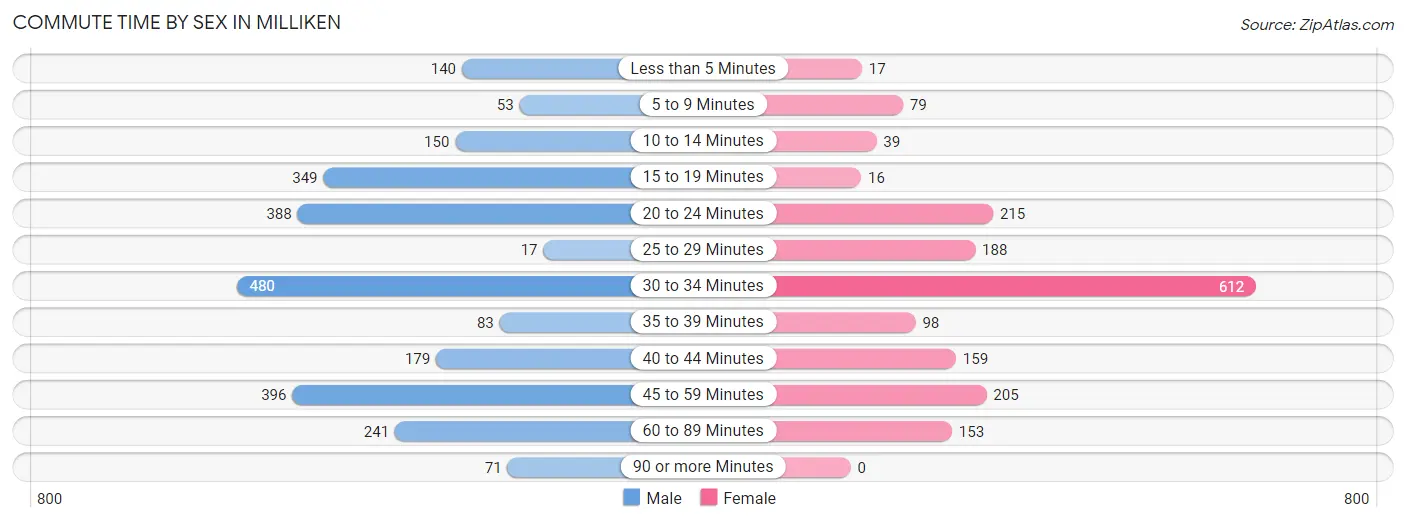
| Commute Time | Male | Female |
| Less than 5 Minutes | 140 (5.5%) | 17 (0.9%) |
| 5 to 9 Minutes | 53 (2.1%) | 79 (4.4%) |
| 10 to 14 Minutes | 150 (5.9%) | 39 (2.2%) |
| 15 to 19 Minutes | 349 (13.7%) | 16 (0.9%) |
| 20 to 24 Minutes | 388 (15.2%) | 215 (12.1%) |
| 25 to 29 Minutes | 17 (0.7%) | 188 (10.6%) |
| 30 to 34 Minutes | 480 (18.9%) | 612 (34.4%) |
| 35 to 39 Minutes | 83 (3.3%) | 98 (5.5%) |
| 40 to 44 Minutes | 179 (7.0%) | 159 (8.9%) |
| 45 to 59 Minutes | 396 (15.5%) | 205 (11.5%) |
| 60 to 89 Minutes | 241 (9.5%) | 153 (8.6%) |
| 90 or more Minutes | 71 (2.8%) | 0 (0.0%) |
Time of Departure to Work by Sex in Milliken
The most frequent times of departure to work in Milliken are 8:00 AM to 8:29 AM (563, 22.1%) for males and 7:00 AM to 7:29 AM (423, 23.7%) for females.
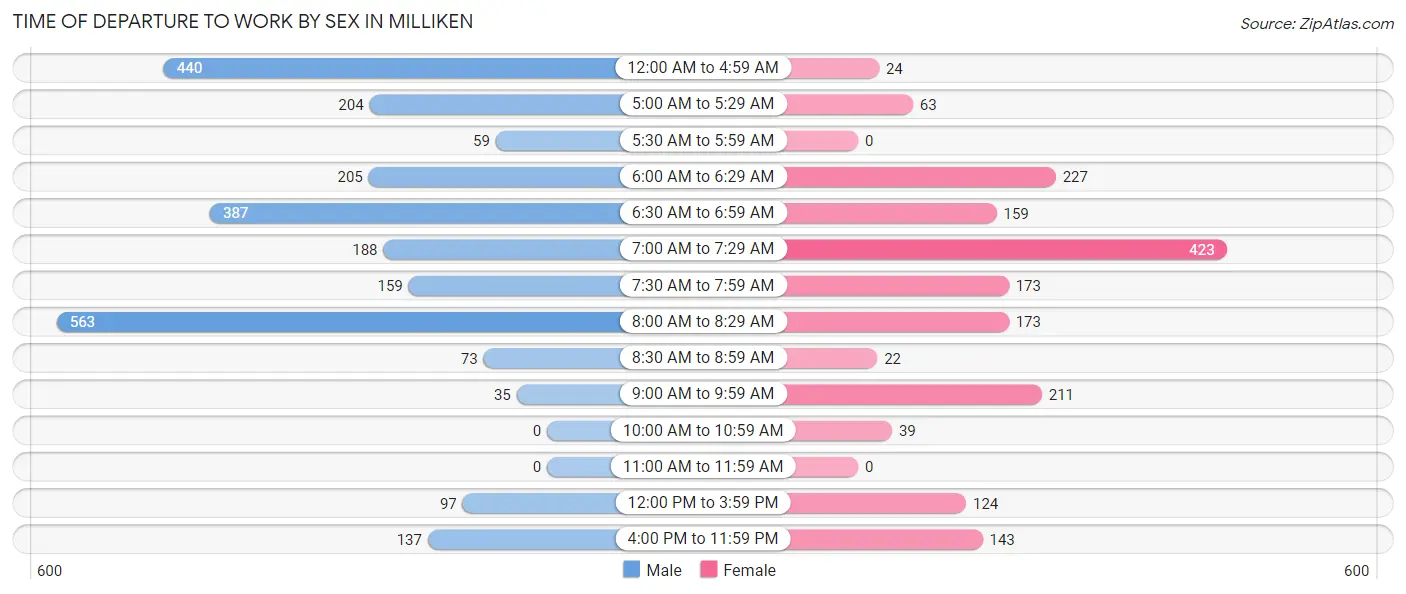
| Time of Departure | Male | Female |
| 12:00 AM to 4:59 AM | 440 (17.3%) | 24 (1.3%) |
| 5:00 AM to 5:29 AM | 204 (8.0%) | 63 (3.5%) |
| 5:30 AM to 5:59 AM | 59 (2.3%) | 0 (0.0%) |
| 6:00 AM to 6:29 AM | 205 (8.1%) | 227 (12.8%) |
| 6:30 AM to 6:59 AM | 387 (15.2%) | 159 (8.9%) |
| 7:00 AM to 7:29 AM | 188 (7.4%) | 423 (23.7%) |
| 7:30 AM to 7:59 AM | 159 (6.2%) | 173 (9.7%) |
| 8:00 AM to 8:29 AM | 563 (22.1%) | 173 (9.7%) |
| 8:30 AM to 8:59 AM | 73 (2.9%) | 22 (1.2%) |
| 9:00 AM to 9:59 AM | 35 (1.4%) | 211 (11.8%) |
| 10:00 AM to 10:59 AM | 0 (0.0%) | 39 (2.2%) |
| 11:00 AM to 11:59 AM | 0 (0.0%) | 0 (0.0%) |
| 12:00 PM to 3:59 PM | 97 (3.8%) | 124 (7.0%) |
| 4:00 PM to 11:59 PM | 137 (5.4%) | 143 (8.0%) |
| Total | 2,547 (100.0%) | 1,781 (100.0%) |
Housing Occupancy in Milliken
Occupancy by Ownership in Milliken
Of the total 3,111 dwellings in Milliken, owner-occupied units account for 2,731 (87.8%), while renter-occupied units make up 380 (12.2%).
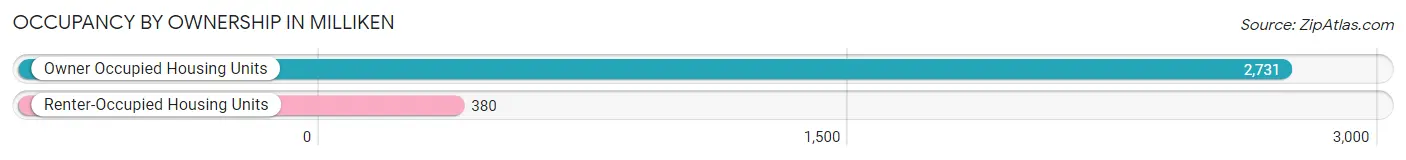
| Occupancy | # Housing Units | % Housing Units |
| Owner Occupied Housing Units | 2,731 | 87.8% |
| Renter-Occupied Housing Units | 380 | 12.2% |
| Total Occupied Housing Units | 3,111 | 100.0% |
Occupancy by Household Size in Milliken
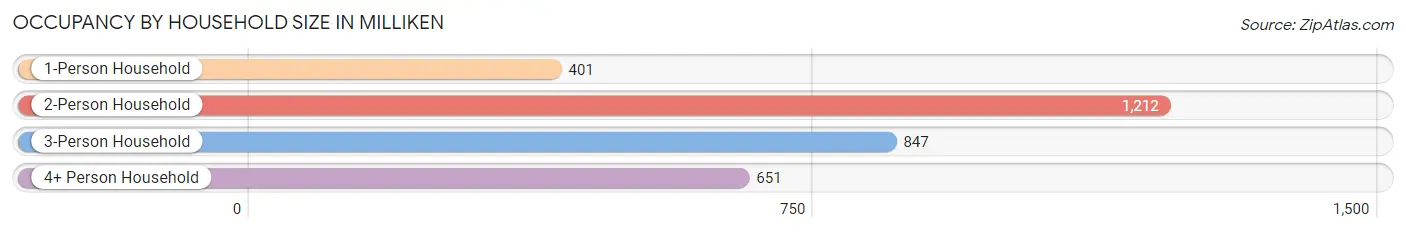
| Household Size | # Housing Units | % Housing Units |
| 1-Person Household | 401 | 12.9% |
| 2-Person Household | 1,212 | 39.0% |
| 3-Person Household | 847 | 27.2% |
| 4+ Person Household | 651 | 20.9% |
| Total Housing Units | 3,111 | 100.0% |
Occupancy by Ownership by Household Size in Milliken
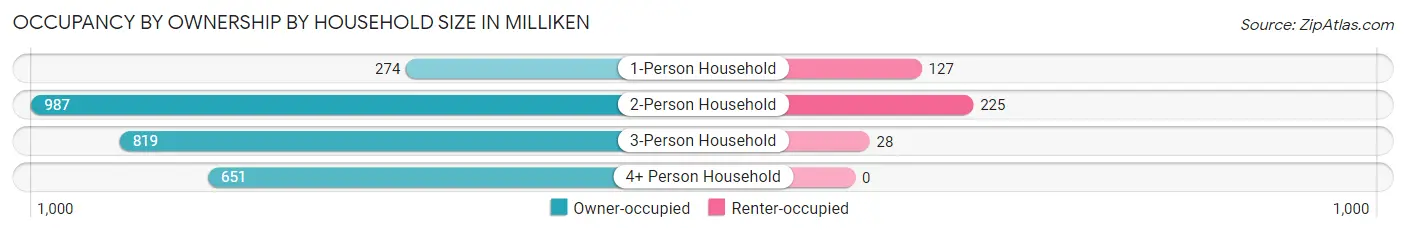
| Household Size | Owner-occupied | Renter-occupied |
| 1-Person Household | 274 (68.3%) | 127 (31.7%) |
| 2-Person Household | 987 (81.4%) | 225 (18.6%) |
| 3-Person Household | 819 (96.7%) | 28 (3.3%) |
| 4+ Person Household | 651 (100.0%) | 0 (0.0%) |
| Total Housing Units | 2,731 (87.8%) | 380 (12.2%) |
Occupancy by Educational Attainment in Milliken
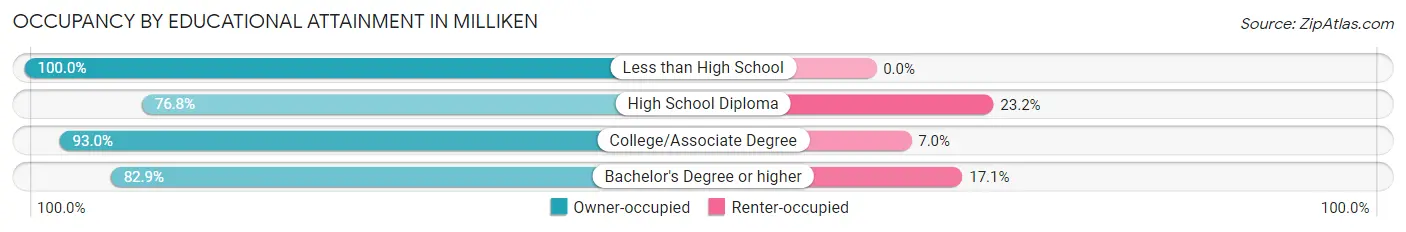
| Household Size | Owner-occupied | Renter-occupied |
| Less than High School | 302 (100.0%) | 0 (0.0%) |
| High School Diploma | 370 (76.8%) | 112 (23.2%) |
| College/Associate Degree | 1,190 (93.0%) | 89 (7.0%) |
| Bachelor's Degree or higher | 869 (82.9%) | 179 (17.1%) |
Occupancy by Age of Householder in Milliken
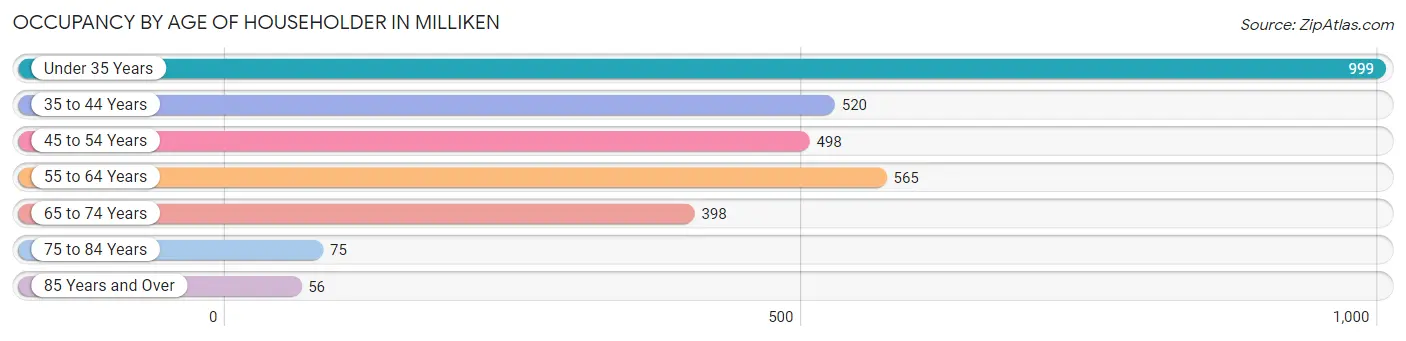
| Age Bracket | # Households | % Households |
| Under 35 Years | 999 | 32.1% |
| 35 to 44 Years | 520 | 16.7% |
| 45 to 54 Years | 498 | 16.0% |
| 55 to 64 Years | 565 | 18.2% |
| 65 to 74 Years | 398 | 12.8% |
| 75 to 84 Years | 75 | 2.4% |
| 85 Years and Over | 56 | 1.8% |
| Total | 3,111 | 100.0% |
Housing Finances in Milliken
Median Income by Occupancy in Milliken
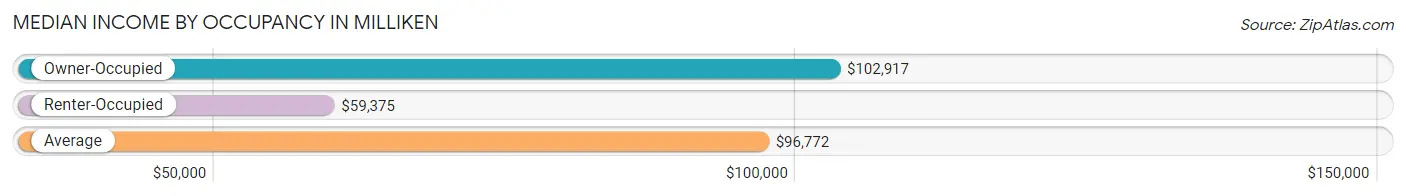
| Occupancy Type | # Households | Median Income |
| Owner-Occupied | 2,731 (87.8%) | $102,917 |
| Renter-Occupied | 380 (12.2%) | $59,375 |
| Average | 3,111 (100.0%) | $96,772 |
Occupancy by Householder Income Bracket in Milliken
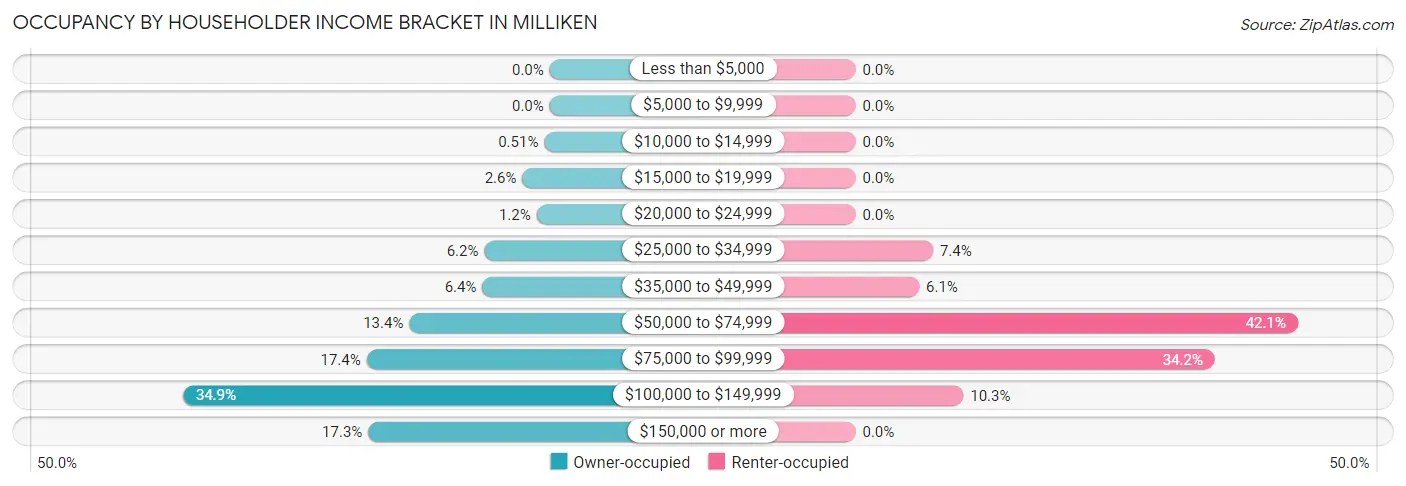
| Income Bracket | Owner-occupied | Renter-occupied |
| Less than $5,000 | 0 (0.0%) | 0 (0.0%) |
| $5,000 to $9,999 | 0 (0.0%) | 0 (0.0%) |
| $10,000 to $14,999 | 14 (0.5%) | 0 (0.0%) |
| $15,000 to $19,999 | 71 (2.6%) | 0 (0.0%) |
| $20,000 to $24,999 | 34 (1.2%) | 0 (0.0%) |
| $25,000 to $34,999 | 170 (6.2%) | 28 (7.4%) |
| $35,000 to $49,999 | 175 (6.4%) | 23 (6.0%) |
| $50,000 to $74,999 | 365 (13.4%) | 160 (42.1%) |
| $75,000 to $99,999 | 476 (17.4%) | 130 (34.2%) |
| $100,000 to $149,999 | 954 (34.9%) | 39 (10.3%) |
| $150,000 or more | 472 (17.3%) | 0 (0.0%) |
| Total | 2,731 (100.0%) | 380 (100.0%) |
Monthly Housing Cost Tiers in Milliken
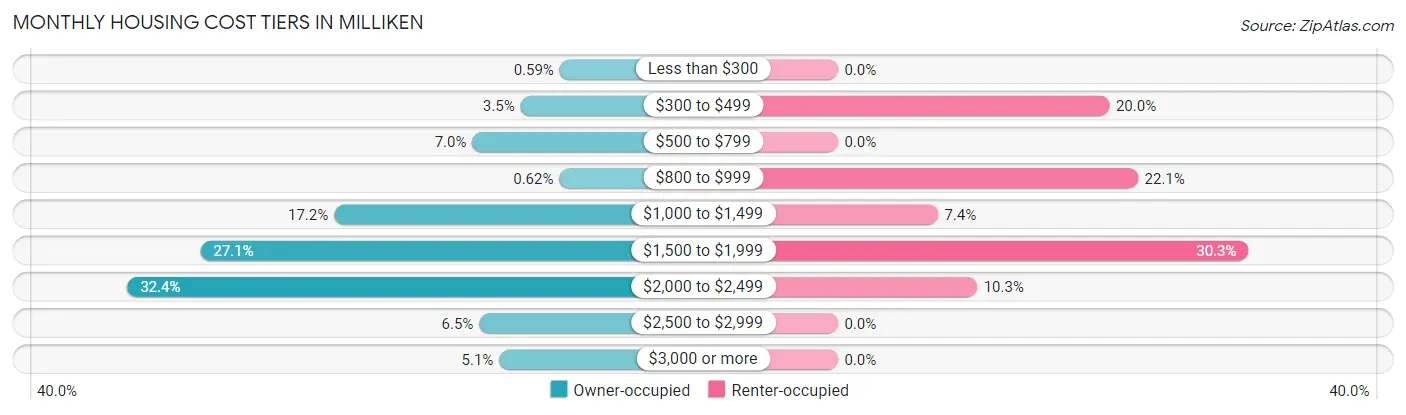
| Monthly Cost | Owner-occupied | Renter-occupied |
| Less than $300 | 16 (0.6%) | 0 (0.0%) |
| $300 to $499 | 95 (3.5%) | 76 (20.0%) |
| $500 to $799 | 192 (7.0%) | 0 (0.0%) |
| $800 to $999 | 17 (0.6%) | 84 (22.1%) |
| $1,000 to $1,499 | 470 (17.2%) | 28 (7.4%) |
| $1,500 to $1,999 | 739 (27.1%) | 115 (30.3%) |
| $2,000 to $2,499 | 886 (32.4%) | 39 (10.3%) |
| $2,500 to $2,999 | 178 (6.5%) | 0 (0.0%) |
| $3,000 or more | 138 (5.1%) | 0 (0.0%) |
| Total | 2,731 (100.0%) | 380 (100.0%) |
Physical Housing Characteristics in Milliken
Housing Structures in Milliken
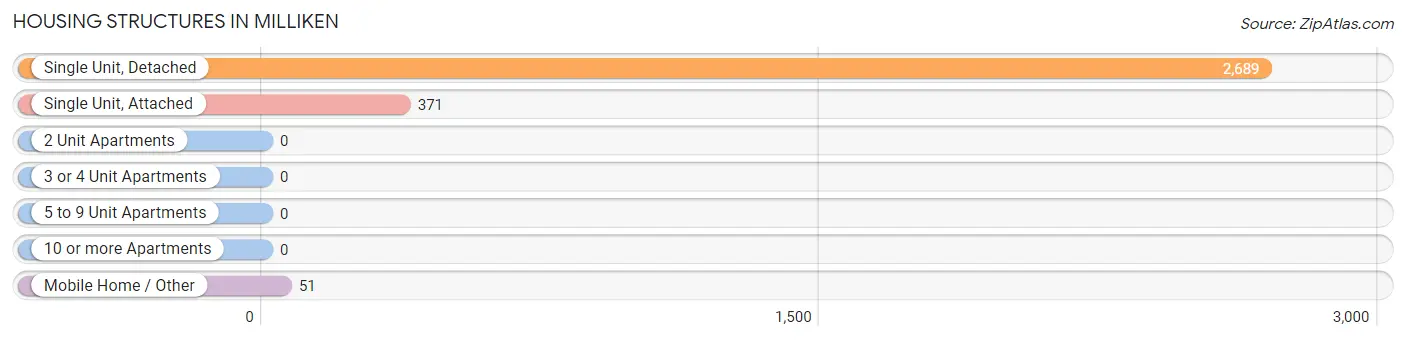
| Structure Type | # Housing Units | % Housing Units |
| Single Unit, Detached | 2,689 | 86.4% |
| Single Unit, Attached | 371 | 11.9% |
| 2 Unit Apartments | 0 | 0.0% |
| 3 or 4 Unit Apartments | 0 | 0.0% |
| 5 to 9 Unit Apartments | 0 | 0.0% |
| 10 or more Apartments | 0 | 0.0% |
| Mobile Home / Other | 51 | 1.6% |
| Total | 3,111 | 100.0% |
Housing Structures by Occupancy in Milliken
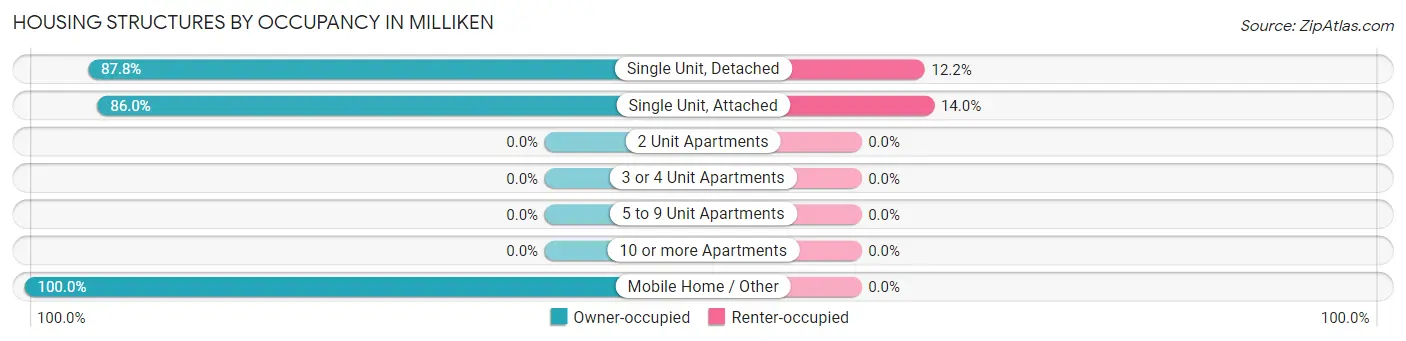
| Structure Type | Owner-occupied | Renter-occupied |
| Single Unit, Detached | 2,361 (87.8%) | 328 (12.2%) |
| Single Unit, Attached | 319 (86.0%) | 52 (14.0%) |
| 2 Unit Apartments | 0 (0.0%) | 0 (0.0%) |
| 3 or 4 Unit Apartments | 0 (0.0%) | 0 (0.0%) |
| 5 to 9 Unit Apartments | 0 (0.0%) | 0 (0.0%) |
| 10 or more Apartments | 0 (0.0%) | 0 (0.0%) |
| Mobile Home / Other | 51 (100.0%) | 0 (0.0%) |
| Total | 2,731 (87.8%) | 380 (12.2%) |
Housing Structures by Number of Rooms in Milliken
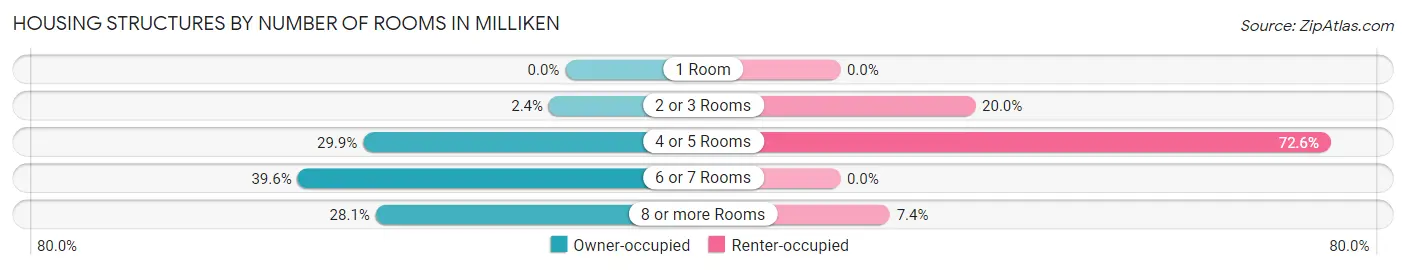
| Number of Rooms | Owner-occupied | Renter-occupied |
| 1 Room | 0 (0.0%) | 0 (0.0%) |
| 2 or 3 Rooms | 66 (2.4%) | 76 (20.0%) |
| 4 or 5 Rooms | 817 (29.9%) | 276 (72.6%) |
| 6 or 7 Rooms | 1,082 (39.6%) | 0 (0.0%) |
| 8 or more Rooms | 766 (28.1%) | 28 (7.4%) |
| Total | 2,731 (100.0%) | 380 (100.0%) |
Housing Structure by Heating Type in Milliken
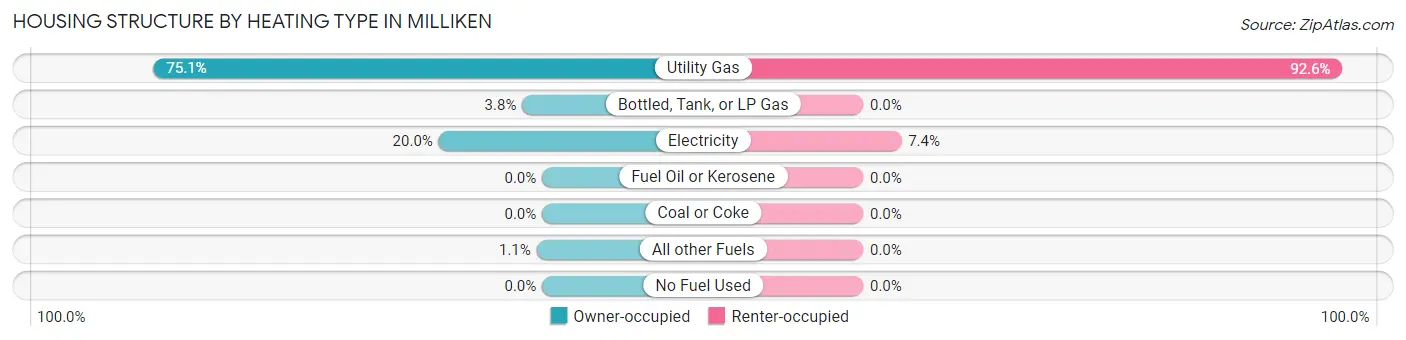
| Heating Type | Owner-occupied | Renter-occupied |
| Utility Gas | 2,051 (75.1%) | 352 (92.6%) |
| Bottled, Tank, or LP Gas | 105 (3.8%) | 0 (0.0%) |
| Electricity | 546 (20.0%) | 28 (7.4%) |
| Fuel Oil or Kerosene | 0 (0.0%) | 0 (0.0%) |
| Coal or Coke | 0 (0.0%) | 0 (0.0%) |
| All other Fuels | 29 (1.1%) | 0 (0.0%) |
| No Fuel Used | 0 (0.0%) | 0 (0.0%) |
| Total | 2,731 (100.0%) | 380 (100.0%) |
Household Vehicle Usage in Milliken
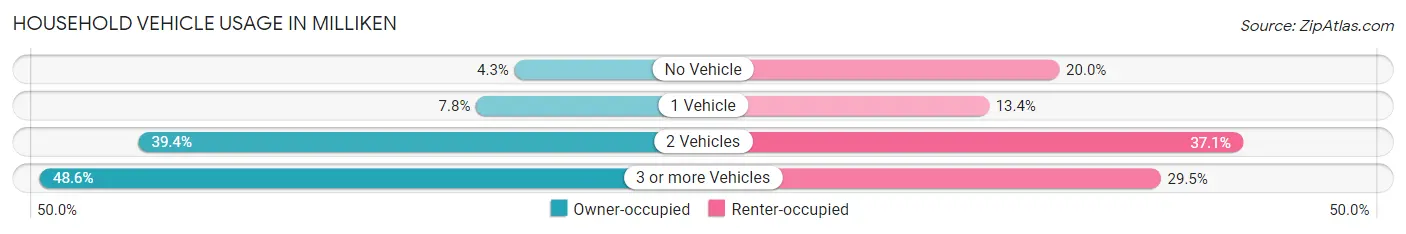
| Vehicles per Household | Owner-occupied | Renter-occupied |
| No Vehicle | 116 (4.3%) | 76 (20.0%) |
| 1 Vehicle | 214 (7.8%) | 51 (13.4%) |
| 2 Vehicles | 1,075 (39.4%) | 141 (37.1%) |
| 3 or more Vehicles | 1,326 (48.5%) | 112 (29.5%) |
| Total | 2,731 (100.0%) | 380 (100.0%) |
Real Estate & Mortgages in Milliken
Real Estate and Mortgage Overview in Milliken
| Characteristic | Without Mortgage | With Mortgage |
| Housing Units | 276 | 2,455 |
| Median Property Value | $452,000 | $380,800 |
| Median Household Income | $44,063 | $438 |
| Monthly Housing Costs | $577 | $138 |
| Real Estate Taxes | $1,825 | $19 |
Property Value by Mortgage Status in Milliken
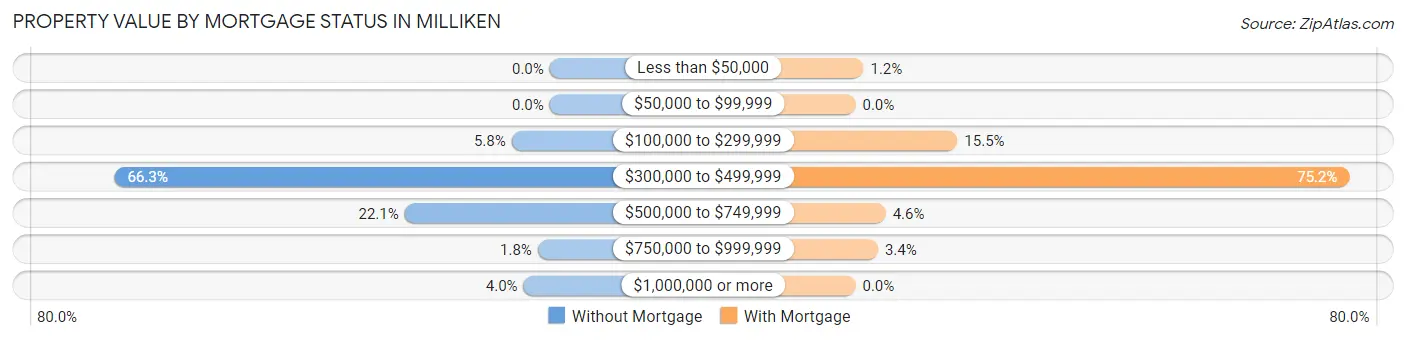
| Property Value | Without Mortgage | With Mortgage |
| Less than $50,000 | 0 (0.0%) | 30 (1.2%) |
| $50,000 to $99,999 | 0 (0.0%) | 0 (0.0%) |
| $100,000 to $299,999 | 16 (5.8%) | 381 (15.5%) |
| $300,000 to $499,999 | 183 (66.3%) | 1,847 (75.2%) |
| $500,000 to $749,999 | 61 (22.1%) | 113 (4.6%) |
| $750,000 to $999,999 | 5 (1.8%) | 84 (3.4%) |
| $1,000,000 or more | 11 (4.0%) | 0 (0.0%) |
| Total | 276 (100.0%) | 2,455 (100.0%) |
Household Income by Mortgage Status in Milliken
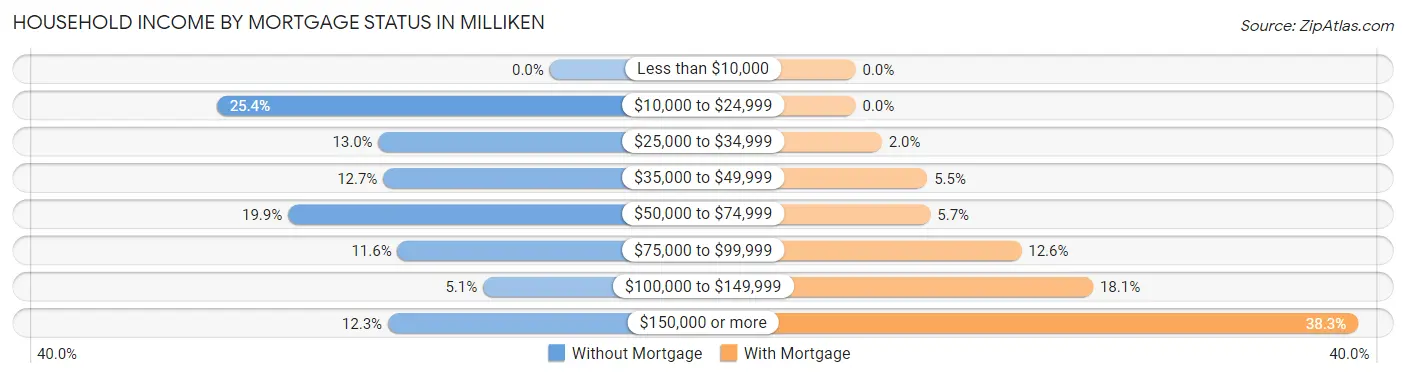
| Household Income | Without Mortgage | With Mortgage |
| Less than $10,000 | 0 (0.0%) | 0 (0.0%) |
| $10,000 to $24,999 | 70 (25.4%) | 0 (0.0%) |
| $25,000 to $34,999 | 36 (13.0%) | 49 (2.0%) |
| $35,000 to $49,999 | 35 (12.7%) | 134 (5.5%) |
| $50,000 to $74,999 | 55 (19.9%) | 140 (5.7%) |
| $75,000 to $99,999 | 32 (11.6%) | 310 (12.6%) |
| $100,000 to $149,999 | 14 (5.1%) | 444 (18.1%) |
| $150,000 or more | 34 (12.3%) | 940 (38.3%) |
| Total | 276 (100.0%) | 2,455 (100.0%) |
Property Value to Household Income Ratio in Milliken
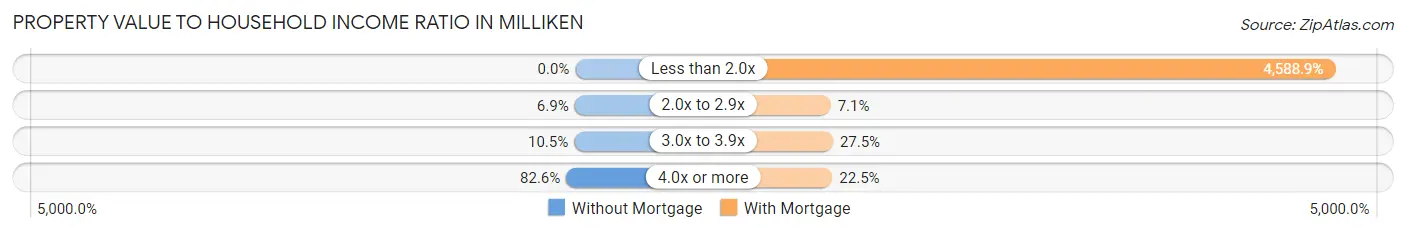
| Value-to-Income Ratio | Without Mortgage | With Mortgage |
| Less than 2.0x | 0 (0.0%) | 112,658 (4,588.9%) |
| 2.0x to 2.9x | 19 (6.9%) | 175 (7.1%) |
| 3.0x to 3.9x | 29 (10.5%) | 676 (27.5%) |
| 4.0x or more | 228 (82.6%) | 553 (22.5%) |
| Total | 276 (100.0%) | 2,455 (100.0%) |
Real Estate Taxes by Mortgage Status in Milliken
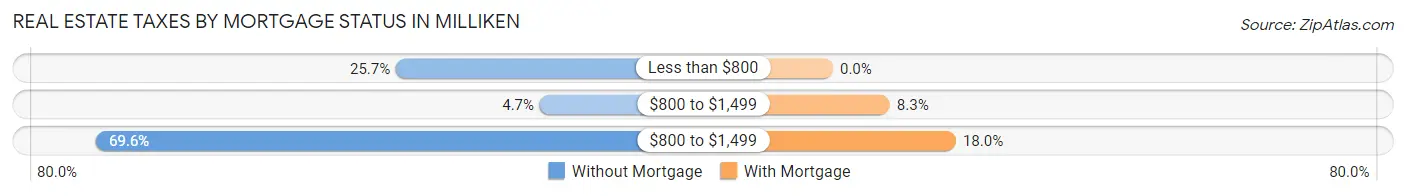
| Property Taxes | Without Mortgage | With Mortgage |
| Less than $800 | 71 (25.7%) | 0 (0.0%) |
| $800 to $1,499 | 13 (4.7%) | 204 (8.3%) |
| $800 to $1,499 | 192 (69.6%) | 441 (18.0%) |
| Total | 276 (100.0%) | 2,455 (100.0%) |
Health & Disability in Milliken
Health Insurance Coverage by Age in Milliken
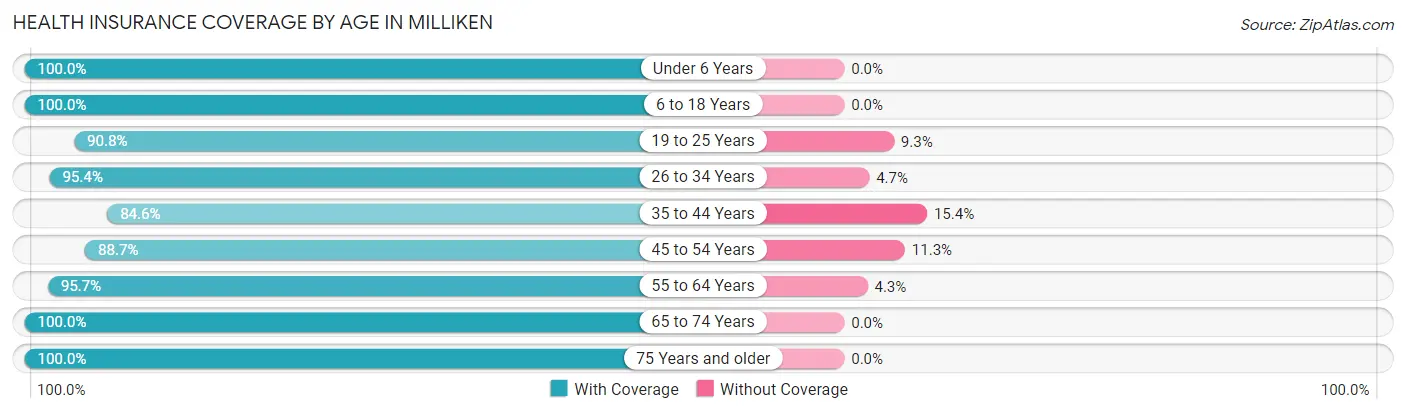
| Age Bracket | With Coverage | Without Coverage |
| Under 6 Years | 898 (100.0%) | 0 (0.0%) |
| 6 to 18 Years | 1,095 (100.0%) | 0 (0.0%) |
| 19 to 25 Years | 461 (90.7%) | 47 (9.2%) |
| 26 to 34 Years | 2,176 (95.4%) | 106 (4.6%) |
| 35 to 44 Years | 861 (84.6%) | 157 (15.4%) |
| 45 to 54 Years | 769 (88.7%) | 98 (11.3%) |
| 55 to 64 Years | 949 (95.7%) | 43 (4.3%) |
| 65 to 74 Years | 600 (100.0%) | 0 (0.0%) |
| 75 Years and older | 178 (100.0%) | 0 (0.0%) |
| Total | 7,987 (94.7%) | 451 (5.3%) |
Health Insurance Coverage by Citizenship Status in Milliken
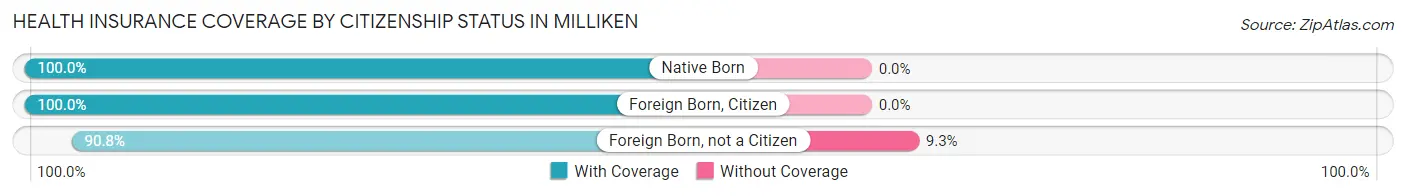
| Citizenship Status | With Coverage | Without Coverage |
| Native Born | 898 (100.0%) | 0 (0.0%) |
| Foreign Born, Citizen | 1,095 (100.0%) | 0 (0.0%) |
| Foreign Born, not a Citizen | 461 (90.7%) | 47 (9.2%) |
Health Insurance Coverage by Household Income in Milliken
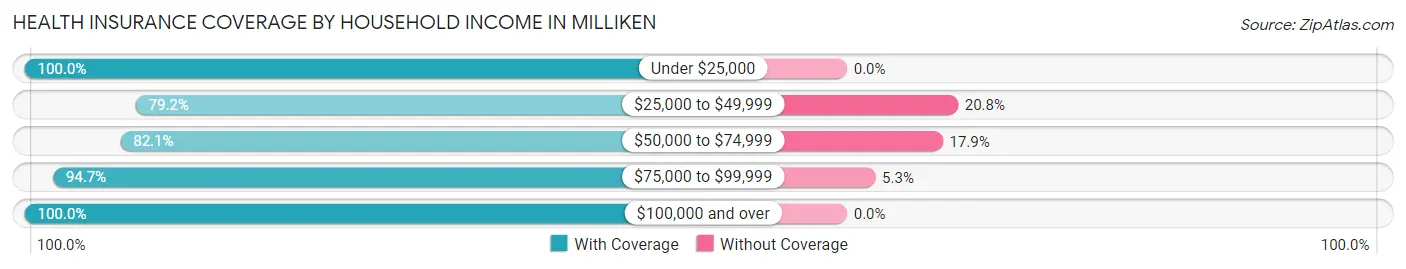
| Household Income | With Coverage | Without Coverage |
| Under $25,000 | 207 (100.0%) | 0 (0.0%) |
| $25,000 to $49,999 | 632 (79.2%) | 166 (20.8%) |
| $50,000 to $74,999 | 933 (82.1%) | 204 (17.9%) |
| $75,000 to $99,999 | 1,445 (94.7%) | 81 (5.3%) |
| $100,000 and over | 4,770 (100.0%) | 0 (0.0%) |
Public vs Private Health Insurance Coverage by Age in Milliken
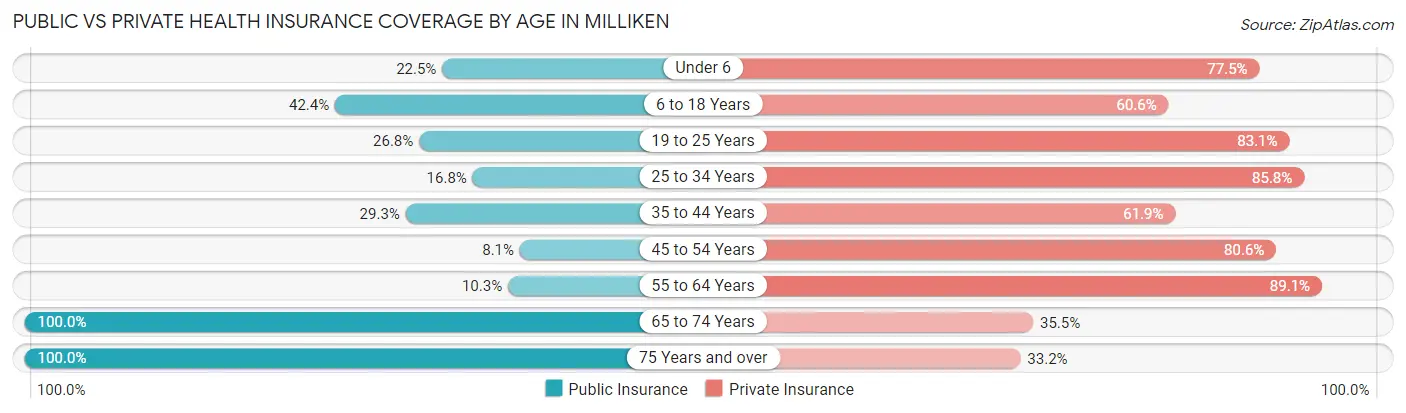
| Age Bracket | Public Insurance | Private Insurance |
| Under 6 | 202 (22.5%) | 696 (77.5%) |
| 6 to 18 Years | 464 (42.4%) | 664 (60.6%) |
| 19 to 25 Years | 136 (26.8%) | 422 (83.1%) |
| 25 to 34 Years | 384 (16.8%) | 1,958 (85.8%) |
| 35 to 44 Years | 298 (29.3%) | 630 (61.9%) |
| 45 to 54 Years | 70 (8.1%) | 699 (80.6%) |
| 55 to 64 Years | 102 (10.3%) | 884 (89.1%) |
| 65 to 74 Years | 600 (100.0%) | 213 (35.5%) |
| 75 Years and over | 178 (100.0%) | 59 (33.2%) |
| Total | 2,434 (28.8%) | 6,225 (73.8%) |
Disability Status by Sex by Age in Milliken
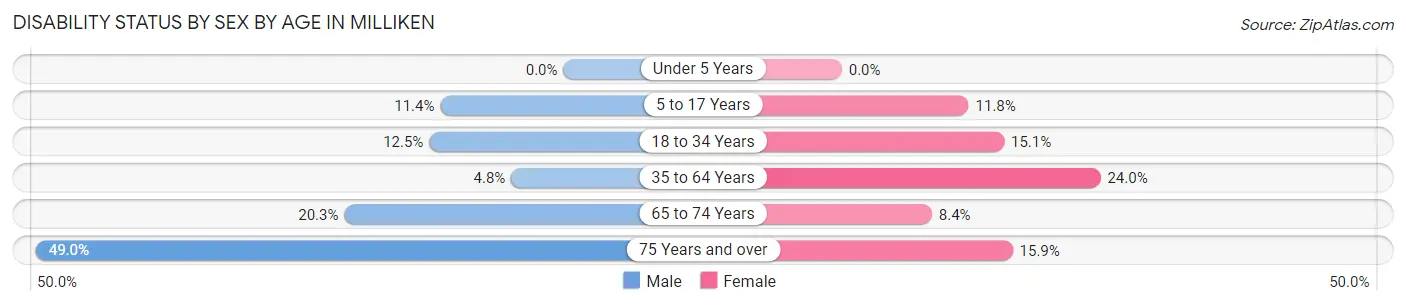
| Age Bracket | Male | Female |
| Under 5 Years | 0 (0.0%) | 0 (0.0%) |
| 5 to 17 Years | 65 (11.4%) | 71 (11.8%) |
| 18 to 34 Years | 204 (12.4%) | 181 (15.1%) |
| 35 to 64 Years | 76 (4.8%) | 314 (24.0%) |
| 65 to 74 Years | 49 (20.3%) | 30 (8.4%) |
| 75 Years and over | 47 (49.0%) | 13 (15.9%) |
Disability Class by Sex by Age in Milliken
Disability Class: Hearing Difficulty
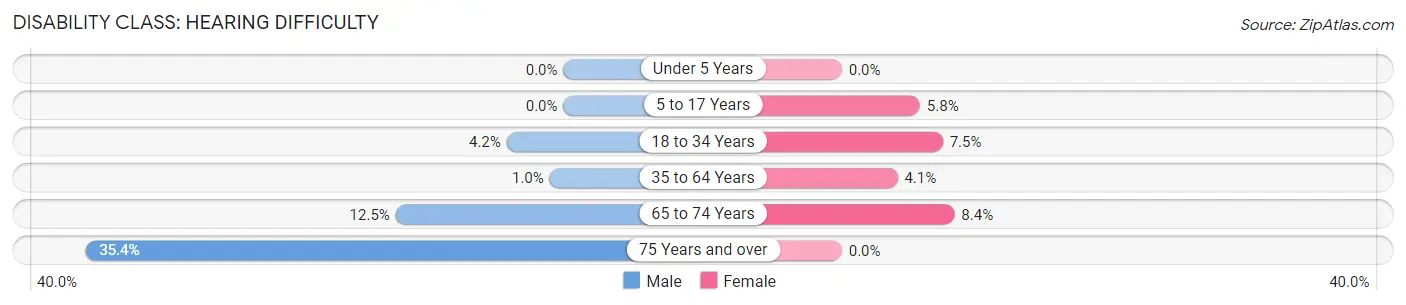
| Age Bracket | Male | Female |
| Under 5 Years | 0 (0.0%) | 0 (0.0%) |
| 5 to 17 Years | 0 (0.0%) | 35 (5.8%) |
| 18 to 34 Years | 69 (4.2%) | 90 (7.5%) |
| 35 to 64 Years | 16 (1.0%) | 54 (4.1%) |
| 65 to 74 Years | 30 (12.4%) | 30 (8.4%) |
| 75 Years and over | 34 (35.4%) | 0 (0.0%) |
Disability Class: Vision Difficulty
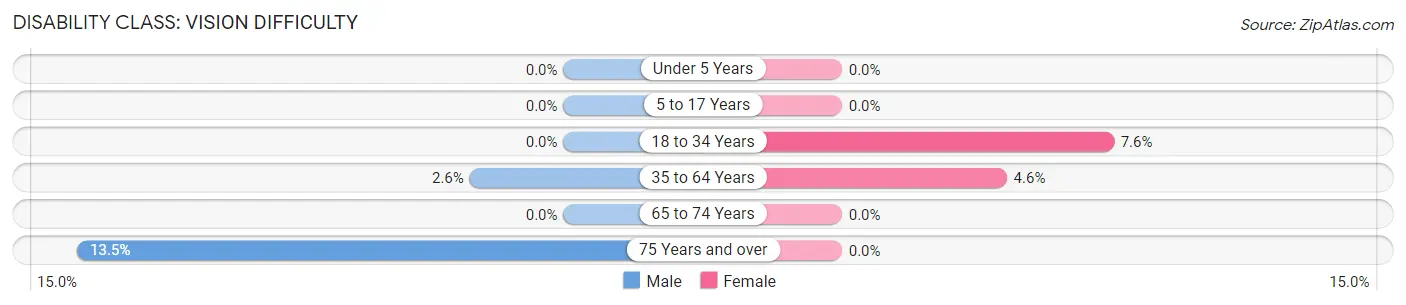
| Age Bracket | Male | Female |
| Under 5 Years | 0 (0.0%) | 0 (0.0%) |
| 5 to 17 Years | 0 (0.0%) | 0 (0.0%) |
| 18 to 34 Years | 0 (0.0%) | 91 (7.6%) |
| 35 to 64 Years | 41 (2.6%) | 60 (4.6%) |
| 65 to 74 Years | 0 (0.0%) | 0 (0.0%) |
| 75 Years and over | 13 (13.5%) | 0 (0.0%) |
Disability Class: Cognitive Difficulty
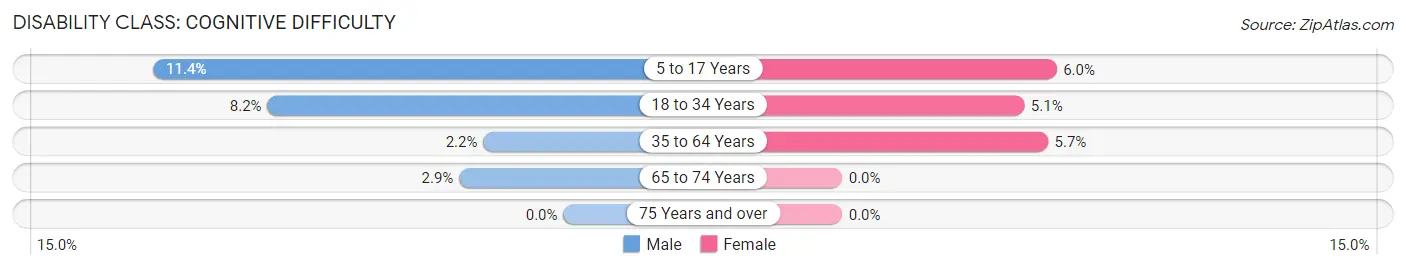
| Age Bracket | Male | Female |
| 5 to 17 Years | 65 (11.4%) | 36 (6.0%) |
| 18 to 34 Years | 135 (8.2%) | 61 (5.1%) |
| 35 to 64 Years | 35 (2.2%) | 75 (5.7%) |
| 65 to 74 Years | 7 (2.9%) | 0 (0.0%) |
| 75 Years and over | 0 (0.0%) | 0 (0.0%) |
Disability Class: Ambulatory Difficulty
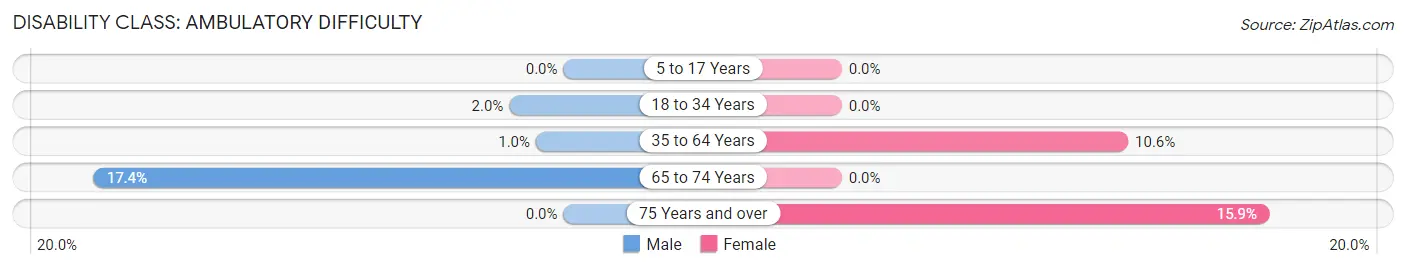
| Age Bracket | Male | Female |
| 5 to 17 Years | 0 (0.0%) | 0 (0.0%) |
| 18 to 34 Years | 33 (2.0%) | 0 (0.0%) |
| 35 to 64 Years | 16 (1.0%) | 139 (10.6%) |
| 65 to 74 Years | 42 (17.4%) | 0 (0.0%) |
| 75 Years and over | 0 (0.0%) | 13 (15.9%) |
Disability Class: Self-Care Difficulty
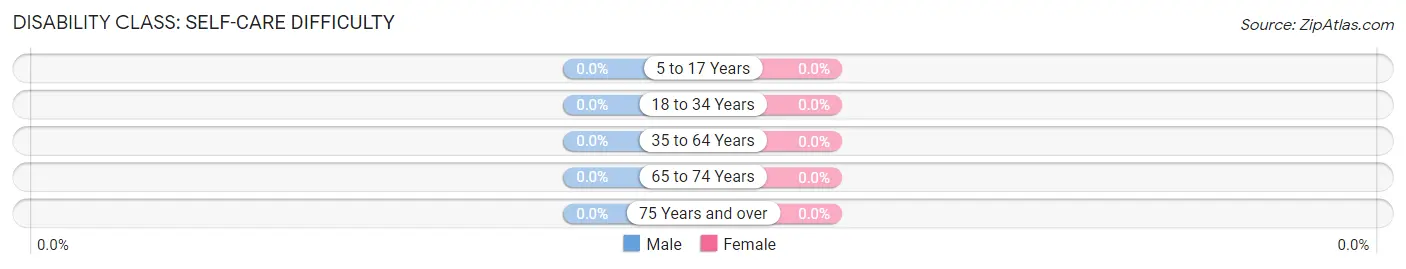
| Age Bracket | Male | Female |
| 5 to 17 Years | 0 (0.0%) | 0 (0.0%) |
| 18 to 34 Years | 0 (0.0%) | 0 (0.0%) |
| 35 to 64 Years | 0 (0.0%) | 0 (0.0%) |
| 65 to 74 Years | 0 (0.0%) | 0 (0.0%) |
| 75 Years and over | 0 (0.0%) | 0 (0.0%) |
Technology Access in Milliken
Computing Device Access in Milliken
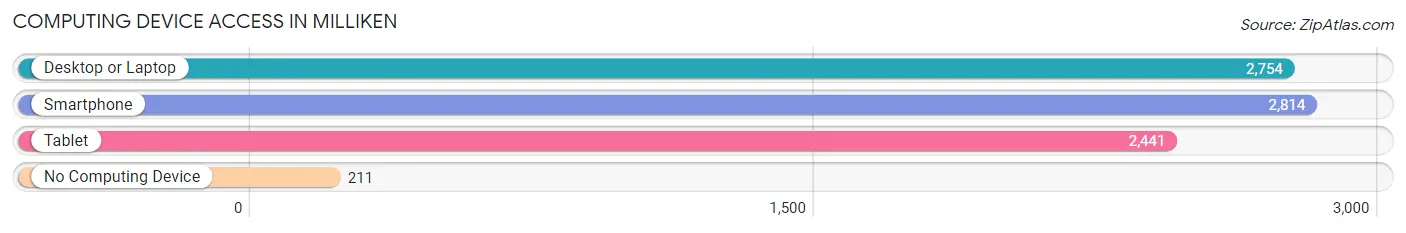
| Device Type | # Households | % Households |
| Desktop or Laptop | 2,754 | 88.5% |
| Smartphone | 2,814 | 90.4% |
| Tablet | 2,441 | 78.5% |
| No Computing Device | 211 | 6.8% |
| Total | 3,111 | 100.0% |
Internet Access in Milliken
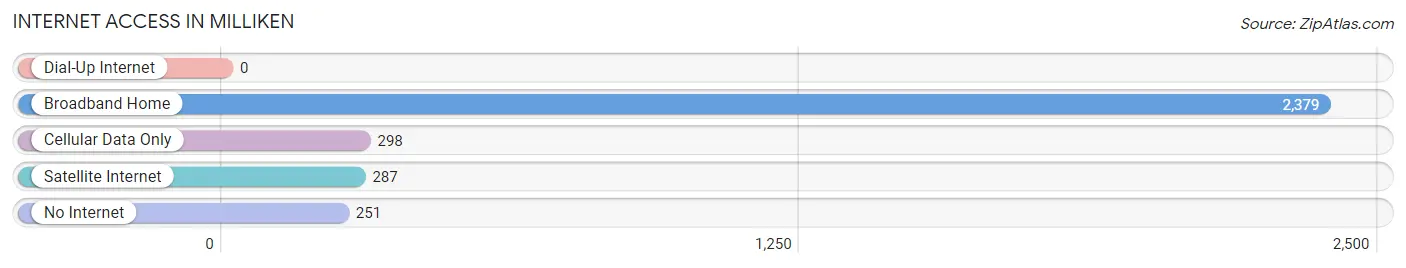
| Internet Type | # Households | % Households |
| Dial-Up Internet | 0 | 0.0% |
| Broadband Home | 2,379 | 76.5% |
| Cellular Data Only | 298 | 9.6% |
| Satellite Internet | 287 | 9.2% |
| No Internet | 251 | 8.1% |
| Total | 3,111 | 100.0% |
Milliken Summary
Milliken, Colorado is a small town located in Weld County, Colorado. It is situated in the northern part of the state, about 30 miles northeast of Denver. The town was founded in 1881 and was named after the first postmaster, William Milliken. The population of Milliken was estimated to be 5,845 in 2019.
Geography
Milliken is located in the northern part of Weld County, Colorado. It is situated in the South Platte River Valley, between the Front Range of the Rocky Mountains and the High Plains. The town is located at an elevation of 4,845 feet above sea level. The town is surrounded by agricultural land, with the South Platte River running through the center of town.
Climate
Milliken has a semi-arid climate, with hot summers and cold winters. The average high temperature in the summer is around 90°F, while the average low temperature in the winter is around 20°F. The town receives an average of 16 inches of precipitation per year, with most of it falling in the spring and summer months.
Economy
Milliken’s economy is largely based on agriculture and manufacturing. The town is home to several large agricultural operations, including a large dairy farm and a large vegetable farm. The town is also home to several manufacturing companies, including a plastics manufacturer and a metal fabrication company.
Demographics
As of the 2019 census, the population of Milliken was estimated to be 5,845. The racial makeup of the town was 91.2% White, 0.7% African American, 0.3% Native American, 0.7% Asian, 0.1% Pacific Islander, 4.3% from other races, and 2.1% from two or more races. Hispanic or Latino of any race were 11.2% of the population.
The median household income in Milliken was $60,938 in 2019. The median home value was $269,400. The median age of the population was 36.7 years.
Education
Milliken is served by the Weld County School District. The town is home to two elementary schools, one middle school, and one high school. The town also has a public library and a community college.
Conclusion
Milliken, Colorado is a small town located in Weld County, Colorado. It is situated in the northern part of the state, about 30 miles northeast of Denver. The town was founded in 1881 and was named after the first postmaster, William Milliken. The population of Milliken was estimated to be 5,845 in 2019. The town’s economy is largely based on agriculture and manufacturing, and the town is served by the Weld County School District. Milliken has a semi-arid climate, with hot summers and cold winters. The median household income in Milliken was $60,938 in 2019.
Common Questions
What is Per Capita Income in Milliken?
Per Capita income in Milliken is $41,822.
What is the Median Family Income in Milliken?
Median Family Income in Milliken is $98,750.
What is the Median Household income in Milliken?
Median Household Income in Milliken is $96,772.
What is Income or Wage Gap in Milliken?
Income or Wage Gap in Milliken is 39.9%.
Women in Milliken earn 60.1 cents for every dollar earned by a man.
What is Inequality or Gini Index in Milliken?
Inequality or Gini Index in Milliken is 0.36.
What is the Total Population of Milliken?
Total Population of Milliken is 8,438.
What is the Total Male Population of Milliken?
Total Male Population of Milliken is 4,412.
What is the Total Female Population of Milliken?
Total Female Population of Milliken is 4,026.
What is the Ratio of Males per 100 Females in Milliken?
There are 109.59 Males per 100 Females in Milliken.
What is the Ratio of Females per 100 Males in Milliken?
There are 91.25 Females per 100 Males in Milliken.
What is the Median Population Age in Milliken?
Median Population Age in Milliken is 33.3 Years.
What is the Average Family Size in Milliken
Average Family Size in Milliken is 3.0 People.
What is the Average Household Size in Milliken
Average Household Size in Milliken is 2.7 People.
How Large is the Labor Force in Milliken?
There are 5,066 People in the Labor Forcein in Milliken.
What is the Percentage of People in the Labor Force in Milliken?
76.1% of People are in the Labor Force in Milliken.
What is the Unemployment Rate in Milliken?
Unemployment Rate in Milliken is 2.9%.