Mancos, CO Map & Demographics
Mancos Map
Mancos Overview
$34,914
PER CAPITA INCOME
$84,545
AVG FAMILY INCOME
$63,185
AVG HOUSEHOLD INCOME
32.6%
WAGE / INCOME GAP [ % ]
67.4¢/ $1
WAGE / INCOME GAP [ $ ]
0.39
INEQUALITY / GINI INDEX
1,121
TOTAL POPULATION
532
MALE POPULATION
589
FEMALE POPULATION
90.32
MALES / 100 FEMALES
110.71
FEMALES / 100 MALES
46.5
MEDIAN AGE
2.8
AVG FAMILY SIZE
2.1
AVG HOUSEHOLD SIZE
589
LABOR FORCE [ PEOPLE ]
62.0%
PERCENT IN LABOR FORCE
1.5%
UNEMPLOYMENT RATE
Mancos Zip Codes
Mancos Area Codes
Income in Mancos
Income Overview in Mancos
Per Capita Income in Mancos is $34,914, while median incomes of families and households are $84,545 and $63,185 respectively.
| Characteristic | Number | Measure |
| Per Capita Income | 1,121 | $34,914 |
| Median Family Income | 284 | $84,545 |
| Mean Family Income | 284 | $102,307 |
| Median Household Income | 495 | $63,185 |
| Mean Household Income | 495 | $76,973 |
| Income Deficit | 284 | $0 |
| Wage / Income Gap (%) | 1,121 | 32.60% |
| Wage / Income Gap ($) | 1,121 | 67.40¢ per $1 |
| Gini / Inequality Index | 1,121 | 0.39 |
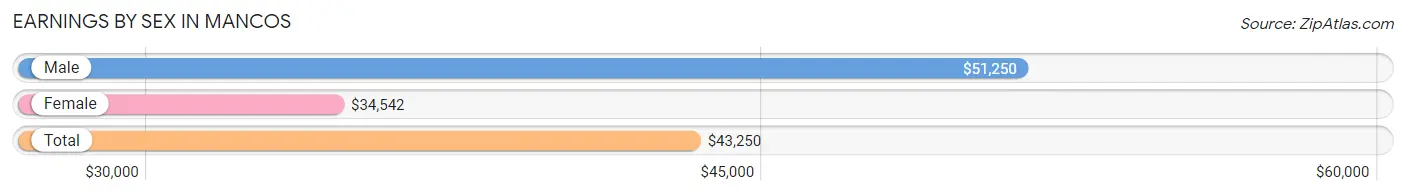
Earnings by Sex in Mancos
Average Earnings in Mancos are $43,250, $51,250 for men and $34,542 for women, a difference of 32.6%.
| Sex | Number | Average Earnings |
| Male | 323 (50.5%) | $51,250 |
| Female | 317 (49.5%) | $34,542 |
| Total | 640 (100.0%) | $43,250 |
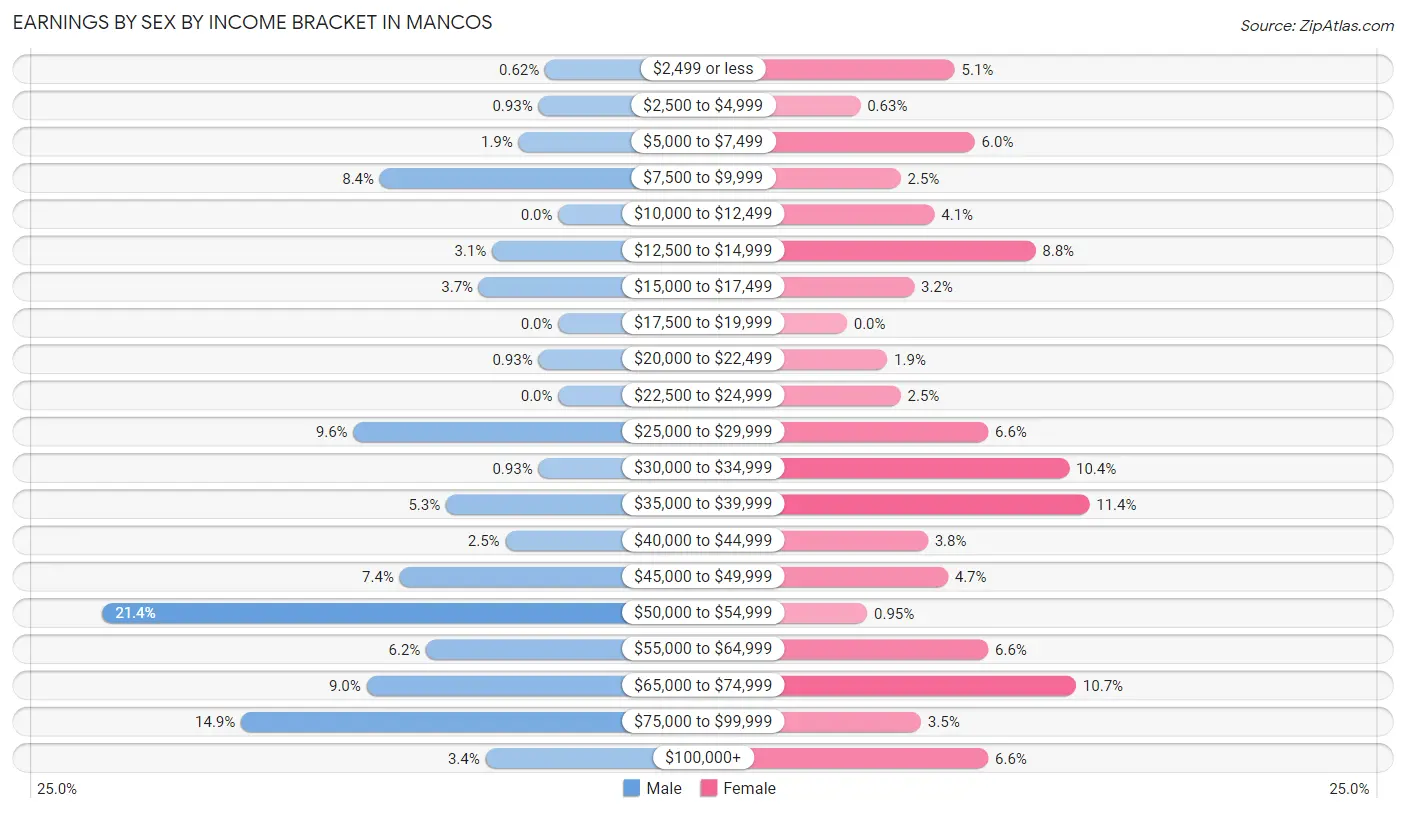
Earnings by Sex by Income Bracket in Mancos
The most common earnings brackets in Mancos are $50,000 to $54,999 for men (69 | 21.4%) and $35,000 to $39,999 for women (36 | 11.4%).
| Income | Male | Female |
| $2,499 or less | 2 (0.6%) | 16 (5.1%) |
| $2,500 to $4,999 | 3 (0.9%) | 2 (0.6%) |
| $5,000 to $7,499 | 6 (1.9%) | 19 (6.0%) |
| $7,500 to $9,999 | 27 (8.4%) | 8 (2.5%) |
| $10,000 to $12,499 | 0 (0.0%) | 13 (4.1%) |
| $12,500 to $14,999 | 10 (3.1%) | 28 (8.8%) |
| $15,000 to $17,499 | 12 (3.7%) | 10 (3.2%) |
| $17,500 to $19,999 | 0 (0.0%) | 0 (0.0%) |
| $20,000 to $22,499 | 3 (0.9%) | 6 (1.9%) |
| $22,500 to $24,999 | 0 (0.0%) | 8 (2.5%) |
| $25,000 to $29,999 | 31 (9.6%) | 21 (6.6%) |
| $30,000 to $34,999 | 3 (0.9%) | 33 (10.4%) |
| $35,000 to $39,999 | 17 (5.3%) | 36 (11.4%) |
| $40,000 to $44,999 | 8 (2.5%) | 12 (3.8%) |
| $45,000 to $49,999 | 24 (7.4%) | 15 (4.7%) |
| $50,000 to $54,999 | 69 (21.4%) | 3 (0.9%) |
| $55,000 to $64,999 | 20 (6.2%) | 21 (6.6%) |
| $65,000 to $74,999 | 29 (9.0%) | 34 (10.7%) |
| $75,000 to $99,999 | 48 (14.9%) | 11 (3.5%) |
| $100,000+ | 11 (3.4%) | 21 (6.6%) |
| Total | 323 (100.0%) | 317 (100.0%) |
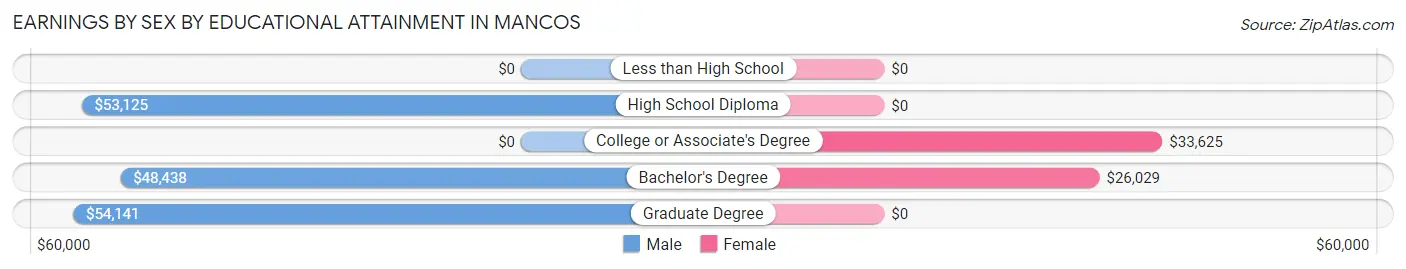
Earnings by Sex by Educational Attainment in Mancos
Average earnings in Mancos are $52,097 for men and $34,917 for women, a difference of 33.0%. Men with an educational attainment of graduate degree enjoy the highest average annual earnings of $54,141, while those with bachelor's degree education earn the least with $48,438. Women with an educational attainment of college or associate's degree earn the most with the average annual earnings of $33,625, while those with bachelor's degree education have the smallest earnings of $26,029.
| Educational Attainment | Male Income | Female Income |
| Less than High School | - | - |
| High School Diploma | $53,125 | $0 |
| College or Associate's Degree | - | - |
| Bachelor's Degree | $48,438 | $26,029 |
| Graduate Degree | $54,141 | $0 |
| Total | $52,097 | $34,917 |
Family Income in Mancos
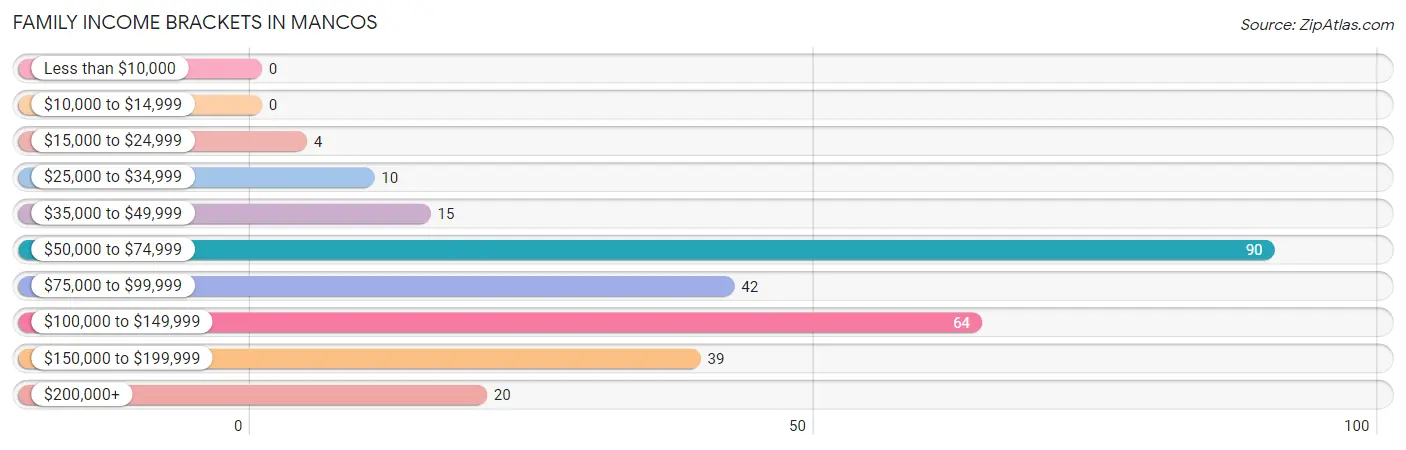
Family Income Brackets in Mancos
According to the Mancos family income data, there are 90 families falling into the $50,000 to $74,999 income range, which is the most common income bracket and makes up 31.7% of all families.
| Income Bracket | # Families | % Families |
| Less than $10,000 | 0 | 0.0% |
| $10,000 to $14,999 | 0 | 0.0% |
| $15,000 to $24,999 | 4 | 1.4% |
| $25,000 to $34,999 | 10 | 3.5% |
| $35,000 to $49,999 | 15 | 5.3% |
| $50,000 to $74,999 | 90 | 31.7% |
| $75,000 to $99,999 | 42 | 14.8% |
| $100,000 to $149,999 | 64 | 22.5% |
| $150,000 to $199,999 | 39 | 13.7% |
| $200,000+ | 20 | 7.0% |
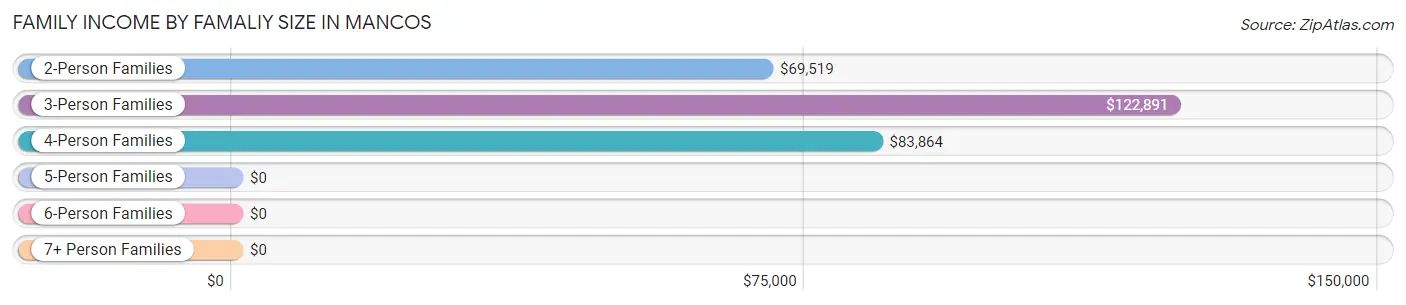
Family Income by Famaliy Size in Mancos
3-person families (65 | 22.9%) account for the highest median family income in Mancos with $122,891 per family, while 3-person families (65 | 22.9%) have the highest median income of $40,964 per family member.
| Income Bracket | # Families | Median Income |
| 2-Person Families | 153 (53.9%) | $69,519 |
| 3-Person Families | 65 (22.9%) | $122,891 |
| 4-Person Families | 66 (23.2%) | $83,864 |
| 5-Person Families | 0 (0.0%) | $0 |
| 6-Person Families | 0 (0.0%) | $0 |
| 7+ Person Families | 0 (0.0%) | $0 |
| Total | 284 (100.0%) | $84,545 |
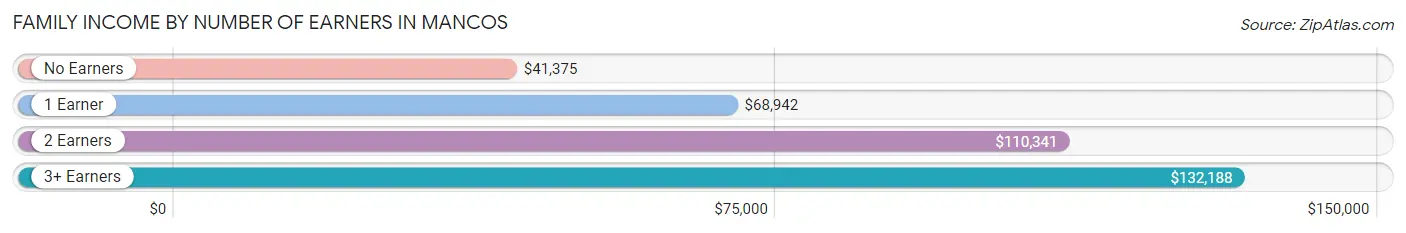
Family Income by Number of Earners in Mancos
The median family income in Mancos is $84,545, with families comprising 3+ earners (11) having the highest median family income of $132,188, while families with no earners (19) have the lowest median family income of $41,375, accounting for 3.9% and 6.7% of families, respectively.
| Number of Earners | # Families | Median Income |
| No Earners | 19 (6.7%) | $41,375 |
| 1 Earner | 87 (30.6%) | $68,942 |
| 2 Earners | 167 (58.8%) | $110,341 |
| 3+ Earners | 11 (3.9%) | $132,188 |
| Total | 284 (100.0%) | $84,545 |
Household Income in Mancos
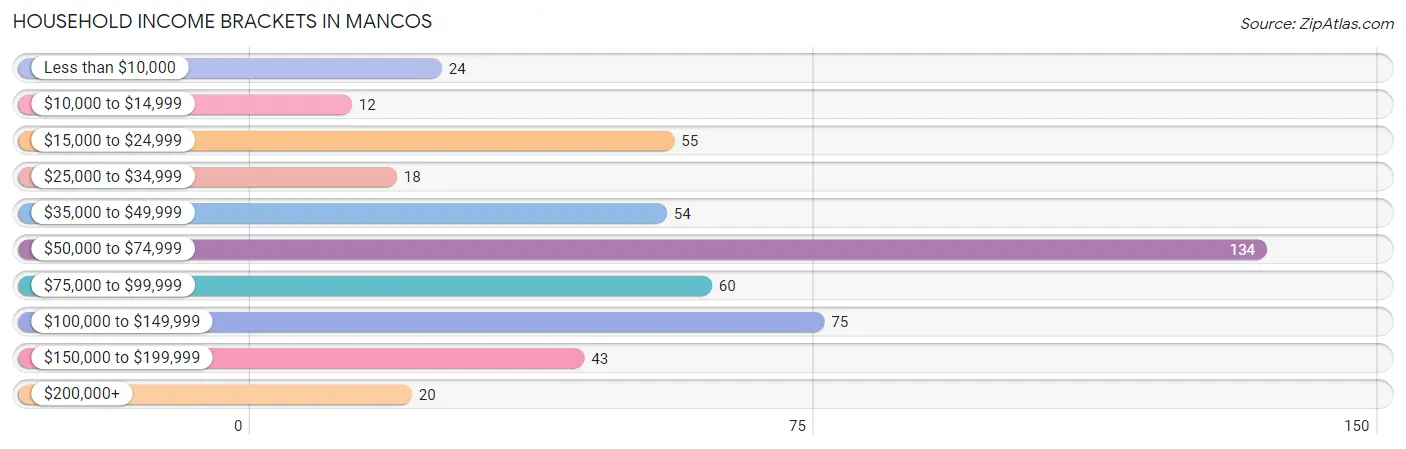
Household Income Brackets in Mancos
With 134 households falling in the category, the $50,000 to $74,999 income range is the most frequent in Mancos, accounting for 27.1% of all households. In contrast, only 12 households (2.4%) fall into the $10,000 to $14,999 income bracket, making it the least populous group.
| Income Bracket | # Households | % Households |
| Less than $10,000 | 24 | 4.8% |
| $10,000 to $14,999 | 12 | 2.4% |
| $15,000 to $24,999 | 55 | 11.1% |
| $25,000 to $34,999 | 18 | 3.6% |
| $35,000 to $49,999 | 54 | 10.9% |
| $50,000 to $74,999 | 134 | 27.1% |
| $75,000 to $99,999 | 60 | 12.1% |
| $100,000 to $149,999 | 75 | 15.2% |
| $150,000 to $199,999 | 43 | 8.7% |
| $200,000+ | 20 | 4.0% |
Household Income by Householder Age in Mancos
The median household income in Mancos is $63,185, with the highest median household income of $86,750 found in the 25 to 44 years age bracket for the primary householder. A total of 153 households (30.9%) fall into this category. Meanwhile, the 15 to 24 years age bracket for the primary householder has the lowest median household income of $0, with 8 households (1.6%) in this group.
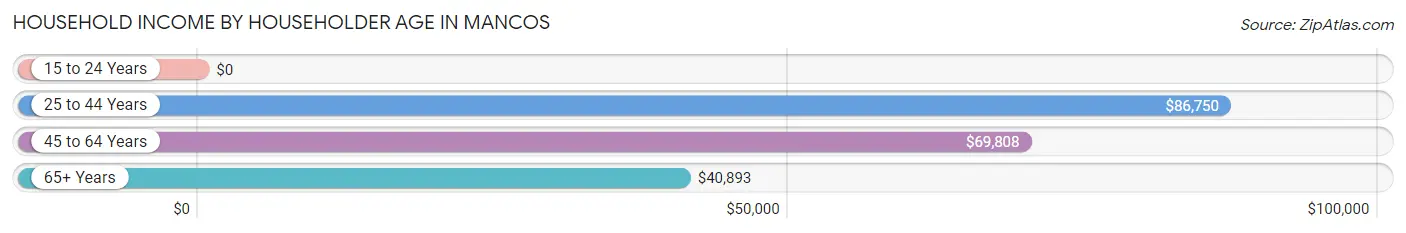
| Income Bracket | # Households | Median Income |
| 15 to 24 Years | 8 (1.6%) | $0 |
| 25 to 44 Years | 153 (30.9%) | $86,750 |
| 45 to 64 Years | 156 (31.5%) | $69,808 |
| 65+ Years | 178 (36.0%) | $40,893 |
| Total | 495 (100.0%) | $63,185 |
Poverty in Mancos
Income Below Poverty by Sex and Age in Mancos
With 2.9% poverty level for males and 10.0% for females among the residents of Mancos, 45 to 54 year old males and 75 year old and over females are the most vulnerable to poverty, with 15 males (19.0%) and 21 females (40.4%) in their respective age groups living below the poverty level.
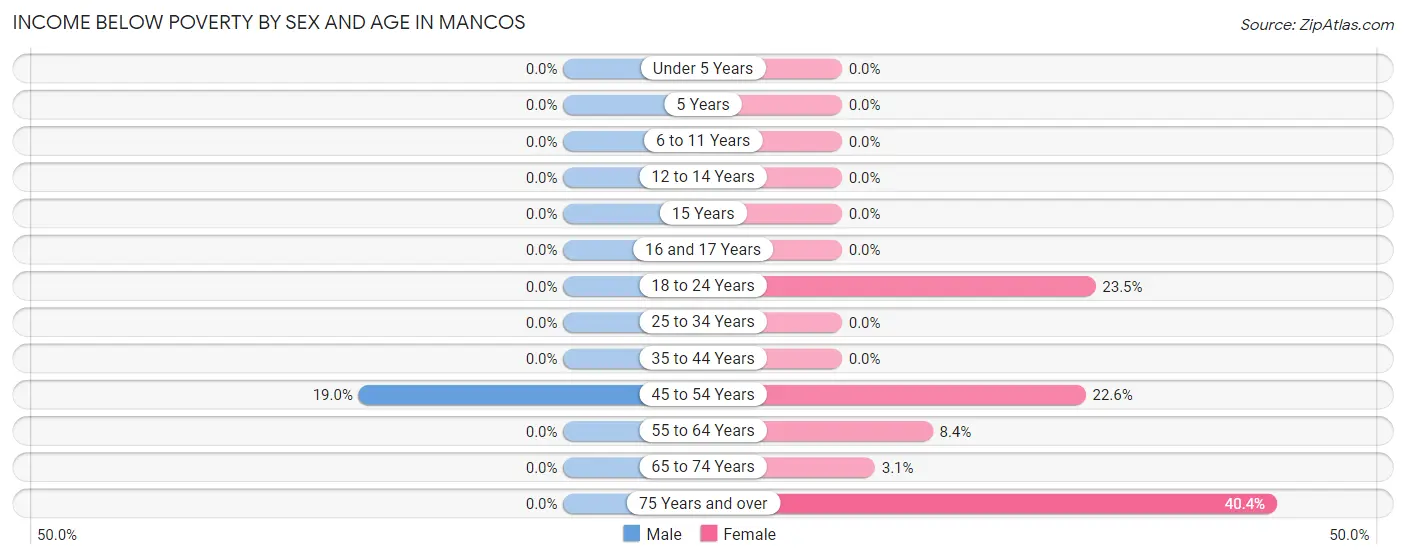
| Age Bracket | Male | Female |
| Under 5 Years | 0 (0.0%) | 0 (0.0%) |
| 5 Years | 0 (0.0%) | 0 (0.0%) |
| 6 to 11 Years | 0 (0.0%) | 0 (0.0%) |
| 12 to 14 Years | 0 (0.0%) | 0 (0.0%) |
| 15 Years | 0 (0.0%) | 0 (0.0%) |
| 16 and 17 Years | 0 (0.0%) | 0 (0.0%) |
| 18 to 24 Years | 0 (0.0%) | 4 (23.5%) |
| 25 to 34 Years | 0 (0.0%) | 0 (0.0%) |
| 35 to 44 Years | 0 (0.0%) | 0 (0.0%) |
| 45 to 54 Years | 15 (19.0%) | 19 (22.6%) |
| 55 to 64 Years | 0 (0.0%) | 8 (8.4%) |
| 65 to 74 Years | 0 (0.0%) | 3 (3.1%) |
| 75 Years and over | 0 (0.0%) | 21 (40.4%) |
| Total | 15 (2.9%) | 55 (10.0%) |
Income Above Poverty by Sex and Age in Mancos
According to the poverty statistics in Mancos, males aged under 5 years and females aged under 5 years are the age groups that are most secure financially, with 100.0% of males and 100.0% of females in these age groups living above the poverty line.
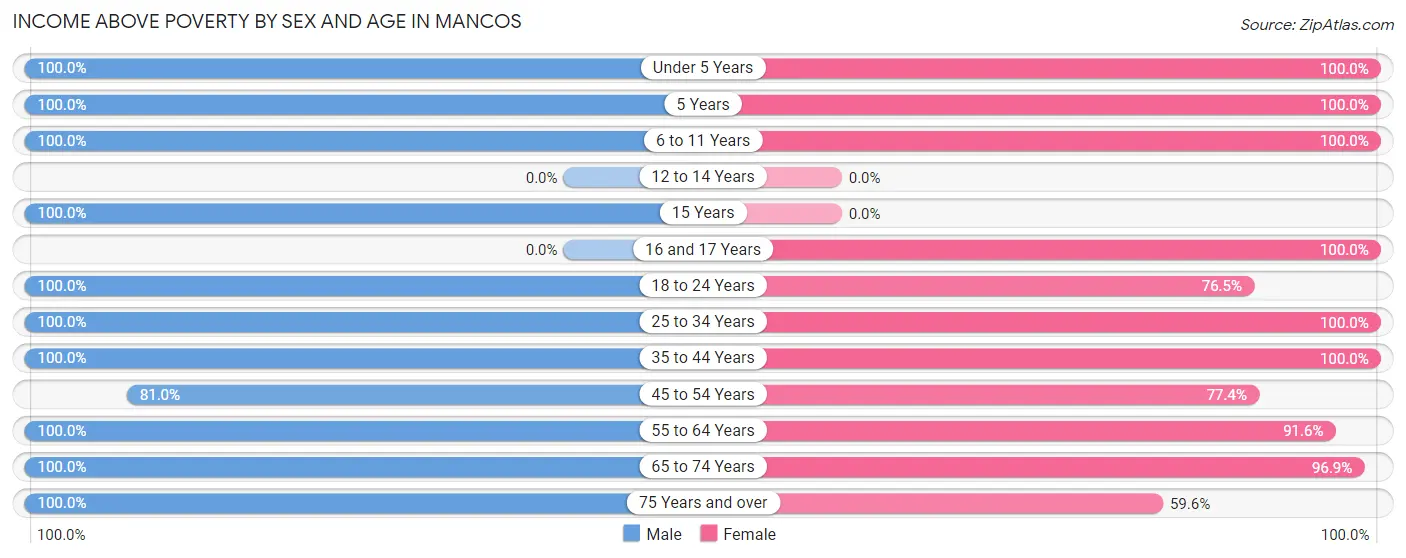
| Age Bracket | Male | Female |
| Under 5 Years | 26 (100.0%) | 4 (100.0%) |
| 5 Years | 12 (100.0%) | 38 (100.0%) |
| 6 to 11 Years | 32 (100.0%) | 24 (100.0%) |
| 12 to 14 Years | 0 (0.0%) | 0 (0.0%) |
| 15 Years | 35 (100.0%) | 0 (0.0%) |
| 16 and 17 Years | 0 (0.0%) | 17 (100.0%) |
| 18 to 24 Years | 21 (100.0%) | 13 (76.5%) |
| 25 to 34 Years | 61 (100.0%) | 63 (100.0%) |
| 35 to 44 Years | 123 (100.0%) | 56 (100.0%) |
| 45 to 54 Years | 64 (81.0%) | 65 (77.4%) |
| 55 to 64 Years | 31 (100.0%) | 87 (91.6%) |
| 65 to 74 Years | 80 (100.0%) | 95 (96.9%) |
| 75 Years and over | 17 (100.0%) | 31 (59.6%) |
| Total | 502 (97.1%) | 493 (90.0%) |
Income Below Poverty Among Married-Couple Families in Mancos
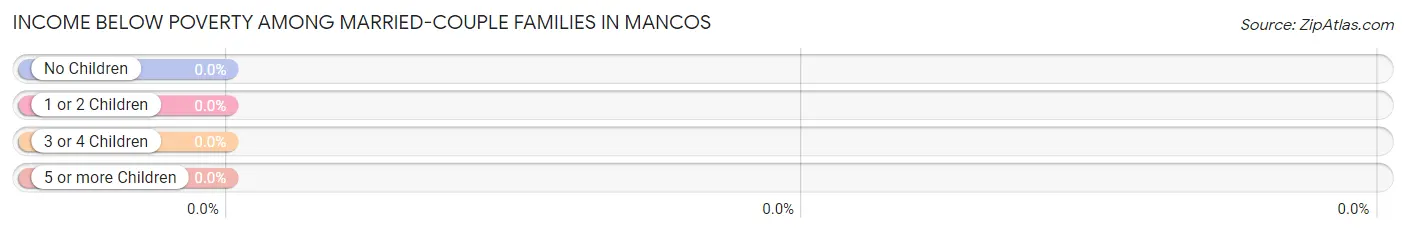
| Children | Above Poverty | Below Poverty |
| No Children | 157 (100.0%) | 0 (0.0%) |
| 1 or 2 Children | 101 (100.0%) | 0 (0.0%) |
| 3 or 4 Children | 0 (0.0%) | 0 (0.0%) |
| 5 or more Children | 0 (0.0%) | 0 (0.0%) |
| Total | 258 (100.0%) | 0 (0.0%) |
Income Below Poverty Among Single-Parent Households in Mancos
| Children | Single Father | Single Mother |
| No Children | 0 (0.0%) | 0 (0.0%) |
| 1 or 2 Children | 0 (0.0%) | 0 (0.0%) |
| 3 or 4 Children | 0 (0.0%) | 0 (0.0%) |
| 5 or more Children | 0 (0.0%) | 0 (0.0%) |
| Total | 0 (0.0%) | 0 (0.0%) |
Income Below Poverty Among Married-Couple vs Single-Parent Households in Mancos
| Children | Married-Couple Families | Single-Parent Households |
| No Children | 0 (0.0%) | 0 (0.0%) |
| 1 or 2 Children | 0 (0.0%) | 0 (0.0%) |
| 3 or 4 Children | 0 (0.0%) | 0 (0.0%) |
| 5 or more Children | 0 (0.0%) | 0 (0.0%) |
| Total | 0 (0.0%) | 0 (0.0%) |
Race in Mancos
The most populous races in Mancos are White / Caucasian (1,039 | 92.7%), Hispanic or Latino (80 | 7.1%), and Two or more Races (37 | 3.3%).
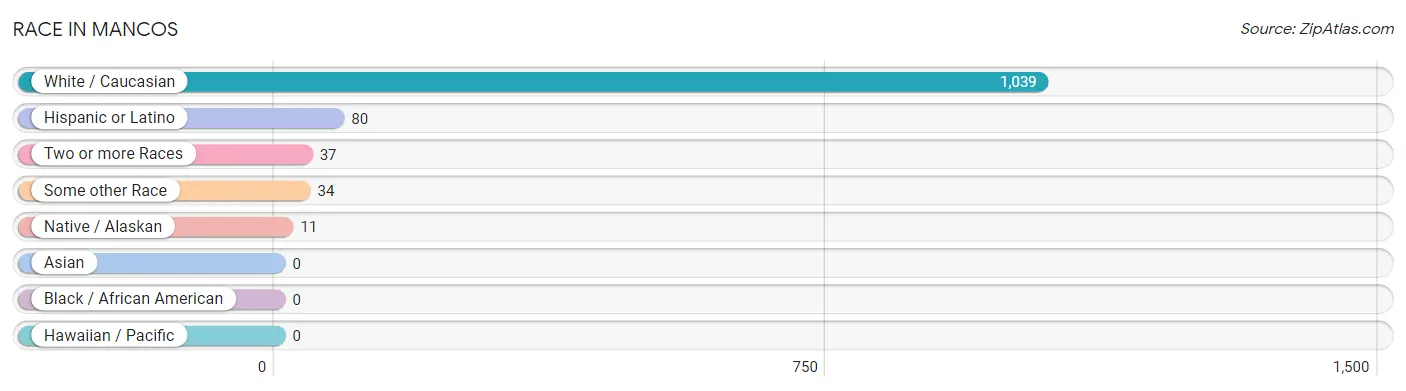
| Race | # Population | % Population |
| Asian | 0 | 0.0% |
| Black / African American | 0 | 0.0% |
| Hawaiian / Pacific | 0 | 0.0% |
| Hispanic or Latino | 80 | 7.1% |
| Native / Alaskan | 11 | 1.0% |
| White / Caucasian | 1,039 | 92.7% |
| Two or more Races | 37 | 3.3% |
| Some other Race | 34 | 3.0% |
| Total | 1,121 | 100.0% |
Ancestry in Mancos
The most populous ancestries reported in Mancos are English (223 | 19.9%), German (219 | 19.5%), Irish (218 | 19.5%), Scottish (72 | 6.4%), and American (70 | 6.2%), together accounting for 71.5% of all Mancos residents.
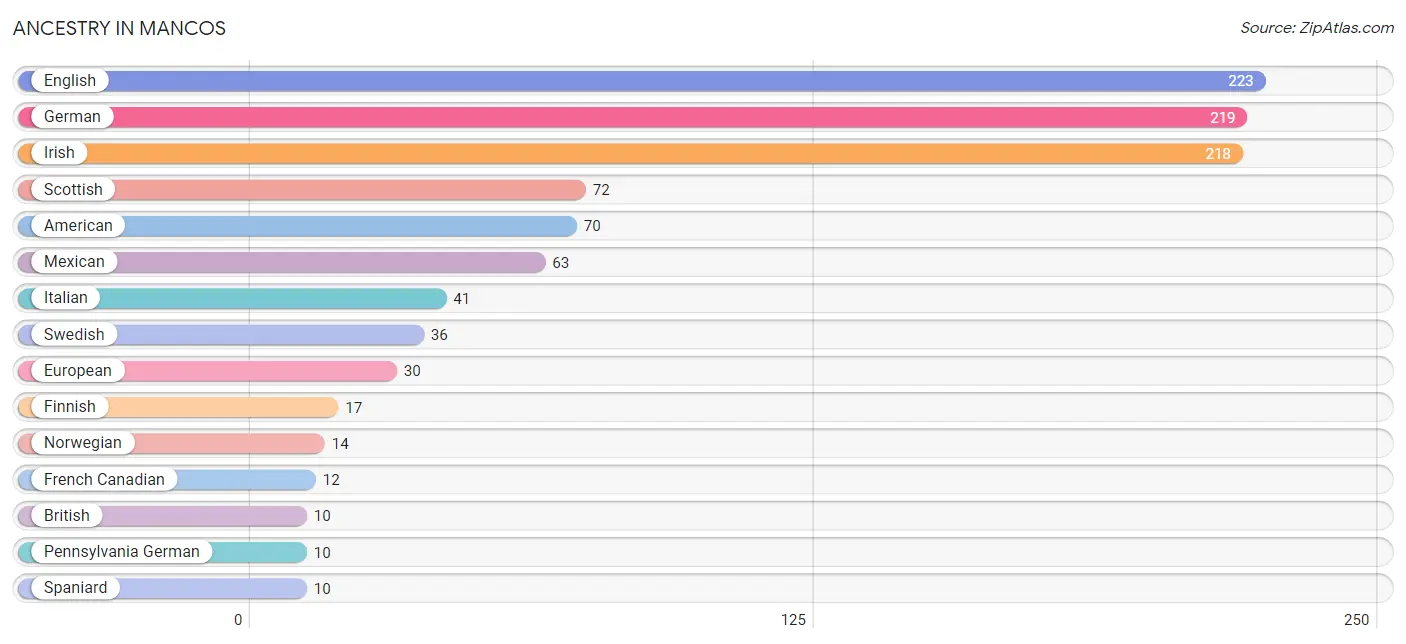
| Ancestry | # Population | % Population |
| American | 70 | 6.2% |
| Apache | 4 | 0.4% |
| British | 10 | 0.9% |
| Celtic | 2 | 0.2% |
| Dutch | 2 | 0.2% |
| Eastern European | 7 | 0.6% |
| English | 223 | 19.9% |
| European | 30 | 2.7% |
| Finnish | 17 | 1.5% |
| French | 8 | 0.7% |
| French Canadian | 12 | 1.1% |
| German | 219 | 19.5% |
| Hungarian | 5 | 0.4% |
| Irish | 218 | 19.5% |
| Italian | 41 | 3.7% |
| Mexican | 63 | 5.6% |
| Northern European | 8 | 0.7% |
| Norwegian | 14 | 1.3% |
| Pennsylvania German | 10 | 0.9% |
| Polish | 4 | 0.4% |
| Pueblo | 3 | 0.3% |
| Romanian | 4 | 0.4% |
| Scandinavian | 4 | 0.4% |
| Scotch-Irish | 8 | 0.7% |
| Scottish | 72 | 6.4% |
| Spaniard | 10 | 0.9% |
| Spanish | 7 | 0.6% |
| Swedish | 36 | 3.2% |
| Swiss | 2 | 0.2% |
| Ute | 9 | 0.8% |
| Welsh | 4 | 0.4% | View All 31 Rows |
Immigrants in Mancos
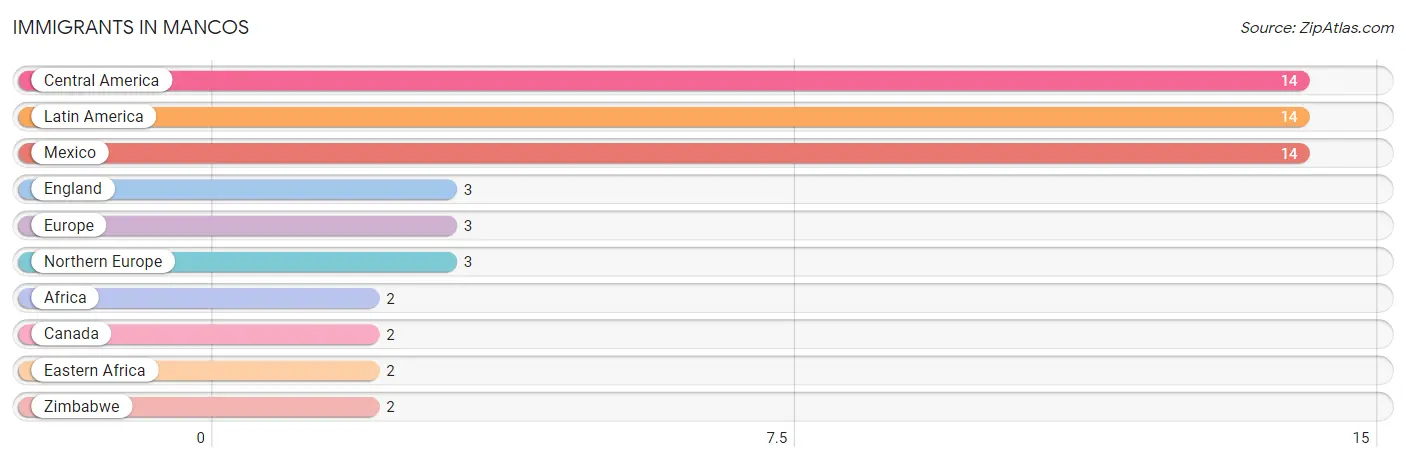
The most numerous immigrant groups reported in Mancos came from Central America (14 | 1.3%), Latin America (14 | 1.3%), Mexico (14 | 1.3%), England (3 | 0.3%), and Europe (3 | 0.3%), together accounting for 4.3% of all Mancos residents.
| Immigration Origin | # Population | % Population |
| Africa | 2 | 0.2% |
| Canada | 2 | 0.2% |
| Central America | 14 | 1.3% |
| Eastern Africa | 2 | 0.2% |
| England | 3 | 0.3% |
| Europe | 3 | 0.3% |
| Latin America | 14 | 1.3% |
| Mexico | 14 | 1.3% |
| Northern Europe | 3 | 0.3% |
| Zimbabwe | 2 | 0.2% | View All 10 Rows |
Sex and Age in Mancos
Sex and Age in Mancos
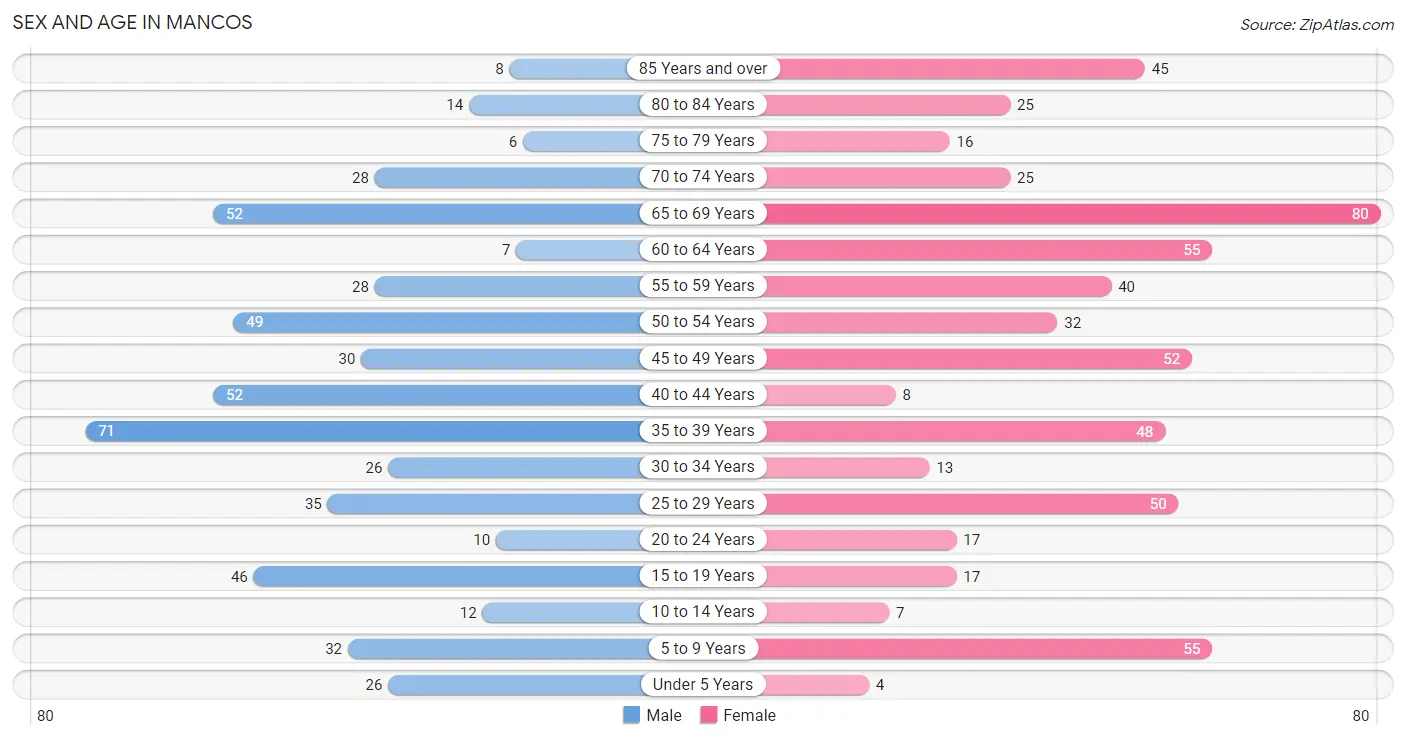
The most populous age groups in Mancos are 35 to 39 Years (71 | 13.4%) for men and 65 to 69 Years (80 | 13.6%) for women.
| Age Bracket | Male | Female |
| Under 5 Years | 26 (4.9%) | 4 (0.7%) |
| 5 to 9 Years | 32 (6.0%) | 55 (9.3%) |
| 10 to 14 Years | 12 (2.3%) | 7 (1.2%) |
| 15 to 19 Years | 46 (8.6%) | 17 (2.9%) |
| 20 to 24 Years | 10 (1.9%) | 17 (2.9%) |
| 25 to 29 Years | 35 (6.6%) | 50 (8.5%) |
| 30 to 34 Years | 26 (4.9%) | 13 (2.2%) |
| 35 to 39 Years | 71 (13.4%) | 48 (8.2%) |
| 40 to 44 Years | 52 (9.8%) | 8 (1.4%) |
| 45 to 49 Years | 30 (5.6%) | 52 (8.8%) |
| 50 to 54 Years | 49 (9.2%) | 32 (5.4%) |
| 55 to 59 Years | 28 (5.3%) | 40 (6.8%) |
| 60 to 64 Years | 7 (1.3%) | 55 (9.3%) |
| 65 to 69 Years | 52 (9.8%) | 80 (13.6%) |
| 70 to 74 Years | 28 (5.3%) | 25 (4.2%) |
| 75 to 79 Years | 6 (1.1%) | 16 (2.7%) |
| 80 to 84 Years | 14 (2.6%) | 25 (4.2%) |
| 85 Years and over | 8 (1.5%) | 45 (7.6%) |
| Total | 532 (100.0%) | 589 (100.0%) |
Families and Households in Mancos
Median Family Size in Mancos
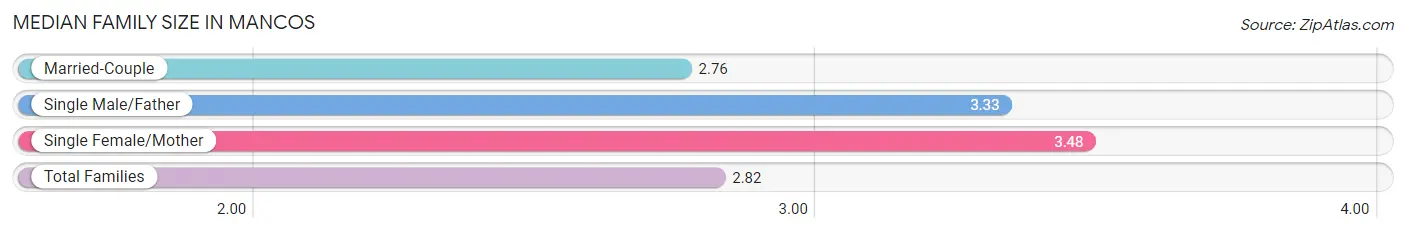
The median family size in Mancos is 2.82 persons per family, with single female/mother families (23 | 8.1%) accounting for the largest median family size of 3.48 persons per family. On the other hand, married-couple families (258 | 90.8%) represent the smallest median family size with 2.76 persons per family.
| Family Type | # Families | Family Size |
| Married-Couple | 258 (90.8%) | 2.76 |
| Single Male/Father | 3 (1.1%) | 3.33 |
| Single Female/Mother | 23 (8.1%) | 3.48 |
| Total Families | 284 (100.0%) | 2.82 |
Median Household Size in Mancos
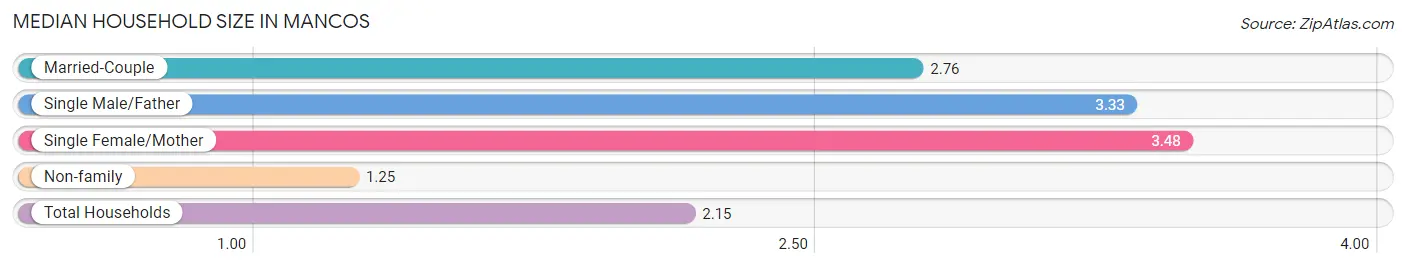
The median household size in Mancos is 2.15 persons per household, with single female/mother households (23 | 4.6%) accounting for the largest median household size of 3.48 persons per household. non-family households (211 | 42.6%) represent the smallest median household size with 1.25 persons per household.
| Household Type | # Households | Household Size |
| Married-Couple | 258 (52.1%) | 2.76 |
| Single Male/Father | 3 (0.6%) | 3.33 |
| Single Female/Mother | 23 (4.6%) | 3.48 |
| Non-family | 211 (42.6%) | 1.25 |
| Total Households | 495 (100.0%) | 2.15 |
Household Size by Marriage Status in Mancos
Out of a total of 495 households in Mancos, 284 (57.4%) are family households, while 211 (42.6%) are nonfamily households. The most numerous type of family households are 2-person households, comprising 151, and the most common type of nonfamily households are 1-person households, comprising 165.
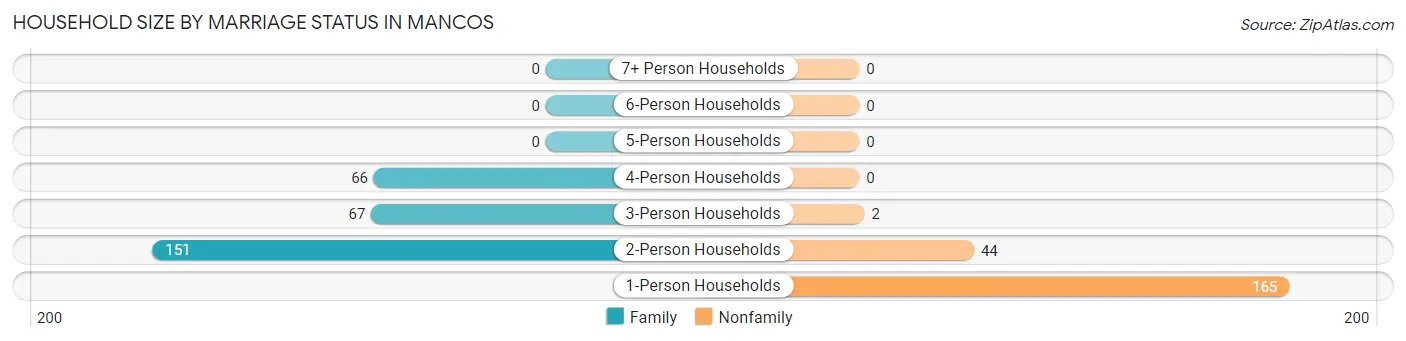
| Household Size | Family Households | Nonfamily Households |
| 1-Person Households | - | 165 (33.3%) |
| 2-Person Households | 151 (30.5%) | 44 (8.9%) |
| 3-Person Households | 67 (13.5%) | 2 (0.4%) |
| 4-Person Households | 66 (13.3%) | 0 (0.0%) |
| 5-Person Households | 0 (0.0%) | 0 (0.0%) |
| 6-Person Households | 0 (0.0%) | 0 (0.0%) |
| 7+ Person Households | 0 (0.0%) | 0 (0.0%) |
| Total | 284 (57.4%) | 211 (42.6%) |
Female Fertility in Mancos
Fertility by Age in Mancos
Average fertility rate in Mancos is 48.0 births per 1,000 women. Women in the age bracket of 20 to 34 years have the highest fertility rate with 125.0 births per 1,000 women. Women in the age bracket of 20 to 34 years acount for 100.0% of all women with births.
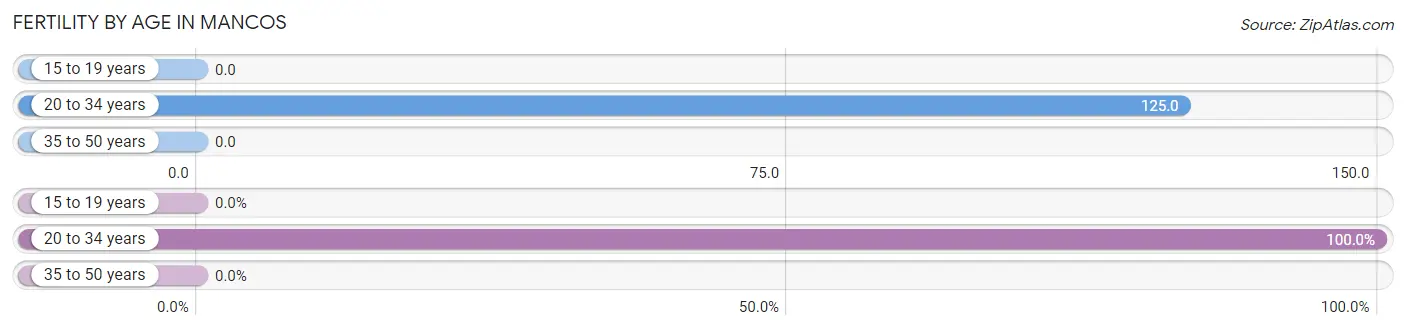
| Age Bracket | Women with Births | Births / 1,000 Women |
| 15 to 19 years | 0 (0.0%) | 0.0 |
| 20 to 34 years | 10 (100.0%) | 125.0 |
| 35 to 50 years | 0 (0.0%) | 0.0 |
| Total | 10 (100.0%) | 48.0 |
Fertility by Age by Marriage Status in Mancos
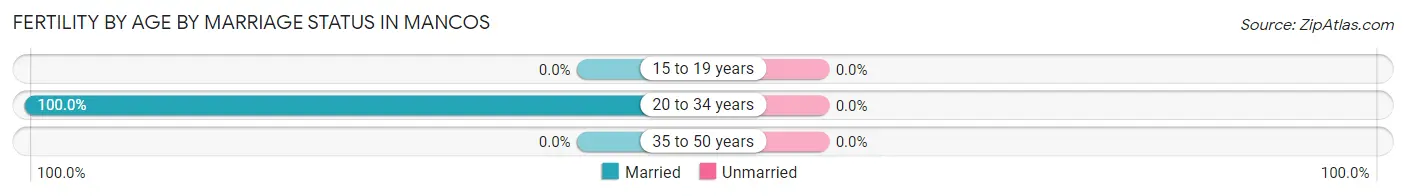
| Age Bracket | Married | Unmarried |
| 15 to 19 years | 0 (0.0%) | 0 (0.0%) |
| 20 to 34 years | 10 (100.0%) | 0 (0.0%) |
| 35 to 50 years | 0 (0.0%) | 0 (0.0%) |
| Total | 10 (100.0%) | 0 (0.0%) |
Fertility by Education in Mancos
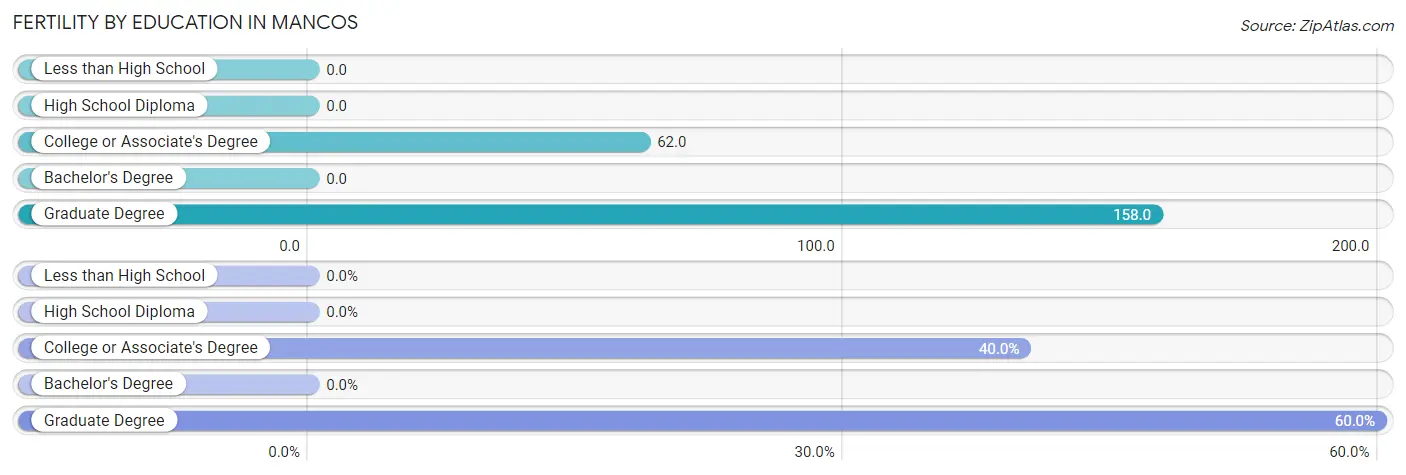
| Educational Attainment | Women with Births | Births / 1,000 Women |
| Less than High School | 0 (0.0%) | 0.0 |
| High School Diploma | 0 (0.0%) | 0.0 |
| College or Associate's Degree | 4 (40.0%) | 62.0 |
| Bachelor's Degree | 0 (0.0%) | 0.0 |
| Graduate Degree | 6 (60.0%) | 158.0 |
| Total | 10 (100.0%) | 48.0 |
Fertility by Education by Marriage Status in Mancos
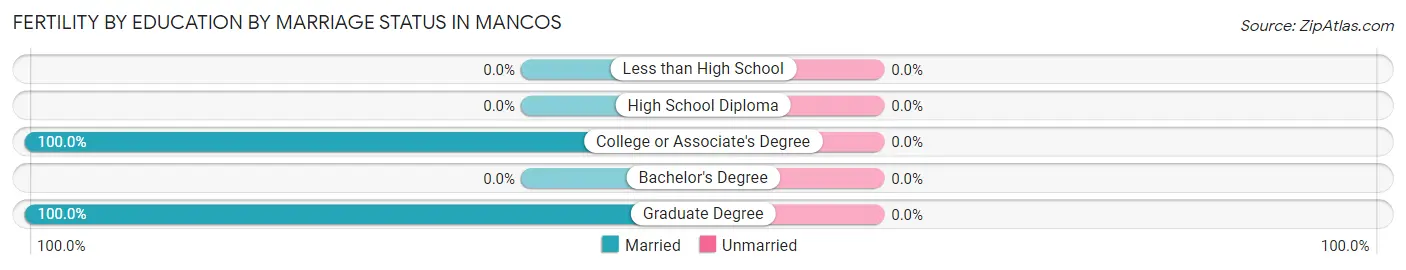
| Educational Attainment | Married | Unmarried |
| Less than High School | 0 (0.0%) | 0 (0.0%) |
| High School Diploma | 0 (0.0%) | 0 (0.0%) |
| College or Associate's Degree | 4 (100.0%) | 0 (0.0%) |
| Bachelor's Degree | 0 (0.0%) | 0 (0.0%) |
| Graduate Degree | 6 (100.0%) | 0 (0.0%) |
| Total | 10 (100.0%) | 0 (0.0%) |
Employment Characteristics in Mancos
Employment by Class of Employer in Mancos
Among the 566 employed individuals in Mancos, private company employees (317 | 56.0%), local government employees (68 | 12.0%), and self-employed (not incorporated) (63 | 11.1%) make up the most common classes of employment.
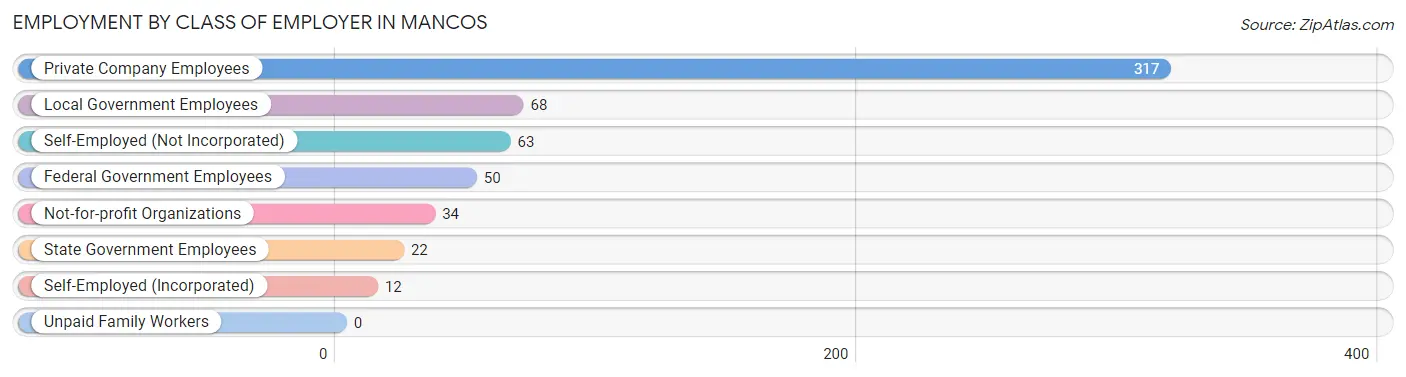
| Employer Class | # Employees | % Employees |
| Private Company Employees | 317 | 56.0% |
| Self-Employed (Incorporated) | 12 | 2.1% |
| Self-Employed (Not Incorporated) | 63 | 11.1% |
| Not-for-profit Organizations | 34 | 6.0% |
| Local Government Employees | 68 | 12.0% |
| State Government Employees | 22 | 3.9% |
| Federal Government Employees | 50 | 8.8% |
| Unpaid Family Workers | 0 | 0.0% |
| Total | 566 | 100.0% |
Employment Status by Age in Mancos
According to the labor force statistics for Mancos, out of the total population over 16 years of age (950), 62.0% or 589 individuals are in the labor force, with 1.5% or 9 of them unemployed. The age group with the highest labor force participation rate is 20 to 24 years, with 100.0% or 27 individuals in the labor force. Within the labor force, the 35 to 44 years age range has the highest percentage of unemployed individuals, with 4.7% or 7 of them being unemployed.
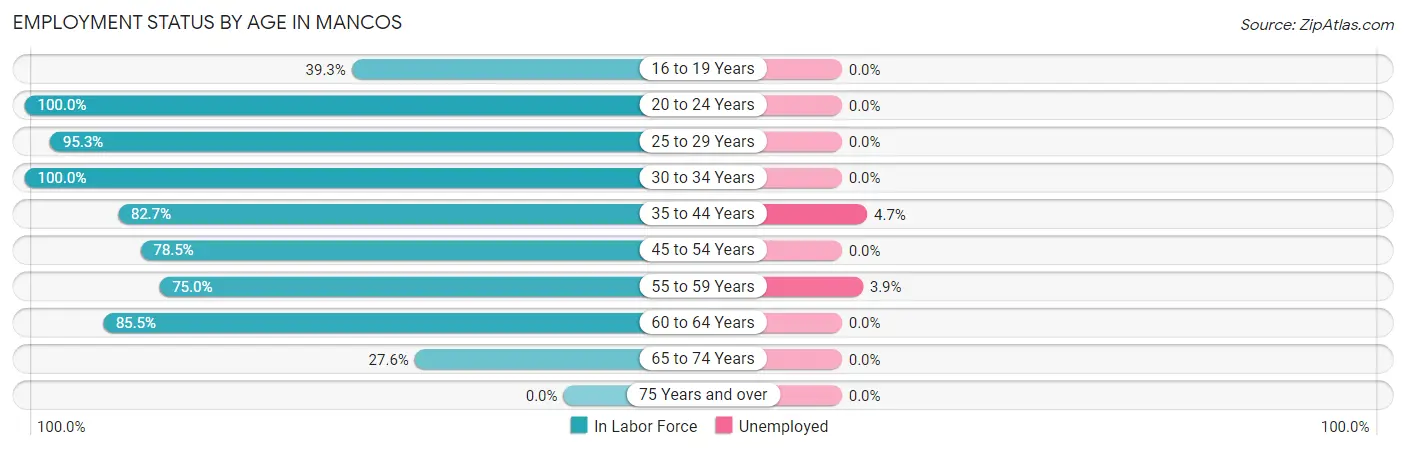
| Age Bracket | In Labor Force | Unemployed |
| 16 to 19 Years | 11 (39.3%) | 0 (0.0%) |
| 20 to 24 Years | 27 (100.0%) | 0 (0.0%) |
| 25 to 29 Years | 81 (95.3%) | 0 (0.0%) |
| 30 to 34 Years | 39 (100.0%) | 0 (0.0%) |
| 35 to 44 Years | 148 (82.7%) | 7 (4.7%) |
| 45 to 54 Years | 128 (78.5%) | 0 (0.0%) |
| 55 to 59 Years | 51 (75.0%) | 2 (3.9%) |
| 60 to 64 Years | 53 (85.5%) | 0 (0.0%) |
| 65 to 74 Years | 51 (27.6%) | 0 (0.0%) |
| 75 Years and over | 0 (0.0%) | 0 (0.0%) |
| Total | 589 (62.0%) | 9 (1.5%) |
Employment Status by Educational Attainment in Mancos
According to labor force statistics for Mancos, 83.9% of individuals (500) out of the total population between 25 and 64 years of age (596) are in the labor force, with 1.8% or 9 of them being unemployed. The group with the highest labor force participation rate are those with the educational attainment of less than high school, with 91.7% or 44 individuals in the labor force. Within the labor force, individuals with bachelor's degree or higher education have the highest percentage of unemployment, with 2.6% or 7 of them being unemployed.
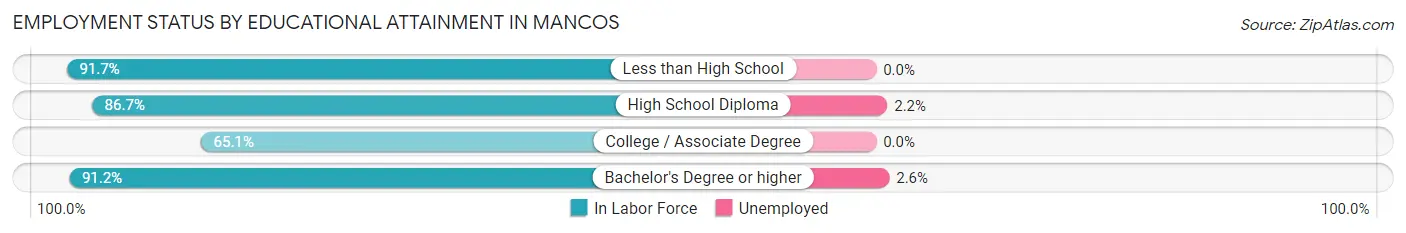
| Educational Attainment | In Labor Force | Unemployed |
| Less than High School | 44 (91.7%) | 0 (0.0%) |
| High School Diploma | 91 (86.7%) | 2 (2.2%) |
| College / Associate Degree | 97 (65.1%) | 0 (0.0%) |
| Bachelor's Degree or higher | 268 (91.2%) | 8 (2.6%) |
| Total | 500 (83.9%) | 11 (1.8%) |
Employment Occupations by Sex in Mancos
Management, Business, Science and Arts Occupations
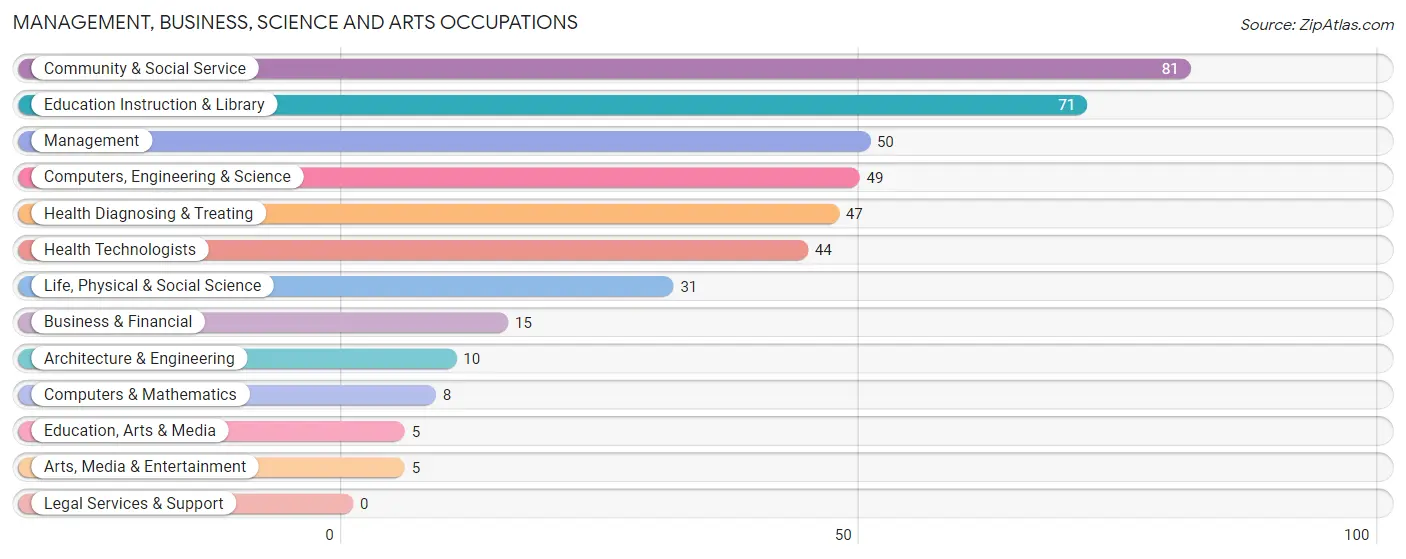
The most common Management, Business, Science and Arts occupations in Mancos are Community & Social Service (81 | 14.0%), Education Instruction & Library (71 | 12.2%), Management (50 | 8.6%), Computers, Engineering & Science (49 | 8.5%), and Health Diagnosing & Treating (47 | 8.1%).
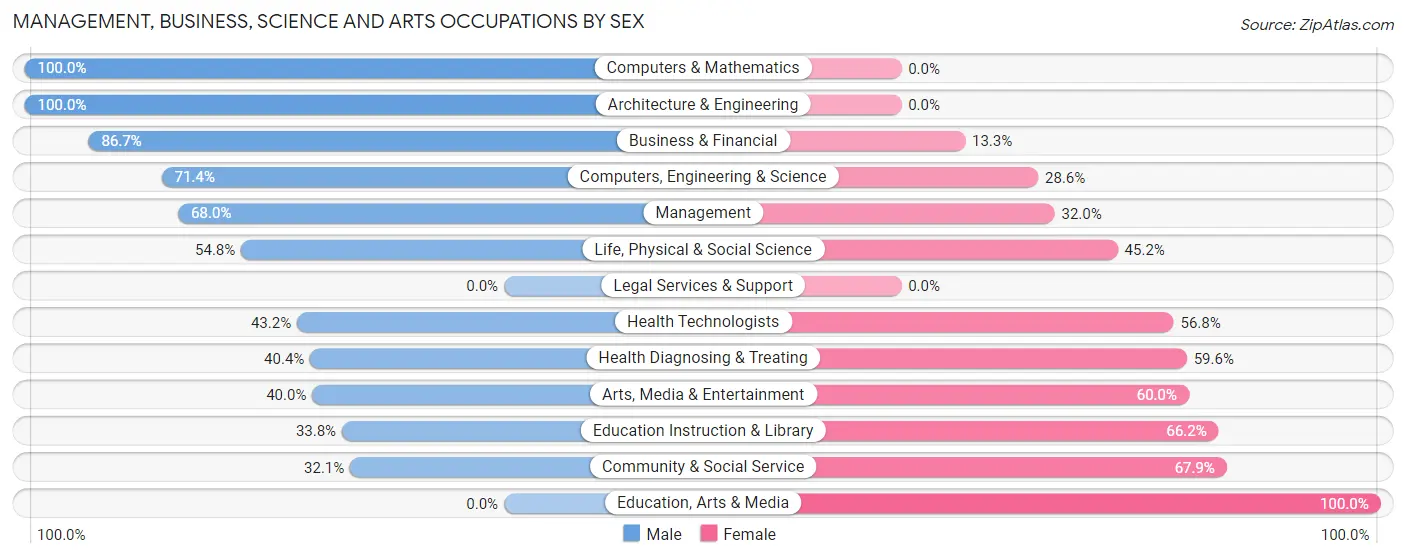
Management, Business, Science and Arts Occupations by Sex
Within the Management, Business, Science and Arts occupations in Mancos, the most male-oriented occupations are Computers & Mathematics (100.0%), Architecture & Engineering (100.0%), and Business & Financial (86.7%), while the most female-oriented occupations are Education, Arts & Media (100.0%), Community & Social Service (67.9%), and Education Instruction & Library (66.2%).
| Occupation | Male | Female |
| Management | 34 (68.0%) | 16 (32.0%) |
| Business & Financial | 13 (86.7%) | 2 (13.3%) |
| Computers, Engineering & Science | 35 (71.4%) | 14 (28.6%) |
| Computers & Mathematics | 8 (100.0%) | 0 (0.0%) |
| Architecture & Engineering | 10 (100.0%) | 0 (0.0%) |
| Life, Physical & Social Science | 17 (54.8%) | 14 (45.2%) |
| Community & Social Service | 26 (32.1%) | 55 (67.9%) |
| Education, Arts & Media | 0 (0.0%) | 5 (100.0%) |
| Legal Services & Support | 0 (0.0%) | 0 (0.0%) |
| Education Instruction & Library | 24 (33.8%) | 47 (66.2%) |
| Arts, Media & Entertainment | 2 (40.0%) | 3 (60.0%) |
| Health Diagnosing & Treating | 19 (40.4%) | 28 (59.6%) |
| Health Technologists | 19 (43.2%) | 25 (56.8%) |
| Total (Category) | 127 (52.5%) | 115 (47.5%) |
| Total (Overall) | 313 (54.0%) | 267 (46.0%) |
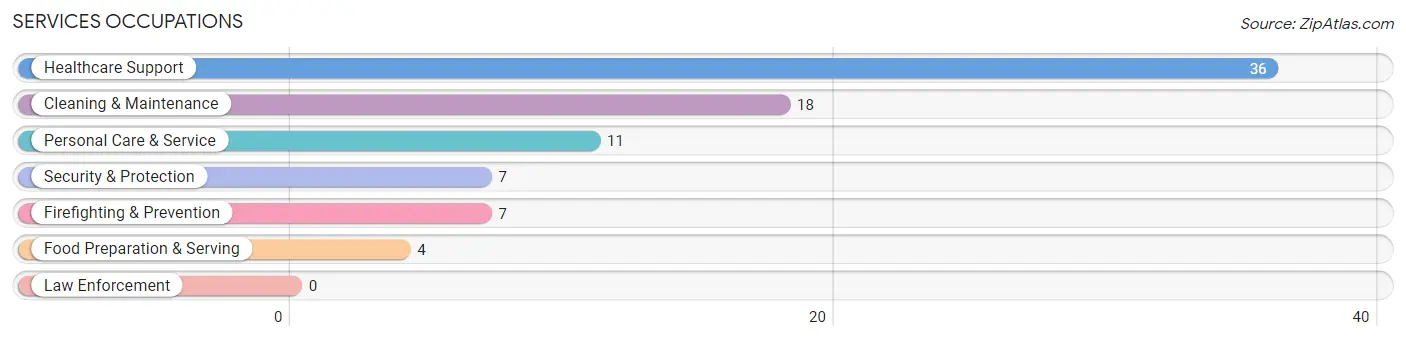
Services Occupations
The most common Services occupations in Mancos are Healthcare Support (36 | 6.2%), Cleaning & Maintenance (18 | 3.1%), Personal Care & Service (11 | 1.9%), Security & Protection (7 | 1.2%), and Firefighting & Prevention (7 | 1.2%).
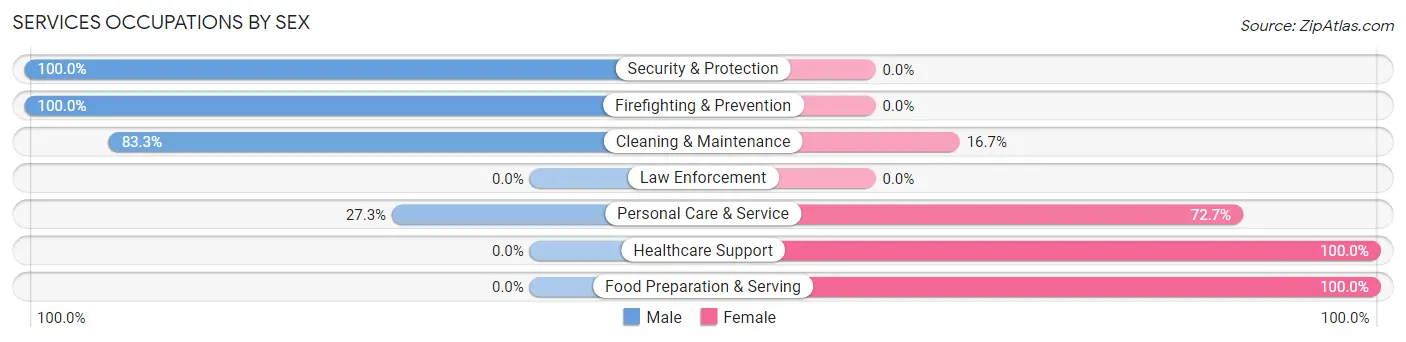
Services Occupations by Sex
Within the Services occupations in Mancos, the most male-oriented occupations are Security & Protection (100.0%), Firefighting & Prevention (100.0%), and Cleaning & Maintenance (83.3%), while the most female-oriented occupations are Healthcare Support (100.0%), Food Preparation & Serving (100.0%), and Personal Care & Service (72.7%).
| Occupation | Male | Female |
| Healthcare Support | 0 (0.0%) | 36 (100.0%) |
| Security & Protection | 7 (100.0%) | 0 (0.0%) |
| Firefighting & Prevention | 7 (100.0%) | 0 (0.0%) |
| Law Enforcement | 0 (0.0%) | 0 (0.0%) |
| Food Preparation & Serving | 0 (0.0%) | 4 (100.0%) |
| Cleaning & Maintenance | 15 (83.3%) | 3 (16.7%) |
| Personal Care & Service | 3 (27.3%) | 8 (72.7%) |
| Total (Category) | 25 (32.9%) | 51 (67.1%) |
| Total (Overall) | 313 (54.0%) | 267 (46.0%) |
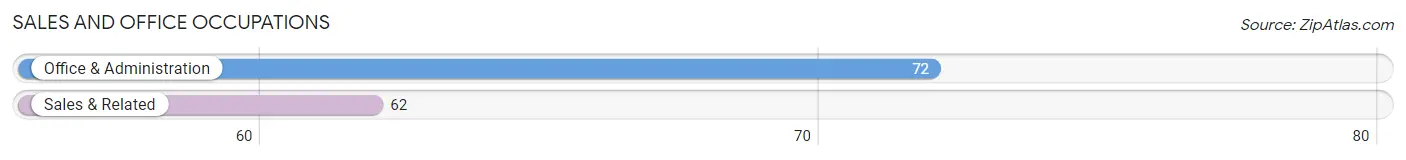
Sales and Office Occupations
The most common Sales and Office occupations in Mancos are Office & Administration (72 | 12.4%), and Sales & Related (62 | 10.7%).
Sales and Office Occupations by Sex
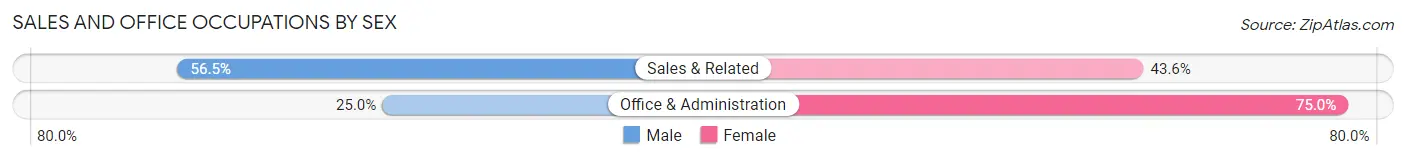
| Occupation | Male | Female |
| Sales & Related | 35 (56.5%) | 27 (43.5%) |
| Office & Administration | 18 (25.0%) | 54 (75.0%) |
| Total (Category) | 53 (39.6%) | 81 (60.5%) |
| Total (Overall) | 313 (54.0%) | 267 (46.0%) |
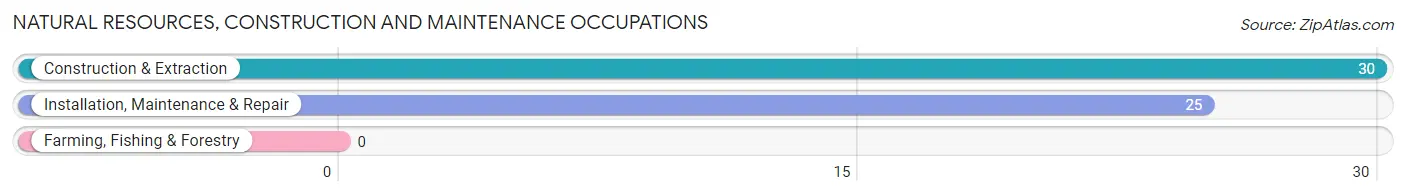
Natural Resources, Construction and Maintenance Occupations
The most common Natural Resources, Construction and Maintenance occupations in Mancos are Construction & Extraction (30 | 5.2%), and Installation, Maintenance & Repair (25 | 4.3%).
Natural Resources, Construction and Maintenance Occupations by Sex
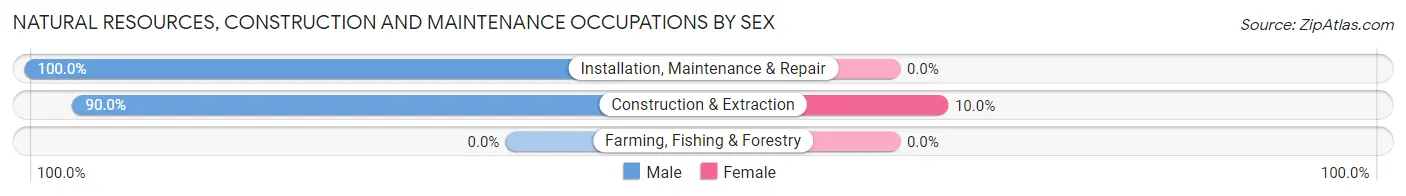
| Occupation | Male | Female |
| Farming, Fishing & Forestry | 0 (0.0%) | 0 (0.0%) |
| Construction & Extraction | 27 (90.0%) | 3 (10.0%) |
| Installation, Maintenance & Repair | 25 (100.0%) | 0 (0.0%) |
| Total (Category) | 52 (94.6%) | 3 (5.4%) |
| Total (Overall) | 313 (54.0%) | 267 (46.0%) |
Production, Transportation and Moving Occupations
The most common Production, Transportation and Moving occupations in Mancos are Production (30 | 5.2%), Transportation (25 | 4.3%), and Material Moving (18 | 3.1%).
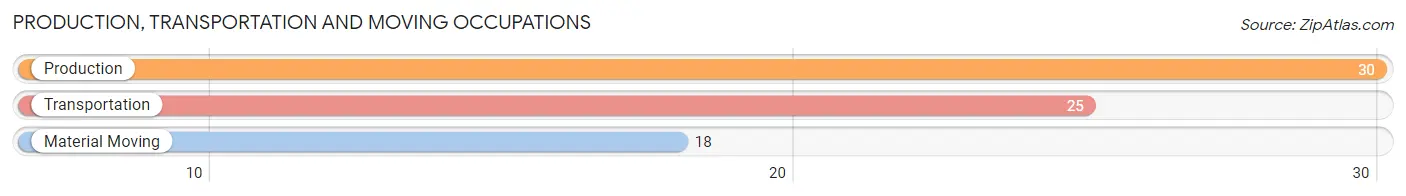
Production, Transportation and Moving Occupations by Sex
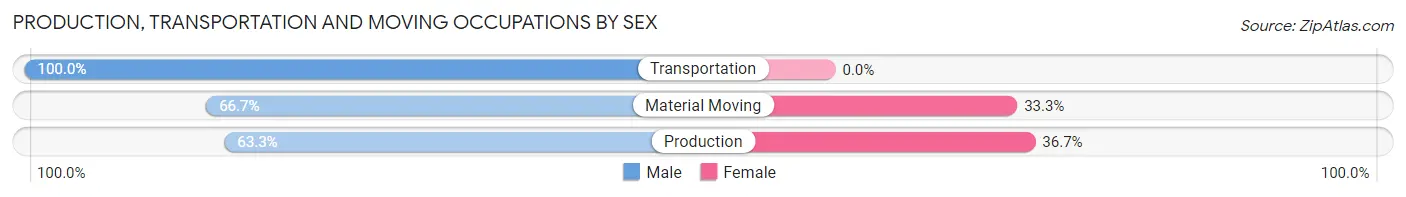
| Occupation | Male | Female |
| Production | 19 (63.3%) | 11 (36.7%) |
| Transportation | 25 (100.0%) | 0 (0.0%) |
| Material Moving | 12 (66.7%) | 6 (33.3%) |
| Total (Category) | 56 (76.7%) | 17 (23.3%) |
| Total (Overall) | 313 (54.0%) | 267 (46.0%) |
Employment Industries by Sex in Mancos
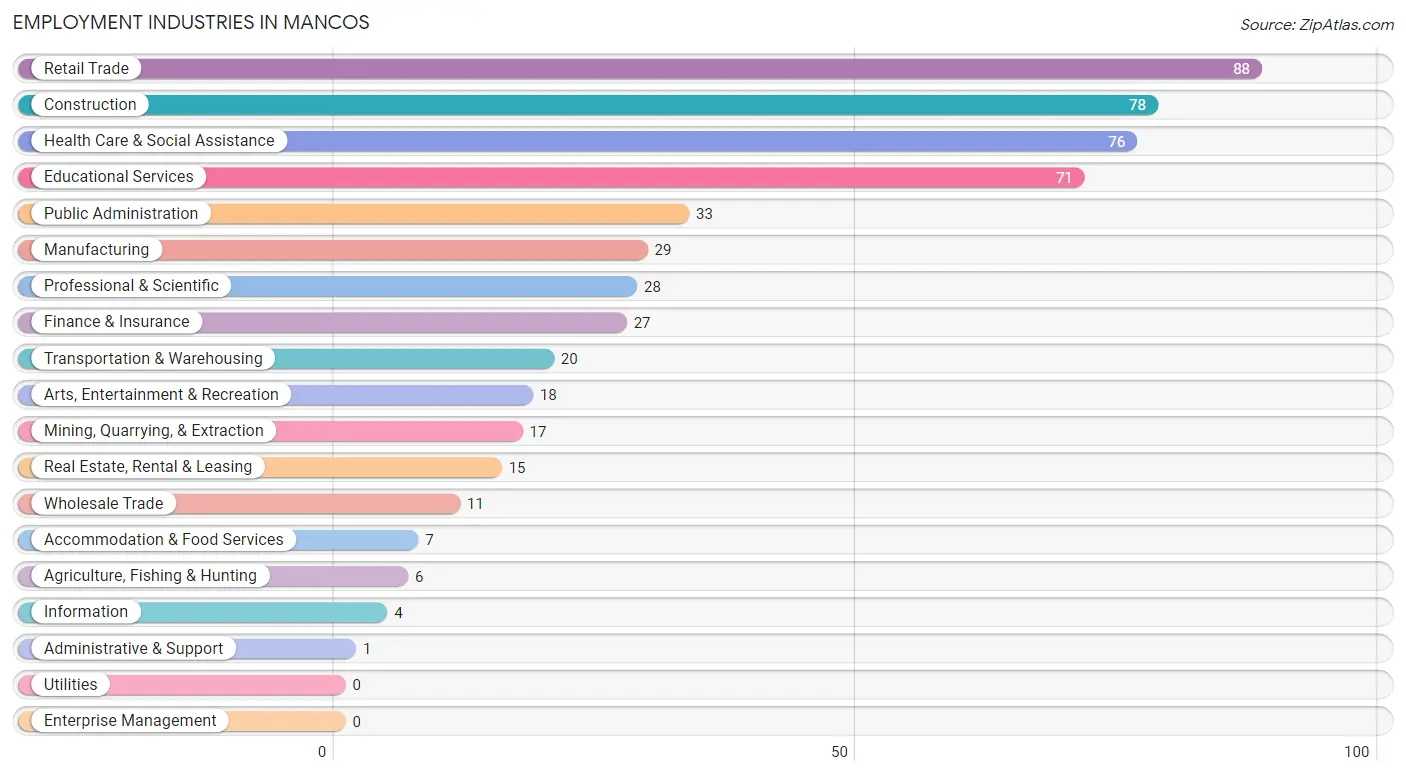
Employment Industries in Mancos
The major employment industries in Mancos include Retail Trade (88 | 15.2%), Construction (78 | 13.5%), Health Care & Social Assistance (76 | 13.1%), Educational Services (71 | 12.2%), and Public Administration (33 | 5.7%).
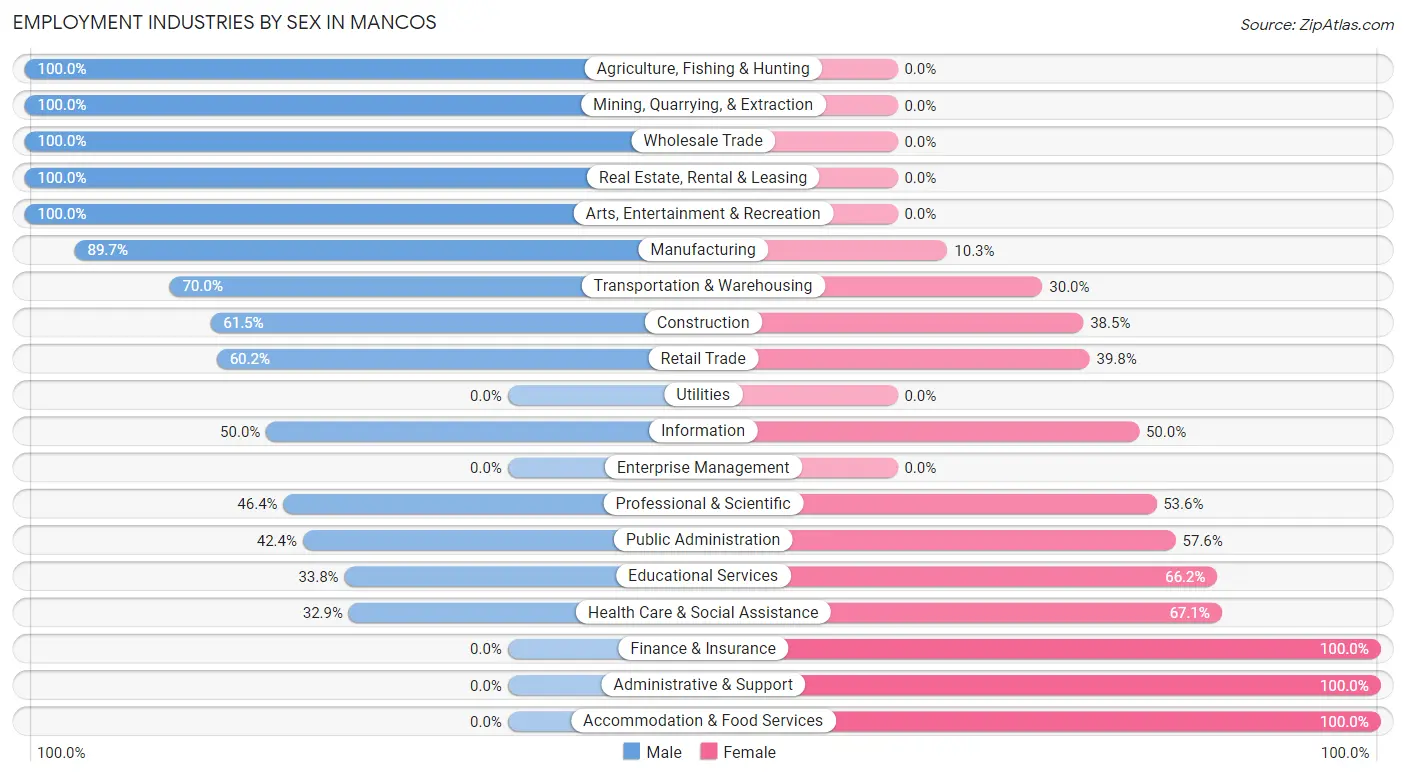
Employment Industries by Sex in Mancos
The Mancos industries that see more men than women are Agriculture, Fishing & Hunting (100.0%), Mining, Quarrying, & Extraction (100.0%), and Wholesale Trade (100.0%), whereas the industries that tend to have a higher number of women are Finance & Insurance (100.0%), Administrative & Support (100.0%), and Accommodation & Food Services (100.0%).
| Industry | Male | Female |
| Agriculture, Fishing & Hunting | 6 (100.0%) | 0 (0.0%) |
| Mining, Quarrying, & Extraction | 17 (100.0%) | 0 (0.0%) |
| Construction | 48 (61.5%) | 30 (38.5%) |
| Manufacturing | 26 (89.7%) | 3 (10.3%) |
| Wholesale Trade | 11 (100.0%) | 0 (0.0%) |
| Retail Trade | 53 (60.2%) | 35 (39.8%) |
| Transportation & Warehousing | 14 (70.0%) | 6 (30.0%) |
| Utilities | 0 (0.0%) | 0 (0.0%) |
| Information | 2 (50.0%) | 2 (50.0%) |
| Finance & Insurance | 0 (0.0%) | 27 (100.0%) |
| Real Estate, Rental & Leasing | 15 (100.0%) | 0 (0.0%) |
| Professional & Scientific | 13 (46.4%) | 15 (53.6%) |
| Enterprise Management | 0 (0.0%) | 0 (0.0%) |
| Administrative & Support | 0 (0.0%) | 1 (100.0%) |
| Educational Services | 24 (33.8%) | 47 (66.2%) |
| Health Care & Social Assistance | 25 (32.9%) | 51 (67.1%) |
| Arts, Entertainment & Recreation | 18 (100.0%) | 0 (0.0%) |
| Accommodation & Food Services | 0 (0.0%) | 7 (100.0%) |
| Public Administration | 14 (42.4%) | 19 (57.6%) |
| Total | 313 (54.0%) | 267 (46.0%) |
Education in Mancos
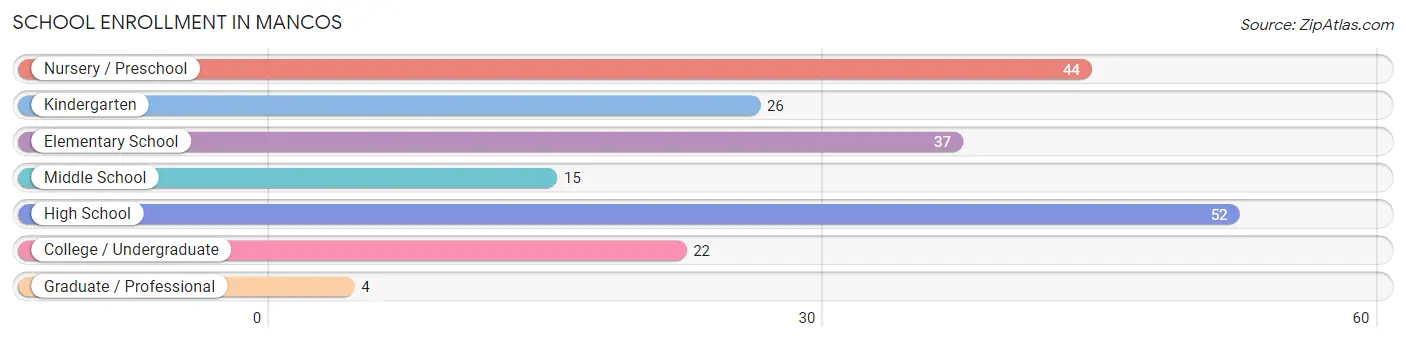
School Enrollment in Mancos
The most common levels of schooling among the 200 students in Mancos are high school (52 | 26.0%), nursery / preschool (44 | 22.0%), and elementary school (37 | 18.5%).
| School Level | # Students | % Students |
| Nursery / Preschool | 44 | 22.0% |
| Kindergarten | 26 | 13.0% |
| Elementary School | 37 | 18.5% |
| Middle School | 15 | 7.5% |
| High School | 52 | 26.0% |
| College / Undergraduate | 22 | 11.0% |
| Graduate / Professional | 4 | 2.0% |
| Total | 200 | 100.0% |
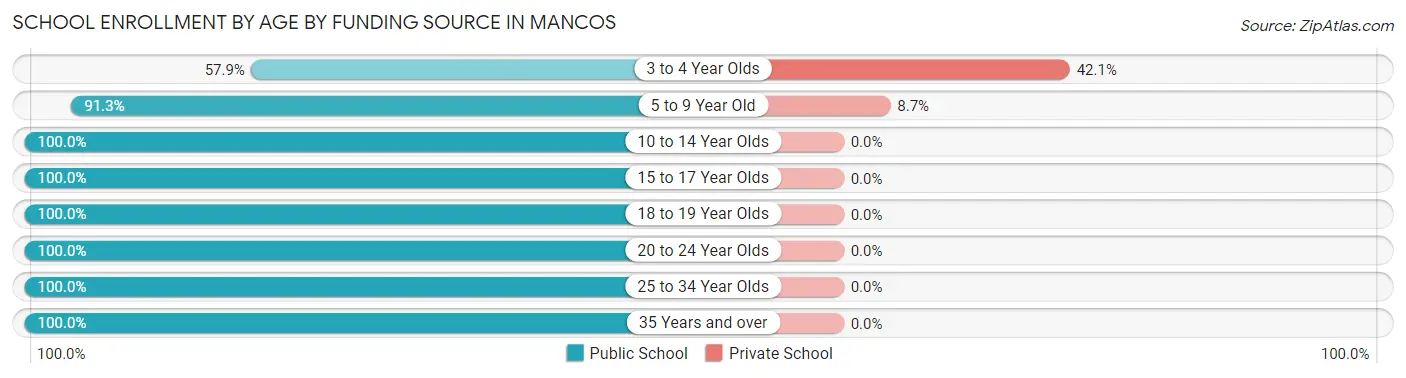
School Enrollment by Age by Funding Source in Mancos
Out of a total of 200 students who are enrolled in schools in Mancos, 14 (7.0%) attend a private institution, while the remaining 186 (93.0%) are enrolled in public schools. The age group of 3 to 4 year olds has the highest likelihood of being enrolled in private schools, with 8 (42.1% in the age bracket) enrolled. Conversely, the age group of 10 to 14 year olds has the lowest likelihood of being enrolled in a private school, with 19 (100.0% in the age bracket) attending a public institution.
| Age Bracket | Public School | Private School |
| 3 to 4 Year Olds | 11 (57.9%) | 8 (42.1%) |
| 5 to 9 Year Old | 63 (91.3%) | 6 (8.7%) |
| 10 to 14 Year Olds | 19 (100.0%) | 0 (0.0%) |
| 15 to 17 Year Olds | 52 (100.0%) | 0 (0.0%) |
| 18 to 19 Year Olds | 6 (100.0%) | 0 (0.0%) |
| 20 to 24 Year Olds | 5 (100.0%) | 0 (0.0%) |
| 25 to 34 Year Olds | 11 (100.0%) | 0 (0.0%) |
| 35 Years and over | 19 (100.0%) | 0 (0.0%) |
| Total | 186 (93.0%) | 14 (7.0%) |
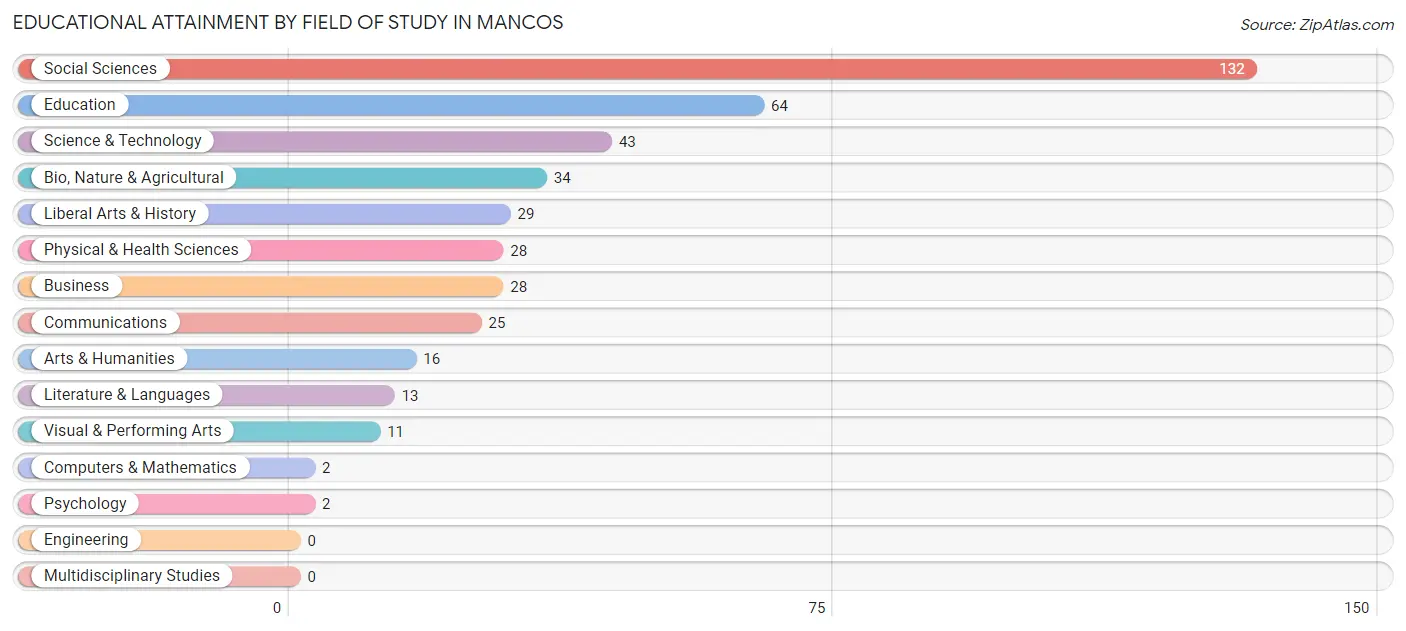
Educational Attainment by Field of Study in Mancos
Social sciences (132 | 30.9%), education (64 | 15.0%), science & technology (43 | 10.1%), bio, nature & agricultural (34 | 8.0%), and liberal arts & history (29 | 6.8%) are the most common fields of study among 427 individuals in Mancos who have obtained a bachelor's degree or higher.
| Field of Study | # Graduates | % Graduates |
| Computers & Mathematics | 2 | 0.5% |
| Bio, Nature & Agricultural | 34 | 8.0% |
| Physical & Health Sciences | 28 | 6.6% |
| Psychology | 2 | 0.5% |
| Social Sciences | 132 | 30.9% |
| Engineering | 0 | 0.0% |
| Multidisciplinary Studies | 0 | 0.0% |
| Science & Technology | 43 | 10.1% |
| Business | 28 | 6.6% |
| Education | 64 | 15.0% |
| Literature & Languages | 13 | 3.0% |
| Liberal Arts & History | 29 | 6.8% |
| Visual & Performing Arts | 11 | 2.6% |
| Communications | 25 | 5.9% |
| Arts & Humanities | 16 | 3.7% |
| Total | 427 | 100.0% |
Transportation & Commute in Mancos
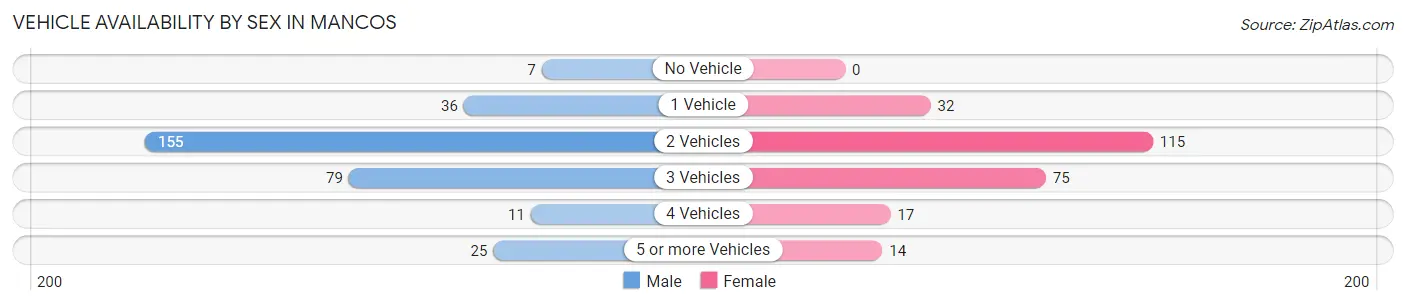
Vehicle Availability by Sex in Mancos
The most prevalent vehicle ownership categories in Mancos are males with 2 vehicles (155, accounting for 49.5%) and females with 2 vehicles (115, making up 61.3%).
| Vehicles Available | Male | Female |
| No Vehicle | 7 (2.2%) | 0 (0.0%) |
| 1 Vehicle | 36 (11.5%) | 32 (12.7%) |
| 2 Vehicles | 155 (49.5%) | 115 (45.5%) |
| 3 Vehicles | 79 (25.2%) | 75 (29.6%) |
| 4 Vehicles | 11 (3.5%) | 17 (6.7%) |
| 5 or more Vehicles | 25 (8.0%) | 14 (5.5%) |
| Total | 313 (100.0%) | 253 (100.0%) |
Commute Time in Mancos
The most frequently occuring commute durations in Mancos are 30 to 34 minutes (133 commuters, 26.3%), 20 to 24 minutes (76 commuters, 15.0%), and 5 to 9 minutes (63 commuters, 12.4%).
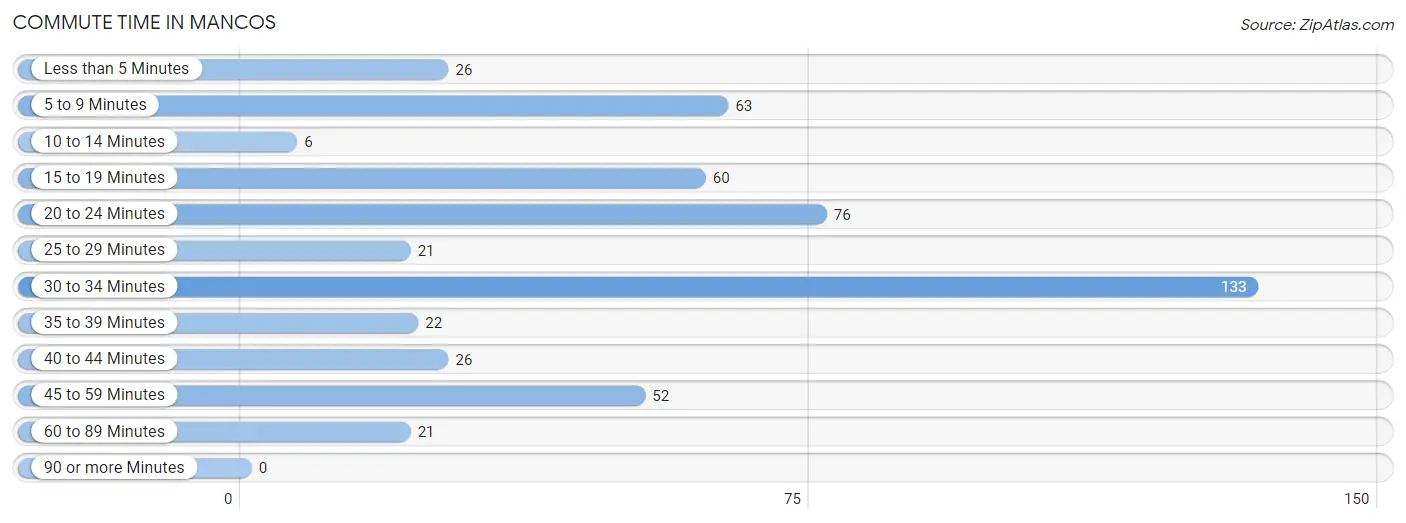
| Commute Time | # Commuters | % Commuters |
| Less than 5 Minutes | 26 | 5.1% |
| 5 to 9 Minutes | 63 | 12.4% |
| 10 to 14 Minutes | 6 | 1.2% |
| 15 to 19 Minutes | 60 | 11.9% |
| 20 to 24 Minutes | 76 | 15.0% |
| 25 to 29 Minutes | 21 | 4.2% |
| 30 to 34 Minutes | 133 | 26.3% |
| 35 to 39 Minutes | 22 | 4.3% |
| 40 to 44 Minutes | 26 | 5.1% |
| 45 to 59 Minutes | 52 | 10.3% |
| 60 to 89 Minutes | 21 | 4.2% |
| 90 or more Minutes | 0 | 0.0% |
Commute Time by Sex in Mancos
The most common commute times in Mancos are 30 to 34 minutes (61 commuters, 20.5%) for males and 30 to 34 minutes (72 commuters, 34.4%) for females.
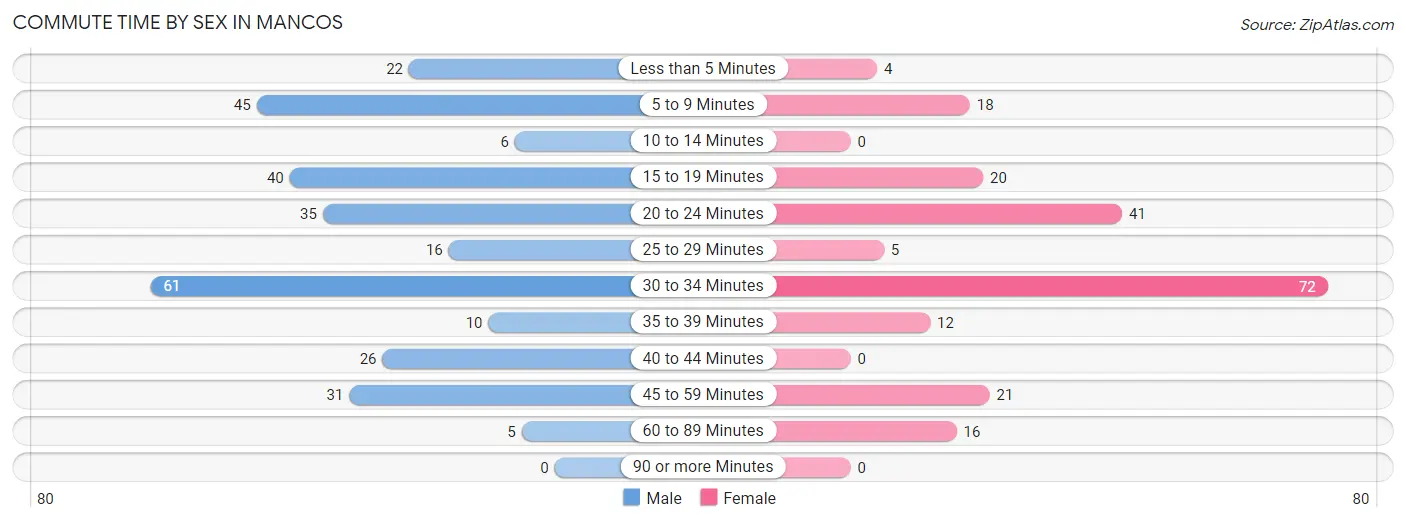
| Commute Time | Male | Female |
| Less than 5 Minutes | 22 (7.4%) | 4 (1.9%) |
| 5 to 9 Minutes | 45 (15.1%) | 18 (8.6%) |
| 10 to 14 Minutes | 6 (2.0%) | 0 (0.0%) |
| 15 to 19 Minutes | 40 (13.5%) | 20 (9.6%) |
| 20 to 24 Minutes | 35 (11.8%) | 41 (19.6%) |
| 25 to 29 Minutes | 16 (5.4%) | 5 (2.4%) |
| 30 to 34 Minutes | 61 (20.5%) | 72 (34.4%) |
| 35 to 39 Minutes | 10 (3.4%) | 12 (5.7%) |
| 40 to 44 Minutes | 26 (8.7%) | 0 (0.0%) |
| 45 to 59 Minutes | 31 (10.4%) | 21 (10.1%) |
| 60 to 89 Minutes | 5 (1.7%) | 16 (7.7%) |
| 90 or more Minutes | 0 (0.0%) | 0 (0.0%) |
Time of Departure to Work by Sex in Mancos
The most frequent times of departure to work in Mancos are 7:30 AM to 7:59 AM (66, 22.2%) for males and 7:30 AM to 7:59 AM (84, 40.2%) for females.
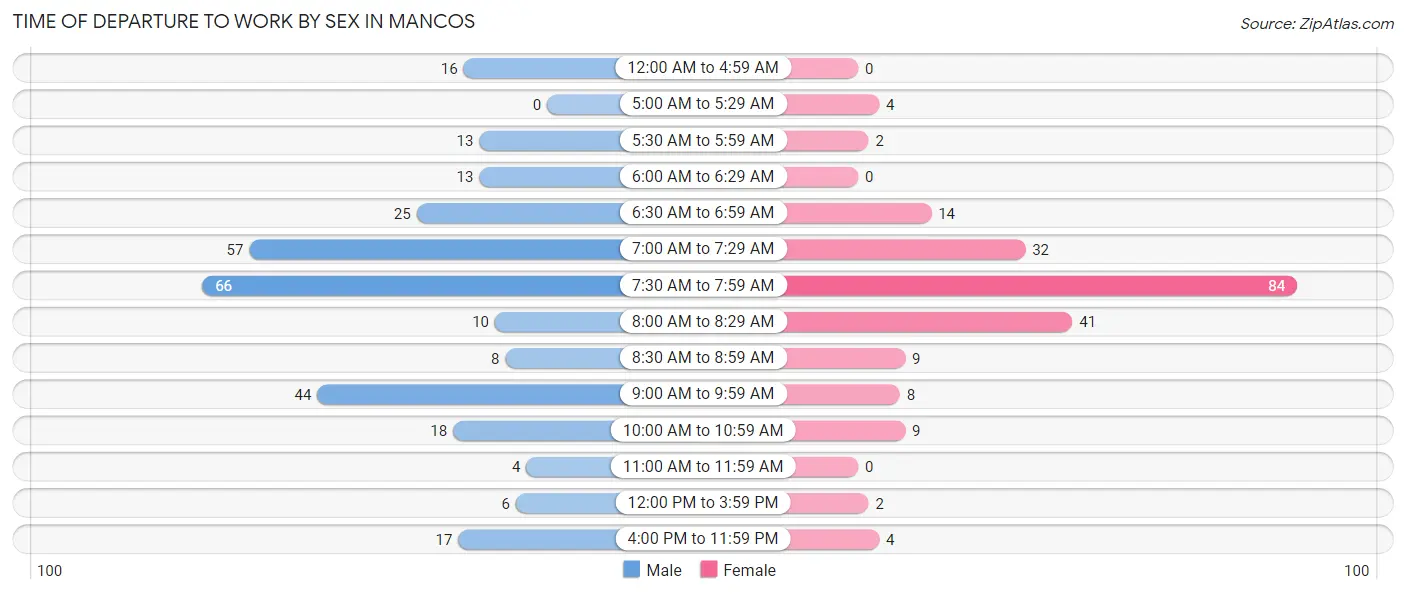
| Time of Departure | Male | Female |
| 12:00 AM to 4:59 AM | 16 (5.4%) | 0 (0.0%) |
| 5:00 AM to 5:29 AM | 0 (0.0%) | 4 (1.9%) |
| 5:30 AM to 5:59 AM | 13 (4.4%) | 2 (1.0%) |
| 6:00 AM to 6:29 AM | 13 (4.4%) | 0 (0.0%) |
| 6:30 AM to 6:59 AM | 25 (8.4%) | 14 (6.7%) |
| 7:00 AM to 7:29 AM | 57 (19.2%) | 32 (15.3%) |
| 7:30 AM to 7:59 AM | 66 (22.2%) | 84 (40.2%) |
| 8:00 AM to 8:29 AM | 10 (3.4%) | 41 (19.6%) |
| 8:30 AM to 8:59 AM | 8 (2.7%) | 9 (4.3%) |
| 9:00 AM to 9:59 AM | 44 (14.8%) | 8 (3.8%) |
| 10:00 AM to 10:59 AM | 18 (6.1%) | 9 (4.3%) |
| 11:00 AM to 11:59 AM | 4 (1.3%) | 0 (0.0%) |
| 12:00 PM to 3:59 PM | 6 (2.0%) | 2 (1.0%) |
| 4:00 PM to 11:59 PM | 17 (5.7%) | 4 (1.9%) |
| Total | 297 (100.0%) | 209 (100.0%) |
Housing Occupancy in Mancos
Occupancy by Ownership in Mancos
Of the total 495 dwellings in Mancos, owner-occupied units account for 373 (75.3%), while renter-occupied units make up 122 (24.6%).
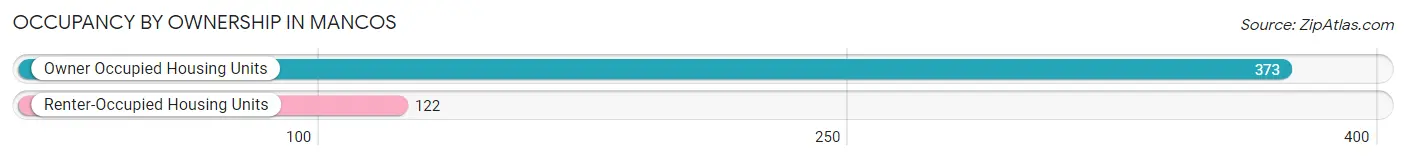
| Occupancy | # Housing Units | % Housing Units |
| Owner Occupied Housing Units | 373 | 75.3% |
| Renter-Occupied Housing Units | 122 | 24.6% |
| Total Occupied Housing Units | 495 | 100.0% |
Occupancy by Household Size in Mancos
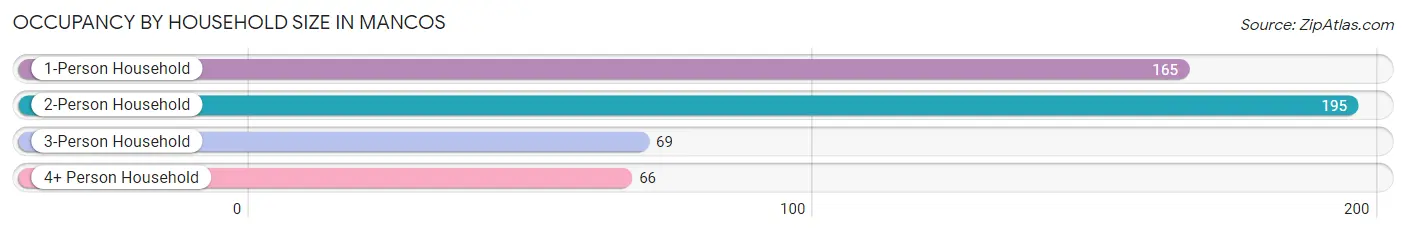
| Household Size | # Housing Units | % Housing Units |
| 1-Person Household | 165 | 33.3% |
| 2-Person Household | 195 | 39.4% |
| 3-Person Household | 69 | 13.9% |
| 4+ Person Household | 66 | 13.3% |
| Total Housing Units | 495 | 100.0% |
Occupancy by Ownership by Household Size in Mancos
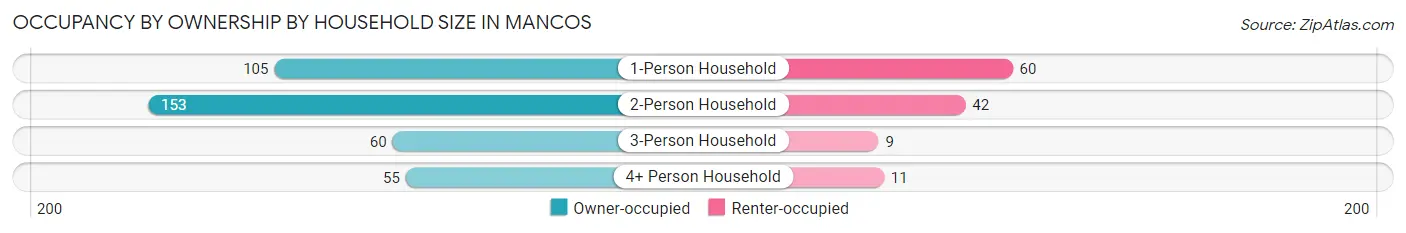
| Household Size | Owner-occupied | Renter-occupied |
| 1-Person Household | 105 (63.6%) | 60 (36.4%) |
| 2-Person Household | 153 (78.5%) | 42 (21.5%) |
| 3-Person Household | 60 (87.0%) | 9 (13.0%) |
| 4+ Person Household | 55 (83.3%) | 11 (16.7%) |
| Total Housing Units | 373 (75.3%) | 122 (24.6%) |
Occupancy by Educational Attainment in Mancos
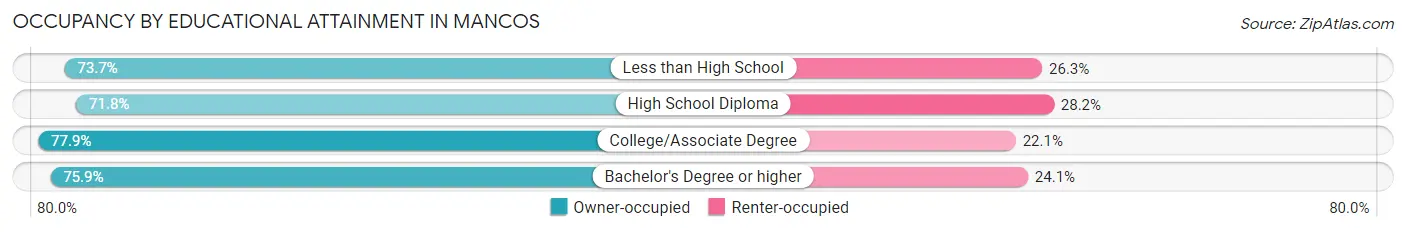
| Household Size | Owner-occupied | Renter-occupied |
| Less than High School | 28 (73.7%) | 10 (26.3%) |
| High School Diploma | 79 (71.8%) | 31 (28.2%) |
| College/Associate Degree | 102 (77.9%) | 29 (22.1%) |
| Bachelor's Degree or higher | 164 (75.9%) | 52 (24.1%) |
Occupancy by Age of Householder in Mancos
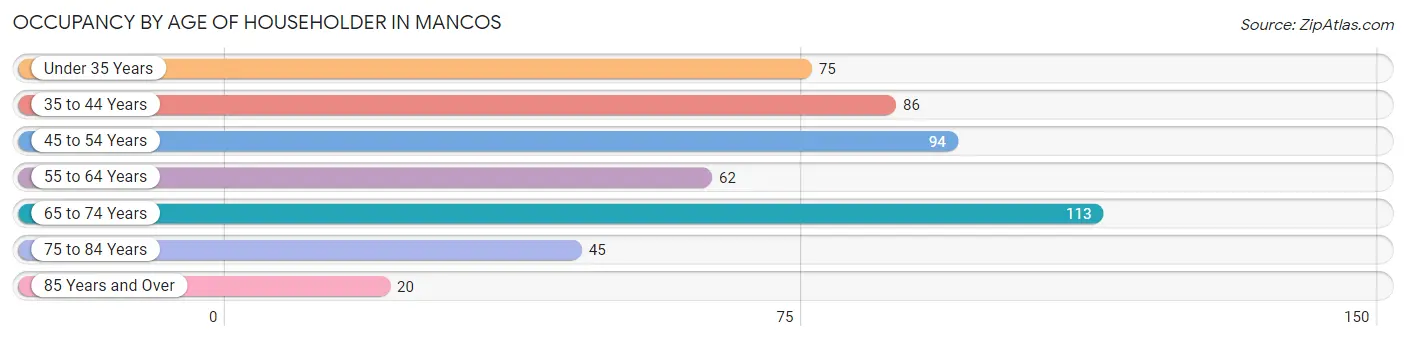
| Age Bracket | # Households | % Households |
| Under 35 Years | 75 | 15.1% |
| 35 to 44 Years | 86 | 17.4% |
| 45 to 54 Years | 94 | 19.0% |
| 55 to 64 Years | 62 | 12.5% |
| 65 to 74 Years | 113 | 22.8% |
| 75 to 84 Years | 45 | 9.1% |
| 85 Years and Over | 20 | 4.0% |
| Total | 495 | 100.0% |
Housing Finances in Mancos
Median Income by Occupancy in Mancos
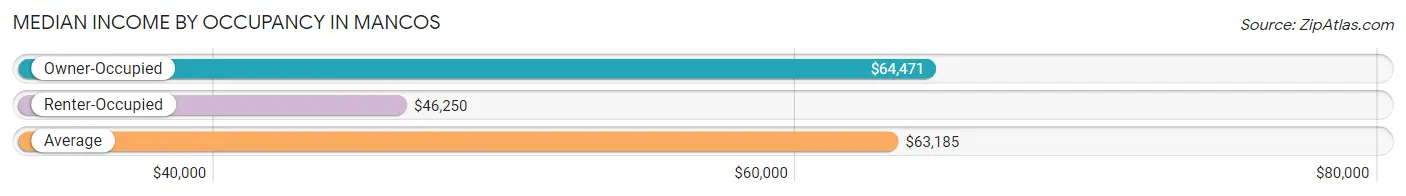
| Occupancy Type | # Households | Median Income |
| Owner-Occupied | 373 (75.3%) | $64,471 |
| Renter-Occupied | 122 (24.6%) | $46,250 |
| Average | 495 (100.0%) | $63,185 |
Occupancy by Householder Income Bracket in Mancos
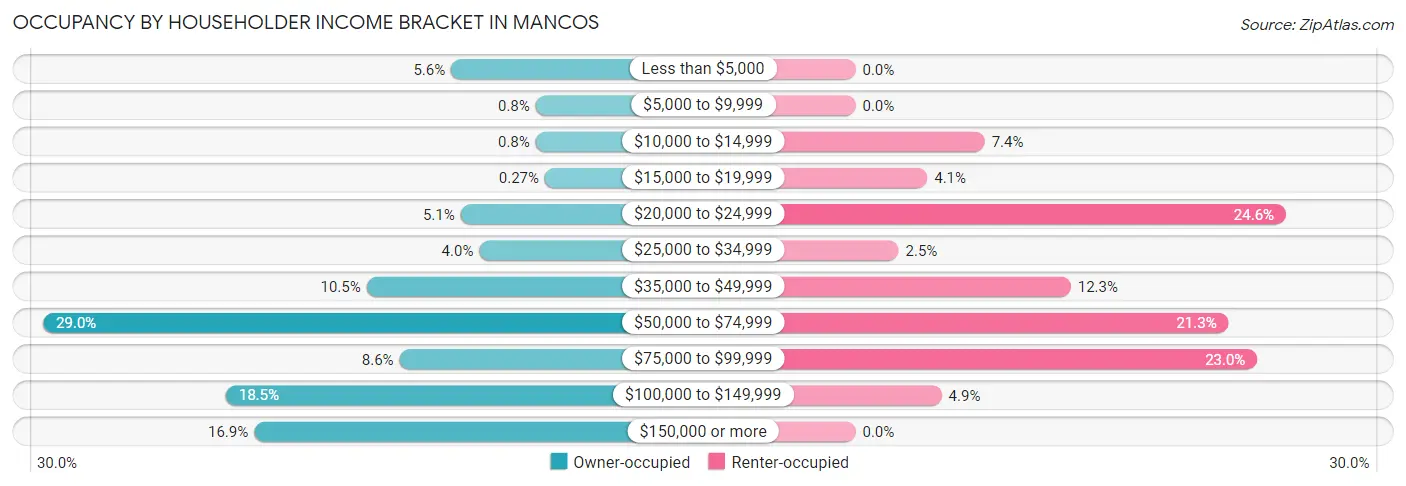
| Income Bracket | Owner-occupied | Renter-occupied |
| Less than $5,000 | 21 (5.6%) | 0 (0.0%) |
| $5,000 to $9,999 | 3 (0.8%) | 0 (0.0%) |
| $10,000 to $14,999 | 3 (0.8%) | 9 (7.4%) |
| $15,000 to $19,999 | 1 (0.3%) | 5 (4.1%) |
| $20,000 to $24,999 | 19 (5.1%) | 30 (24.6%) |
| $25,000 to $34,999 | 15 (4.0%) | 3 (2.5%) |
| $35,000 to $49,999 | 39 (10.5%) | 15 (12.3%) |
| $50,000 to $74,999 | 108 (28.9%) | 26 (21.3%) |
| $75,000 to $99,999 | 32 (8.6%) | 28 (23.0%) |
| $100,000 to $149,999 | 69 (18.5%) | 6 (4.9%) |
| $150,000 or more | 63 (16.9%) | 0 (0.0%) |
| Total | 373 (100.0%) | 122 (100.0%) |
Monthly Housing Cost Tiers in Mancos
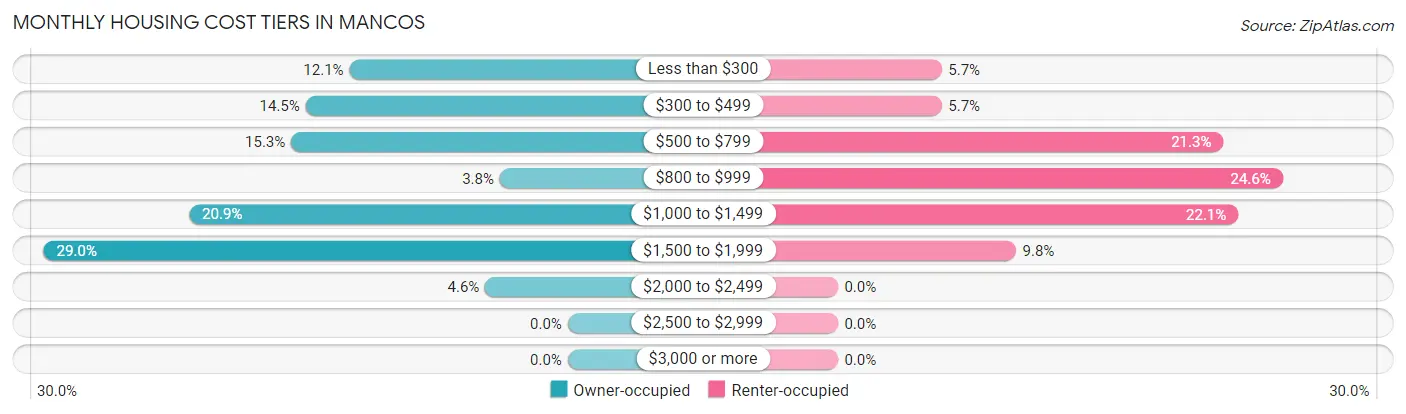
| Monthly Cost | Owner-occupied | Renter-occupied |
| Less than $300 | 45 (12.1%) | 7 (5.7%) |
| $300 to $499 | 54 (14.5%) | 7 (5.7%) |
| $500 to $799 | 57 (15.3%) | 26 (21.3%) |
| $800 to $999 | 14 (3.7%) | 30 (24.6%) |
| $1,000 to $1,499 | 78 (20.9%) | 27 (22.1%) |
| $1,500 to $1,999 | 108 (28.9%) | 12 (9.8%) |
| $2,000 to $2,499 | 17 (4.6%) | 0 (0.0%) |
| $2,500 to $2,999 | 0 (0.0%) | 0 (0.0%) |
| $3,000 or more | 0 (0.0%) | 0 (0.0%) |
| Total | 373 (100.0%) | 122 (100.0%) |
Physical Housing Characteristics in Mancos
Housing Structures in Mancos
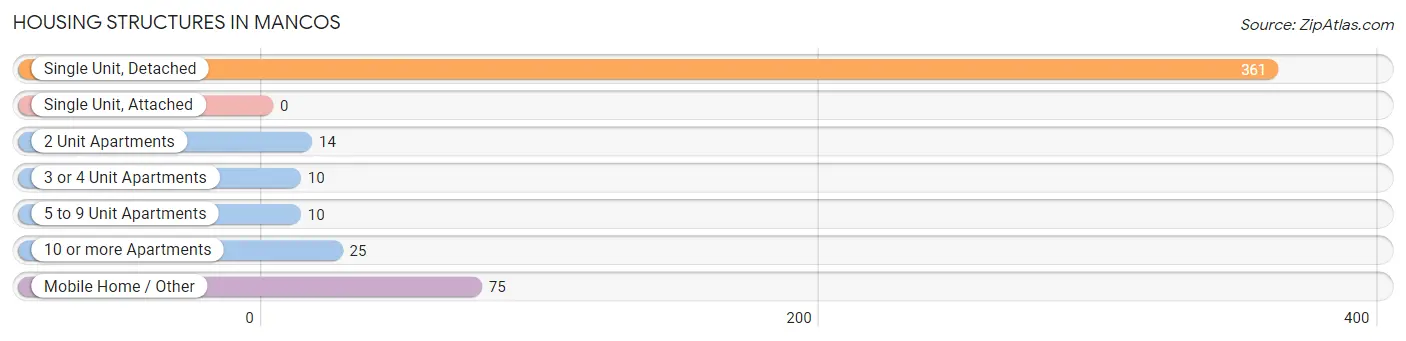
| Structure Type | # Housing Units | % Housing Units |
| Single Unit, Detached | 361 | 72.9% |
| Single Unit, Attached | 0 | 0.0% |
| 2 Unit Apartments | 14 | 2.8% |
| 3 or 4 Unit Apartments | 10 | 2.0% |
| 5 to 9 Unit Apartments | 10 | 2.0% |
| 10 or more Apartments | 25 | 5.1% |
| Mobile Home / Other | 75 | 15.1% |
| Total | 495 | 100.0% |
Housing Structures by Occupancy in Mancos
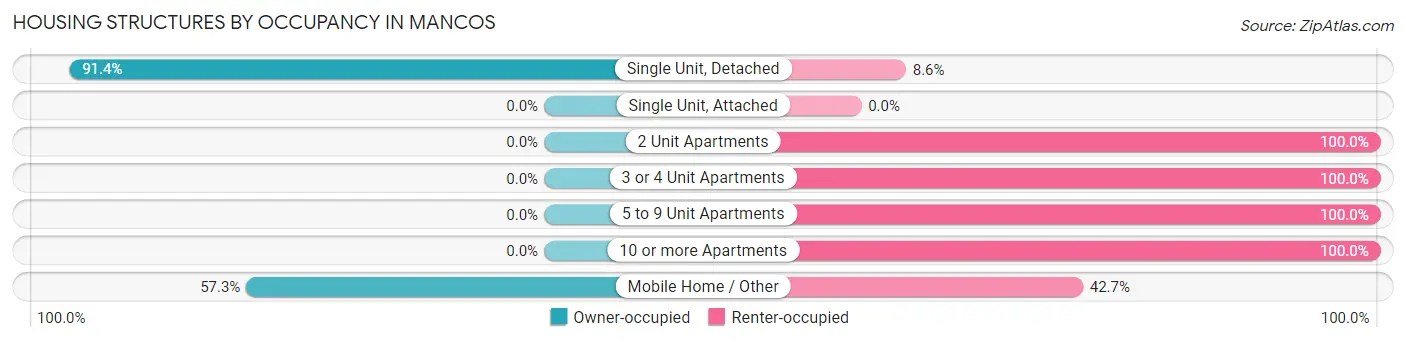
| Structure Type | Owner-occupied | Renter-occupied |
| Single Unit, Detached | 330 (91.4%) | 31 (8.6%) |
| Single Unit, Attached | 0 (0.0%) | 0 (0.0%) |
| 2 Unit Apartments | 0 (0.0%) | 14 (100.0%) |
| 3 or 4 Unit Apartments | 0 (0.0%) | 10 (100.0%) |
| 5 to 9 Unit Apartments | 0 (0.0%) | 10 (100.0%) |
| 10 or more Apartments | 0 (0.0%) | 25 (100.0%) |
| Mobile Home / Other | 43 (57.3%) | 32 (42.7%) |
| Total | 373 (75.3%) | 122 (24.6%) |
Housing Structures by Number of Rooms in Mancos
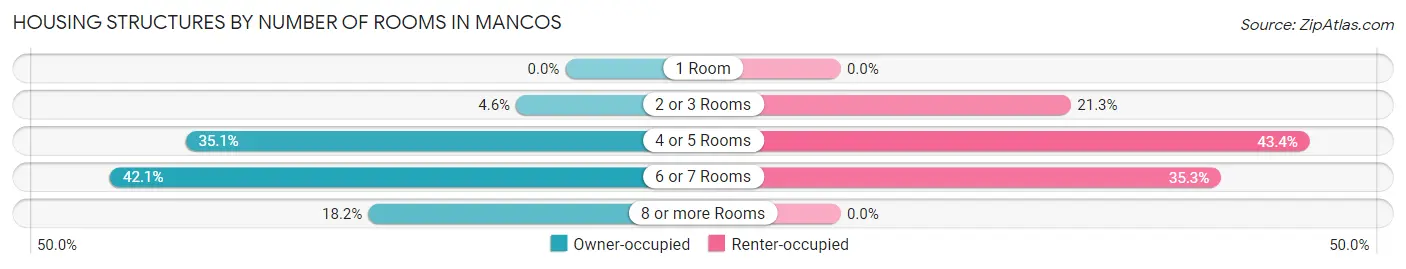
| Number of Rooms | Owner-occupied | Renter-occupied |
| 1 Room | 0 (0.0%) | 0 (0.0%) |
| 2 or 3 Rooms | 17 (4.6%) | 26 (21.3%) |
| 4 or 5 Rooms | 131 (35.1%) | 53 (43.4%) |
| 6 or 7 Rooms | 157 (42.1%) | 43 (35.2%) |
| 8 or more Rooms | 68 (18.2%) | 0 (0.0%) |
| Total | 373 (100.0%) | 122 (100.0%) |
Housing Structure by Heating Type in Mancos
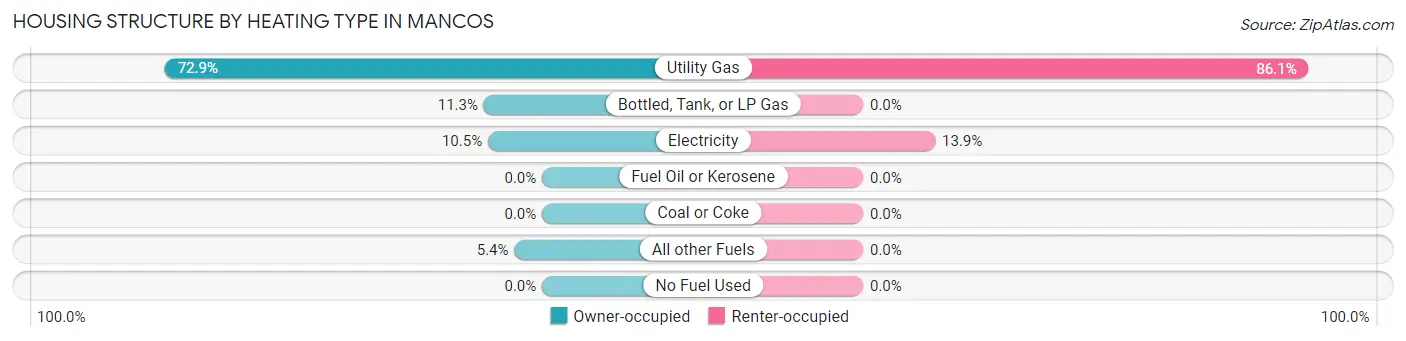
| Heating Type | Owner-occupied | Renter-occupied |
| Utility Gas | 272 (72.9%) | 105 (86.1%) |
| Bottled, Tank, or LP Gas | 42 (11.3%) | 0 (0.0%) |
| Electricity | 39 (10.5%) | 17 (13.9%) |
| Fuel Oil or Kerosene | 0 (0.0%) | 0 (0.0%) |
| Coal or Coke | 0 (0.0%) | 0 (0.0%) |
| All other Fuels | 20 (5.4%) | 0 (0.0%) |
| No Fuel Used | 0 (0.0%) | 0 (0.0%) |
| Total | 373 (100.0%) | 122 (100.0%) |
Household Vehicle Usage in Mancos
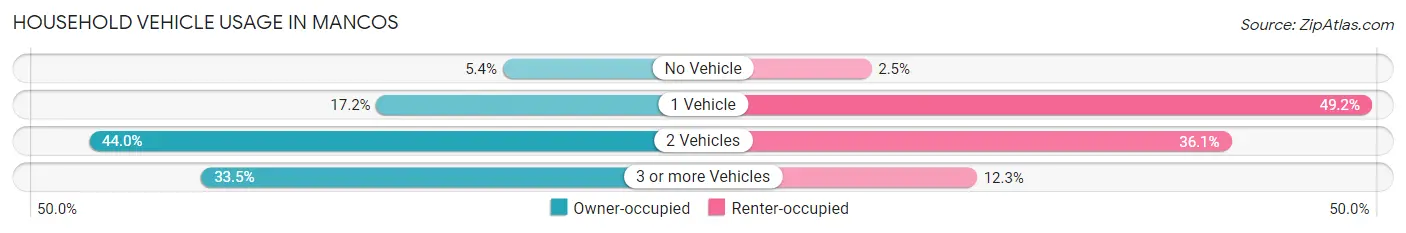
| Vehicles per Household | Owner-occupied | Renter-occupied |
| No Vehicle | 20 (5.4%) | 3 (2.5%) |
| 1 Vehicle | 64 (17.2%) | 60 (49.2%) |
| 2 Vehicles | 164 (44.0%) | 44 (36.1%) |
| 3 or more Vehicles | 125 (33.5%) | 15 (12.3%) |
| Total | 373 (100.0%) | 122 (100.0%) |
Real Estate & Mortgages in Mancos
Real Estate and Mortgage Overview in Mancos
| Characteristic | Without Mortgage | With Mortgage |
| Housing Units | 144 | 229 |
| Median Property Value | $325,000 | $271,100 |
| Median Household Income | $53,750 | $47 |
| Monthly Housing Costs | $344 | $0 |
| Real Estate Taxes | $1,189 | $0 |
Property Value by Mortgage Status in Mancos
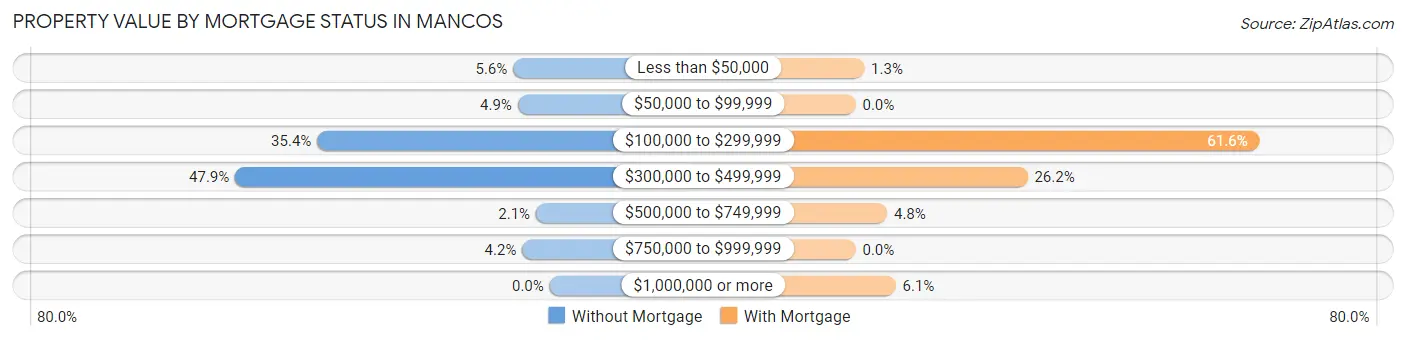
| Property Value | Without Mortgage | With Mortgage |
| Less than $50,000 | 8 (5.6%) | 3 (1.3%) |
| $50,000 to $99,999 | 7 (4.9%) | 0 (0.0%) |
| $100,000 to $299,999 | 51 (35.4%) | 141 (61.6%) |
| $300,000 to $499,999 | 69 (47.9%) | 60 (26.2%) |
| $500,000 to $749,999 | 3 (2.1%) | 11 (4.8%) |
| $750,000 to $999,999 | 6 (4.2%) | 0 (0.0%) |
| $1,000,000 or more | 0 (0.0%) | 14 (6.1%) |
| Total | 144 (100.0%) | 229 (100.0%) |
Household Income by Mortgage Status in Mancos
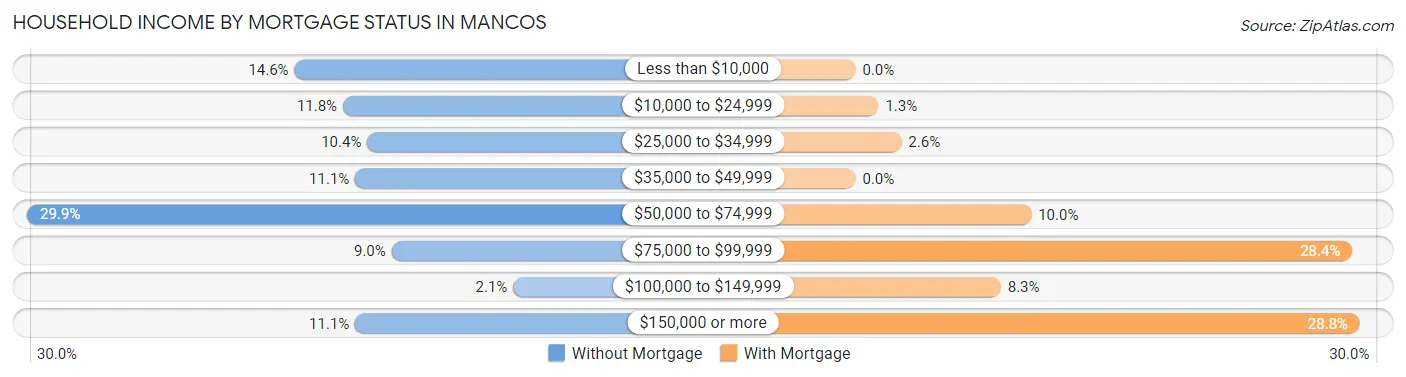
| Household Income | Without Mortgage | With Mortgage |
| Less than $10,000 | 21 (14.6%) | 0 (0.0%) |
| $10,000 to $24,999 | 17 (11.8%) | 3 (1.3%) |
| $25,000 to $34,999 | 15 (10.4%) | 6 (2.6%) |
| $35,000 to $49,999 | 16 (11.1%) | 0 (0.0%) |
| $50,000 to $74,999 | 43 (29.9%) | 23 (10.0%) |
| $75,000 to $99,999 | 13 (9.0%) | 65 (28.4%) |
| $100,000 to $149,999 | 3 (2.1%) | 19 (8.3%) |
| $150,000 or more | 16 (11.1%) | 66 (28.8%) |
| Total | 144 (100.0%) | 229 (100.0%) |
Property Value to Household Income Ratio in Mancos
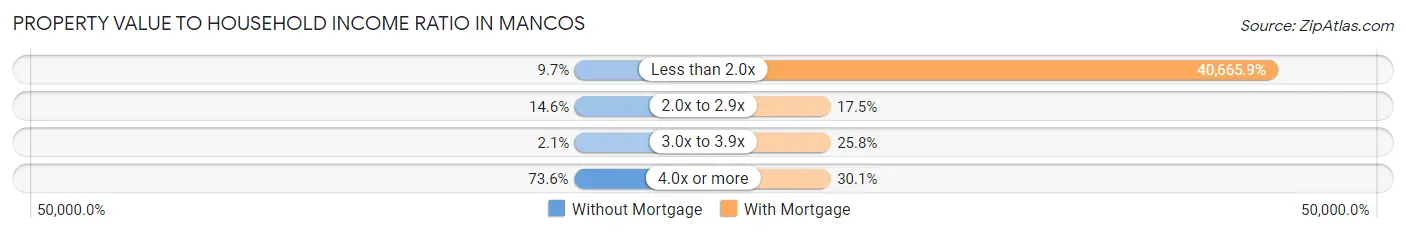
| Value-to-Income Ratio | Without Mortgage | With Mortgage |
| Less than 2.0x | 14 (9.7%) | 93,125 (40,665.9%) |
| 2.0x to 2.9x | 21 (14.6%) | 40 (17.5%) |
| 3.0x to 3.9x | 3 (2.1%) | 59 (25.8%) |
| 4.0x or more | 106 (73.6%) | 69 (30.1%) |
| Total | 144 (100.0%) | 229 (100.0%) |
Real Estate Taxes by Mortgage Status in Mancos
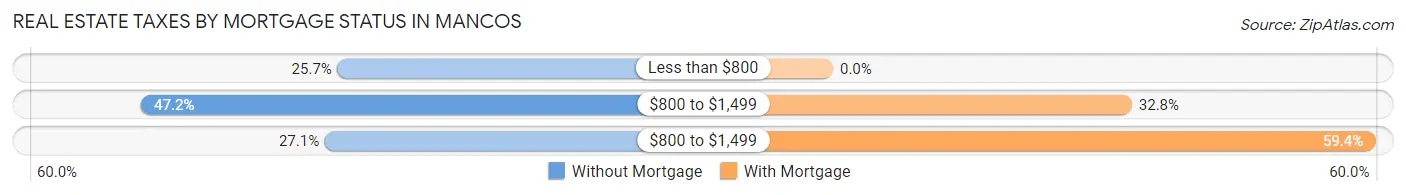
| Property Taxes | Without Mortgage | With Mortgage |
| Less than $800 | 37 (25.7%) | 0 (0.0%) |
| $800 to $1,499 | 68 (47.2%) | 75 (32.8%) |
| $800 to $1,499 | 39 (27.1%) | 136 (59.4%) |
| Total | 144 (100.0%) | 229 (100.0%) |
Health & Disability in Mancos
Health Insurance Coverage by Age in Mancos
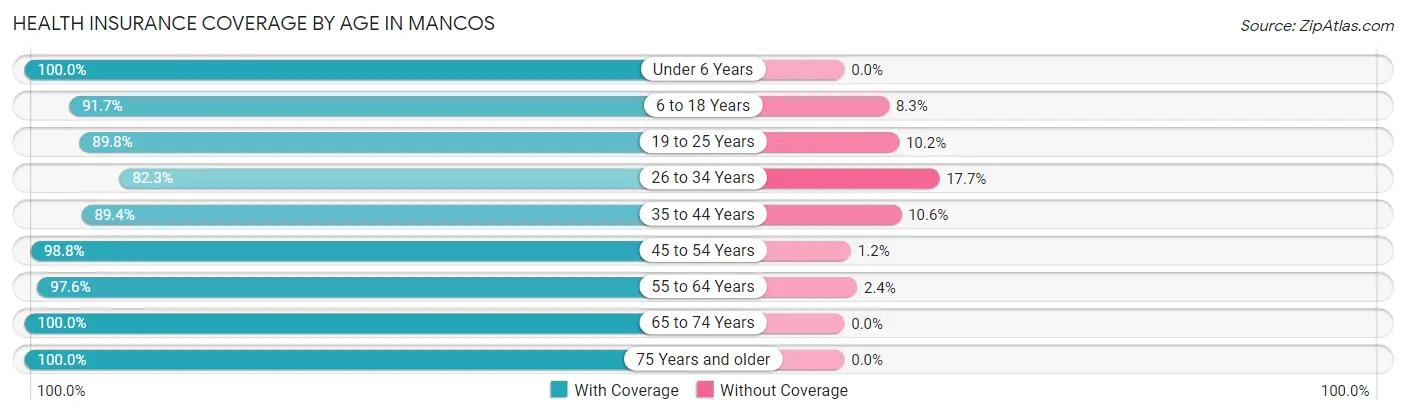
| Age Bracket | With Coverage | Without Coverage |
| Under 6 Years | 80 (100.0%) | 0 (0.0%) |
| 6 to 18 Years | 99 (91.7%) | 9 (8.3%) |
| 19 to 25 Years | 44 (89.8%) | 5 (10.2%) |
| 26 to 34 Years | 93 (82.3%) | 20 (17.7%) |
| 35 to 44 Years | 160 (89.4%) | 19 (10.6%) |
| 45 to 54 Years | 161 (98.8%) | 2 (1.2%) |
| 55 to 64 Years | 123 (97.6%) | 3 (2.4%) |
| 65 to 74 Years | 178 (100.0%) | 0 (0.0%) |
| 75 Years and older | 69 (100.0%) | 0 (0.0%) |
| Total | 1,007 (94.6%) | 58 (5.4%) |
Health Insurance Coverage by Citizenship Status in Mancos
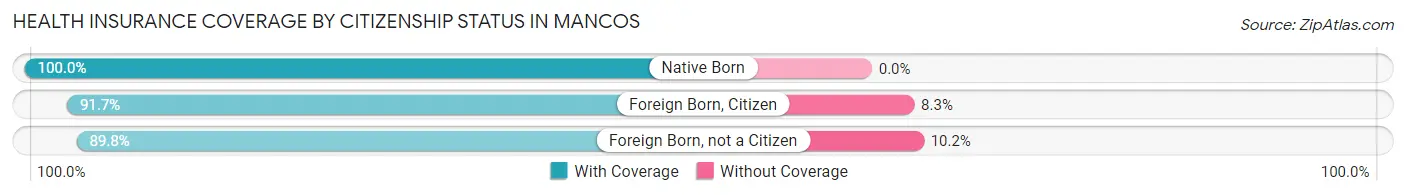
| Citizenship Status | With Coverage | Without Coverage |
| Native Born | 80 (100.0%) | 0 (0.0%) |
| Foreign Born, Citizen | 99 (91.7%) | 9 (8.3%) |
| Foreign Born, not a Citizen | 44 (89.8%) | 5 (10.2%) |
Health Insurance Coverage by Household Income in Mancos
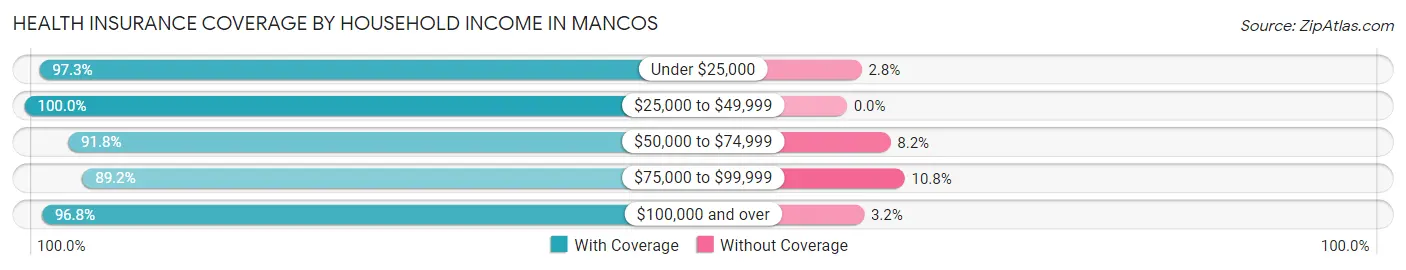
| Household Income | With Coverage | Without Coverage |
| Under $25,000 | 106 (97.3%) | 3 (2.8%) |
| $25,000 to $49,999 | 138 (100.0%) | 0 (0.0%) |
| $50,000 to $74,999 | 259 (91.8%) | 23 (8.2%) |
| $75,000 to $99,999 | 173 (89.2%) | 21 (10.8%) |
| $100,000 and over | 331 (96.8%) | 11 (3.2%) |
Public vs Private Health Insurance Coverage by Age in Mancos
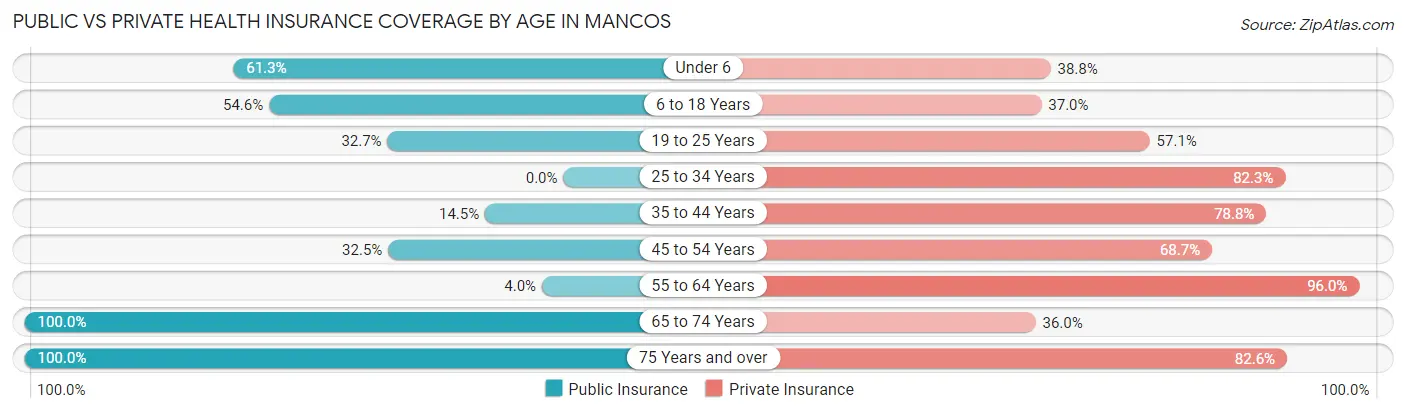
| Age Bracket | Public Insurance | Private Insurance |
| Under 6 | 49 (61.3%) | 31 (38.8%) |
| 6 to 18 Years | 59 (54.6%) | 40 (37.0%) |
| 19 to 25 Years | 16 (32.7%) | 28 (57.1%) |
| 25 to 34 Years | 0 (0.0%) | 93 (82.3%) |
| 35 to 44 Years | 26 (14.5%) | 141 (78.8%) |
| 45 to 54 Years | 53 (32.5%) | 112 (68.7%) |
| 55 to 64 Years | 5 (4.0%) | 121 (96.0%) |
| 65 to 74 Years | 178 (100.0%) | 64 (36.0%) |
| 75 Years and over | 69 (100.0%) | 57 (82.6%) |
| Total | 455 (42.7%) | 687 (64.5%) |
Disability Status by Sex by Age in Mancos
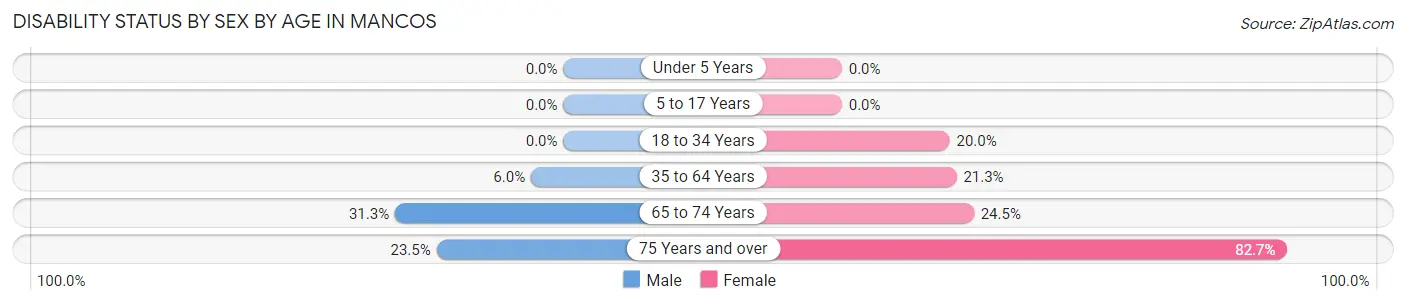
| Age Bracket | Male | Female |
| Under 5 Years | 0 (0.0%) | 0 (0.0%) |
| 5 to 17 Years | 0 (0.0%) | 0 (0.0%) |
| 18 to 34 Years | 0 (0.0%) | 16 (20.0%) |
| 35 to 64 Years | 14 (6.0%) | 50 (21.3%) |
| 65 to 74 Years | 25 (31.2%) | 24 (24.5%) |
| 75 Years and over | 4 (23.5%) | 43 (82.7%) |
Disability Class by Sex by Age in Mancos
Disability Class: Hearing Difficulty
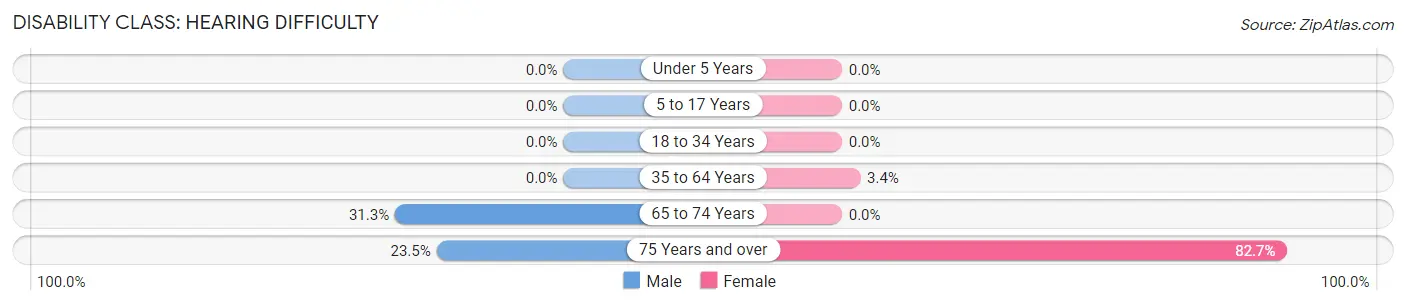
| Age Bracket | Male | Female |
| Under 5 Years | 0 (0.0%) | 0 (0.0%) |
| 5 to 17 Years | 0 (0.0%) | 0 (0.0%) |
| 18 to 34 Years | 0 (0.0%) | 0 (0.0%) |
| 35 to 64 Years | 0 (0.0%) | 8 (3.4%) |
| 65 to 74 Years | 25 (31.2%) | 0 (0.0%) |
| 75 Years and over | 4 (23.5%) | 43 (82.7%) |
Disability Class: Vision Difficulty
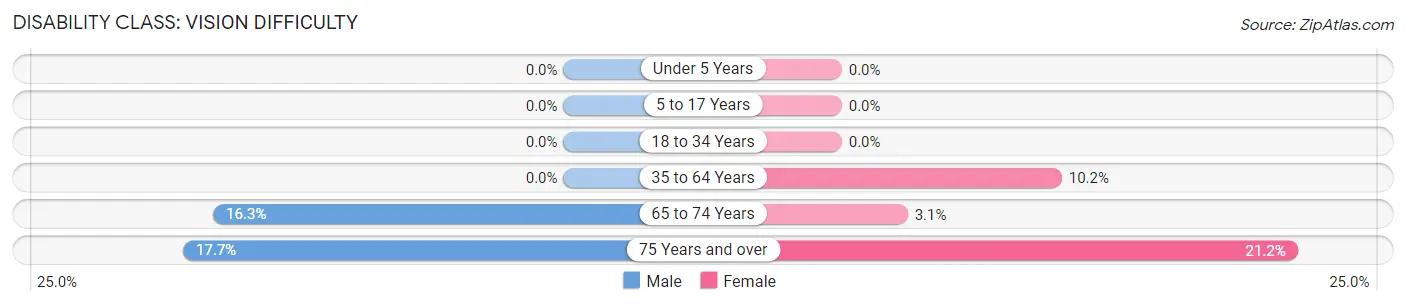
| Age Bracket | Male | Female |
| Under 5 Years | 0 (0.0%) | 0 (0.0%) |
| 5 to 17 Years | 0 (0.0%) | 0 (0.0%) |
| 18 to 34 Years | 0 (0.0%) | 0 (0.0%) |
| 35 to 64 Years | 0 (0.0%) | 24 (10.2%) |
| 65 to 74 Years | 13 (16.3%) | 3 (3.1%) |
| 75 Years and over | 3 (17.6%) | 11 (21.1%) |
Disability Class: Cognitive Difficulty
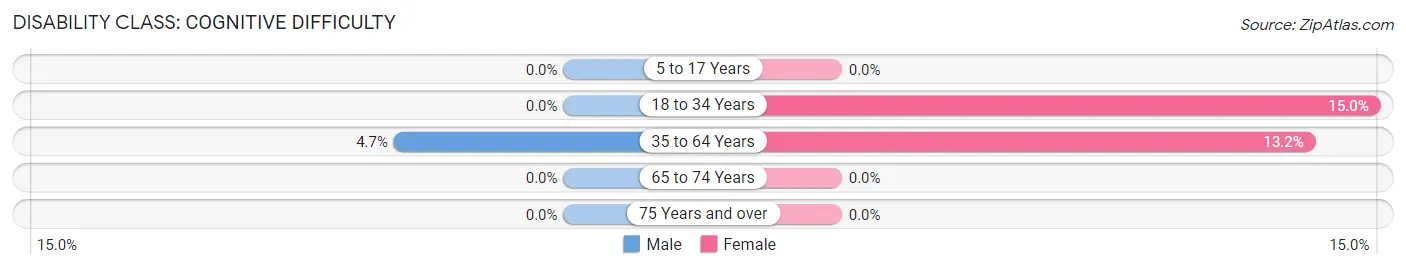
| Age Bracket | Male | Female |
| 5 to 17 Years | 0 (0.0%) | 0 (0.0%) |
| 18 to 34 Years | 0 (0.0%) | 12 (15.0%) |
| 35 to 64 Years | 11 (4.7%) | 31 (13.2%) |
| 65 to 74 Years | 0 (0.0%) | 0 (0.0%) |
| 75 Years and over | 0 (0.0%) | 0 (0.0%) |
Disability Class: Ambulatory Difficulty
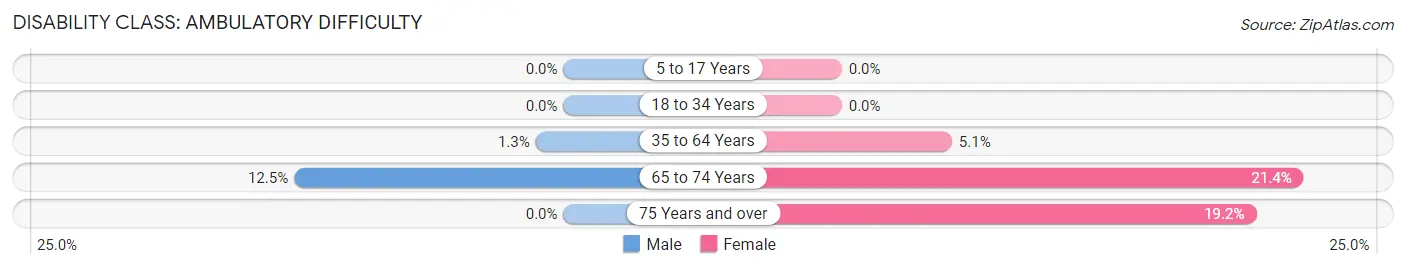
| Age Bracket | Male | Female |
| 5 to 17 Years | 0 (0.0%) | 0 (0.0%) |
| 18 to 34 Years | 0 (0.0%) | 0 (0.0%) |
| 35 to 64 Years | 3 (1.3%) | 12 (5.1%) |
| 65 to 74 Years | 10 (12.5%) | 21 (21.4%) |
| 75 Years and over | 0 (0.0%) | 10 (19.2%) |
Disability Class: Self-Care Difficulty
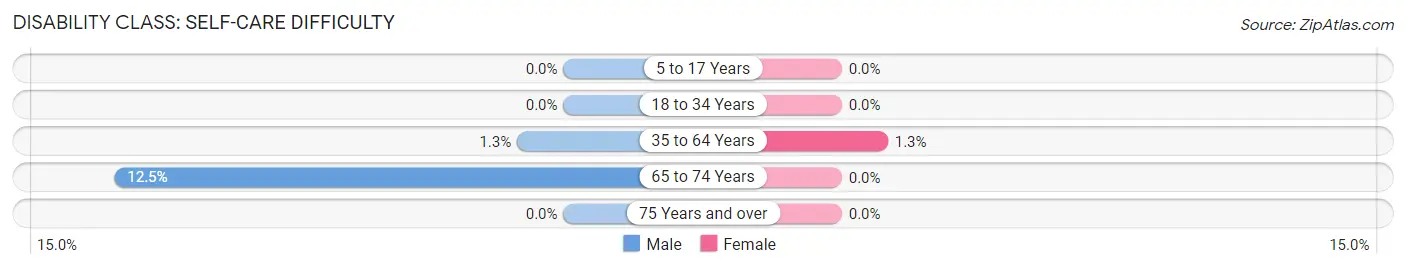
| Age Bracket | Male | Female |
| 5 to 17 Years | 0 (0.0%) | 0 (0.0%) |
| 18 to 34 Years | 0 (0.0%) | 0 (0.0%) |
| 35 to 64 Years | 3 (1.3%) | 3 (1.3%) |
| 65 to 74 Years | 10 (12.5%) | 0 (0.0%) |
| 75 Years and over | 0 (0.0%) | 0 (0.0%) |
Technology Access in Mancos
Computing Device Access in Mancos
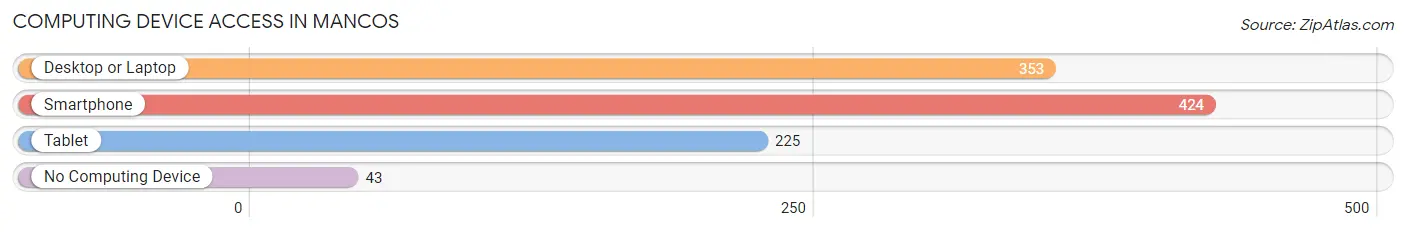
| Device Type | # Households | % Households |
| Desktop or Laptop | 353 | 71.3% |
| Smartphone | 424 | 85.7% |
| Tablet | 225 | 45.5% |
| No Computing Device | 43 | 8.7% |
| Total | 495 | 100.0% |
Internet Access in Mancos
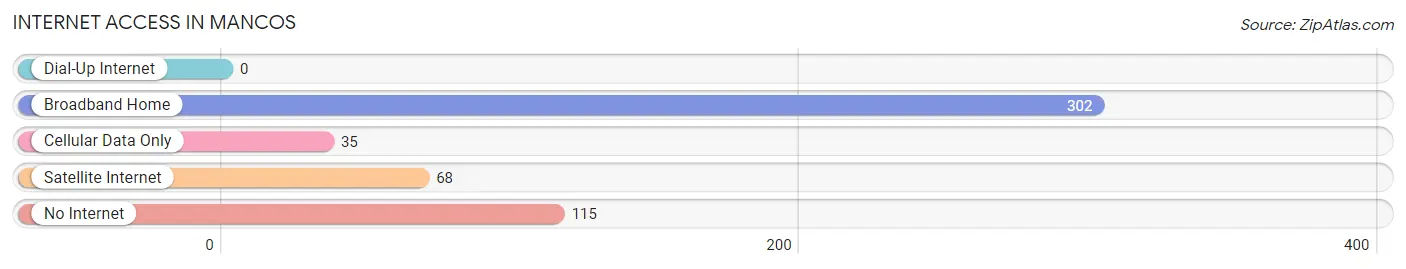
| Internet Type | # Households | % Households |
| Dial-Up Internet | 0 | 0.0% |
| Broadband Home | 302 | 61.0% |
| Cellular Data Only | 35 | 7.1% |
| Satellite Internet | 68 | 13.7% |
| No Internet | 115 | 23.2% |
| Total | 495 | 100.0% |
Mancos Summary
Mancos is a small town located in Montezuma County, Colorado, United States. It is situated in the southwestern part of the state, approximately 25 miles west of Durango. The town was founded in 1894 and has a population of 1,335 as of the 2010 census.
History
Mancos was founded in 1894 by a group of settlers from the nearby town of Mancos. The settlers were looking for a place to settle and start a new life. The town was named after the nearby Mancos River, which was named after the Ute Indian word for “big water”. The town was originally a farming and ranching community, but it soon became a center for the mining industry. The town was also home to a number of saloons, hotels, and other businesses.
In the early 1900s, the town was home to a number of coal mines, which provided employment for many of the town’s residents. The coal mines were eventually closed in the 1950s, and the town’s economy shifted to tourism and recreation. The town is now home to a number of art galleries, restaurants, and other businesses.
Geography
Mancos is located in southwestern Colorado, approximately 25 miles west of Durango. The town is situated in the Mancos Valley, which is surrounded by the San Juan Mountains to the east and the La Plata Mountains to the west. The town is located at an elevation of 6,845 feet above sea level.
The climate in Mancos is semi-arid, with hot summers and cold winters. The average annual temperature is 52 degrees Fahrenheit, and the average annual precipitation is 16.5 inches.
Economy
The economy of Mancos is largely based on tourism and recreation. The town is home to a number of art galleries, restaurants, and other businesses that cater to tourists. The town is also home to a number of outdoor recreation activities, such as fishing, hunting, camping, and hiking.
The town is also home to a number of small businesses, such as retail stores, restaurants, and other services. The town is also home to a number of manufacturing businesses, such as furniture makers and woodworking shops.
Demographics
As of the 2010 census, the population of Mancos was 1,335. The racial makeup of the town was 94.3% White, 0.7% African American, 0.7% Native American, 0.3% Asian, 0.1% Pacific Islander, 1.2% from other races, and 2.9% from two or more races. Hispanic or Latino of any race were 5.2% of the population.
The median income for a household in Mancos was $37,500, and the median income for a family was $45,000. The per capita income for the town was $20,845. About 11.2% of families and 14.2% of the population were below the poverty line, including 18.2% of those under age 18 and 8.3% of those age 65 or over.
Common Questions
What is Per Capita Income in Mancos?
Per Capita income in Mancos is $34,914.
What is the Median Family Income in Mancos?
Median Family Income in Mancos is $84,545.
What is the Median Household income in Mancos?
Median Household Income in Mancos is $63,185.
What is Income or Wage Gap in Mancos?
Income or Wage Gap in Mancos is 32.6%.
Women in Mancos earn 67.4 cents for every dollar earned by a man.
What is Inequality or Gini Index in Mancos?
Inequality or Gini Index in Mancos is 0.39.
What is the Total Population of Mancos?
Total Population of Mancos is 1,121.
What is the Total Male Population of Mancos?
Total Male Population of Mancos is 532.
What is the Total Female Population of Mancos?
Total Female Population of Mancos is 589.
What is the Ratio of Males per 100 Females in Mancos?
There are 90.32 Males per 100 Females in Mancos.
What is the Ratio of Females per 100 Males in Mancos?
There are 110.71 Females per 100 Males in Mancos.
What is the Median Population Age in Mancos?
Median Population Age in Mancos is 46.5 Years.
What is the Average Family Size in Mancos
Average Family Size in Mancos is 2.8 People.
What is the Average Household Size in Mancos
Average Household Size in Mancos is 2.1 People.
How Large is the Labor Force in Mancos?
There are 589 People in the Labor Forcein in Mancos.
What is the Percentage of People in the Labor Force in Mancos?
62.0% of People are in the Labor Force in Mancos.
What is the Unemployment Rate in Mancos?
Unemployment Rate in Mancos is 1.5%.