Loma, CO Map & Demographics
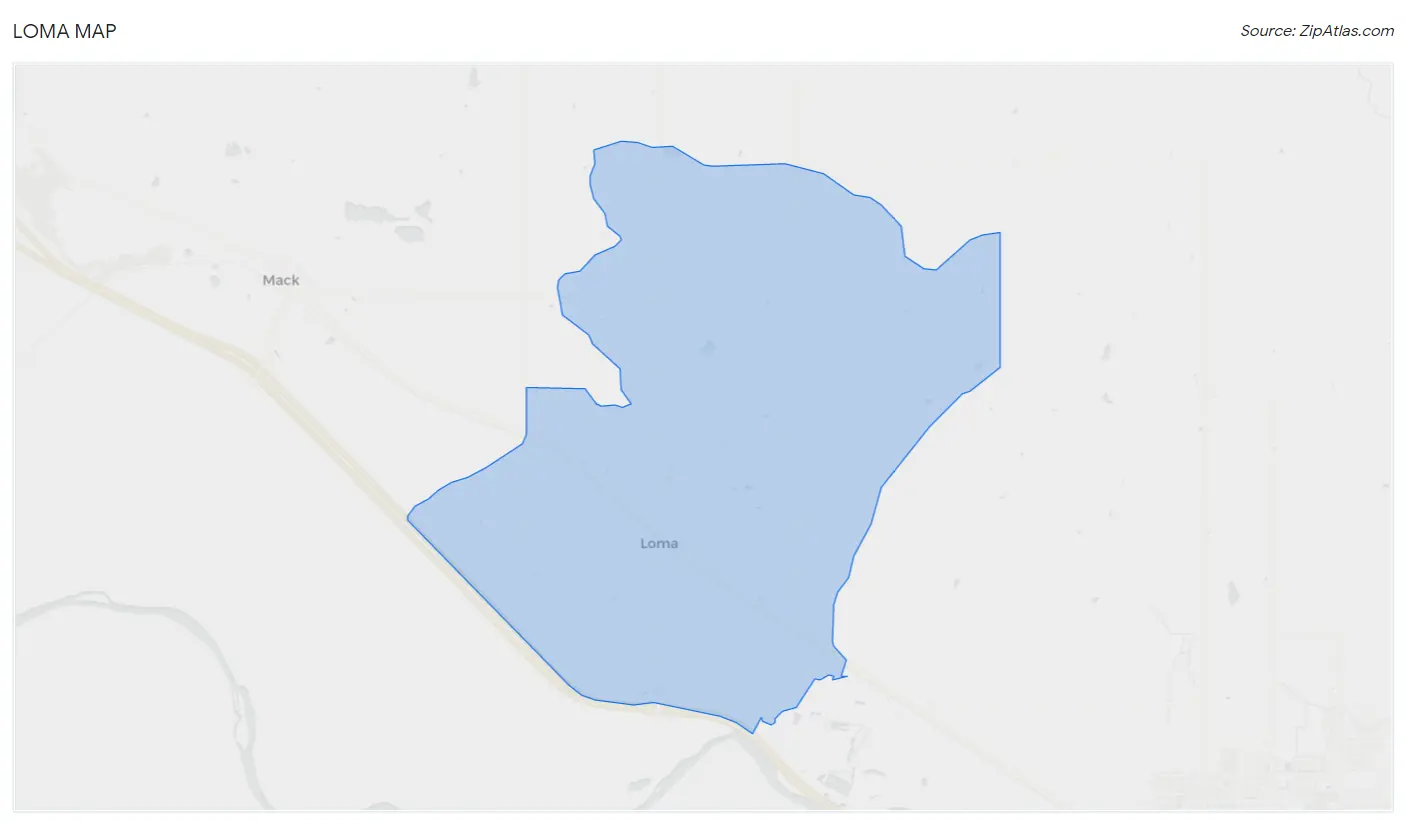
Loma Map
Loma Overview
$36,372
PER CAPITA INCOME
$138,528
AVG FAMILY INCOME
$137,995
AVG HOUSEHOLD INCOME
0.28
INEQUALITY / GINI INDEX
1,481
TOTAL POPULATION
595
MALE POPULATION
886
FEMALE POPULATION
67.16
MALES / 100 FEMALES
148.91
FEMALES / 100 MALES
20.6
MEDIAN AGE
3.2
AVG FAMILY SIZE
4.2
AVG HOUSEHOLD SIZE
864
LABOR FORCE [ PEOPLE ]
87.6%
PERCENT IN LABOR FORCE
1.5%
UNEMPLOYMENT RATE
Loma Zip Codes
Loma Area Codes
Income in Loma
Income Overview in Loma
Per Capita Income in Loma is $36,372, while median incomes of families and households are $138,528 and $137,995 respectively.
| Characteristic | Number | Measure |
| Per Capita Income | 1,481 | $36,372 |
| Median Family Income | 257 | $138,528 |
| Mean Family Income | 257 | $154,560 |
| Median Household Income | 350 | $137,995 |
| Mean Household Income | 350 | $136,791 |
| Income Deficit | 257 | $0 |
| Wage / Income Gap (%) | 1,481 | 0.00% |
| Wage / Income Gap ($) | 1,481 | 100.00¢ per $1 |
| Gini / Inequality Index | 1,481 | 0.28 |
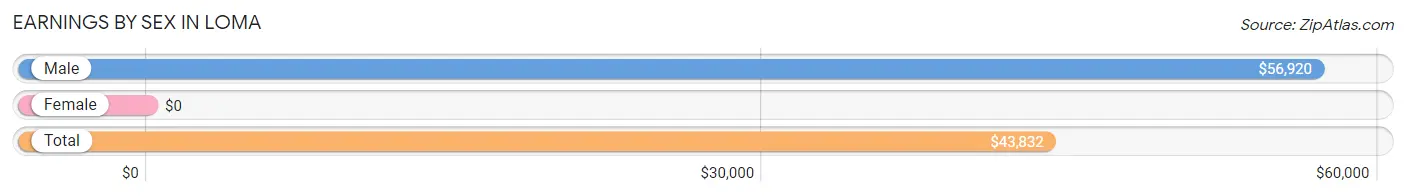
Earnings by Sex in Loma
| Sex | Number | Average Earnings |
| Male | 427 (48.1%) | $56,920 |
| Female | 460 (51.9%) | $0 |
| Total | 887 (100.0%) | $43,832 |
Earnings by Sex by Income Bracket in Loma
The most common earnings brackets in Loma are $100,000+ for men (142 | 33.3%) and $50,000 to $54,999 for women (96 | 20.9%).
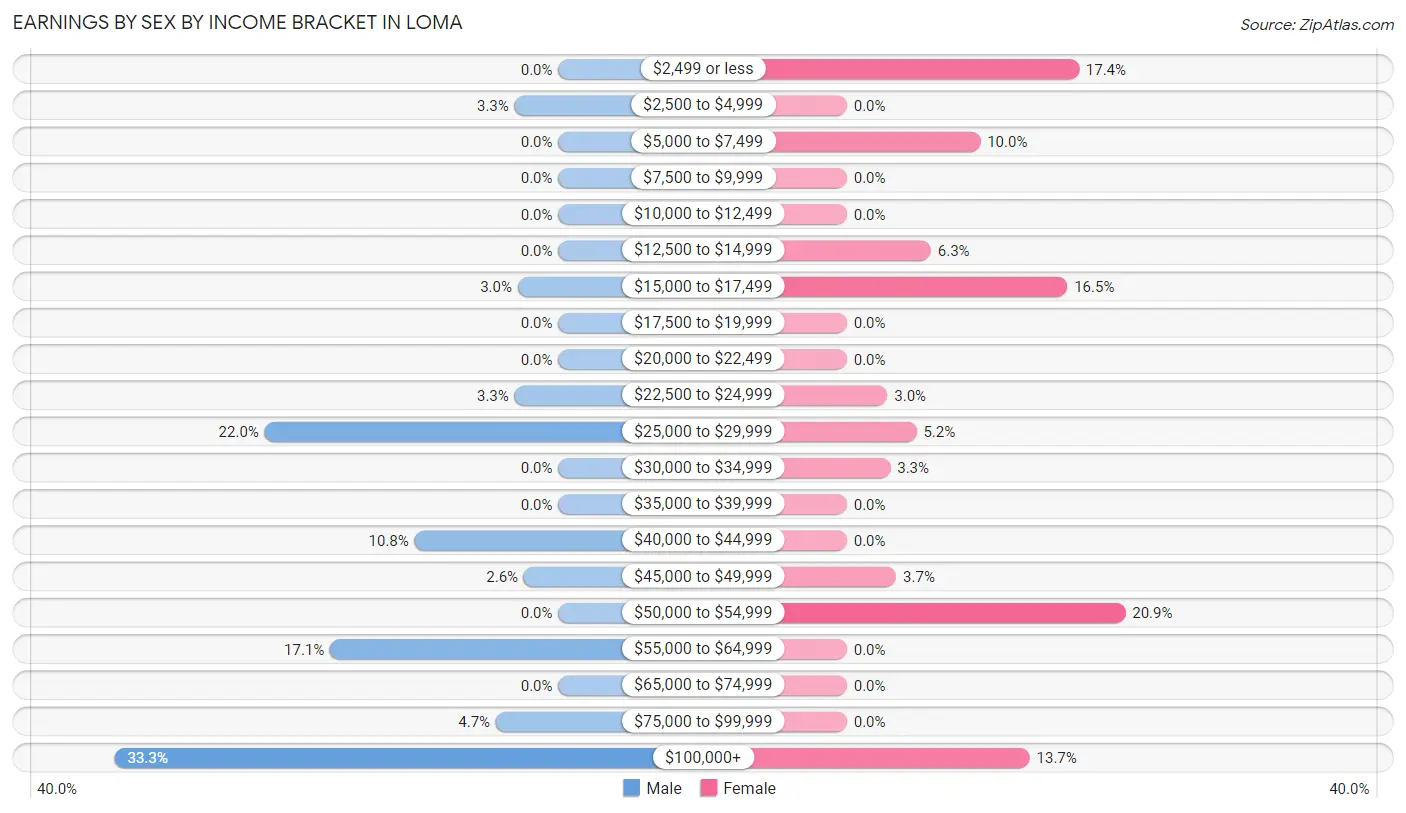
| Income | Male | Female |
| $2,499 or less | 0 (0.0%) | 80 (17.4%) |
| $2,500 to $4,999 | 14 (3.3%) | 0 (0.0%) |
| $5,000 to $7,499 | 0 (0.0%) | 46 (10.0%) |
| $7,500 to $9,999 | 0 (0.0%) | 0 (0.0%) |
| $10,000 to $12,499 | 0 (0.0%) | 0 (0.0%) |
| $12,500 to $14,999 | 0 (0.0%) | 29 (6.3%) |
| $15,000 to $17,499 | 13 (3.0%) | 76 (16.5%) |
| $17,500 to $19,999 | 0 (0.0%) | 0 (0.0%) |
| $20,000 to $22,499 | 0 (0.0%) | 0 (0.0%) |
| $22,500 to $24,999 | 14 (3.3%) | 14 (3.0%) |
| $25,000 to $29,999 | 94 (22.0%) | 24 (5.2%) |
| $30,000 to $34,999 | 0 (0.0%) | 15 (3.3%) |
| $35,000 to $39,999 | 0 (0.0%) | 0 (0.0%) |
| $40,000 to $44,999 | 46 (10.8%) | 0 (0.0%) |
| $45,000 to $49,999 | 11 (2.6%) | 17 (3.7%) |
| $50,000 to $54,999 | 0 (0.0%) | 96 (20.9%) |
| $55,000 to $64,999 | 73 (17.1%) | 0 (0.0%) |
| $65,000 to $74,999 | 0 (0.0%) | 0 (0.0%) |
| $75,000 to $99,999 | 20 (4.7%) | 0 (0.0%) |
| $100,000+ | 142 (33.3%) | 63 (13.7%) |
| Total | 427 (100.0%) | 460 (100.0%) |
Earnings by Sex by Educational Attainment in Loma
Average earnings in Loma are $82,750 for men and $50,078 for women, a difference of 39.5%. Men with an educational attainment of college or associate's degree enjoy the highest average annual earnings of $147,708, while those with high school diploma education earn the least with $128,506. Women with an educational attainment of college or associate's degree earn the most with the average annual earnings of $30,667, while those with college or associate's degree education have the smallest earnings of $30,667.
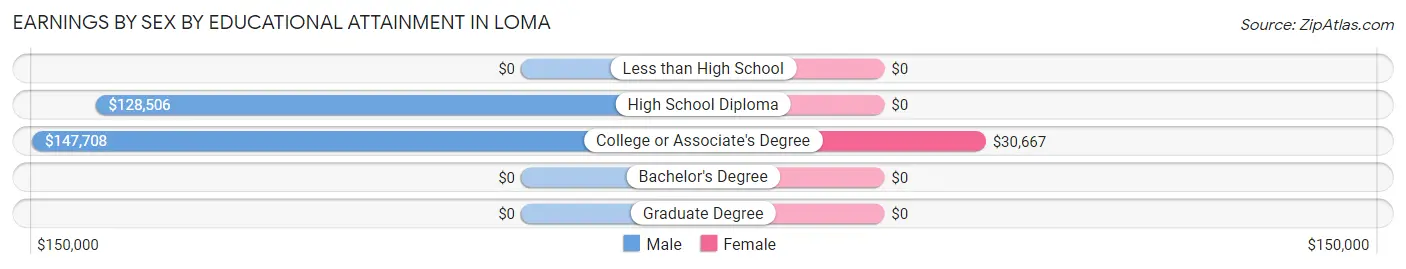
| Educational Attainment | Male Income | Female Income |
| Less than High School | - | - |
| High School Diploma | $128,506 | $0 |
| College or Associate's Degree | $147,708 | $30,667 |
| Bachelor's Degree | - | - |
| Graduate Degree | - | - |
| Total | $82,750 | $50,078 |
Family Income in Loma
Family Income Brackets in Loma
According to the Loma family income data, there are 102 families falling into the $100,000 to $149,999 income range, which is the most common income bracket and makes up 39.7% of all families.
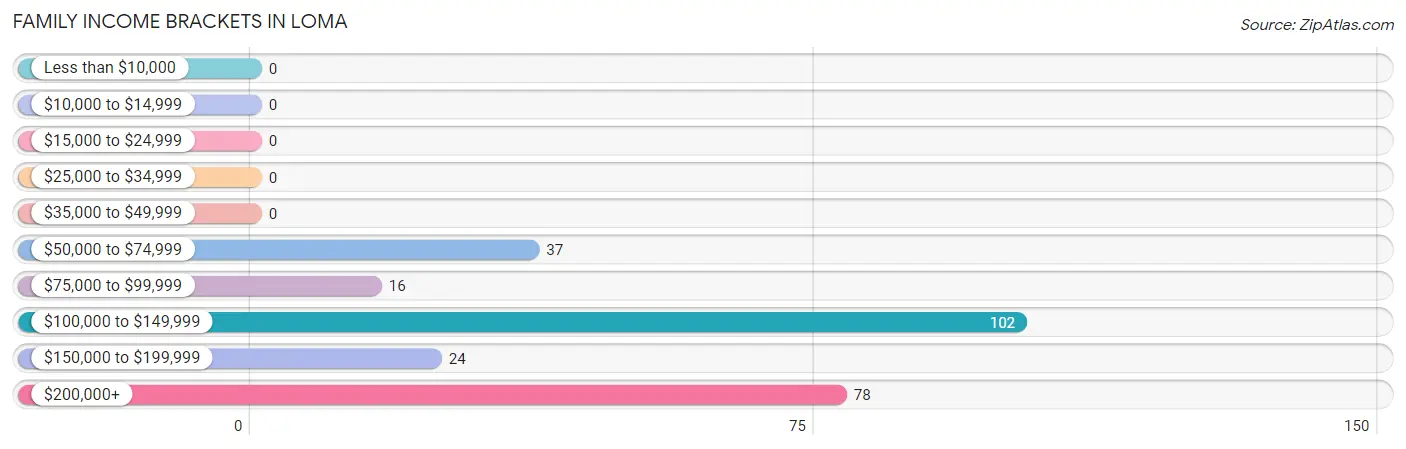
| Income Bracket | # Families | % Families |
| Less than $10,000 | 0 | 0.0% |
| $10,000 to $14,999 | 0 | 0.0% |
| $15,000 to $24,999 | 0 | 0.0% |
| $25,000 to $34,999 | 0 | 0.0% |
| $35,000 to $49,999 | 0 | 0.0% |
| $50,000 to $74,999 | 37 | 14.4% |
| $75,000 to $99,999 | 16 | 6.2% |
| $100,000 to $149,999 | 102 | 39.7% |
| $150,000 to $199,999 | 24 | 9.3% |
| $200,000+ | 78 | 30.4% |
Family Income by Famaliy Size in Loma
2-person families (113 | 44.0%) account for the highest median family income in Loma with $175,885 per family, while 2-person families (113 | 44.0%) have the highest median income of $87,942 per family member.
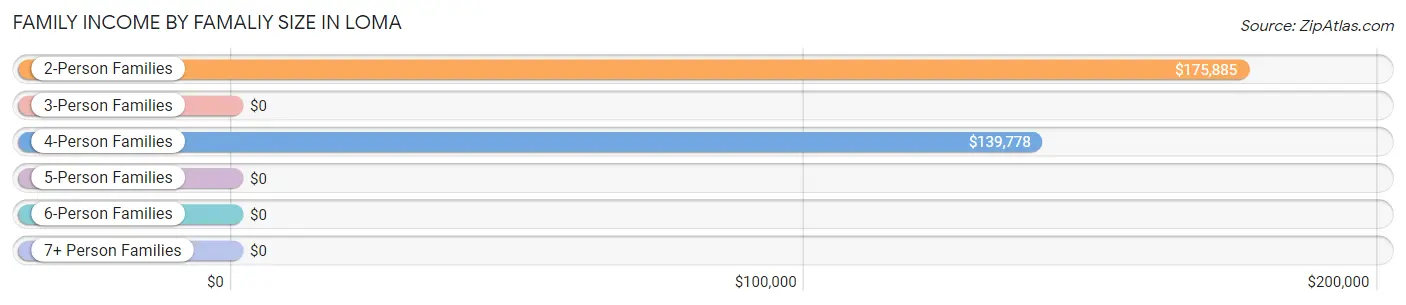
| Income Bracket | # Families | Median Income |
| 2-Person Families | 113 (44.0%) | $175,885 |
| 3-Person Families | 37 (14.4%) | $0 |
| 4-Person Families | 82 (31.9%) | $139,778 |
| 5-Person Families | 25 (9.7%) | $0 |
| 6-Person Families | 0 (0.0%) | $0 |
| 7+ Person Families | 0 (0.0%) | $0 |
| Total | 257 (100.0%) | $138,528 |
Family Income by Number of Earners in Loma
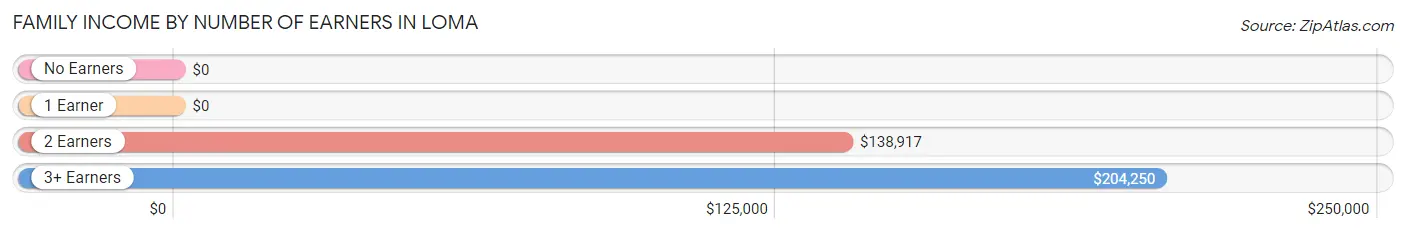
| Number of Earners | # Families | Median Income |
| No Earners | 19 (7.4%) | $0 |
| 1 Earner | 23 (8.9%) | $0 |
| 2 Earners | 169 (65.8%) | $138,917 |
| 3+ Earners | 46 (17.9%) | $204,250 |
| Total | 257 (100.0%) | $138,528 |
Household Income in Loma
Household Income Brackets in Loma
With 148 households falling in the category, the $100,000 to $149,999 income range is the most frequent in Loma, accounting for 42.3% of all households.
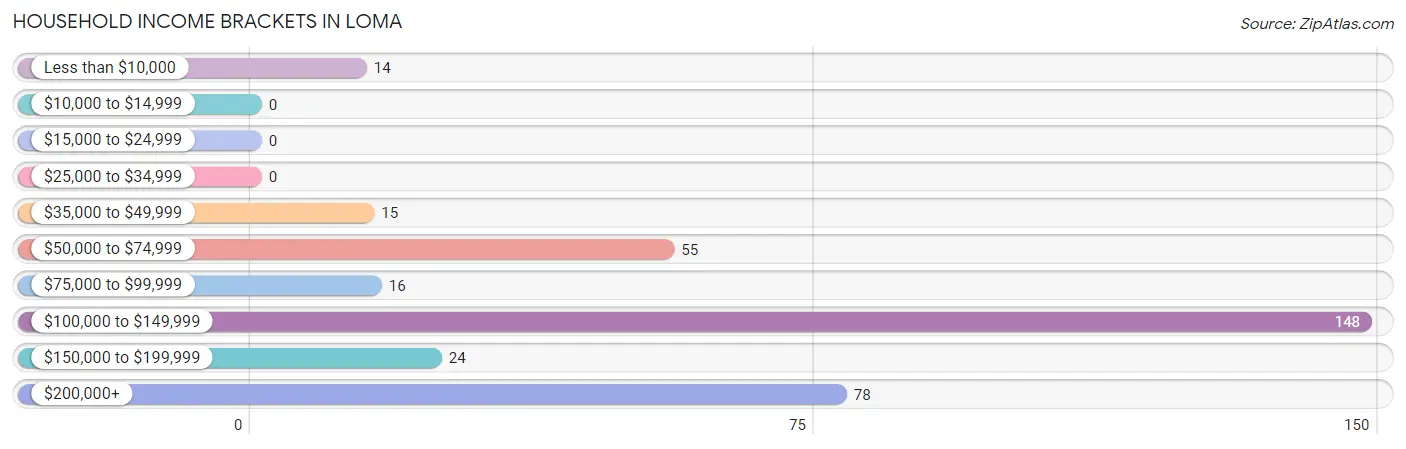
| Income Bracket | # Households | % Households |
| Less than $10,000 | 14 | 4.0% |
| $10,000 to $14,999 | 0 | 0.0% |
| $15,000 to $24,999 | 0 | 0.0% |
| $25,000 to $34,999 | 0 | 0.0% |
| $35,000 to $49,999 | 15 | 4.3% |
| $50,000 to $74,999 | 55 | 15.7% |
| $75,000 to $99,999 | 16 | 4.6% |
| $100,000 to $149,999 | 148 | 42.3% |
| $150,000 to $199,999 | 24 | 6.9% |
| $200,000+ | 78 | 22.3% |
Household Income by Householder Age in Loma
The median household income in Loma is $137,995, with the highest median household income of $139,973 found in the 45 to 64 years age bracket for the primary householder. A total of 205 households (58.6%) fall into this category.
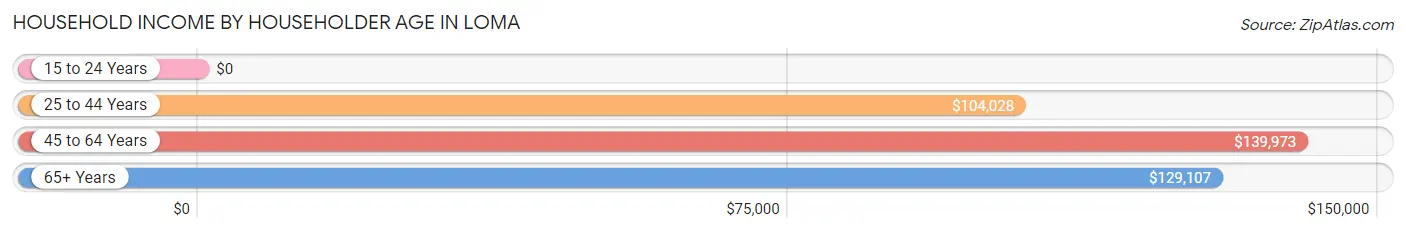
| Income Bracket | # Households | Median Income |
| 15 to 24 Years | 0 (0.0%) | $0 |
| 25 to 44 Years | 97 (27.7%) | $104,028 |
| 45 to 64 Years | 205 (58.6%) | $139,973 |
| 65+ Years | 48 (13.7%) | $129,107 |
| Total | 350 (100.0%) | $137,995 |
Poverty in Loma
Income Below Poverty by Sex and Age in Loma
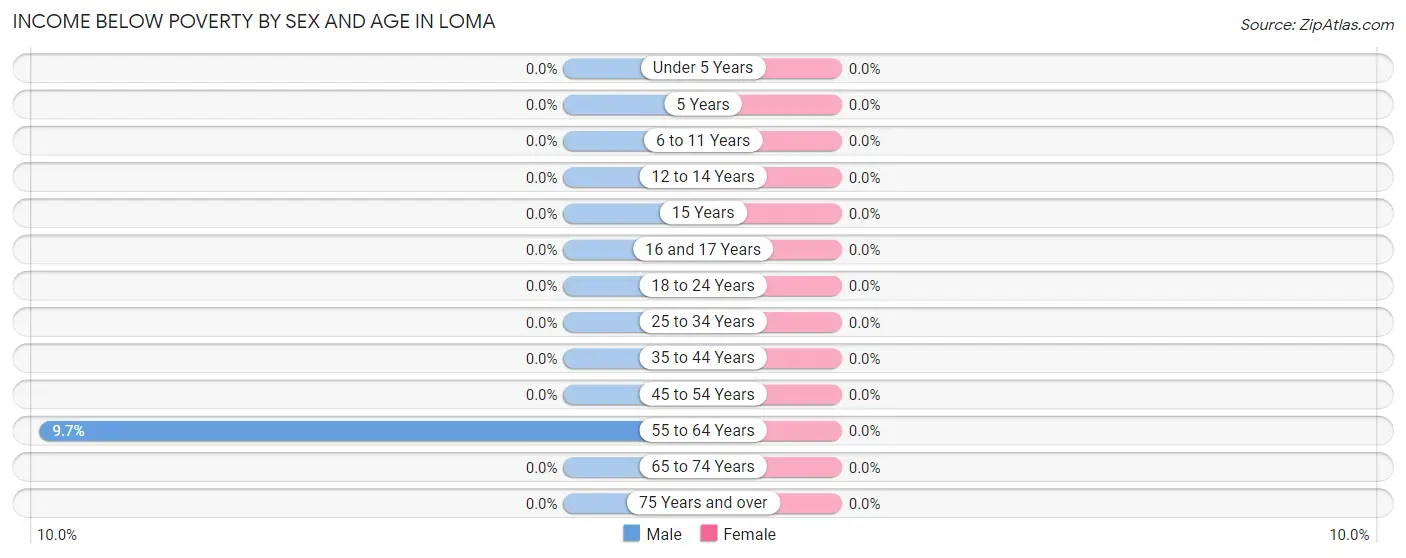
| Age Bracket | Male | Female |
| Under 5 Years | 0 (0.0%) | 0 (0.0%) |
| 5 Years | 0 (0.0%) | 0 (0.0%) |
| 6 to 11 Years | 0 (0.0%) | 0 (0.0%) |
| 12 to 14 Years | 0 (0.0%) | 0 (0.0%) |
| 15 Years | 0 (0.0%) | 0 (0.0%) |
| 16 and 17 Years | 0 (0.0%) | 0 (0.0%) |
| 18 to 24 Years | 0 (0.0%) | 0 (0.0%) |
| 25 to 34 Years | 0 (0.0%) | 0 (0.0%) |
| 35 to 44 Years | 0 (0.0%) | 0 (0.0%) |
| 45 to 54 Years | 0 (0.0%) | 0 (0.0%) |
| 55 to 64 Years | 14 (9.7%) | 0 (0.0%) |
| 65 to 74 Years | 0 (0.0%) | 0 (0.0%) |
| 75 Years and over | 0 (0.0%) | 0 (0.0%) |
| Total | 14 (2.6%) | 0 (0.0%) |
Income Above Poverty by Sex and Age in Loma
According to the poverty statistics in Loma, males aged 6 to 11 years and females aged under 5 years are the age groups that are most secure financially, with 100.0% of males and 100.0% of females in these age groups living above the poverty line.
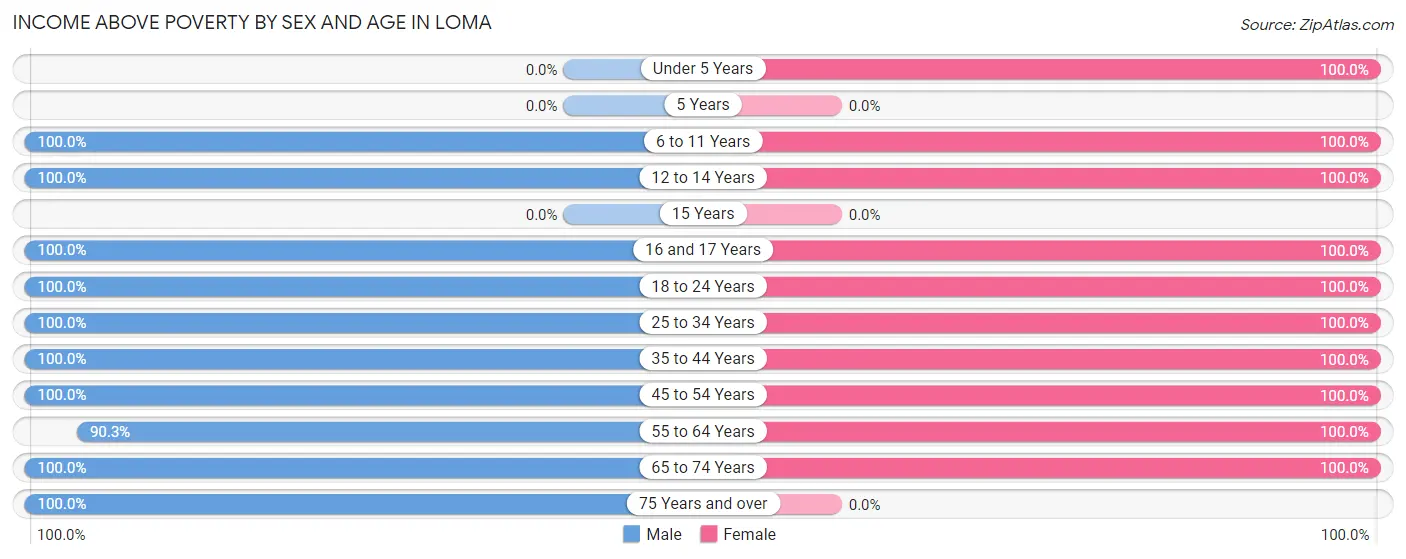
| Age Bracket | Male | Female |
| Under 5 Years | 0 (0.0%) | 10 (100.0%) |
| 5 Years | 0 (0.0%) | 0 (0.0%) |
| 6 to 11 Years | 13 (100.0%) | 65 (100.0%) |
| 12 to 14 Years | 50 (100.0%) | 49 (100.0%) |
| 15 Years | 0 (0.0%) | 0 (0.0%) |
| 16 and 17 Years | 94 (100.0%) | 27 (100.0%) |
| 18 to 24 Years | 13 (100.0%) | 141 (100.0%) |
| 25 to 34 Years | 45 (100.0%) | 9 (100.0%) |
| 35 to 44 Years | 87 (100.0%) | 164 (100.0%) |
| 45 to 54 Years | 60 (100.0%) | 75 (100.0%) |
| 55 to 64 Years | 130 (90.3%) | 64 (100.0%) |
| 65 to 74 Years | 15 (100.0%) | 29 (100.0%) |
| 75 Years and over | 19 (100.0%) | 0 (0.0%) |
| Total | 526 (97.4%) | 633 (100.0%) |
Income Below Poverty Among Married-Couple Families in Loma
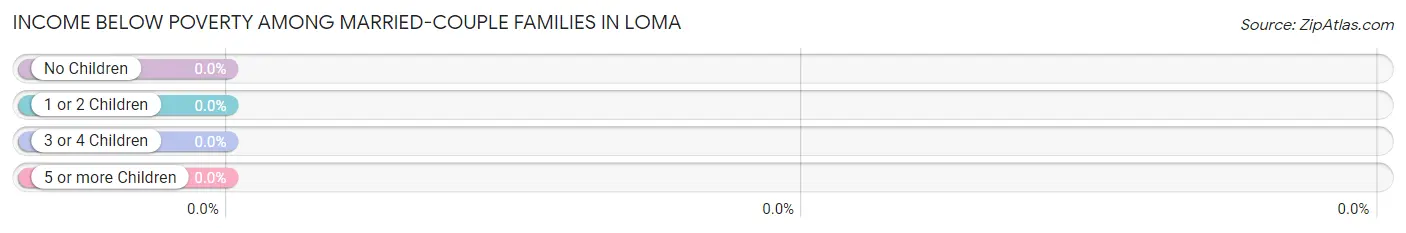
| Children | Above Poverty | Below Poverty |
| No Children | 111 (100.0%) | 0 (0.0%) |
| 1 or 2 Children | 74 (100.0%) | 0 (0.0%) |
| 3 or 4 Children | 25 (100.0%) | 0 (0.0%) |
| 5 or more Children | 0 (0.0%) | 0 (0.0%) |
| Total | 210 (100.0%) | 0 (0.0%) |
Income Below Poverty Among Single-Parent Households in Loma
| Children | Single Father | Single Mother |
| No Children | 0 (0.0%) | 0 (0.0%) |
| 1 or 2 Children | 0 (0.0%) | 0 (0.0%) |
| 3 or 4 Children | 0 (0.0%) | 0 (0.0%) |
| 5 or more Children | 0 (0.0%) | 0 (0.0%) |
| Total | 0 (0.0%) | 0 (0.0%) |
Income Below Poverty Among Married-Couple vs Single-Parent Households in Loma
| Children | Married-Couple Families | Single-Parent Households |
| No Children | 0 (0.0%) | 0 (0.0%) |
| 1 or 2 Children | 0 (0.0%) | 0 (0.0%) |
| 3 or 4 Children | 0 (0.0%) | 0 (0.0%) |
| 5 or more Children | 0 (0.0%) | 0 (0.0%) |
| Total | 0 (0.0%) | 0 (0.0%) |
Race in Loma
The most populous races in Loma are White / Caucasian (1,472 | 99.4%), and Two or more Races (9 | 0.6%).
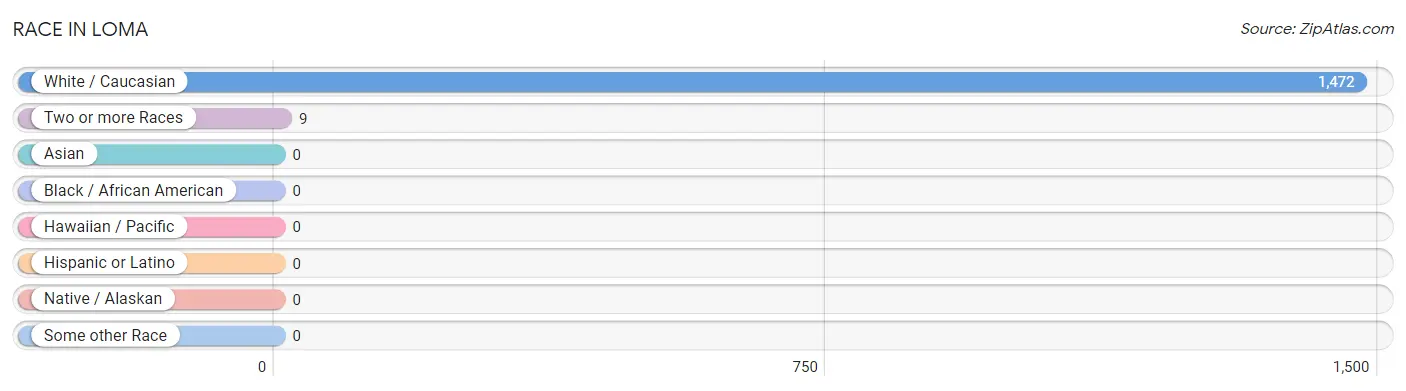
| Race | # Population | % Population |
| Asian | 0 | 0.0% |
| Black / African American | 0 | 0.0% |
| Hawaiian / Pacific | 0 | 0.0% |
| Hispanic or Latino | 0 | 0.0% |
| Native / Alaskan | 0 | 0.0% |
| White / Caucasian | 1,472 | 99.4% |
| Two or more Races | 9 | 0.6% |
| Some other Race | 0 | 0.0% |
| Total | 1,481 | 100.0% |
Ancestry in Loma
The most populous ancestries reported in Loma are Italian (233 | 15.7%), German (169 | 11.4%), English (150 | 10.1%), American (52 | 3.5%), and Irish (45 | 3.0%), together accounting for 43.8% of all Loma residents.
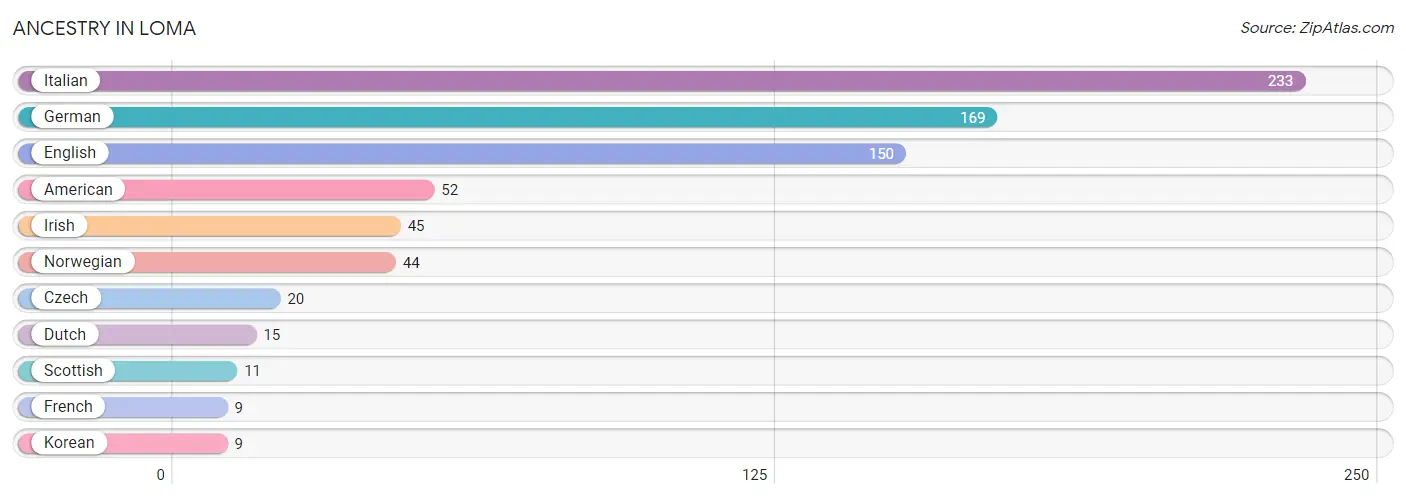
| Ancestry | # Population | % Population |
| American | 52 | 3.5% |
| Czech | 20 | 1.3% |
| Dutch | 15 | 1.0% |
| English | 150 | 10.1% |
| French | 9 | 0.6% |
| German | 169 | 11.4% |
| Irish | 45 | 3.0% |
| Italian | 233 | 15.7% |
| Korean | 9 | 0.6% |
| Norwegian | 44 | 3.0% |
| Scottish | 11 | 0.7% | View All 11 Rows |
Immigrants in Loma

| Immigration Origin | # Population | % Population | View All 0 Rows |
Sex and Age in Loma
Sex and Age in Loma
The most populous age groups in Loma are 55 to 59 Years (144 | 24.2%) for men and 10 to 14 Years (189 | 21.3%) for women.
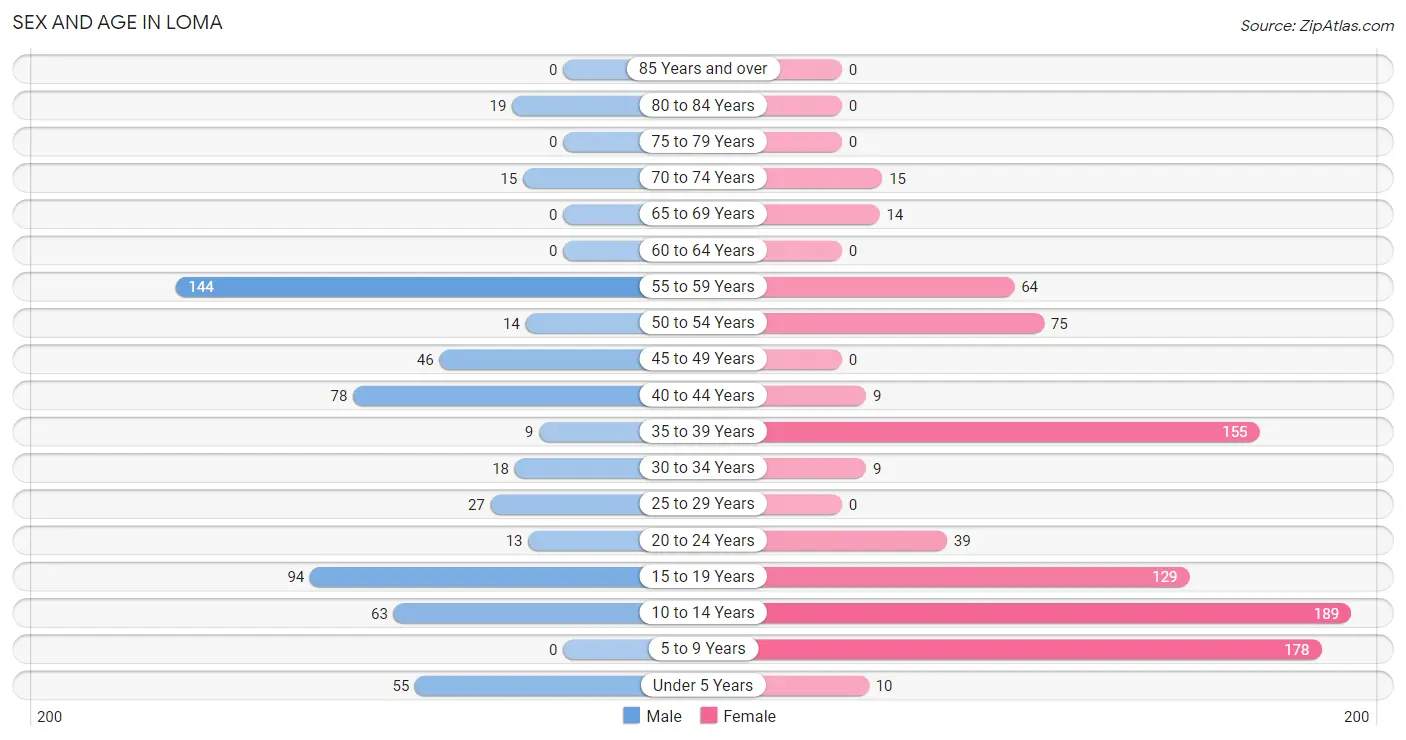
| Age Bracket | Male | Female |
| Under 5 Years | 55 (9.2%) | 10 (1.1%) |
| 5 to 9 Years | 0 (0.0%) | 178 (20.1%) |
| 10 to 14 Years | 63 (10.6%) | 189 (21.3%) |
| 15 to 19 Years | 94 (15.8%) | 129 (14.6%) |
| 20 to 24 Years | 13 (2.2%) | 39 (4.4%) |
| 25 to 29 Years | 27 (4.5%) | 0 (0.0%) |
| 30 to 34 Years | 18 (3.0%) | 9 (1.0%) |
| 35 to 39 Years | 9 (1.5%) | 155 (17.5%) |
| 40 to 44 Years | 78 (13.1%) | 9 (1.0%) |
| 45 to 49 Years | 46 (7.7%) | 0 (0.0%) |
| 50 to 54 Years | 14 (2.4%) | 75 (8.5%) |
| 55 to 59 Years | 144 (24.2%) | 64 (7.2%) |
| 60 to 64 Years | 0 (0.0%) | 0 (0.0%) |
| 65 to 69 Years | 0 (0.0%) | 14 (1.6%) |
| 70 to 74 Years | 15 (2.5%) | 15 (1.7%) |
| 75 to 79 Years | 0 (0.0%) | 0 (0.0%) |
| 80 to 84 Years | 19 (3.2%) | 0 (0.0%) |
| 85 Years and over | 0 (0.0%) | 0 (0.0%) |
| Total | 595 (100.0%) | 886 (100.0%) |
Families and Households in Loma
Median Family Size in Loma
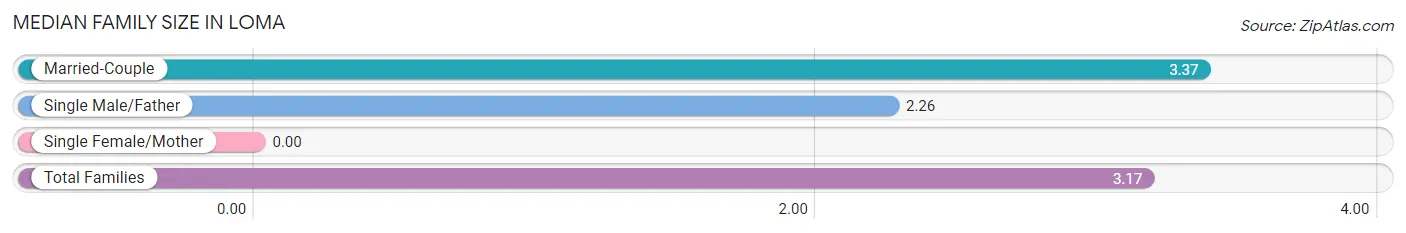
| Family Type | # Families | Family Size |
| Married-Couple | 210 (81.7%) | 3.37 |
| Single Male/Father | 47 (18.3%) | 2.26 |
| Single Female/Mother | 0 (0.0%) | - |
| Total Families | 257 (100.0%) | 3.17 |
Median Household Size in Loma
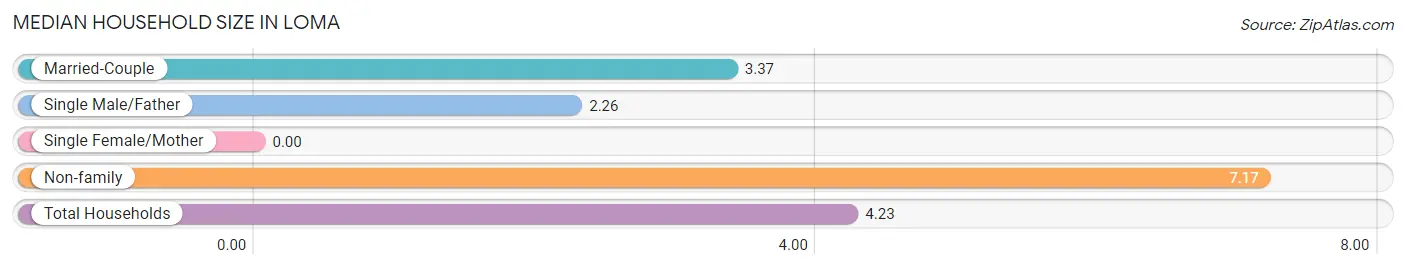
| Household Type | # Households | Household Size |
| Married-Couple | 210 (60.0%) | 3.37 |
| Single Male/Father | 47 (13.4%) | 2.26 |
| Single Female/Mother | 0 (0.0%) | - |
| Non-family | 93 (26.6%) | 7.17 |
| Total Households | 350 (100.0%) | 4.23 |
Household Size by Marriage Status in Loma
Out of a total of 350 households in Loma, 257 (73.4%) are family households, while 93 (26.6%) are nonfamily households. The most numerous type of family households are 2-person households, comprising 113, and the most common type of nonfamily households are 1-person households, comprising 47.
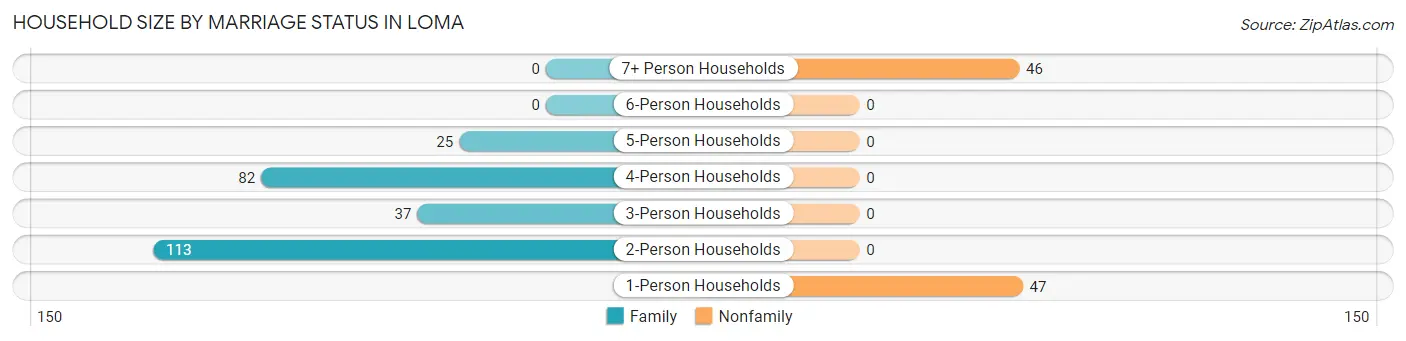
| Household Size | Family Households | Nonfamily Households |
| 1-Person Households | - | 47 (13.4%) |
| 2-Person Households | 113 (32.3%) | 0 (0.0%) |
| 3-Person Households | 37 (10.6%) | 0 (0.0%) |
| 4-Person Households | 82 (23.4%) | 0 (0.0%) |
| 5-Person Households | 25 (7.1%) | 0 (0.0%) |
| 6-Person Households | 0 (0.0%) | 0 (0.0%) |
| 7+ Person Households | 0 (0.0%) | 46 (13.1%) |
| Total | 257 (73.4%) | 93 (26.6%) |
Female Fertility in Loma
Fertility by Age in Loma
Average fertility rate in Loma is 212.0 births per 1,000 women. Women in the age bracket of 15 to 19 years have the highest fertility rate with 589.0 births per 1,000 women. Women in the age bracket of 15 to 19 years acount for 100.0% of all women with births.
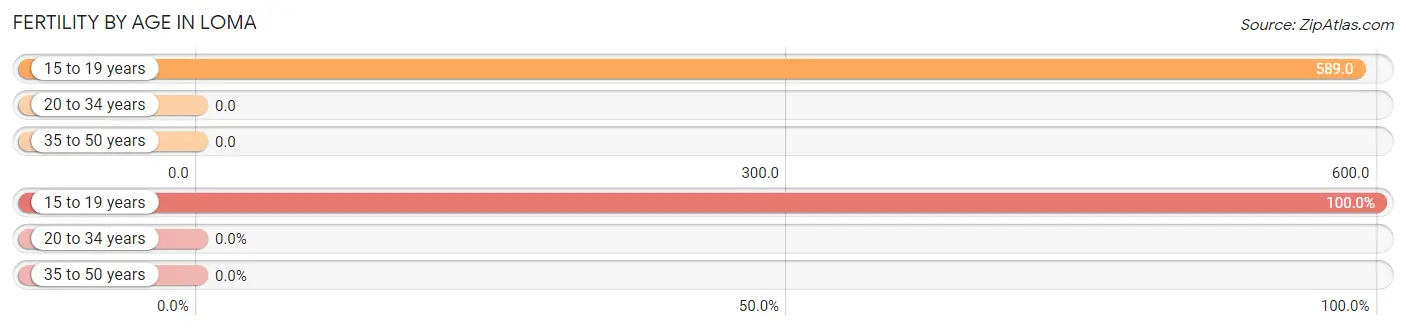
| Age Bracket | Women with Births | Births / 1,000 Women |
| 15 to 19 years | 76 (100.0%) | 589.0 |
| 20 to 34 years | 0 (0.0%) | 0.0 |
| 35 to 50 years | 0 (0.0%) | 0.0 |
| Total | 76 (100.0%) | 212.0 |
Fertility by Age by Marriage Status in Loma
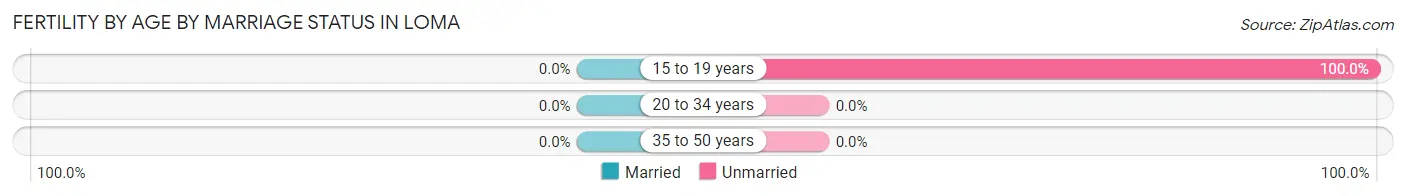
| Age Bracket | Married | Unmarried |
| 15 to 19 years | 0 (0.0%) | 76 (100.0%) |
| 20 to 34 years | 0 (0.0%) | 0 (0.0%) |
| 35 to 50 years | 0 (0.0%) | 0 (0.0%) |
| Total | 0 (0.0%) | 76 (100.0%) |
Fertility by Education in Loma
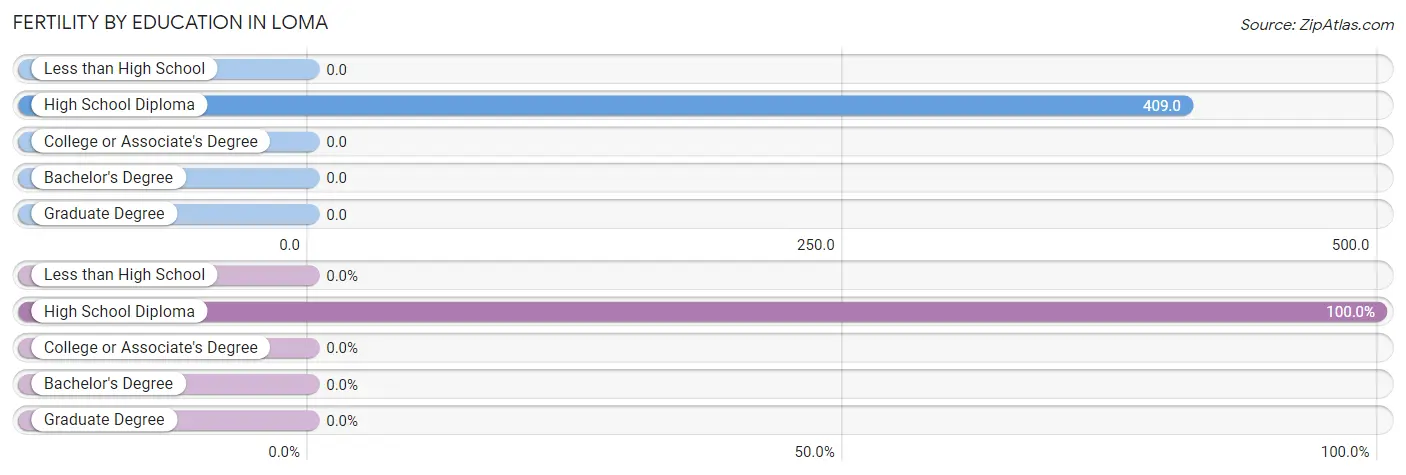
| Educational Attainment | Women with Births | Births / 1,000 Women |
| Less than High School | 0 (0.0%) | 0.0 |
| High School Diploma | 76 (100.0%) | 409.0 |
| College or Associate's Degree | 0 (0.0%) | 0.0 |
| Bachelor's Degree | 0 (0.0%) | 0.0 |
| Graduate Degree | 0 (0.0%) | 0.0 |
| Total | 76 (100.0%) | 212.0 |
Fertility by Education by Marriage Status in Loma
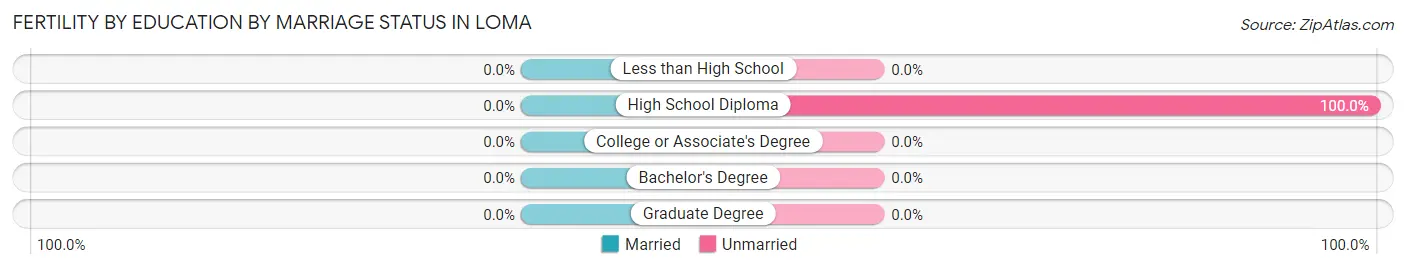
| Educational Attainment | Married | Unmarried |
| Less than High School | 0 (0.0%) | 0 (0.0%) |
| High School Diploma | 0 (0.0%) | 76 (100.0%) |
| College or Associate's Degree | 0 (0.0%) | 0 (0.0%) |
| Bachelor's Degree | 0 (0.0%) | 0 (0.0%) |
| Graduate Degree | 0 (0.0%) | 0 (0.0%) |
| Total | 0 (0.0%) | 76 (100.0%) |
Employment Characteristics in Loma
Employment by Class of Employer in Loma
Among the 806 employed individuals in Loma, private company employees (646 | 80.1%), self-employed (not incorporated) (79 | 9.8%), and self-employed (incorporated) (37 | 4.6%) make up the most common classes of employment.
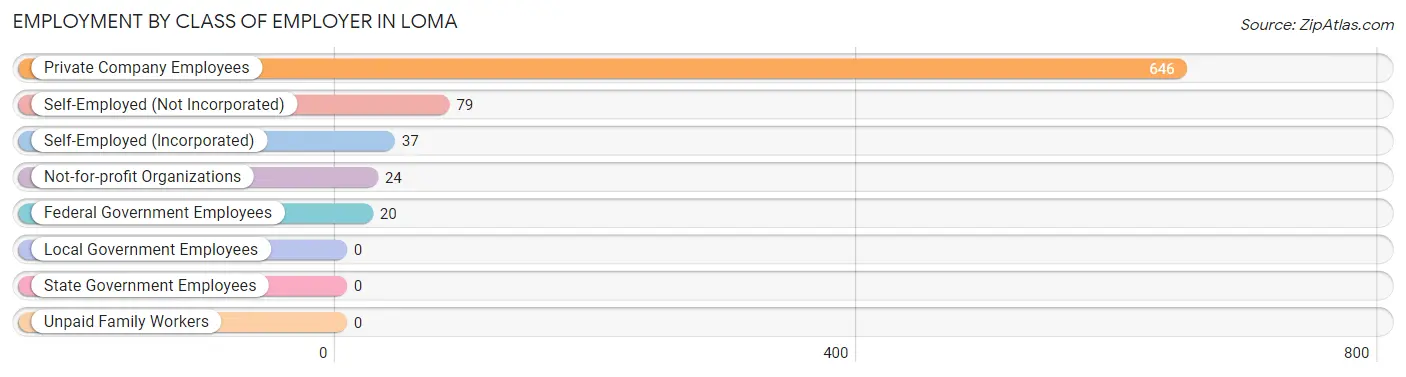
| Employer Class | # Employees | % Employees |
| Private Company Employees | 646 | 80.1% |
| Self-Employed (Incorporated) | 37 | 4.6% |
| Self-Employed (Not Incorporated) | 79 | 9.8% |
| Not-for-profit Organizations | 24 | 3.0% |
| Local Government Employees | 0 | 0.0% |
| State Government Employees | 0 | 0.0% |
| Federal Government Employees | 20 | 2.5% |
| Unpaid Family Workers | 0 | 0.0% |
| Total | 806 | 100.0% |
Employment Status by Age in Loma
According to the labor force statistics for Loma, out of the total population over 16 years of age (986), 87.6% or 864 individuals are in the labor force, with 1.5% or 13 of them unemployed. The age group with the highest labor force participation rate is 25 to 29 years, with 100.0% or 27 individuals in the labor force. Within the labor force, the 20 to 24 years age range has the highest percentage of unemployed individuals, with 40.6% or 13 of them being unemployed.
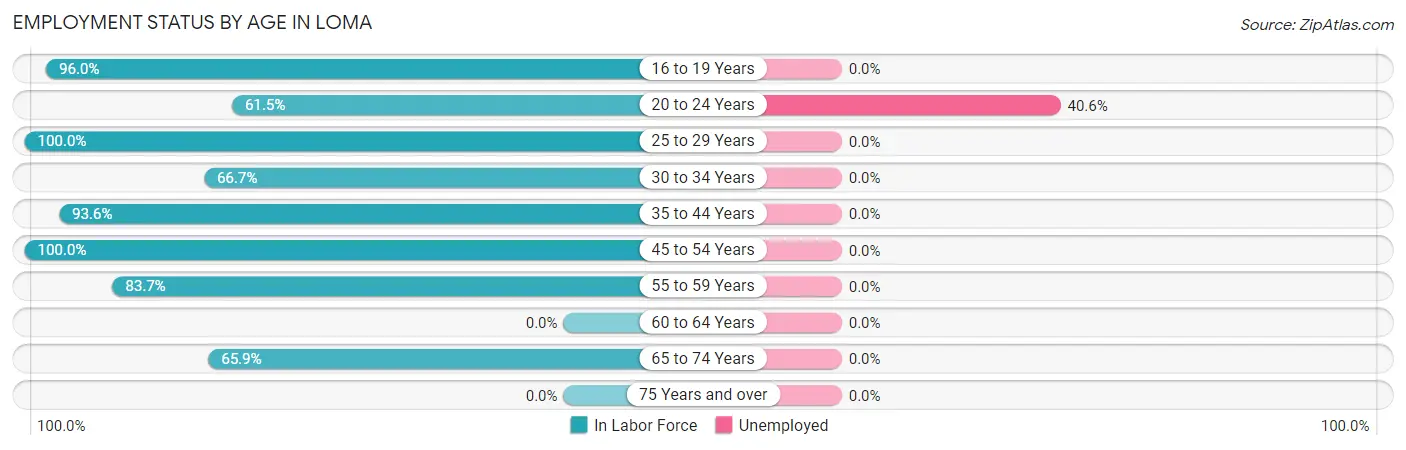
| Age Bracket | In Labor Force | Unemployed |
| 16 to 19 Years | 214 (96.0%) | 0 (0.0%) |
| 20 to 24 Years | 32 (61.5%) | 13 (40.6%) |
| 25 to 29 Years | 27 (100.0%) | 0 (0.0%) |
| 30 to 34 Years | 18 (66.7%) | 0 (0.0%) |
| 35 to 44 Years | 235 (93.6%) | 0 (0.0%) |
| 45 to 54 Years | 135 (100.0%) | 0 (0.0%) |
| 55 to 59 Years | 174 (83.7%) | 0 (0.0%) |
| 60 to 64 Years | 0 (0.0%) | 0 (0.0%) |
| 65 to 74 Years | 29 (65.9%) | 0 (0.0%) |
| 75 Years and over | 0 (0.0%) | 0 (0.0%) |
| Total | 864 (87.6%) | 13 (1.5%) |
Employment Status by Educational Attainment in Loma
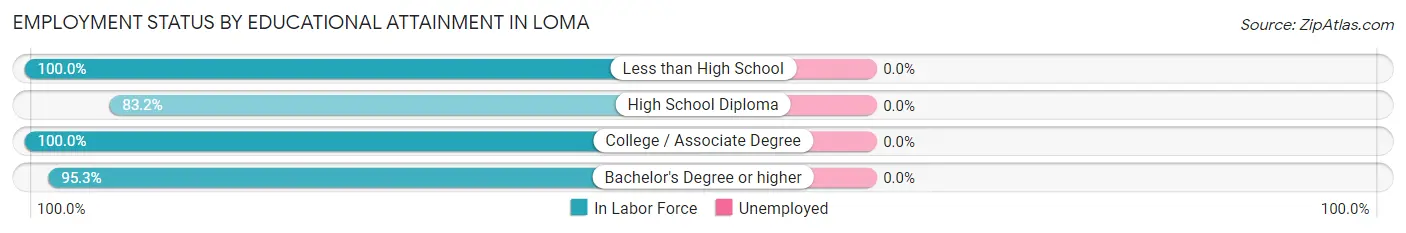
| Educational Attainment | In Labor Force | Unemployed |
| Less than High School | 74 (100.0%) | 0 (0.0%) |
| High School Diploma | 247 (83.2%) | 0 (0.0%) |
| College / Associate Degree | 85 (100.0%) | 0 (0.0%) |
| Bachelor's Degree or higher | 183 (95.3%) | 0 (0.0%) |
| Total | 589 (90.9%) | 0 (0.0%) |
Employment Occupations by Sex in Loma
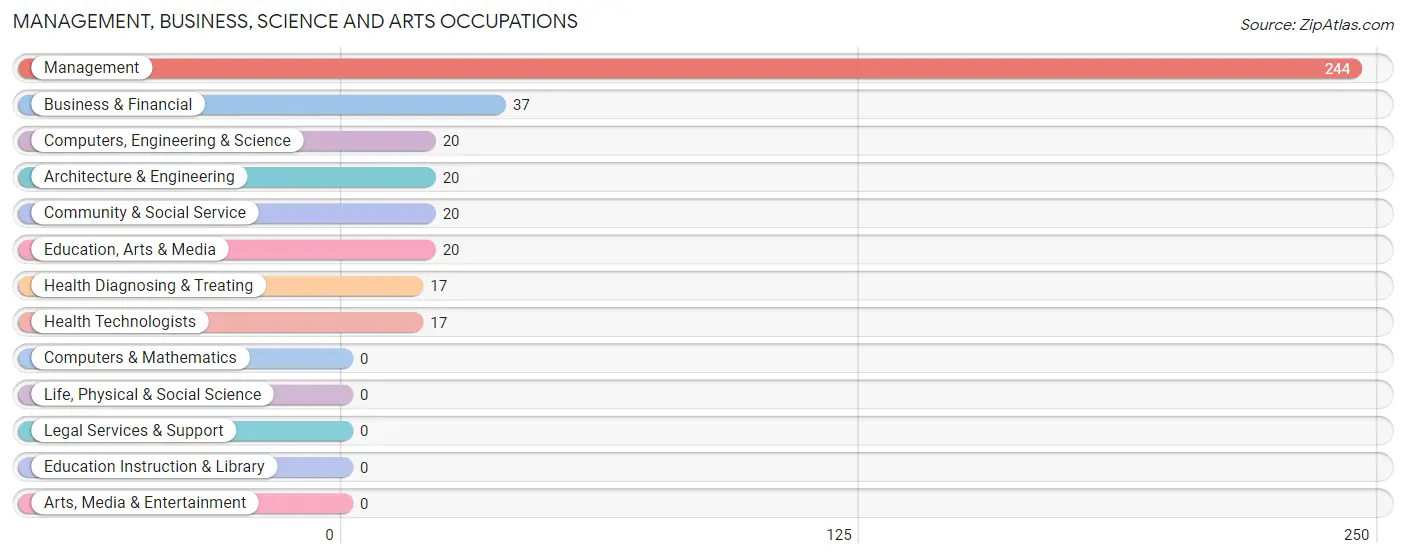
Management, Business, Science and Arts Occupations
The most common Management, Business, Science and Arts occupations in Loma are Management (244 | 28.7%), Business & Financial (37 | 4.3%), Computers, Engineering & Science (20 | 2.4%), Architecture & Engineering (20 | 2.4%), and Community & Social Service (20 | 2.4%).
Management, Business, Science and Arts Occupations by Sex
Within the Management, Business, Science and Arts occupations in Loma, the most male-oriented occupations are Computers, Engineering & Science (100.0%), Architecture & Engineering (100.0%), and Health Diagnosing & Treating (100.0%), while the most female-oriented occupations are Community & Social Service (100.0%), Education, Arts & Media (100.0%), and Management (78.7%).
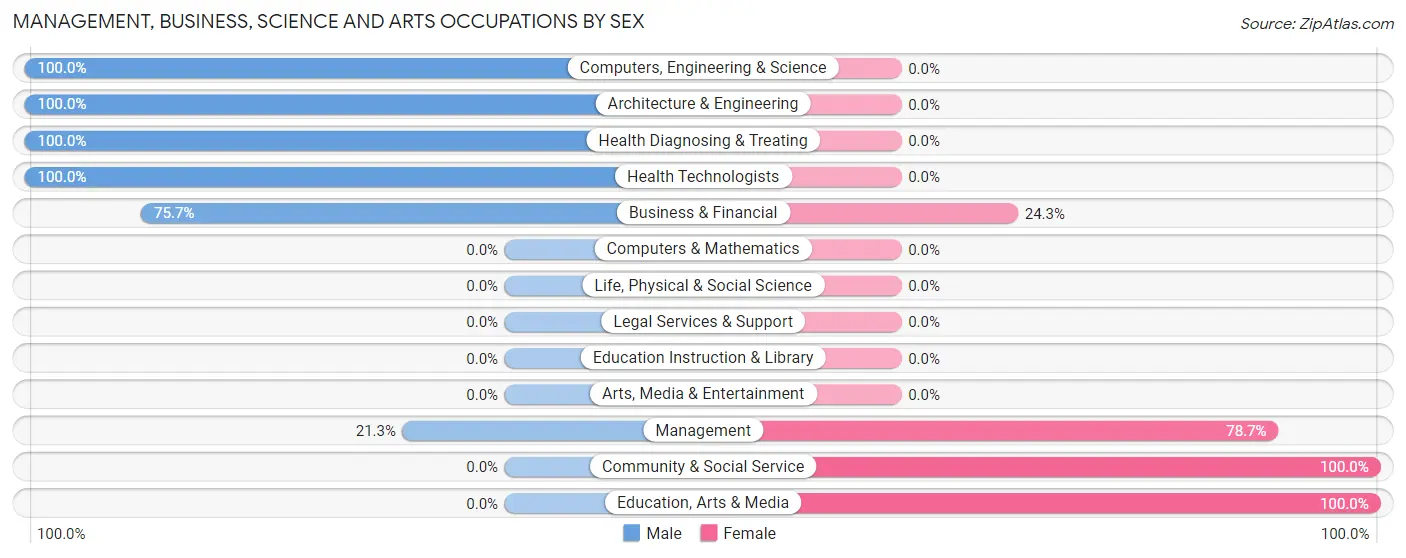
| Occupation | Male | Female |
| Management | 52 (21.3%) | 192 (78.7%) |
| Business & Financial | 28 (75.7%) | 9 (24.3%) |
| Computers, Engineering & Science | 20 (100.0%) | 0 (0.0%) |
| Computers & Mathematics | 0 (0.0%) | 0 (0.0%) |
| Architecture & Engineering | 20 (100.0%) | 0 (0.0%) |
| Life, Physical & Social Science | 0 (0.0%) | 0 (0.0%) |
| Community & Social Service | 0 (0.0%) | 20 (100.0%) |
| Education, Arts & Media | 0 (0.0%) | 20 (100.0%) |
| Legal Services & Support | 0 (0.0%) | 0 (0.0%) |
| Education Instruction & Library | 0 (0.0%) | 0 (0.0%) |
| Arts, Media & Entertainment | 0 (0.0%) | 0 (0.0%) |
| Health Diagnosing & Treating | 17 (100.0%) | 0 (0.0%) |
| Health Technologists | 17 (100.0%) | 0 (0.0%) |
| Total (Category) | 117 (34.6%) | 221 (65.4%) |
| Total (Overall) | 400 (47.0%) | 451 (53.0%) |
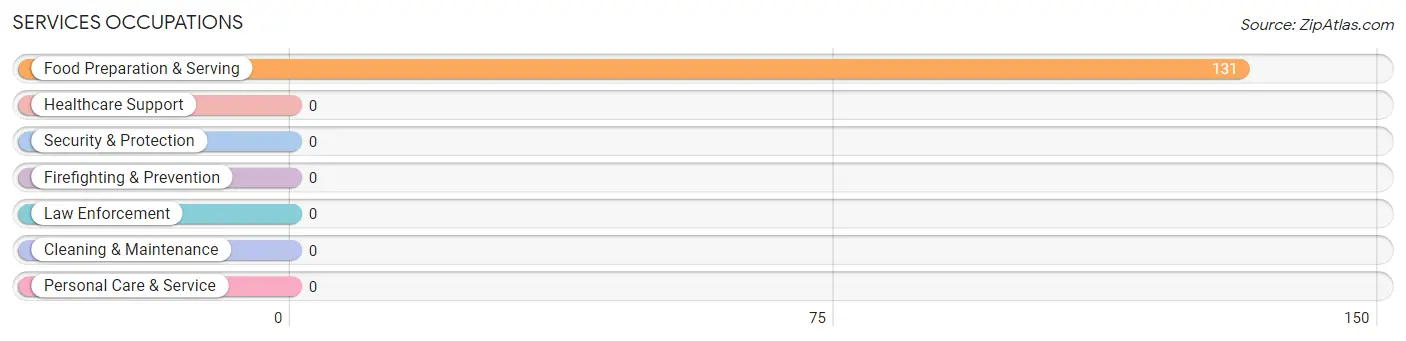
Services Occupations
The most common Services occupations in Loma are , and Food Preparation & Serving (131 | 15.4%).
Services Occupations by Sex
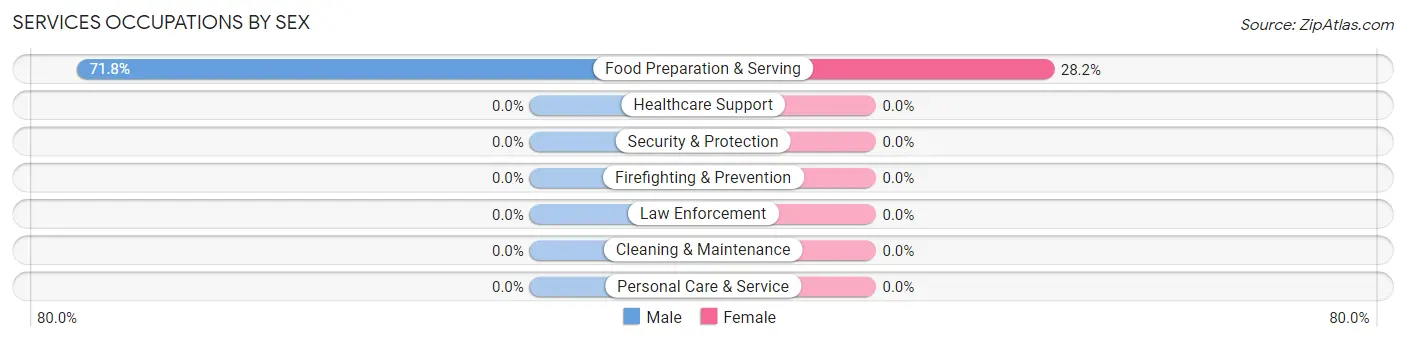
| Occupation | Male | Female |
| Healthcare Support | 0 (0.0%) | 0 (0.0%) |
| Security & Protection | 0 (0.0%) | 0 (0.0%) |
| Firefighting & Prevention | 0 (0.0%) | 0 (0.0%) |
| Law Enforcement | 0 (0.0%) | 0 (0.0%) |
| Food Preparation & Serving | 94 (71.8%) | 37 (28.2%) |
| Cleaning & Maintenance | 0 (0.0%) | 0 (0.0%) |
| Personal Care & Service | 0 (0.0%) | 0 (0.0%) |
| Total (Category) | 94 (71.8%) | 37 (28.2%) |
| Total (Overall) | 400 (47.0%) | 451 (53.0%) |
Sales and Office Occupations
The most common Sales and Office occupations in Loma are Office & Administration (56 | 6.6%), and Sales & Related (50 | 5.9%).
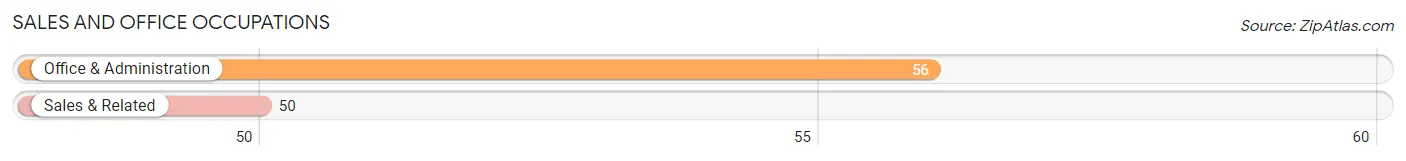
Sales and Office Occupations by Sex
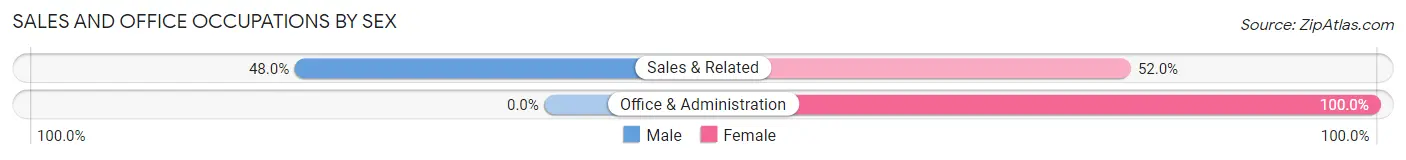
| Occupation | Male | Female |
| Sales & Related | 24 (48.0%) | 26 (52.0%) |
| Office & Administration | 0 (0.0%) | 56 (100.0%) |
| Total (Category) | 24 (22.6%) | 82 (77.4%) |
| Total (Overall) | 400 (47.0%) | 451 (53.0%) |
Natural Resources, Construction and Maintenance Occupations
The most common Natural Resources, Construction and Maintenance occupations in Loma are , and Construction & Extraction (32 | 3.8%).
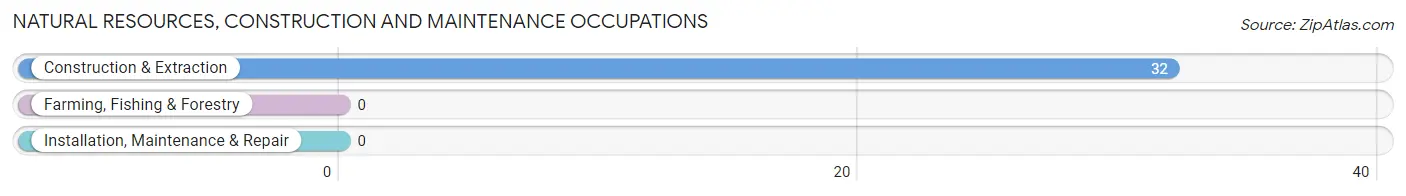
Natural Resources, Construction and Maintenance Occupations by Sex
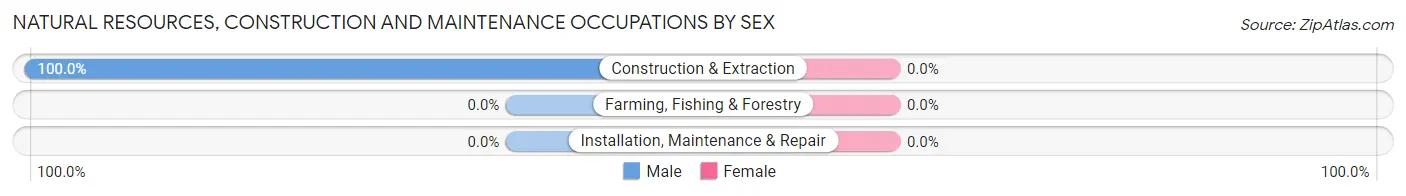
| Occupation | Male | Female |
| Farming, Fishing & Forestry | 0 (0.0%) | 0 (0.0%) |
| Construction & Extraction | 32 (100.0%) | 0 (0.0%) |
| Installation, Maintenance & Repair | 0 (0.0%) | 0 (0.0%) |
| Total (Category) | 32 (100.0%) | 0 (0.0%) |
| Total (Overall) | 400 (47.0%) | 451 (53.0%) |
Production, Transportation and Moving Occupations
The most common Production, Transportation and Moving occupations in Loma are Transportation (142 | 16.7%), Material Moving (93 | 10.9%), and Production (9 | 1.1%).
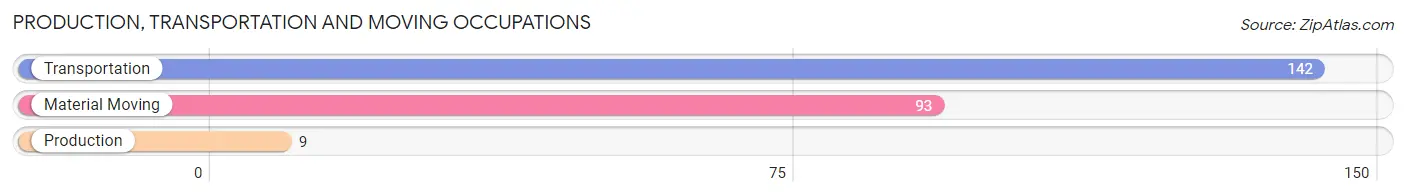
Production, Transportation and Moving Occupations by Sex
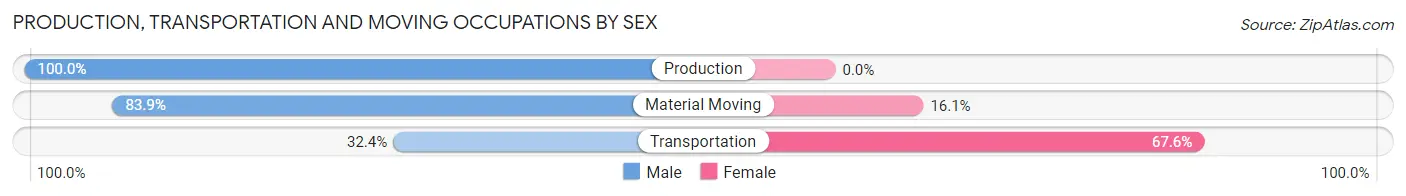
| Occupation | Male | Female |
| Production | 9 (100.0%) | 0 (0.0%) |
| Transportation | 46 (32.4%) | 96 (67.6%) |
| Material Moving | 78 (83.9%) | 15 (16.1%) |
| Total (Category) | 133 (54.5%) | 111 (45.5%) |
| Total (Overall) | 400 (47.0%) | 451 (53.0%) |
Employment Industries by Sex in Loma
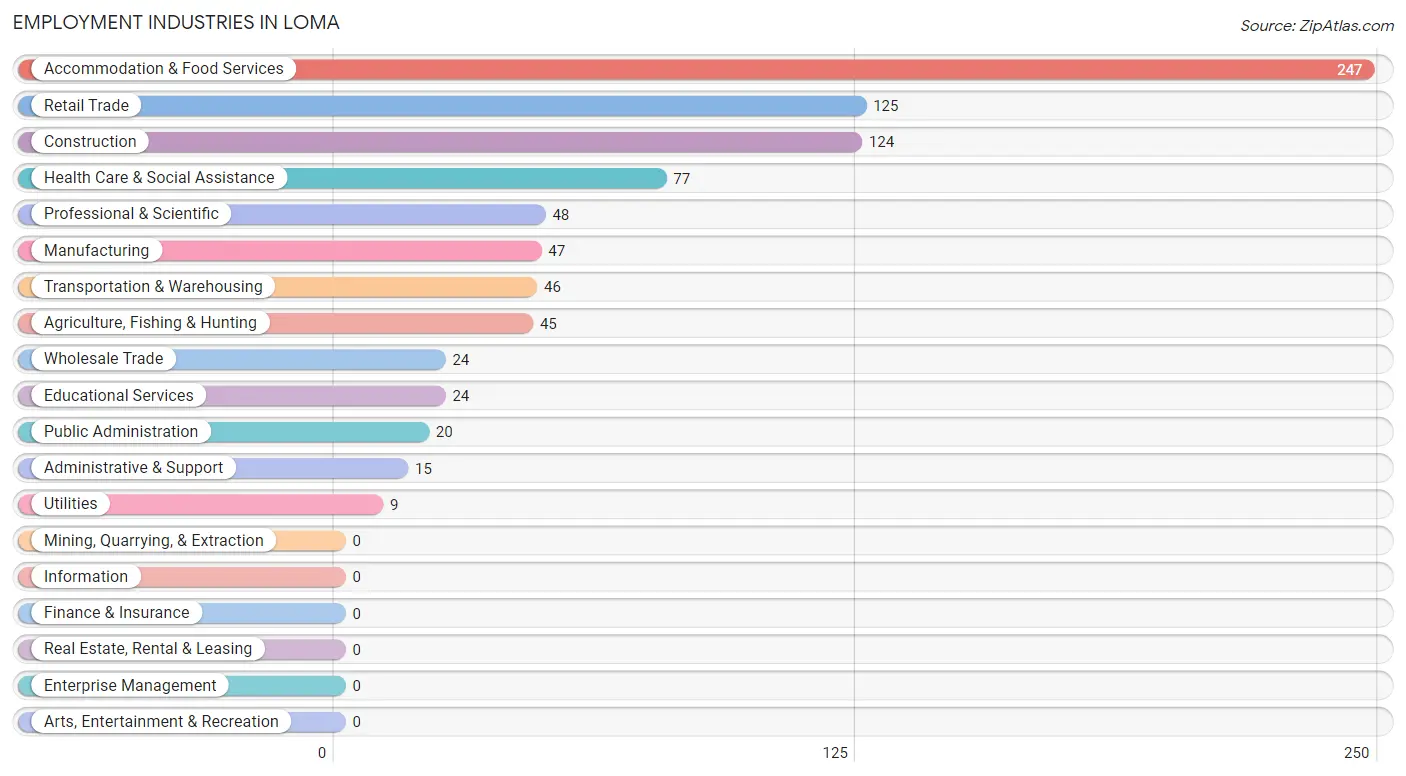
Employment Industries in Loma
The major employment industries in Loma include Accommodation & Food Services (247 | 29.0%), Retail Trade (125 | 14.7%), Construction (124 | 14.6%), Health Care & Social Assistance (77 | 9.0%), and Professional & Scientific (48 | 5.6%).
Employment Industries by Sex in Loma
The Loma industries that see more men than women are Construction (100.0%), Wholesale Trade (100.0%), and Transportation & Warehousing (100.0%), whereas the industries that tend to have a higher number of women are Agriculture, Fishing & Hunting (100.0%), Retail Trade (100.0%), and Administrative & Support (100.0%).
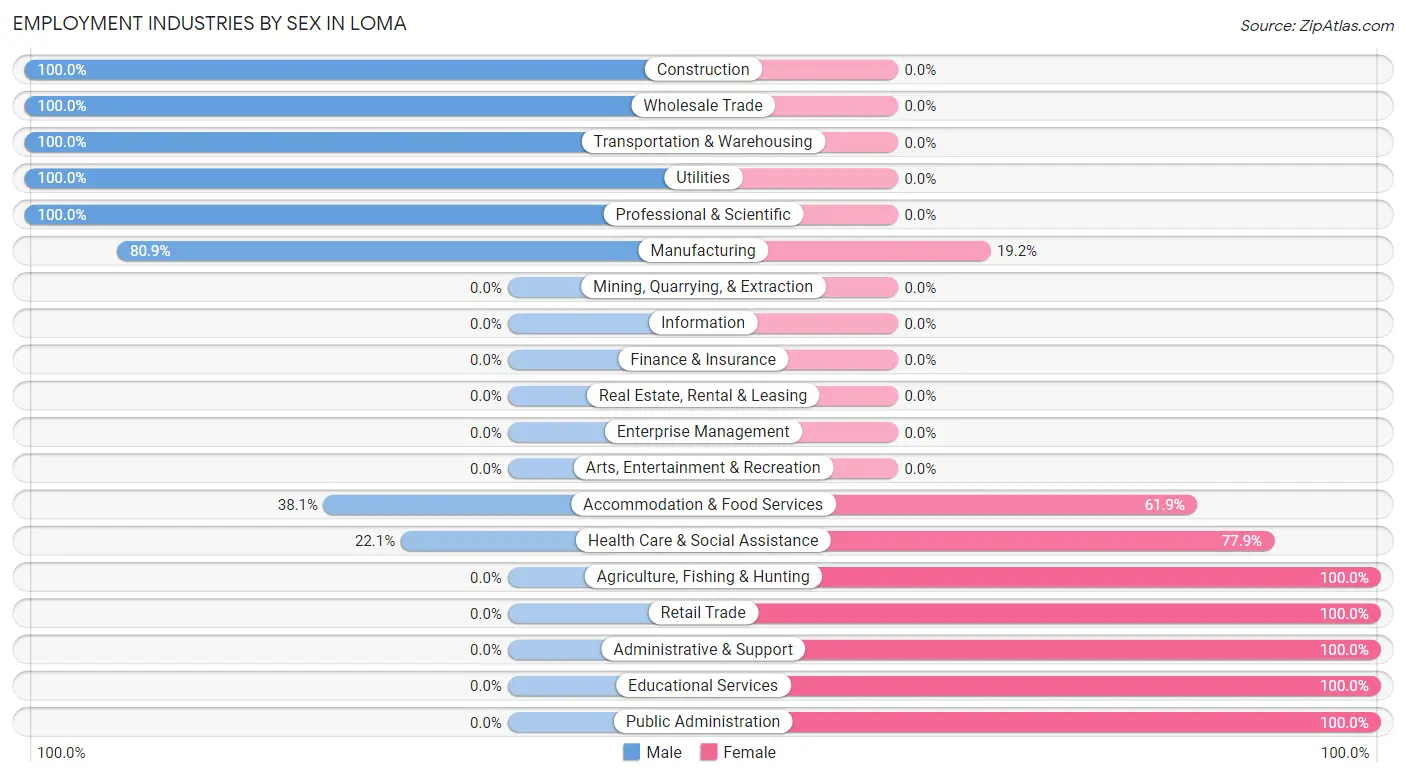
| Industry | Male | Female |
| Agriculture, Fishing & Hunting | 0 (0.0%) | 45 (100.0%) |
| Mining, Quarrying, & Extraction | 0 (0.0%) | 0 (0.0%) |
| Construction | 124 (100.0%) | 0 (0.0%) |
| Manufacturing | 38 (80.8%) | 9 (19.2%) |
| Wholesale Trade | 24 (100.0%) | 0 (0.0%) |
| Retail Trade | 0 (0.0%) | 125 (100.0%) |
| Transportation & Warehousing | 46 (100.0%) | 0 (0.0%) |
| Utilities | 9 (100.0%) | 0 (0.0%) |
| Information | 0 (0.0%) | 0 (0.0%) |
| Finance & Insurance | 0 (0.0%) | 0 (0.0%) |
| Real Estate, Rental & Leasing | 0 (0.0%) | 0 (0.0%) |
| Professional & Scientific | 48 (100.0%) | 0 (0.0%) |
| Enterprise Management | 0 (0.0%) | 0 (0.0%) |
| Administrative & Support | 0 (0.0%) | 15 (100.0%) |
| Educational Services | 0 (0.0%) | 24 (100.0%) |
| Health Care & Social Assistance | 17 (22.1%) | 60 (77.9%) |
| Arts, Entertainment & Recreation | 0 (0.0%) | 0 (0.0%) |
| Accommodation & Food Services | 94 (38.1%) | 153 (61.9%) |
| Public Administration | 0 (0.0%) | 20 (100.0%) |
| Total | 400 (47.0%) | 451 (53.0%) |
Education in Loma
School Enrollment in Loma
The most common levels of schooling among the 616 students in Loma are elementary school (302 | 49.0%), high school (217 | 35.2%), and middle school (58 | 9.4%).
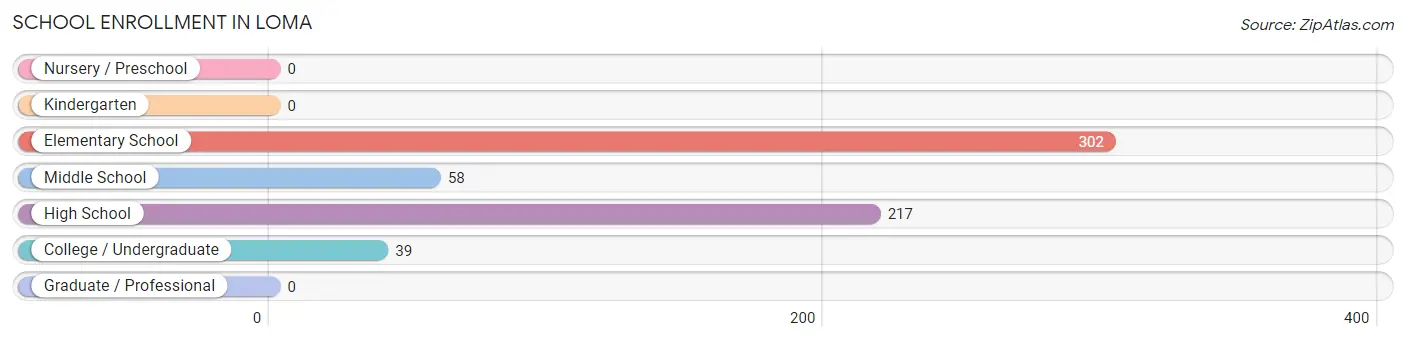
| School Level | # Students | % Students |
| Nursery / Preschool | 0 | 0.0% |
| Kindergarten | 0 | 0.0% |
| Elementary School | 302 | 49.0% |
| Middle School | 58 | 9.4% |
| High School | 217 | 35.2% |
| College / Undergraduate | 39 | 6.3% |
| Graduate / Professional | 0 | 0.0% |
| Total | 616 | 100.0% |
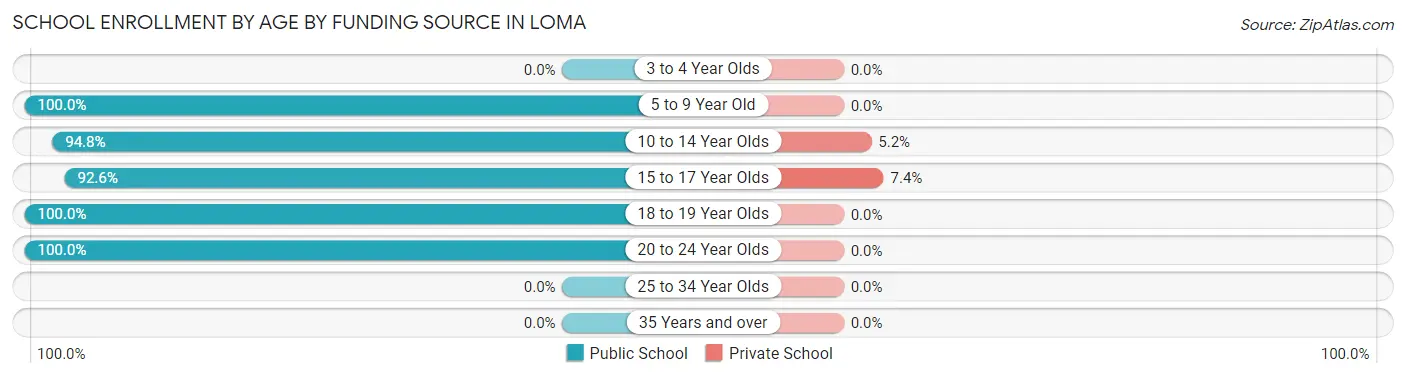
School Enrollment by Age by Funding Source in Loma
Out of a total of 616 students who are enrolled in schools in Loma, 22 (3.6%) attend a private institution, while the remaining 594 (96.4%) are enrolled in public schools. The age group of 15 to 17 year olds has the highest likelihood of being enrolled in private schools, with 9 (7.4% in the age bracket) enrolled. Conversely, the age group of 5 to 9 year old has the lowest likelihood of being enrolled in a private school, with 178 (100.0% in the age bracket) attending a public institution.
| Age Bracket | Public School | Private School |
| 3 to 4 Year Olds | 0 (0.0%) | 0 (0.0%) |
| 5 to 9 Year Old | 178 (100.0%) | 0 (0.0%) |
| 10 to 14 Year Olds | 239 (94.8%) | 13 (5.2%) |
| 15 to 17 Year Olds | 112 (92.6%) | 9 (7.4%) |
| 18 to 19 Year Olds | 26 (100.0%) | 0 (0.0%) |
| 20 to 24 Year Olds | 39 (100.0%) | 0 (0.0%) |
| 25 to 34 Year Olds | 0 (0.0%) | 0 (0.0%) |
| 35 Years and over | 0 (0.0%) | 0 (0.0%) |
| Total | 594 (96.4%) | 22 (3.6%) |
Educational Attainment by Field of Study in Loma
Arts & humanities (66 | 29.9%), engineering (48 | 21.7%), bio, nature & agricultural (43 | 19.5%), science & technology (29 | 13.1%), and business (18 | 8.1%) are the most common fields of study among 221 individuals in Loma who have obtained a bachelor's degree or higher.
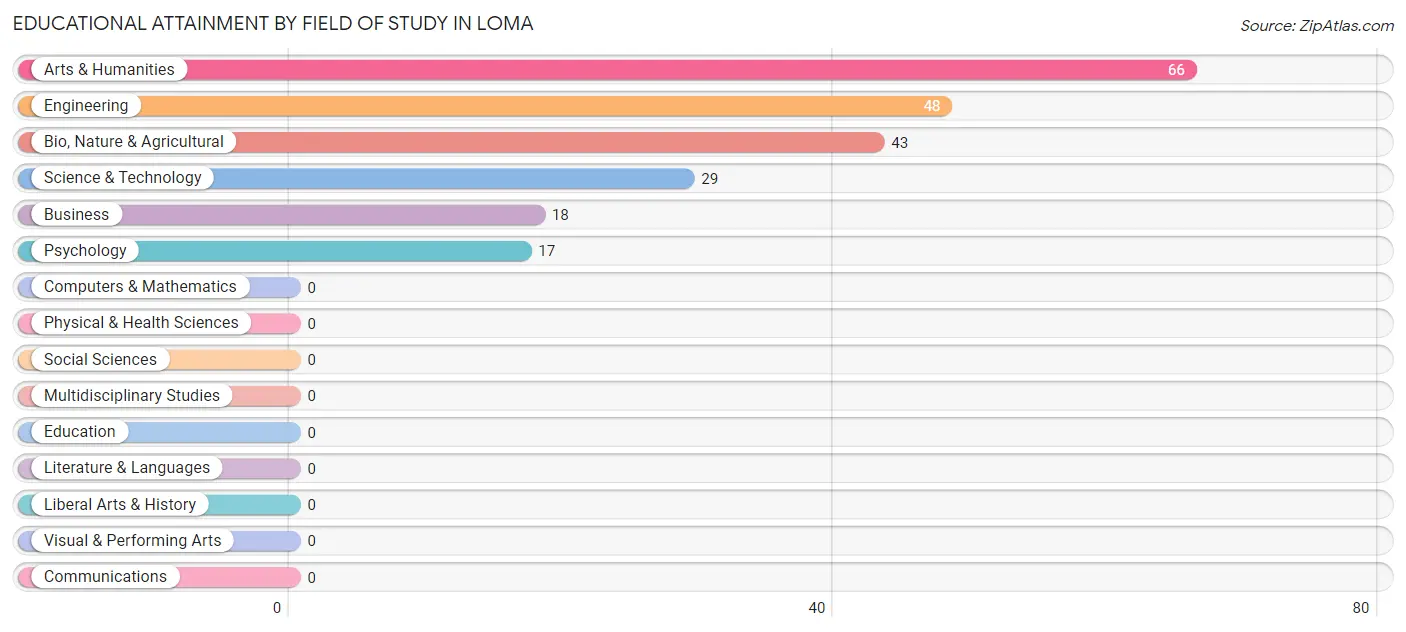
| Field of Study | # Graduates | % Graduates |
| Computers & Mathematics | 0 | 0.0% |
| Bio, Nature & Agricultural | 43 | 19.5% |
| Physical & Health Sciences | 0 | 0.0% |
| Psychology | 17 | 7.7% |
| Social Sciences | 0 | 0.0% |
| Engineering | 48 | 21.7% |
| Multidisciplinary Studies | 0 | 0.0% |
| Science & Technology | 29 | 13.1% |
| Business | 18 | 8.1% |
| Education | 0 | 0.0% |
| Literature & Languages | 0 | 0.0% |
| Liberal Arts & History | 0 | 0.0% |
| Visual & Performing Arts | 0 | 0.0% |
| Communications | 0 | 0.0% |
| Arts & Humanities | 66 | 29.9% |
| Total | 221 | 100.0% |
Transportation & Commute in Loma
Vehicle Availability by Sex in Loma
The most prevalent vehicle ownership categories in Loma are males with 3 vehicles (154, accounting for 38.5%) and females with 3 vehicles (187, making up 37.9%).
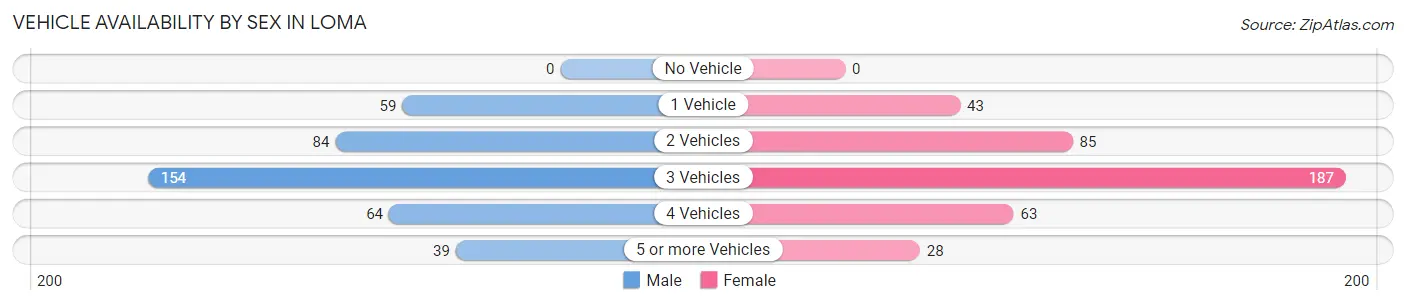
| Vehicles Available | Male | Female |
| No Vehicle | 0 (0.0%) | 0 (0.0%) |
| 1 Vehicle | 59 (14.7%) | 43 (10.6%) |
| 2 Vehicles | 84 (21.0%) | 85 (20.9%) |
| 3 Vehicles | 154 (38.5%) | 187 (46.1%) |
| 4 Vehicles | 64 (16.0%) | 63 (15.5%) |
| 5 or more Vehicles | 39 (9.8%) | 28 (6.9%) |
| Total | 400 (100.0%) | 406 (100.0%) |
Commute Time in Loma
The most frequently occuring commute durations in Loma are 15 to 19 minutes (189 commuters, 23.9%), 10 to 14 minutes (136 commuters, 17.2%), and 30 to 34 minutes (124 commuters, 15.7%).
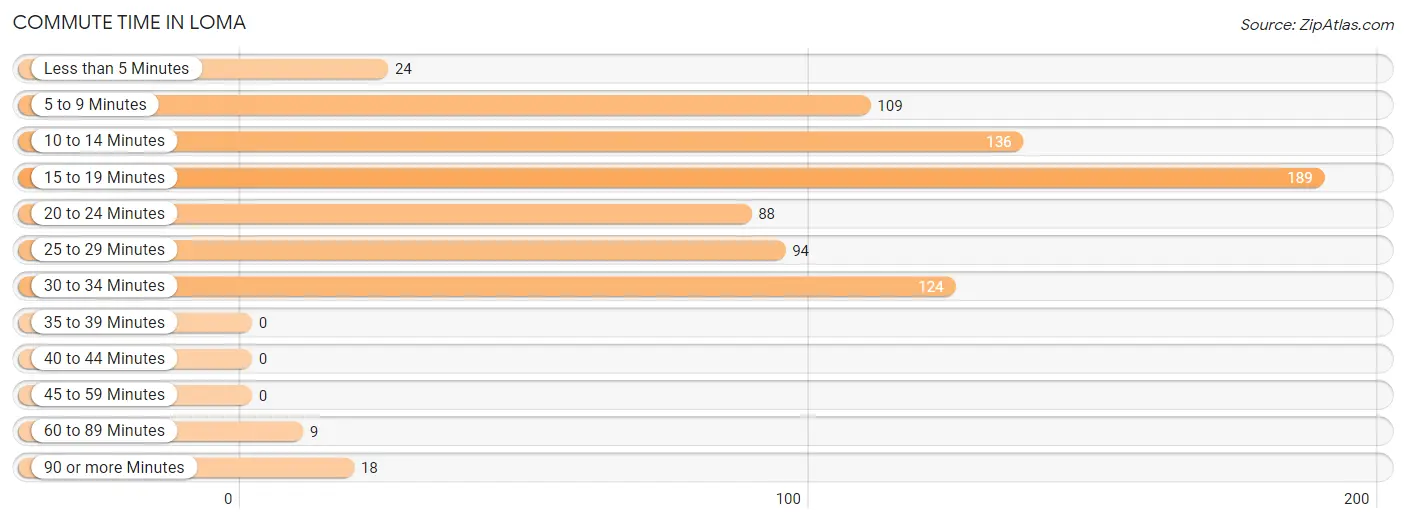
| Commute Time | # Commuters | % Commuters |
| Less than 5 Minutes | 24 | 3.0% |
| 5 to 9 Minutes | 109 | 13.8% |
| 10 to 14 Minutes | 136 | 17.2% |
| 15 to 19 Minutes | 189 | 23.9% |
| 20 to 24 Minutes | 88 | 11.1% |
| 25 to 29 Minutes | 94 | 11.9% |
| 30 to 34 Minutes | 124 | 15.7% |
| 35 to 39 Minutes | 0 | 0.0% |
| 40 to 44 Minutes | 0 | 0.0% |
| 45 to 59 Minutes | 0 | 0.0% |
| 60 to 89 Minutes | 9 | 1.1% |
| 90 or more Minutes | 18 | 2.3% |
Commute Time by Sex in Loma
The most common commute times in Loma are 15 to 19 minutes (94 commuters, 23.5%) for males and 10 to 14 minutes (122 commuters, 31.2%) for females.
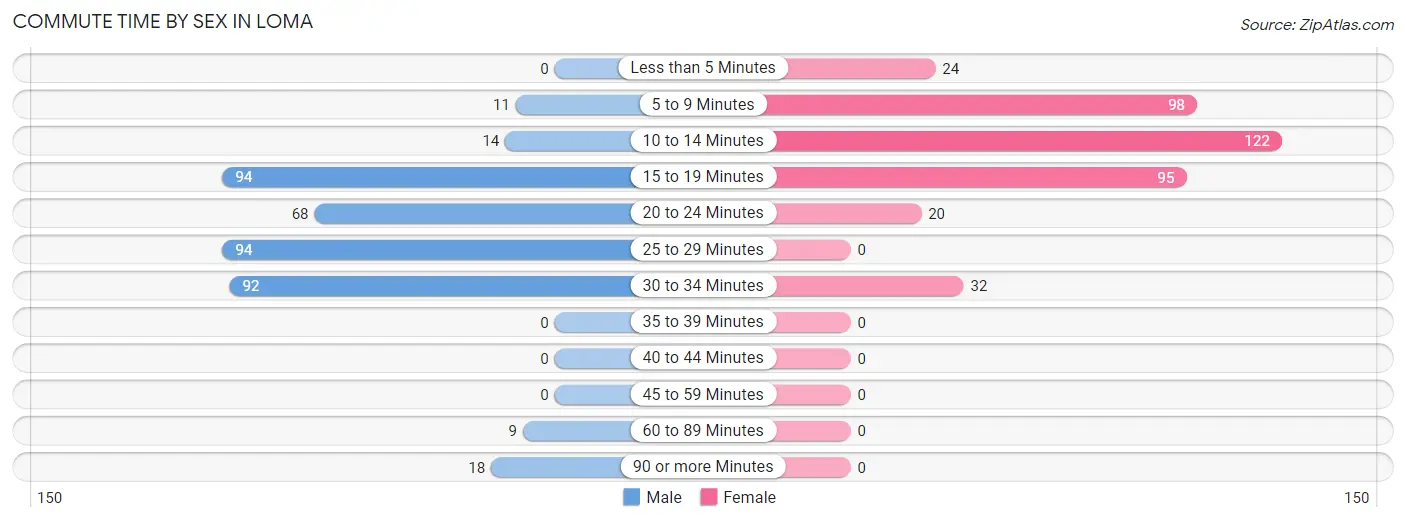
| Commute Time | Male | Female |
| Less than 5 Minutes | 0 (0.0%) | 24 (6.1%) |
| 5 to 9 Minutes | 11 (2.8%) | 98 (25.1%) |
| 10 to 14 Minutes | 14 (3.5%) | 122 (31.2%) |
| 15 to 19 Minutes | 94 (23.5%) | 95 (24.3%) |
| 20 to 24 Minutes | 68 (17.0%) | 20 (5.1%) |
| 25 to 29 Minutes | 94 (23.5%) | 0 (0.0%) |
| 30 to 34 Minutes | 92 (23.0%) | 32 (8.2%) |
| 35 to 39 Minutes | 0 (0.0%) | 0 (0.0%) |
| 40 to 44 Minutes | 0 (0.0%) | 0 (0.0%) |
| 45 to 59 Minutes | 0 (0.0%) | 0 (0.0%) |
| 60 to 89 Minutes | 9 (2.2%) | 0 (0.0%) |
| 90 or more Minutes | 18 (4.5%) | 0 (0.0%) |
Time of Departure to Work by Sex in Loma
The most frequent times of departure to work in Loma are 7:00 AM to 7:29 AM (164, 41.0%) for males and 12:00 PM to 3:59 PM (122, 31.2%) for females.
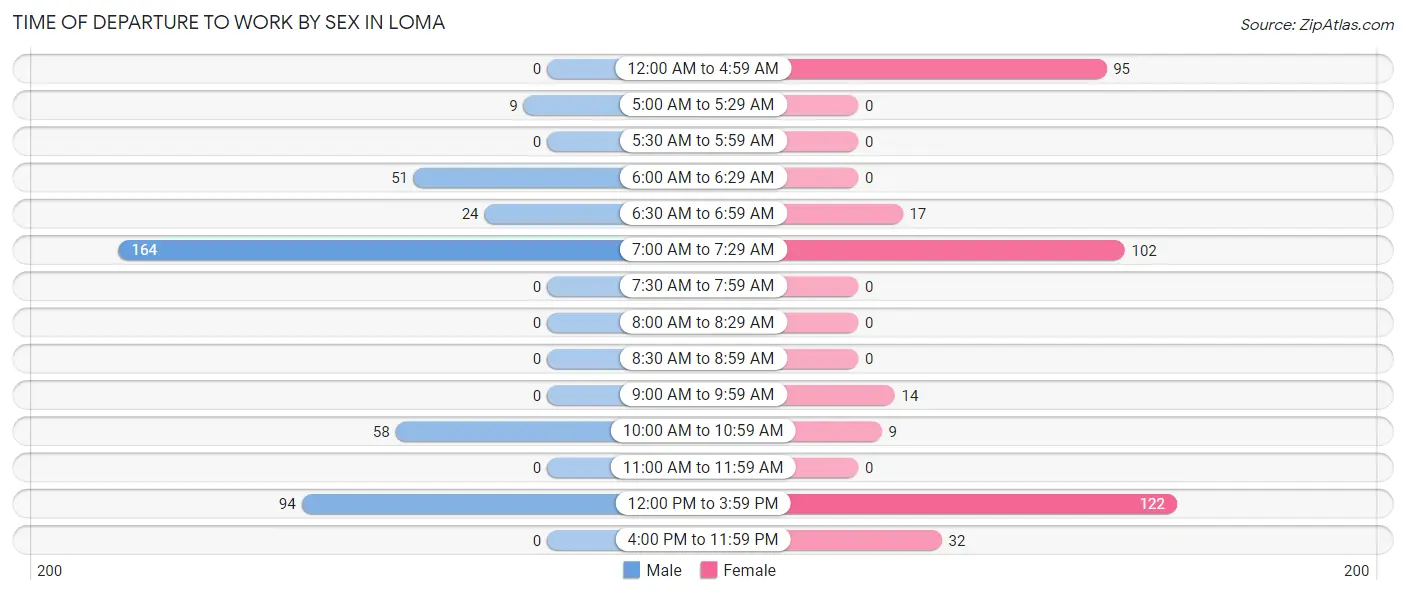
| Time of Departure | Male | Female |
| 12:00 AM to 4:59 AM | 0 (0.0%) | 95 (24.3%) |
| 5:00 AM to 5:29 AM | 9 (2.2%) | 0 (0.0%) |
| 5:30 AM to 5:59 AM | 0 (0.0%) | 0 (0.0%) |
| 6:00 AM to 6:29 AM | 51 (12.8%) | 0 (0.0%) |
| 6:30 AM to 6:59 AM | 24 (6.0%) | 17 (4.3%) |
| 7:00 AM to 7:29 AM | 164 (41.0%) | 102 (26.1%) |
| 7:30 AM to 7:59 AM | 0 (0.0%) | 0 (0.0%) |
| 8:00 AM to 8:29 AM | 0 (0.0%) | 0 (0.0%) |
| 8:30 AM to 8:59 AM | 0 (0.0%) | 0 (0.0%) |
| 9:00 AM to 9:59 AM | 0 (0.0%) | 14 (3.6%) |
| 10:00 AM to 10:59 AM | 58 (14.5%) | 9 (2.3%) |
| 11:00 AM to 11:59 AM | 0 (0.0%) | 0 (0.0%) |
| 12:00 PM to 3:59 PM | 94 (23.5%) | 122 (31.2%) |
| 4:00 PM to 11:59 PM | 0 (0.0%) | 32 (8.2%) |
| Total | 400 (100.0%) | 391 (100.0%) |
Housing Occupancy in Loma
Occupancy by Ownership in Loma
Of the total 350 dwellings in Loma, owner-occupied units account for 304 (86.9%), while renter-occupied units make up 46 (13.1%).
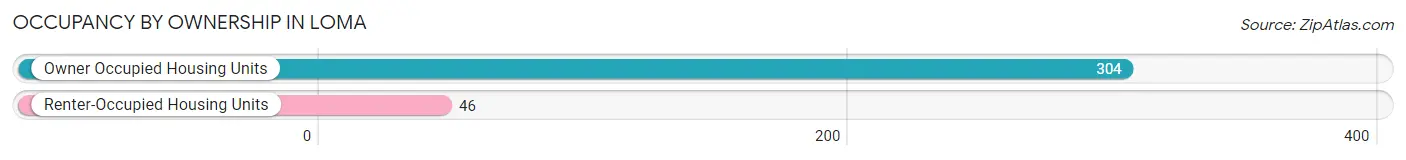
| Occupancy | # Housing Units | % Housing Units |
| Owner Occupied Housing Units | 304 | 86.9% |
| Renter-Occupied Housing Units | 46 | 13.1% |
| Total Occupied Housing Units | 350 | 100.0% |
Occupancy by Household Size in Loma
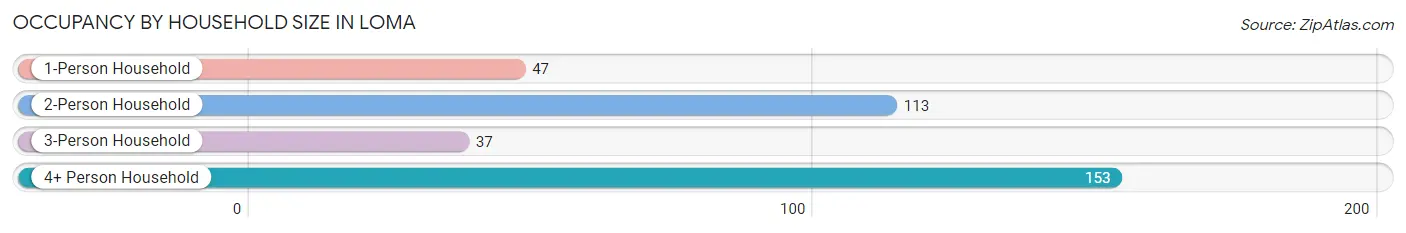
| Household Size | # Housing Units | % Housing Units |
| 1-Person Household | 47 | 13.4% |
| 2-Person Household | 113 | 32.3% |
| 3-Person Household | 37 | 10.6% |
| 4+ Person Household | 153 | 43.7% |
| Total Housing Units | 350 | 100.0% |
Occupancy by Ownership by Household Size in Loma
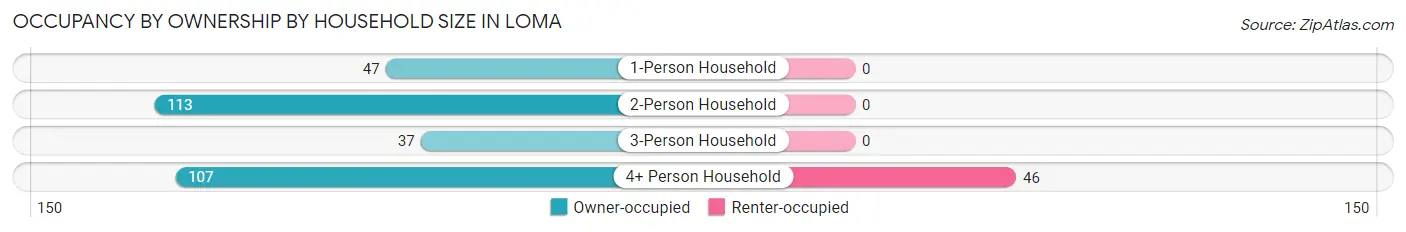
| Household Size | Owner-occupied | Renter-occupied |
| 1-Person Household | 47 (100.0%) | 0 (0.0%) |
| 2-Person Household | 113 (100.0%) | 0 (0.0%) |
| 3-Person Household | 37 (100.0%) | 0 (0.0%) |
| 4+ Person Household | 107 (69.9%) | 46 (30.1%) |
| Total Housing Units | 304 (86.9%) | 46 (13.1%) |
Occupancy by Educational Attainment in Loma
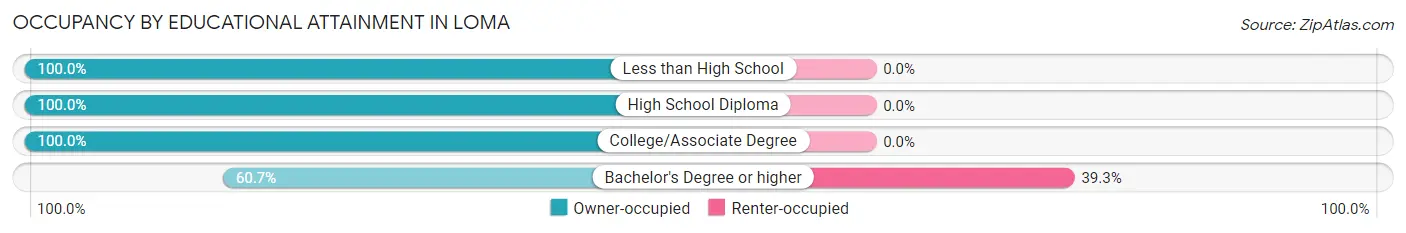
| Household Size | Owner-occupied | Renter-occupied |
| Less than High School | 60 (100.0%) | 0 (0.0%) |
| High School Diploma | 108 (100.0%) | 0 (0.0%) |
| College/Associate Degree | 65 (100.0%) | 0 (0.0%) |
| Bachelor's Degree or higher | 71 (60.7%) | 46 (39.3%) |
Occupancy by Age of Householder in Loma
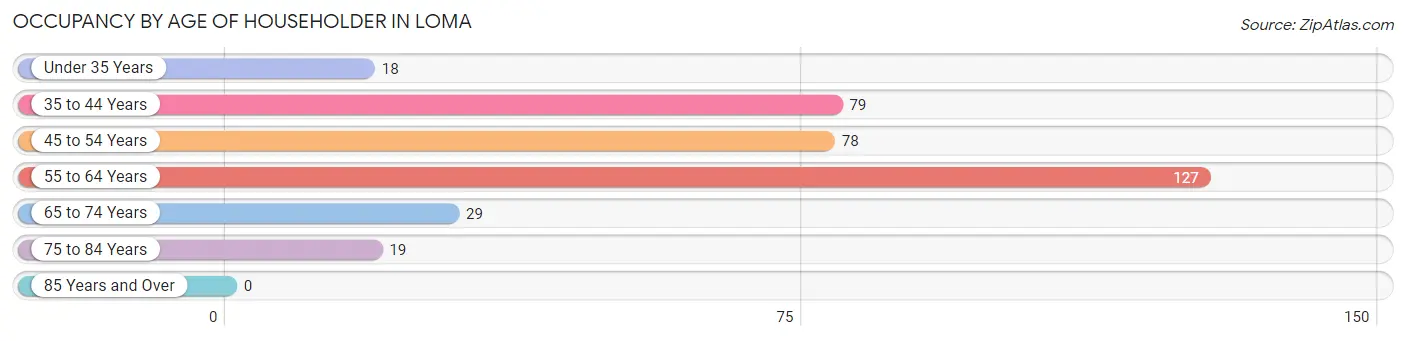
| Age Bracket | # Households | % Households |
| Under 35 Years | 18 | 5.1% |
| 35 to 44 Years | 79 | 22.6% |
| 45 to 54 Years | 78 | 22.3% |
| 55 to 64 Years | 127 | 36.3% |
| 65 to 74 Years | 29 | 8.3% |
| 75 to 84 Years | 19 | 5.4% |
| 85 Years and Over | 0 | 0.0% |
| Total | 350 | 100.0% |
Housing Finances in Loma
Median Income by Occupancy in Loma
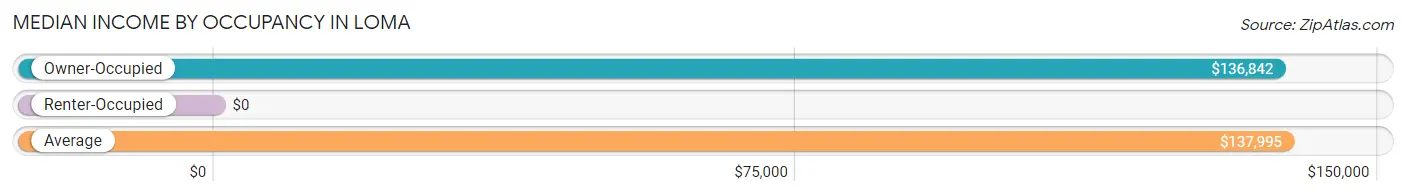
| Occupancy Type | # Households | Median Income |
| Owner-Occupied | 304 (86.9%) | $136,842 |
| Renter-Occupied | 46 (13.1%) | $0 |
| Average | 350 (100.0%) | $137,995 |
Occupancy by Householder Income Bracket in Loma
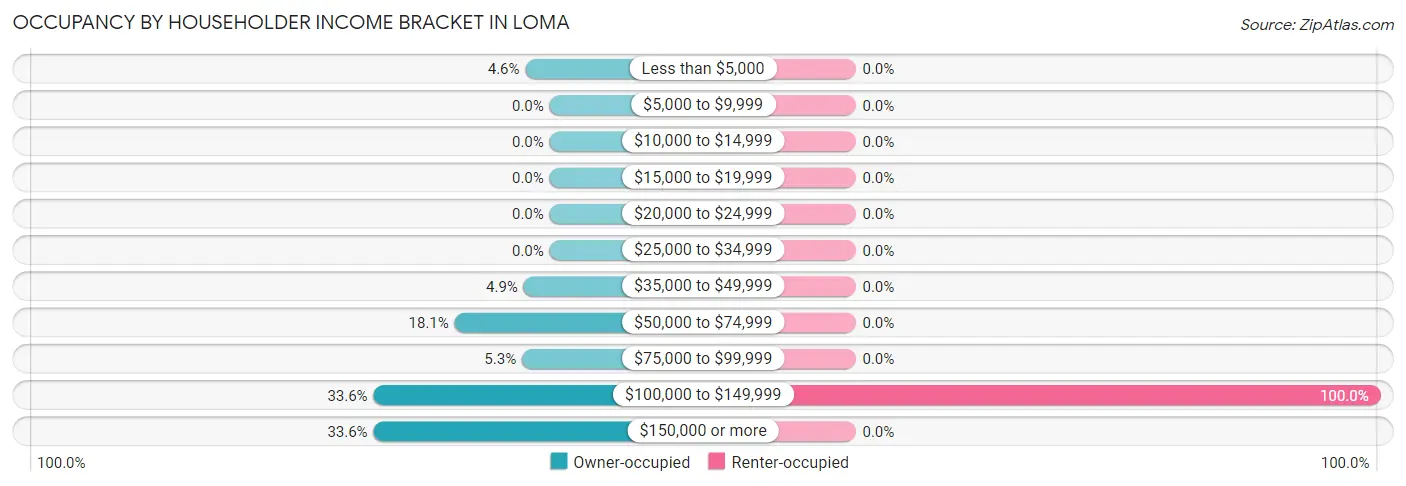
| Income Bracket | Owner-occupied | Renter-occupied |
| Less than $5,000 | 14 (4.6%) | 0 (0.0%) |
| $5,000 to $9,999 | 0 (0.0%) | 0 (0.0%) |
| $10,000 to $14,999 | 0 (0.0%) | 0 (0.0%) |
| $15,000 to $19,999 | 0 (0.0%) | 0 (0.0%) |
| $20,000 to $24,999 | 0 (0.0%) | 0 (0.0%) |
| $25,000 to $34,999 | 0 (0.0%) | 0 (0.0%) |
| $35,000 to $49,999 | 15 (4.9%) | 0 (0.0%) |
| $50,000 to $74,999 | 55 (18.1%) | 0 (0.0%) |
| $75,000 to $99,999 | 16 (5.3%) | 0 (0.0%) |
| $100,000 to $149,999 | 102 (33.6%) | 46 (100.0%) |
| $150,000 or more | 102 (33.6%) | 0 (0.0%) |
| Total | 304 (100.0%) | 46 (100.0%) |
Monthly Housing Cost Tiers in Loma
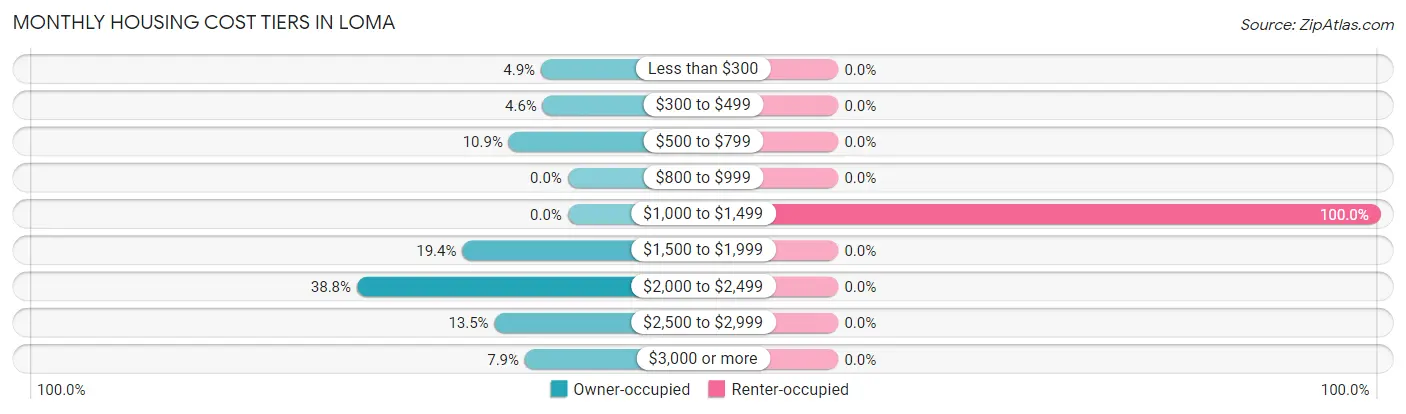
| Monthly Cost | Owner-occupied | Renter-occupied |
| Less than $300 | 15 (4.9%) | 0 (0.0%) |
| $300 to $499 | 14 (4.6%) | 0 (0.0%) |
| $500 to $799 | 33 (10.9%) | 0 (0.0%) |
| $800 to $999 | 0 (0.0%) | 0 (0.0%) |
| $1,000 to $1,499 | 0 (0.0%) | 46 (100.0%) |
| $1,500 to $1,999 | 59 (19.4%) | 0 (0.0%) |
| $2,000 to $2,499 | 118 (38.8%) | 0 (0.0%) |
| $2,500 to $2,999 | 41 (13.5%) | 0 (0.0%) |
| $3,000 or more | 24 (7.9%) | 0 (0.0%) |
| Total | 304 (100.0%) | 46 (100.0%) |
Physical Housing Characteristics in Loma
Housing Structures in Loma
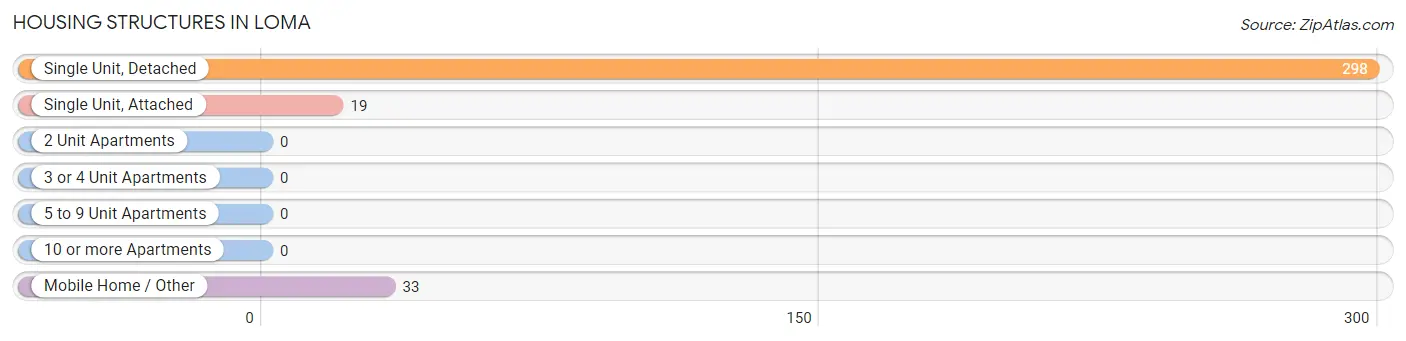
| Structure Type | # Housing Units | % Housing Units |
| Single Unit, Detached | 298 | 85.1% |
| Single Unit, Attached | 19 | 5.4% |
| 2 Unit Apartments | 0 | 0.0% |
| 3 or 4 Unit Apartments | 0 | 0.0% |
| 5 to 9 Unit Apartments | 0 | 0.0% |
| 10 or more Apartments | 0 | 0.0% |
| Mobile Home / Other | 33 | 9.4% |
| Total | 350 | 100.0% |
Housing Structures by Occupancy in Loma
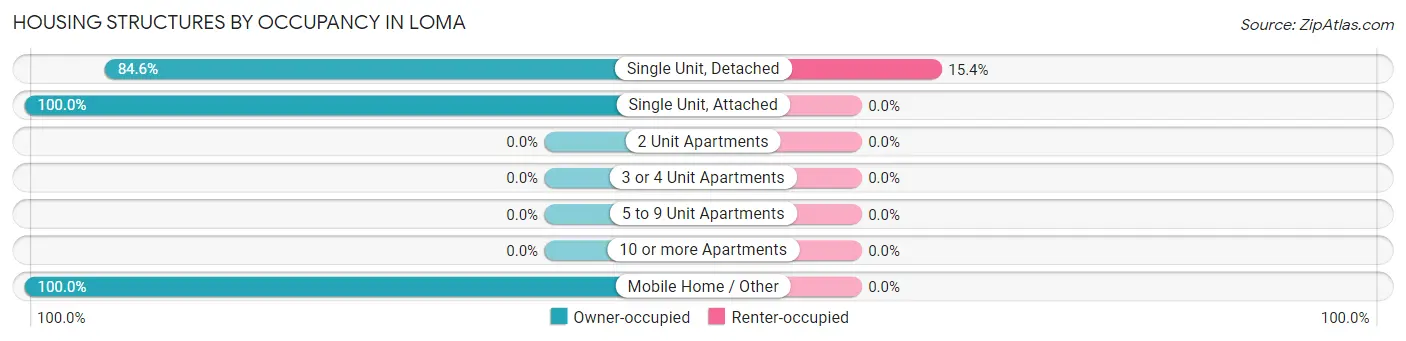
| Structure Type | Owner-occupied | Renter-occupied |
| Single Unit, Detached | 252 (84.6%) | 46 (15.4%) |
| Single Unit, Attached | 19 (100.0%) | 0 (0.0%) |
| 2 Unit Apartments | 0 (0.0%) | 0 (0.0%) |
| 3 or 4 Unit Apartments | 0 (0.0%) | 0 (0.0%) |
| 5 to 9 Unit Apartments | 0 (0.0%) | 0 (0.0%) |
| 10 or more Apartments | 0 (0.0%) | 0 (0.0%) |
| Mobile Home / Other | 33 (100.0%) | 0 (0.0%) |
| Total | 304 (86.9%) | 46 (13.1%) |
Housing Structures by Number of Rooms in Loma
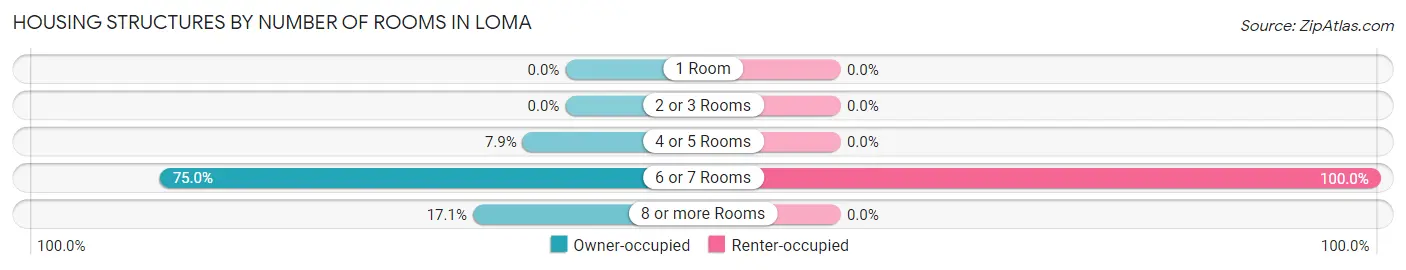
| Number of Rooms | Owner-occupied | Renter-occupied |
| 1 Room | 0 (0.0%) | 0 (0.0%) |
| 2 or 3 Rooms | 0 (0.0%) | 0 (0.0%) |
| 4 or 5 Rooms | 24 (7.9%) | 0 (0.0%) |
| 6 or 7 Rooms | 228 (75.0%) | 46 (100.0%) |
| 8 or more Rooms | 52 (17.1%) | 0 (0.0%) |
| Total | 304 (100.0%) | 46 (100.0%) |
Housing Structure by Heating Type in Loma
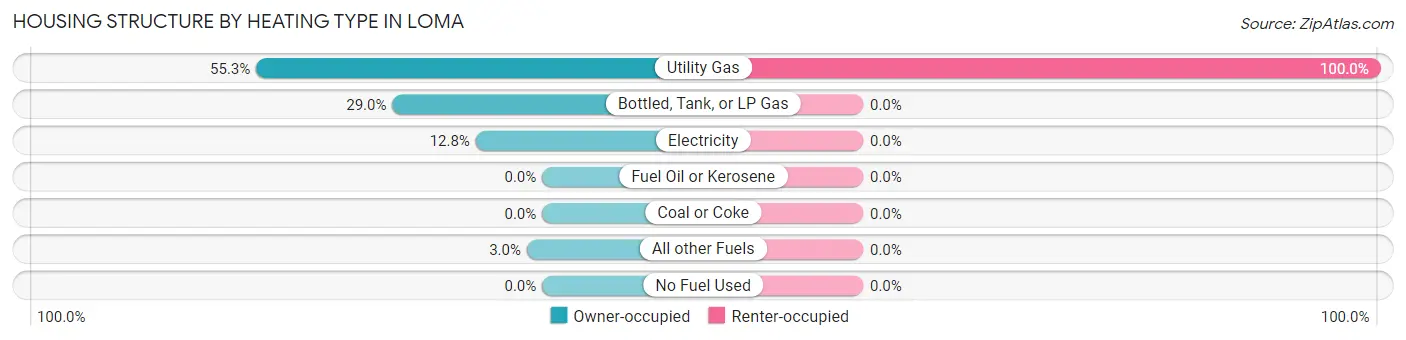
| Heating Type | Owner-occupied | Renter-occupied |
| Utility Gas | 168 (55.3%) | 46 (100.0%) |
| Bottled, Tank, or LP Gas | 88 (28.9%) | 0 (0.0%) |
| Electricity | 39 (12.8%) | 0 (0.0%) |
| Fuel Oil or Kerosene | 0 (0.0%) | 0 (0.0%) |
| Coal or Coke | 0 (0.0%) | 0 (0.0%) |
| All other Fuels | 9 (3.0%) | 0 (0.0%) |
| No Fuel Used | 0 (0.0%) | 0 (0.0%) |
| Total | 304 (100.0%) | 46 (100.0%) |
Household Vehicle Usage in Loma
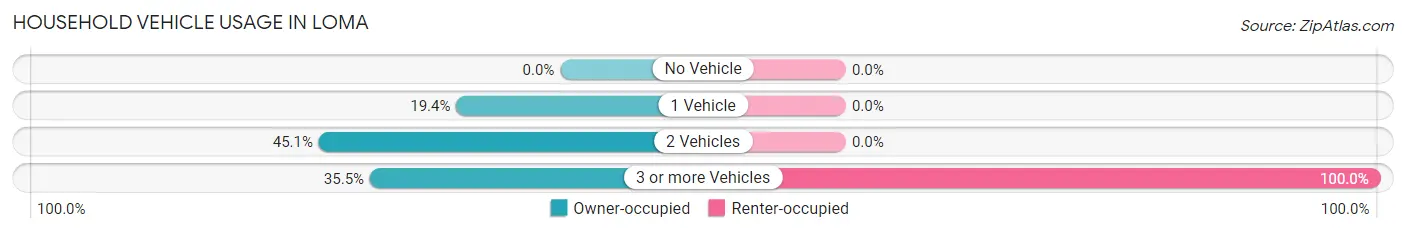
| Vehicles per Household | Owner-occupied | Renter-occupied |
| No Vehicle | 0 (0.0%) | 0 (0.0%) |
| 1 Vehicle | 59 (19.4%) | 0 (0.0%) |
| 2 Vehicles | 137 (45.1%) | 0 (0.0%) |
| 3 or more Vehicles | 108 (35.5%) | 46 (100.0%) |
| Total | 304 (100.0%) | 46 (100.0%) |
Real Estate & Mortgages in Loma
Real Estate and Mortgage Overview in Loma
| Characteristic | Without Mortgage | With Mortgage |
| Housing Units | 62 | 242 |
| Median Property Value | - | - |
| Median Household Income | - | - |
| Monthly Housing Costs | $514 | $24 |
| Real Estate Taxes | $1,670 | $0 |
Property Value by Mortgage Status in Loma
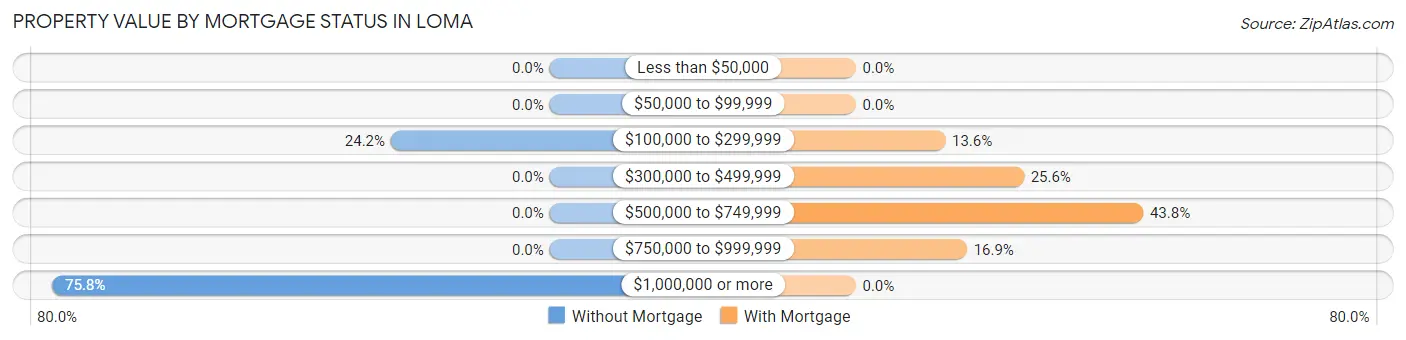
| Property Value | Without Mortgage | With Mortgage |
| Less than $50,000 | 0 (0.0%) | 0 (0.0%) |
| $50,000 to $99,999 | 0 (0.0%) | 0 (0.0%) |
| $100,000 to $299,999 | 15 (24.2%) | 33 (13.6%) |
| $300,000 to $499,999 | 0 (0.0%) | 62 (25.6%) |
| $500,000 to $749,999 | 0 (0.0%) | 106 (43.8%) |
| $750,000 to $999,999 | 0 (0.0%) | 41 (16.9%) |
| $1,000,000 or more | 47 (75.8%) | 0 (0.0%) |
| Total | 62 (100.0%) | 242 (100.0%) |
Household Income by Mortgage Status in Loma
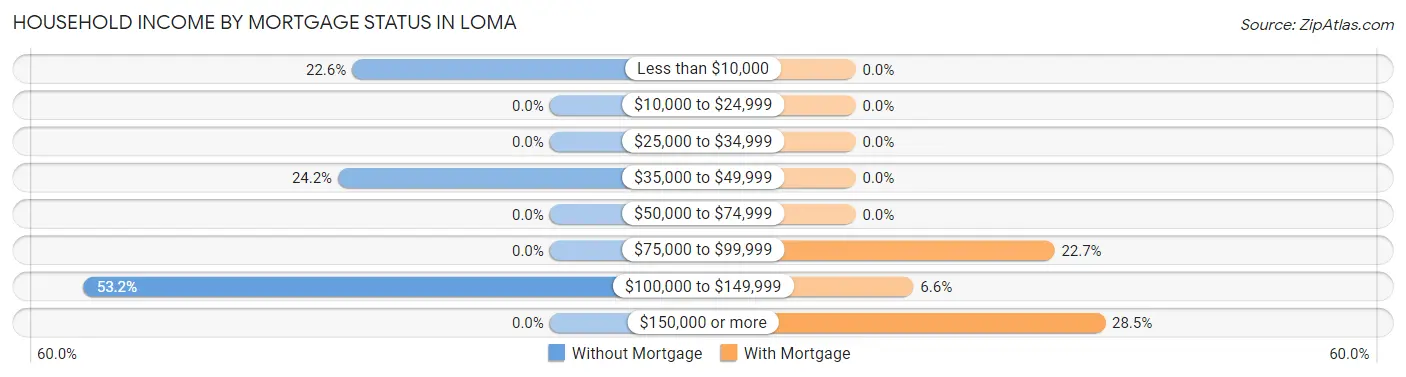
| Household Income | Without Mortgage | With Mortgage |
| Less than $10,000 | 14 (22.6%) | 0 (0.0%) |
| $10,000 to $24,999 | 0 (0.0%) | 0 (0.0%) |
| $25,000 to $34,999 | 0 (0.0%) | 0 (0.0%) |
| $35,000 to $49,999 | 15 (24.2%) | 0 (0.0%) |
| $50,000 to $74,999 | 0 (0.0%) | 0 (0.0%) |
| $75,000 to $99,999 | 0 (0.0%) | 55 (22.7%) |
| $100,000 to $149,999 | 33 (53.2%) | 16 (6.6%) |
| $150,000 or more | 0 (0.0%) | 69 (28.5%) |
| Total | 62 (100.0%) | 242 (100.0%) |
Property Value to Household Income Ratio in Loma
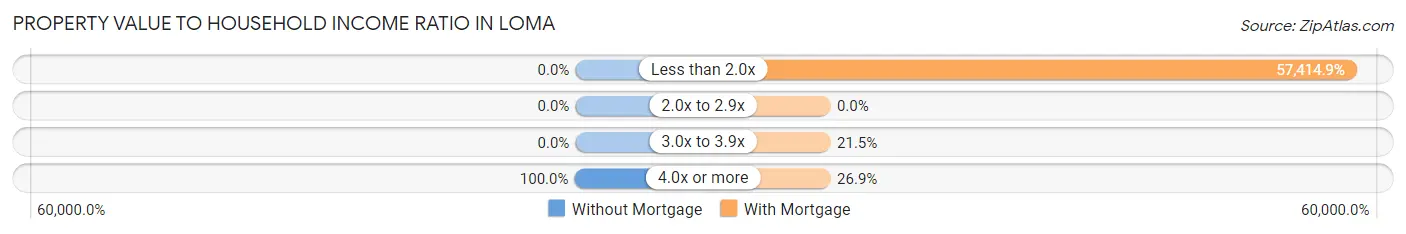
| Value-to-Income Ratio | Without Mortgage | With Mortgage |
| Less than 2.0x | 0 (0.0%) | 138,944 (57,414.9%) |
| 2.0x to 2.9x | 0 (0.0%) | 0 (0.0%) |
| 3.0x to 3.9x | 0 (0.0%) | 52 (21.5%) |
| 4.0x or more | 62 (100.0%) | 65 (26.9%) |
| Total | 62 (100.0%) | 242 (100.0%) |
Real Estate Taxes by Mortgage Status in Loma
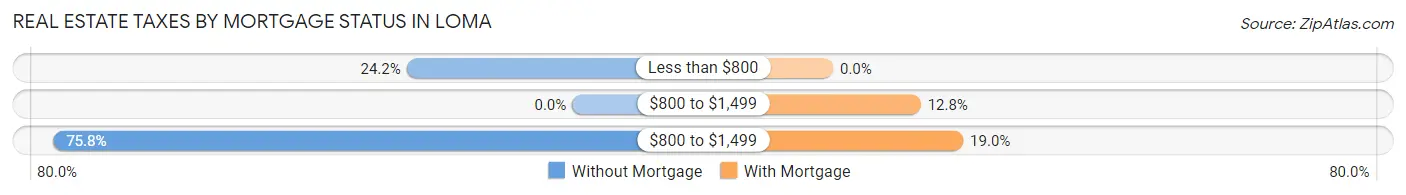
| Property Taxes | Without Mortgage | With Mortgage |
| Less than $800 | 15 (24.2%) | 0 (0.0%) |
| $800 to $1,499 | 0 (0.0%) | 31 (12.8%) |
| $800 to $1,499 | 47 (75.8%) | 46 (19.0%) |
| Total | 62 (100.0%) | 242 (100.0%) |
Health & Disability in Loma
Health Insurance Coverage by Age in Loma
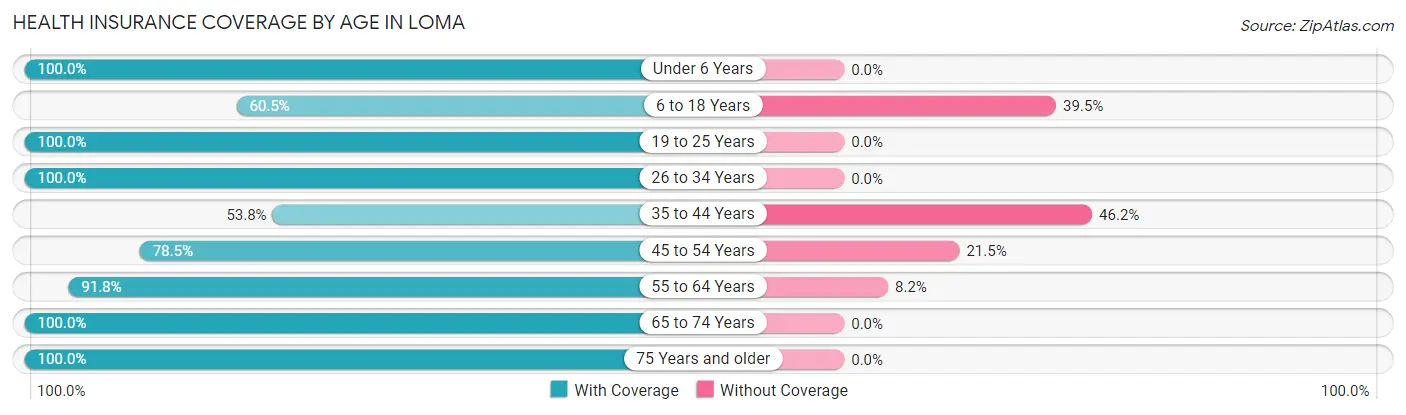
| Age Bracket | With Coverage | Without Coverage |
| Under 6 Years | 65 (100.0%) | 0 (0.0%) |
| 6 to 18 Years | 349 (60.5%) | 228 (39.5%) |
| 19 to 25 Years | 155 (100.0%) | 0 (0.0%) |
| 26 to 34 Years | 27 (100.0%) | 0 (0.0%) |
| 35 to 44 Years | 135 (53.8%) | 116 (46.2%) |
| 45 to 54 Years | 106 (78.5%) | 29 (21.5%) |
| 55 to 64 Years | 191 (91.8%) | 17 (8.2%) |
| 65 to 74 Years | 44 (100.0%) | 0 (0.0%) |
| 75 Years and older | 19 (100.0%) | 0 (0.0%) |
| Total | 1,091 (73.7%) | 390 (26.3%) |
Health Insurance Coverage by Citizenship Status in Loma
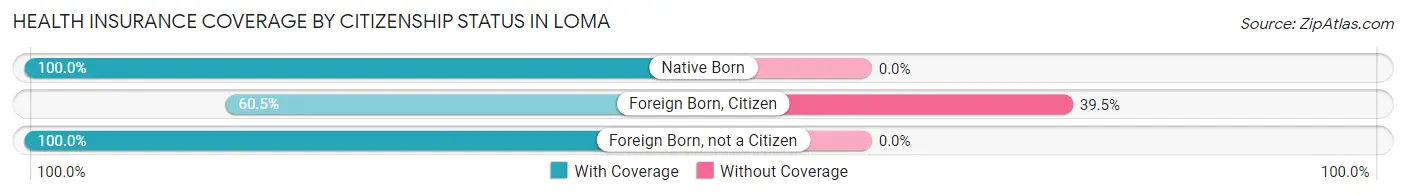
| Citizenship Status | With Coverage | Without Coverage |
| Native Born | 65 (100.0%) | 0 (0.0%) |
| Foreign Born, Citizen | 349 (60.5%) | 228 (39.5%) |
| Foreign Born, not a Citizen | 155 (100.0%) | 0 (0.0%) |
Health Insurance Coverage by Household Income in Loma
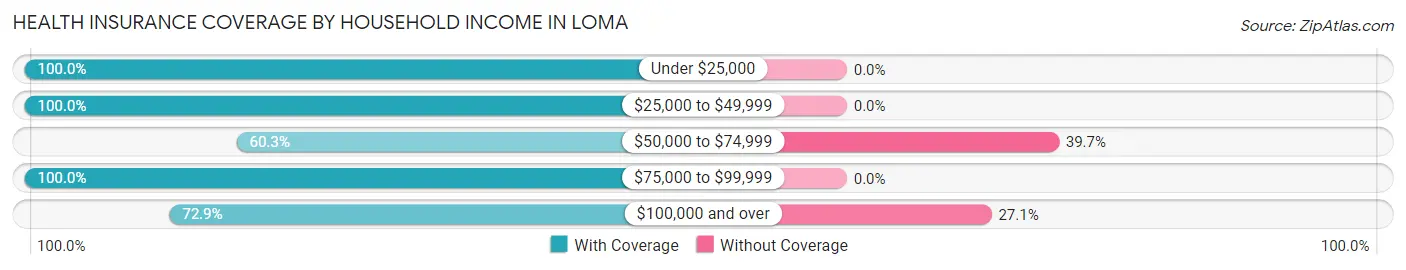
| Household Income | With Coverage | Without Coverage |
| Under $25,000 | 14 (100.0%) | 0 (0.0%) |
| $25,000 to $49,999 | 15 (100.0%) | 0 (0.0%) |
| $50,000 to $74,999 | 85 (60.3%) | 56 (39.7%) |
| $75,000 to $99,999 | 79 (100.0%) | 0 (0.0%) |
| $100,000 and over | 898 (72.9%) | 334 (27.1%) |
Public vs Private Health Insurance Coverage by Age in Loma
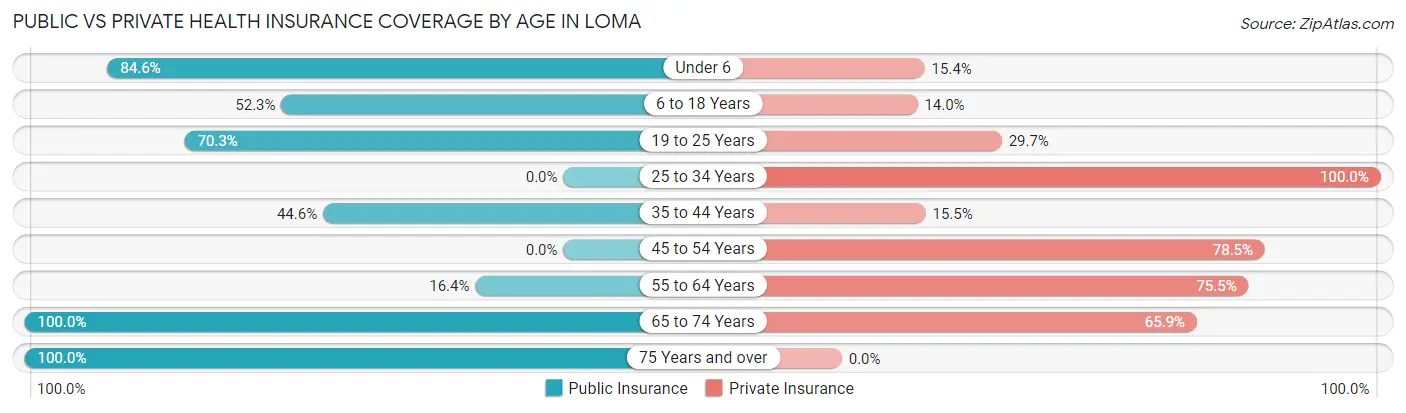
| Age Bracket | Public Insurance | Private Insurance |
| Under 6 | 55 (84.6%) | 10 (15.4%) |
| 6 to 18 Years | 302 (52.3%) | 81 (14.0%) |
| 19 to 25 Years | 109 (70.3%) | 46 (29.7%) |
| 25 to 34 Years | 0 (0.0%) | 27 (100.0%) |
| 35 to 44 Years | 112 (44.6%) | 39 (15.5%) |
| 45 to 54 Years | 0 (0.0%) | 106 (78.5%) |
| 55 to 64 Years | 34 (16.4%) | 157 (75.5%) |
| 65 to 74 Years | 44 (100.0%) | 29 (65.9%) |
| 75 Years and over | 19 (100.0%) | 0 (0.0%) |
| Total | 675 (45.6%) | 495 (33.4%) |
Disability Status by Sex by Age in Loma
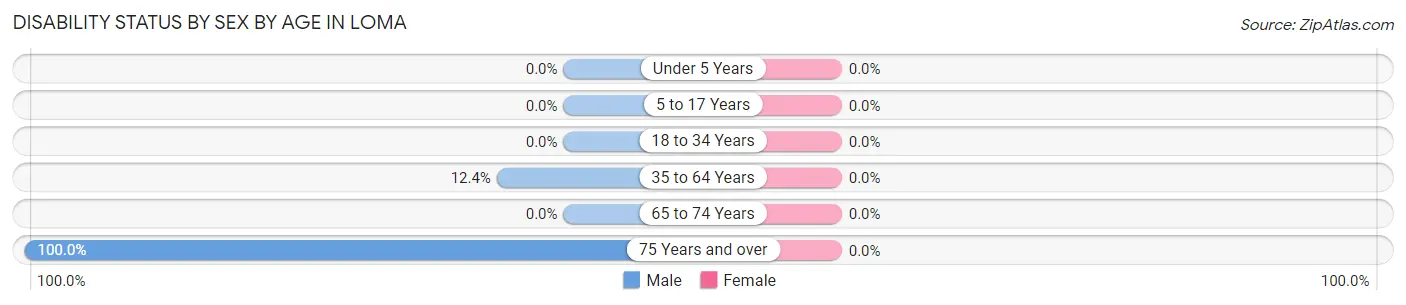
| Age Bracket | Male | Female |
| Under 5 Years | 0 (0.0%) | 0 (0.0%) |
| 5 to 17 Years | 0 (0.0%) | 0 (0.0%) |
| 18 to 34 Years | 0 (0.0%) | 0 (0.0%) |
| 35 to 64 Years | 36 (12.4%) | 0 (0.0%) |
| 65 to 74 Years | 0 (0.0%) | 0 (0.0%) |
| 75 Years and over | 19 (100.0%) | 0 (0.0%) |
Disability Class by Sex by Age in Loma
Disability Class: Hearing Difficulty
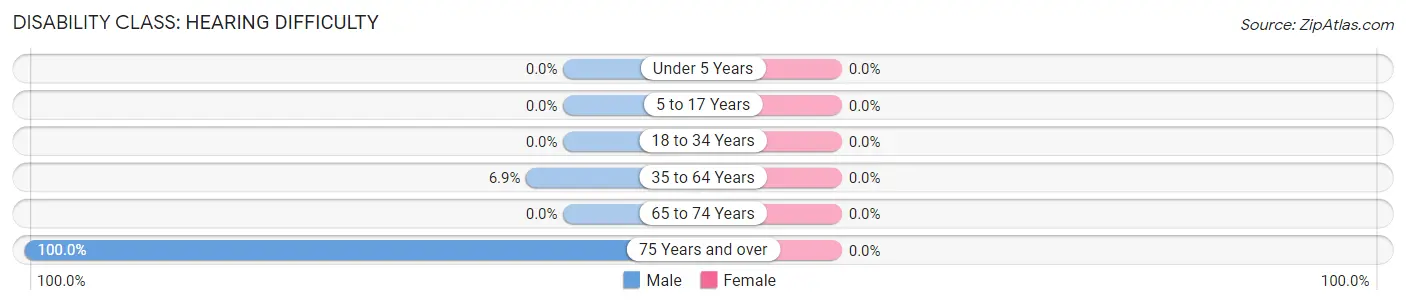
| Age Bracket | Male | Female |
| Under 5 Years | 0 (0.0%) | 0 (0.0%) |
| 5 to 17 Years | 0 (0.0%) | 0 (0.0%) |
| 18 to 34 Years | 0 (0.0%) | 0 (0.0%) |
| 35 to 64 Years | 20 (6.9%) | 0 (0.0%) |
| 65 to 74 Years | 0 (0.0%) | 0 (0.0%) |
| 75 Years and over | 19 (100.0%) | 0 (0.0%) |
Disability Class: Vision Difficulty
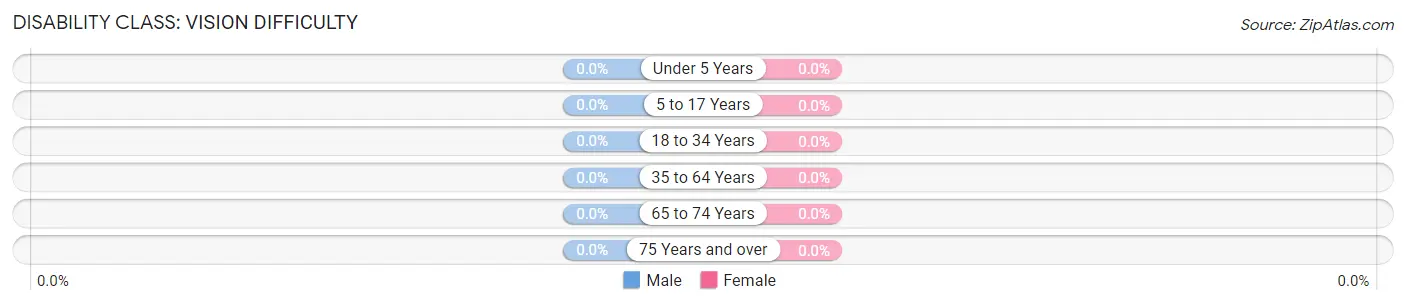
| Age Bracket | Male | Female |
| Under 5 Years | 0 (0.0%) | 0 (0.0%) |
| 5 to 17 Years | 0 (0.0%) | 0 (0.0%) |
| 18 to 34 Years | 0 (0.0%) | 0 (0.0%) |
| 35 to 64 Years | 0 (0.0%) | 0 (0.0%) |
| 65 to 74 Years | 0 (0.0%) | 0 (0.0%) |
| 75 Years and over | 0 (0.0%) | 0 (0.0%) |
Disability Class: Cognitive Difficulty

| Age Bracket | Male | Female |
| 5 to 17 Years | 0 (0.0%) | 0 (0.0%) |
| 18 to 34 Years | 0 (0.0%) | 0 (0.0%) |
| 35 to 64 Years | 16 (5.5%) | 0 (0.0%) |
| 65 to 74 Years | 0 (0.0%) | 0 (0.0%) |
| 75 Years and over | 0 (0.0%) | 0 (0.0%) |
Disability Class: Ambulatory Difficulty
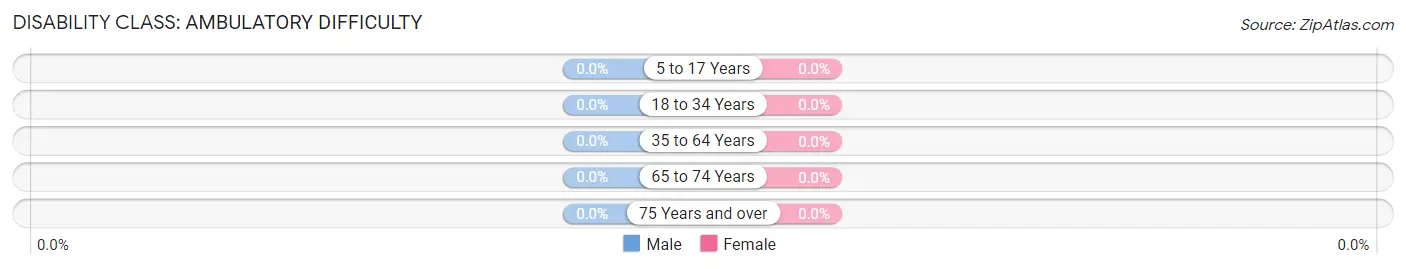
| Age Bracket | Male | Female |
| 5 to 17 Years | 0 (0.0%) | 0 (0.0%) |
| 18 to 34 Years | 0 (0.0%) | 0 (0.0%) |
| 35 to 64 Years | 0 (0.0%) | 0 (0.0%) |
| 65 to 74 Years | 0 (0.0%) | 0 (0.0%) |
| 75 Years and over | 0 (0.0%) | 0 (0.0%) |
Disability Class: Self-Care Difficulty
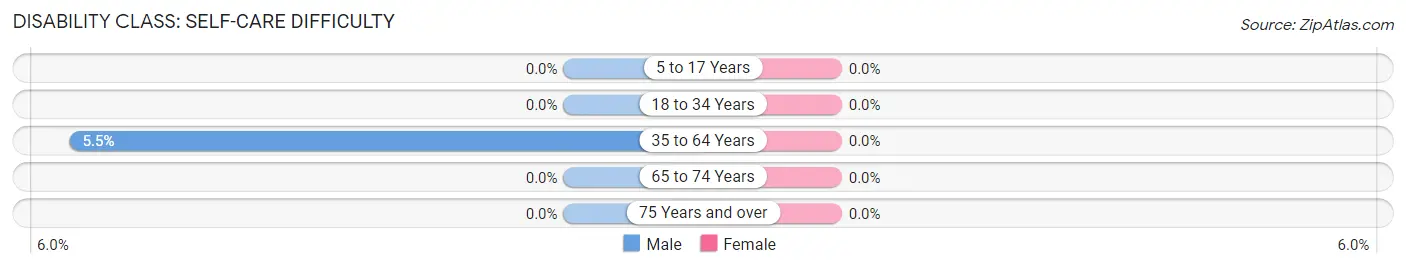
| Age Bracket | Male | Female |
| 5 to 17 Years | 0 (0.0%) | 0 (0.0%) |
| 18 to 34 Years | 0 (0.0%) | 0 (0.0%) |
| 35 to 64 Years | 16 (5.5%) | 0 (0.0%) |
| 65 to 74 Years | 0 (0.0%) | 0 (0.0%) |
| 75 Years and over | 0 (0.0%) | 0 (0.0%) |
Technology Access in Loma
Computing Device Access in Loma
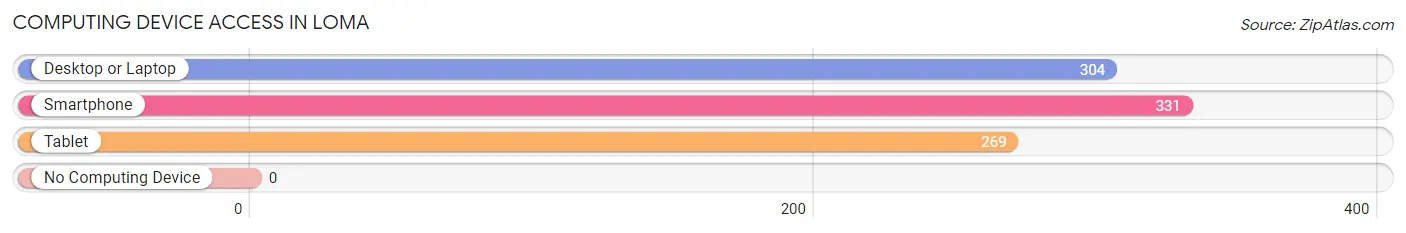
| Device Type | # Households | % Households |
| Desktop or Laptop | 304 | 86.9% |
| Smartphone | 331 | 94.6% |
| Tablet | 269 | 76.9% |
| No Computing Device | 0 | 0.0% |
| Total | 350 | 100.0% |
Internet Access in Loma
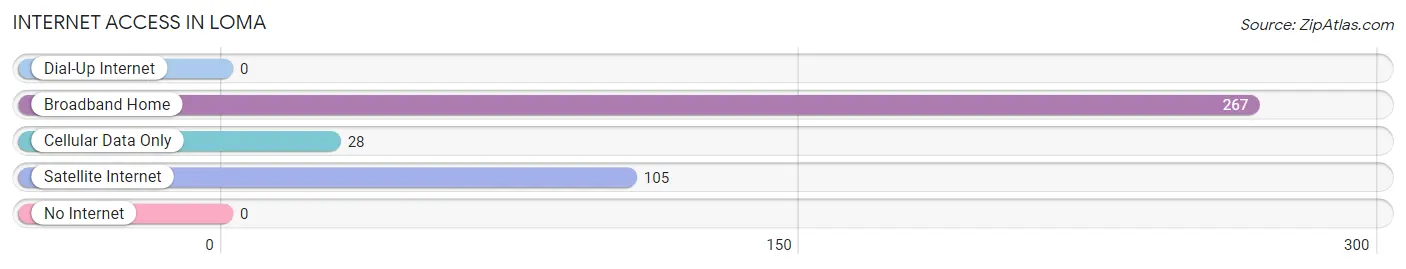
| Internet Type | # Households | % Households |
| Dial-Up Internet | 0 | 0.0% |
| Broadband Home | 267 | 76.3% |
| Cellular Data Only | 28 | 8.0% |
| Satellite Internet | 105 | 30.0% |
| No Internet | 0 | 0.0% |
| Total | 350 | 100.0% |
Loma Summary
Loma is a small unincorporated community located in Mesa County, Colorado, United States. It is situated along the Colorado River, approximately 10 miles (16 km) east of Grand Junction. The population of Loma was estimated to be 1,845 in 2019.
History
Loma was first settled in the late 1800s by ranchers and farmers. The town was named after the nearby Loma Creek, which was named by early settlers for the Spanish word for "ridge". The town was officially incorporated in 1909.
In the early 1900s, Loma was a thriving agricultural community, with many farms and ranches in the area. The town was also home to a number of businesses, including a general store, a hotel, a blacksmith shop, and a post office.
In the 1950s, the town began to decline as many of the farms and ranches in the area were sold off. The town's population decreased from a peak of over 1,000 in the 1940s to just over 500 in the 1970s.
Geography
Loma is located in western Colorado, approximately 10 miles (16 km) east of Grand Junction. The town is situated along the Colorado River, at an elevation of 4,890 feet (1,490 m).
The town is surrounded by rolling hills and mesas, with the Book Cliffs to the north and the Grand Mesa to the south. The area is known for its mild climate, with warm summers and mild winters.
Economy
Loma's economy is largely based on agriculture and tourism. The town is home to several farms and ranches, as well as a number of tourist attractions, including the Colorado National Monument and the Dinosaur Journey Museum.
The town is also home to a number of businesses, including a general store, a hotel, a restaurant, and a post office.
Demographics
As of the 2010 census, the population of Loma was 1,845. The racial makeup of the town was 95.3% White, 0.3% African American, 0.7% Native American, 0.2% Asian, 0.1% Pacific Islander, 1.2% from other races, and 2.3% from two or more races. Hispanic or Latino of any race were 4.2% of the population.
The median household income in Loma was $45,000, and the median family income was $50,000. The per capita income for the town was $20,000. About 10.3% of families and 13.2% of the population were below the poverty line, including 17.2% of those under age 18 and 8.3% of those age 65 or over.
Common Questions
What is Per Capita Income in Loma?
Per Capita income in Loma is $36,372.
What is the Median Family Income in Loma?
Median Family Income in Loma is $138,528.
What is the Median Household income in Loma?
Median Household Income in Loma is $137,995.
What is Inequality or Gini Index in Loma?
Inequality or Gini Index in Loma is 0.28.
What is the Total Population of Loma?
Total Population of Loma is 1,481.
What is the Total Male Population of Loma?
Total Male Population of Loma is 595.
What is the Total Female Population of Loma?
Total Female Population of Loma is 886.
What is the Ratio of Males per 100 Females in Loma?
There are 67.16 Males per 100 Females in Loma.
What is the Ratio of Females per 100 Males in Loma?
There are 148.91 Females per 100 Males in Loma.
What is the Median Population Age in Loma?
Median Population Age in Loma is 20.6 Years.
What is the Average Family Size in Loma
Average Family Size in Loma is 3.2 People.
What is the Average Household Size in Loma
Average Household Size in Loma is 4.2 People.
How Large is the Labor Force in Loma?
There are 864 People in the Labor Forcein in Loma.
What is the Percentage of People in the Labor Force in Loma?
87.6% of People are in the Labor Force in Loma.
What is the Unemployment Rate in Loma?
Unemployment Rate in Loma is 1.5%.