Lewis, CO Map & Demographics
Lewis Map
Lewis Overview
$30,321
PER CAPITA INCOME
$100,682
AVG FAMILY INCOME
$86,591
AVG HOUSEHOLD INCOME
0.14
INEQUALITY / GINI INDEX
149
TOTAL POPULATION
58
MALE POPULATION
91
FEMALE POPULATION
63.74
MALES / 100 FEMALES
156.90
FEMALES / 100 MALES
30.0
MEDIAN AGE
3.9
AVG FAMILY SIZE
2.9
AVG HOUSEHOLD SIZE
61
LABOR FORCE [ PEOPLE ]
54.5%
PERCENT IN LABOR FORCE
Lewis Zip Codes
Lewis Area Codes
Income in Lewis
Income Overview in Lewis
Per Capita Income in Lewis is $30,321, while median incomes of families and households are $100,682 and $86,591 respectively.
| Characteristic | Number | Measure |
| Per Capita Income | 149 | $30,321 |
| Median Family Income | 30 | $100,682 |
| Mean Family Income | 30 | $113,010 |
| Median Household Income | 52 | $86,591 |
| Mean Household Income | 52 | $101,790 |
| Income Deficit | 30 | $0 |
| Wage / Income Gap (%) | 149 | 0.00% |
| Wage / Income Gap ($) | 149 | 100.00¢ per $1 |
| Gini / Inequality Index | 149 | 0.14 |
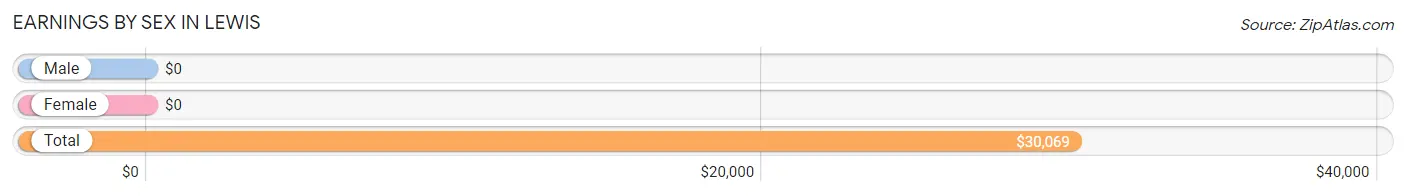
Earnings by Sex in Lewis
| Sex | Number | Average Earnings |
| Male | 32 (41.6%) | $0 |
| Female | 45 (58.4%) | $0 |
| Total | 77 (100.0%) | $30,069 |
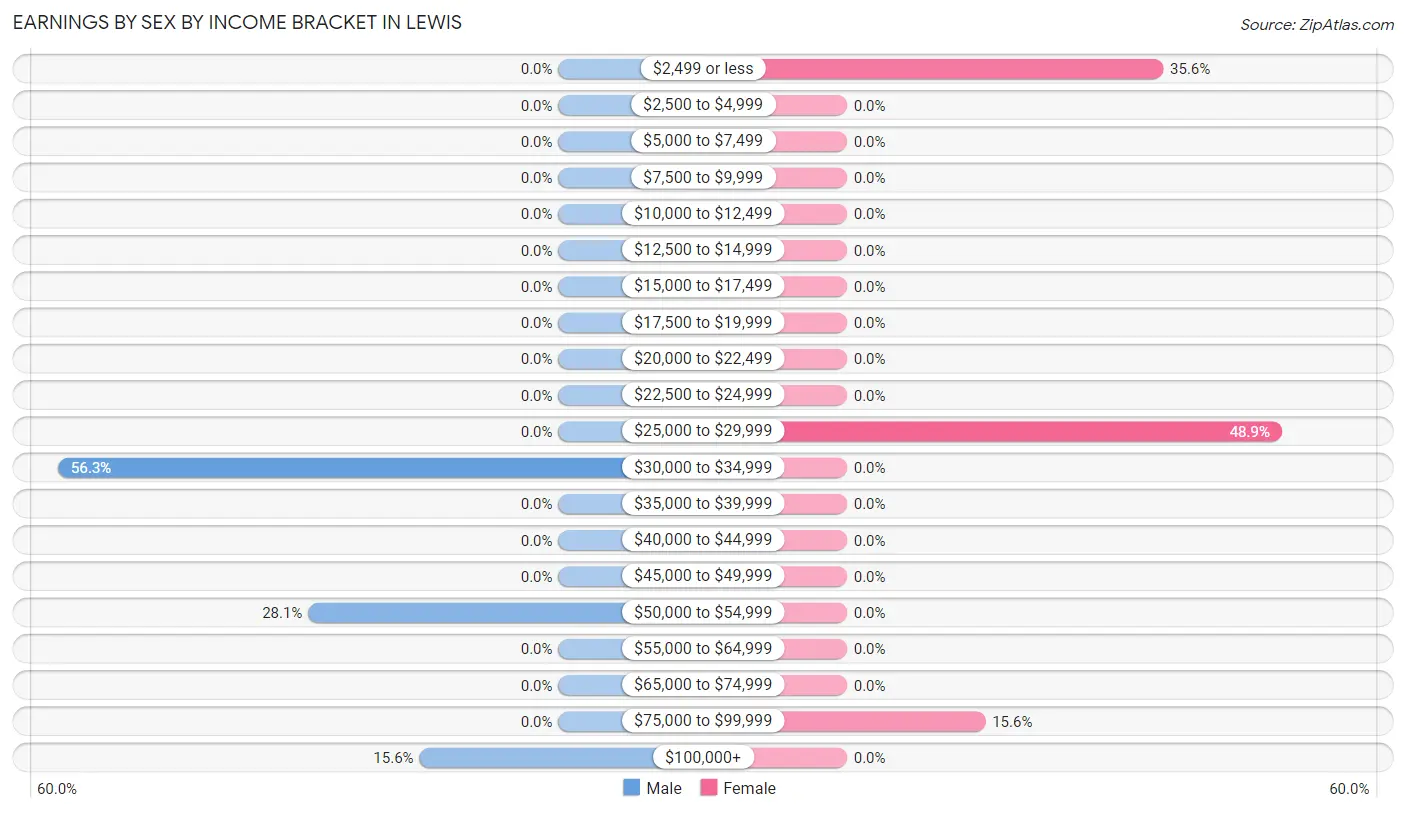
Earnings by Sex by Income Bracket in Lewis
The most common earnings brackets in Lewis are $30,000 to $34,999 for men (18 | 56.2%) and $25,000 to $29,999 for women (22 | 48.9%).
| Income | Male | Female |
| $2,499 or less | 0 (0.0%) | 16 (35.6%) |
| $2,500 to $4,999 | 0 (0.0%) | 0 (0.0%) |
| $5,000 to $7,499 | 0 (0.0%) | 0 (0.0%) |
| $7,500 to $9,999 | 0 (0.0%) | 0 (0.0%) |
| $10,000 to $12,499 | 0 (0.0%) | 0 (0.0%) |
| $12,500 to $14,999 | 0 (0.0%) | 0 (0.0%) |
| $15,000 to $17,499 | 0 (0.0%) | 0 (0.0%) |
| $17,500 to $19,999 | 0 (0.0%) | 0 (0.0%) |
| $20,000 to $22,499 | 0 (0.0%) | 0 (0.0%) |
| $22,500 to $24,999 | 0 (0.0%) | 0 (0.0%) |
| $25,000 to $29,999 | 0 (0.0%) | 22 (48.9%) |
| $30,000 to $34,999 | 18 (56.2%) | 0 (0.0%) |
| $35,000 to $39,999 | 0 (0.0%) | 0 (0.0%) |
| $40,000 to $44,999 | 0 (0.0%) | 0 (0.0%) |
| $45,000 to $49,999 | 0 (0.0%) | 0 (0.0%) |
| $50,000 to $54,999 | 9 (28.1%) | 0 (0.0%) |
| $55,000 to $64,999 | 0 (0.0%) | 0 (0.0%) |
| $65,000 to $74,999 | 0 (0.0%) | 0 (0.0%) |
| $75,000 to $99,999 | 0 (0.0%) | 7 (15.6%) |
| $100,000+ | 5 (15.6%) | 0 (0.0%) |
| Total | 32 (100.0%) | 45 (100.0%) |
Earnings by Sex by Educational Attainment in Lewis
| Educational Attainment | Male Income | Female Income |
| Less than High School | - | - |
| High School Diploma | - | - |
| College or Associate's Degree | - | - |
| Bachelor's Degree | - | - |
| Graduate Degree | - | - |
| Total | - | - |
Family Income in Lewis
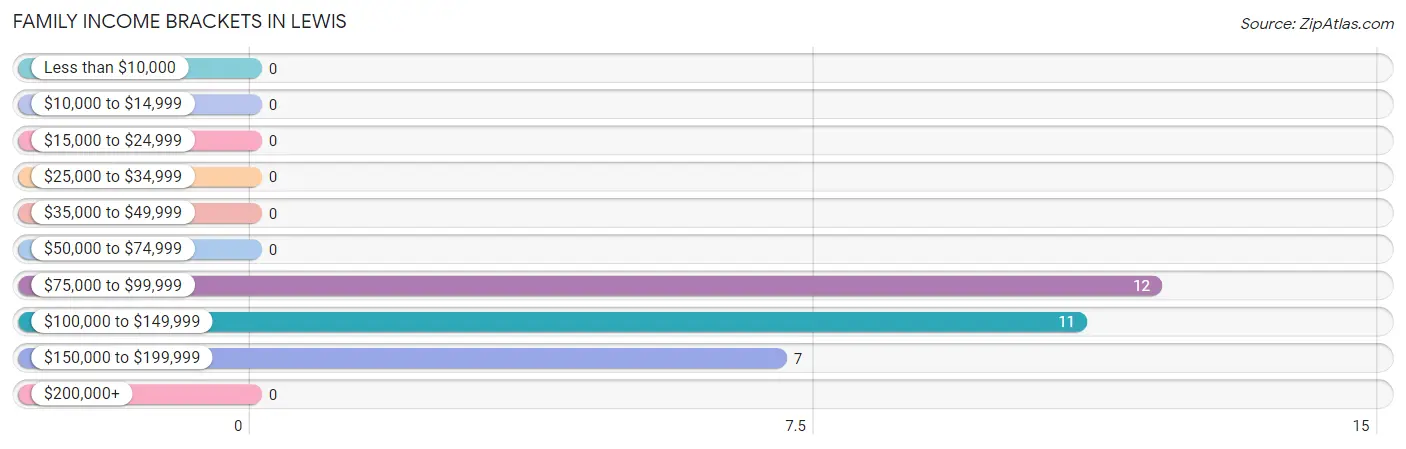
Family Income Brackets in Lewis
According to the Lewis family income data, there are 12 families falling into the $75,000 to $99,999 income range, which is the most common income bracket and makes up 40.0% of all families.
| Income Bracket | # Families | % Families |
| Less than $10,000 | 0 | 0.0% |
| $10,000 to $14,999 | 0 | 0.0% |
| $15,000 to $24,999 | 0 | 0.0% |
| $25,000 to $34,999 | 0 | 0.0% |
| $35,000 to $49,999 | 0 | 0.0% |
| $50,000 to $74,999 | 0 | 0.0% |
| $75,000 to $99,999 | 12 | 40.0% |
| $100,000 to $149,999 | 11 | 36.7% |
| $150,000 to $199,999 | 7 | 23.3% |
| $200,000+ | 0 | 0.0% |
Family Income by Famaliy Size in Lewis
| Income Bracket | # Families | Median Income |
| 2-Person Families | 11 (36.7%) | $0 |
| 3-Person Families | 0 (0.0%) | $0 |
| 4-Person Families | 7 (23.3%) | $0 |
| 5-Person Families | 12 (40.0%) | $0 |
| 6-Person Families | 0 (0.0%) | $0 |
| 7+ Person Families | 0 (0.0%) | $0 |
| Total | 30 (100.0%) | $100,682 |
Family Income by Number of Earners in Lewis
| Number of Earners | # Families | Median Income |
| No Earners | 11 (36.7%) | $0 |
| 1 Earner | 0 (0.0%) | $0 |
| 2 Earners | 19 (63.3%) | $0 |
| 3+ Earners | 0 (0.0%) | $0 |
| Total | 30 (100.0%) | $100,682 |
Household Income in Lewis
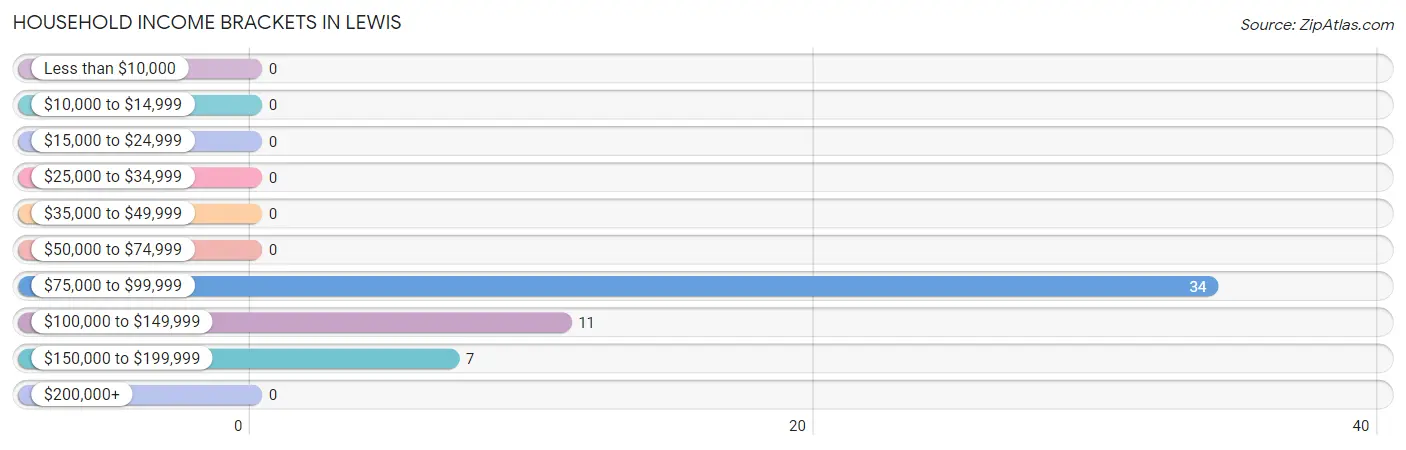
Household Income Brackets in Lewis
With 34 households falling in the category, the $75,000 to $99,999 income range is the most frequent in Lewis, accounting for 65.4% of all households.
| Income Bracket | # Households | % Households |
| Less than $10,000 | 0 | 0.0% |
| $10,000 to $14,999 | 0 | 0.0% |
| $15,000 to $24,999 | 0 | 0.0% |
| $25,000 to $34,999 | 0 | 0.0% |
| $35,000 to $49,999 | 0 | 0.0% |
| $50,000 to $74,999 | 0 | 0.0% |
| $75,000 to $99,999 | 34 | 65.4% |
| $100,000 to $149,999 | 11 | 21.2% |
| $150,000 to $199,999 | 7 | 13.5% |
| $200,000+ | 0 | 0.0% |
Household Income by Householder Age in Lewis
| Income Bracket | # Households | Median Income |
| 15 to 24 Years | 0 (0.0%) | $0 |
| 25 to 44 Years | 22 (42.3%) | $0 |
| 45 to 64 Years | 19 (36.5%) | $0 |
| 65+ Years | 11 (21.1%) | $0 |
| Total | 52 (100.0%) | $86,591 |
Poverty in Lewis
Income Below Poverty by Sex and Age in Lewis
| Age Bracket | Male | Female |
| Under 5 Years | 0 (0.0%) | 0 (0.0%) |
| 5 Years | 0 (0.0%) | 0 (0.0%) |
| 6 to 11 Years | 0 (0.0%) | 0 (0.0%) |
| 12 to 14 Years | 0 (0.0%) | 0 (0.0%) |
| 15 Years | 0 (0.0%) | 0 (0.0%) |
| 16 and 17 Years | 0 (0.0%) | 0 (0.0%) |
| 18 to 24 Years | 0 (0.0%) | 0 (0.0%) |
| 25 to 34 Years | 0 (0.0%) | 0 (0.0%) |
| 35 to 44 Years | 0 (0.0%) | 0 (0.0%) |
| 45 to 54 Years | 0 (0.0%) | 0 (0.0%) |
| 55 to 64 Years | 0 (0.0%) | 0 (0.0%) |
| 65 to 74 Years | 0 (0.0%) | 0 (0.0%) |
| 75 Years and over | 0 (0.0%) | 0 (0.0%) |
| Total | 0 (0.0%) | 0 (0.0%) |
Income Above Poverty by Sex and Age in Lewis
According to the poverty statistics in Lewis, males aged under 5 years and females aged under 5 years are the age groups that are most secure financially, with 100.0% of males and 100.0% of females in these age groups living above the poverty line.
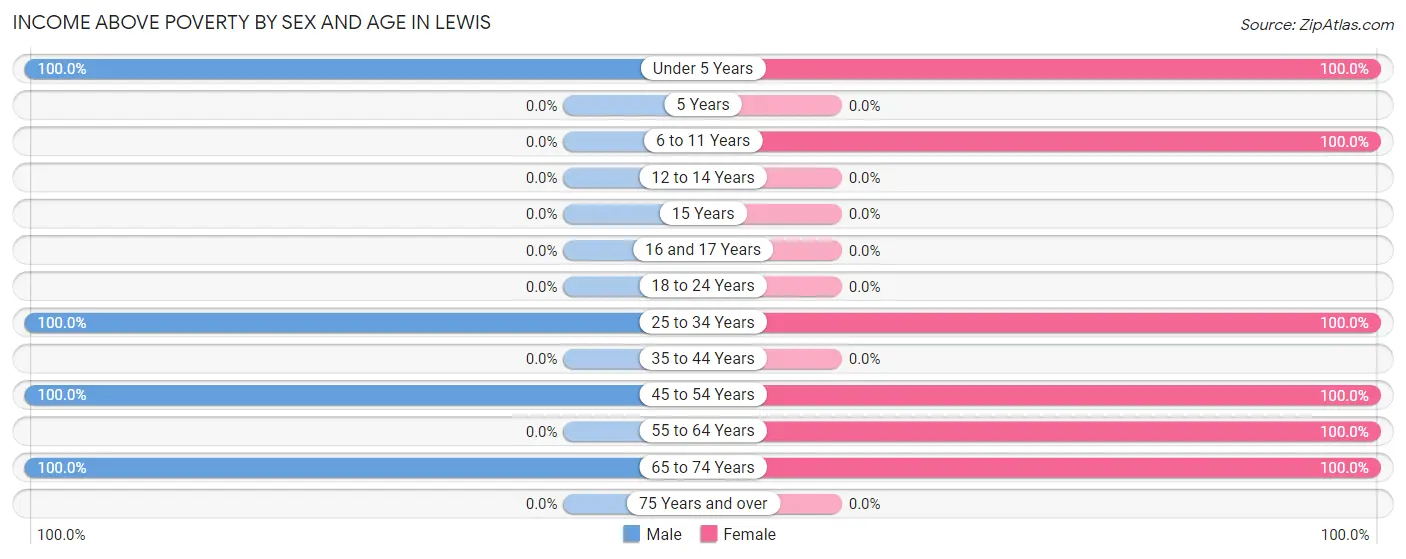
| Age Bracket | Male | Female |
| Under 5 Years | 15 (100.0%) | 12 (100.0%) |
| 5 Years | 0 (0.0%) | 0 (0.0%) |
| 6 to 11 Years | 0 (0.0%) | 10 (100.0%) |
| 12 to 14 Years | 0 (0.0%) | 0 (0.0%) |
| 15 Years | 0 (0.0%) | 0 (0.0%) |
| 16 and 17 Years | 0 (0.0%) | 0 (0.0%) |
| 18 to 24 Years | 0 (0.0%) | 0 (0.0%) |
| 25 to 34 Years | 27 (100.0%) | 38 (100.0%) |
| 35 to 44 Years | 0 (0.0%) | 0 (0.0%) |
| 45 to 54 Years | 5 (100.0%) | 7 (100.0%) |
| 55 to 64 Years | 0 (0.0%) | 12 (100.0%) |
| 65 to 74 Years | 11 (100.0%) | 12 (100.0%) |
| 75 Years and over | 0 (0.0%) | 0 (0.0%) |
| Total | 58 (100.0%) | 91 (100.0%) |
Income Below Poverty Among Married-Couple Families in Lewis
| Children | Above Poverty | Below Poverty |
| No Children | 11 (100.0%) | 0 (0.0%) |
| 1 or 2 Children | 7 (100.0%) | 0 (0.0%) |
| 3 or 4 Children | 0 (0.0%) | 0 (0.0%) |
| 5 or more Children | 0 (0.0%) | 0 (0.0%) |
| Total | 18 (100.0%) | 0 (0.0%) |
Income Below Poverty Among Single-Parent Households in Lewis
| Children | Single Father | Single Mother |
| No Children | 0 (0.0%) | 0 (0.0%) |
| 1 or 2 Children | 0 (0.0%) | 0 (0.0%) |
| 3 or 4 Children | 0 (0.0%) | 0 (0.0%) |
| 5 or more Children | 0 (0.0%) | 0 (0.0%) |
| Total | 0 (0.0%) | 0 (0.0%) |
Income Below Poverty Among Married-Couple vs Single-Parent Households in Lewis
| Children | Married-Couple Families | Single-Parent Households |
| No Children | 0 (0.0%) | 0 (0.0%) |
| 1 or 2 Children | 0 (0.0%) | 0 (0.0%) |
| 3 or 4 Children | 0 (0.0%) | 0 (0.0%) |
| 5 or more Children | 0 (0.0%) | 0 (0.0%) |
| Total | 0 (0.0%) | 0 (0.0%) |
Race in Lewis
The most populous races in Lewis are , and White / Caucasian (149 | 100.0%).
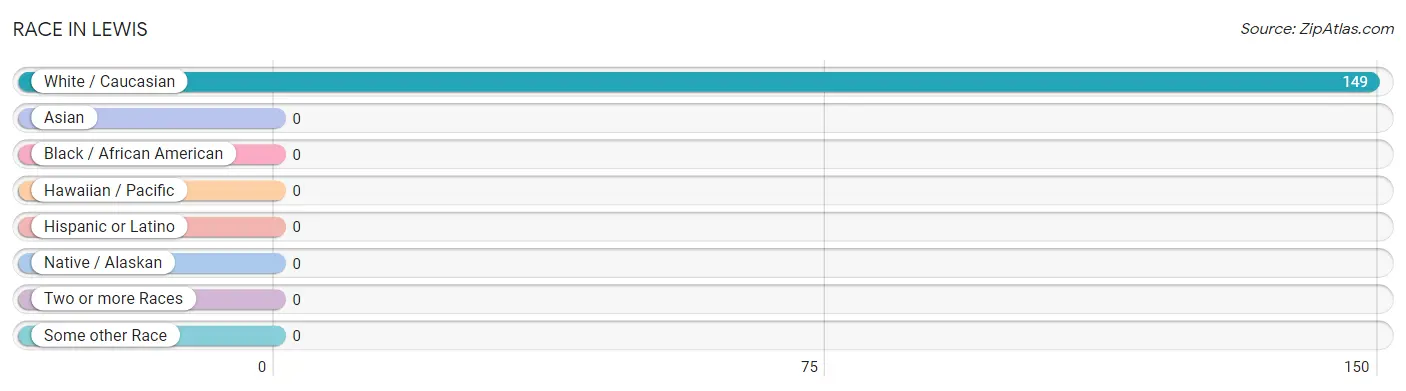
| Race | # Population | % Population |
| Asian | 0 | 0.0% |
| Black / African American | 0 | 0.0% |
| Hawaiian / Pacific | 0 | 0.0% |
| Hispanic or Latino | 0 | 0.0% |
| Native / Alaskan | 0 | 0.0% |
| White / Caucasian | 149 | 100.0% |
| Two or more Races | 0 | 0.0% |
| Some other Race | 0 | 0.0% |
| Total | 149 | 100.0% |
Ancestry in Lewis
The most populous ancestries reported in Lewis are English (35 | 23.5%), and Ukrainian (12 | 8.1%), together accounting for 31.5% of all Lewis residents.
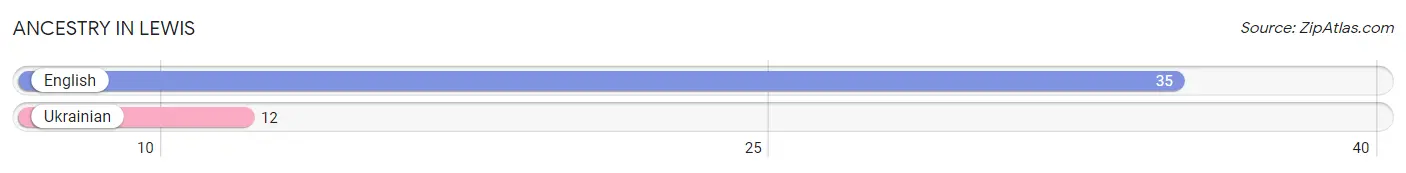
| Ancestry | # Population | % Population |
| English | 35 | 23.5% |
| Ukrainian | 12 | 8.1% | View All 2 Rows |
Immigrants in Lewis

| Immigration Origin | # Population | % Population | View All 0 Rows |
Sex and Age in Lewis
Sex and Age in Lewis
The most populous age groups in Lewis are 30 to 34 Years (27 | 46.6%) for men and 25 to 29 Years (38 | 41.8%) for women.
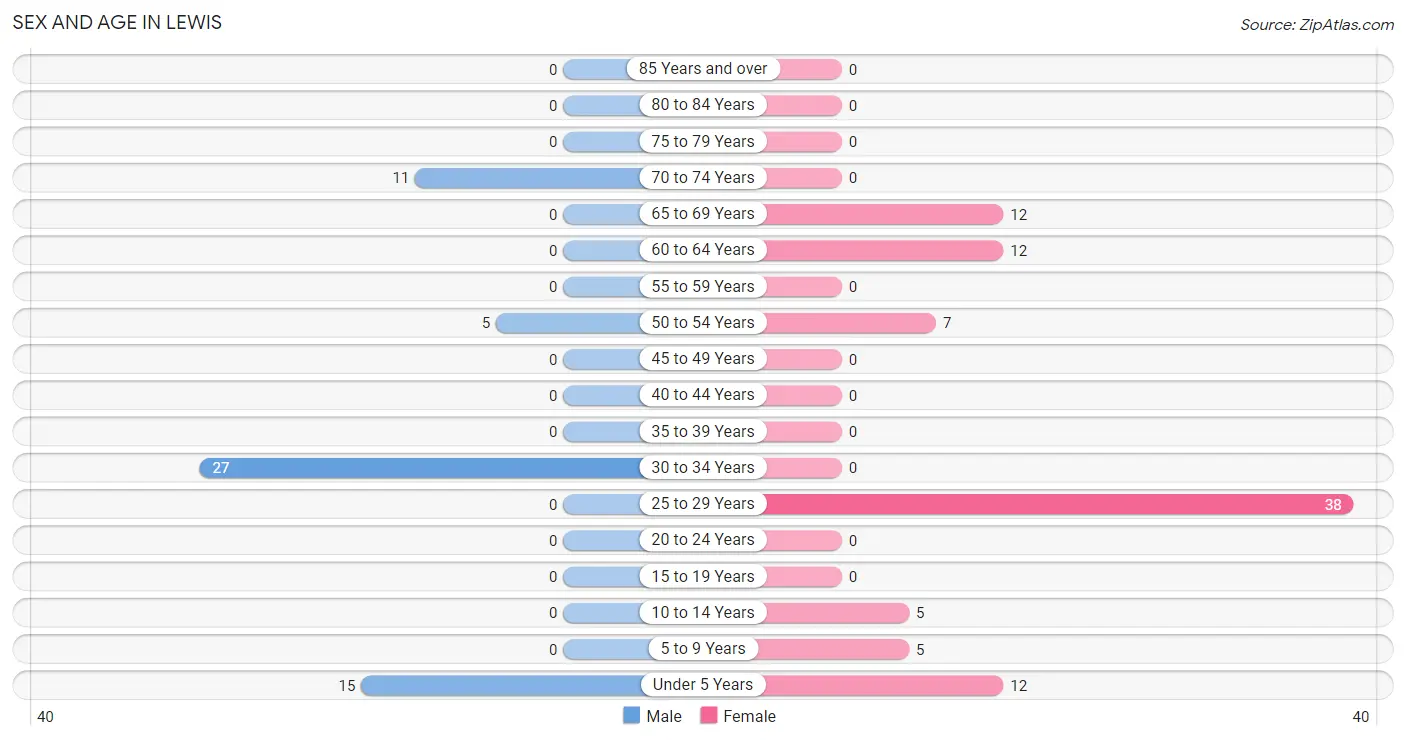
| Age Bracket | Male | Female |
| Under 5 Years | 15 (25.9%) | 12 (13.2%) |
| 5 to 9 Years | 0 (0.0%) | 5 (5.5%) |
| 10 to 14 Years | 0 (0.0%) | 5 (5.5%) |
| 15 to 19 Years | 0 (0.0%) | 0 (0.0%) |
| 20 to 24 Years | 0 (0.0%) | 0 (0.0%) |
| 25 to 29 Years | 0 (0.0%) | 38 (41.8%) |
| 30 to 34 Years | 27 (46.6%) | 0 (0.0%) |
| 35 to 39 Years | 0 (0.0%) | 0 (0.0%) |
| 40 to 44 Years | 0 (0.0%) | 0 (0.0%) |
| 45 to 49 Years | 0 (0.0%) | 0 (0.0%) |
| 50 to 54 Years | 5 (8.6%) | 7 (7.7%) |
| 55 to 59 Years | 0 (0.0%) | 0 (0.0%) |
| 60 to 64 Years | 0 (0.0%) | 12 (13.2%) |
| 65 to 69 Years | 0 (0.0%) | 12 (13.2%) |
| 70 to 74 Years | 11 (19.0%) | 0 (0.0%) |
| 75 to 79 Years | 0 (0.0%) | 0 (0.0%) |
| 80 to 84 Years | 0 (0.0%) | 0 (0.0%) |
| 85 Years and over | 0 (0.0%) | 0 (0.0%) |
| Total | 58 (100.0%) | 91 (100.0%) |
Families and Households in Lewis
Median Family Size in Lewis
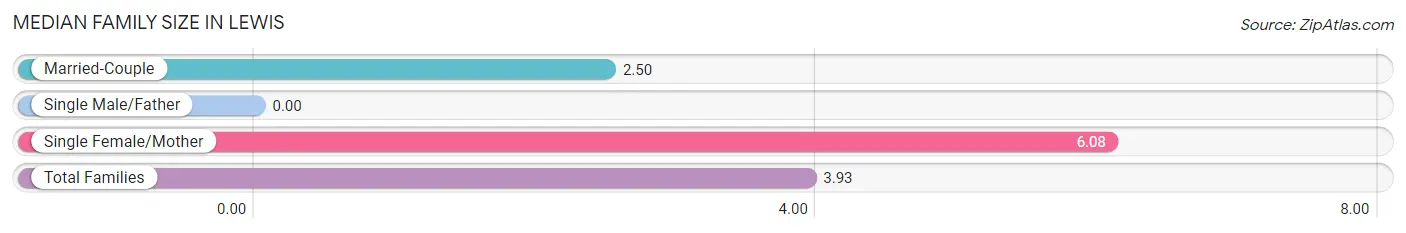
| Family Type | # Families | Family Size |
| Married-Couple | 18 (60.0%) | 2.50 |
| Single Male/Father | 0 (0.0%) | - |
| Single Female/Mother | 12 (40.0%) | 6.08 |
| Total Families | 30 (100.0%) | 3.93 |
Median Household Size in Lewis
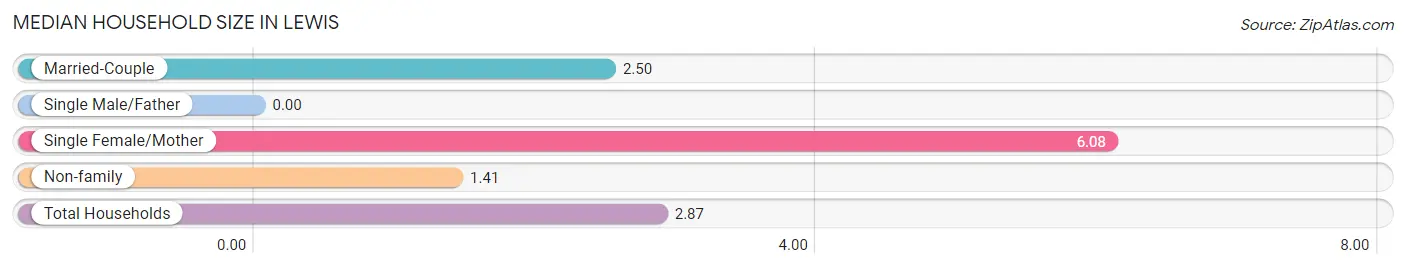
| Household Type | # Households | Household Size |
| Married-Couple | 18 (34.6%) | 2.50 |
| Single Male/Father | 0 (0.0%) | - |
| Single Female/Mother | 12 (23.1%) | 6.08 |
| Non-family | 22 (42.3%) | 1.41 |
| Total Households | 52 (100.0%) | 2.87 |
Household Size by Marriage Status in Lewis
Out of a total of 52 households in Lewis, 30 (57.7%) are family households, while 22 (42.3%) are nonfamily households. The most numerous type of family households are 5-person households, comprising 12, and the most common type of nonfamily households are 2-person households, comprising 22.
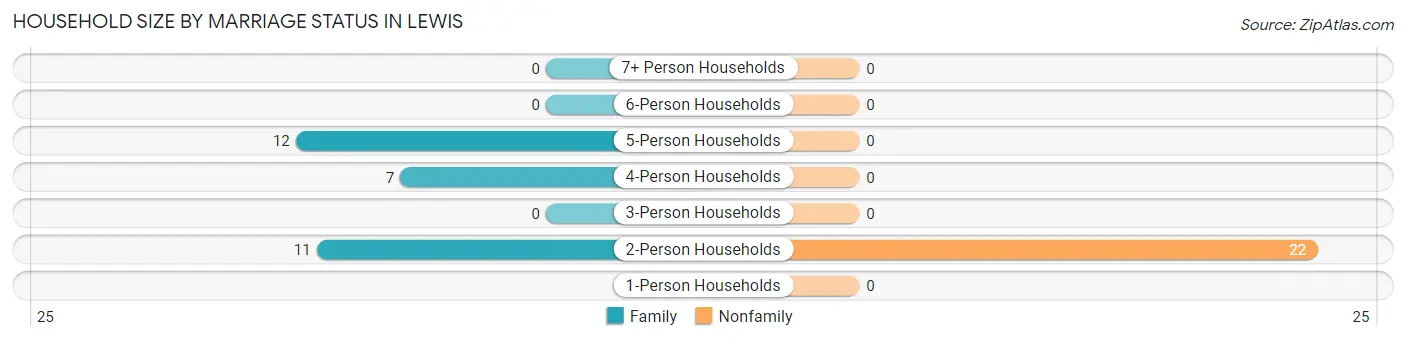
| Household Size | Family Households | Nonfamily Households |
| 1-Person Households | - | 0 (0.0%) |
| 2-Person Households | 11 (21.1%) | 22 (42.3%) |
| 3-Person Households | 0 (0.0%) | 0 (0.0%) |
| 4-Person Households | 7 (13.5%) | 0 (0.0%) |
| 5-Person Households | 12 (23.1%) | 0 (0.0%) |
| 6-Person Households | 0 (0.0%) | 0 (0.0%) |
| 7+ Person Households | 0 (0.0%) | 0 (0.0%) |
| Total | 30 (57.7%) | 22 (42.3%) |
Female Fertility in Lewis
Fertility by Age in Lewis
| Age Bracket | Women with Births | Births / 1,000 Women |
| 15 to 19 years | 0 (0.0%) | 0.0 |
| 20 to 34 years | 0 (0.0%) | 0.0 |
| 35 to 50 years | 0 (0.0%) | 0.0 |
| Total | 0 (0.0%) | 0.0 |
Fertility by Age by Marriage Status in Lewis
| Age Bracket | Married | Unmarried |
| 15 to 19 years | 0 (0.0%) | 0 (0.0%) |
| 20 to 34 years | 0 (0.0%) | 0 (0.0%) |
| 35 to 50 years | 0 (0.0%) | 0 (0.0%) |
| Total | 0 (0.0%) | 0 (0.0%) |
Fertility by Education in Lewis
| Educational Attainment | Women with Births | Births / 1,000 Women |
| Less than High School | 0 (0.0%) | 0.0 |
| High School Diploma | 0 (0.0%) | 0.0 |
| College or Associate's Degree | 0 (0.0%) | 0.0 |
| Bachelor's Degree | 0 (0.0%) | 0.0 |
| Graduate Degree | 0 (0.0%) | 0.0 |
| Total | 0 (0.0%) | 0.0 |
Fertility by Education by Marriage Status in Lewis
| Educational Attainment | Married | Unmarried |
| Less than High School | 0 (0.0%) | 0 (0.0%) |
| High School Diploma | 0 (0.0%) | 0 (0.0%) |
| College or Associate's Degree | 0 (0.0%) | 0 (0.0%) |
| Bachelor's Degree | 0 (0.0%) | 0 (0.0%) |
| Graduate Degree | 0 (0.0%) | 0 (0.0%) |
| Total | 0 (0.0%) | 0 (0.0%) |
Employment Characteristics in Lewis
Employment by Class of Employer in Lewis
Among the 61 employed individuals in Lewis, private company employees (25 | 41.0%), not-for-profit organizations (22 | 36.1%), and local government employees (9 | 14.7%) make up the most common classes of employment.
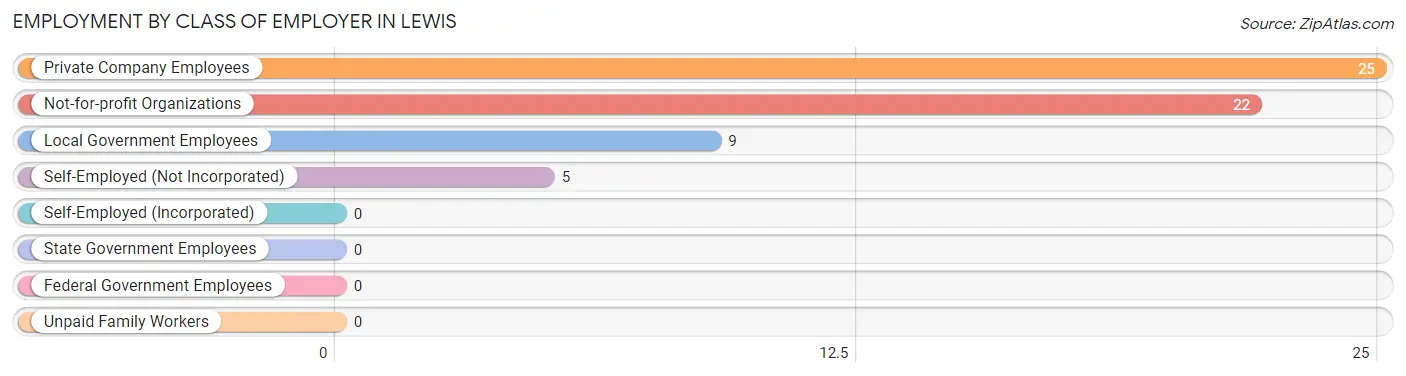
| Employer Class | # Employees | % Employees |
| Private Company Employees | 25 | 41.0% |
| Self-Employed (Incorporated) | 0 | 0.0% |
| Self-Employed (Not Incorporated) | 5 | 8.2% |
| Not-for-profit Organizations | 22 | 36.1% |
| Local Government Employees | 9 | 14.7% |
| State Government Employees | 0 | 0.0% |
| Federal Government Employees | 0 | 0.0% |
| Unpaid Family Workers | 0 | 0.0% |
| Total | 61 | 100.0% |
Employment Status by Age in Lewis
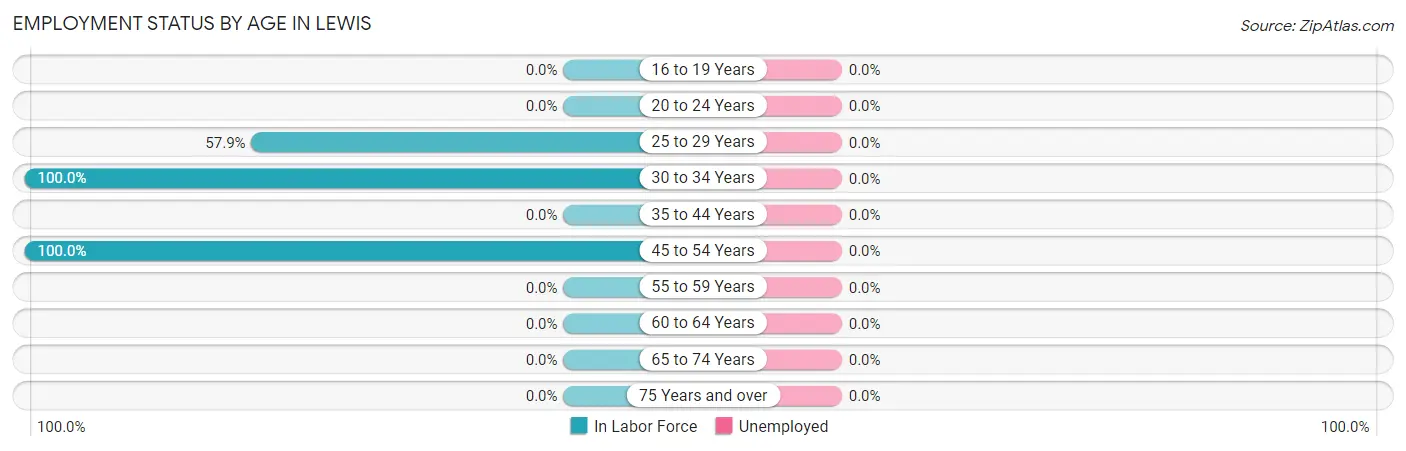
| Age Bracket | In Labor Force | Unemployed |
| 16 to 19 Years | 0 (0.0%) | 0 (0.0%) |
| 20 to 24 Years | 0 (0.0%) | 0 (0.0%) |
| 25 to 29 Years | 22 (57.9%) | 0 (0.0%) |
| 30 to 34 Years | 27 (100.0%) | 0 (0.0%) |
| 35 to 44 Years | 0 (0.0%) | 0 (0.0%) |
| 45 to 54 Years | 12 (100.0%) | 0 (0.0%) |
| 55 to 59 Years | 0 (0.0%) | 0 (0.0%) |
| 60 to 64 Years | 0 (0.0%) | 0 (0.0%) |
| 65 to 74 Years | 0 (0.0%) | 0 (0.0%) |
| 75 Years and over | 0 (0.0%) | 0 (0.0%) |
| Total | 61 (54.5%) | 0 (0.0%) |
Employment Status by Educational Attainment in Lewis
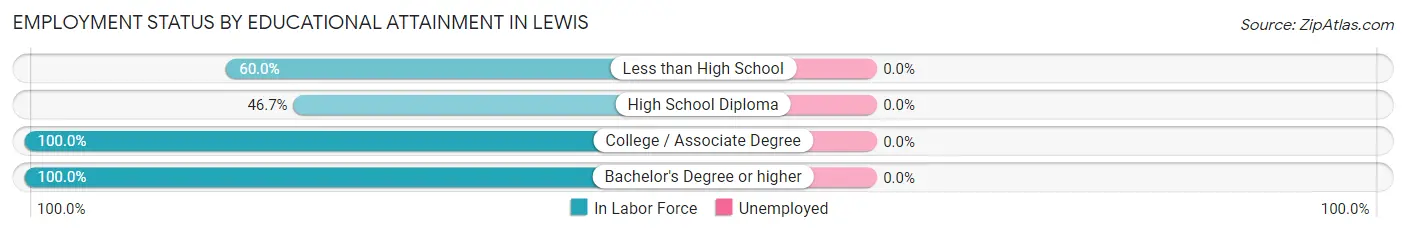
| Educational Attainment | In Labor Force | Unemployed |
| Less than High School | 18 (60.0%) | 0 (0.0%) |
| High School Diploma | 14 (46.7%) | 0 (0.0%) |
| College / Associate Degree | 22 (100.0%) | 0 (0.0%) |
| Bachelor's Degree or higher | 7 (100.0%) | 0 (0.0%) |
| Total | 61 (68.5%) | 0 (0.0%) |
Employment Occupations by Sex in Lewis
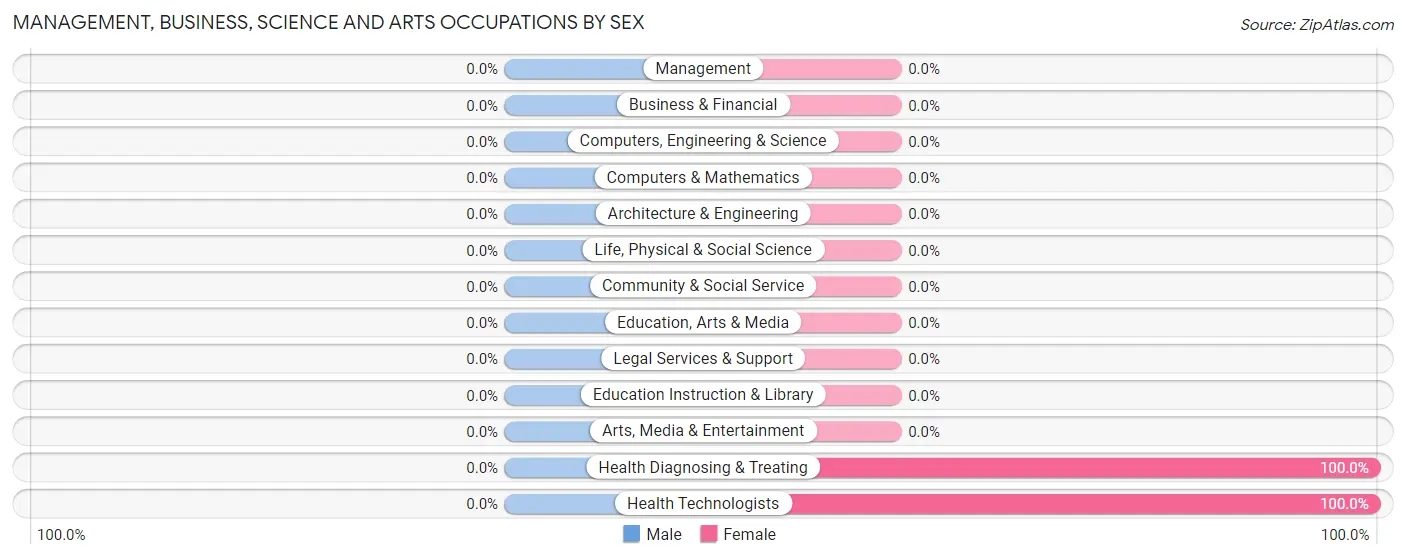
Management, Business, Science and Arts Occupations
The most common Management, Business, Science and Arts occupations in Lewis are Health Diagnosing & Treating (22 | 36.1%), and Health Technologists (22 | 36.1%).
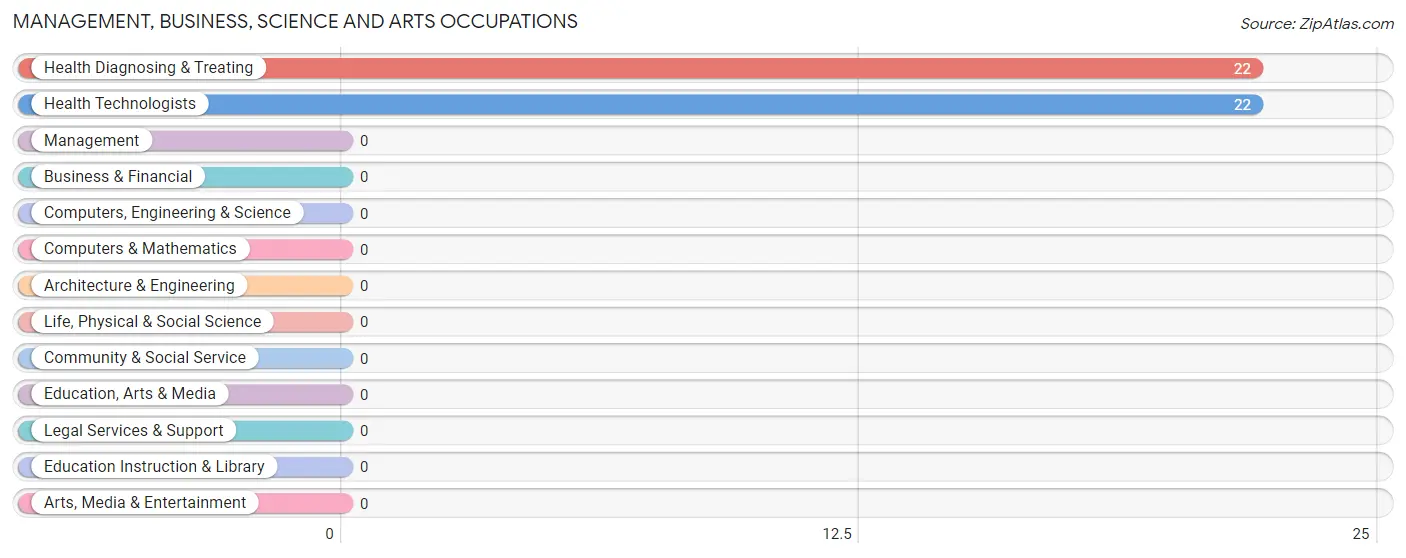
Management, Business, Science and Arts Occupations by Sex
| Occupation | Male | Female |
| Management | 0 (0.0%) | 0 (0.0%) |
| Business & Financial | 0 (0.0%) | 0 (0.0%) |
| Computers, Engineering & Science | 0 (0.0%) | 0 (0.0%) |
| Computers & Mathematics | 0 (0.0%) | 0 (0.0%) |
| Architecture & Engineering | 0 (0.0%) | 0 (0.0%) |
| Life, Physical & Social Science | 0 (0.0%) | 0 (0.0%) |
| Community & Social Service | 0 (0.0%) | 0 (0.0%) |
| Education, Arts & Media | 0 (0.0%) | 0 (0.0%) |
| Legal Services & Support | 0 (0.0%) | 0 (0.0%) |
| Education Instruction & Library | 0 (0.0%) | 0 (0.0%) |
| Arts, Media & Entertainment | 0 (0.0%) | 0 (0.0%) |
| Health Diagnosing & Treating | 0 (0.0%) | 22 (100.0%) |
| Health Technologists | 0 (0.0%) | 22 (100.0%) |
| Total (Category) | 0 (0.0%) | 22 (100.0%) |
| Total (Overall) | 32 (52.5%) | 29 (47.5%) |
Services Occupations
Services Occupations by Sex
| Occupation | Male | Female |
| Healthcare Support | 0 (0.0%) | 0 (0.0%) |
| Security & Protection | 0 (0.0%) | 0 (0.0%) |
| Firefighting & Prevention | 0 (0.0%) | 0 (0.0%) |
| Law Enforcement | 0 (0.0%) | 0 (0.0%) |
| Food Preparation & Serving | 0 (0.0%) | 0 (0.0%) |
| Cleaning & Maintenance | 0 (0.0%) | 0 (0.0%) |
| Personal Care & Service | 0 (0.0%) | 0 (0.0%) |
| Total (Category) | 0 (0.0%) | 0 (0.0%) |
| Total (Overall) | 32 (52.5%) | 29 (47.5%) |
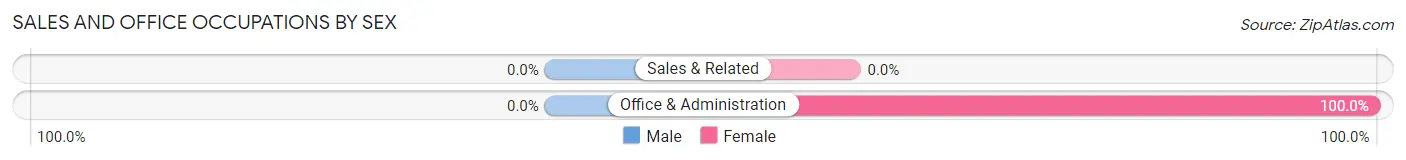
Sales and Office Occupations
The most common Sales and Office occupations in Lewis are , and Office & Administration (7 | 11.5%).
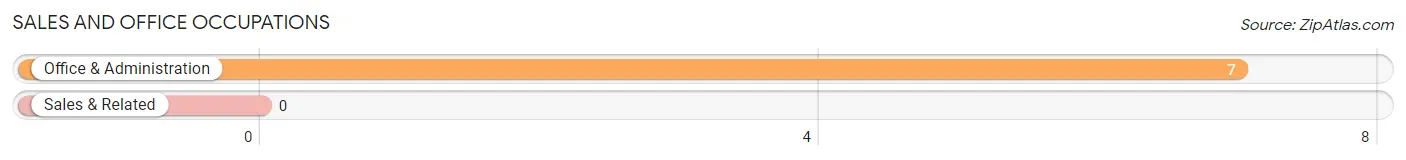
Sales and Office Occupations by Sex
| Occupation | Male | Female |
| Sales & Related | 0 (0.0%) | 0 (0.0%) |
| Office & Administration | 0 (0.0%) | 7 (100.0%) |
| Total (Category) | 0 (0.0%) | 7 (100.0%) |
| Total (Overall) | 32 (52.5%) | 29 (47.5%) |
Natural Resources, Construction and Maintenance Occupations
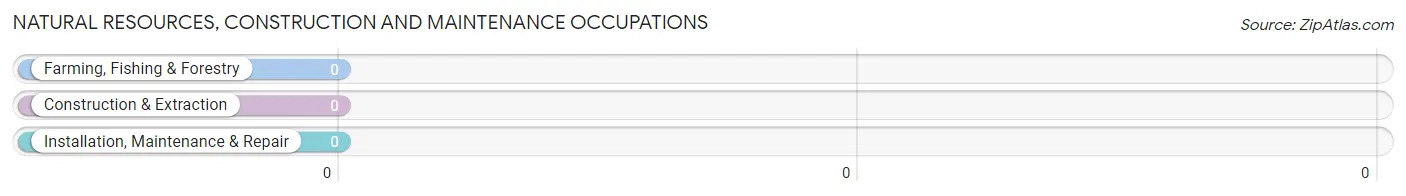
Natural Resources, Construction and Maintenance Occupations by Sex
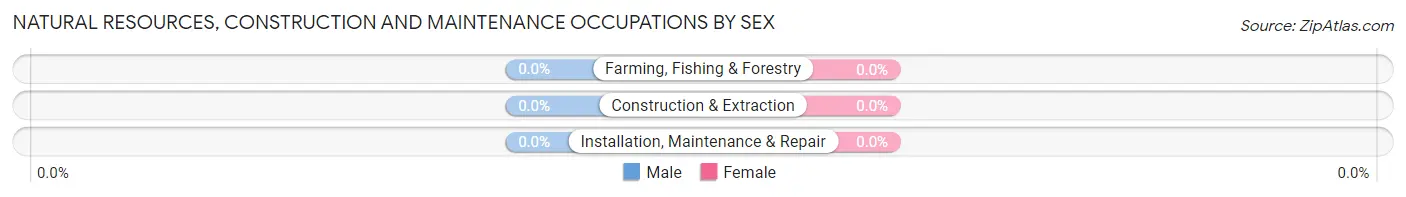
| Occupation | Male | Female |
| Farming, Fishing & Forestry | 0 (0.0%) | 0 (0.0%) |
| Construction & Extraction | 0 (0.0%) | 0 (0.0%) |
| Installation, Maintenance & Repair | 0 (0.0%) | 0 (0.0%) |
| Total (Category) | 0 (0.0%) | 0 (0.0%) |
| Total (Overall) | 32 (52.5%) | 29 (47.5%) |
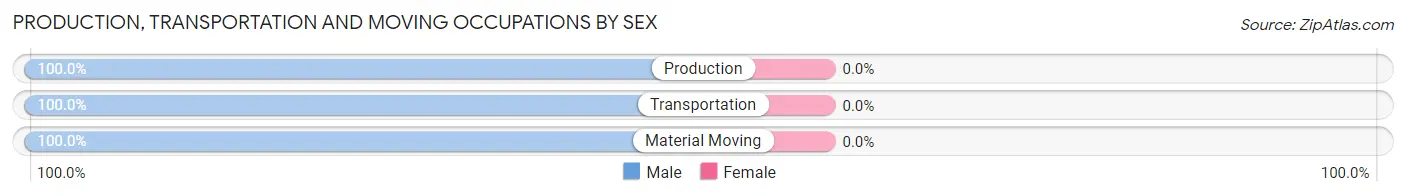
Production, Transportation and Moving Occupations
The most common Production, Transportation and Moving occupations in Lewis are Material Moving (18 | 29.5%), Production (9 | 14.7%), and Transportation (5 | 8.2%).
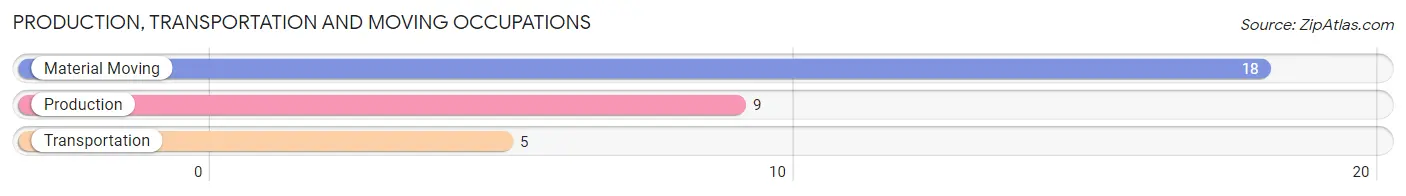
Production, Transportation and Moving Occupations by Sex
| Occupation | Male | Female |
| Production | 9 (100.0%) | 0 (0.0%) |
| Transportation | 5 (100.0%) | 0 (0.0%) |
| Material Moving | 18 (100.0%) | 0 (0.0%) |
| Total (Category) | 32 (100.0%) | 0 (0.0%) |
| Total (Overall) | 32 (52.5%) | 29 (47.5%) |
Employment Industries by Sex in Lewis
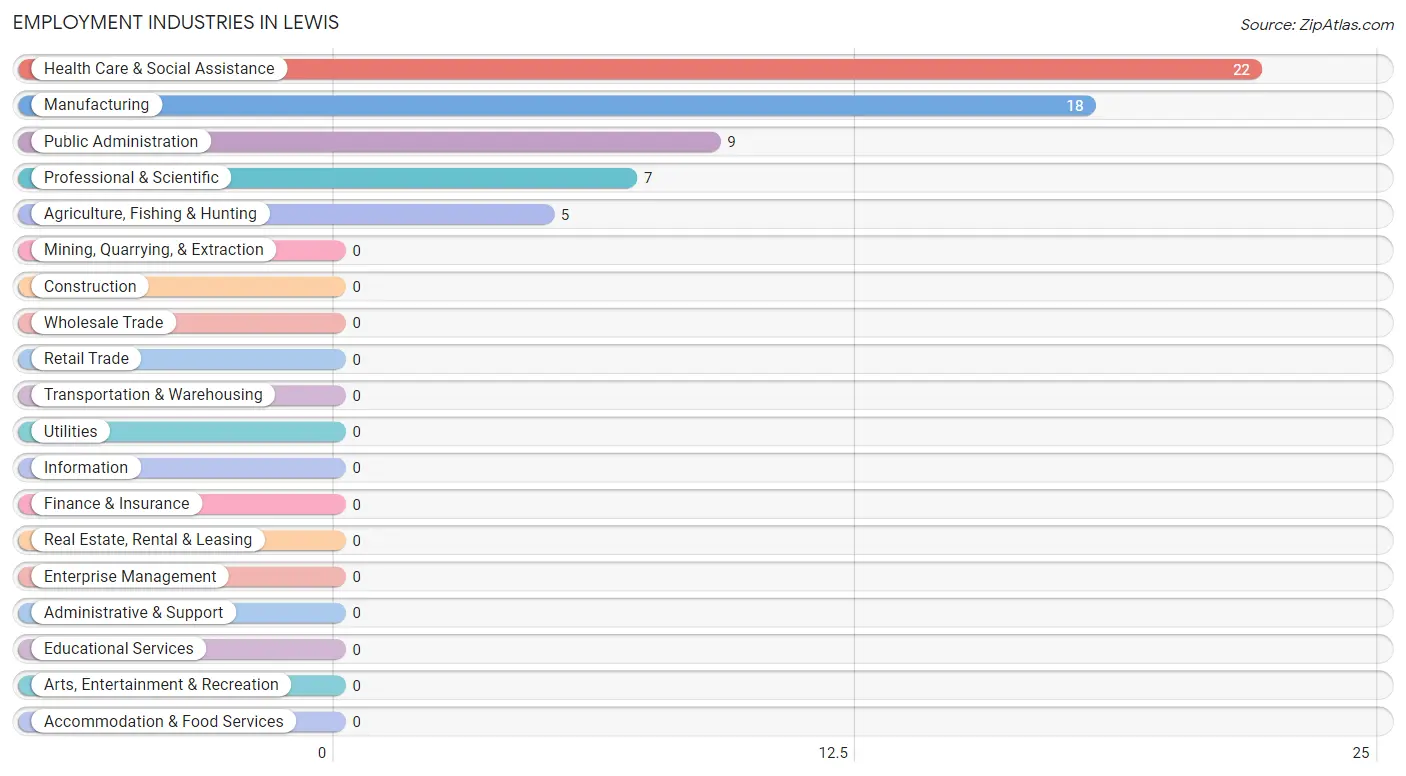
Employment Industries in Lewis
The major employment industries in Lewis include Health Care & Social Assistance (22 | 36.1%), Manufacturing (18 | 29.5%), Public Administration (9 | 14.7%), Professional & Scientific (7 | 11.5%), and Agriculture, Fishing & Hunting (5 | 8.2%).
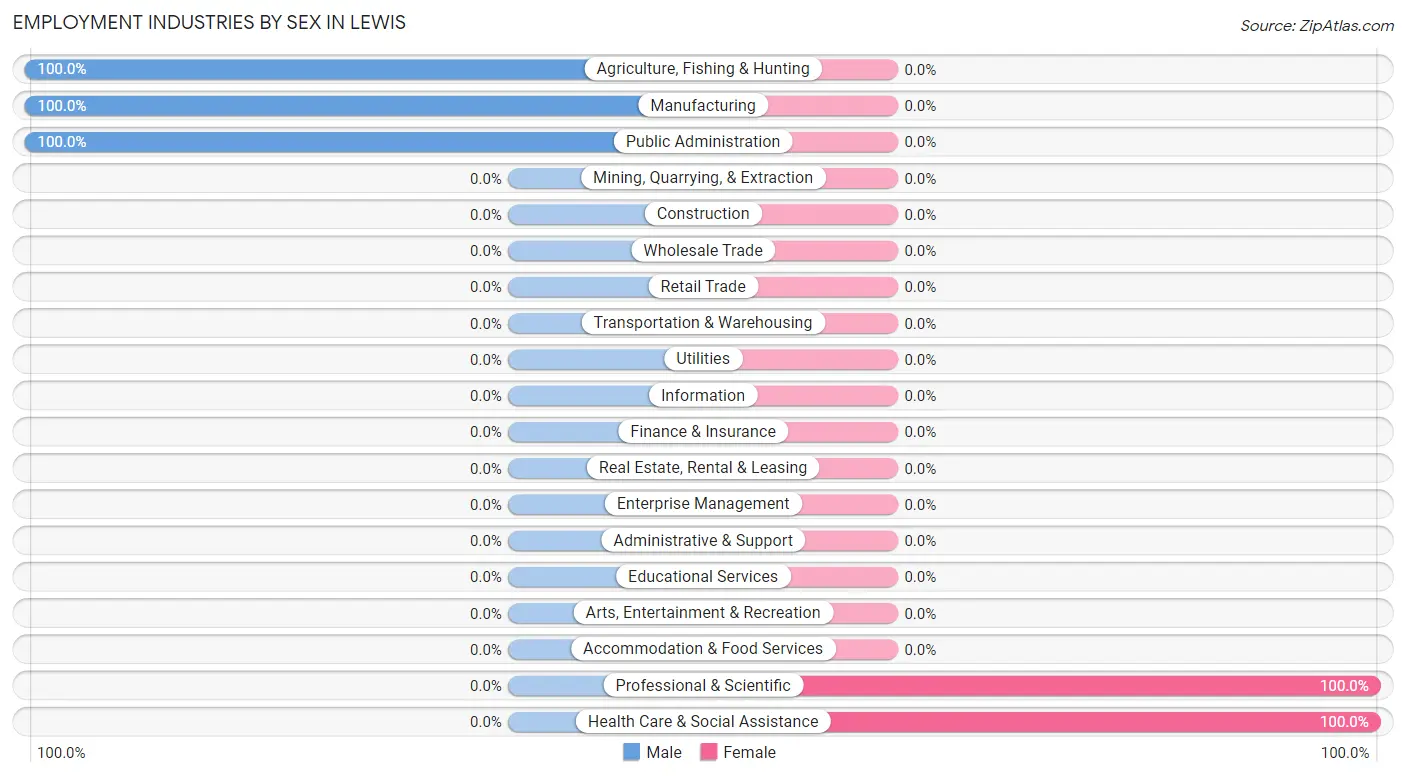
Employment Industries by Sex in Lewis
The Lewis industries that see more men than women are Agriculture, Fishing & Hunting (100.0%), Manufacturing (100.0%), and Public Administration (100.0%), whereas the industries that tend to have a higher number of women are Professional & Scientific (100.0%), and Health Care & Social Assistance (100.0%).
| Industry | Male | Female |
| Agriculture, Fishing & Hunting | 5 (100.0%) | 0 (0.0%) |
| Mining, Quarrying, & Extraction | 0 (0.0%) | 0 (0.0%) |
| Construction | 0 (0.0%) | 0 (0.0%) |
| Manufacturing | 18 (100.0%) | 0 (0.0%) |
| Wholesale Trade | 0 (0.0%) | 0 (0.0%) |
| Retail Trade | 0 (0.0%) | 0 (0.0%) |
| Transportation & Warehousing | 0 (0.0%) | 0 (0.0%) |
| Utilities | 0 (0.0%) | 0 (0.0%) |
| Information | 0 (0.0%) | 0 (0.0%) |
| Finance & Insurance | 0 (0.0%) | 0 (0.0%) |
| Real Estate, Rental & Leasing | 0 (0.0%) | 0 (0.0%) |
| Professional & Scientific | 0 (0.0%) | 7 (100.0%) |
| Enterprise Management | 0 (0.0%) | 0 (0.0%) |
| Administrative & Support | 0 (0.0%) | 0 (0.0%) |
| Educational Services | 0 (0.0%) | 0 (0.0%) |
| Health Care & Social Assistance | 0 (0.0%) | 22 (100.0%) |
| Arts, Entertainment & Recreation | 0 (0.0%) | 0 (0.0%) |
| Accommodation & Food Services | 0 (0.0%) | 0 (0.0%) |
| Public Administration | 9 (100.0%) | 0 (0.0%) |
| Total | 32 (52.5%) | 29 (47.5%) |
Education in Lewis
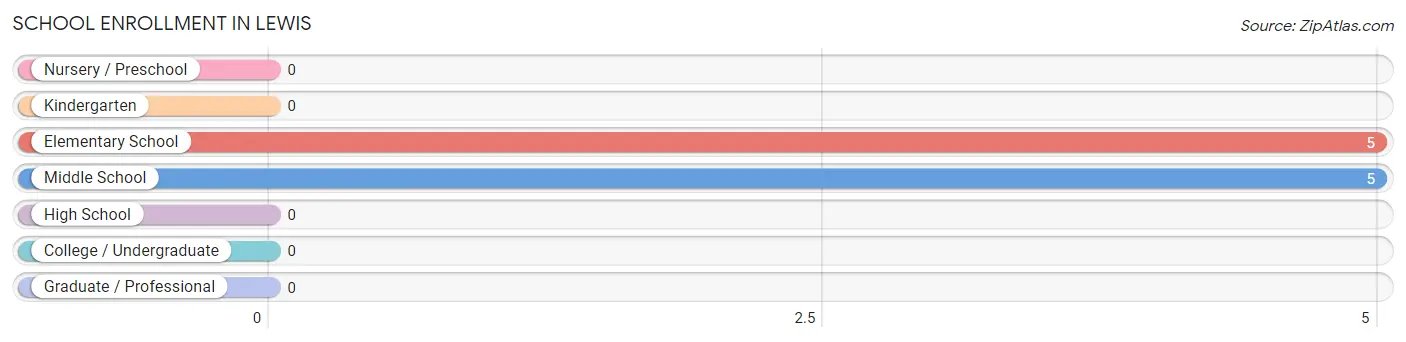
School Enrollment in Lewis
The most common levels of schooling among the 10 students in Lewis are elementary school (5 | 50.0%), and middle school (5 | 50.0%).
| School Level | # Students | % Students |
| Nursery / Preschool | 0 | 0.0% |
| Kindergarten | 0 | 0.0% |
| Elementary School | 5 | 50.0% |
| Middle School | 5 | 50.0% |
| High School | 0 | 0.0% |
| College / Undergraduate | 0 | 0.0% |
| Graduate / Professional | 0 | 0.0% |
| Total | 10 | 100.0% |
School Enrollment by Age by Funding Source in Lewis
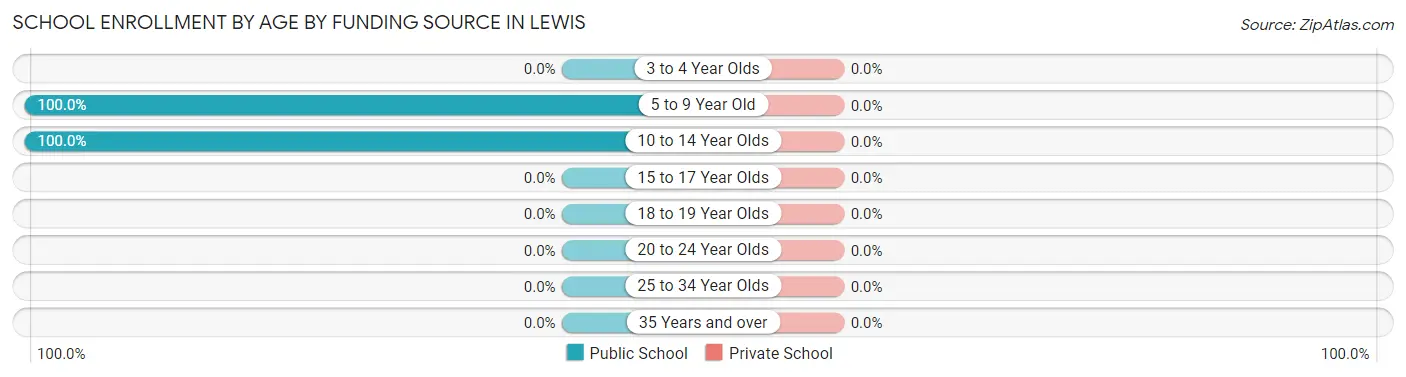
| Age Bracket | Public School | Private School |
| 3 to 4 Year Olds | 0 (0.0%) | 0 (0.0%) |
| 5 to 9 Year Old | 5 (100.0%) | 0 (0.0%) |
| 10 to 14 Year Olds | 5 (100.0%) | 0 (0.0%) |
| 15 to 17 Year Olds | 0 (0.0%) | 0 (0.0%) |
| 18 to 19 Year Olds | 0 (0.0%) | 0 (0.0%) |
| 20 to 24 Year Olds | 0 (0.0%) | 0 (0.0%) |
| 25 to 34 Year Olds | 0 (0.0%) | 0 (0.0%) |
| 35 Years and over | 0 (0.0%) | 0 (0.0%) |
| Total | 10 (100.0%) | 0 (0.0%) |
Educational Attainment by Field of Study in Lewis
Literature & languages (12 | 40.0%), education (11 | 36.7%), and business (7 | 23.3%) are the most common fields of study among 30 individuals in Lewis who have obtained a bachelor's degree or higher.
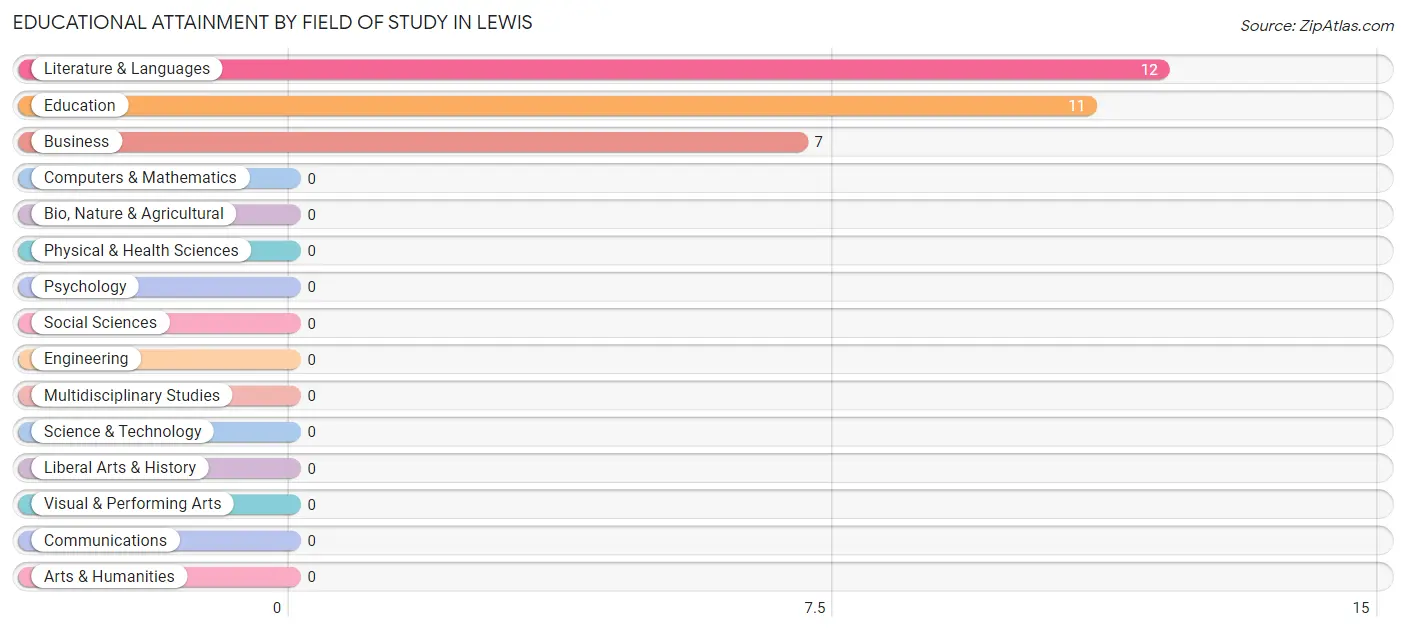
| Field of Study | # Graduates | % Graduates |
| Computers & Mathematics | 0 | 0.0% |
| Bio, Nature & Agricultural | 0 | 0.0% |
| Physical & Health Sciences | 0 | 0.0% |
| Psychology | 0 | 0.0% |
| Social Sciences | 0 | 0.0% |
| Engineering | 0 | 0.0% |
| Multidisciplinary Studies | 0 | 0.0% |
| Science & Technology | 0 | 0.0% |
| Business | 7 | 23.3% |
| Education | 11 | 36.7% |
| Literature & Languages | 12 | 40.0% |
| Liberal Arts & History | 0 | 0.0% |
| Visual & Performing Arts | 0 | 0.0% |
| Communications | 0 | 0.0% |
| Arts & Humanities | 0 | 0.0% |
| Total | 30 | 100.0% |
Transportation & Commute in Lewis
Vehicle Availability by Sex in Lewis
The most prevalent vehicle ownership categories in Lewis are males with 3 vehicles (18, accounting for 56.2%) and females with 3 vehicles (0, making up 62.1%).
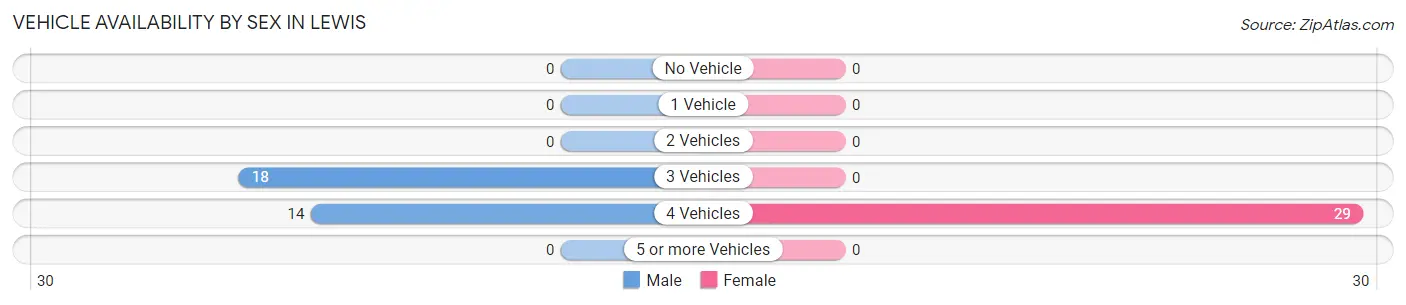
| Vehicles Available | Male | Female |
| No Vehicle | 0 (0.0%) | 0 (0.0%) |
| 1 Vehicle | 0 (0.0%) | 0 (0.0%) |
| 2 Vehicles | 0 (0.0%) | 0 (0.0%) |
| 3 Vehicles | 18 (56.2%) | 0 (0.0%) |
| 4 Vehicles | 14 (43.8%) | 29 (100.0%) |
| 5 or more Vehicles | 0 (0.0%) | 0 (0.0%) |
| Total | 32 (100.0%) | 29 (100.0%) |
Commute Time in Lewis
The most frequently occuring commute durations in Lewis are 15 to 19 minutes (25 commuters, 44.6%), 30 to 34 minutes (22 commuters, 39.3%), and 5 to 9 minutes (9 commuters, 16.1%).
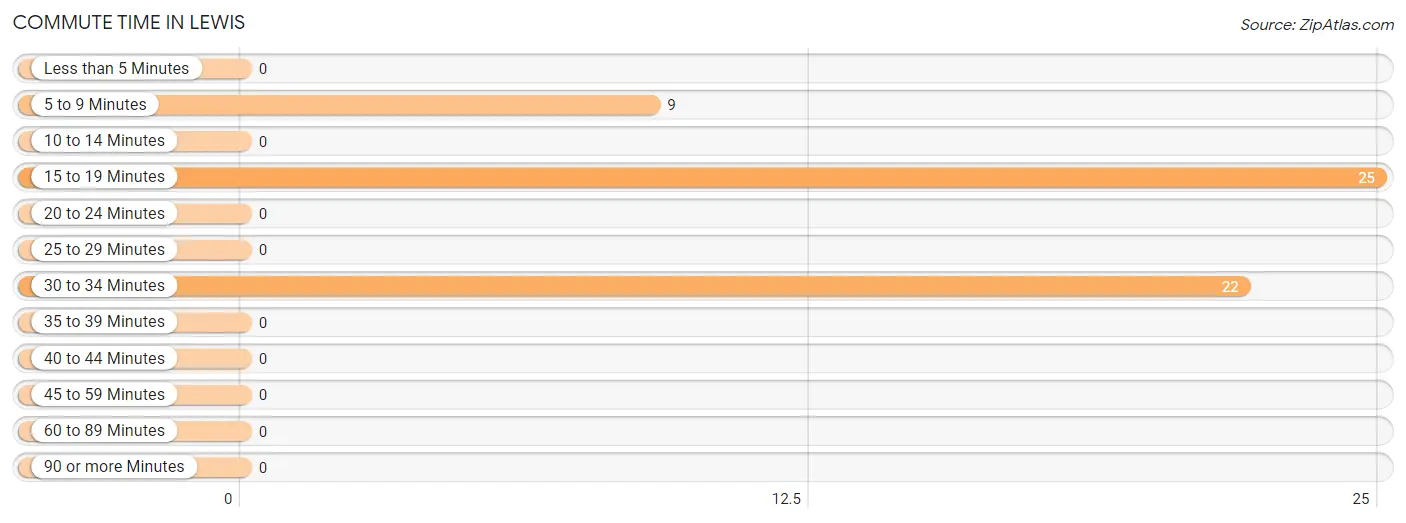
| Commute Time | # Commuters | % Commuters |
| Less than 5 Minutes | 0 | 0.0% |
| 5 to 9 Minutes | 9 | 16.1% |
| 10 to 14 Minutes | 0 | 0.0% |
| 15 to 19 Minutes | 25 | 44.6% |
| 20 to 24 Minutes | 0 | 0.0% |
| 25 to 29 Minutes | 0 | 0.0% |
| 30 to 34 Minutes | 22 | 39.3% |
| 35 to 39 Minutes | 0 | 0.0% |
| 40 to 44 Minutes | 0 | 0.0% |
| 45 to 59 Minutes | 0 | 0.0% |
| 60 to 89 Minutes | 0 | 0.0% |
| 90 or more Minutes | 0 | 0.0% |
Commute Time by Sex in Lewis
The most common commute times in Lewis are 15 to 19 minutes (18 commuters, 66.7%) for males and 30 to 34 minutes (22 commuters, 75.9%) for females.
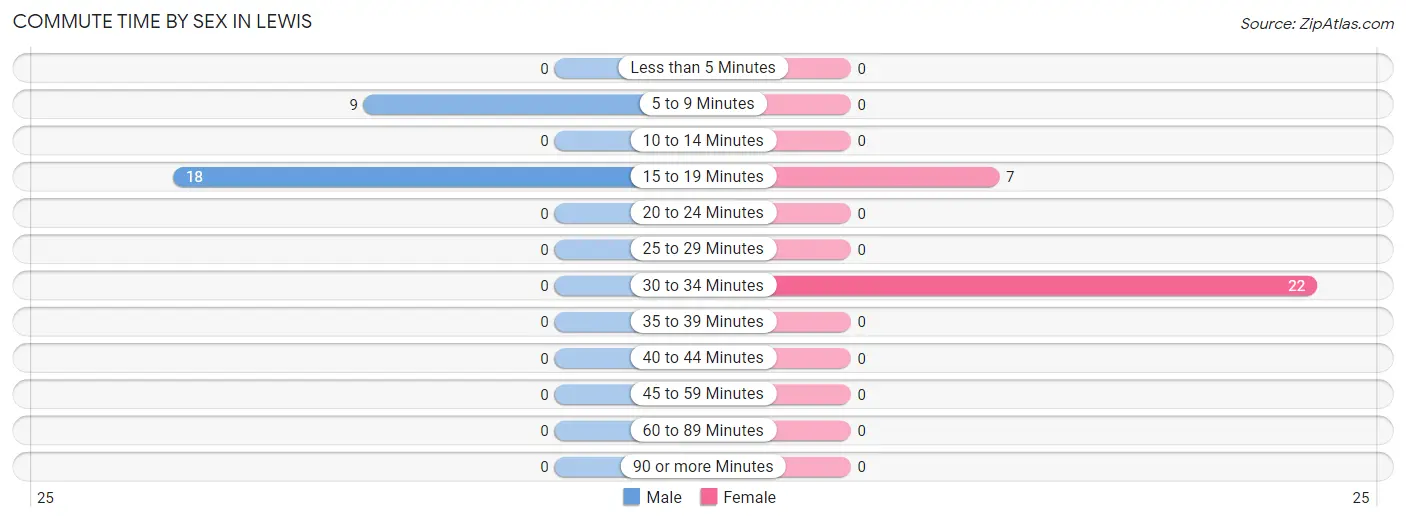
| Commute Time | Male | Female |
| Less than 5 Minutes | 0 (0.0%) | 0 (0.0%) |
| 5 to 9 Minutes | 9 (33.3%) | 0 (0.0%) |
| 10 to 14 Minutes | 0 (0.0%) | 0 (0.0%) |
| 15 to 19 Minutes | 18 (66.7%) | 7 (24.1%) |
| 20 to 24 Minutes | 0 (0.0%) | 0 (0.0%) |
| 25 to 29 Minutes | 0 (0.0%) | 0 (0.0%) |
| 30 to 34 Minutes | 0 (0.0%) | 22 (75.9%) |
| 35 to 39 Minutes | 0 (0.0%) | 0 (0.0%) |
| 40 to 44 Minutes | 0 (0.0%) | 0 (0.0%) |
| 45 to 59 Minutes | 0 (0.0%) | 0 (0.0%) |
| 60 to 89 Minutes | 0 (0.0%) | 0 (0.0%) |
| 90 or more Minutes | 0 (0.0%) | 0 (0.0%) |
Time of Departure to Work by Sex in Lewis
The most frequent times of departure to work in Lewis are 6:30 AM to 6:59 AM (18, 66.7%) for males and 12:00 PM to 3:59 PM (22, 75.9%) for females.
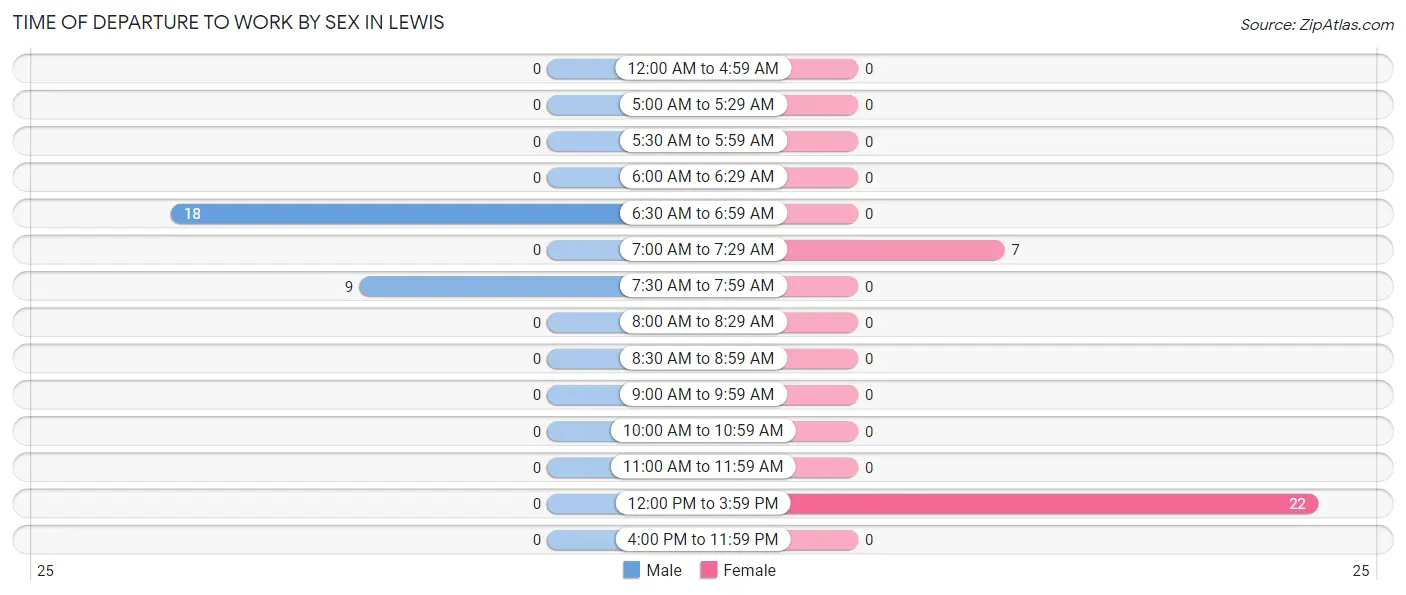
| Time of Departure | Male | Female |
| 12:00 AM to 4:59 AM | 0 (0.0%) | 0 (0.0%) |
| 5:00 AM to 5:29 AM | 0 (0.0%) | 0 (0.0%) |
| 5:30 AM to 5:59 AM | 0 (0.0%) | 0 (0.0%) |
| 6:00 AM to 6:29 AM | 0 (0.0%) | 0 (0.0%) |
| 6:30 AM to 6:59 AM | 18 (66.7%) | 0 (0.0%) |
| 7:00 AM to 7:29 AM | 0 (0.0%) | 7 (24.1%) |
| 7:30 AM to 7:59 AM | 9 (33.3%) | 0 (0.0%) |
| 8:00 AM to 8:29 AM | 0 (0.0%) | 0 (0.0%) |
| 8:30 AM to 8:59 AM | 0 (0.0%) | 0 (0.0%) |
| 9:00 AM to 9:59 AM | 0 (0.0%) | 0 (0.0%) |
| 10:00 AM to 10:59 AM | 0 (0.0%) | 0 (0.0%) |
| 11:00 AM to 11:59 AM | 0 (0.0%) | 0 (0.0%) |
| 12:00 PM to 3:59 PM | 0 (0.0%) | 22 (75.9%) |
| 4:00 PM to 11:59 PM | 0 (0.0%) | 0 (0.0%) |
| Total | 27 (100.0%) | 29 (100.0%) |
Housing Occupancy in Lewis
Occupancy by Ownership in Lewis
Of the total 52 dwellings in Lewis, owner-occupied units account for 52 (100.0%), while renter-occupied units make up 0 (0.0%).
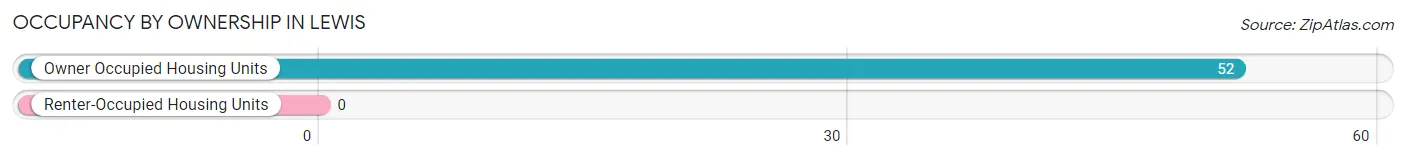
| Occupancy | # Housing Units | % Housing Units |
| Owner Occupied Housing Units | 52 | 100.0% |
| Renter-Occupied Housing Units | 0 | 0.0% |
| Total Occupied Housing Units | 52 | 100.0% |
Occupancy by Household Size in Lewis
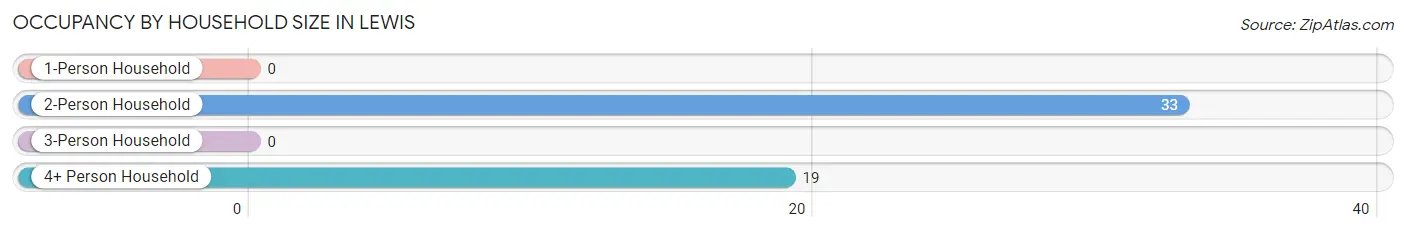
| Household Size | # Housing Units | % Housing Units |
| 1-Person Household | 0 | 0.0% |
| 2-Person Household | 33 | 63.5% |
| 3-Person Household | 0 | 0.0% |
| 4+ Person Household | 19 | 36.5% |
| Total Housing Units | 52 | 100.0% |
Occupancy by Ownership by Household Size in Lewis
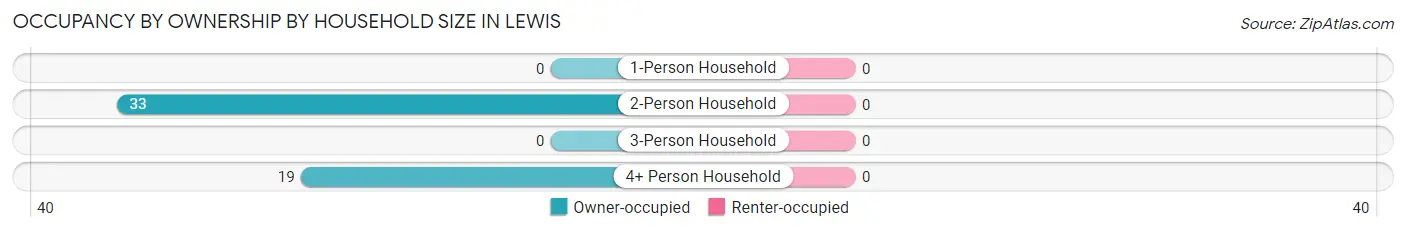
| Household Size | Owner-occupied | Renter-occupied |
| 1-Person Household | 0 (0.0%) | 0 (0.0%) |
| 2-Person Household | 33 (100.0%) | 0 (0.0%) |
| 3-Person Household | 0 (0.0%) | 0 (0.0%) |
| 4+ Person Household | 19 (100.0%) | 0 (0.0%) |
| Total Housing Units | 52 (100.0%) | 0 (0.0%) |
Occupancy by Educational Attainment in Lewis
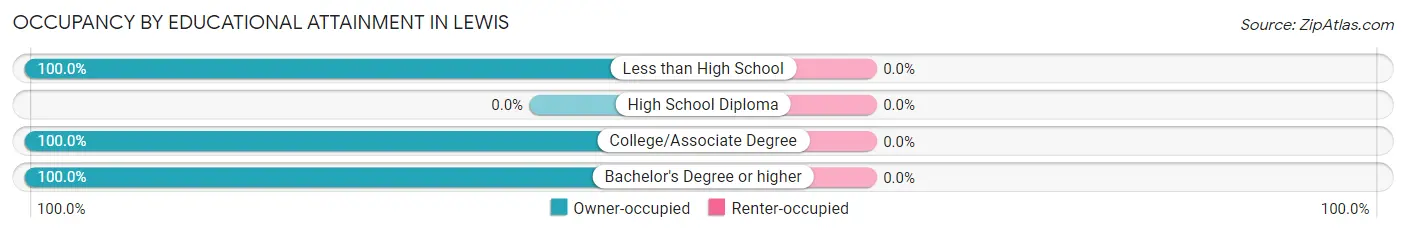
| Household Size | Owner-occupied | Renter-occupied |
| Less than High School | 12 (100.0%) | 0 (0.0%) |
| High School Diploma | 0 (0.0%) | 0 (0.0%) |
| College/Associate Degree | 22 (100.0%) | 0 (0.0%) |
| Bachelor's Degree or higher | 18 (100.0%) | 0 (0.0%) |
Occupancy by Age of Householder in Lewis
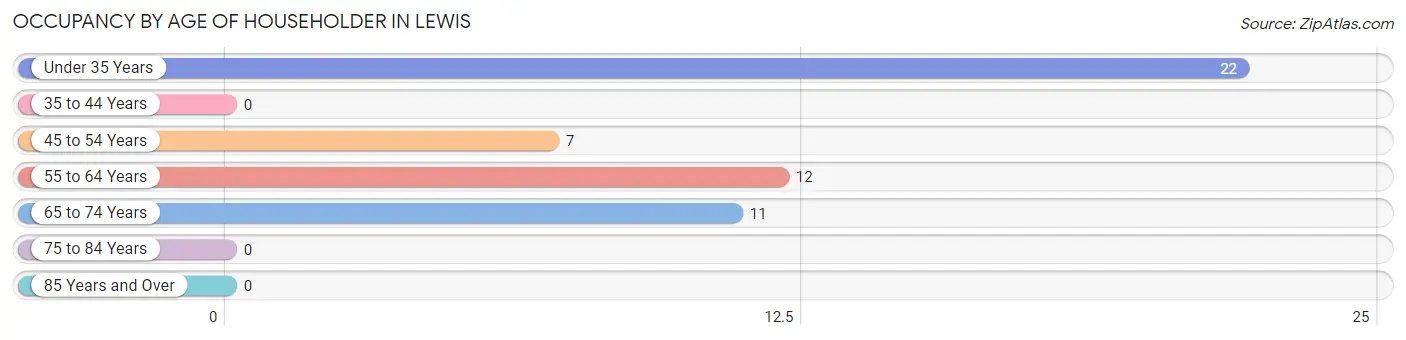
| Age Bracket | # Households | % Households |
| Under 35 Years | 22 | 42.3% |
| 35 to 44 Years | 0 | 0.0% |
| 45 to 54 Years | 7 | 13.5% |
| 55 to 64 Years | 12 | 23.1% |
| 65 to 74 Years | 11 | 21.1% |
| 75 to 84 Years | 0 | 0.0% |
| 85 Years and Over | 0 | 0.0% |
| Total | 52 | 100.0% |
Housing Finances in Lewis
Median Income by Occupancy in Lewis
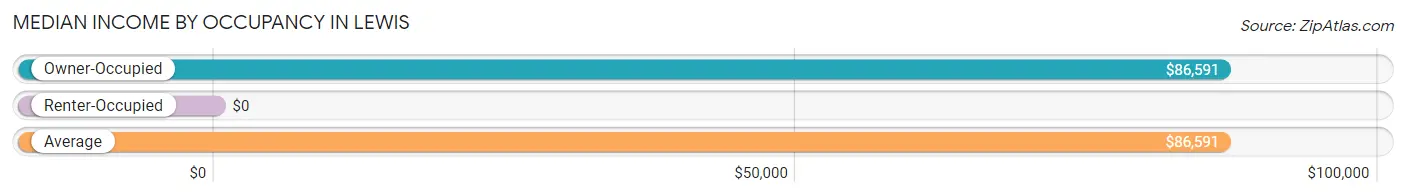
| Occupancy Type | # Households | Median Income |
| Owner-Occupied | 52 (100.0%) | $86,591 |
| Renter-Occupied | 0 (0.0%) | $0 |
| Average | 52 (100.0%) | $86,591 |
Occupancy by Householder Income Bracket in Lewis
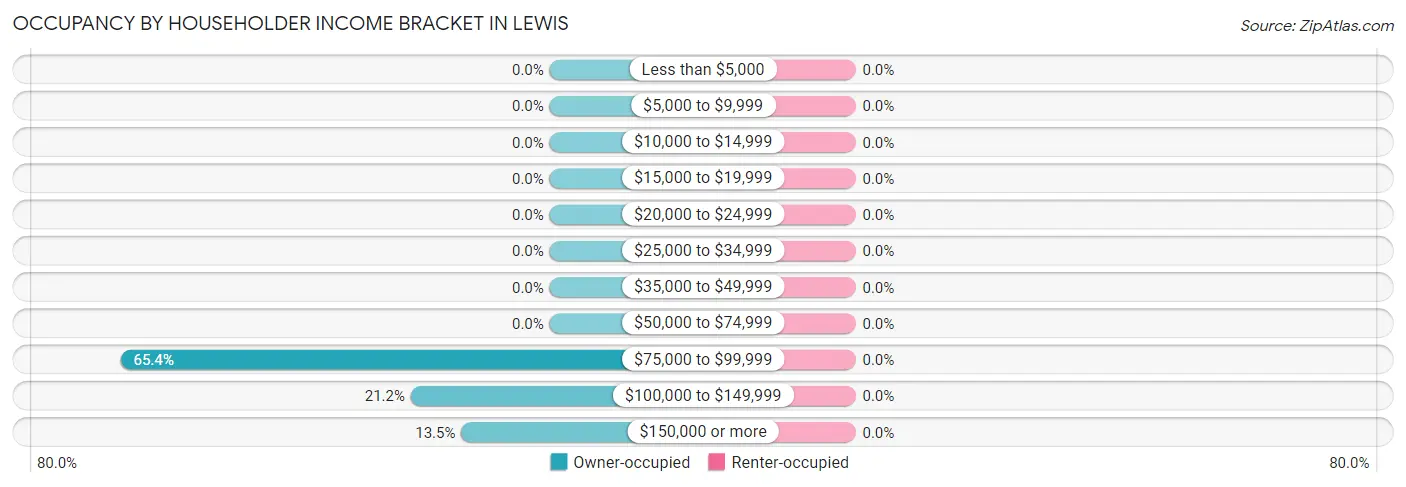
| Income Bracket | Owner-occupied | Renter-occupied |
| Less than $5,000 | 0 (0.0%) | 0 (0.0%) |
| $5,000 to $9,999 | 0 (0.0%) | 0 (0.0%) |
| $10,000 to $14,999 | 0 (0.0%) | 0 (0.0%) |
| $15,000 to $19,999 | 0 (0.0%) | 0 (0.0%) |
| $20,000 to $24,999 | 0 (0.0%) | 0 (0.0%) |
| $25,000 to $34,999 | 0 (0.0%) | 0 (0.0%) |
| $35,000 to $49,999 | 0 (0.0%) | 0 (0.0%) |
| $50,000 to $74,999 | 0 (0.0%) | 0 (0.0%) |
| $75,000 to $99,999 | 34 (65.4%) | 0 (0.0%) |
| $100,000 to $149,999 | 11 (21.1%) | 0 (0.0%) |
| $150,000 or more | 7 (13.5%) | 0 (0.0%) |
| Total | 52 (100.0%) | 0 (0.0%) |
Monthly Housing Cost Tiers in Lewis
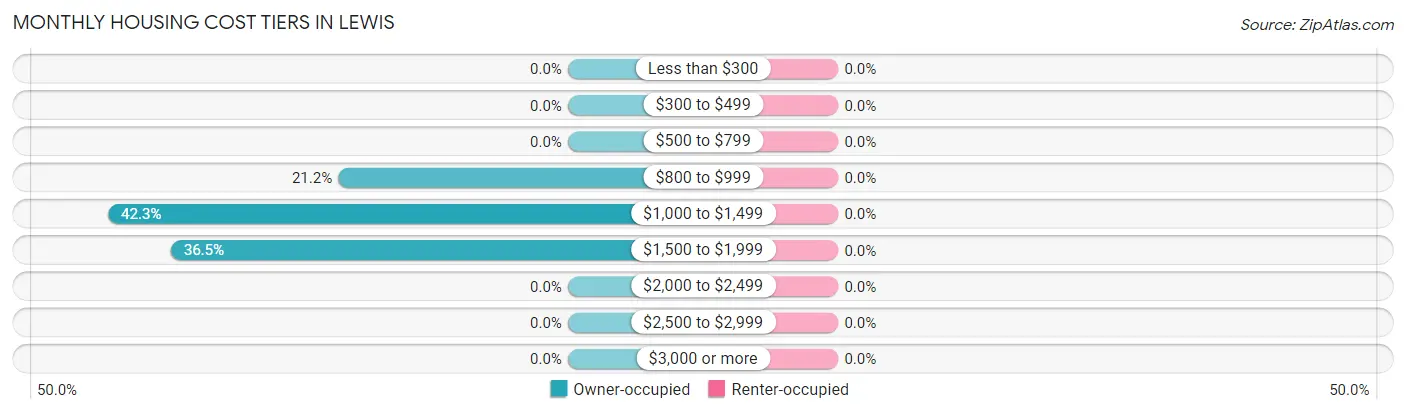
| Monthly Cost | Owner-occupied | Renter-occupied |
| Less than $300 | 0 (0.0%) | 0 (0.0%) |
| $300 to $499 | 0 (0.0%) | 0 (0.0%) |
| $500 to $799 | 0 (0.0%) | 0 (0.0%) |
| $800 to $999 | 11 (21.1%) | 0 (0.0%) |
| $1,000 to $1,499 | 22 (42.3%) | 0 (0.0%) |
| $1,500 to $1,999 | 19 (36.5%) | 0 (0.0%) |
| $2,000 to $2,499 | 0 (0.0%) | 0 (0.0%) |
| $2,500 to $2,999 | 0 (0.0%) | 0 (0.0%) |
| $3,000 or more | 0 (0.0%) | 0 (0.0%) |
| Total | 52 (100.0%) | 0 (0.0%) |
Physical Housing Characteristics in Lewis
Housing Structures in Lewis
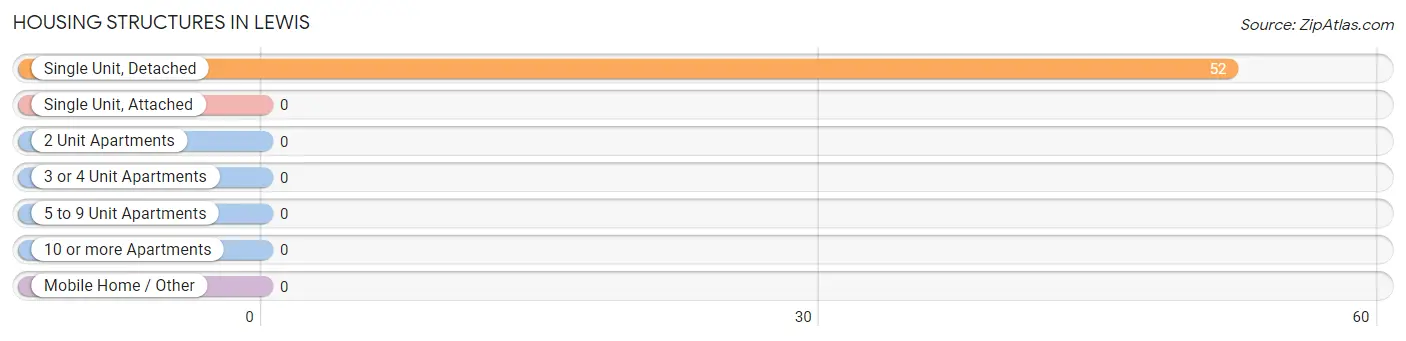
| Structure Type | # Housing Units | % Housing Units |
| Single Unit, Detached | 52 | 100.0% |
| Single Unit, Attached | 0 | 0.0% |
| 2 Unit Apartments | 0 | 0.0% |
| 3 or 4 Unit Apartments | 0 | 0.0% |
| 5 to 9 Unit Apartments | 0 | 0.0% |
| 10 or more Apartments | 0 | 0.0% |
| Mobile Home / Other | 0 | 0.0% |
| Total | 52 | 100.0% |
Housing Structures by Occupancy in Lewis
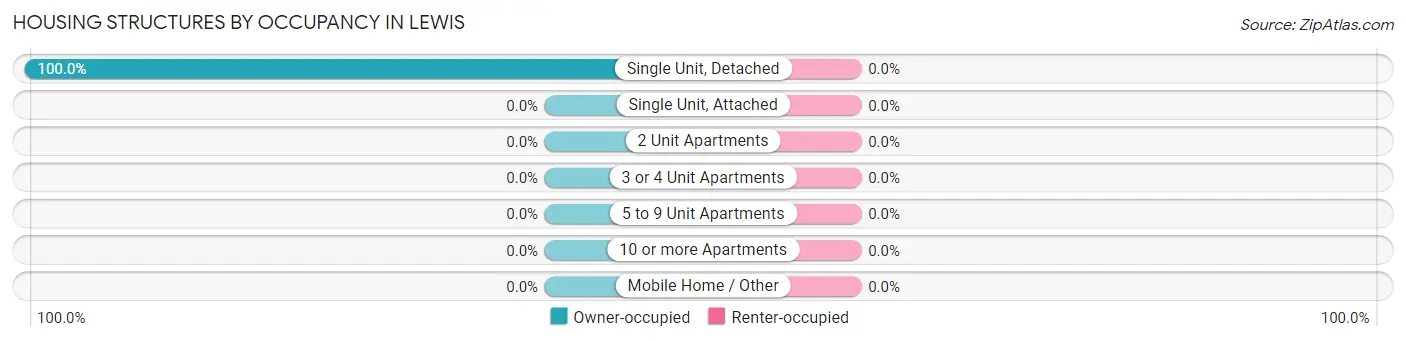
| Structure Type | Owner-occupied | Renter-occupied |
| Single Unit, Detached | 52 (100.0%) | 0 (0.0%) |
| Single Unit, Attached | 0 (0.0%) | 0 (0.0%) |
| 2 Unit Apartments | 0 (0.0%) | 0 (0.0%) |
| 3 or 4 Unit Apartments | 0 (0.0%) | 0 (0.0%) |
| 5 to 9 Unit Apartments | 0 (0.0%) | 0 (0.0%) |
| 10 or more Apartments | 0 (0.0%) | 0 (0.0%) |
| Mobile Home / Other | 0 (0.0%) | 0 (0.0%) |
| Total | 52 (100.0%) | 0 (0.0%) |
Housing Structures by Number of Rooms in Lewis
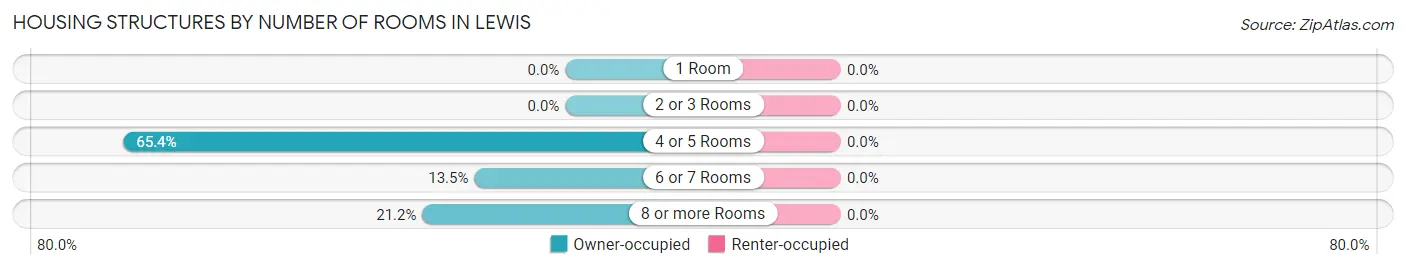
| Number of Rooms | Owner-occupied | Renter-occupied |
| 1 Room | 0 (0.0%) | 0 (0.0%) |
| 2 or 3 Rooms | 0 (0.0%) | 0 (0.0%) |
| 4 or 5 Rooms | 34 (65.4%) | 0 (0.0%) |
| 6 or 7 Rooms | 7 (13.5%) | 0 (0.0%) |
| 8 or more Rooms | 11 (21.1%) | 0 (0.0%) |
| Total | 52 (100.0%) | 0 (0.0%) |
Housing Structure by Heating Type in Lewis
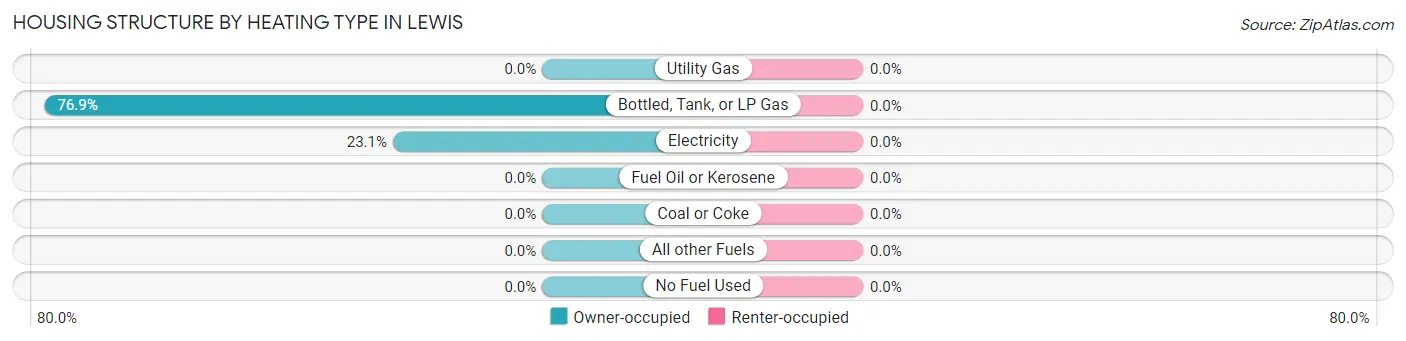
| Heating Type | Owner-occupied | Renter-occupied |
| Utility Gas | 0 (0.0%) | 0 (0.0%) |
| Bottled, Tank, or LP Gas | 40 (76.9%) | 0 (0.0%) |
| Electricity | 12 (23.1%) | 0 (0.0%) |
| Fuel Oil or Kerosene | 0 (0.0%) | 0 (0.0%) |
| Coal or Coke | 0 (0.0%) | 0 (0.0%) |
| All other Fuels | 0 (0.0%) | 0 (0.0%) |
| No Fuel Used | 0 (0.0%) | 0 (0.0%) |
| Total | 52 (100.0%) | 0 (0.0%) |
Household Vehicle Usage in Lewis
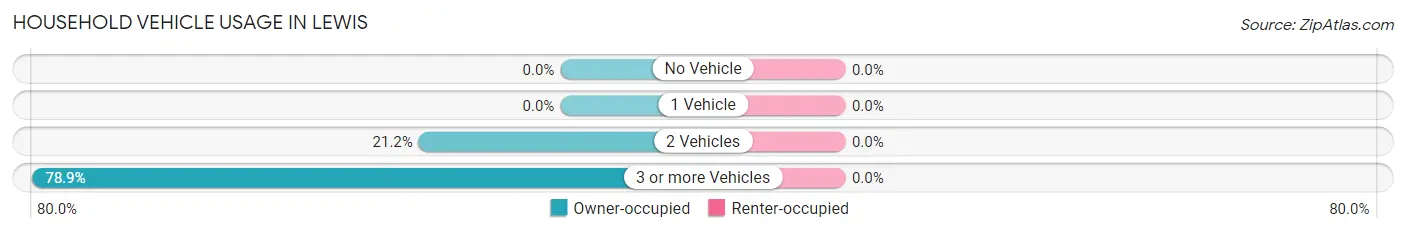
| Vehicles per Household | Owner-occupied | Renter-occupied |
| No Vehicle | 0 (0.0%) | 0 (0.0%) |
| 1 Vehicle | 0 (0.0%) | 0 (0.0%) |
| 2 Vehicles | 11 (21.1%) | 0 (0.0%) |
| 3 or more Vehicles | 41 (78.8%) | 0 (0.0%) |
| Total | 52 (100.0%) | 0 (0.0%) |
Real Estate & Mortgages in Lewis
Real Estate and Mortgage Overview in Lewis
| Characteristic | Without Mortgage | With Mortgage |
| Housing Units | 11 | 41 |
| Median Property Value | - | - |
| Median Household Income | - | - |
| Monthly Housing Costs | - | - |
| Real Estate Taxes | - | - |
Property Value by Mortgage Status in Lewis
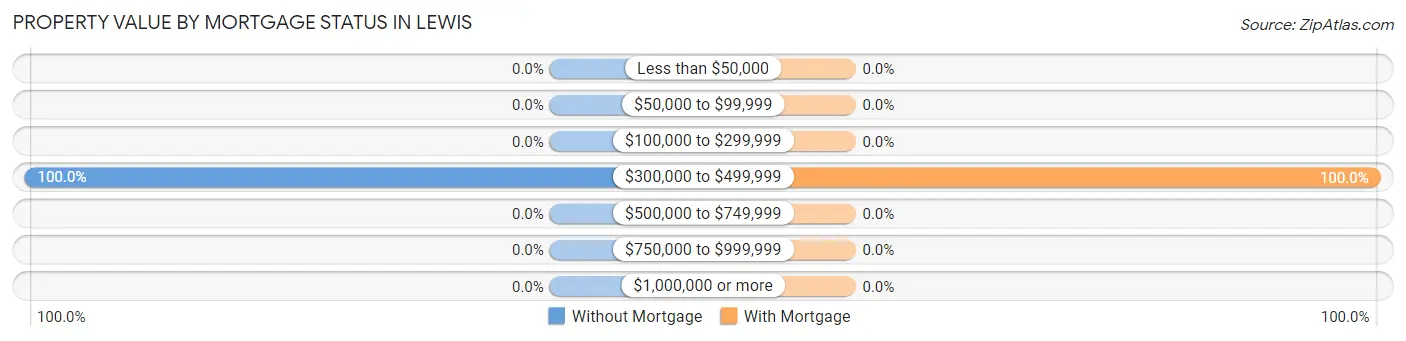
| Property Value | Without Mortgage | With Mortgage |
| Less than $50,000 | 0 (0.0%) | 0 (0.0%) |
| $50,000 to $99,999 | 0 (0.0%) | 0 (0.0%) |
| $100,000 to $299,999 | 0 (0.0%) | 0 (0.0%) |
| $300,000 to $499,999 | 11 (100.0%) | 41 (100.0%) |
| $500,000 to $749,999 | 0 (0.0%) | 0 (0.0%) |
| $750,000 to $999,999 | 0 (0.0%) | 0 (0.0%) |
| $1,000,000 or more | 0 (0.0%) | 0 (0.0%) |
| Total | 11 (100.0%) | 41 (100.0%) |
Household Income by Mortgage Status in Lewis
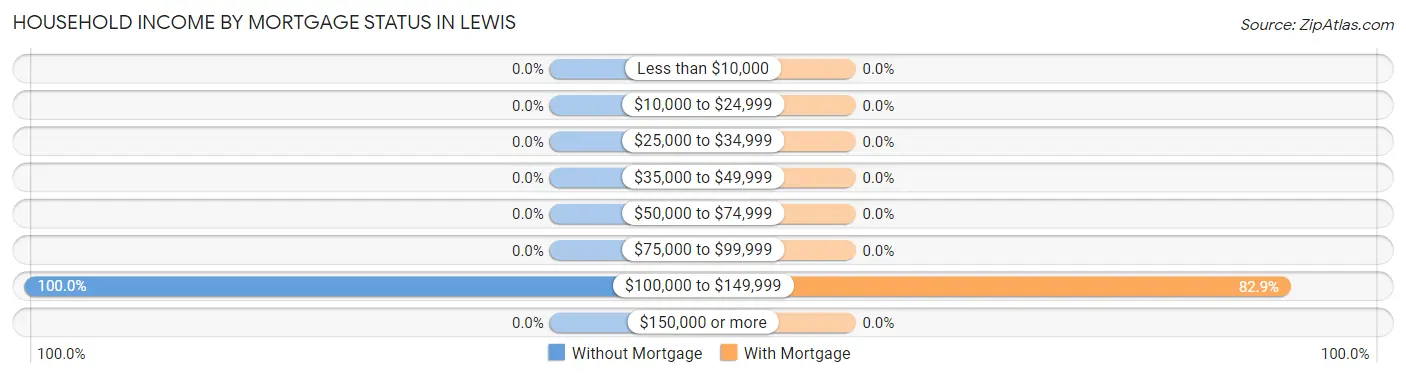
| Household Income | Without Mortgage | With Mortgage |
| Less than $10,000 | 0 (0.0%) | 0 (0.0%) |
| $10,000 to $24,999 | 0 (0.0%) | 0 (0.0%) |
| $25,000 to $34,999 | 0 (0.0%) | 0 (0.0%) |
| $35,000 to $49,999 | 0 (0.0%) | 0 (0.0%) |
| $50,000 to $74,999 | 0 (0.0%) | 0 (0.0%) |
| $75,000 to $99,999 | 0 (0.0%) | 0 (0.0%) |
| $100,000 to $149,999 | 11 (100.0%) | 34 (82.9%) |
| $150,000 or more | 0 (0.0%) | 0 (0.0%) |
| Total | 11 (100.0%) | 41 (100.0%) |
Property Value to Household Income Ratio in Lewis
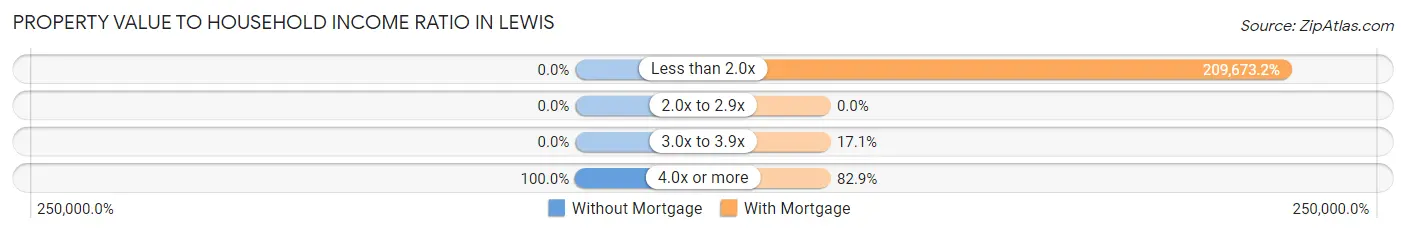
| Value-to-Income Ratio | Without Mortgage | With Mortgage |
| Less than 2.0x | 0 (0.0%) | 85,966 (209,673.2%) |
| 2.0x to 2.9x | 0 (0.0%) | 0 (0.0%) |
| 3.0x to 3.9x | 0 (0.0%) | 7 (17.1%) |
| 4.0x or more | 11 (100.0%) | 34 (82.9%) |
| Total | 11 (100.0%) | 41 (100.0%) |
Real Estate Taxes by Mortgage Status in Lewis
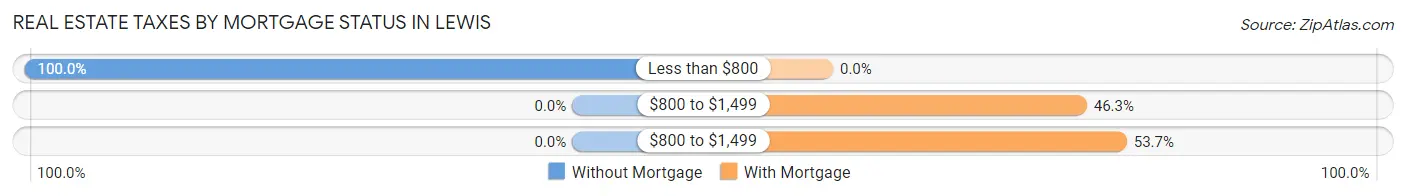
| Property Taxes | Without Mortgage | With Mortgage |
| Less than $800 | 11 (100.0%) | 0 (0.0%) |
| $800 to $1,499 | 0 (0.0%) | 19 (46.3%) |
| $800 to $1,499 | 0 (0.0%) | 22 (53.7%) |
| Total | 11 (100.0%) | 41 (100.0%) |
Health & Disability in Lewis
Health Insurance Coverage by Age in Lewis
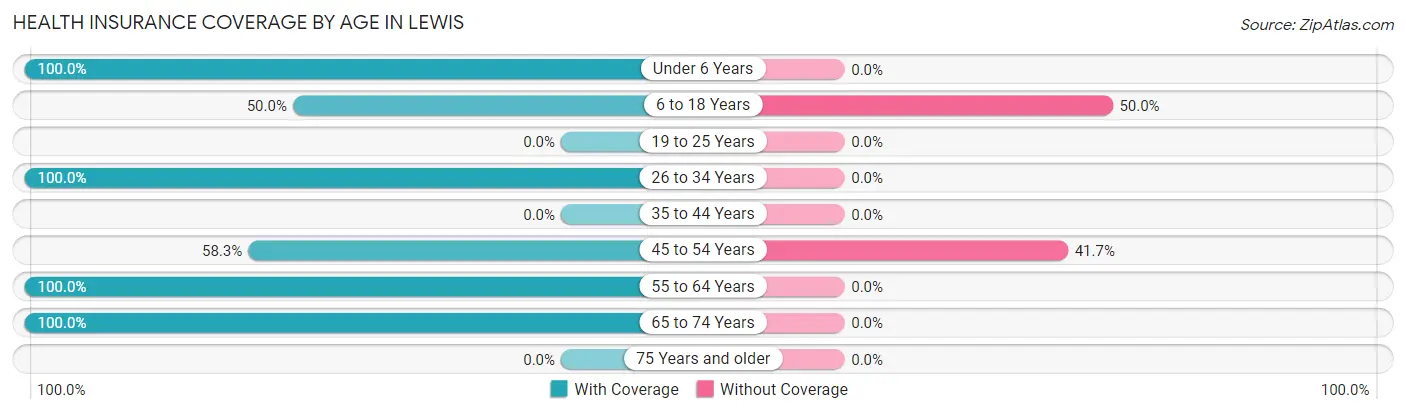
| Age Bracket | With Coverage | Without Coverage |
| Under 6 Years | 27 (100.0%) | 0 (0.0%) |
| 6 to 18 Years | 5 (50.0%) | 5 (50.0%) |
| 19 to 25 Years | 0 (0.0%) | 0 (0.0%) |
| 26 to 34 Years | 65 (100.0%) | 0 (0.0%) |
| 35 to 44 Years | 0 (0.0%) | 0 (0.0%) |
| 45 to 54 Years | 7 (58.3%) | 5 (41.7%) |
| 55 to 64 Years | 12 (100.0%) | 0 (0.0%) |
| 65 to 74 Years | 23 (100.0%) | 0 (0.0%) |
| 75 Years and older | 0 (0.0%) | 0 (0.0%) |
| Total | 139 (93.3%) | 10 (6.7%) |
Health Insurance Coverage by Citizenship Status in Lewis
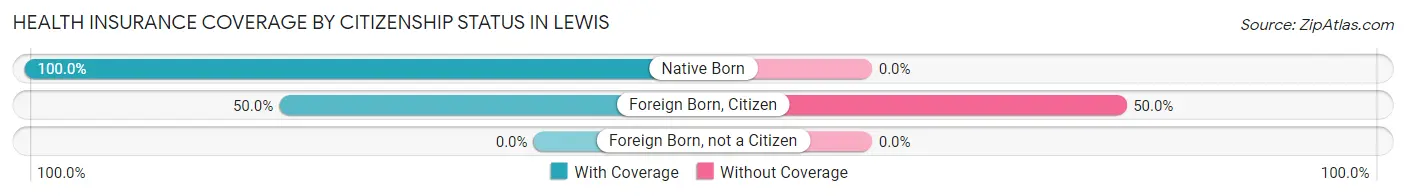
| Citizenship Status | With Coverage | Without Coverage |
| Native Born | 27 (100.0%) | 0 (0.0%) |
| Foreign Born, Citizen | 5 (50.0%) | 5 (50.0%) |
| Foreign Born, not a Citizen | 0 (0.0%) | 0 (0.0%) |
Health Insurance Coverage by Household Income in Lewis
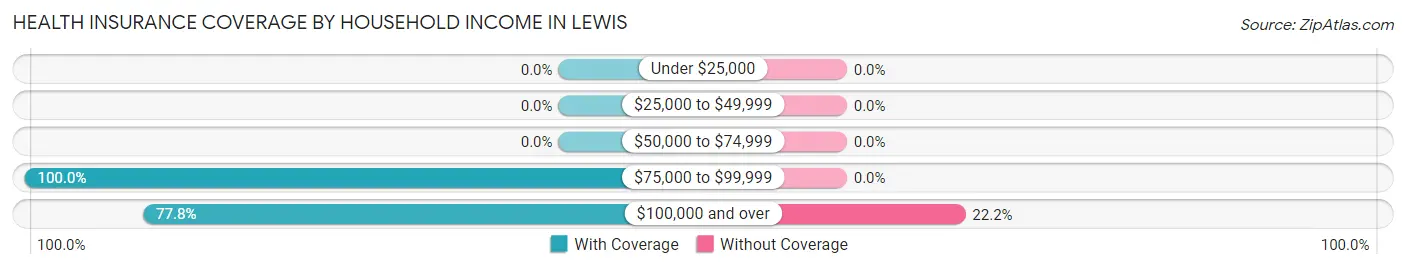
| Household Income | With Coverage | Without Coverage |
| Under $25,000 | 0 (0.0%) | 0 (0.0%) |
| $25,000 to $49,999 | 0 (0.0%) | 0 (0.0%) |
| $50,000 to $74,999 | 0 (0.0%) | 0 (0.0%) |
| $75,000 to $99,999 | 104 (100.0%) | 0 (0.0%) |
| $100,000 and over | 35 (77.8%) | 10 (22.2%) |
Public vs Private Health Insurance Coverage by Age in Lewis
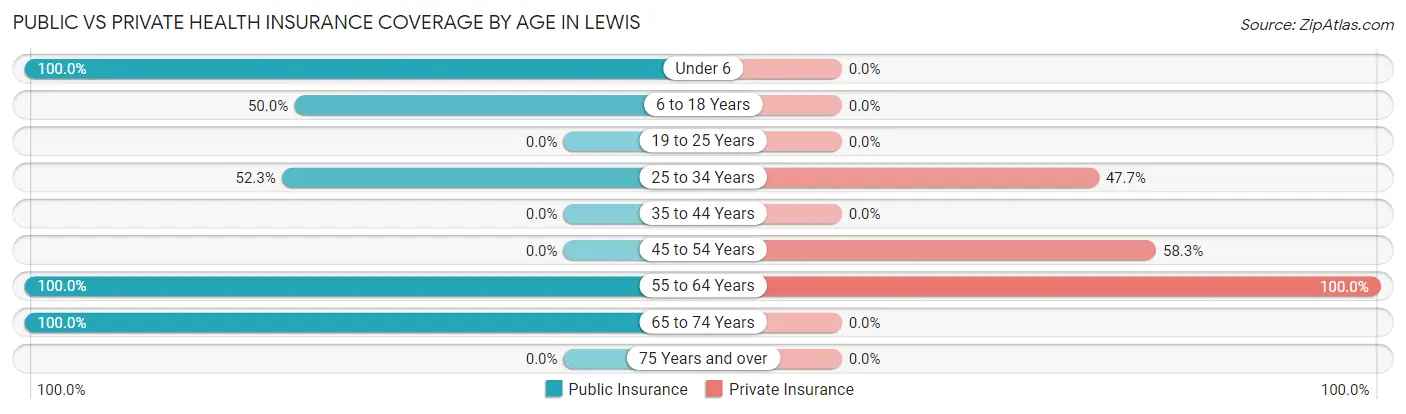
| Age Bracket | Public Insurance | Private Insurance |
| Under 6 | 27 (100.0%) | 0 (0.0%) |
| 6 to 18 Years | 5 (50.0%) | 0 (0.0%) |
| 19 to 25 Years | 0 (0.0%) | 0 (0.0%) |
| 25 to 34 Years | 34 (52.3%) | 31 (47.7%) |
| 35 to 44 Years | 0 (0.0%) | 0 (0.0%) |
| 45 to 54 Years | 0 (0.0%) | 7 (58.3%) |
| 55 to 64 Years | 12 (100.0%) | 12 (100.0%) |
| 65 to 74 Years | 23 (100.0%) | 0 (0.0%) |
| 75 Years and over | 0 (0.0%) | 0 (0.0%) |
| Total | 101 (67.8%) | 50 (33.6%) |
Disability Status by Sex by Age in Lewis
| Age Bracket | Male | Female |
| Under 5 Years | 0 (0.0%) | 0 (0.0%) |
| 5 to 17 Years | 0 (0.0%) | 0 (0.0%) |
| 18 to 34 Years | 0 (0.0%) | 0 (0.0%) |
| 35 to 64 Years | 0 (0.0%) | 0 (0.0%) |
| 65 to 74 Years | 0 (0.0%) | 0 (0.0%) |
| 75 Years and over | 0 (0.0%) | 0 (0.0%) |
Disability Class by Sex by Age in Lewis
Disability Class: Hearing Difficulty
| Age Bracket | Male | Female |
| Under 5 Years | 0 (0.0%) | 0 (0.0%) |
| 5 to 17 Years | 0 (0.0%) | 0 (0.0%) |
| 18 to 34 Years | 0 (0.0%) | 0 (0.0%) |
| 35 to 64 Years | 0 (0.0%) | 0 (0.0%) |
| 65 to 74 Years | 0 (0.0%) | 0 (0.0%) |
| 75 Years and over | 0 (0.0%) | 0 (0.0%) |
Disability Class: Vision Difficulty
| Age Bracket | Male | Female |
| Under 5 Years | 0 (0.0%) | 0 (0.0%) |
| 5 to 17 Years | 0 (0.0%) | 0 (0.0%) |
| 18 to 34 Years | 0 (0.0%) | 0 (0.0%) |
| 35 to 64 Years | 0 (0.0%) | 0 (0.0%) |
| 65 to 74 Years | 0 (0.0%) | 0 (0.0%) |
| 75 Years and over | 0 (0.0%) | 0 (0.0%) |
Disability Class: Cognitive Difficulty
| Age Bracket | Male | Female |
| 5 to 17 Years | 0 (0.0%) | 0 (0.0%) |
| 18 to 34 Years | 0 (0.0%) | 0 (0.0%) |
| 35 to 64 Years | 0 (0.0%) | 0 (0.0%) |
| 65 to 74 Years | 0 (0.0%) | 0 (0.0%) |
| 75 Years and over | 0 (0.0%) | 0 (0.0%) |
Disability Class: Ambulatory Difficulty
| Age Bracket | Male | Female |
| 5 to 17 Years | 0 (0.0%) | 0 (0.0%) |
| 18 to 34 Years | 0 (0.0%) | 0 (0.0%) |
| 35 to 64 Years | 0 (0.0%) | 0 (0.0%) |
| 65 to 74 Years | 0 (0.0%) | 0 (0.0%) |
| 75 Years and over | 0 (0.0%) | 0 (0.0%) |
Disability Class: Self-Care Difficulty
| Age Bracket | Male | Female |
| 5 to 17 Years | 0 (0.0%) | 0 (0.0%) |
| 18 to 34 Years | 0 (0.0%) | 0 (0.0%) |
| 35 to 64 Years | 0 (0.0%) | 0 (0.0%) |
| 65 to 74 Years | 0 (0.0%) | 0 (0.0%) |
| 75 Years and over | 0 (0.0%) | 0 (0.0%) |
Technology Access in Lewis
Computing Device Access in Lewis
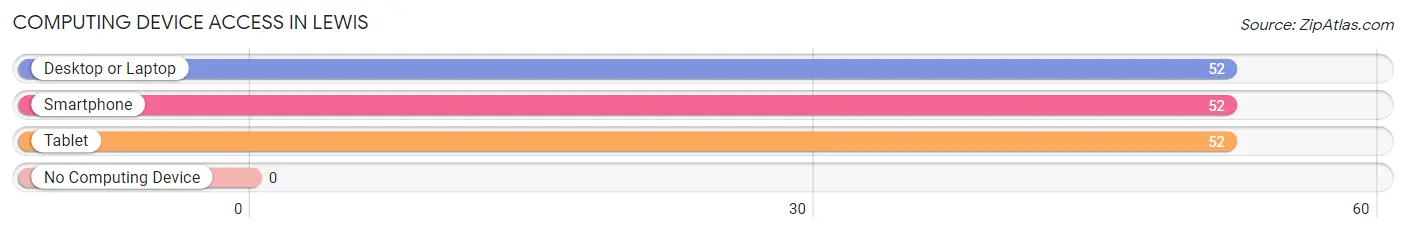
| Device Type | # Households | % Households |
| Desktop or Laptop | 52 | 100.0% |
| Smartphone | 52 | 100.0% |
| Tablet | 52 | 100.0% |
| No Computing Device | 0 | 0.0% |
| Total | 52 | 100.0% |
Internet Access in Lewis
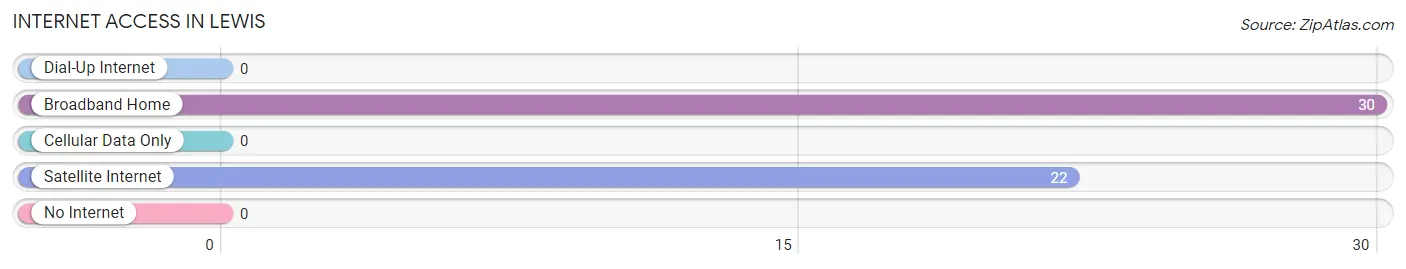
| Internet Type | # Households | % Households |
| Dial-Up Internet | 0 | 0.0% |
| Broadband Home | 30 | 57.7% |
| Cellular Data Only | 0 | 0.0% |
| Satellite Internet | 22 | 42.3% |
| No Internet | 0 | 0.0% |
| Total | 52 | 100.0% |
Lewis Summary
Lewis, Colorado is a small town located in the San Luis Valley in the south-central part of the state. It is situated at an elevation of 8,000 feet and is surrounded by the Sangre de Cristo Mountains. The town was founded in 1876 by a group of settlers from the nearby town of Saguache. The town was named after the Lewis family, who were among the first settlers.
Geography
Lewis is located in the San Luis Valley, which is a large intermontane basin located in south-central Colorado. The valley is surrounded by the Sangre de Cristo Mountains to the east and the San Juan Mountains to the west. The valley is approximately 8,000 feet above sea level and is the largest alpine valley in the United States. The valley is home to several rivers, including the Rio Grande, the Arkansas River, and the Conejos River. The climate in the valley is semi-arid, with hot summers and cold winters.
Economy
The economy of Lewis is largely based on agriculture and tourism. The town is home to several farms and ranches, which produce a variety of crops, including potatoes, alfalfa, and hay. The town is also home to several tourist attractions, including the Great Sand Dunes National Park and the San Luis Valley Museum. The town is also home to several small businesses, including restaurants, shops, and lodging.
Demographics
As of the 2010 census, the population of Lewis was 545. The racial makeup of the town was 94.2% White, 0.2% African American, 0.7% Native American, 0.2% Asian, 0.2% Pacific Islander, 2.7% from other races, and 1.9% from two or more races. Hispanic or Latino of any race were 8.2% of the population.
The median income for a household in Lewis was $31,250, and the median income for a family was $35,417. The per capita income for the town was $14,945. About 11.2% of families and 14.2% of the population were below the poverty line, including 18.2% of those under age 18 and 8.3% of those age 65 or over.
Conclusion
Lewis, Colorado is a small town located in the San Luis Valley in the south-central part of the state. It is situated at an elevation of 8,000 feet and is surrounded by the Sangre de Cristo Mountains. The town was founded in 1876 by a group of settlers from the nearby town of Saguache. The town is home to several farms and ranches, which produce a variety of crops, and is also home to several tourist attractions. The population of Lewis was 545 as of the 2010 census, and the median income for a household was $31,250. The town is a great place to visit and explore, and offers a unique glimpse into the history and culture of the San Luis Valley.
Common Questions
What is Per Capita Income in Lewis?
Per Capita income in Lewis is $30,321.
What is the Median Family Income in Lewis?
Median Family Income in Lewis is $100,682.
What is the Median Household income in Lewis?
Median Household Income in Lewis is $86,591.
What is Inequality or Gini Index in Lewis?
Inequality or Gini Index in Lewis is 0.14.
What is the Total Population of Lewis?
Total Population of Lewis is 149.
What is the Total Male Population of Lewis?
Total Male Population of Lewis is 58.
What is the Total Female Population of Lewis?
Total Female Population of Lewis is 91.
What is the Ratio of Males per 100 Females in Lewis?
There are 63.74 Males per 100 Females in Lewis.
What is the Ratio of Females per 100 Males in Lewis?
There are 156.90 Females per 100 Males in Lewis.
What is the Median Population Age in Lewis?
Median Population Age in Lewis is 30.0 Years.
What is the Average Family Size in Lewis
Average Family Size in Lewis is 3.9 People.
What is the Average Household Size in Lewis
Average Household Size in Lewis is 2.9 People.
How Large is the Labor Force in Lewis?
There are 61 People in the Labor Forcein in Lewis.
What is the Percentage of People in the Labor Force in Lewis?
54.5% of People are in the Labor Force in Lewis.