Kremmling, CO Map & Demographics
Kremmling Map
Kremmling Overview
$29,021
PER CAPITA INCOME
$83,786
AVG FAMILY INCOME
$64,141
AVG HOUSEHOLD INCOME
23.4%
WAGE / INCOME GAP [ % ]
76.6¢/ $1
WAGE / INCOME GAP [ $ ]
0.44
INEQUALITY / GINI INDEX
1,779
TOTAL POPULATION
996
MALE POPULATION
783
FEMALE POPULATION
127.20
MALES / 100 FEMALES
78.61
FEMALES / 100 MALES
35.2
MEDIAN AGE
4.1
AVG FAMILY SIZE
2.9
AVG HOUSEHOLD SIZE
788
LABOR FORCE [ PEOPLE ]
62.8%
PERCENT IN LABOR FORCE
2.4%
UNEMPLOYMENT RATE
Kremmling Zip Codes
Kremmling Area Codes
Income in Kremmling
Income Overview in Kremmling
Per Capita Income in Kremmling is $29,021, while median incomes of families and households are $83,786 and $64,141 respectively.
| Characteristic | Number | Measure |
| Per Capita Income | 1,779 | $29,021 |
| Median Family Income | 366 | $83,786 |
| Mean Family Income | 366 | $98,211 |
| Median Household Income | 610 | $64,141 |
| Mean Household Income | 610 | $82,903 |
| Income Deficit | 366 | $0 |
| Wage / Income Gap (%) | 1,779 | 23.39% |
| Wage / Income Gap ($) | 1,779 | 76.61¢ per $1 |
| Gini / Inequality Index | 1,779 | 0.44 |
Earnings by Sex in Kremmling
Average Earnings in Kremmling are $42,021, $50,357 for men and $38,581 for women, a difference of 23.4%.
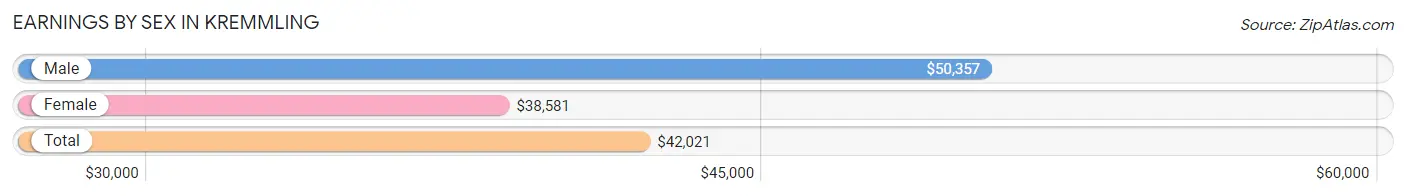
| Sex | Number | Average Earnings |
| Male | 530 (65.6%) | $50,357 |
| Female | 278 (34.4%) | $38,581 |
| Total | 808 (100.0%) | $42,021 |
Earnings by Sex by Income Bracket in Kremmling
The most common earnings brackets in Kremmling are $100,000+ for men (101 | 19.1%) and $35,000 to $39,999 for women (37 | 13.3%).
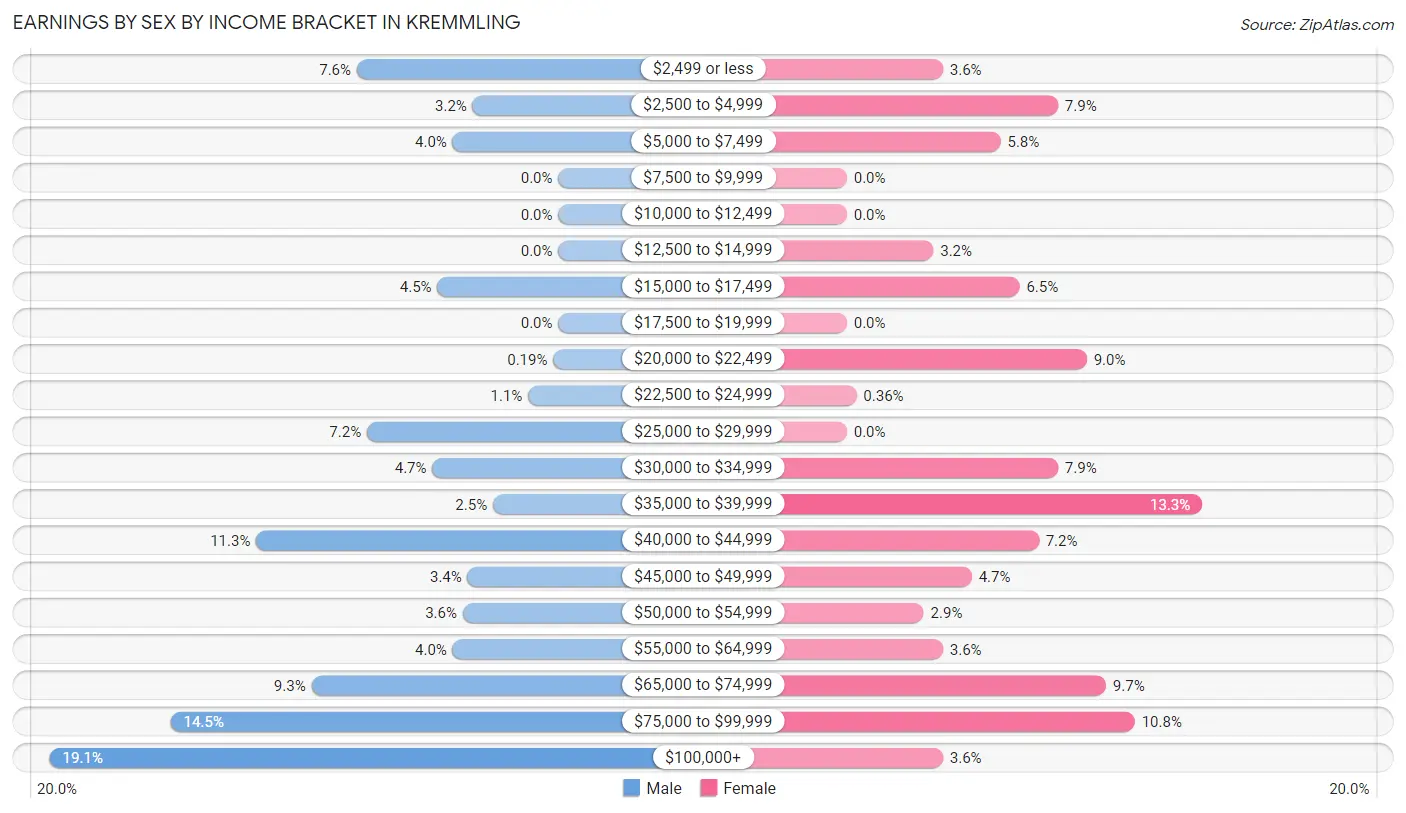
| Income | Male | Female |
| $2,499 or less | 40 (7.5%) | 10 (3.6%) |
| $2,500 to $4,999 | 17 (3.2%) | 22 (7.9%) |
| $5,000 to $7,499 | 21 (4.0%) | 16 (5.8%) |
| $7,500 to $9,999 | 0 (0.0%) | 0 (0.0%) |
| $10,000 to $12,499 | 0 (0.0%) | 0 (0.0%) |
| $12,500 to $14,999 | 0 (0.0%) | 9 (3.2%) |
| $15,000 to $17,499 | 24 (4.5%) | 18 (6.5%) |
| $17,500 to $19,999 | 0 (0.0%) | 0 (0.0%) |
| $20,000 to $22,499 | 1 (0.2%) | 25 (9.0%) |
| $22,500 to $24,999 | 6 (1.1%) | 1 (0.4%) |
| $25,000 to $29,999 | 38 (7.2%) | 0 (0.0%) |
| $30,000 to $34,999 | 25 (4.7%) | 22 (7.9%) |
| $35,000 to $39,999 | 13 (2.5%) | 37 (13.3%) |
| $40,000 to $44,999 | 60 (11.3%) | 20 (7.2%) |
| $45,000 to $49,999 | 18 (3.4%) | 13 (4.7%) |
| $50,000 to $54,999 | 19 (3.6%) | 8 (2.9%) |
| $55,000 to $64,999 | 21 (4.0%) | 10 (3.6%) |
| $65,000 to $74,999 | 49 (9.2%) | 27 (9.7%) |
| $75,000 to $99,999 | 77 (14.5%) | 30 (10.8%) |
| $100,000+ | 101 (19.1%) | 10 (3.6%) |
| Total | 530 (100.0%) | 278 (100.0%) |
Earnings by Sex by Educational Attainment in Kremmling
Average earnings in Kremmling are $68,250 for men and $40,125 for women, a difference of 41.2%. Men with an educational attainment of graduate degree enjoy the highest average annual earnings of $143,036, while those with high school diploma education earn the least with $33,125. Women with an educational attainment of high school diploma earn the most with the average annual earnings of $70,655, while those with college or associate's degree education have the smallest earnings of $37,750.
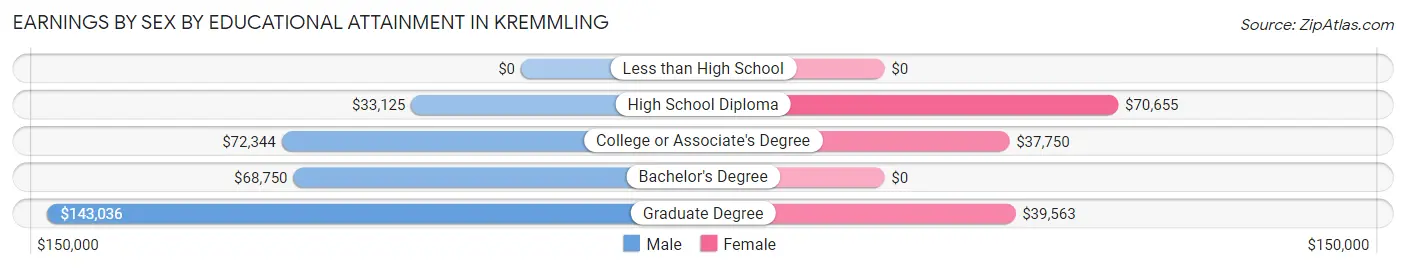
| Educational Attainment | Male Income | Female Income |
| Less than High School | - | - |
| High School Diploma | $33,125 | $70,655 |
| College or Associate's Degree | $72,344 | $37,750 |
| Bachelor's Degree | $68,750 | $0 |
| Graduate Degree | $143,036 | $39,563 |
| Total | $68,250 | $40,125 |
Family Income in Kremmling
Family Income Brackets in Kremmling
According to the Kremmling family income data, there are 79 families falling into the $35,000 to $49,999 income range, which is the most common income bracket and makes up 21.6% of all families.
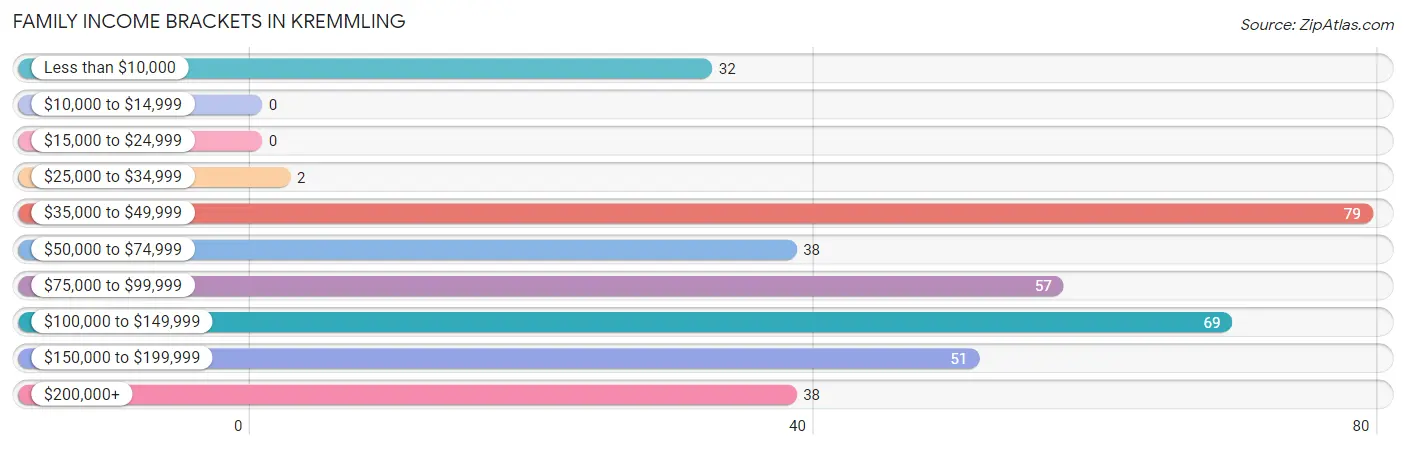
| Income Bracket | # Families | % Families |
| Less than $10,000 | 32 | 8.7% |
| $10,000 to $14,999 | 0 | 0.0% |
| $15,000 to $24,999 | 0 | 0.0% |
| $25,000 to $34,999 | 2 | 0.5% |
| $35,000 to $49,999 | 79 | 21.6% |
| $50,000 to $74,999 | 38 | 10.4% |
| $75,000 to $99,999 | 57 | 15.6% |
| $100,000 to $149,999 | 69 | 18.9% |
| $150,000 to $199,999 | 51 | 13.9% |
| $200,000+ | 38 | 10.4% |
Family Income by Famaliy Size in Kremmling
2-person families (201 | 54.9%) account for the highest median family income in Kremmling with $83,536 per family, while 2-person families (201 | 54.9%) have the highest median income of $41,768 per family member.
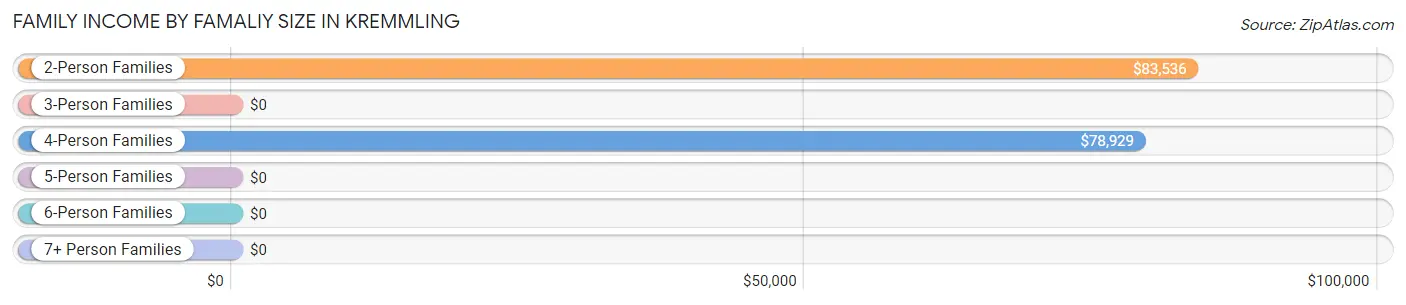
| Income Bracket | # Families | Median Income |
| 2-Person Families | 201 (54.9%) | $83,536 |
| 3-Person Families | 68 (18.6%) | $0 |
| 4-Person Families | 52 (14.2%) | $78,929 |
| 5-Person Families | 10 (2.7%) | $0 |
| 6-Person Families | 30 (8.2%) | $0 |
| 7+ Person Families | 5 (1.4%) | $0 |
| Total | 366 (100.0%) | $83,786 |
Family Income by Number of Earners in Kremmling
The median family income in Kremmling is $83,786, with families comprising 3+ earners (47) having the highest median family income of $166,806, while families with no earners (76) have the lowest median family income of $38,500, accounting for 12.8% and 20.8% of families, respectively.
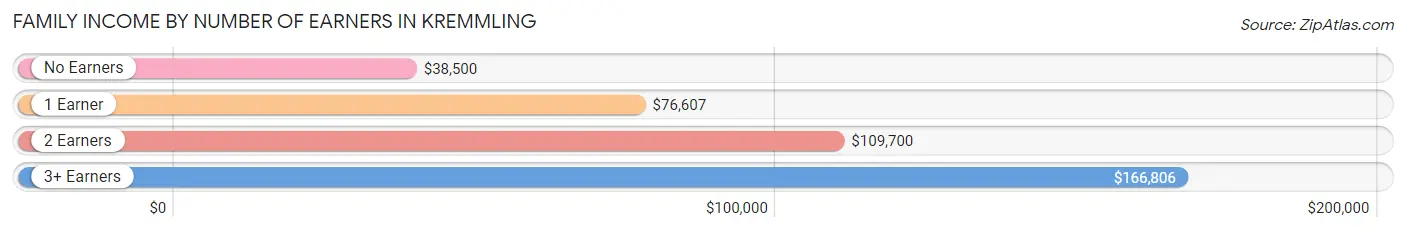
| Number of Earners | # Families | Median Income |
| No Earners | 76 (20.8%) | $38,500 |
| 1 Earner | 101 (27.6%) | $76,607 |
| 2 Earners | 142 (38.8%) | $109,700 |
| 3+ Earners | 47 (12.8%) | $166,806 |
| Total | 366 (100.0%) | $83,786 |
Household Income in Kremmling
Household Income Brackets in Kremmling
With 104 households falling in the category, the $35,000 to $49,999 income range is the most frequent in Kremmling, accounting for 17.1% of all households. In contrast, only 9 households (1.5%) fall into the $25,000 to $34,999 income bracket, making it the least populous group.
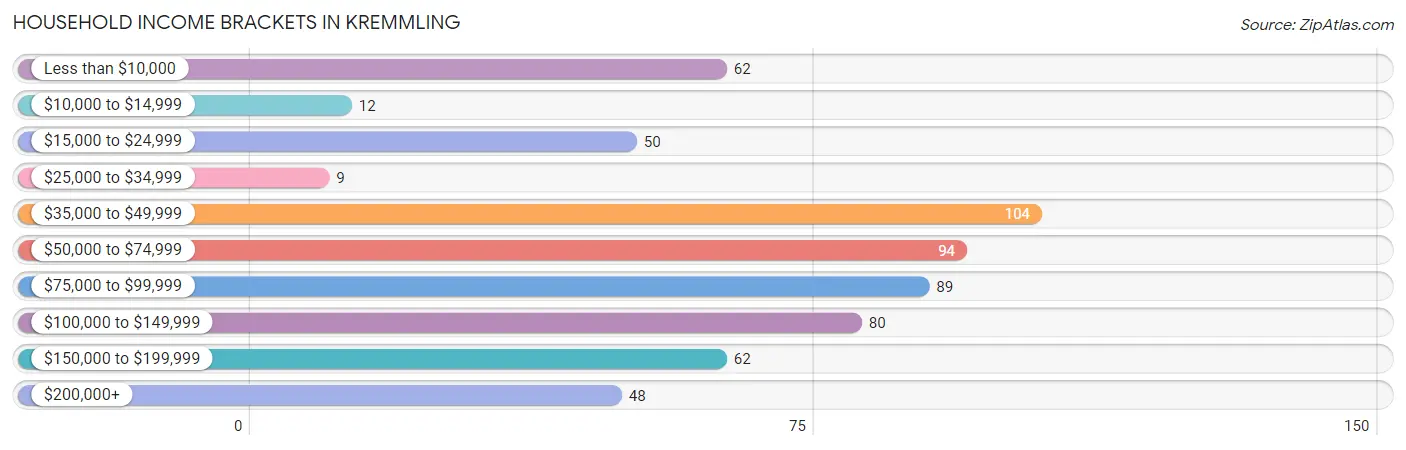
| Income Bracket | # Households | % Households |
| Less than $10,000 | 62 | 10.2% |
| $10,000 to $14,999 | 12 | 2.0% |
| $15,000 to $24,999 | 50 | 8.2% |
| $25,000 to $34,999 | 9 | 1.5% |
| $35,000 to $49,999 | 104 | 17.0% |
| $50,000 to $74,999 | 94 | 15.4% |
| $75,000 to $99,999 | 89 | 14.6% |
| $100,000 to $149,999 | 80 | 13.1% |
| $150,000 to $199,999 | 62 | 10.2% |
| $200,000+ | 48 | 7.9% |
Household Income by Householder Age in Kremmling
The median household income in Kremmling is $64,141, with the highest median household income of $108,000 found in the 25 to 44 years age bracket for the primary householder. A total of 144 households (23.6%) fall into this category. Meanwhile, the 15 to 24 years age bracket for the primary householder has the lowest median household income of $0, with 10 households (1.6%) in this group.
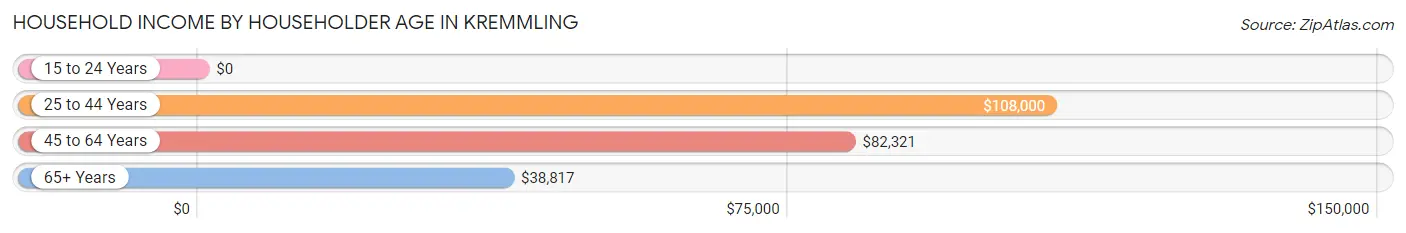
| Income Bracket | # Households | Median Income |
| 15 to 24 Years | 10 (1.6%) | $0 |
| 25 to 44 Years | 144 (23.6%) | $108,000 |
| 45 to 64 Years | 257 (42.1%) | $82,321 |
| 65+ Years | 199 (32.6%) | $38,817 |
| Total | 610 (100.0%) | $64,141 |
Poverty in Kremmling
Income Below Poverty by Sex and Age in Kremmling
With 15.6% poverty level for males and 23.3% for females among the residents of Kremmling, 18 to 24 year old males and 16 and 17 year old females are the most vulnerable to poverty, with 63 males (47.0%) and 15 females (100.0%) in their respective age groups living below the poverty level.
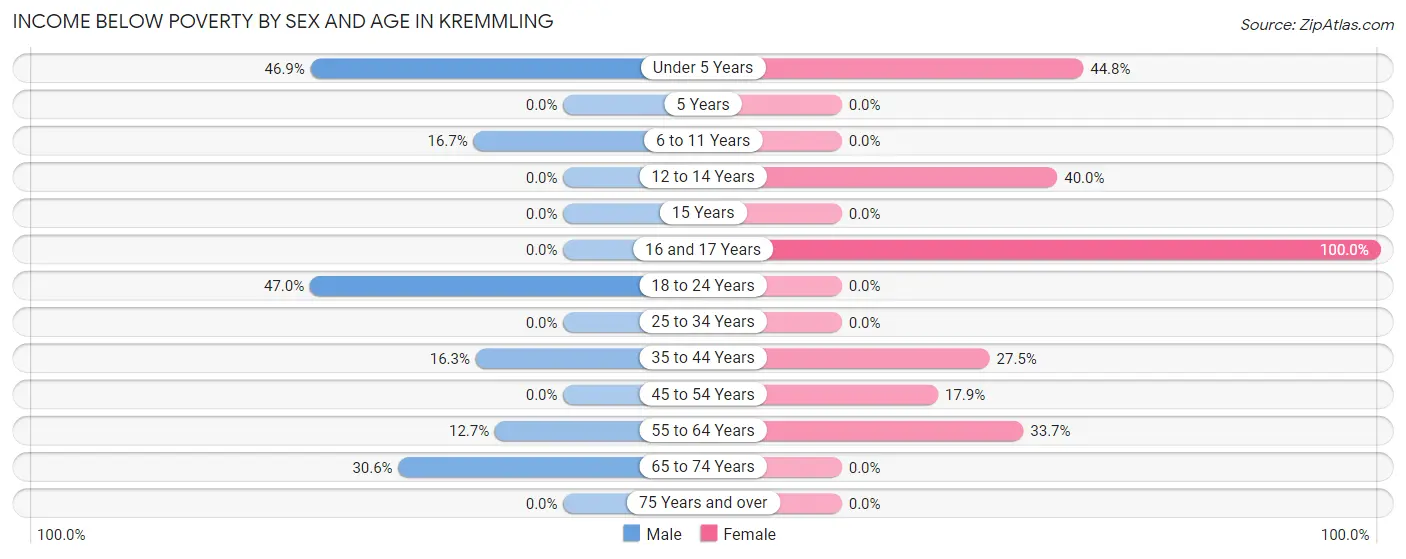
| Age Bracket | Male | Female |
| Under 5 Years | 38 (46.9%) | 39 (44.8%) |
| 5 Years | 0 (0.0%) | 0 (0.0%) |
| 6 to 11 Years | 8 (16.7%) | 0 (0.0%) |
| 12 to 14 Years | 0 (0.0%) | 48 (40.0%) |
| 15 Years | 0 (0.0%) | 0 (0.0%) |
| 16 and 17 Years | 0 (0.0%) | 15 (100.0%) |
| 18 to 24 Years | 63 (47.0%) | 0 (0.0%) |
| 25 to 34 Years | 0 (0.0%) | 0 (0.0%) |
| 35 to 44 Years | 13 (16.3%) | 28 (27.5%) |
| 45 to 54 Years | 0 (0.0%) | 20 (17.9%) |
| 55 to 64 Years | 18 (12.7%) | 31 (33.7%) |
| 65 to 74 Years | 15 (30.6%) | 0 (0.0%) |
| 75 Years and over | 0 (0.0%) | 0 (0.0%) |
| Total | 155 (15.6%) | 181 (23.3%) |
Income Above Poverty by Sex and Age in Kremmling
According to the poverty statistics in Kremmling, males aged 12 to 14 years and females aged 6 to 11 years are the age groups that are most secure financially, with 100.0% of males and 100.0% of females in these age groups living above the poverty line.
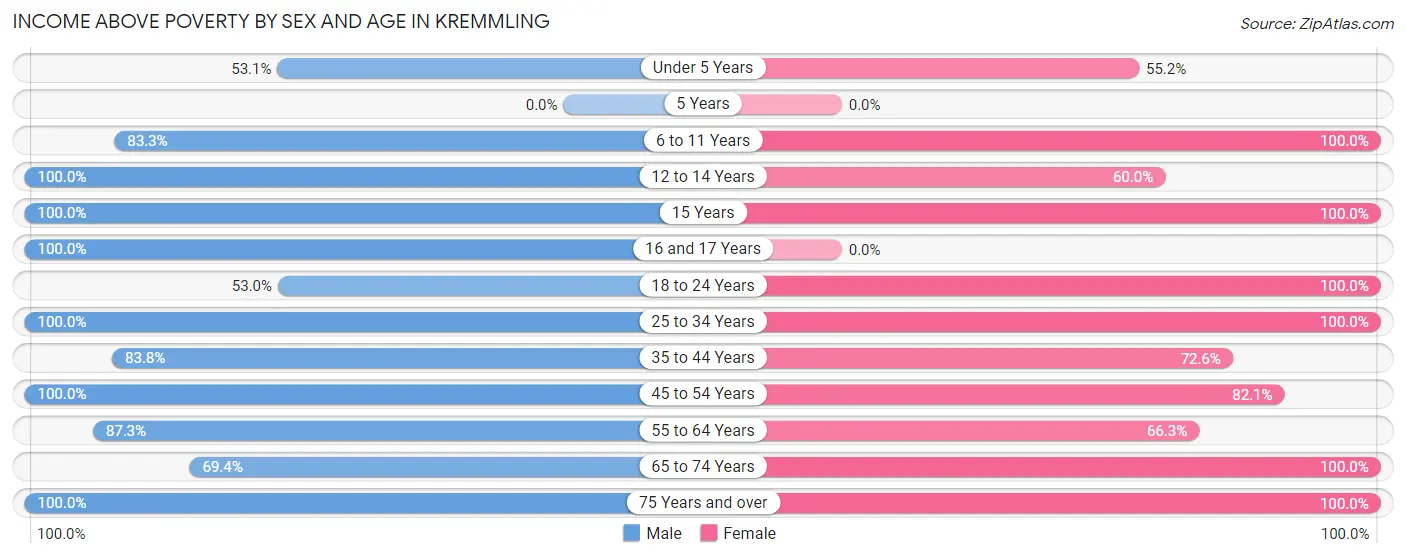
| Age Bracket | Male | Female |
| Under 5 Years | 43 (53.1%) | 48 (55.2%) |
| 5 Years | 0 (0.0%) | 0 (0.0%) |
| 6 to 11 Years | 40 (83.3%) | 19 (100.0%) |
| 12 to 14 Years | 89 (100.0%) | 72 (60.0%) |
| 15 Years | 69 (100.0%) | 11 (100.0%) |
| 16 and 17 Years | 70 (100.0%) | 0 (0.0%) |
| 18 to 24 Years | 71 (53.0%) | 39 (100.0%) |
| 25 to 34 Years | 69 (100.0%) | 35 (100.0%) |
| 35 to 44 Years | 67 (83.8%) | 74 (72.6%) |
| 45 to 54 Years | 127 (100.0%) | 92 (82.1%) |
| 55 to 64 Years | 124 (87.3%) | 61 (66.3%) |
| 65 to 74 Years | 34 (69.4%) | 14 (100.0%) |
| 75 Years and over | 38 (100.0%) | 131 (100.0%) |
| Total | 841 (84.4%) | 596 (76.7%) |
Income Below Poverty Among Married-Couple Families in Kremmling
The poverty statistics for married-couple families in Kremmling show that 9.9% or 28 of the total 284 families live below the poverty line. Families with 3 or 4 children have the highest poverty rate of 47.5%, comprising of 19 families. On the other hand, families with 1 or 2 children have the lowest poverty rate of 0.0%, which includes 0 families.
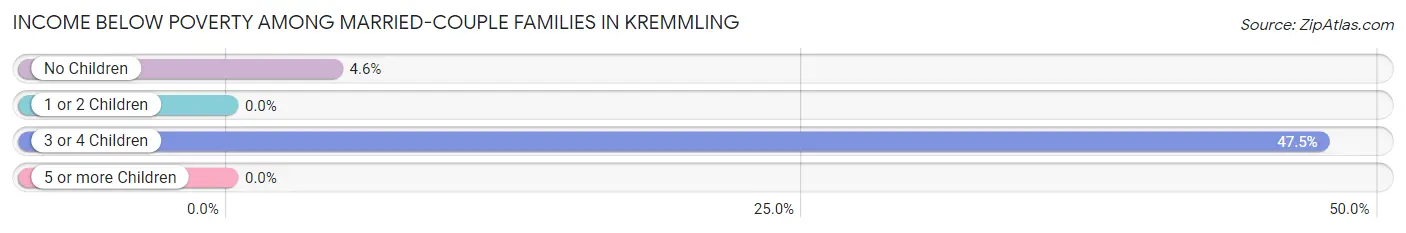
| Children | Above Poverty | Below Poverty |
| No Children | 189 (95.5%) | 9 (4.5%) |
| 1 or 2 Children | 41 (100.0%) | 0 (0.0%) |
| 3 or 4 Children | 21 (52.5%) | 19 (47.5%) |
| 5 or more Children | 5 (100.0%) | 0 (0.0%) |
| Total | 256 (90.1%) | 28 (9.9%) |
Income Below Poverty Among Single-Parent Households in Kremmling
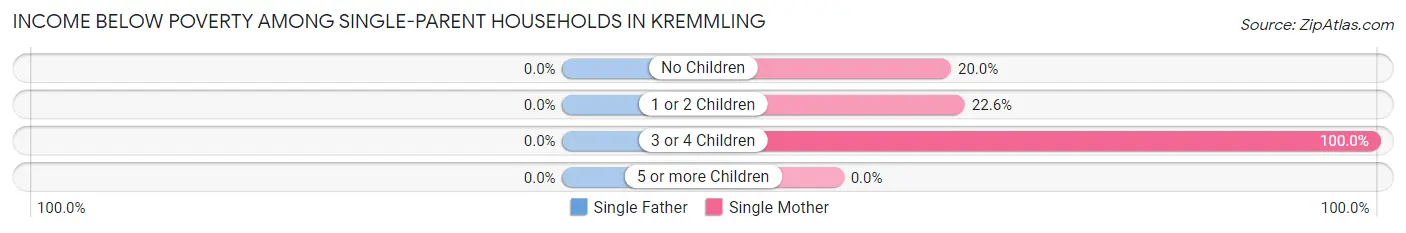
| Children | Single Father | Single Mother |
| No Children | 0 (0.0%) | 7 (20.0%) |
| 1 or 2 Children | 0 (0.0%) | 7 (22.6%) |
| 3 or 4 Children | 0 (0.0%) | 9 (100.0%) |
| 5 or more Children | 0 (0.0%) | 0 (0.0%) |
| Total | 0 (0.0%) | 23 (30.7%) |
Income Below Poverty Among Married-Couple vs Single-Parent Households in Kremmling
The poverty data for Kremmling shows that 28 of the married-couple family households (9.9%) and 23 of the single-parent households (28.1%) are living below the poverty level. Within the married-couple family households, those with 3 or 4 children have the highest poverty rate, with 19 households (47.5%) falling below the poverty line. Among the single-parent households, those with 3 or 4 children have the highest poverty rate, with 9 household (100.0%) living below poverty.
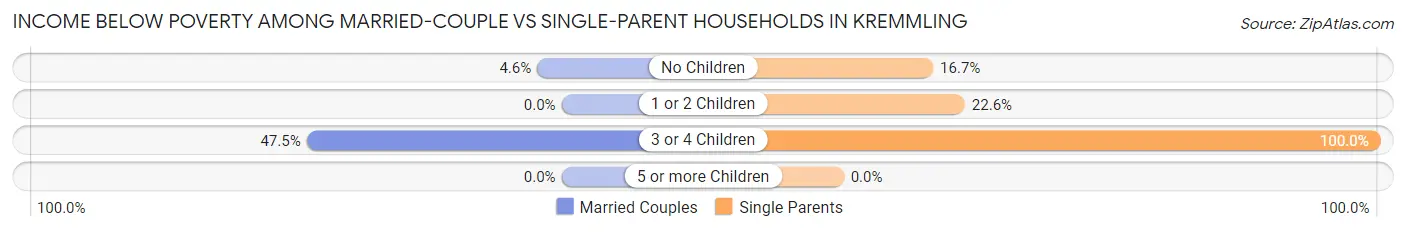
| Children | Married-Couple Families | Single-Parent Households |
| No Children | 9 (4.5%) | 7 (16.7%) |
| 1 or 2 Children | 0 (0.0%) | 7 (22.6%) |
| 3 or 4 Children | 19 (47.5%) | 9 (100.0%) |
| 5 or more Children | 0 (0.0%) | 0 (0.0%) |
| Total | 28 (9.9%) | 23 (28.1%) |
Race in Kremmling
The most populous races in Kremmling are White / Caucasian (1,386 | 77.9%), Hispanic or Latino (518 | 29.1%), and Two or more Races (393 | 22.1%).
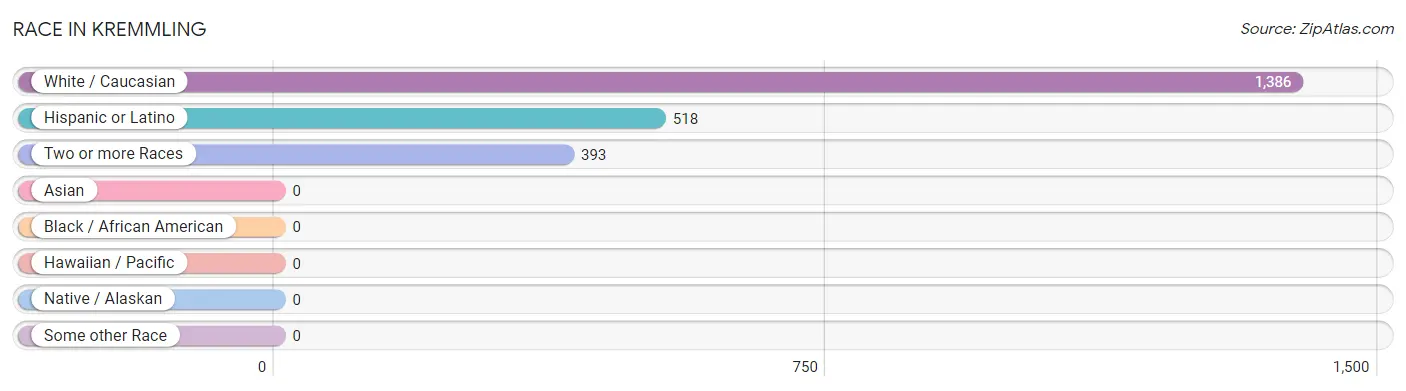
| Race | # Population | % Population |
| Asian | 0 | 0.0% |
| Black / African American | 0 | 0.0% |
| Hawaiian / Pacific | 0 | 0.0% |
| Hispanic or Latino | 518 | 29.1% |
| Native / Alaskan | 0 | 0.0% |
| White / Caucasian | 1,386 | 77.9% |
| Two or more Races | 393 | 22.1% |
| Some other Race | 0 | 0.0% |
| Total | 1,779 | 100.0% |
Ancestry in Kremmling
The most populous ancestries reported in Kremmling are Mexican (505 | 28.4%), German (272 | 15.3%), English (201 | 11.3%), Irish (78 | 4.4%), and British (55 | 3.1%), together accounting for 62.4% of all Kremmling residents.
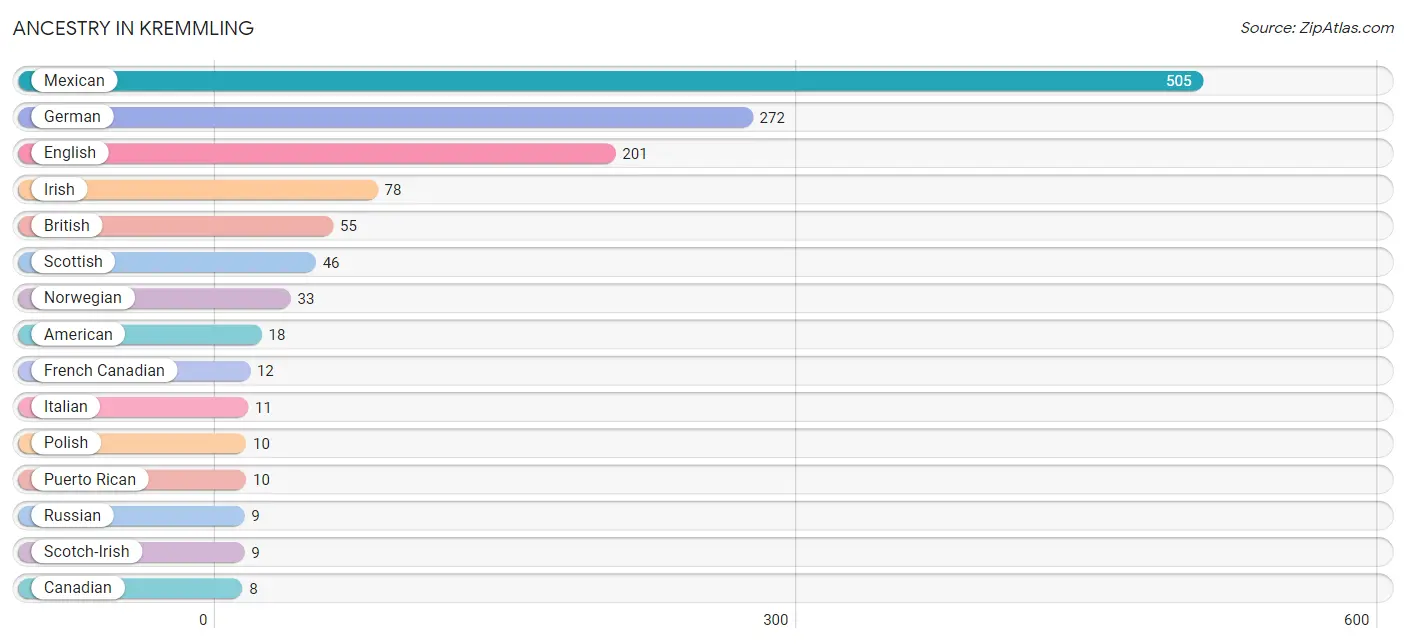
| Ancestry | # Population | % Population |
| American | 18 | 1.0% |
| British | 55 | 3.1% |
| Canadian | 8 | 0.4% |
| English | 201 | 11.3% |
| French | 6 | 0.3% |
| French Canadian | 12 | 0.7% |
| German | 272 | 15.3% |
| Hungarian | 7 | 0.4% |
| Irish | 78 | 4.4% |
| Italian | 11 | 0.6% |
| Mexican | 505 | 28.4% |
| Norwegian | 33 | 1.8% |
| Peruvian | 3 | 0.2% |
| Polish | 10 | 0.6% |
| Puerto Rican | 10 | 0.6% |
| Russian | 9 | 0.5% |
| Scotch-Irish | 9 | 0.5% |
| Scottish | 46 | 2.6% |
| South American | 3 | 0.2% | View All 19 Rows |
Immigrants in Kremmling
The most numerous immigrant groups reported in Kremmling came from Latin America (50 | 2.8%), Central America (47 | 2.6%), Mexico (47 | 2.6%), Eastern Europe (10 | 0.6%), and Europe (10 | 0.6%), together accounting for 9.2% of all Kremmling residents.
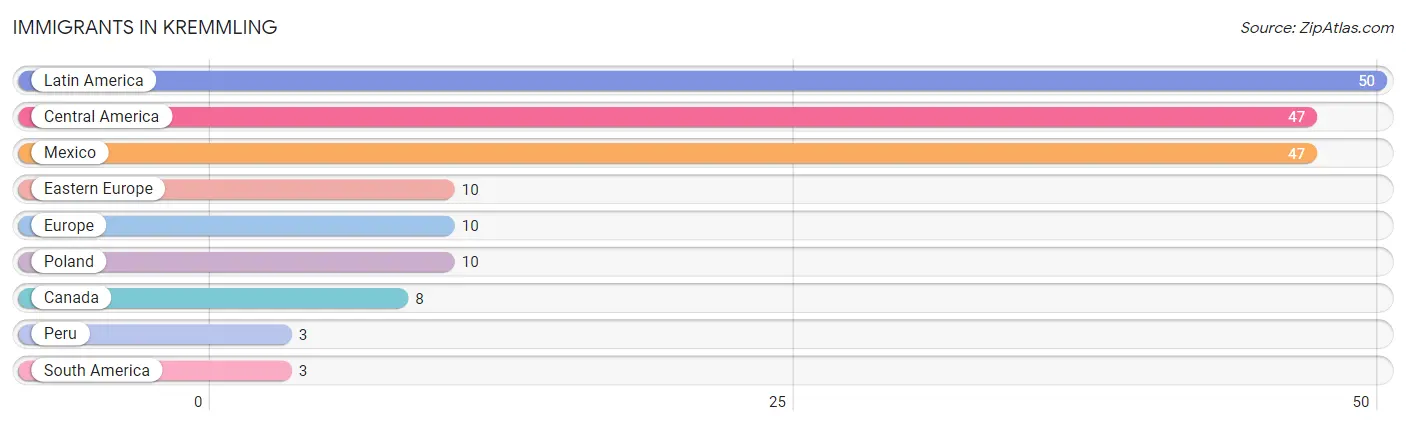
| Immigration Origin | # Population | % Population |
| Canada | 8 | 0.4% |
| Central America | 47 | 2.6% |
| Eastern Europe | 10 | 0.6% |
| Europe | 10 | 0.6% |
| Latin America | 50 | 2.8% |
| Mexico | 47 | 2.6% |
| Peru | 3 | 0.2% |
| Poland | 10 | 0.6% |
| South America | 3 | 0.2% | View All 9 Rows |
Sex and Age in Kremmling
Sex and Age in Kremmling
The most populous age groups in Kremmling are 15 to 19 Years (197 | 19.8%) for men and 10 to 14 Years (120 | 15.3%) for women.
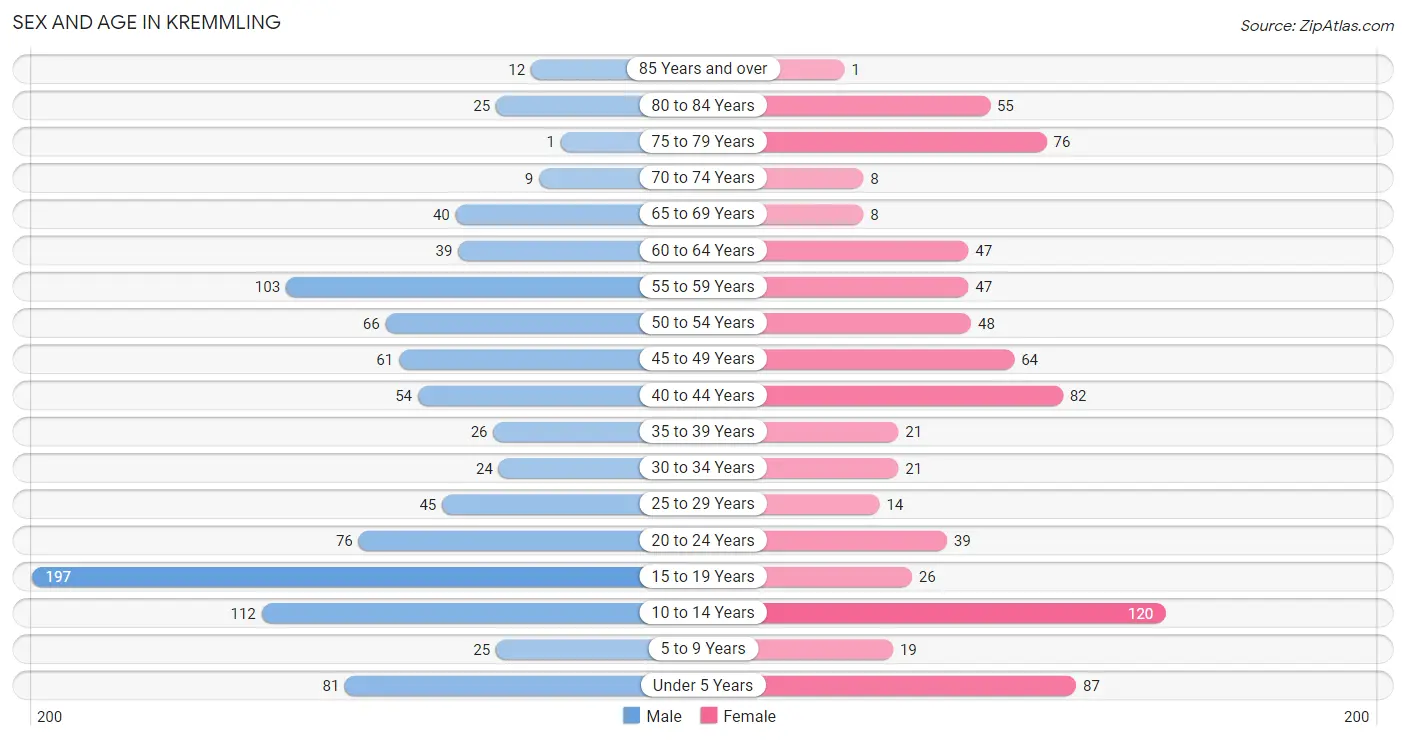
| Age Bracket | Male | Female |
| Under 5 Years | 81 (8.1%) | 87 (11.1%) |
| 5 to 9 Years | 25 (2.5%) | 19 (2.4%) |
| 10 to 14 Years | 112 (11.2%) | 120 (15.3%) |
| 15 to 19 Years | 197 (19.8%) | 26 (3.3%) |
| 20 to 24 Years | 76 (7.6%) | 39 (5.0%) |
| 25 to 29 Years | 45 (4.5%) | 14 (1.8%) |
| 30 to 34 Years | 24 (2.4%) | 21 (2.7%) |
| 35 to 39 Years | 26 (2.6%) | 21 (2.7%) |
| 40 to 44 Years | 54 (5.4%) | 82 (10.5%) |
| 45 to 49 Years | 61 (6.1%) | 64 (8.2%) |
| 50 to 54 Years | 66 (6.6%) | 48 (6.1%) |
| 55 to 59 Years | 103 (10.3%) | 47 (6.0%) |
| 60 to 64 Years | 39 (3.9%) | 47 (6.0%) |
| 65 to 69 Years | 40 (4.0%) | 8 (1.0%) |
| 70 to 74 Years | 9 (0.9%) | 8 (1.0%) |
| 75 to 79 Years | 1 (0.1%) | 76 (9.7%) |
| 80 to 84 Years | 25 (2.5%) | 55 (7.0%) |
| 85 Years and over | 12 (1.2%) | 1 (0.1%) |
| Total | 996 (100.0%) | 783 (100.0%) |
Families and Households in Kremmling
Median Family Size in Kremmling
The median family size in Kremmling is 4.08 persons per family, with single male/father families (7 | 1.9%) accounting for the largest median family size of 4.43 persons per family. On the other hand, single female/mother families (75 | 20.5%) represent the smallest median family size with 3.57 persons per family.
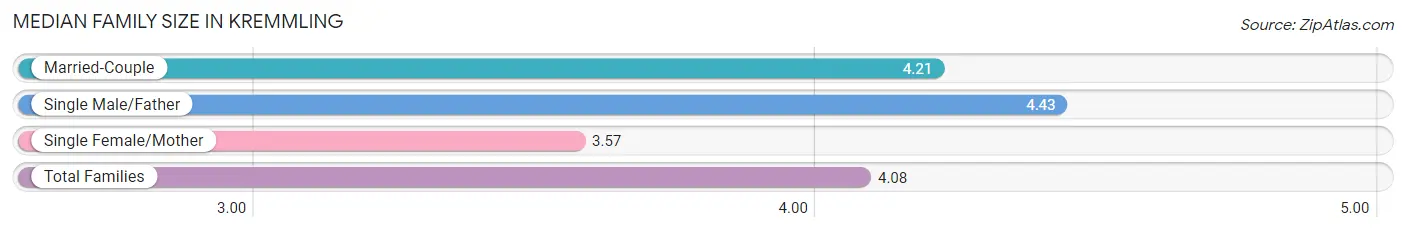
| Family Type | # Families | Family Size |
| Married-Couple | 284 (77.6%) | 4.21 |
| Single Male/Father | 7 (1.9%) | 4.43 |
| Single Female/Mother | 75 (20.5%) | 3.57 |
| Total Families | 366 (100.0%) | 4.08 |
Median Household Size in Kremmling
The median household size in Kremmling is 2.91 persons per household, with single male/father households (7 | 1.1%) accounting for the largest median household size of 4.43 persons per household. non-family households (244 | 40.0%) represent the smallest median household size with 1.12 persons per household.
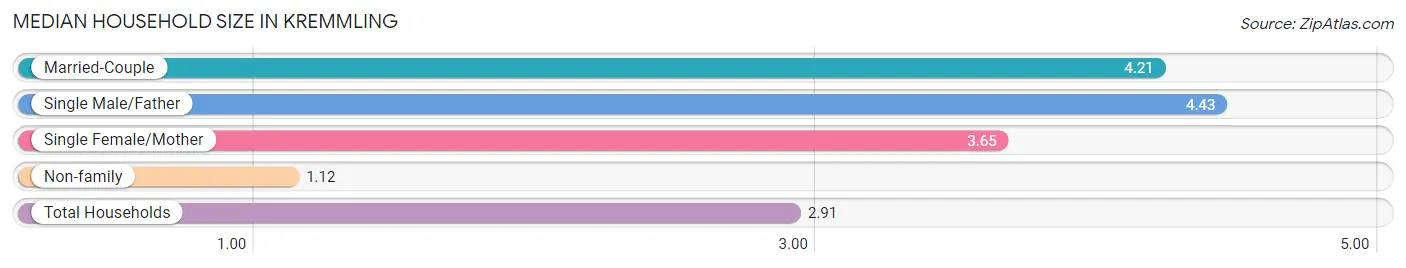
| Household Type | # Households | Household Size |
| Married-Couple | 284 (46.6%) | 4.21 |
| Single Male/Father | 7 (1.1%) | 4.43 |
| Single Female/Mother | 75 (12.3%) | 3.65 |
| Non-family | 244 (40.0%) | 1.12 |
| Total Households | 610 (100.0%) | 2.91 |
Household Size by Marriage Status in Kremmling
Out of a total of 610 households in Kremmling, 366 (60.0%) are family households, while 244 (40.0%) are nonfamily households. The most numerous type of family households are 2-person households, comprising 201, and the most common type of nonfamily households are 1-person households, comprising 227.
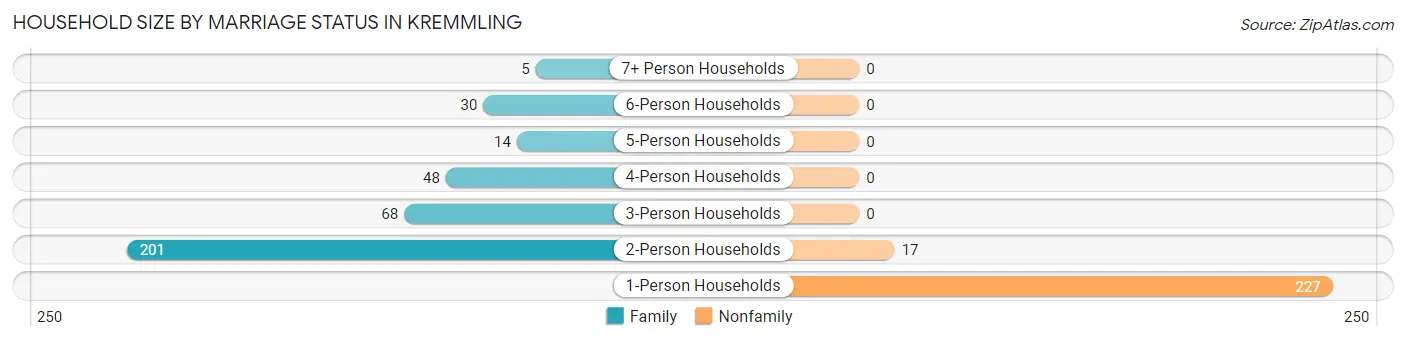
| Household Size | Family Households | Nonfamily Households |
| 1-Person Households | - | 227 (37.2%) |
| 2-Person Households | 201 (33.0%) | 17 (2.8%) |
| 3-Person Households | 68 (11.2%) | 0 (0.0%) |
| 4-Person Households | 48 (7.9%) | 0 (0.0%) |
| 5-Person Households | 14 (2.3%) | 0 (0.0%) |
| 6-Person Households | 30 (4.9%) | 0 (0.0%) |
| 7+ Person Households | 5 (0.8%) | 0 (0.0%) |
| Total | 366 (60.0%) | 244 (40.0%) |
Female Fertility in Kremmling
Fertility by Age in Kremmling
Average fertility rate in Kremmling is 11.0 births per 1,000 women. Women in the age bracket of 20 to 34 years have the highest fertility rate with 41.0 births per 1,000 women. Women in the age bracket of 20 to 34 years acount for 100.0% of all women with births.
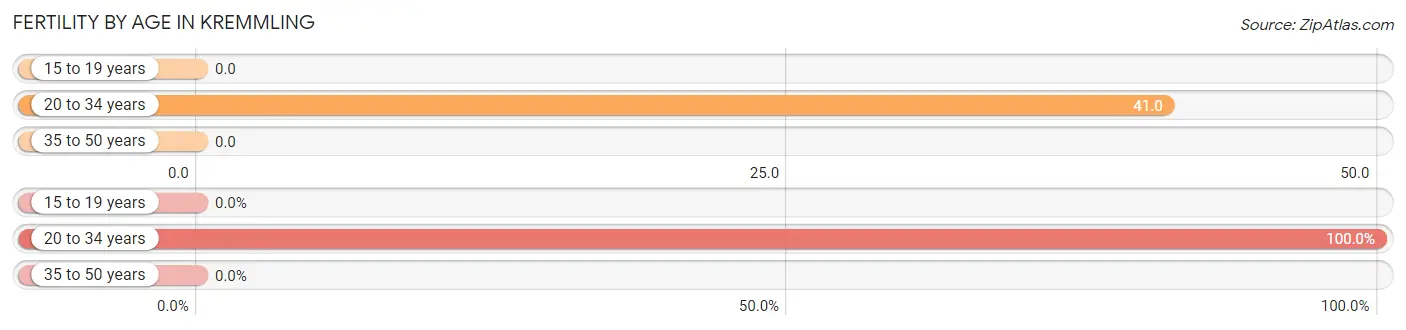
| Age Bracket | Women with Births | Births / 1,000 Women |
| 15 to 19 years | 0 (0.0%) | 0.0 |
| 20 to 34 years | 3 (100.0%) | 41.0 |
| 35 to 50 years | 0 (0.0%) | 0.0 |
| Total | 3 (100.0%) | 11.0 |
Fertility by Age by Marriage Status in Kremmling
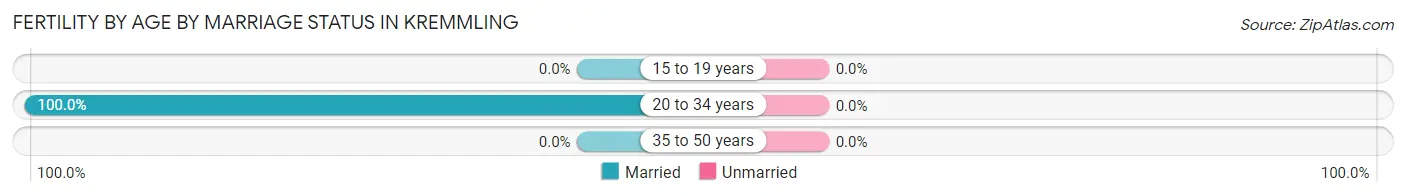
| Age Bracket | Married | Unmarried |
| 15 to 19 years | 0 (0.0%) | 0 (0.0%) |
| 20 to 34 years | 3 (100.0%) | 0 (0.0%) |
| 35 to 50 years | 0 (0.0%) | 0 (0.0%) |
| Total | 3 (100.0%) | 0 (0.0%) |
Fertility by Education in Kremmling
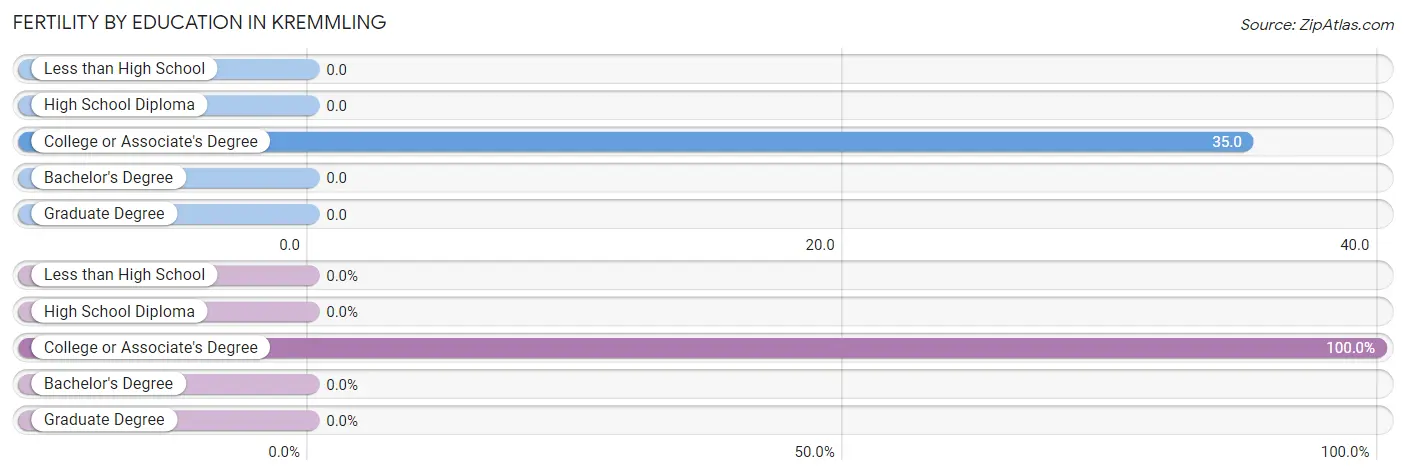
| Educational Attainment | Women with Births | Births / 1,000 Women |
| Less than High School | 0 (0.0%) | 0.0 |
| High School Diploma | 0 (0.0%) | 0.0 |
| College or Associate's Degree | 3 (100.0%) | 35.0 |
| Bachelor's Degree | 0 (0.0%) | 0.0 |
| Graduate Degree | 0 (0.0%) | 0.0 |
| Total | 3 (100.0%) | 11.0 |
Fertility by Education by Marriage Status in Kremmling
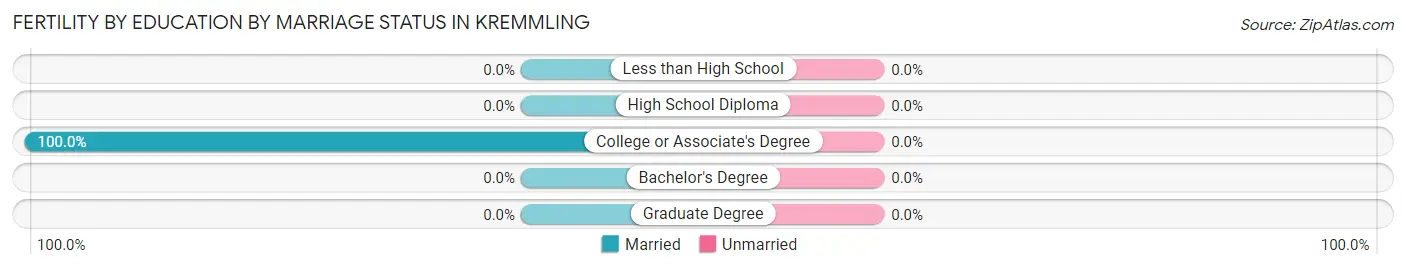
| Educational Attainment | Married | Unmarried |
| Less than High School | 0 (0.0%) | 0 (0.0%) |
| High School Diploma | 0 (0.0%) | 0 (0.0%) |
| College or Associate's Degree | 3 (100.0%) | 0 (0.0%) |
| Bachelor's Degree | 0 (0.0%) | 0 (0.0%) |
| Graduate Degree | 0 (0.0%) | 0 (0.0%) |
| Total | 3 (100.0%) | 0 (0.0%) |
Employment Characteristics in Kremmling
Employment by Class of Employer in Kremmling
Among the 762 employed individuals in Kremmling, private company employees (559 | 73.4%), local government employees (76 | 10.0%), and self-employed (not incorporated) (54 | 7.1%) make up the most common classes of employment.
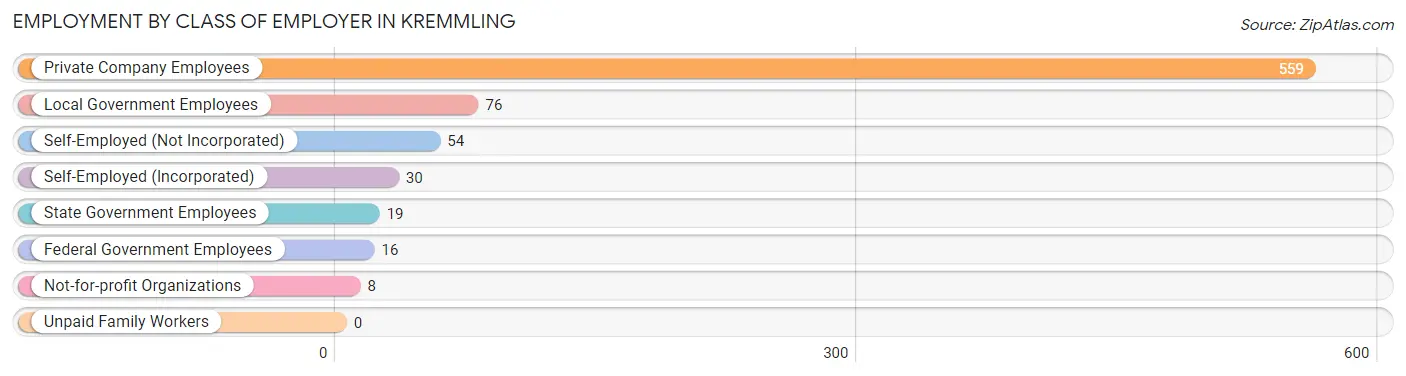
| Employer Class | # Employees | % Employees |
| Private Company Employees | 559 | 73.4% |
| Self-Employed (Incorporated) | 30 | 3.9% |
| Self-Employed (Not Incorporated) | 54 | 7.1% |
| Not-for-profit Organizations | 8 | 1.1% |
| Local Government Employees | 76 | 10.0% |
| State Government Employees | 19 | 2.5% |
| Federal Government Employees | 16 | 2.1% |
| Unpaid Family Workers | 0 | 0.0% |
| Total | 762 | 100.0% |
Employment Status by Age in Kremmling
According to the labor force statistics for Kremmling, out of the total population over 16 years of age (1,255), 62.8% or 788 individuals are in the labor force, with 2.4% or 19 of them unemployed. The age group with the highest labor force participation rate is 20 to 24 years, with 97.4% or 112 individuals in the labor force. Within the labor force, the 20 to 24 years age range has the highest percentage of unemployed individuals, with 17.0% or 19 of them being unemployed.
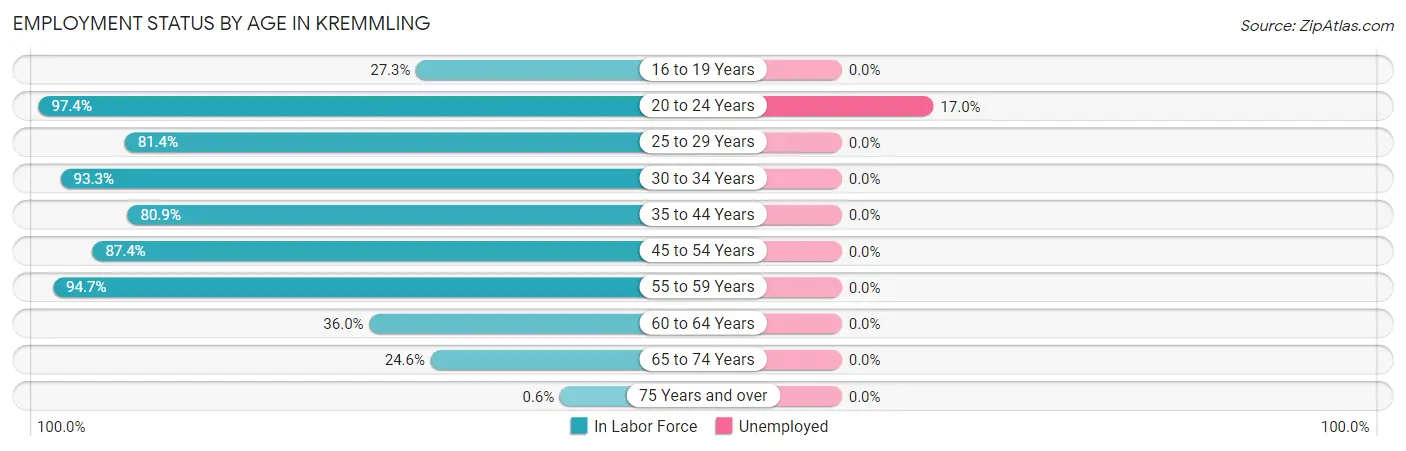
| Age Bracket | In Labor Force | Unemployed |
| 16 to 19 Years | 39 (27.3%) | 0 (0.0%) |
| 20 to 24 Years | 112 (97.4%) | 19 (17.0%) |
| 25 to 29 Years | 48 (81.4%) | 0 (0.0%) |
| 30 to 34 Years | 42 (93.3%) | 0 (0.0%) |
| 35 to 44 Years | 148 (80.9%) | 0 (0.0%) |
| 45 to 54 Years | 209 (87.4%) | 0 (0.0%) |
| 55 to 59 Years | 142 (94.7%) | 0 (0.0%) |
| 60 to 64 Years | 31 (36.0%) | 0 (0.0%) |
| 65 to 74 Years | 16 (24.6%) | 0 (0.0%) |
| 75 Years and over | 1 (0.6%) | 0 (0.0%) |
| Total | 788 (62.8%) | 19 (2.4%) |
Employment Status by Educational Attainment in Kremmling
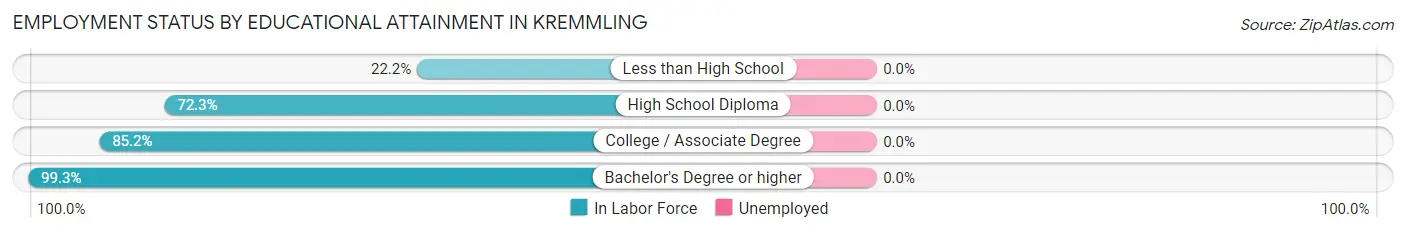
| Educational Attainment | In Labor Force | Unemployed |
| Less than High School | 2 (22.2%) | 0 (0.0%) |
| High School Diploma | 250 (72.3%) | 0 (0.0%) |
| College / Associate Degree | 218 (85.2%) | 0 (0.0%) |
| Bachelor's Degree or higher | 150 (99.3%) | 0 (0.0%) |
| Total | 620 (81.4%) | 0 (0.0%) |
Employment Occupations by Sex in Kremmling
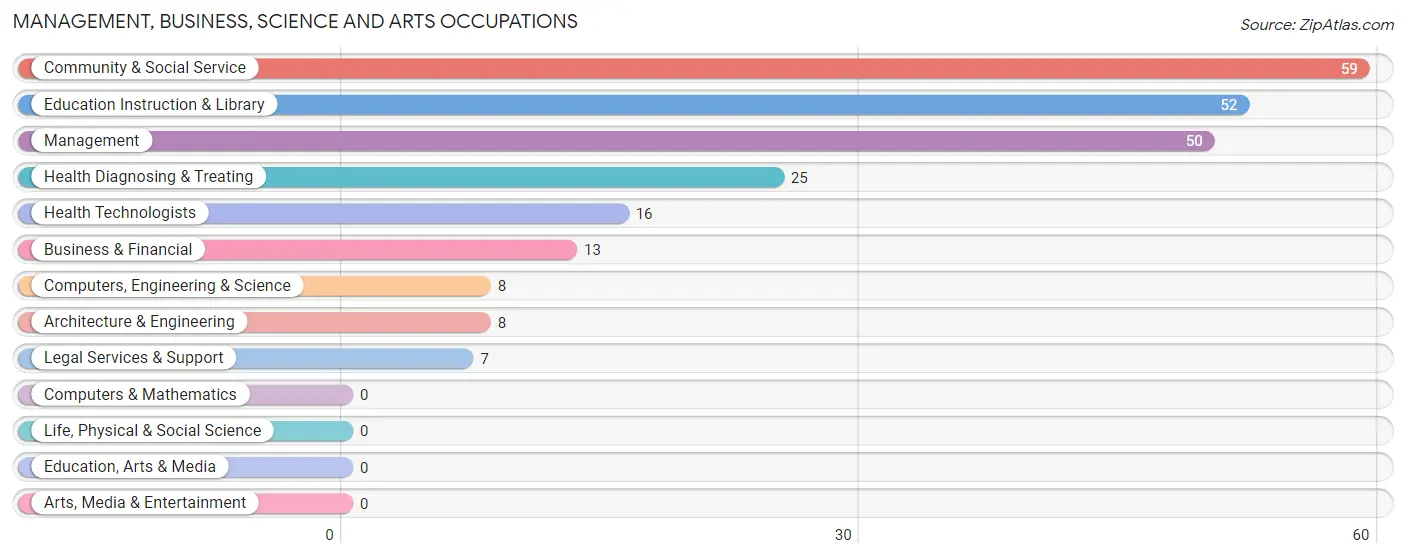
Management, Business, Science and Arts Occupations
The most common Management, Business, Science and Arts occupations in Kremmling are Community & Social Service (59 | 7.7%), Education Instruction & Library (52 | 6.8%), Management (50 | 6.5%), Health Diagnosing & Treating (25 | 3.3%), and Health Technologists (16 | 2.1%).
Management, Business, Science and Arts Occupations by Sex
Within the Management, Business, Science and Arts occupations in Kremmling, the most male-oriented occupations are Computers, Engineering & Science (100.0%), Architecture & Engineering (100.0%), and Legal Services & Support (100.0%), while the most female-oriented occupations are Business & Financial (100.0%), Education Instruction & Library (100.0%), and Community & Social Service (88.1%).
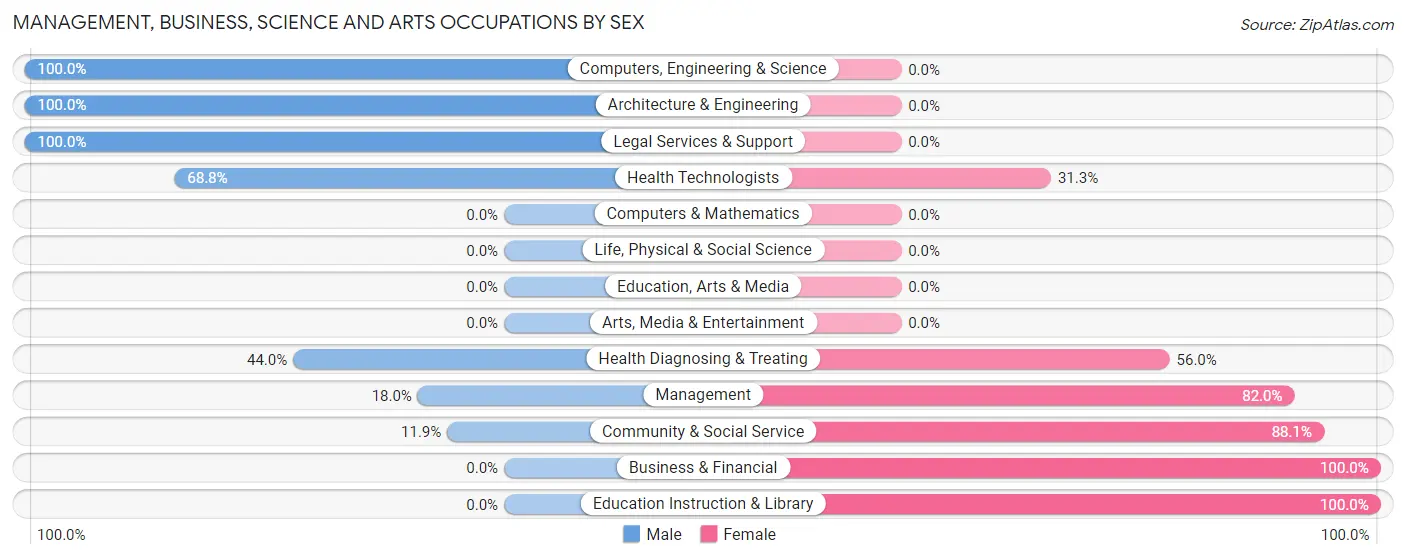
| Occupation | Male | Female |
| Management | 9 (18.0%) | 41 (82.0%) |
| Business & Financial | 0 (0.0%) | 13 (100.0%) |
| Computers, Engineering & Science | 8 (100.0%) | 0 (0.0%) |
| Computers & Mathematics | 0 (0.0%) | 0 (0.0%) |
| Architecture & Engineering | 8 (100.0%) | 0 (0.0%) |
| Life, Physical & Social Science | 0 (0.0%) | 0 (0.0%) |
| Community & Social Service | 7 (11.9%) | 52 (88.1%) |
| Education, Arts & Media | 0 (0.0%) | 0 (0.0%) |
| Legal Services & Support | 7 (100.0%) | 0 (0.0%) |
| Education Instruction & Library | 0 (0.0%) | 52 (100.0%) |
| Arts, Media & Entertainment | 0 (0.0%) | 0 (0.0%) |
| Health Diagnosing & Treating | 11 (44.0%) | 14 (56.0%) |
| Health Technologists | 11 (68.8%) | 5 (31.2%) |
| Total (Category) | 35 (22.6%) | 120 (77.4%) |
| Total (Overall) | 506 (65.8%) | 263 (34.2%) |
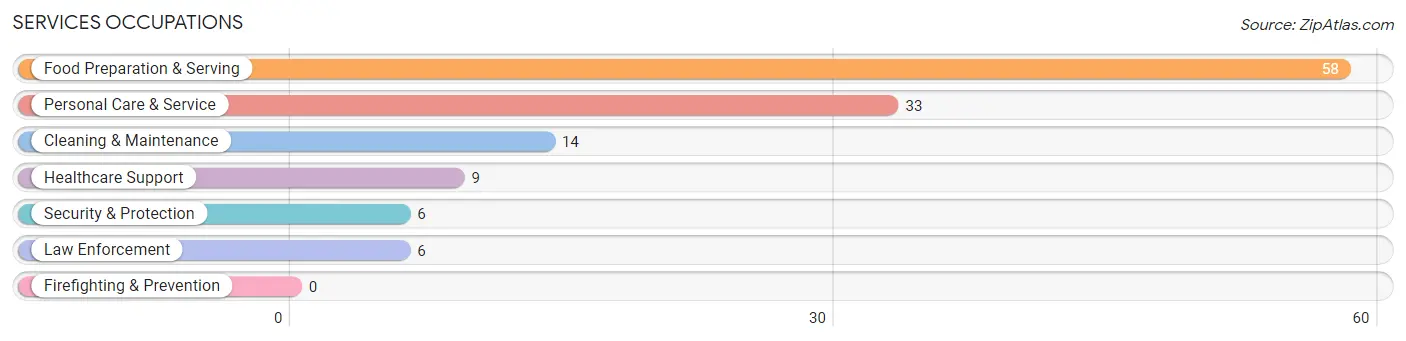
Services Occupations
The most common Services occupations in Kremmling are Food Preparation & Serving (58 | 7.5%), Personal Care & Service (33 | 4.3%), Cleaning & Maintenance (14 | 1.8%), Healthcare Support (9 | 1.2%), and Security & Protection (6 | 0.8%).
Services Occupations by Sex
Within the Services occupations in Kremmling, the most male-oriented occupations are Security & Protection (100.0%), Law Enforcement (100.0%), and Cleaning & Maintenance (100.0%), while the most female-oriented occupations are Healthcare Support (100.0%), Food Preparation & Serving (62.1%), and Personal Care & Service (54.5%).
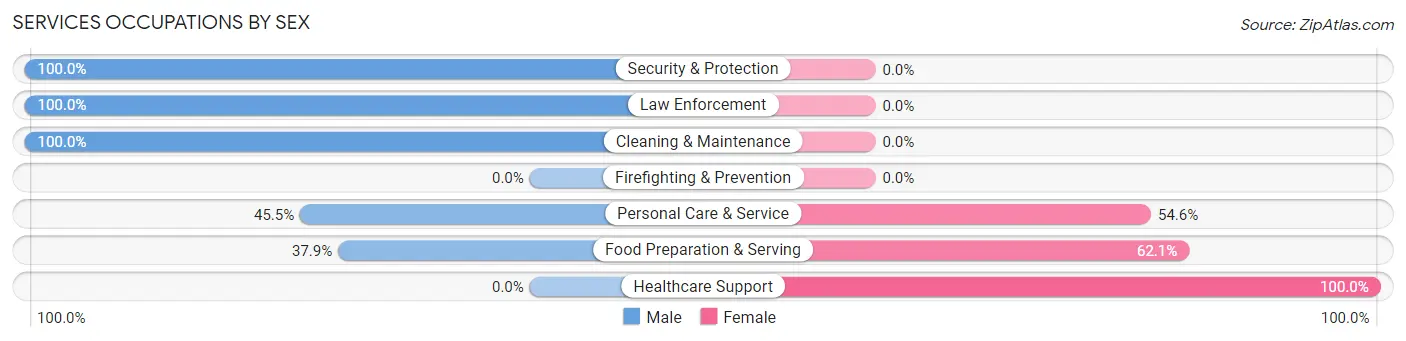
| Occupation | Male | Female |
| Healthcare Support | 0 (0.0%) | 9 (100.0%) |
| Security & Protection | 6 (100.0%) | 0 (0.0%) |
| Firefighting & Prevention | 0 (0.0%) | 0 (0.0%) |
| Law Enforcement | 6 (100.0%) | 0 (0.0%) |
| Food Preparation & Serving | 22 (37.9%) | 36 (62.1%) |
| Cleaning & Maintenance | 14 (100.0%) | 0 (0.0%) |
| Personal Care & Service | 15 (45.5%) | 18 (54.5%) |
| Total (Category) | 57 (47.5%) | 63 (52.5%) |
| Total (Overall) | 506 (65.8%) | 263 (34.2%) |
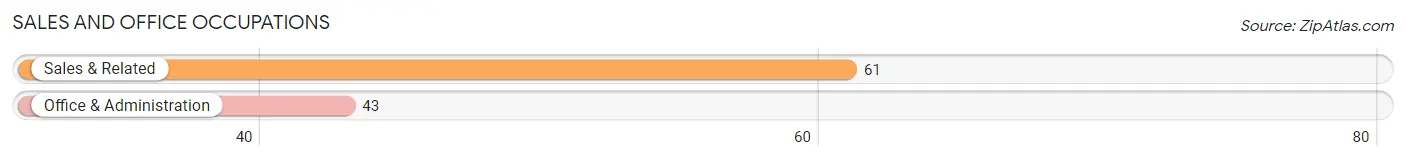
Sales and Office Occupations
The most common Sales and Office occupations in Kremmling are Sales & Related (61 | 7.9%), and Office & Administration (43 | 5.6%).
Sales and Office Occupations by Sex
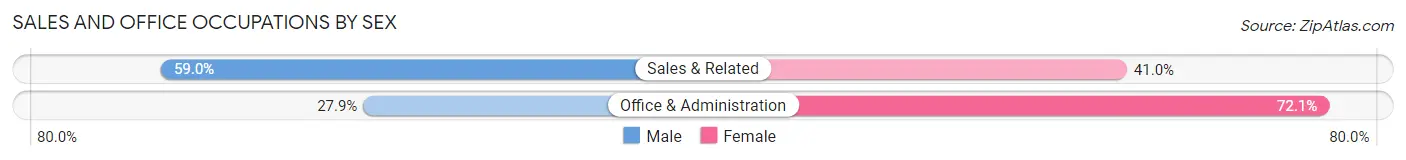
| Occupation | Male | Female |
| Sales & Related | 36 (59.0%) | 25 (41.0%) |
| Office & Administration | 12 (27.9%) | 31 (72.1%) |
| Total (Category) | 48 (46.2%) | 56 (53.8%) |
| Total (Overall) | 506 (65.8%) | 263 (34.2%) |
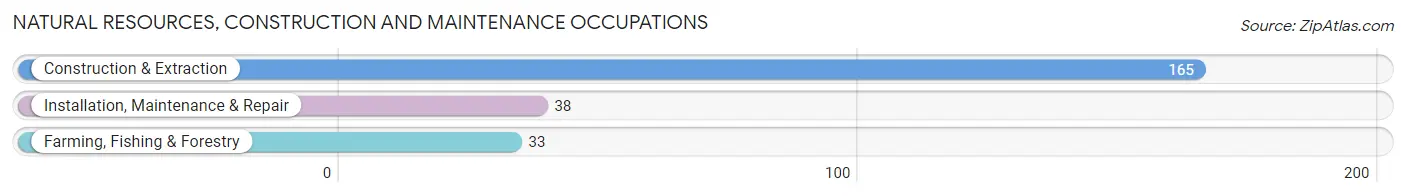
Natural Resources, Construction and Maintenance Occupations
The most common Natural Resources, Construction and Maintenance occupations in Kremmling are Construction & Extraction (165 | 21.5%), Installation, Maintenance & Repair (38 | 4.9%), and Farming, Fishing & Forestry (33 | 4.3%).
Natural Resources, Construction and Maintenance Occupations by Sex
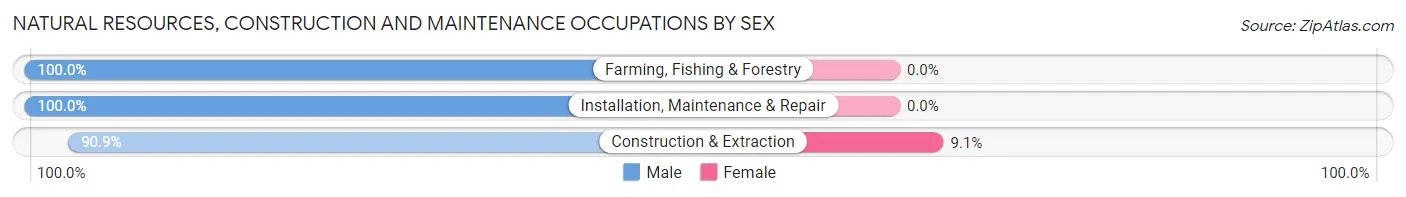
| Occupation | Male | Female |
| Farming, Fishing & Forestry | 33 (100.0%) | 0 (0.0%) |
| Construction & Extraction | 150 (90.9%) | 15 (9.1%) |
| Installation, Maintenance & Repair | 38 (100.0%) | 0 (0.0%) |
| Total (Category) | 221 (93.6%) | 15 (6.4%) |
| Total (Overall) | 506 (65.8%) | 263 (34.2%) |
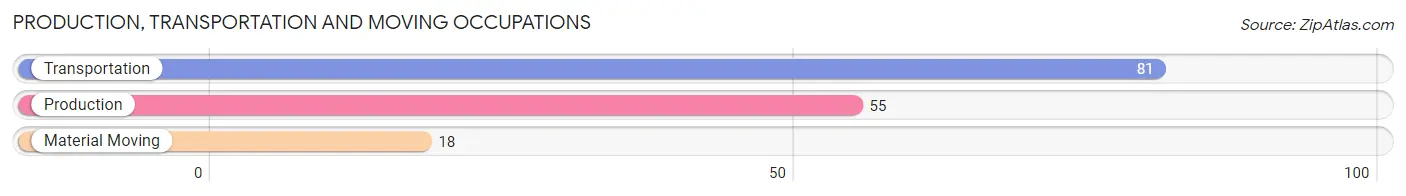
Production, Transportation and Moving Occupations
The most common Production, Transportation and Moving occupations in Kremmling are Transportation (81 | 10.5%), Production (55 | 7.1%), and Material Moving (18 | 2.3%).
Production, Transportation and Moving Occupations by Sex
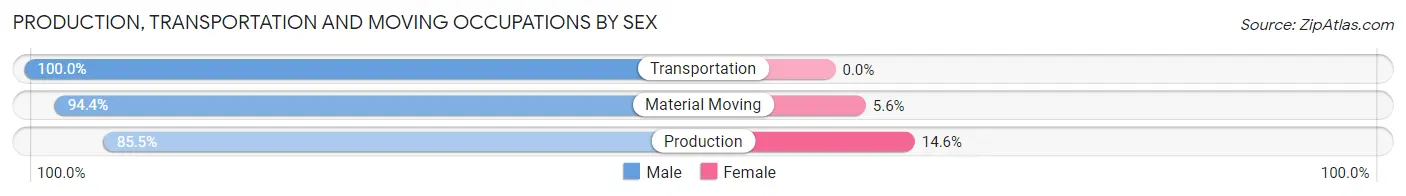
| Occupation | Male | Female |
| Production | 47 (85.5%) | 8 (14.5%) |
| Transportation | 81 (100.0%) | 0 (0.0%) |
| Material Moving | 17 (94.4%) | 1 (5.6%) |
| Total (Category) | 145 (94.2%) | 9 (5.8%) |
| Total (Overall) | 506 (65.8%) | 263 (34.2%) |
Employment Industries by Sex in Kremmling
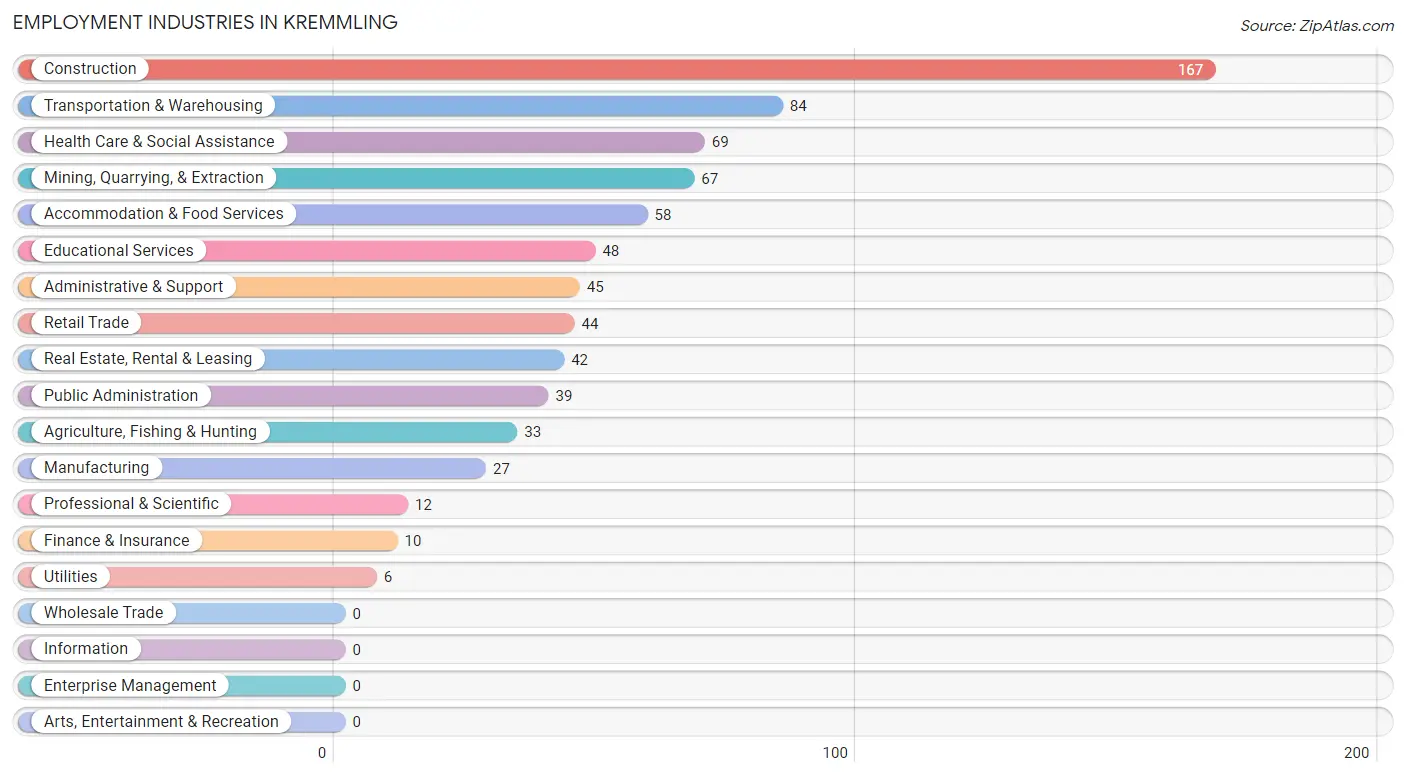
Employment Industries in Kremmling
The major employment industries in Kremmling include Construction (167 | 21.7%), Transportation & Warehousing (84 | 10.9%), Health Care & Social Assistance (69 | 9.0%), Mining, Quarrying, & Extraction (67 | 8.7%), and Accommodation & Food Services (58 | 7.5%).
Employment Industries by Sex in Kremmling
The Kremmling industries that see more men than women are Agriculture, Fishing & Hunting (100.0%), Mining, Quarrying, & Extraction (100.0%), and Manufacturing (100.0%), whereas the industries that tend to have a higher number of women are Finance & Insurance (100.0%), Educational Services (100.0%), and Health Care & Social Assistance (84.1%).
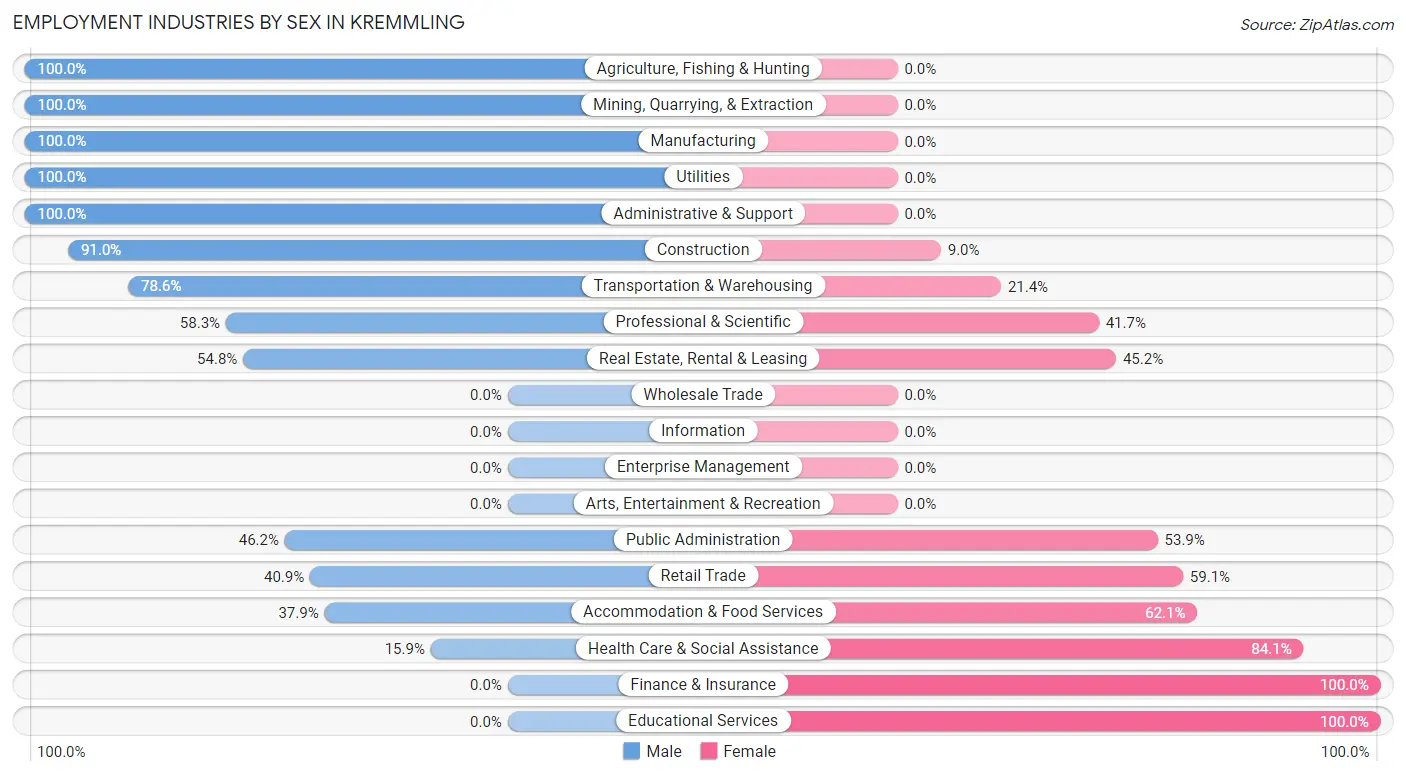
| Industry | Male | Female |
| Agriculture, Fishing & Hunting | 33 (100.0%) | 0 (0.0%) |
| Mining, Quarrying, & Extraction | 67 (100.0%) | 0 (0.0%) |
| Construction | 152 (91.0%) | 15 (9.0%) |
| Manufacturing | 27 (100.0%) | 0 (0.0%) |
| Wholesale Trade | 0 (0.0%) | 0 (0.0%) |
| Retail Trade | 18 (40.9%) | 26 (59.1%) |
| Transportation & Warehousing | 66 (78.6%) | 18 (21.4%) |
| Utilities | 6 (100.0%) | 0 (0.0%) |
| Information | 0 (0.0%) | 0 (0.0%) |
| Finance & Insurance | 0 (0.0%) | 10 (100.0%) |
| Real Estate, Rental & Leasing | 23 (54.8%) | 19 (45.2%) |
| Professional & Scientific | 7 (58.3%) | 5 (41.7%) |
| Enterprise Management | 0 (0.0%) | 0 (0.0%) |
| Administrative & Support | 45 (100.0%) | 0 (0.0%) |
| Educational Services | 0 (0.0%) | 48 (100.0%) |
| Health Care & Social Assistance | 11 (15.9%) | 58 (84.1%) |
| Arts, Entertainment & Recreation | 0 (0.0%) | 0 (0.0%) |
| Accommodation & Food Services | 22 (37.9%) | 36 (62.1%) |
| Public Administration | 18 (46.2%) | 21 (53.8%) |
| Total | 506 (65.8%) | 263 (34.2%) |
Education in Kremmling
School Enrollment in Kremmling
The most common levels of schooling among the 457 students in Kremmling are high school (252 | 55.1%), middle school (125 | 27.4%), and college / undergraduate (34 | 7.4%).
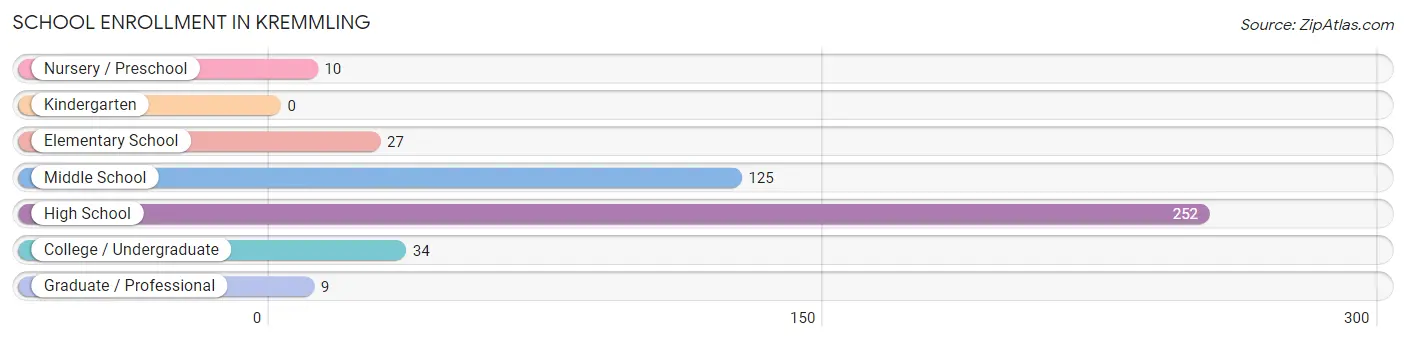
| School Level | # Students | % Students |
| Nursery / Preschool | 10 | 2.2% |
| Kindergarten | 0 | 0.0% |
| Elementary School | 27 | 5.9% |
| Middle School | 125 | 27.4% |
| High School | 252 | 55.1% |
| College / Undergraduate | 34 | 7.4% |
| Graduate / Professional | 9 | 2.0% |
| Total | 457 | 100.0% |
School Enrollment by Age by Funding Source in Kremmling
Out of a total of 457 students who are enrolled in schools in Kremmling, 39 (8.5%) attend a private institution, while the remaining 418 (91.5%) are enrolled in public schools. The age group of 3 to 4 year olds has the highest likelihood of being enrolled in private schools, with 5 (50.0% in the age bracket) enrolled. Conversely, the age group of 5 to 9 year old has the lowest likelihood of being enrolled in a private school, with 19 (100.0% in the age bracket) attending a public institution.
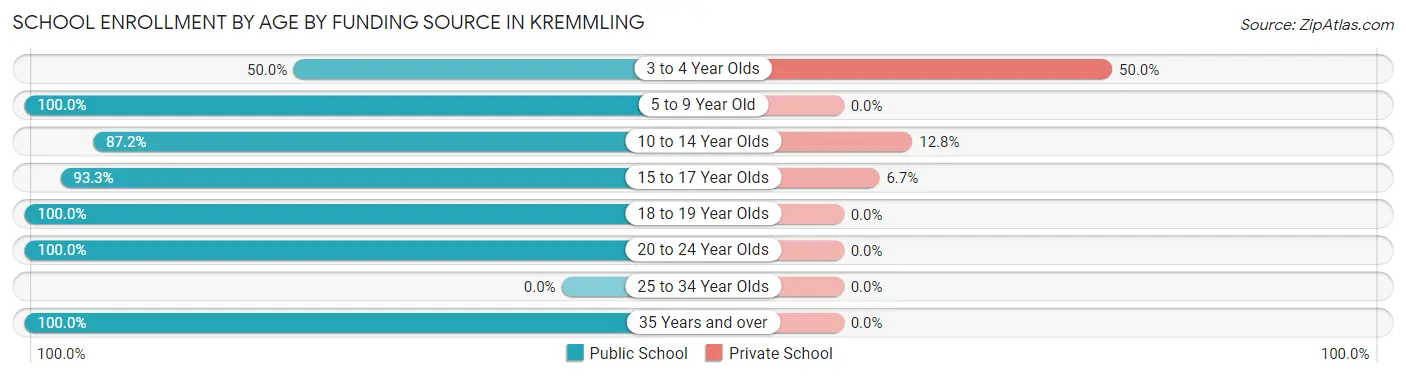
| Age Bracket | Public School | Private School |
| 3 to 4 Year Olds | 5 (50.0%) | 5 (50.0%) |
| 5 to 9 Year Old | 19 (100.0%) | 0 (0.0%) |
| 10 to 14 Year Olds | 157 (87.2%) | 23 (12.8%) |
| 15 to 17 Year Olds | 154 (93.3%) | 11 (6.7%) |
| 18 to 19 Year Olds | 49 (100.0%) | 0 (0.0%) |
| 20 to 24 Year Olds | 19 (100.0%) | 0 (0.0%) |
| 25 to 34 Year Olds | 0 (0.0%) | 0 (0.0%) |
| 35 Years and over | 15 (100.0%) | 0 (0.0%) |
| Total | 418 (91.5%) | 39 (8.5%) |
Educational Attainment by Field of Study in Kremmling
Education (88 | 40.4%), social sciences (32 | 14.7%), engineering (26 | 11.9%), arts & humanities (20 | 9.2%), and computers & mathematics (16 | 7.3%) are the most common fields of study among 218 individuals in Kremmling who have obtained a bachelor's degree or higher.
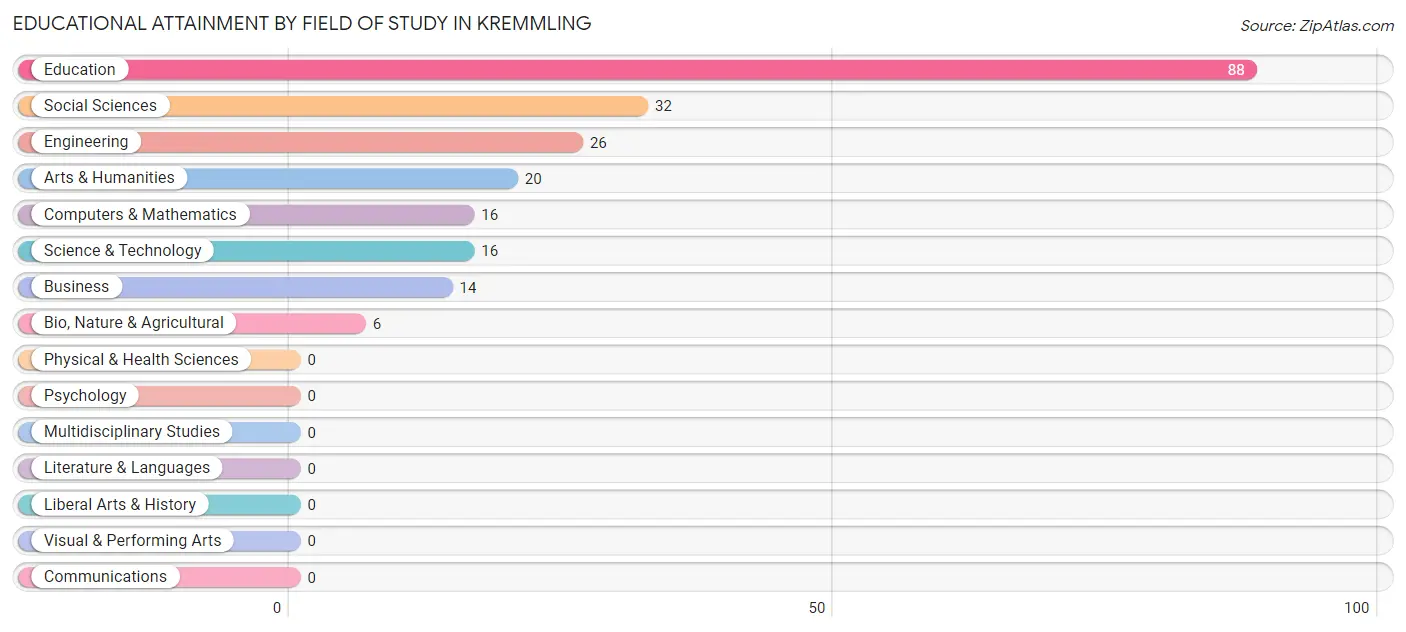
| Field of Study | # Graduates | % Graduates |
| Computers & Mathematics | 16 | 7.3% |
| Bio, Nature & Agricultural | 6 | 2.8% |
| Physical & Health Sciences | 0 | 0.0% |
| Psychology | 0 | 0.0% |
| Social Sciences | 32 | 14.7% |
| Engineering | 26 | 11.9% |
| Multidisciplinary Studies | 0 | 0.0% |
| Science & Technology | 16 | 7.3% |
| Business | 14 | 6.4% |
| Education | 88 | 40.4% |
| Literature & Languages | 0 | 0.0% |
| Liberal Arts & History | 0 | 0.0% |
| Visual & Performing Arts | 0 | 0.0% |
| Communications | 0 | 0.0% |
| Arts & Humanities | 20 | 9.2% |
| Total | 218 | 100.0% |
Transportation & Commute in Kremmling
Vehicle Availability by Sex in Kremmling
The most prevalent vehicle ownership categories in Kremmling are males with 3 vehicles (265, accounting for 53.1%) and females with 3 vehicles (166, making up 100.8%).
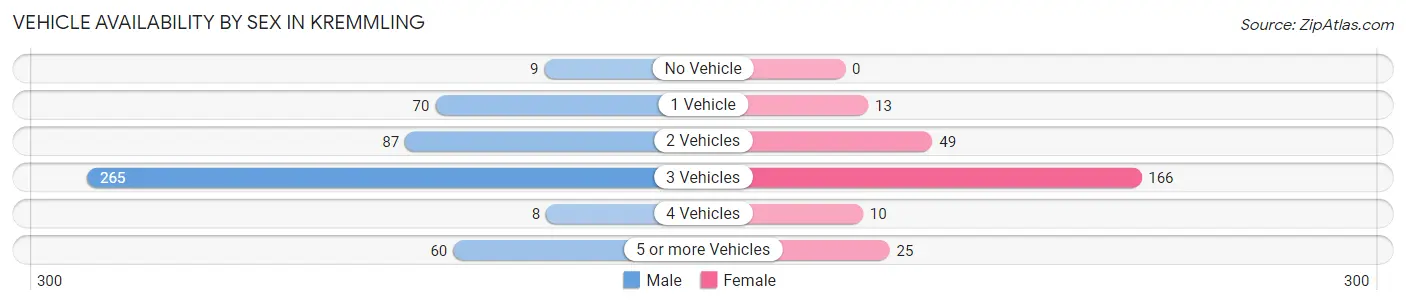
| Vehicles Available | Male | Female |
| No Vehicle | 9 (1.8%) | 0 (0.0%) |
| 1 Vehicle | 70 (14.0%) | 13 (4.9%) |
| 2 Vehicles | 87 (17.4%) | 49 (18.6%) |
| 3 Vehicles | 265 (53.1%) | 166 (63.1%) |
| 4 Vehicles | 8 (1.6%) | 10 (3.8%) |
| 5 or more Vehicles | 60 (12.0%) | 25 (9.5%) |
| Total | 499 (100.0%) | 263 (100.0%) |
Commute Time in Kremmling
The most frequently occuring commute durations in Kremmling are less than 5 minutes (133 commuters, 19.0%), 5 to 9 minutes (127 commuters, 18.1%), and 45 to 59 minutes (104 commuters, 14.8%).
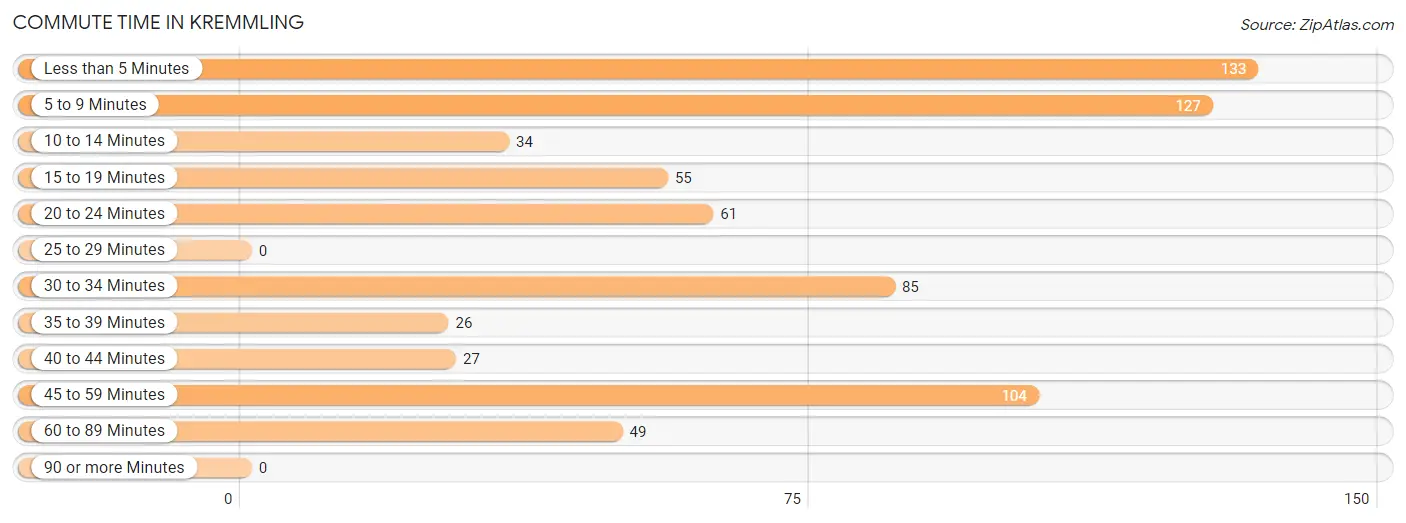
| Commute Time | # Commuters | % Commuters |
| Less than 5 Minutes | 133 | 19.0% |
| 5 to 9 Minutes | 127 | 18.1% |
| 10 to 14 Minutes | 34 | 4.9% |
| 15 to 19 Minutes | 55 | 7.9% |
| 20 to 24 Minutes | 61 | 8.7% |
| 25 to 29 Minutes | 0 | 0.0% |
| 30 to 34 Minutes | 85 | 12.1% |
| 35 to 39 Minutes | 26 | 3.7% |
| 40 to 44 Minutes | 27 | 3.8% |
| 45 to 59 Minutes | 104 | 14.8% |
| 60 to 89 Minutes | 49 | 7.0% |
| 90 or more Minutes | 0 | 0.0% |
Commute Time by Sex in Kremmling
The most common commute times in Kremmling are less than 5 minutes (110 commuters, 23.5%) for males and 5 to 9 minutes (70 commuters, 30.0%) for females.
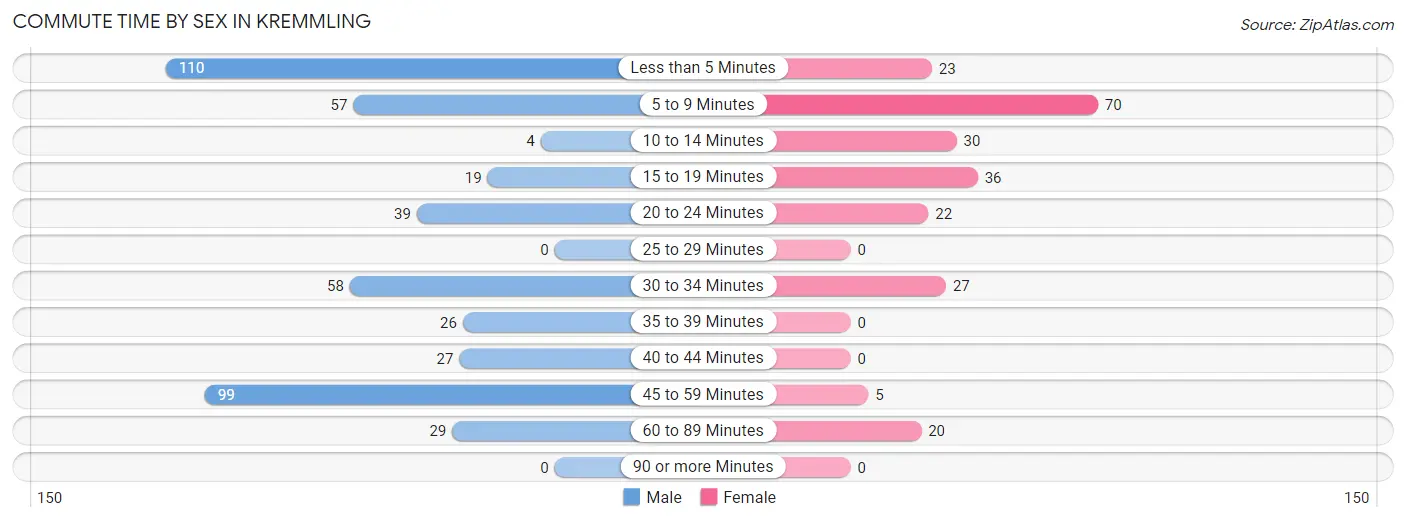
| Commute Time | Male | Female |
| Less than 5 Minutes | 110 (23.5%) | 23 (9.9%) |
| 5 to 9 Minutes | 57 (12.2%) | 70 (30.0%) |
| 10 to 14 Minutes | 4 (0.9%) | 30 (12.9%) |
| 15 to 19 Minutes | 19 (4.1%) | 36 (15.4%) |
| 20 to 24 Minutes | 39 (8.3%) | 22 (9.4%) |
| 25 to 29 Minutes | 0 (0.0%) | 0 (0.0%) |
| 30 to 34 Minutes | 58 (12.4%) | 27 (11.6%) |
| 35 to 39 Minutes | 26 (5.6%) | 0 (0.0%) |
| 40 to 44 Minutes | 27 (5.8%) | 0 (0.0%) |
| 45 to 59 Minutes | 99 (21.1%) | 5 (2.1%) |
| 60 to 89 Minutes | 29 (6.2%) | 20 (8.6%) |
| 90 or more Minutes | 0 (0.0%) | 0 (0.0%) |
Time of Departure to Work by Sex in Kremmling
The most frequent times of departure to work in Kremmling are 7:00 AM to 7:29 AM (88, 18.8%) for males and 7:30 AM to 7:59 AM (56, 24.0%) for females.
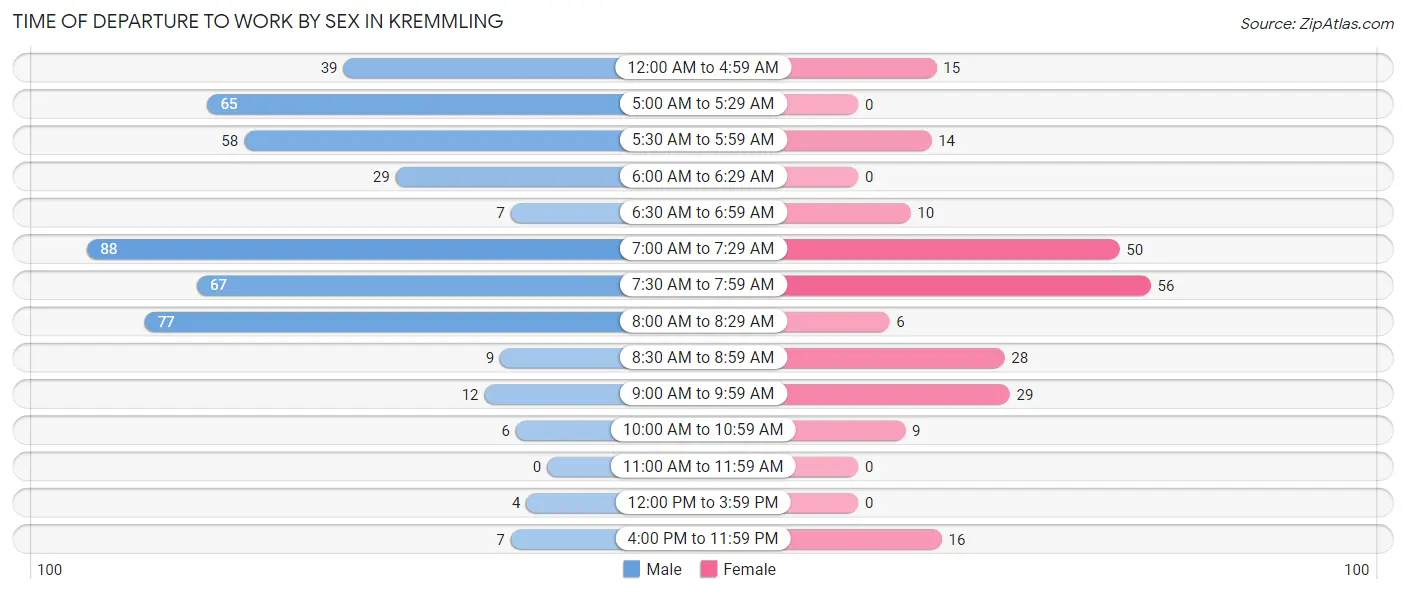
| Time of Departure | Male | Female |
| 12:00 AM to 4:59 AM | 39 (8.3%) | 15 (6.4%) |
| 5:00 AM to 5:29 AM | 65 (13.9%) | 0 (0.0%) |
| 5:30 AM to 5:59 AM | 58 (12.4%) | 14 (6.0%) |
| 6:00 AM to 6:29 AM | 29 (6.2%) | 0 (0.0%) |
| 6:30 AM to 6:59 AM | 7 (1.5%) | 10 (4.3%) |
| 7:00 AM to 7:29 AM | 88 (18.8%) | 50 (21.5%) |
| 7:30 AM to 7:59 AM | 67 (14.3%) | 56 (24.0%) |
| 8:00 AM to 8:29 AM | 77 (16.5%) | 6 (2.6%) |
| 8:30 AM to 8:59 AM | 9 (1.9%) | 28 (12.0%) |
| 9:00 AM to 9:59 AM | 12 (2.6%) | 29 (12.4%) |
| 10:00 AM to 10:59 AM | 6 (1.3%) | 9 (3.9%) |
| 11:00 AM to 11:59 AM | 0 (0.0%) | 0 (0.0%) |
| 12:00 PM to 3:59 PM | 4 (0.9%) | 0 (0.0%) |
| 4:00 PM to 11:59 PM | 7 (1.5%) | 16 (6.9%) |
| Total | 468 (100.0%) | 233 (100.0%) |
Housing Occupancy in Kremmling
Occupancy by Ownership in Kremmling
Of the total 610 dwellings in Kremmling, owner-occupied units account for 452 (74.1%), while renter-occupied units make up 158 (25.9%).
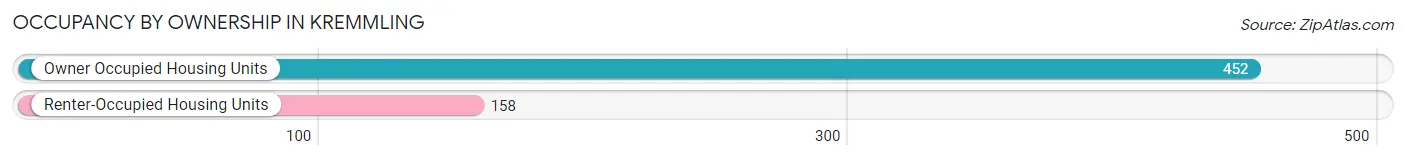
| Occupancy | # Housing Units | % Housing Units |
| Owner Occupied Housing Units | 452 | 74.1% |
| Renter-Occupied Housing Units | 158 | 25.9% |
| Total Occupied Housing Units | 610 | 100.0% |
Occupancy by Household Size in Kremmling
| Household Size | # Housing Units | % Housing Units |
| 1-Person Household | 227 | 37.2% |
| 2-Person Household | 218 | 35.7% |
| 3-Person Household | 68 | 11.2% |
| 4+ Person Household | 97 | 15.9% |
| Total Housing Units | 610 | 100.0% |
Occupancy by Ownership by Household Size in Kremmling

| Household Size | Owner-occupied | Renter-occupied |
| 1-Person Household | 122 (53.7%) | 105 (46.3%) |
| 2-Person Household | 191 (87.6%) | 27 (12.4%) |
| 3-Person Household | 55 (80.9%) | 13 (19.1%) |
| 4+ Person Household | 84 (86.6%) | 13 (13.4%) |
| Total Housing Units | 452 (74.1%) | 158 (25.9%) |
Occupancy by Educational Attainment in Kremmling
| Household Size | Owner-occupied | Renter-occupied |
| Less than High School | 4 (10.8%) | 33 (89.2%) |
| High School Diploma | 233 (83.2%) | 47 (16.8%) |
| College/Associate Degree | 87 (59.2%) | 60 (40.8%) |
| Bachelor's Degree or higher | 128 (87.7%) | 18 (12.3%) |
Occupancy by Age of Householder in Kremmling
| Age Bracket | # Households | % Households |
| Under 35 Years | 37 | 6.1% |
| 35 to 44 Years | 117 | 19.2% |
| 45 to 54 Years | 162 | 26.6% |
| 55 to 64 Years | 95 | 15.6% |
| 65 to 74 Years | 56 | 9.2% |
| 75 to 84 Years | 131 | 21.5% |
| 85 Years and Over | 12 | 2.0% |
| Total | 610 | 100.0% |
Housing Finances in Kremmling
Median Income by Occupancy in Kremmling
| Occupancy Type | # Households | Median Income |
| Owner-Occupied | 452 (74.1%) | $79,286 |
| Renter-Occupied | 158 (25.9%) | $63,750 |
| Average | 610 (100.0%) | $64,141 |
Occupancy by Householder Income Bracket in Kremmling
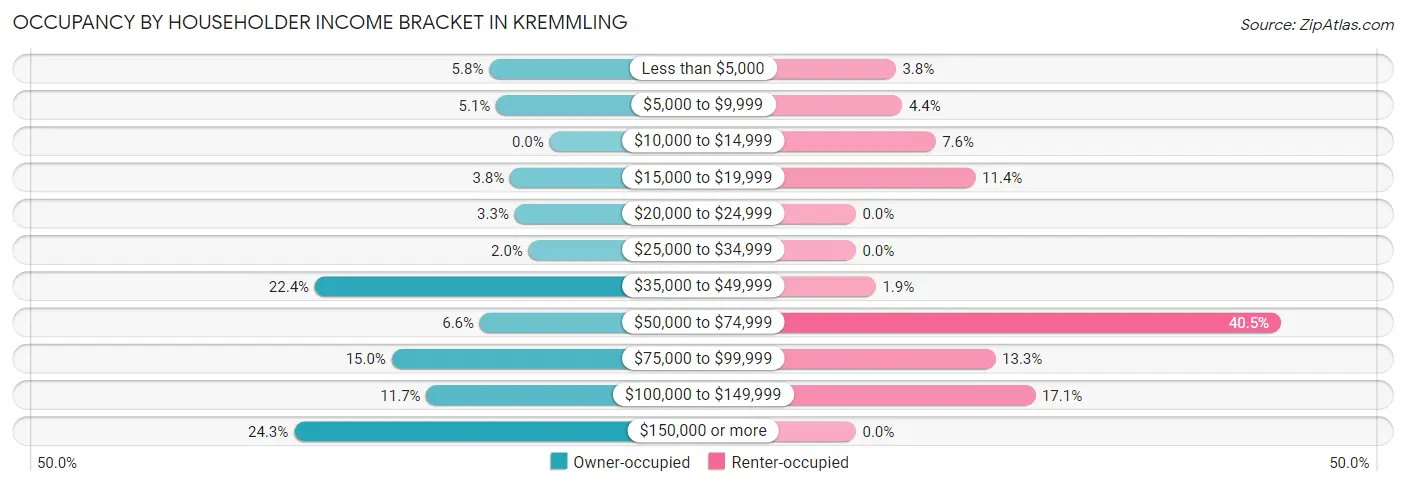
| Income Bracket | Owner-occupied | Renter-occupied |
| Less than $5,000 | 26 (5.8%) | 6 (3.8%) |
| $5,000 to $9,999 | 23 (5.1%) | 7 (4.4%) |
| $10,000 to $14,999 | 0 (0.0%) | 12 (7.6%) |
| $15,000 to $19,999 | 17 (3.8%) | 18 (11.4%) |
| $20,000 to $24,999 | 15 (3.3%) | 0 (0.0%) |
| $25,000 to $34,999 | 9 (2.0%) | 0 (0.0%) |
| $35,000 to $49,999 | 101 (22.4%) | 3 (1.9%) |
| $50,000 to $74,999 | 30 (6.6%) | 64 (40.5%) |
| $75,000 to $99,999 | 68 (15.0%) | 21 (13.3%) |
| $100,000 to $149,999 | 53 (11.7%) | 27 (17.1%) |
| $150,000 or more | 110 (24.3%) | 0 (0.0%) |
| Total | 452 (100.0%) | 158 (100.0%) |
Monthly Housing Cost Tiers in Kremmling
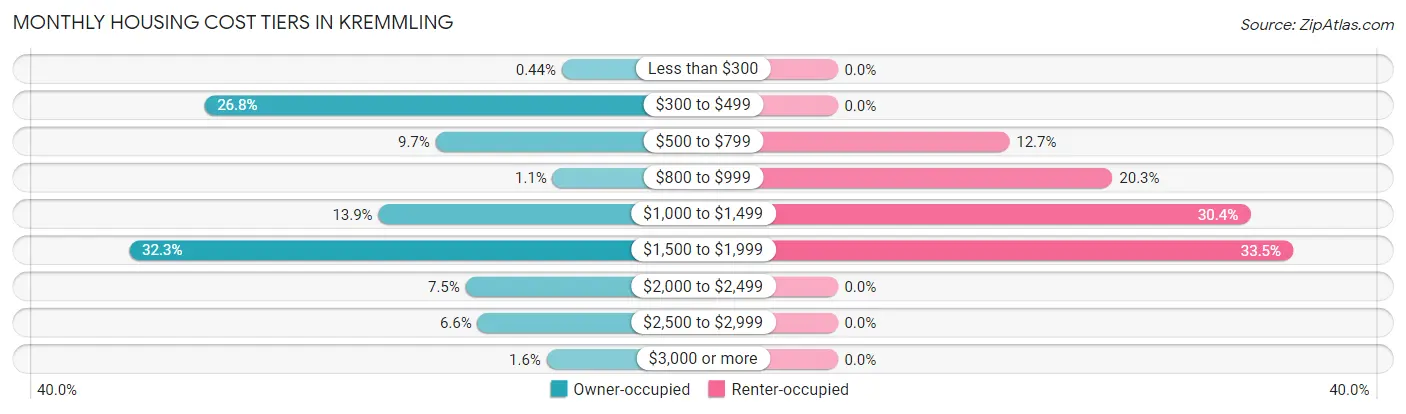
| Monthly Cost | Owner-occupied | Renter-occupied |
| Less than $300 | 2 (0.4%) | 0 (0.0%) |
| $300 to $499 | 121 (26.8%) | 0 (0.0%) |
| $500 to $799 | 44 (9.7%) | 20 (12.7%) |
| $800 to $999 | 5 (1.1%) | 32 (20.3%) |
| $1,000 to $1,499 | 63 (13.9%) | 48 (30.4%) |
| $1,500 to $1,999 | 146 (32.3%) | 53 (33.5%) |
| $2,000 to $2,499 | 34 (7.5%) | 0 (0.0%) |
| $2,500 to $2,999 | 30 (6.6%) | 0 (0.0%) |
| $3,000 or more | 7 (1.5%) | 0 (0.0%) |
| Total | 452 (100.0%) | 158 (100.0%) |
Physical Housing Characteristics in Kremmling
Housing Structures in Kremmling
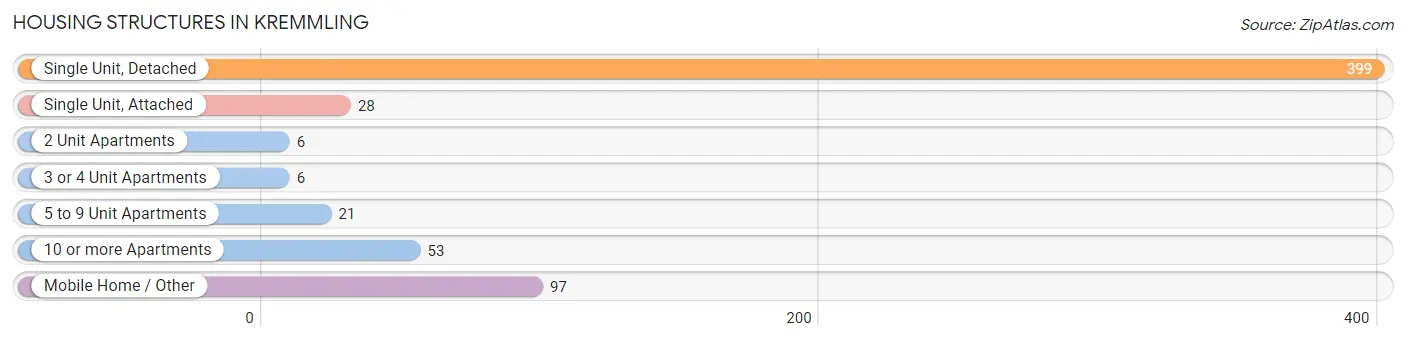
| Structure Type | # Housing Units | % Housing Units |
| Single Unit, Detached | 399 | 65.4% |
| Single Unit, Attached | 28 | 4.6% |
| 2 Unit Apartments | 6 | 1.0% |
| 3 or 4 Unit Apartments | 6 | 1.0% |
| 5 to 9 Unit Apartments | 21 | 3.4% |
| 10 or more Apartments | 53 | 8.7% |
| Mobile Home / Other | 97 | 15.9% |
| Total | 610 | 100.0% |
Housing Structures by Occupancy in Kremmling
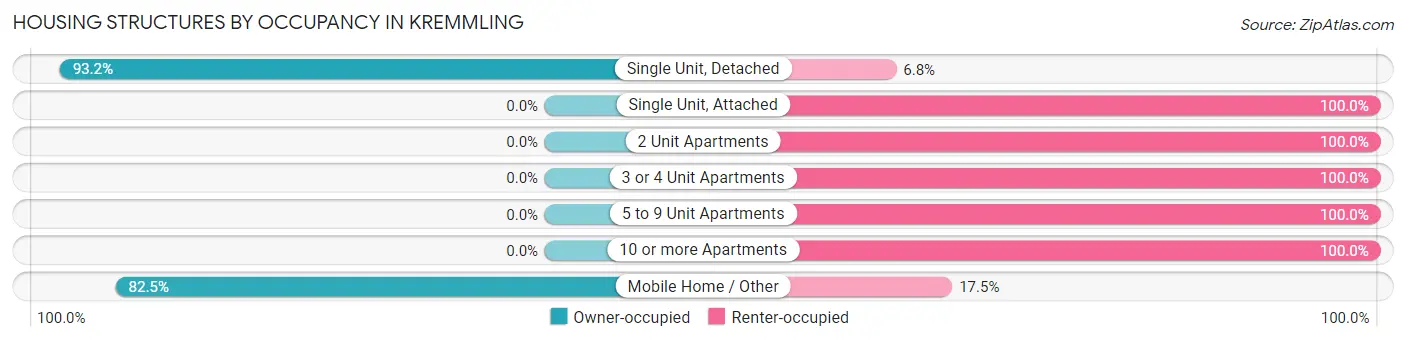
| Structure Type | Owner-occupied | Renter-occupied |
| Single Unit, Detached | 372 (93.2%) | 27 (6.8%) |
| Single Unit, Attached | 0 (0.0%) | 28 (100.0%) |
| 2 Unit Apartments | 0 (0.0%) | 6 (100.0%) |
| 3 or 4 Unit Apartments | 0 (0.0%) | 6 (100.0%) |
| 5 to 9 Unit Apartments | 0 (0.0%) | 21 (100.0%) |
| 10 or more Apartments | 0 (0.0%) | 53 (100.0%) |
| Mobile Home / Other | 80 (82.5%) | 17 (17.5%) |
| Total | 452 (74.1%) | 158 (25.9%) |
Housing Structures by Number of Rooms in Kremmling
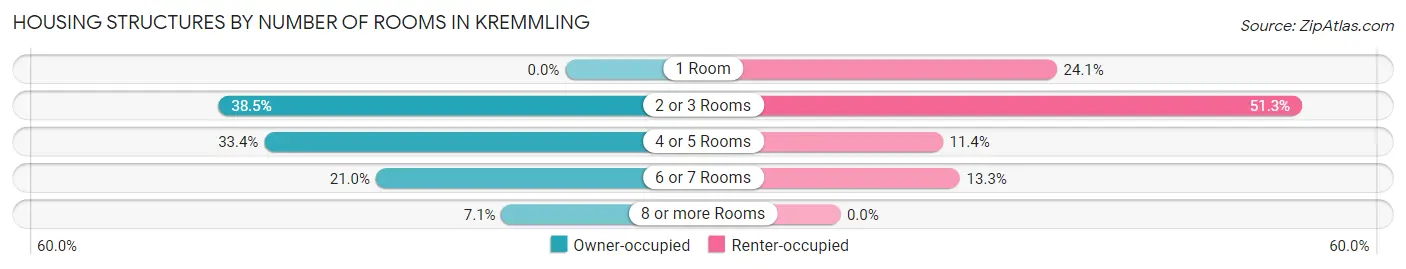
| Number of Rooms | Owner-occupied | Renter-occupied |
| 1 Room | 0 (0.0%) | 38 (24.0%) |
| 2 or 3 Rooms | 174 (38.5%) | 81 (51.3%) |
| 4 or 5 Rooms | 151 (33.4%) | 18 (11.4%) |
| 6 or 7 Rooms | 95 (21.0%) | 21 (13.3%) |
| 8 or more Rooms | 32 (7.1%) | 0 (0.0%) |
| Total | 452 (100.0%) | 158 (100.0%) |
Housing Structure by Heating Type in Kremmling
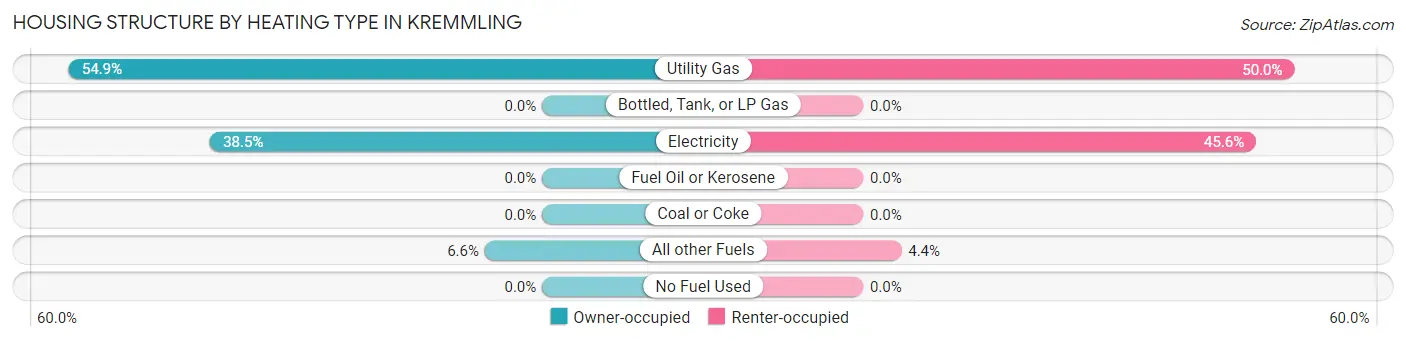
| Heating Type | Owner-occupied | Renter-occupied |
| Utility Gas | 248 (54.9%) | 79 (50.0%) |
| Bottled, Tank, or LP Gas | 0 (0.0%) | 0 (0.0%) |
| Electricity | 174 (38.5%) | 72 (45.6%) |
| Fuel Oil or Kerosene | 0 (0.0%) | 0 (0.0%) |
| Coal or Coke | 0 (0.0%) | 0 (0.0%) |
| All other Fuels | 30 (6.6%) | 7 (4.4%) |
| No Fuel Used | 0 (0.0%) | 0 (0.0%) |
| Total | 452 (100.0%) | 158 (100.0%) |
Household Vehicle Usage in Kremmling
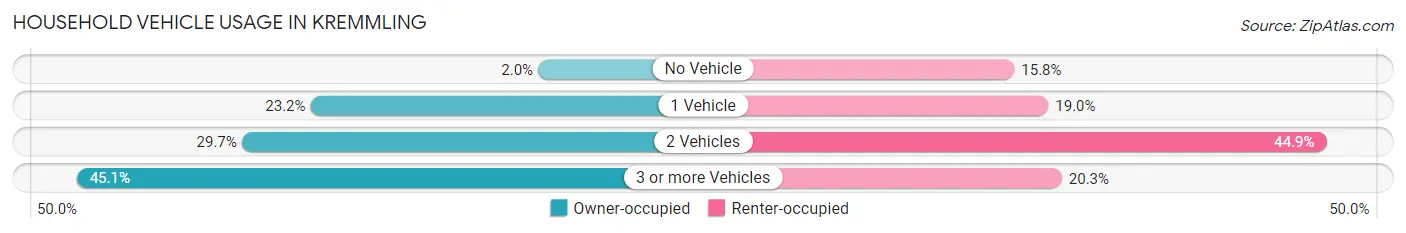
| Vehicles per Household | Owner-occupied | Renter-occupied |
| No Vehicle | 9 (2.0%) | 25 (15.8%) |
| 1 Vehicle | 105 (23.2%) | 30 (19.0%) |
| 2 Vehicles | 134 (29.6%) | 71 (44.9%) |
| 3 or more Vehicles | 204 (45.1%) | 32 (20.3%) |
| Total | 452 (100.0%) | 158 (100.0%) |
Real Estate & Mortgages in Kremmling
Real Estate and Mortgage Overview in Kremmling
| Characteristic | Without Mortgage | With Mortgage |
| Housing Units | 172 | 280 |
| Median Property Value | - | - |
| Median Household Income | $39,233 | $103 |
| Monthly Housing Costs | $372 | $7 |
| Real Estate Taxes | - | - |
Property Value by Mortgage Status in Kremmling
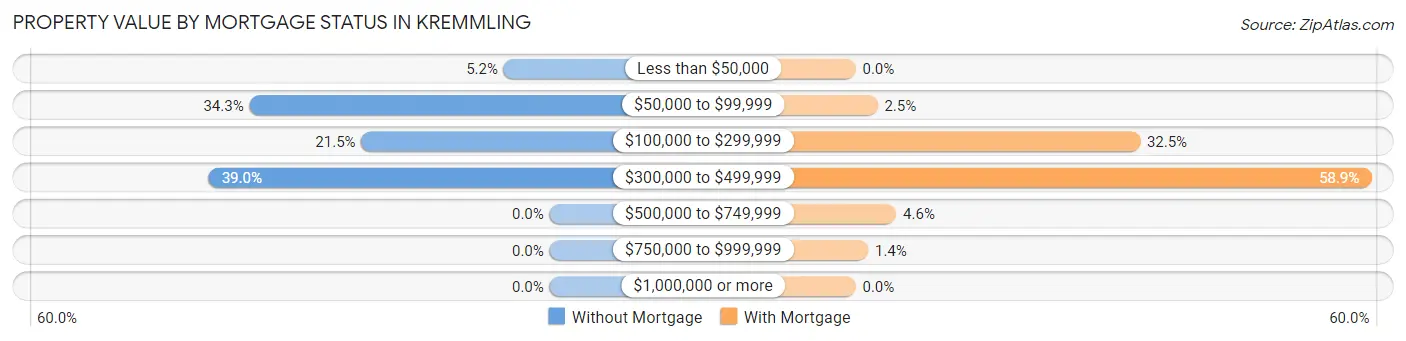
| Property Value | Without Mortgage | With Mortgage |
| Less than $50,000 | 9 (5.2%) | 0 (0.0%) |
| $50,000 to $99,999 | 59 (34.3%) | 7 (2.5%) |
| $100,000 to $299,999 | 37 (21.5%) | 91 (32.5%) |
| $300,000 to $499,999 | 67 (39.0%) | 165 (58.9%) |
| $500,000 to $749,999 | 0 (0.0%) | 13 (4.6%) |
| $750,000 to $999,999 | 0 (0.0%) | 4 (1.4%) |
| $1,000,000 or more | 0 (0.0%) | 0 (0.0%) |
| Total | 172 (100.0%) | 280 (100.0%) |
Household Income by Mortgage Status in Kremmling
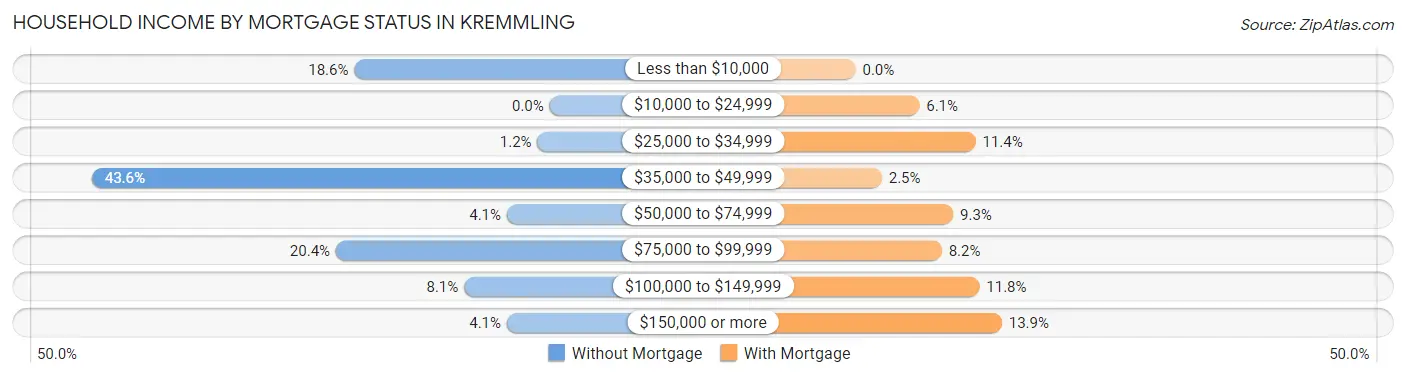
| Household Income | Without Mortgage | With Mortgage |
| Less than $10,000 | 32 (18.6%) | 0 (0.0%) |
| $10,000 to $24,999 | 0 (0.0%) | 17 (6.1%) |
| $25,000 to $34,999 | 2 (1.2%) | 32 (11.4%) |
| $35,000 to $49,999 | 75 (43.6%) | 7 (2.5%) |
| $50,000 to $74,999 | 7 (4.1%) | 26 (9.3%) |
| $75,000 to $99,999 | 35 (20.3%) | 23 (8.2%) |
| $100,000 to $149,999 | 14 (8.1%) | 33 (11.8%) |
| $150,000 or more | 7 (4.1%) | 39 (13.9%) |
| Total | 172 (100.0%) | 280 (100.0%) |
Property Value to Household Income Ratio in Kremmling
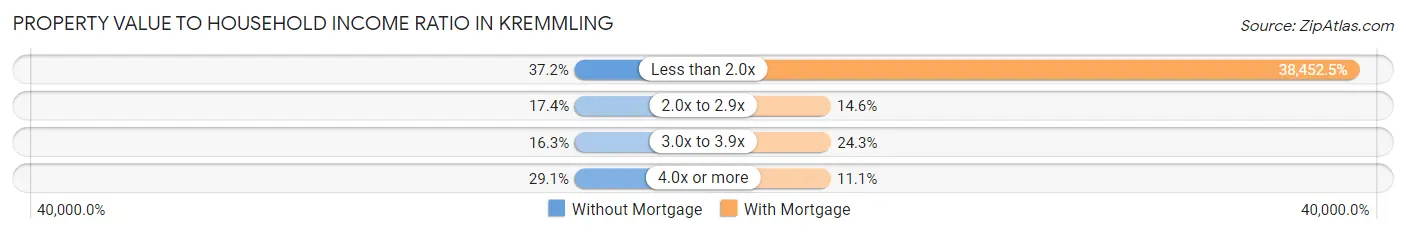
| Value-to-Income Ratio | Without Mortgage | With Mortgage |
| Less than 2.0x | 64 (37.2%) | 107,667 (38,452.5%) |
| 2.0x to 2.9x | 30 (17.4%) | 41 (14.6%) |
| 3.0x to 3.9x | 28 (16.3%) | 68 (24.3%) |
| 4.0x or more | 50 (29.1%) | 31 (11.1%) |
| Total | 172 (100.0%) | 280 (100.0%) |
Real Estate Taxes by Mortgage Status in Kremmling
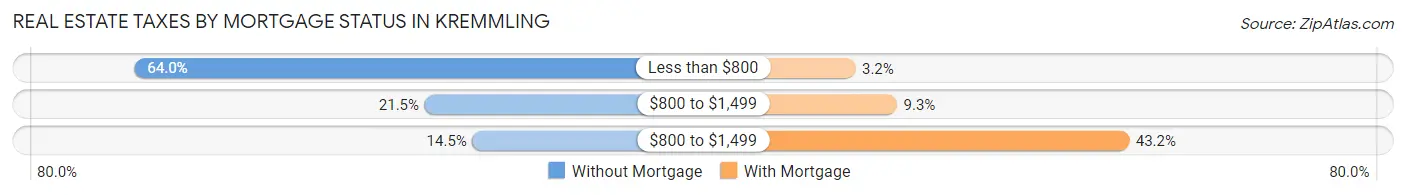
| Property Taxes | Without Mortgage | With Mortgage |
| Less than $800 | 110 (63.9%) | 9 (3.2%) |
| $800 to $1,499 | 37 (21.5%) | 26 (9.3%) |
| $800 to $1,499 | 25 (14.5%) | 121 (43.2%) |
| Total | 172 (100.0%) | 280 (100.0%) |
Health & Disability in Kremmling
Health Insurance Coverage by Age in Kremmling
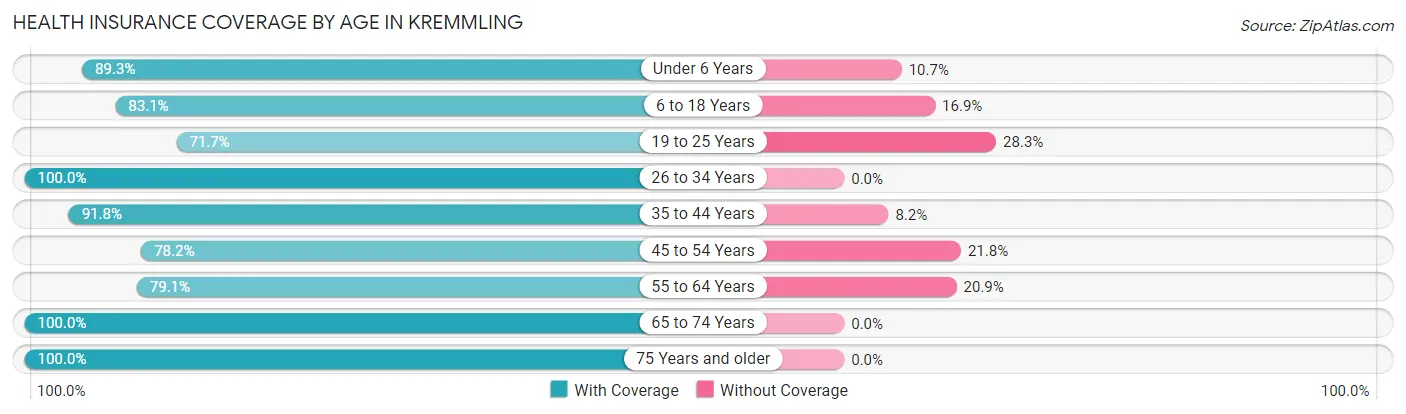
| Age Bracket | With Coverage | Without Coverage |
| Under 6 Years | 150 (89.3%) | 18 (10.7%) |
| 6 to 18 Years | 407 (83.1%) | 83 (16.9%) |
| 19 to 25 Years | 124 (71.7%) | 49 (28.3%) |
| 26 to 34 Years | 55 (100.0%) | 0 (0.0%) |
| 35 to 44 Years | 167 (91.8%) | 15 (8.2%) |
| 45 to 54 Years | 187 (78.2%) | 52 (21.8%) |
| 55 to 64 Years | 185 (79.1%) | 49 (20.9%) |
| 65 to 74 Years | 63 (100.0%) | 0 (0.0%) |
| 75 Years and older | 169 (100.0%) | 0 (0.0%) |
| Total | 1,507 (85.0%) | 266 (15.0%) |
Health Insurance Coverage by Citizenship Status in Kremmling
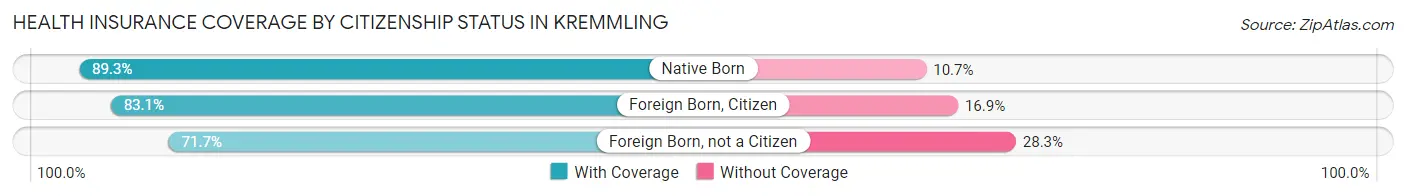
| Citizenship Status | With Coverage | Without Coverage |
| Native Born | 150 (89.3%) | 18 (10.7%) |
| Foreign Born, Citizen | 407 (83.1%) | 83 (16.9%) |
| Foreign Born, not a Citizen | 124 (71.7%) | 49 (28.3%) |
Health Insurance Coverage by Household Income in Kremmling
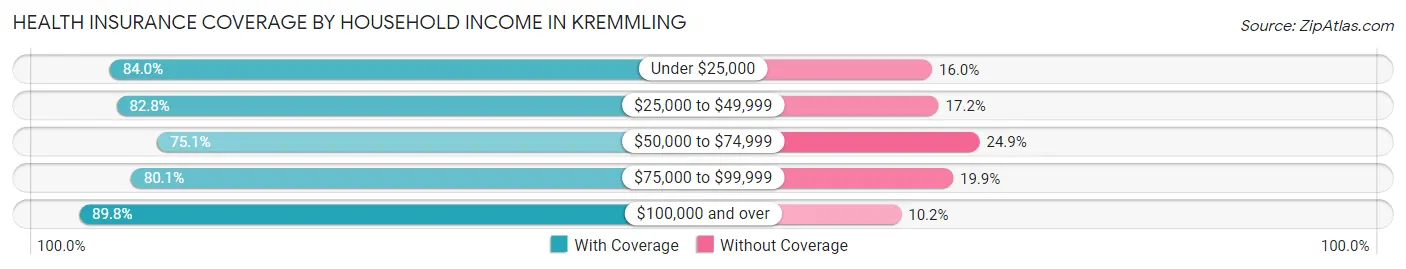
| Household Income | With Coverage | Without Coverage |
| Under $25,000 | 184 (84.0%) | 35 (16.0%) |
| $25,000 to $49,999 | 303 (82.8%) | 63 (17.2%) |
| $50,000 to $74,999 | 142 (75.1%) | 47 (24.9%) |
| $75,000 to $99,999 | 157 (80.1%) | 39 (19.9%) |
| $100,000 and over | 721 (89.8%) | 82 (10.2%) |
Public vs Private Health Insurance Coverage by Age in Kremmling
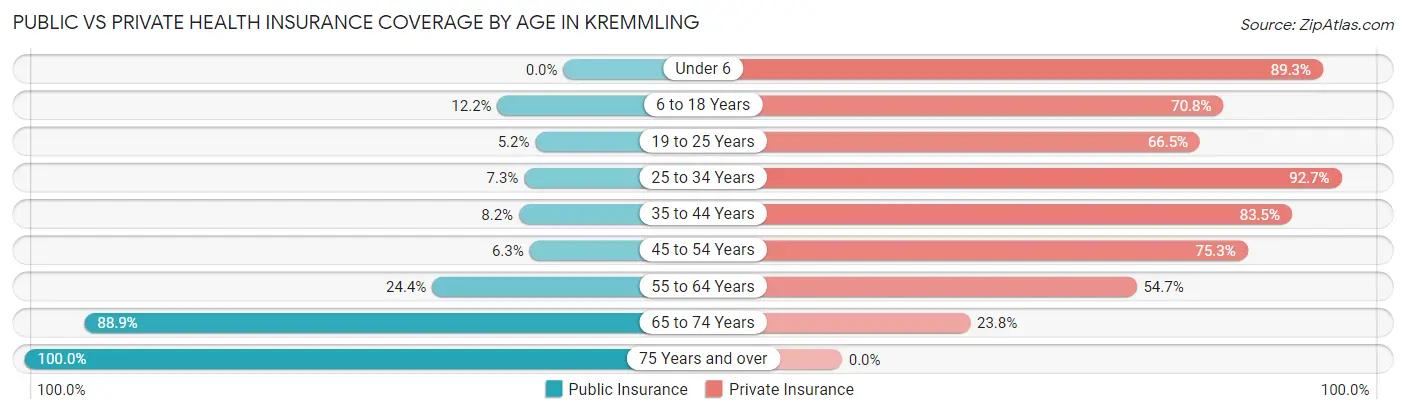
| Age Bracket | Public Insurance | Private Insurance |
| Under 6 | 0 (0.0%) | 150 (89.3%) |
| 6 to 18 Years | 60 (12.2%) | 347 (70.8%) |
| 19 to 25 Years | 9 (5.2%) | 115 (66.5%) |
| 25 to 34 Years | 4 (7.3%) | 51 (92.7%) |
| 35 to 44 Years | 15 (8.2%) | 152 (83.5%) |
| 45 to 54 Years | 15 (6.3%) | 180 (75.3%) |
| 55 to 64 Years | 57 (24.4%) | 128 (54.7%) |
| 65 to 74 Years | 56 (88.9%) | 15 (23.8%) |
| 75 Years and over | 169 (100.0%) | 0 (0.0%) |
| Total | 385 (21.7%) | 1,138 (64.2%) |
Disability Status by Sex by Age in Kremmling
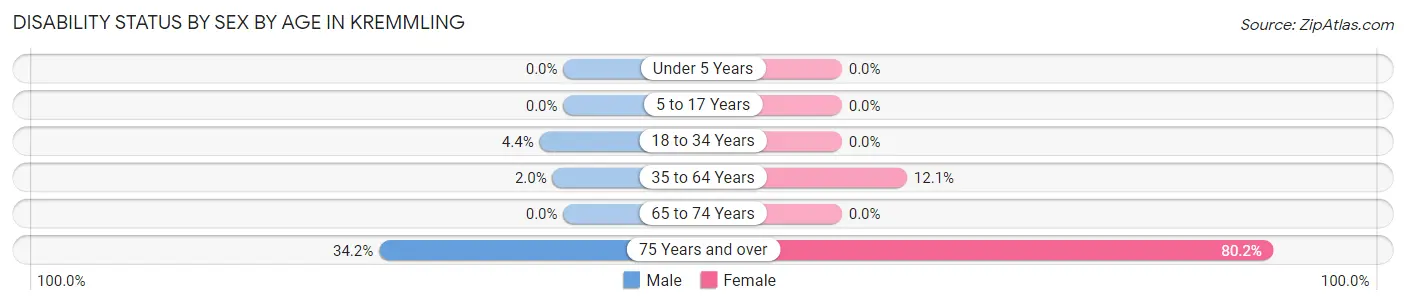
| Age Bracket | Male | Female |
| Under 5 Years | 0 (0.0%) | 0 (0.0%) |
| 5 to 17 Years | 0 (0.0%) | 0 (0.0%) |
| 18 to 34 Years | 9 (4.4%) | 0 (0.0%) |
| 35 to 64 Years | 7 (2.0%) | 37 (12.1%) |
| 65 to 74 Years | 0 (0.0%) | 0 (0.0%) |
| 75 Years and over | 13 (34.2%) | 105 (80.1%) |
Disability Class by Sex by Age in Kremmling
Disability Class: Hearing Difficulty
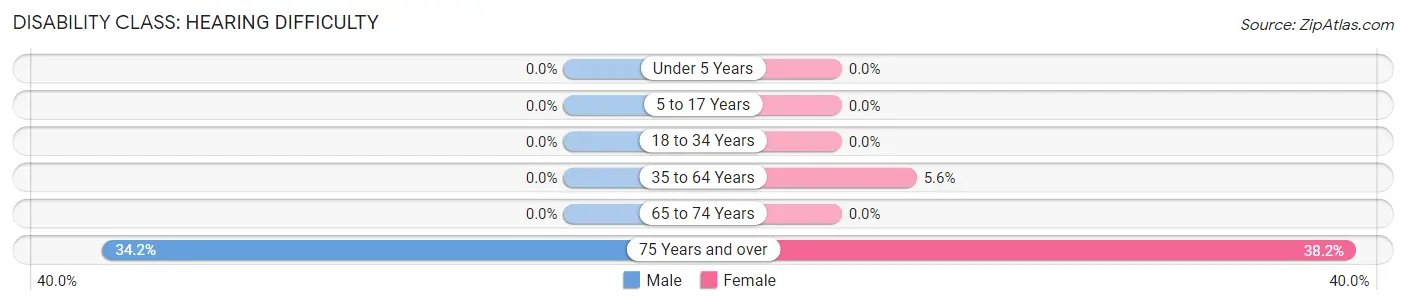
| Age Bracket | Male | Female |
| Under 5 Years | 0 (0.0%) | 0 (0.0%) |
| 5 to 17 Years | 0 (0.0%) | 0 (0.0%) |
| 18 to 34 Years | 0 (0.0%) | 0 (0.0%) |
| 35 to 64 Years | 0 (0.0%) | 17 (5.6%) |
| 65 to 74 Years | 0 (0.0%) | 0 (0.0%) |
| 75 Years and over | 13 (34.2%) | 50 (38.2%) |
Disability Class: Vision Difficulty
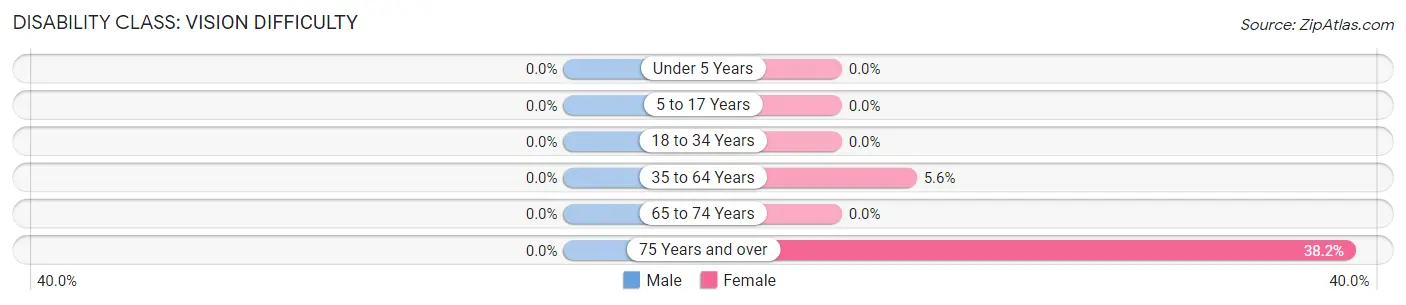
| Age Bracket | Male | Female |
| Under 5 Years | 0 (0.0%) | 0 (0.0%) |
| 5 to 17 Years | 0 (0.0%) | 0 (0.0%) |
| 18 to 34 Years | 0 (0.0%) | 0 (0.0%) |
| 35 to 64 Years | 0 (0.0%) | 17 (5.6%) |
| 65 to 74 Years | 0 (0.0%) | 0 (0.0%) |
| 75 Years and over | 0 (0.0%) | 50 (38.2%) |
Disability Class: Cognitive Difficulty
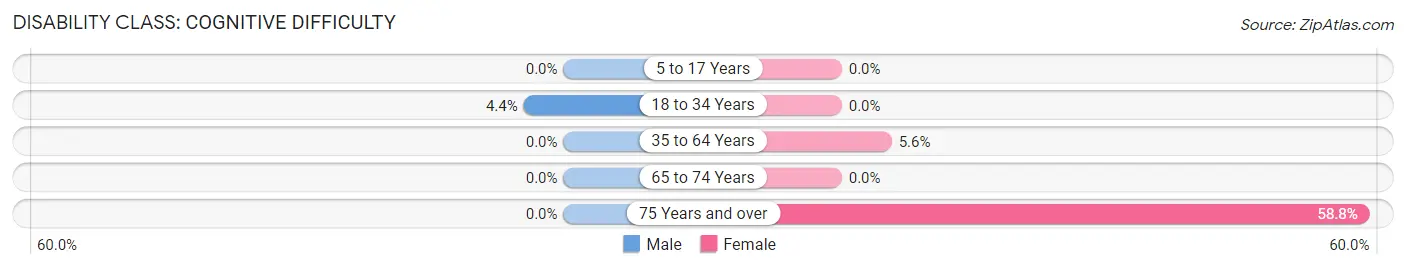
| Age Bracket | Male | Female |
| 5 to 17 Years | 0 (0.0%) | 0 (0.0%) |
| 18 to 34 Years | 9 (4.4%) | 0 (0.0%) |
| 35 to 64 Years | 0 (0.0%) | 17 (5.6%) |
| 65 to 74 Years | 0 (0.0%) | 0 (0.0%) |
| 75 Years and over | 0 (0.0%) | 77 (58.8%) |
Disability Class: Ambulatory Difficulty
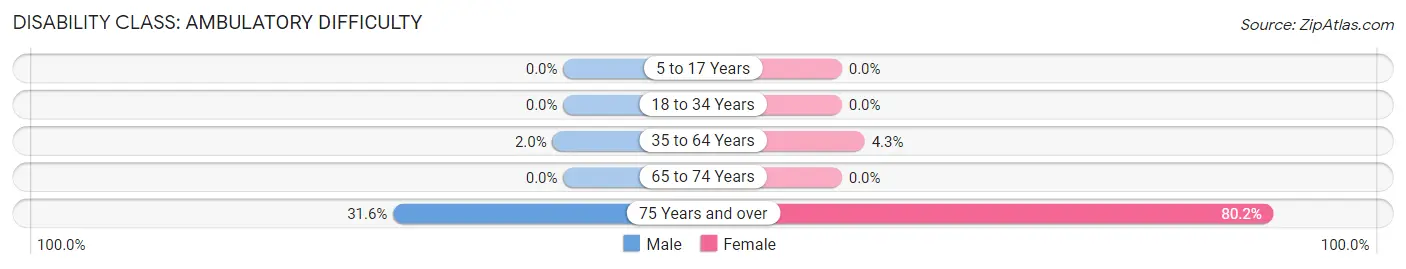
| Age Bracket | Male | Female |
| 5 to 17 Years | 0 (0.0%) | 0 (0.0%) |
| 18 to 34 Years | 0 (0.0%) | 0 (0.0%) |
| 35 to 64 Years | 7 (2.0%) | 13 (4.3%) |
| 65 to 74 Years | 0 (0.0%) | 0 (0.0%) |
| 75 Years and over | 12 (31.6%) | 105 (80.1%) |
Disability Class: Self-Care Difficulty
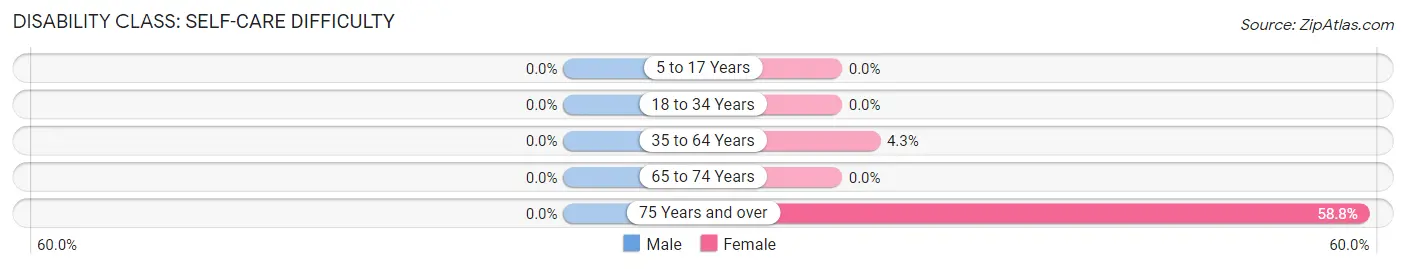
| Age Bracket | Male | Female |
| 5 to 17 Years | 0 (0.0%) | 0 (0.0%) |
| 18 to 34 Years | 0 (0.0%) | 0 (0.0%) |
| 35 to 64 Years | 0 (0.0%) | 13 (4.3%) |
| 65 to 74 Years | 0 (0.0%) | 0 (0.0%) |
| 75 Years and over | 0 (0.0%) | 77 (58.8%) |
Technology Access in Kremmling
Computing Device Access in Kremmling
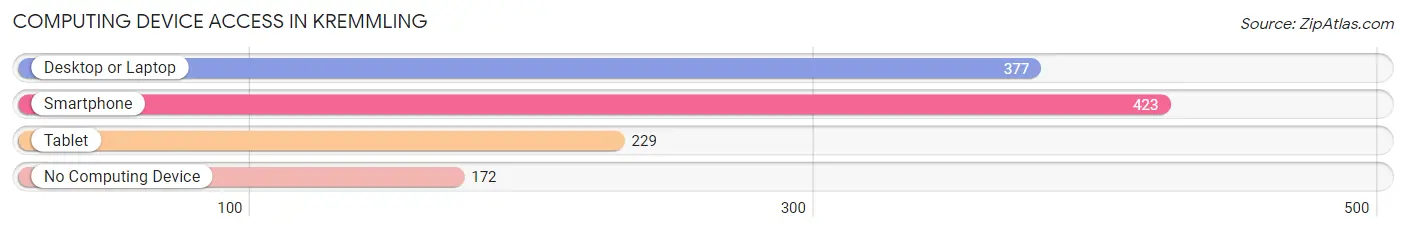
| Device Type | # Households | % Households |
| Desktop or Laptop | 377 | 61.8% |
| Smartphone | 423 | 69.3% |
| Tablet | 229 | 37.5% |
| No Computing Device | 172 | 28.2% |
| Total | 610 | 100.0% |
Internet Access in Kremmling
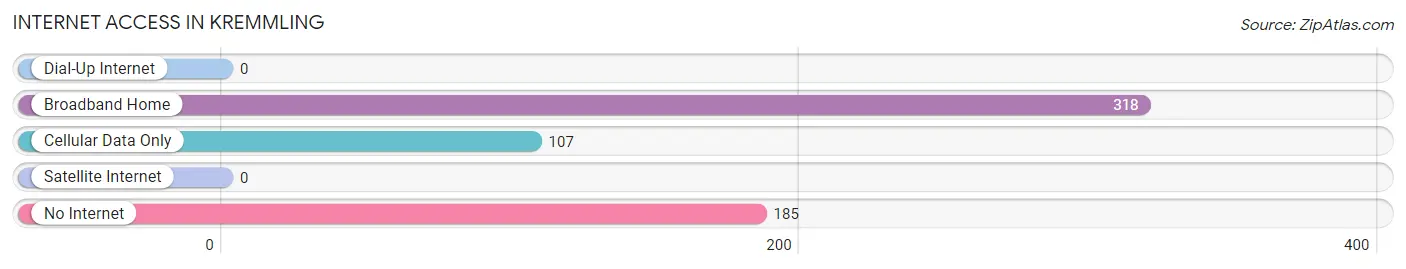
| Internet Type | # Households | % Households |
| Dial-Up Internet | 0 | 0.0% |
| Broadband Home | 318 | 52.1% |
| Cellular Data Only | 107 | 17.5% |
| Satellite Internet | 0 | 0.0% |
| No Internet | 185 | 30.3% |
| Total | 610 | 100.0% |
Kremmling Summary
Kremmling is a small town located in Grand County, Colorado, United States. It is situated in the Upper Colorado River Valley, at the confluence of the Blue and Colorado Rivers. The town is located approximately 90 miles northwest of Denver and is the county seat of Grand County. The population of Kremmling was 1,063 at the 2010 census.
History
Kremmling was founded in 1881 by German immigrant, John Kremmling. He was a rancher and miner who had come to the area in search of gold. He established a trading post and a post office in the area, and the town was named after him.
The town grew slowly, but steadily, and by the early 1900s, it had become a bustling community. The town was home to several businesses, including a hotel, a bank, a general store, and a saloon. The town also had a school, a church, and a newspaper.
In the early 1900s, Kremmling was a popular destination for tourists, who came to enjoy the area's natural beauty and outdoor activities. The town was also a popular stop for travelers on the Denver and Rio Grande Western Railroad.
Geography
Kremmling is located in the Upper Colorado River Valley, at the confluence of the Blue and Colorado Rivers. The town is situated at an elevation of 7,741 feet (2,360 m). The town is surrounded by mountains, including the Gore Range to the north, the Williams Fork Mountains to the east, and the Park Range to the south.
The town is located approximately 90 miles northwest of Denver and is the county seat of Grand County. The town is located along U.S. Highway 40, which runs through the center of town.
Economy
Kremmling's economy is largely based on tourism and agriculture. The town is a popular destination for outdoor enthusiasts, who come to enjoy the area's natural beauty and outdoor activities. The town is also home to several businesses, including restaurants, hotels, and retail stores.
Agriculture is also an important part of the local economy. The area is home to several ranches and farms, which produce hay, cattle, and other agricultural products.
Demographics
As of the 2010 census, the population of Kremmling was 1,063. The racial makeup of the town was 95.3% White, 0.3% African American, 0.7% Native American, 0.3% Asian, 0.1% Pacific Islander, 1.2% from other races, and 2.2% from two or more races. Hispanic or Latino of any race were 4.2% of the population.
The median income for a household in Kremmling was $41,250, and the median income for a family was $45,000. The per capita income for the town was $20,945. About 11.2% of families and 14.2% of the population were below the poverty line, including 18.2% of those under age 18 and 8.3% of those age 65 or over.
Common Questions
What is Per Capita Income in Kremmling?
Per Capita income in Kremmling is $29,021.
What is the Median Family Income in Kremmling?
Median Family Income in Kremmling is $83,786.
What is the Median Household income in Kremmling?
Median Household Income in Kremmling is $64,141.
What is Income or Wage Gap in Kremmling?
Income or Wage Gap in Kremmling is 23.4%.
Women in Kremmling earn 76.6 cents for every dollar earned by a man.
What is Inequality or Gini Index in Kremmling?
Inequality or Gini Index in Kremmling is 0.44.
What is the Total Population of Kremmling?
Total Population of Kremmling is 1,779.
What is the Total Male Population of Kremmling?
Total Male Population of Kremmling is 996.
What is the Total Female Population of Kremmling?
Total Female Population of Kremmling is 783.
What is the Ratio of Males per 100 Females in Kremmling?
There are 127.20 Males per 100 Females in Kremmling.
What is the Ratio of Females per 100 Males in Kremmling?
There are 78.61 Females per 100 Males in Kremmling.
What is the Median Population Age in Kremmling?
Median Population Age in Kremmling is 35.2 Years.
What is the Average Family Size in Kremmling
Average Family Size in Kremmling is 4.1 People.
What is the Average Household Size in Kremmling
Average Household Size in Kremmling is 2.9 People.
How Large is the Labor Force in Kremmling?
There are 788 People in the Labor Forcein in Kremmling.
What is the Percentage of People in the Labor Force in Kremmling?
62.8% of People are in the Labor Force in Kremmling.
What is the Unemployment Rate in Kremmling?
Unemployment Rate in Kremmling is 2.4%.