Kittredge, CO Map & Demographics
Kittredge Map
Kittredge Overview
$80,689
PER CAPITA INCOME
$220,417
AVG FAMILY INCOME
$143,147
AVG HOUSEHOLD INCOME
58.5%
WAGE / INCOME GAP [ % ]
41.5¢/ $1
WAGE / INCOME GAP [ $ ]
0.39
INEQUALITY / GINI INDEX
1,021
TOTAL POPULATION
460
MALE POPULATION
561
FEMALE POPULATION
82.00
MALES / 100 FEMALES
121.96
FEMALES / 100 MALES
40.3
MEDIAN AGE
2.9
AVG FAMILY SIZE
2.4
AVG HOUSEHOLD SIZE
705
LABOR FORCE [ PEOPLE ]
84.7%
PERCENT IN LABOR FORCE
4.8%
UNEMPLOYMENT RATE
Kittredge Zip Codes
Kittredge Area Codes
Income in Kittredge
Income Overview in Kittredge
Per Capita Income in Kittredge is $80,689, while median incomes of families and households are $220,417 and $143,147 respectively.
| Characteristic | Number | Measure |
| Per Capita Income | 1,021 | $80,689 |
| Median Family Income | 215 | $220,417 |
| Mean Family Income | 215 | $225,189 |
| Median Household Income | 429 | $143,147 |
| Mean Household Income | 429 | $190,135 |
| Income Deficit | 215 | $0 |
| Wage / Income Gap (%) | 1,021 | 58.51% |
| Wage / Income Gap ($) | 1,021 | 41.49¢ per $1 |
| Gini / Inequality Index | 1,021 | 0.39 |
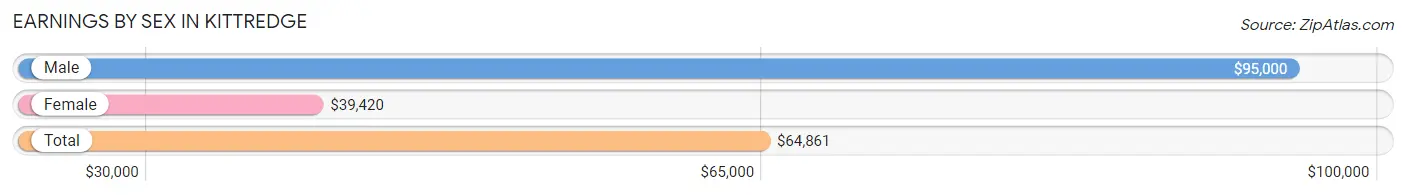
Earnings by Sex in Kittredge
Average Earnings in Kittredge are $64,861, $95,000 for men and $39,420 for women, a difference of 58.5%.
| Sex | Number | Average Earnings |
| Male | 350 (49.9%) | $95,000 |
| Female | 351 (50.1%) | $39,420 |
| Total | 701 (100.0%) | $64,861 |
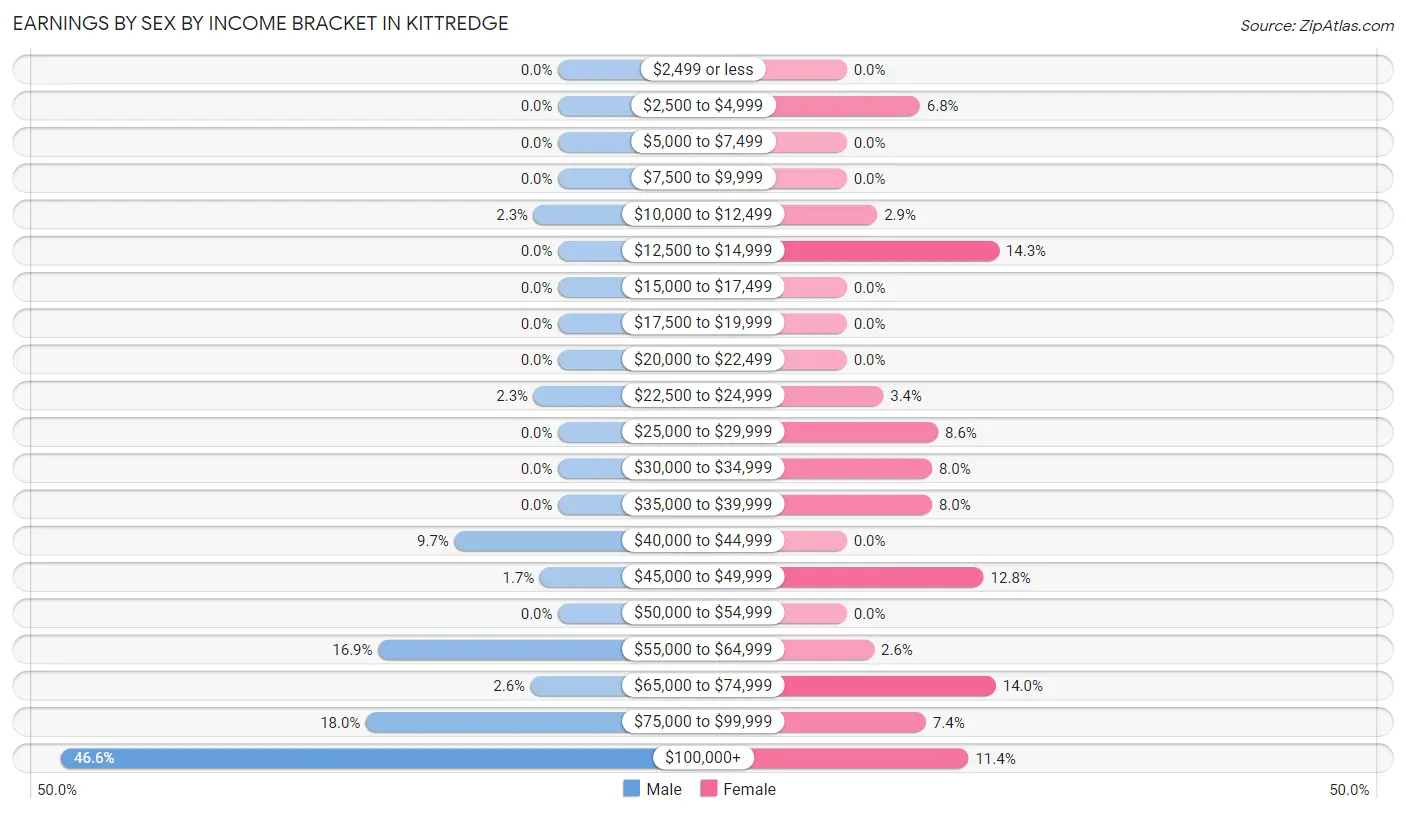
Earnings by Sex by Income Bracket in Kittredge
The most common earnings brackets in Kittredge are $100,000+ for men (163 | 46.6%) and $12,500 to $14,999 for women (50 | 14.2%).
| Income | Male | Female |
| $2,499 or less | 0 (0.0%) | 0 (0.0%) |
| $2,500 to $4,999 | 0 (0.0%) | 24 (6.8%) |
| $5,000 to $7,499 | 0 (0.0%) | 0 (0.0%) |
| $7,500 to $9,999 | 0 (0.0%) | 0 (0.0%) |
| $10,000 to $12,499 | 8 (2.3%) | 10 (2.9%) |
| $12,500 to $14,999 | 0 (0.0%) | 50 (14.2%) |
| $15,000 to $17,499 | 0 (0.0%) | 0 (0.0%) |
| $17,500 to $19,999 | 0 (0.0%) | 0 (0.0%) |
| $20,000 to $22,499 | 0 (0.0%) | 0 (0.0%) |
| $22,500 to $24,999 | 8 (2.3%) | 12 (3.4%) |
| $25,000 to $29,999 | 0 (0.0%) | 30 (8.6%) |
| $30,000 to $34,999 | 0 (0.0%) | 28 (8.0%) |
| $35,000 to $39,999 | 0 (0.0%) | 28 (8.0%) |
| $40,000 to $44,999 | 34 (9.7%) | 0 (0.0%) |
| $45,000 to $49,999 | 6 (1.7%) | 45 (12.8%) |
| $50,000 to $54,999 | 0 (0.0%) | 0 (0.0%) |
| $55,000 to $64,999 | 59 (16.9%) | 9 (2.6%) |
| $65,000 to $74,999 | 9 (2.6%) | 49 (14.0%) |
| $75,000 to $99,999 | 63 (18.0%) | 26 (7.4%) |
| $100,000+ | 163 (46.6%) | 40 (11.4%) |
| Total | 350 (100.0%) | 351 (100.0%) |
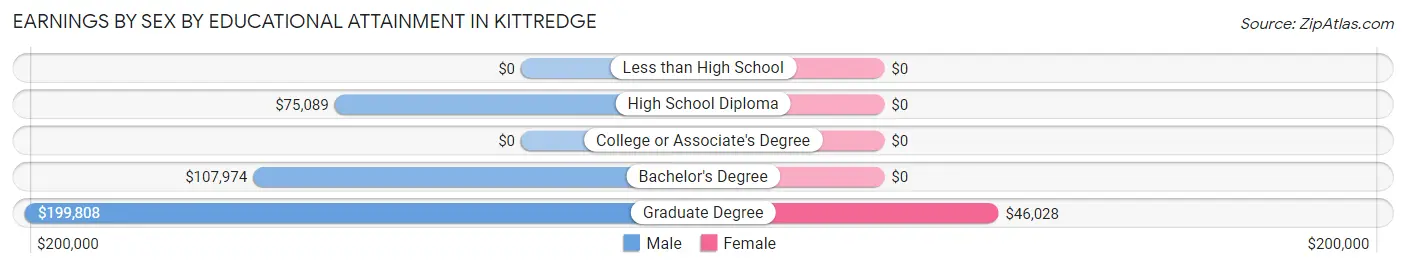
Earnings by Sex by Educational Attainment in Kittredge
Average earnings in Kittredge are $107,845 for men and $45,500 for women, a difference of 57.8%. Men with an educational attainment of graduate degree enjoy the highest average annual earnings of $199,808, while those with high school diploma education earn the least with $75,089. Women with an educational attainment of graduate degree earn the most with the average annual earnings of $46,028, while those with graduate degree education have the smallest earnings of $46,028.
| Educational Attainment | Male Income | Female Income |
| Less than High School | - | - |
| High School Diploma | $75,089 | $0 |
| College or Associate's Degree | - | - |
| Bachelor's Degree | $107,974 | $0 |
| Graduate Degree | $199,808 | $46,028 |
| Total | $107,845 | $45,500 |
Family Income in Kittredge
Family Income Brackets in Kittredge
According to the Kittredge family income data, there are 120 families falling into the $200,000+ income range, which is the most common income bracket and makes up 55.8% of all families.
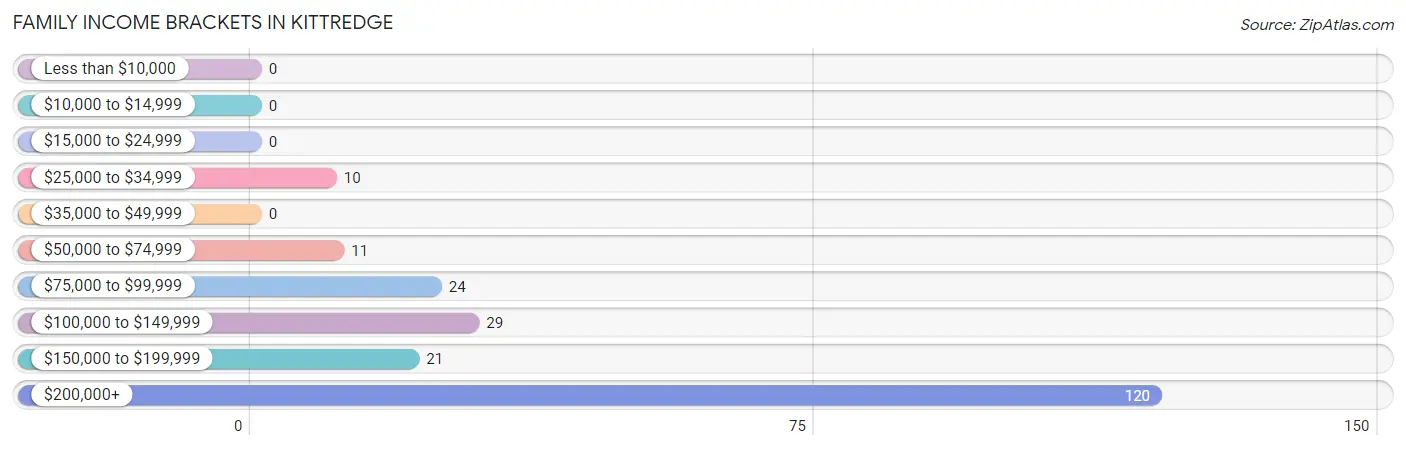
| Income Bracket | # Families | % Families |
| Less than $10,000 | 0 | 0.0% |
| $10,000 to $14,999 | 0 | 0.0% |
| $15,000 to $24,999 | 0 | 0.0% |
| $25,000 to $34,999 | 10 | 4.7% |
| $35,000 to $49,999 | 0 | 0.0% |
| $50,000 to $74,999 | 11 | 5.1% |
| $75,000 to $99,999 | 24 | 11.2% |
| $100,000 to $149,999 | 29 | 13.5% |
| $150,000 to $199,999 | 21 | 9.8% |
| $200,000+ | 120 | 55.8% |
Family Income by Famaliy Size in Kittredge
3-person families (64 | 29.8%) account for the highest median family income in Kittredge with $250,001 per family, while 2-person families (94 | 43.7%) have the highest median income of $110,714 per family member.
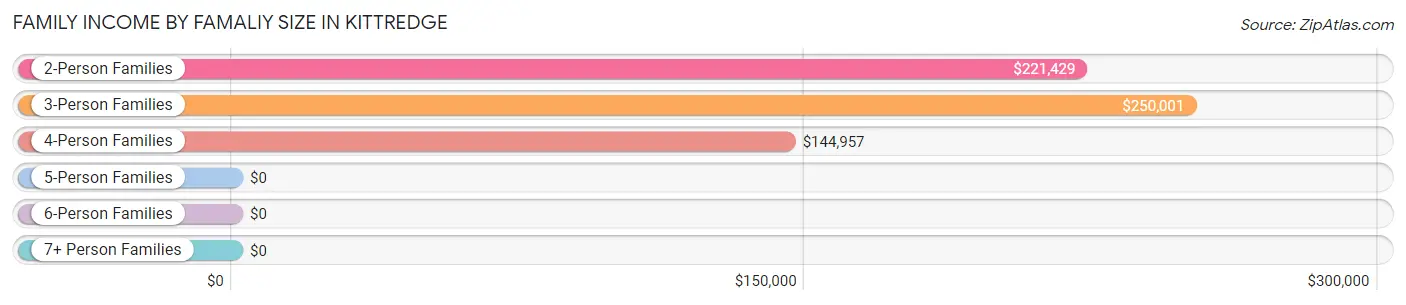
| Income Bracket | # Families | Median Income |
| 2-Person Families | 94 (43.7%) | $221,429 |
| 3-Person Families | 64 (29.8%) | $250,001 |
| 4-Person Families | 57 (26.5%) | $144,957 |
| 5-Person Families | 0 (0.0%) | $0 |
| 6-Person Families | 0 (0.0%) | $0 |
| 7+ Person Families | 0 (0.0%) | $0 |
| Total | 215 (100.0%) | $220,417 |
Family Income by Number of Earners in Kittredge
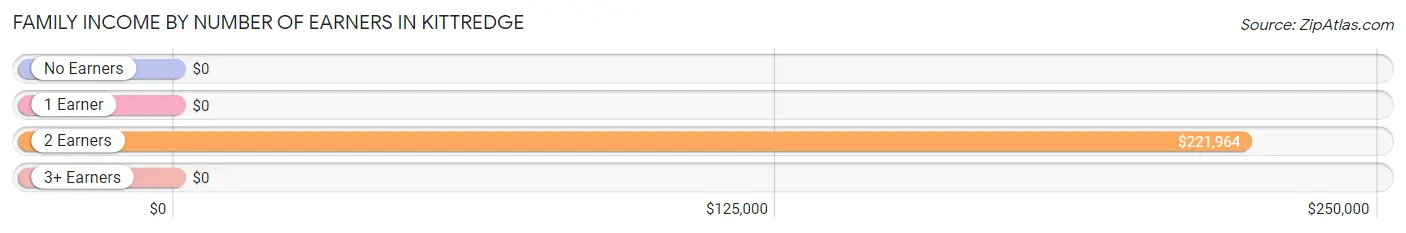
| Number of Earners | # Families | Median Income |
| No Earners | 21 (9.8%) | $0 |
| 1 Earner | 23 (10.7%) | $0 |
| 2 Earners | 155 (72.1%) | $221,964 |
| 3+ Earners | 16 (7.4%) | $0 |
| Total | 215 (100.0%) | $220,417 |
Household Income in Kittredge
Household Income Brackets in Kittredge
With 159 households falling in the category, the $200,000+ income range is the most frequent in Kittredge, accounting for 37.1% of all households.
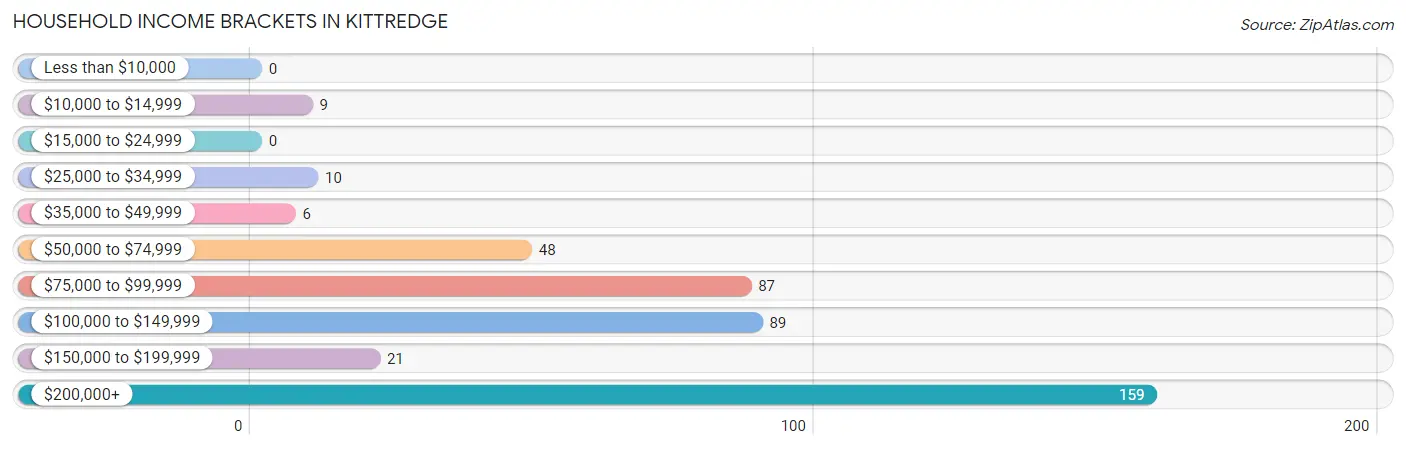
| Income Bracket | # Households | % Households |
| Less than $10,000 | 0 | 0.0% |
| $10,000 to $14,999 | 9 | 2.1% |
| $15,000 to $24,999 | 0 | 0.0% |
| $25,000 to $34,999 | 10 | 2.3% |
| $35,000 to $49,999 | 6 | 1.4% |
| $50,000 to $74,999 | 48 | 11.2% |
| $75,000 to $99,999 | 87 | 20.3% |
| $100,000 to $149,999 | 89 | 20.7% |
| $150,000 to $199,999 | 21 | 4.9% |
| $200,000+ | 159 | 37.1% |
Household Income by Householder Age in Kittredge
The median household income in Kittredge is $143,147, with the highest median household income of $220,595 found in the 45 to 64 years age bracket for the primary householder. A total of 200 households (46.6%) fall into this category.
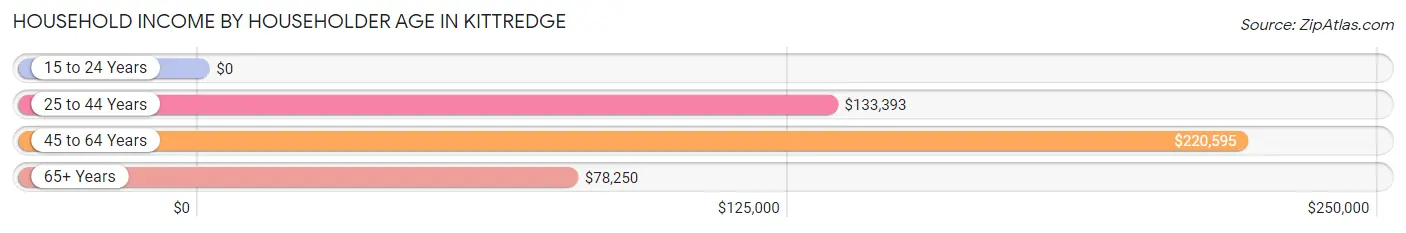
| Income Bracket | # Households | Median Income |
| 15 to 24 Years | 0 (0.0%) | $0 |
| 25 to 44 Years | 160 (37.3%) | $133,393 |
| 45 to 64 Years | 200 (46.6%) | $220,595 |
| 65+ Years | 69 (16.1%) | $78,250 |
| Total | 429 (100.0%) | $143,147 |
Poverty in Kittredge
Income Below Poverty by Sex and Age in Kittredge
With 12.0% poverty level for males and 9.2% for females among the residents of Kittredge, 15 year old males and 75 year old and over females are the most vulnerable to poverty, with 23 males (100.0%) and 9 females (42.9%) in their respective age groups living below the poverty level.
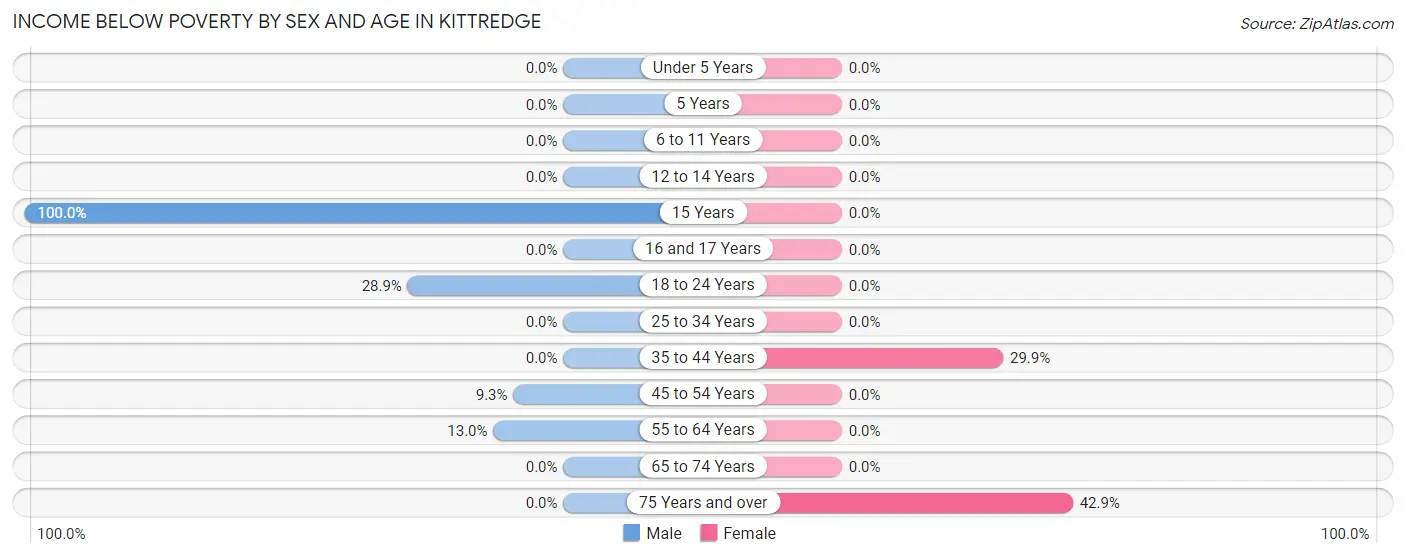
| Age Bracket | Male | Female |
| Under 5 Years | 0 (0.0%) | 0 (0.0%) |
| 5 Years | 0 (0.0%) | 0 (0.0%) |
| 6 to 11 Years | 0 (0.0%) | 0 (0.0%) |
| 12 to 14 Years | 0 (0.0%) | 0 (0.0%) |
| 15 Years | 23 (100.0%) | 0 (0.0%) |
| 16 and 17 Years | 0 (0.0%) | 0 (0.0%) |
| 18 to 24 Years | 13 (28.9%) | 0 (0.0%) |
| 25 to 34 Years | 0 (0.0%) | 0 (0.0%) |
| 35 to 44 Years | 0 (0.0%) | 41 (29.9%) |
| 45 to 54 Years | 9 (9.3%) | 0 (0.0%) |
| 55 to 64 Years | 10 (13.0%) | 0 (0.0%) |
| 65 to 74 Years | 0 (0.0%) | 0 (0.0%) |
| 75 Years and over | 0 (0.0%) | 9 (42.9%) |
| Total | 55 (12.0%) | 50 (9.2%) |
Income Above Poverty by Sex and Age in Kittredge
According to the poverty statistics in Kittredge, males aged under 5 years and females aged under 5 years are the age groups that are most secure financially, with 100.0% of males and 100.0% of females in these age groups living above the poverty line.
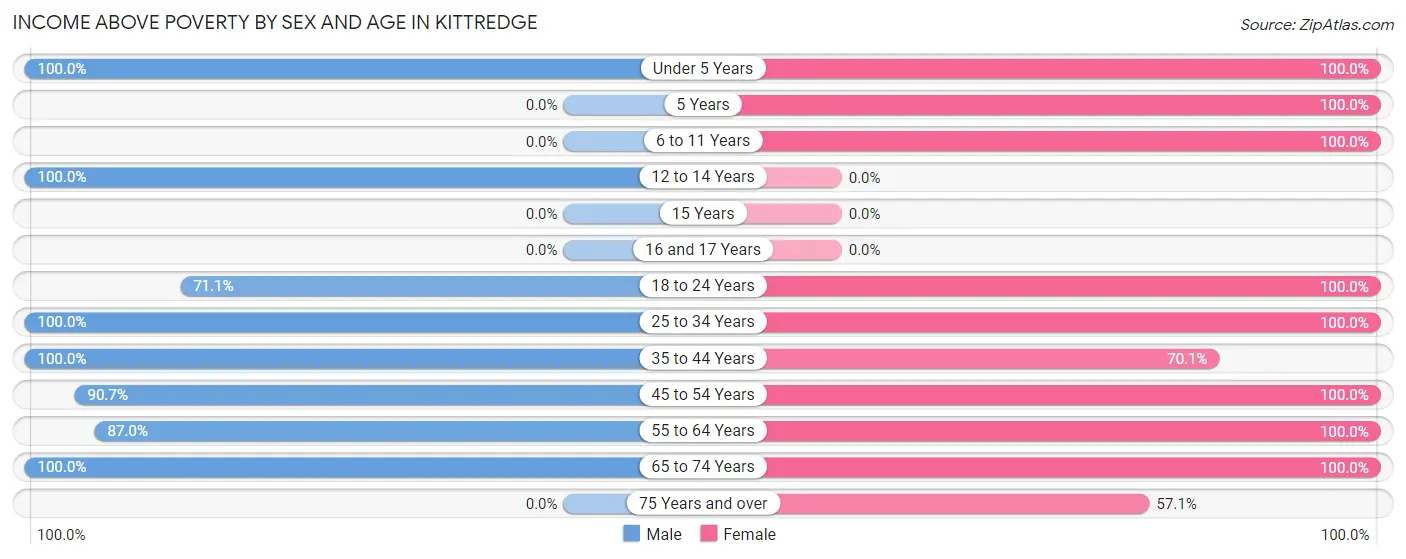
| Age Bracket | Male | Female |
| Under 5 Years | 7 (100.0%) | 49 (100.0%) |
| 5 Years | 0 (0.0%) | 9 (100.0%) |
| 6 to 11 Years | 0 (0.0%) | 54 (100.0%) |
| 12 to 14 Years | 27 (100.0%) | 0 (0.0%) |
| 15 Years | 0 (0.0%) | 0 (0.0%) |
| 16 and 17 Years | 0 (0.0%) | 0 (0.0%) |
| 18 to 24 Years | 32 (71.1%) | 31 (100.0%) |
| 25 to 34 Years | 73 (100.0%) | 73 (100.0%) |
| 35 to 44 Years | 90 (100.0%) | 96 (70.1%) |
| 45 to 54 Years | 88 (90.7%) | 22 (100.0%) |
| 55 to 64 Years | 67 (87.0%) | 85 (100.0%) |
| 65 to 74 Years | 21 (100.0%) | 60 (100.0%) |
| 75 Years and over | 0 (0.0%) | 12 (57.1%) |
| Total | 405 (88.0%) | 491 (90.8%) |
Income Below Poverty Among Married-Couple Families in Kittredge
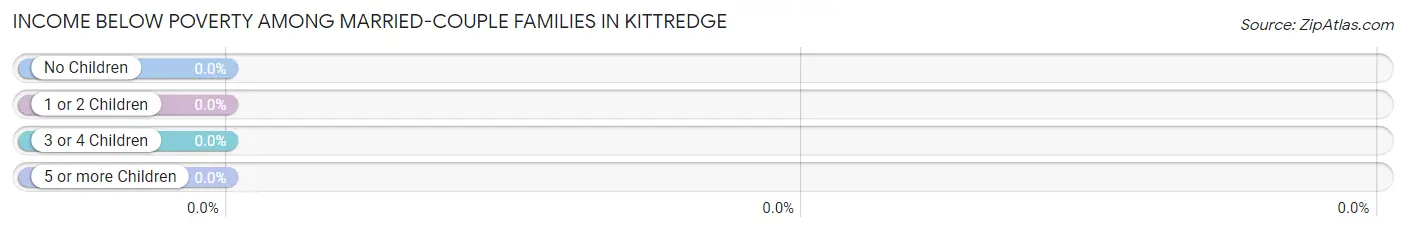
| Children | Above Poverty | Below Poverty |
| No Children | 86 (100.0%) | 0 (0.0%) |
| 1 or 2 Children | 87 (100.0%) | 0 (0.0%) |
| 3 or 4 Children | 0 (0.0%) | 0 (0.0%) |
| 5 or more Children | 0 (0.0%) | 0 (0.0%) |
| Total | 173 (100.0%) | 0 (0.0%) |
Income Below Poverty Among Single-Parent Households in Kittredge
| Children | Single Father | Single Mother |
| No Children | 0 (0.0%) | 0 (0.0%) |
| 1 or 2 Children | 0 (0.0%) | 0 (0.0%) |
| 3 or 4 Children | 0 (0.0%) | 0 (0.0%) |
| 5 or more Children | 0 (0.0%) | 0 (0.0%) |
| Total | 0 (0.0%) | 0 (0.0%) |
Income Below Poverty Among Married-Couple vs Single-Parent Households in Kittredge
| Children | Married-Couple Families | Single-Parent Households |
| No Children | 0 (0.0%) | 0 (0.0%) |
| 1 or 2 Children | 0 (0.0%) | 0 (0.0%) |
| 3 or 4 Children | 0 (0.0%) | 0 (0.0%) |
| 5 or more Children | 0 (0.0%) | 0 (0.0%) |
| Total | 0 (0.0%) | 0 (0.0%) |
Race in Kittredge
The most populous races in Kittredge are White / Caucasian (956 | 93.6%), Hispanic or Latino (124 | 12.1%), and Two or more Races (56 | 5.5%).
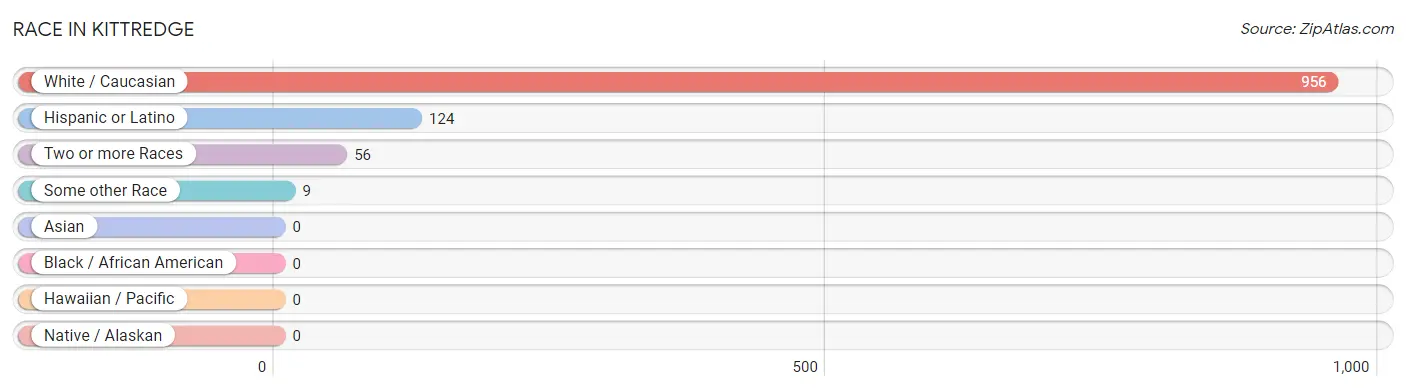
| Race | # Population | % Population |
| Asian | 0 | 0.0% |
| Black / African American | 0 | 0.0% |
| Hawaiian / Pacific | 0 | 0.0% |
| Hispanic or Latino | 124 | 12.1% |
| Native / Alaskan | 0 | 0.0% |
| White / Caucasian | 956 | 93.6% |
| Two or more Races | 56 | 5.5% |
| Some other Race | 9 | 0.9% |
| Total | 1,021 | 100.0% |
Ancestry in Kittredge
The most populous ancestries reported in Kittredge are Irish (106 | 10.4%), German (101 | 9.9%), English (95 | 9.3%), South American (66 | 6.5%), and American (53 | 5.2%), together accounting for 41.2% of all Kittredge residents.
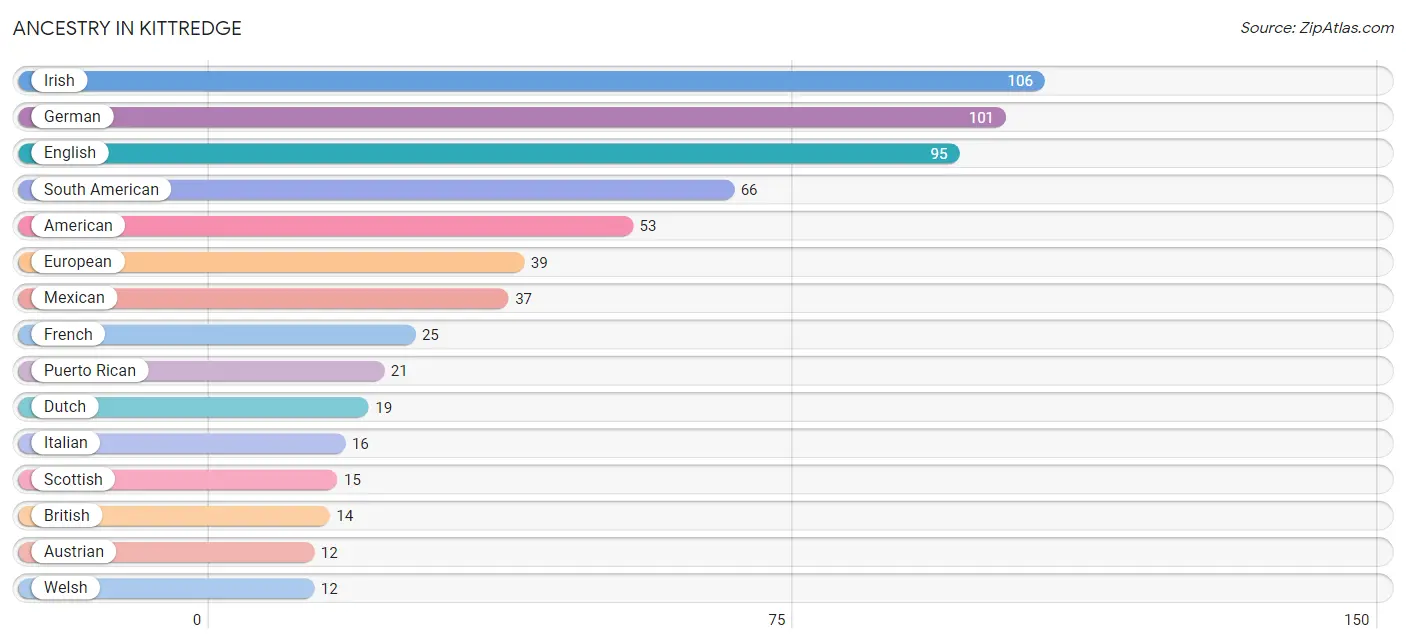
| Ancestry | # Population | % Population |
| American | 53 | 5.2% |
| Austrian | 12 | 1.2% |
| British | 14 | 1.4% |
| Danish | 7 | 0.7% |
| Dutch | 19 | 1.9% |
| English | 95 | 9.3% |
| European | 39 | 3.8% |
| Finnish | 9 | 0.9% |
| French | 25 | 2.5% |
| German | 101 | 9.9% |
| Irish | 106 | 10.4% |
| Italian | 16 | 1.6% |
| Mexican | 37 | 3.6% |
| Norwegian | 8 | 0.8% |
| Polish | 8 | 0.8% |
| Puerto Rican | 21 | 2.1% |
| Scottish | 15 | 1.5% |
| South American | 66 | 6.5% |
| Swedish | 11 | 1.1% |
| Welsh | 12 | 1.2% | View All 20 Rows |
Immigrants in Kittredge
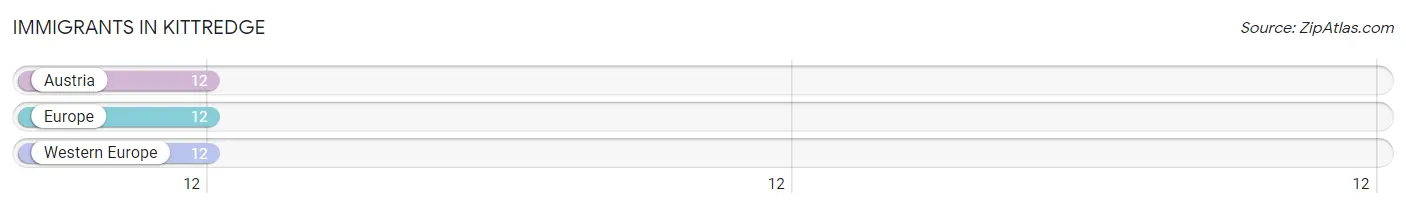
The most numerous immigrant groups reported in Kittredge came from Austria (12 | 1.2%), Europe (12 | 1.2%), and Western Europe (12 | 1.2%), together accounting for 3.5% of all Kittredge residents.
| Immigration Origin | # Population | % Population |
| Austria | 12 | 1.2% |
| Europe | 12 | 1.2% |
| Western Europe | 12 | 1.2% | View All 3 Rows |
Sex and Age in Kittredge
Sex and Age in Kittredge
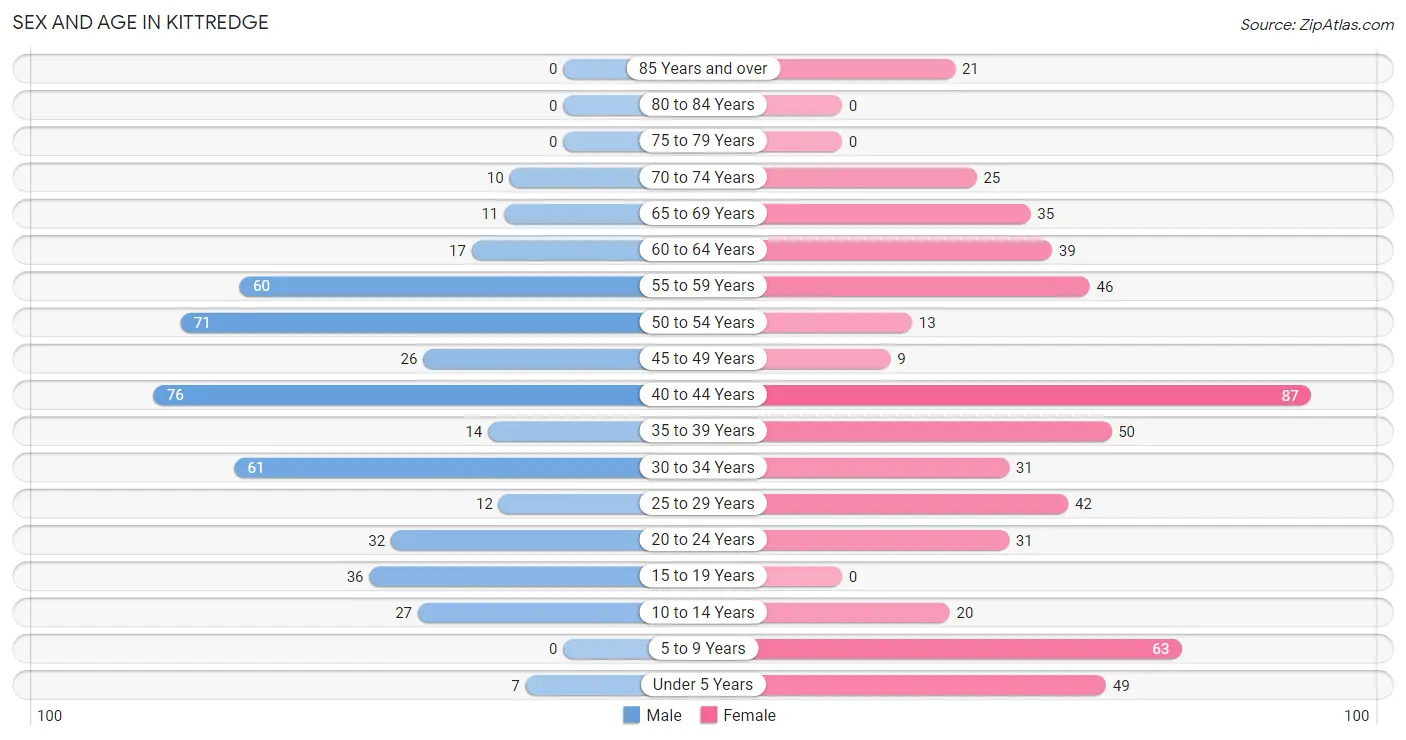
The most populous age groups in Kittredge are 40 to 44 Years (76 | 16.5%) for men and 40 to 44 Years (87 | 15.5%) for women.
| Age Bracket | Male | Female |
| Under 5 Years | 7 (1.5%) | 49 (8.7%) |
| 5 to 9 Years | 0 (0.0%) | 63 (11.2%) |
| 10 to 14 Years | 27 (5.9%) | 20 (3.6%) |
| 15 to 19 Years | 36 (7.8%) | 0 (0.0%) |
| 20 to 24 Years | 32 (7.0%) | 31 (5.5%) |
| 25 to 29 Years | 12 (2.6%) | 42 (7.5%) |
| 30 to 34 Years | 61 (13.3%) | 31 (5.5%) |
| 35 to 39 Years | 14 (3.0%) | 50 (8.9%) |
| 40 to 44 Years | 76 (16.5%) | 87 (15.5%) |
| 45 to 49 Years | 26 (5.7%) | 9 (1.6%) |
| 50 to 54 Years | 71 (15.4%) | 13 (2.3%) |
| 55 to 59 Years | 60 (13.0%) | 46 (8.2%) |
| 60 to 64 Years | 17 (3.7%) | 39 (7.0%) |
| 65 to 69 Years | 11 (2.4%) | 35 (6.2%) |
| 70 to 74 Years | 10 (2.2%) | 25 (4.5%) |
| 75 to 79 Years | 0 (0.0%) | 0 (0.0%) |
| 80 to 84 Years | 0 (0.0%) | 0 (0.0%) |
| 85 Years and over | 0 (0.0%) | 21 (3.7%) |
| Total | 460 (100.0%) | 561 (100.0%) |
Families and Households in Kittredge
Median Family Size in Kittredge
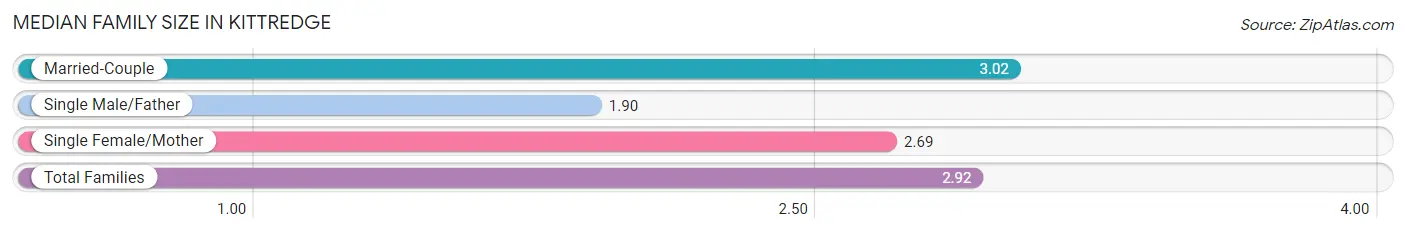
The median family size in Kittredge is 2.92 persons per family, with married-couple families (173 | 80.5%) accounting for the largest median family size of 3.02 persons per family. On the other hand, single male/father families (10 | 4.6%) represent the smallest median family size with 1.90 persons per family.
| Family Type | # Families | Family Size |
| Married-Couple | 173 (80.5%) | 3.02 |
| Single Male/Father | 10 (4.6%) | 1.90 |
| Single Female/Mother | 32 (14.9%) | 2.69 |
| Total Families | 215 (100.0%) | 2.92 |
Median Household Size in Kittredge
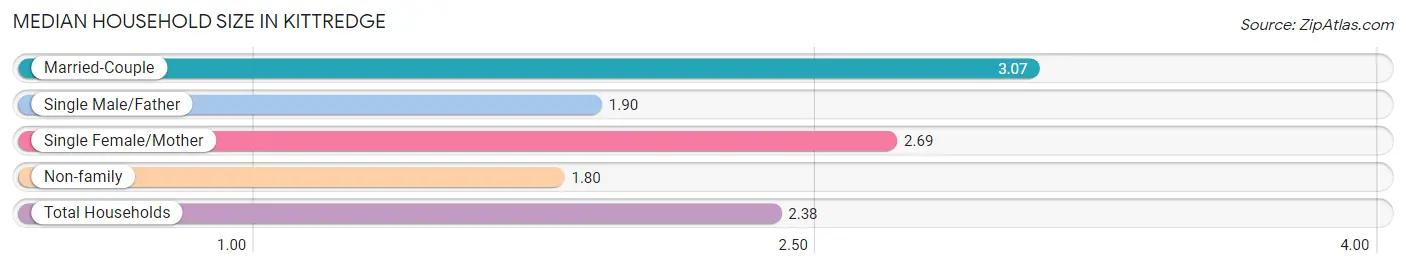
The median household size in Kittredge is 2.38 persons per household, with married-couple households (173 | 40.3%) accounting for the largest median household size of 3.07 persons per household. non-family households (214 | 49.9%) represent the smallest median household size with 1.80 persons per household.
| Household Type | # Households | Household Size |
| Married-Couple | 173 (40.3%) | 3.07 |
| Single Male/Father | 10 (2.3%) | 1.90 |
| Single Female/Mother | 32 (7.5%) | 2.69 |
| Non-family | 214 (49.9%) | 1.80 |
| Total Households | 429 (100.0%) | 2.38 |
Household Size by Marriage Status in Kittredge
Out of a total of 429 households in Kittredge, 215 (50.1%) are family households, while 214 (49.9%) are nonfamily households. The most numerous type of family households are 2-person households, comprising 94, and the most common type of nonfamily households are 1-person households, comprising 111.
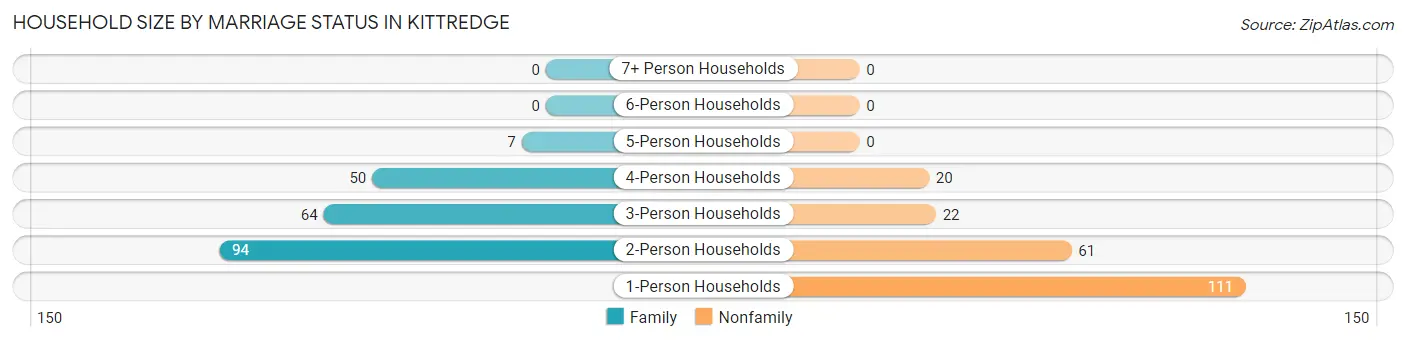
| Household Size | Family Households | Nonfamily Households |
| 1-Person Households | - | 111 (25.9%) |
| 2-Person Households | 94 (21.9%) | 61 (14.2%) |
| 3-Person Households | 64 (14.9%) | 22 (5.1%) |
| 4-Person Households | 50 (11.7%) | 20 (4.7%) |
| 5-Person Households | 7 (1.6%) | 0 (0.0%) |
| 6-Person Households | 0 (0.0%) | 0 (0.0%) |
| 7+ Person Households | 0 (0.0%) | 0 (0.0%) |
| Total | 215 (50.1%) | 214 (49.9%) |
Female Fertility in Kittredge
Fertility by Age in Kittredge
Average fertility rate in Kittredge is 160.0 births per 1,000 women. Women in the age bracket of 20 to 34 years have the highest fertility rate with 385.0 births per 1,000 women. Women in the age bracket of 20 to 34 years acount for 100.0% of all women with births.
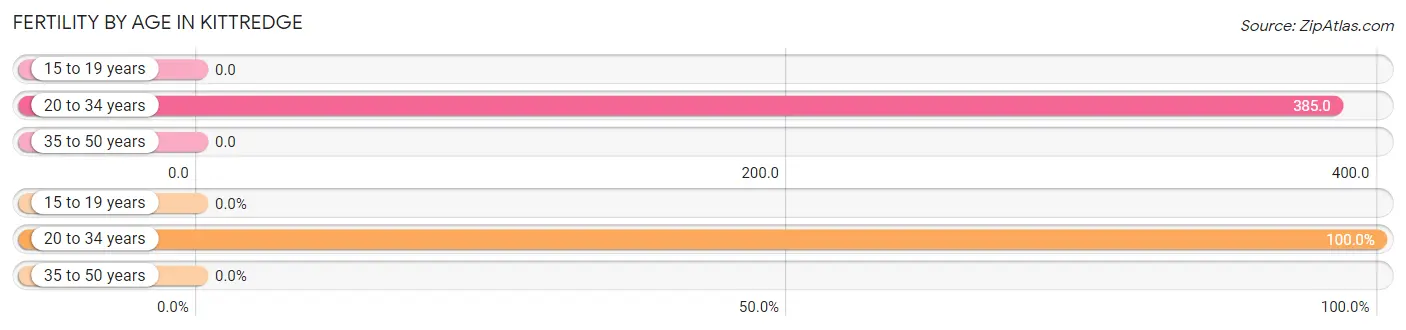
| Age Bracket | Women with Births | Births / 1,000 Women |
| 15 to 19 years | 0 (0.0%) | 0.0 |
| 20 to 34 years | 40 (100.0%) | 385.0 |
| 35 to 50 years | 0 (0.0%) | 0.0 |
| Total | 40 (100.0%) | 160.0 |
Fertility by Age by Marriage Status in Kittredge
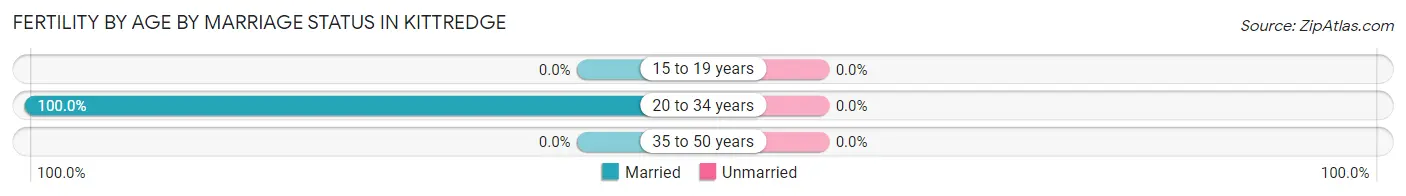
| Age Bracket | Married | Unmarried |
| 15 to 19 years | 0 (0.0%) | 0 (0.0%) |
| 20 to 34 years | 40 (100.0%) | 0 (0.0%) |
| 35 to 50 years | 0 (0.0%) | 0 (0.0%) |
| Total | 40 (100.0%) | 0 (0.0%) |
Fertility by Education in Kittredge
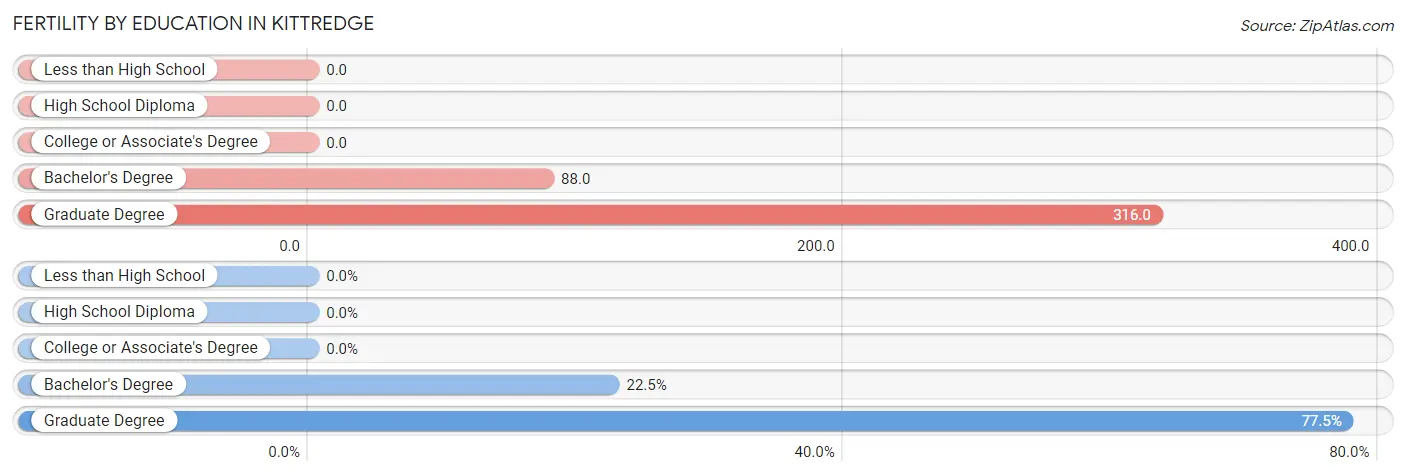
| Educational Attainment | Women with Births | Births / 1,000 Women |
| Less than High School | 0 (0.0%) | 0.0 |
| High School Diploma | 0 (0.0%) | 0.0 |
| College or Associate's Degree | 0 (0.0%) | 0.0 |
| Bachelor's Degree | 9 (22.5%) | 88.0 |
| Graduate Degree | 31 (77.5%) | 316.0 |
| Total | 40 (100.0%) | 160.0 |
Fertility by Education by Marriage Status in Kittredge
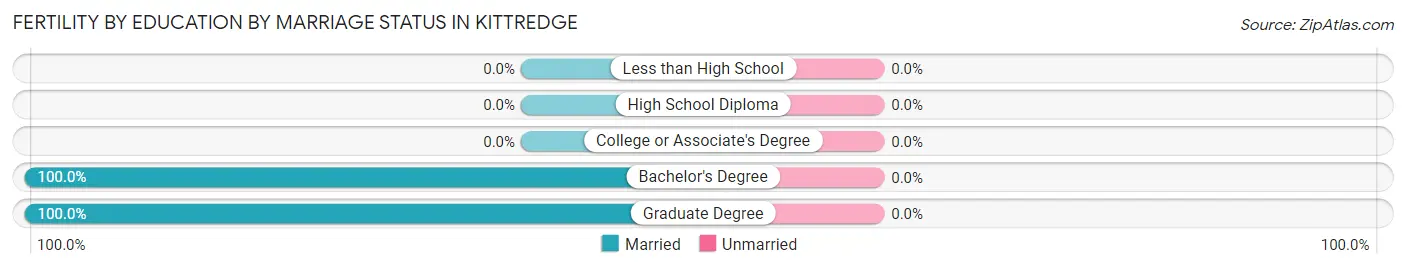
| Educational Attainment | Married | Unmarried |
| Less than High School | 0 (0.0%) | 0 (0.0%) |
| High School Diploma | 0 (0.0%) | 0 (0.0%) |
| College or Associate's Degree | 0 (0.0%) | 0 (0.0%) |
| Bachelor's Degree | 9 (100.0%) | 0 (0.0%) |
| Graduate Degree | 31 (100.0%) | 0 (0.0%) |
| Total | 40 (100.0%) | 0 (0.0%) |
Employment Characteristics in Kittredge
Employment by Class of Employer in Kittredge
Among the 671 employed individuals in Kittredge, private company employees (419 | 62.4%), self-employed (not incorporated) (78 | 11.6%), and local government employees (74 | 11.0%) make up the most common classes of employment.
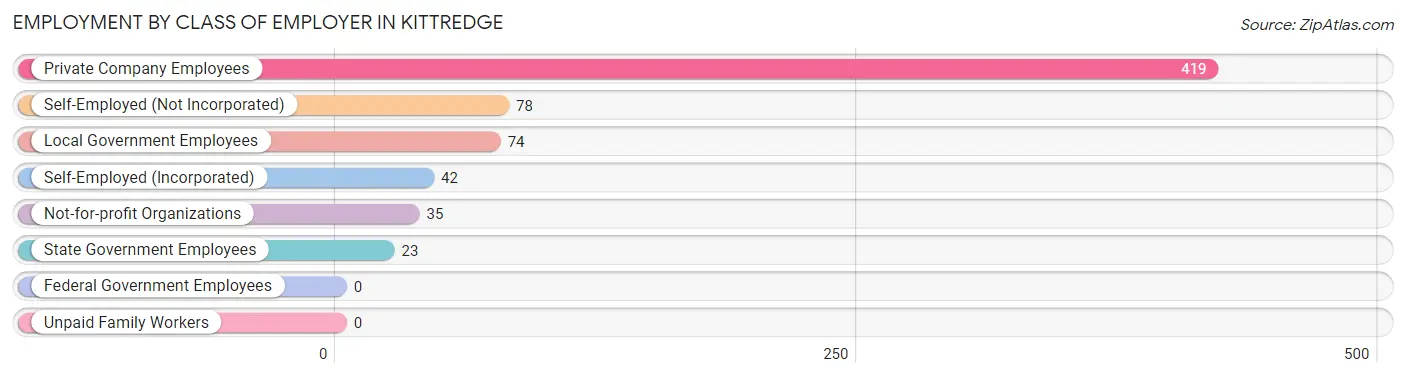
| Employer Class | # Employees | % Employees |
| Private Company Employees | 419 | 62.4% |
| Self-Employed (Incorporated) | 42 | 6.3% |
| Self-Employed (Not Incorporated) | 78 | 11.6% |
| Not-for-profit Organizations | 35 | 5.2% |
| Local Government Employees | 74 | 11.0% |
| State Government Employees | 23 | 3.4% |
| Federal Government Employees | 0 | 0.0% |
| Unpaid Family Workers | 0 | 0.0% |
| Total | 671 | 100.0% |
Employment Status by Age in Kittredge
According to the labor force statistics for Kittredge, out of the total population over 16 years of age (832), 84.7% or 705 individuals are in the labor force, with 4.8% or 34 of them unemployed. The age group with the highest labor force participation rate is 20 to 24 years, with 100.0% or 63 individuals in the labor force. Within the labor force, the 55 to 59 years age range has the highest percentage of unemployed individuals, with 23.6% or 21 of them being unemployed.
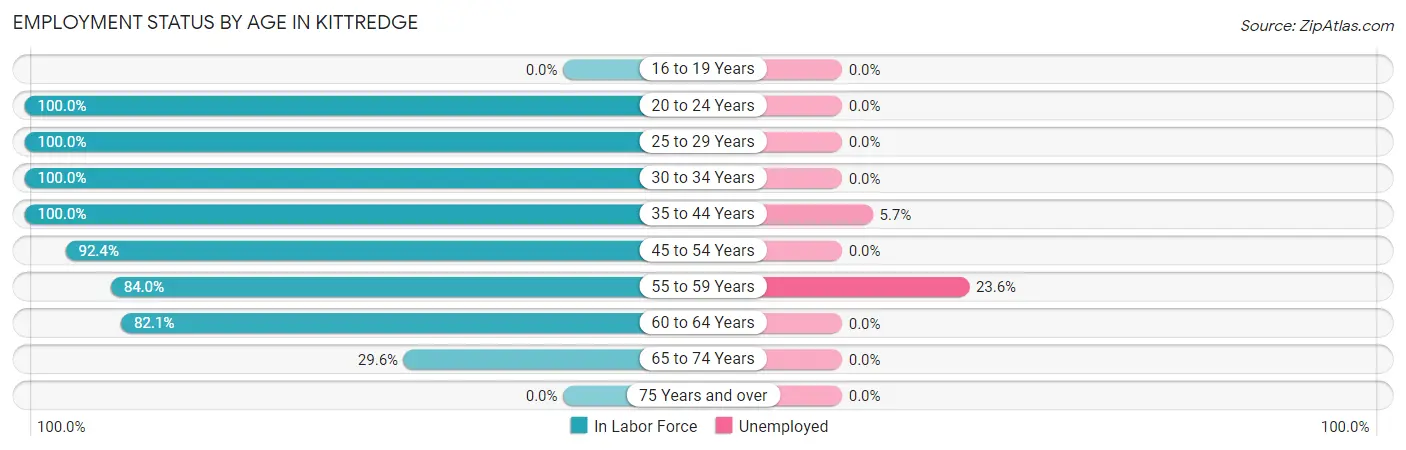
| Age Bracket | In Labor Force | Unemployed |
| 16 to 19 Years | 0 (0.0%) | 0 (0.0%) |
| 20 to 24 Years | 63 (100.0%) | 0 (0.0%) |
| 25 to 29 Years | 54 (100.0%) | 0 (0.0%) |
| 30 to 34 Years | 92 (100.0%) | 0 (0.0%) |
| 35 to 44 Years | 227 (100.0%) | 13 (5.7%) |
| 45 to 54 Years | 110 (92.4%) | 0 (0.0%) |
| 55 to 59 Years | 89 (84.0%) | 21 (23.6%) |
| 60 to 64 Years | 46 (82.1%) | 0 (0.0%) |
| 65 to 74 Years | 24 (29.6%) | 0 (0.0%) |
| 75 Years and over | 0 (0.0%) | 0 (0.0%) |
| Total | 705 (84.7%) | 34 (4.8%) |
Employment Status by Educational Attainment in Kittredge
According to labor force statistics for Kittredge, 94.5% of individuals (618) out of the total population between 25 and 64 years of age (654) are in the labor force, with 5.5% or 34 of them being unemployed. The group with the highest labor force participation rate are those with the educational attainment of high school diploma, with 100.0% or 119 individuals in the labor force. Within the labor force, individuals with college / associate degree education have the highest percentage of unemployment, with 27.6% or 21 of them being unemployed.
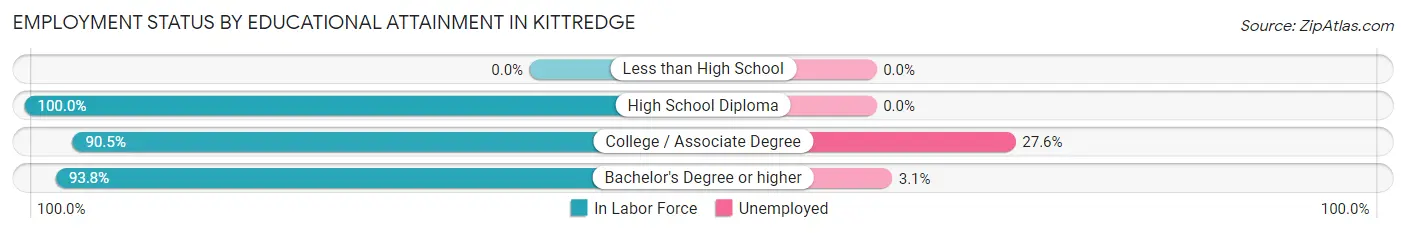
| Educational Attainment | In Labor Force | Unemployed |
| Less than High School | 0 (0.0%) | 0 (0.0%) |
| High School Diploma | 119 (100.0%) | 0 (0.0%) |
| College / Associate Degree | 76 (90.5%) | 23 (27.6%) |
| Bachelor's Degree or higher | 423 (93.8%) | 14 (3.1%) |
| Total | 618 (94.5%) | 36 (5.5%) |
Employment Occupations by Sex in Kittredge
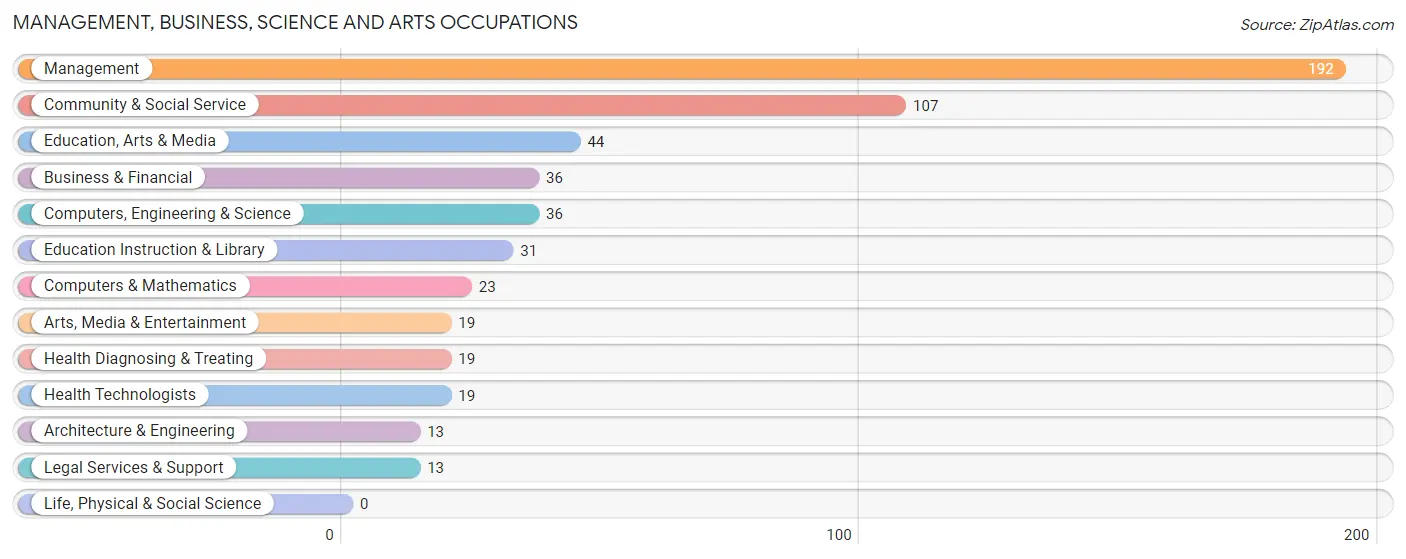
Management, Business, Science and Arts Occupations
The most common Management, Business, Science and Arts occupations in Kittredge are Management (192 | 28.6%), Community & Social Service (107 | 16.0%), Education, Arts & Media (44 | 6.6%), Business & Financial (36 | 5.4%), and Computers, Engineering & Science (36 | 5.4%).
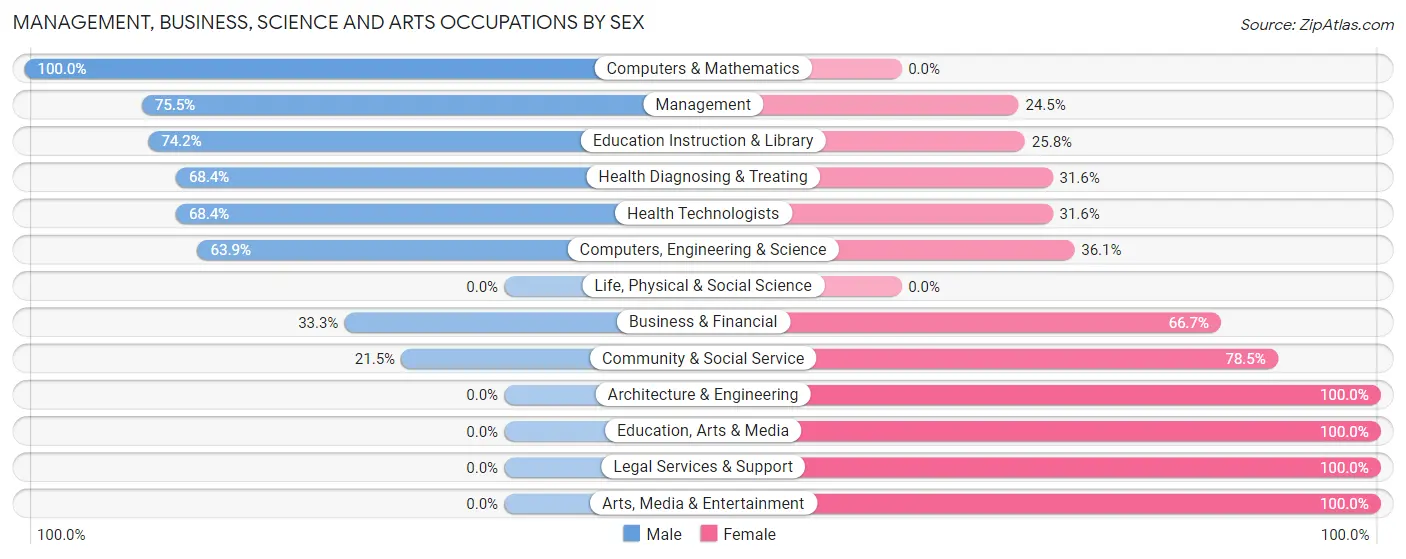
Management, Business, Science and Arts Occupations by Sex
Within the Management, Business, Science and Arts occupations in Kittredge, the most male-oriented occupations are Computers & Mathematics (100.0%), Management (75.5%), and Education Instruction & Library (74.2%), while the most female-oriented occupations are Architecture & Engineering (100.0%), Education, Arts & Media (100.0%), and Legal Services & Support (100.0%).
| Occupation | Male | Female |
| Management | 145 (75.5%) | 47 (24.5%) |
| Business & Financial | 12 (33.3%) | 24 (66.7%) |
| Computers, Engineering & Science | 23 (63.9%) | 13 (36.1%) |
| Computers & Mathematics | 23 (100.0%) | 0 (0.0%) |
| Architecture & Engineering | 0 (0.0%) | 13 (100.0%) |
| Life, Physical & Social Science | 0 (0.0%) | 0 (0.0%) |
| Community & Social Service | 23 (21.5%) | 84 (78.5%) |
| Education, Arts & Media | 0 (0.0%) | 44 (100.0%) |
| Legal Services & Support | 0 (0.0%) | 13 (100.0%) |
| Education Instruction & Library | 23 (74.2%) | 8 (25.8%) |
| Arts, Media & Entertainment | 0 (0.0%) | 19 (100.0%) |
| Health Diagnosing & Treating | 13 (68.4%) | 6 (31.6%) |
| Health Technologists | 13 (68.4%) | 6 (31.6%) |
| Total (Category) | 216 (55.4%) | 174 (44.6%) |
| Total (Overall) | 350 (52.2%) | 321 (47.8%) |
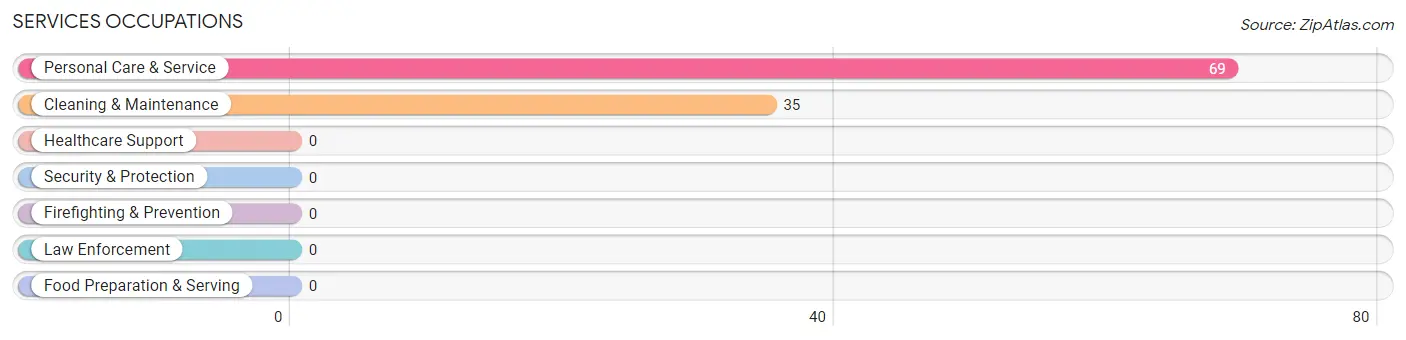
Services Occupations
The most common Services occupations in Kittredge are Personal Care & Service (69 | 10.3%), and Cleaning & Maintenance (35 | 5.2%).
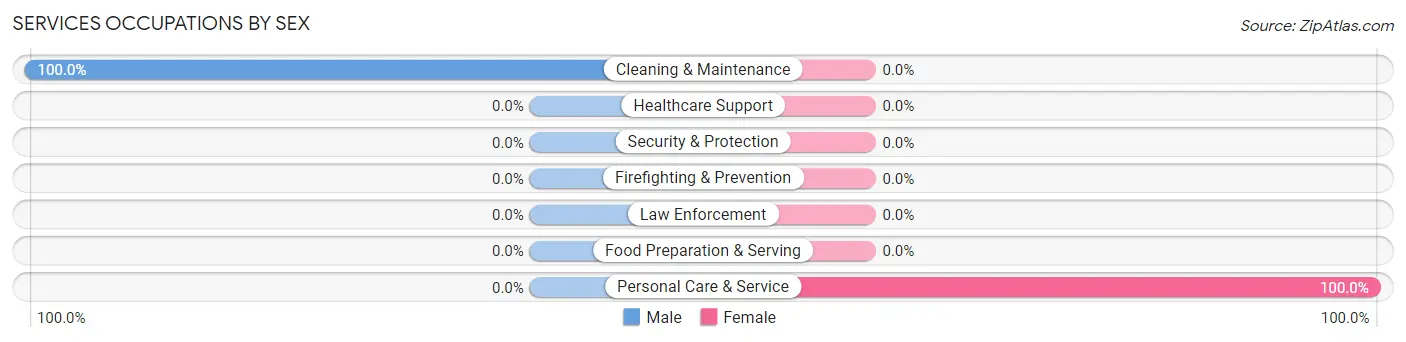
Services Occupations by Sex
| Occupation | Male | Female |
| Healthcare Support | 0 (0.0%) | 0 (0.0%) |
| Security & Protection | 0 (0.0%) | 0 (0.0%) |
| Firefighting & Prevention | 0 (0.0%) | 0 (0.0%) |
| Law Enforcement | 0 (0.0%) | 0 (0.0%) |
| Food Preparation & Serving | 0 (0.0%) | 0 (0.0%) |
| Cleaning & Maintenance | 35 (100.0%) | 0 (0.0%) |
| Personal Care & Service | 0 (0.0%) | 69 (100.0%) |
| Total (Category) | 35 (33.7%) | 69 (66.3%) |
| Total (Overall) | 350 (52.2%) | 321 (47.8%) |
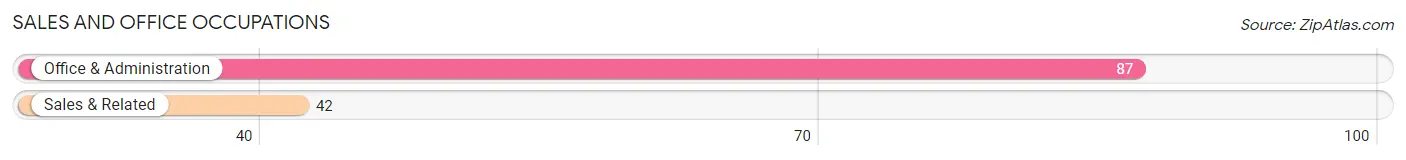
Sales and Office Occupations
The most common Sales and Office occupations in Kittredge are Office & Administration (87 | 13.0%), and Sales & Related (42 | 6.3%).
Sales and Office Occupations by Sex
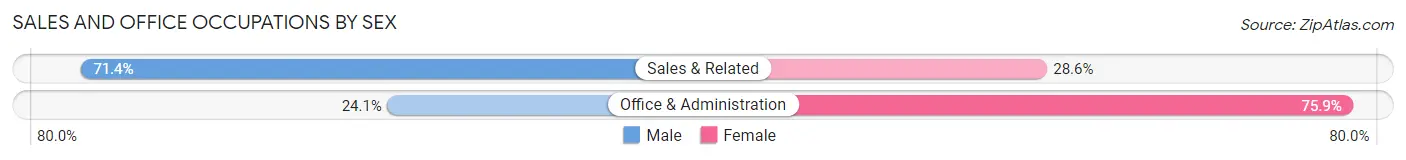
| Occupation | Male | Female |
| Sales & Related | 30 (71.4%) | 12 (28.6%) |
| Office & Administration | 21 (24.1%) | 66 (75.9%) |
| Total (Category) | 51 (39.5%) | 78 (60.5%) |
| Total (Overall) | 350 (52.2%) | 321 (47.8%) |
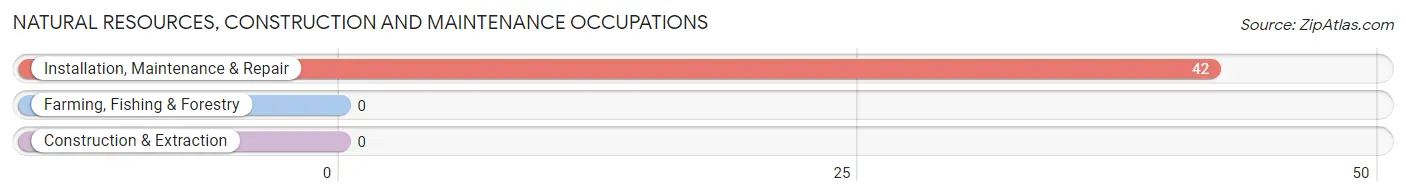
Natural Resources, Construction and Maintenance Occupations
The most common Natural Resources, Construction and Maintenance occupations in Kittredge are , and Installation, Maintenance & Repair (42 | 6.3%).
Natural Resources, Construction and Maintenance Occupations by Sex
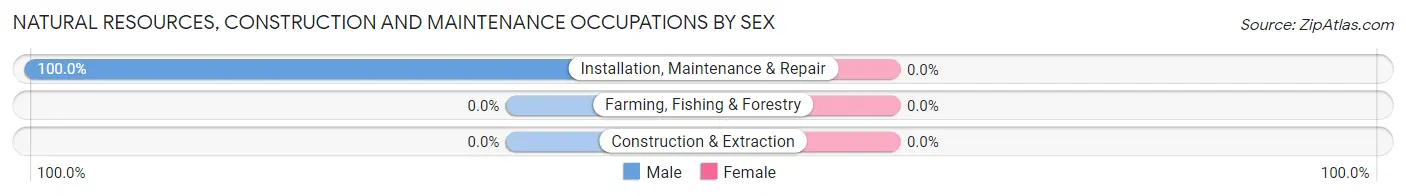
| Occupation | Male | Female |
| Farming, Fishing & Forestry | 0 (0.0%) | 0 (0.0%) |
| Construction & Extraction | 0 (0.0%) | 0 (0.0%) |
| Installation, Maintenance & Repair | 42 (100.0%) | 0 (0.0%) |
| Total (Category) | 42 (100.0%) | 0 (0.0%) |
| Total (Overall) | 350 (52.2%) | 321 (47.8%) |
Production, Transportation and Moving Occupations
The most common Production, Transportation and Moving occupations in Kittredge are , and Transportation (6 | 0.9%).
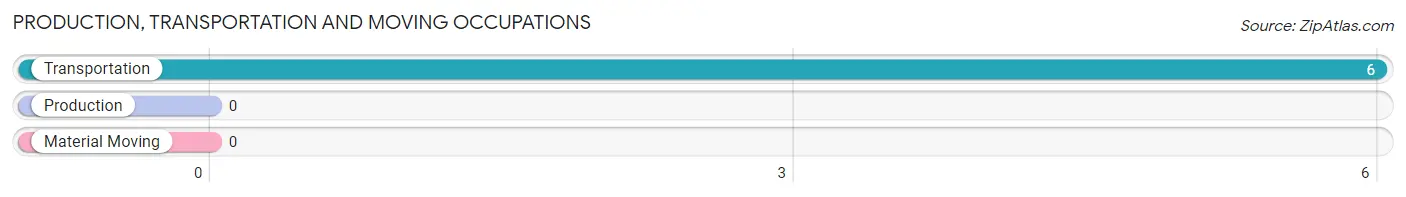
Production, Transportation and Moving Occupations by Sex
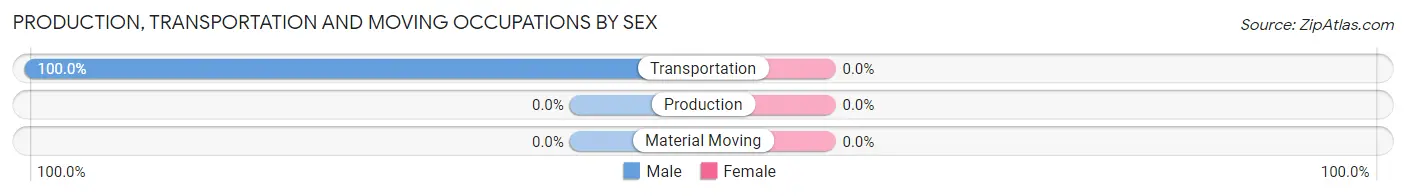
| Occupation | Male | Female |
| Production | 0 (0.0%) | 0 (0.0%) |
| Transportation | 6 (100.0%) | 0 (0.0%) |
| Material Moving | 0 (0.0%) | 0 (0.0%) |
| Total (Category) | 6 (100.0%) | 0 (0.0%) |
| Total (Overall) | 350 (52.2%) | 321 (47.8%) |
Employment Industries by Sex in Kittredge
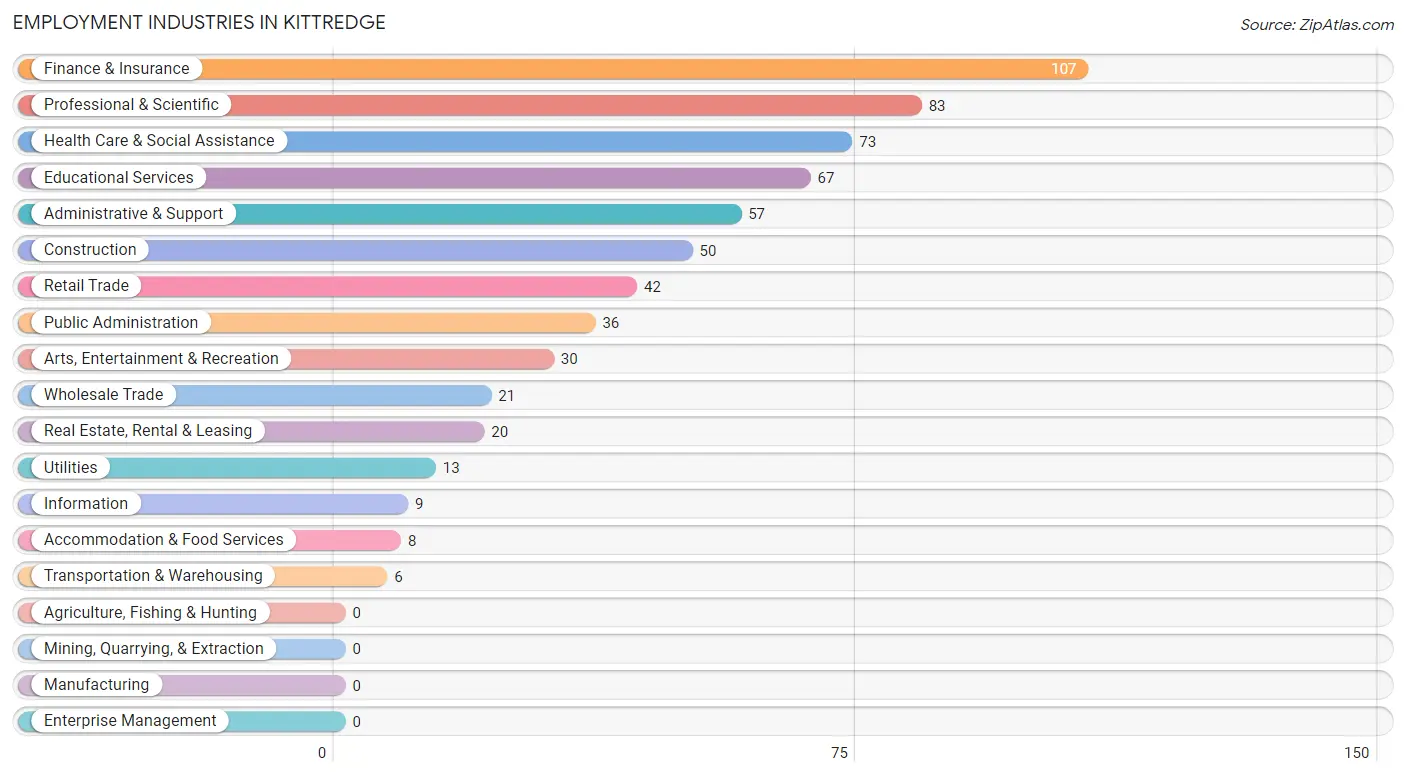
Employment Industries in Kittredge
The major employment industries in Kittredge include Finance & Insurance (107 | 16.0%), Professional & Scientific (83 | 12.4%), Health Care & Social Assistance (73 | 10.9%), Educational Services (67 | 10.0%), and Administrative & Support (57 | 8.5%).
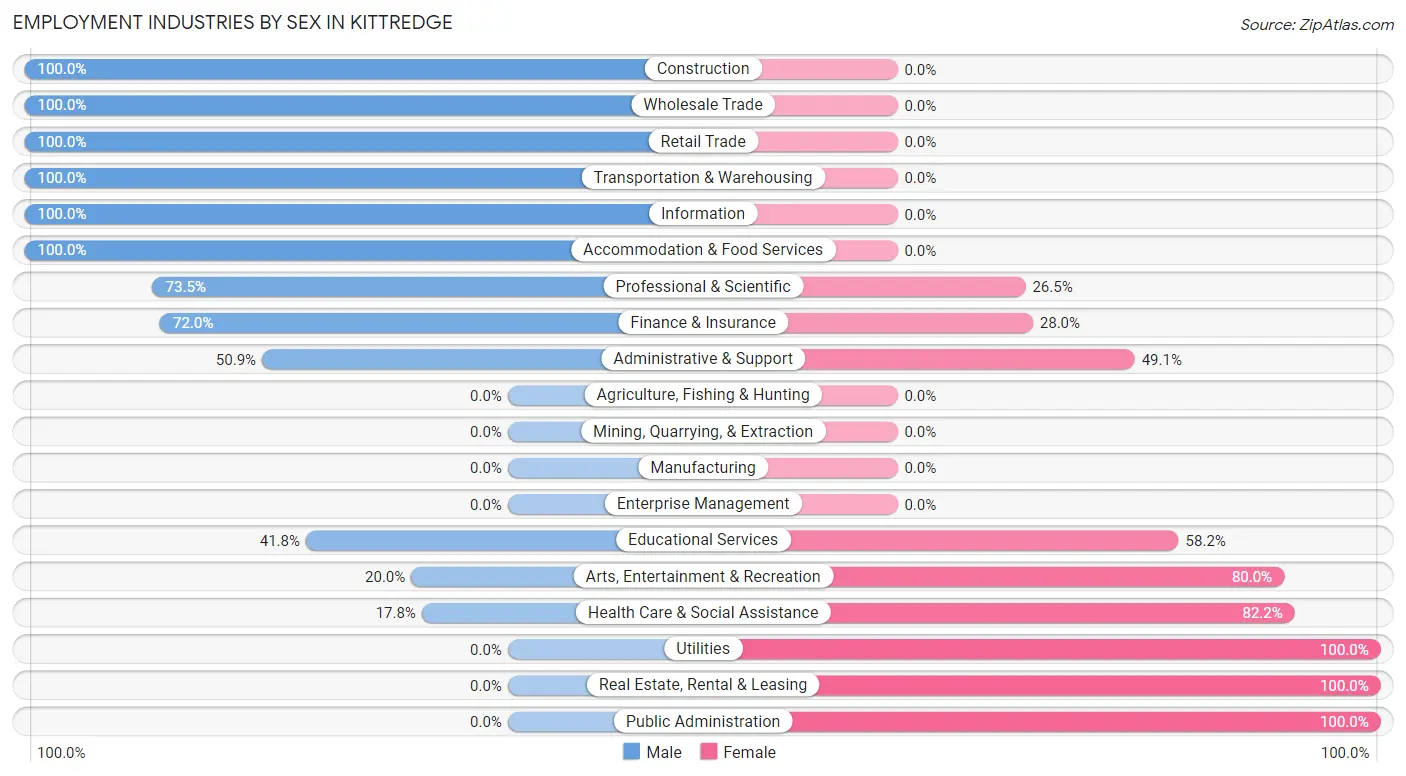
Employment Industries by Sex in Kittredge
The Kittredge industries that see more men than women are Construction (100.0%), Wholesale Trade (100.0%), and Retail Trade (100.0%), whereas the industries that tend to have a higher number of women are Utilities (100.0%), Real Estate, Rental & Leasing (100.0%), and Public Administration (100.0%).
| Industry | Male | Female |
| Agriculture, Fishing & Hunting | 0 (0.0%) | 0 (0.0%) |
| Mining, Quarrying, & Extraction | 0 (0.0%) | 0 (0.0%) |
| Construction | 50 (100.0%) | 0 (0.0%) |
| Manufacturing | 0 (0.0%) | 0 (0.0%) |
| Wholesale Trade | 21 (100.0%) | 0 (0.0%) |
| Retail Trade | 42 (100.0%) | 0 (0.0%) |
| Transportation & Warehousing | 6 (100.0%) | 0 (0.0%) |
| Utilities | 0 (0.0%) | 13 (100.0%) |
| Information | 9 (100.0%) | 0 (0.0%) |
| Finance & Insurance | 77 (72.0%) | 30 (28.0%) |
| Real Estate, Rental & Leasing | 0 (0.0%) | 20 (100.0%) |
| Professional & Scientific | 61 (73.5%) | 22 (26.5%) |
| Enterprise Management | 0 (0.0%) | 0 (0.0%) |
| Administrative & Support | 29 (50.9%) | 28 (49.1%) |
| Educational Services | 28 (41.8%) | 39 (58.2%) |
| Health Care & Social Assistance | 13 (17.8%) | 60 (82.2%) |
| Arts, Entertainment & Recreation | 6 (20.0%) | 24 (80.0%) |
| Accommodation & Food Services | 8 (100.0%) | 0 (0.0%) |
| Public Administration | 0 (0.0%) | 36 (100.0%) |
| Total | 350 (52.2%) | 321 (47.8%) |
Education in Kittredge
School Enrollment in Kittredge
The most common levels of schooling among the 217 students in Kittredge are college / undergraduate (60 | 27.7%), kindergarten (50 | 23.0%), and middle school (47 | 21.7%).
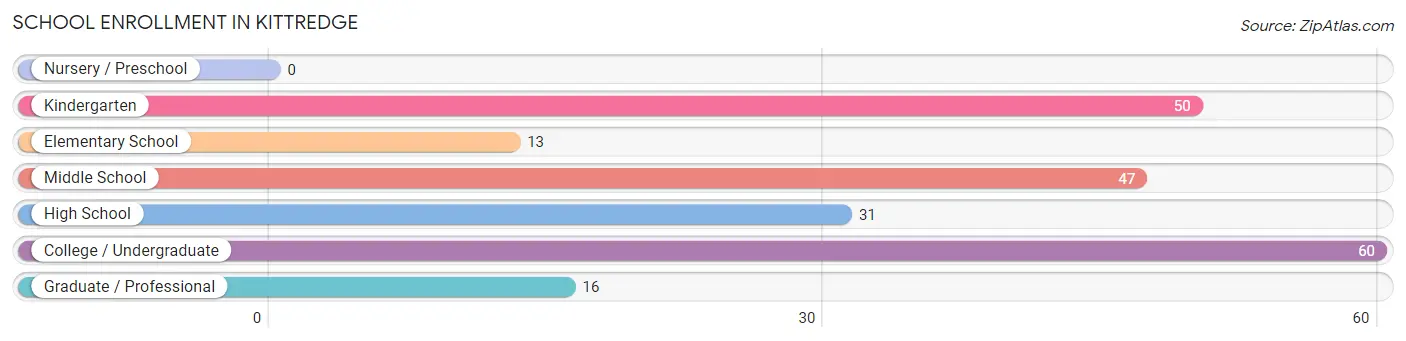
| School Level | # Students | % Students |
| Nursery / Preschool | 0 | 0.0% |
| Kindergarten | 50 | 23.0% |
| Elementary School | 13 | 6.0% |
| Middle School | 47 | 21.7% |
| High School | 31 | 14.3% |
| College / Undergraduate | 60 | 27.7% |
| Graduate / Professional | 16 | 7.4% |
| Total | 217 | 100.0% |
School Enrollment by Age by Funding Source in Kittredge
Out of a total of 217 students who are enrolled in schools in Kittredge, 63 (29.0%) attend a private institution, while the remaining 154 (71.0%) are enrolled in public schools. The age group of 10 to 14 year olds has the highest likelihood of being enrolled in private schools, with 27 (57.5% in the age bracket) enrolled. Conversely, the age group of 15 to 17 year olds has the lowest likelihood of being enrolled in a private school, with 23 (100.0% in the age bracket) attending a public institution.
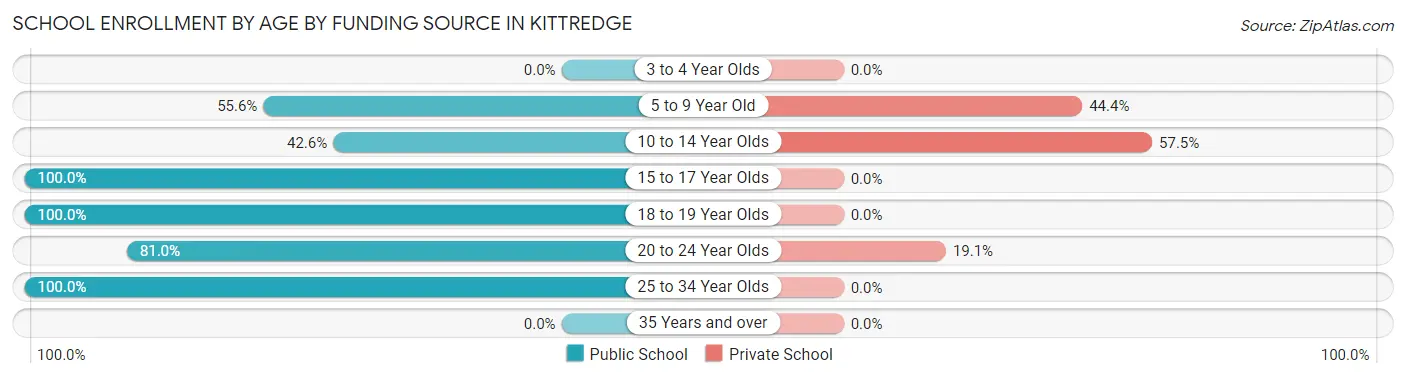
| Age Bracket | Public School | Private School |
| 3 to 4 Year Olds | 0 (0.0%) | 0 (0.0%) |
| 5 to 9 Year Old | 35 (55.6%) | 28 (44.4%) |
| 10 to 14 Year Olds | 20 (42.5%) | 27 (57.5%) |
| 15 to 17 Year Olds | 23 (100.0%) | 0 (0.0%) |
| 18 to 19 Year Olds | 13 (100.0%) | 0 (0.0%) |
| 20 to 24 Year Olds | 34 (80.9%) | 8 (19.1%) |
| 25 to 34 Year Olds | 29 (100.0%) | 0 (0.0%) |
| 35 Years and over | 0 (0.0%) | 0 (0.0%) |
| Total | 154 (71.0%) | 63 (29.0%) |
Educational Attainment by Field of Study in Kittredge
Business (103 | 18.4%), visual & performing arts (51 | 9.1%), bio, nature & agricultural (50 | 8.9%), arts & humanities (46 | 8.2%), and engineering (45 | 8.0%) are the most common fields of study among 561 individuals in Kittredge who have obtained a bachelor's degree or higher.
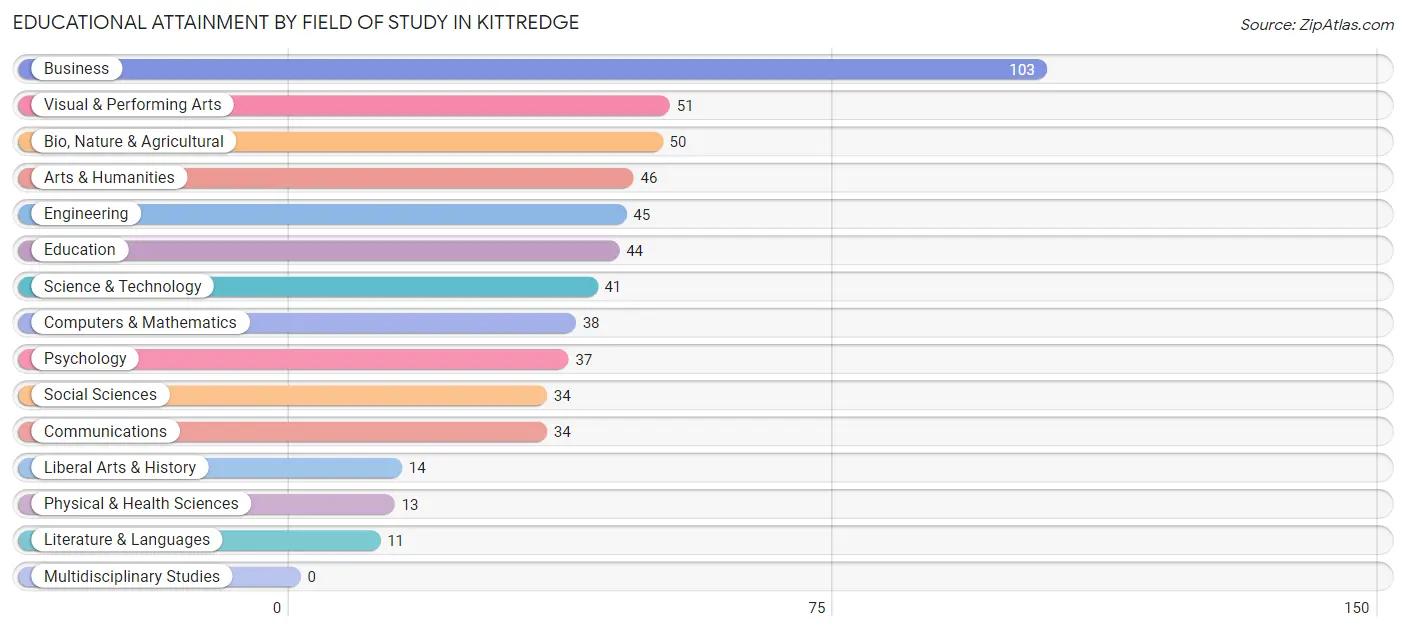
| Field of Study | # Graduates | % Graduates |
| Computers & Mathematics | 38 | 6.8% |
| Bio, Nature & Agricultural | 50 | 8.9% |
| Physical & Health Sciences | 13 | 2.3% |
| Psychology | 37 | 6.6% |
| Social Sciences | 34 | 6.1% |
| Engineering | 45 | 8.0% |
| Multidisciplinary Studies | 0 | 0.0% |
| Science & Technology | 41 | 7.3% |
| Business | 103 | 18.4% |
| Education | 44 | 7.8% |
| Literature & Languages | 11 | 2.0% |
| Liberal Arts & History | 14 | 2.5% |
| Visual & Performing Arts | 51 | 9.1% |
| Communications | 34 | 6.1% |
| Arts & Humanities | 46 | 8.2% |
| Total | 561 | 100.0% |
Transportation & Commute in Kittredge
Vehicle Availability by Sex in Kittredge
The most prevalent vehicle ownership categories in Kittredge are males with 2 vehicles (203, accounting for 58.0%) and females with 2 vehicles (167, making up 63.2%).
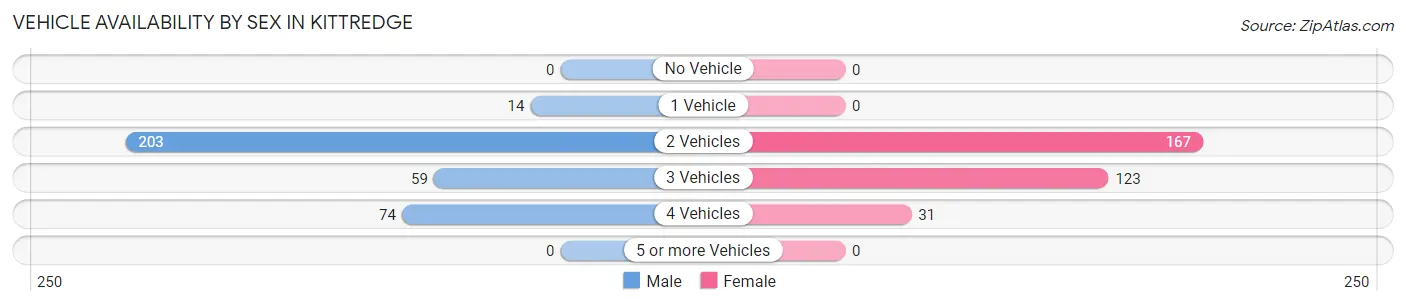
| Vehicles Available | Male | Female |
| No Vehicle | 0 (0.0%) | 0 (0.0%) |
| 1 Vehicle | 14 (4.0%) | 0 (0.0%) |
| 2 Vehicles | 203 (58.0%) | 167 (52.0%) |
| 3 Vehicles | 59 (16.9%) | 123 (38.3%) |
| 4 Vehicles | 74 (21.1%) | 31 (9.7%) |
| 5 or more Vehicles | 0 (0.0%) | 0 (0.0%) |
| Total | 350 (100.0%) | 321 (100.0%) |
Commute Time in Kittredge
The most frequently occuring commute durations in Kittredge are 60 to 89 minutes (219 commuters, 43.6%), 30 to 34 minutes (86 commuters, 17.1%), and 35 to 39 minutes (83 commuters, 16.5%).
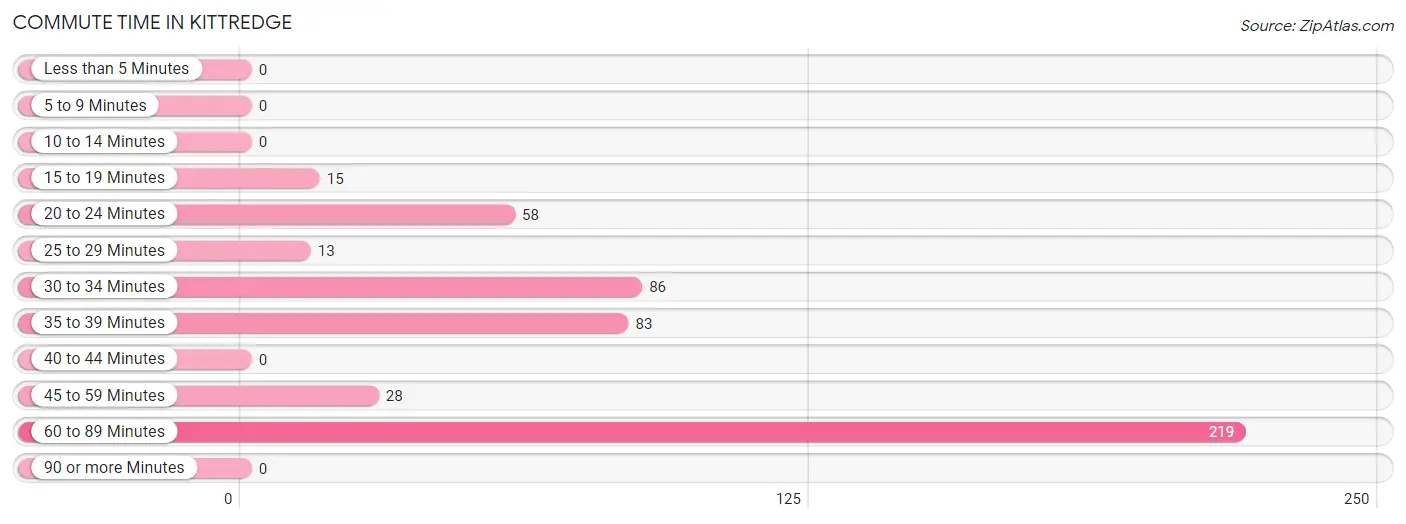
| Commute Time | # Commuters | % Commuters |
| Less than 5 Minutes | 0 | 0.0% |
| 5 to 9 Minutes | 0 | 0.0% |
| 10 to 14 Minutes | 0 | 0.0% |
| 15 to 19 Minutes | 15 | 3.0% |
| 20 to 24 Minutes | 58 | 11.6% |
| 25 to 29 Minutes | 13 | 2.6% |
| 30 to 34 Minutes | 86 | 17.1% |
| 35 to 39 Minutes | 83 | 16.5% |
| 40 to 44 Minutes | 0 | 0.0% |
| 45 to 59 Minutes | 28 | 5.6% |
| 60 to 89 Minutes | 219 | 43.6% |
| 90 or more Minutes | 0 | 0.0% |
Commute Time by Sex in Kittredge
The most common commute times in Kittredge are 60 to 89 minutes (88 commuters, 34.9%) for males and 60 to 89 minutes (131 commuters, 52.4%) for females.
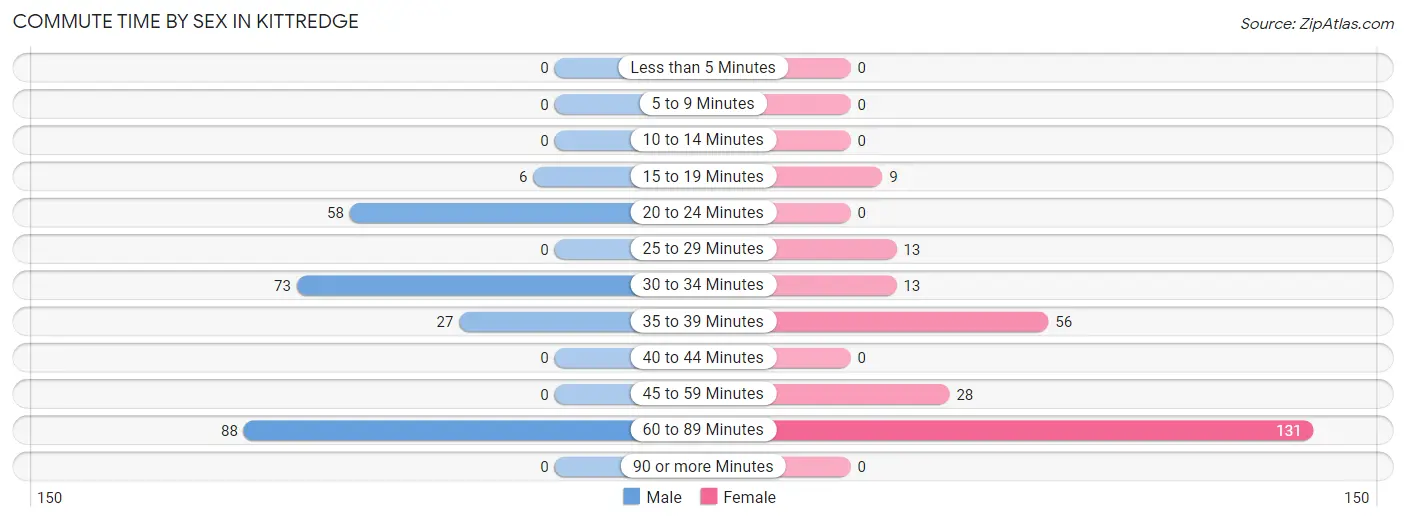
| Commute Time | Male | Female |
| Less than 5 Minutes | 0 (0.0%) | 0 (0.0%) |
| 5 to 9 Minutes | 0 (0.0%) | 0 (0.0%) |
| 10 to 14 Minutes | 0 (0.0%) | 0 (0.0%) |
| 15 to 19 Minutes | 6 (2.4%) | 9 (3.6%) |
| 20 to 24 Minutes | 58 (23.0%) | 0 (0.0%) |
| 25 to 29 Minutes | 0 (0.0%) | 13 (5.2%) |
| 30 to 34 Minutes | 73 (29.0%) | 13 (5.2%) |
| 35 to 39 Minutes | 27 (10.7%) | 56 (22.4%) |
| 40 to 44 Minutes | 0 (0.0%) | 0 (0.0%) |
| 45 to 59 Minutes | 0 (0.0%) | 28 (11.2%) |
| 60 to 89 Minutes | 88 (34.9%) | 131 (52.4%) |
| 90 or more Minutes | 0 (0.0%) | 0 (0.0%) |
Time of Departure to Work by Sex in Kittredge
The most frequent times of departure to work in Kittredge are 8:00 AM to 8:29 AM (116, 46.0%) for males and 7:00 AM to 7:29 AM (76, 30.4%) for females.
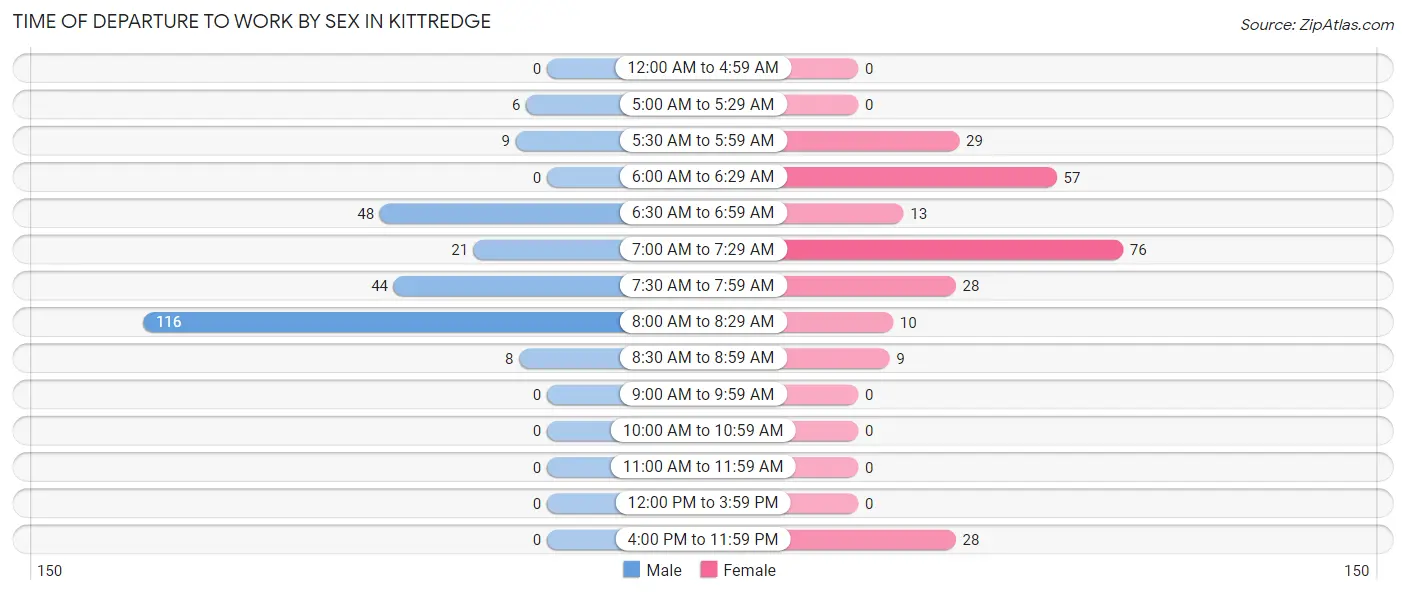
| Time of Departure | Male | Female |
| 12:00 AM to 4:59 AM | 0 (0.0%) | 0 (0.0%) |
| 5:00 AM to 5:29 AM | 6 (2.4%) | 0 (0.0%) |
| 5:30 AM to 5:59 AM | 9 (3.6%) | 29 (11.6%) |
| 6:00 AM to 6:29 AM | 0 (0.0%) | 57 (22.8%) |
| 6:30 AM to 6:59 AM | 48 (19.1%) | 13 (5.2%) |
| 7:00 AM to 7:29 AM | 21 (8.3%) | 76 (30.4%) |
| 7:30 AM to 7:59 AM | 44 (17.5%) | 28 (11.2%) |
| 8:00 AM to 8:29 AM | 116 (46.0%) | 10 (4.0%) |
| 8:30 AM to 8:59 AM | 8 (3.2%) | 9 (3.6%) |
| 9:00 AM to 9:59 AM | 0 (0.0%) | 0 (0.0%) |
| 10:00 AM to 10:59 AM | 0 (0.0%) | 0 (0.0%) |
| 11:00 AM to 11:59 AM | 0 (0.0%) | 0 (0.0%) |
| 12:00 PM to 3:59 PM | 0 (0.0%) | 0 (0.0%) |
| 4:00 PM to 11:59 PM | 0 (0.0%) | 28 (11.2%) |
| Total | 252 (100.0%) | 250 (100.0%) |
Housing Occupancy in Kittredge
Occupancy by Ownership in Kittredge
Of the total 429 dwellings in Kittredge, owner-occupied units account for 372 (86.7%), while renter-occupied units make up 57 (13.3%).
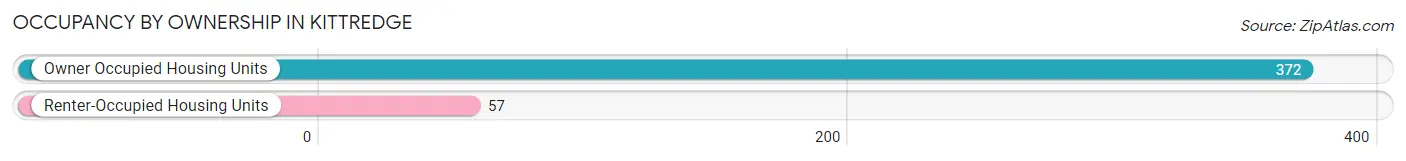
| Occupancy | # Housing Units | % Housing Units |
| Owner Occupied Housing Units | 372 | 86.7% |
| Renter-Occupied Housing Units | 57 | 13.3% |
| Total Occupied Housing Units | 429 | 100.0% |
Occupancy by Household Size in Kittredge
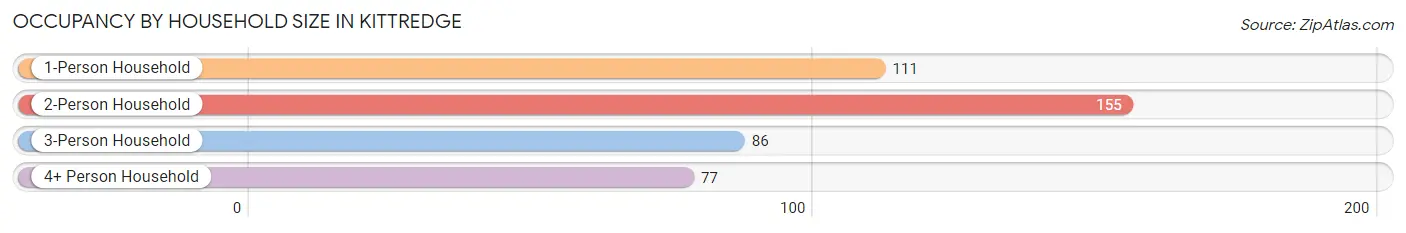
| Household Size | # Housing Units | % Housing Units |
| 1-Person Household | 111 | 25.9% |
| 2-Person Household | 155 | 36.1% |
| 3-Person Household | 86 | 20.1% |
| 4+ Person Household | 77 | 17.9% |
| Total Housing Units | 429 | 100.0% |
Occupancy by Ownership by Household Size in Kittredge
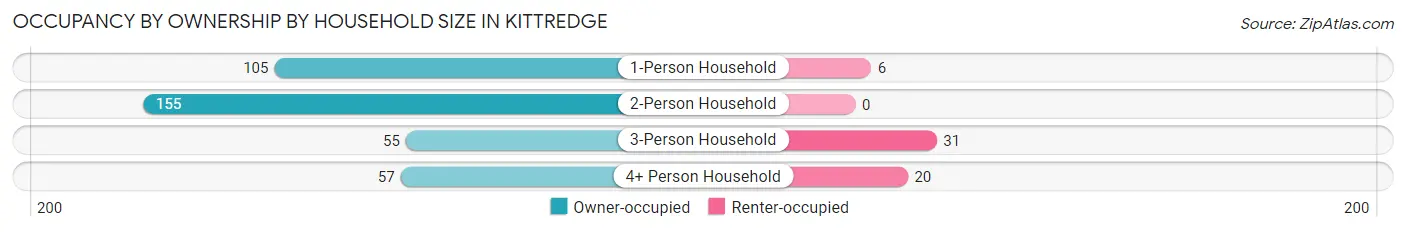
| Household Size | Owner-occupied | Renter-occupied |
| 1-Person Household | 105 (94.6%) | 6 (5.4%) |
| 2-Person Household | 155 (100.0%) | 0 (0.0%) |
| 3-Person Household | 55 (63.9%) | 31 (36.0%) |
| 4+ Person Household | 57 (74.0%) | 20 (26.0%) |
| Total Housing Units | 372 (86.7%) | 57 (13.3%) |
Occupancy by Educational Attainment in Kittredge
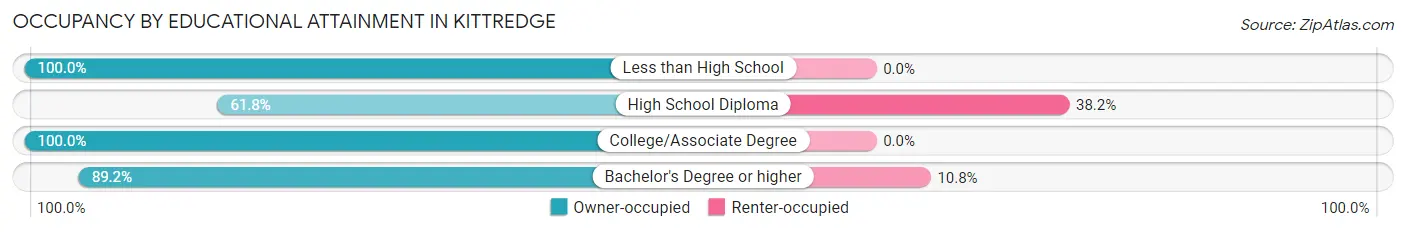
| Household Size | Owner-occupied | Renter-occupied |
| Less than High School | 9 (100.0%) | 0 (0.0%) |
| High School Diploma | 42 (61.8%) | 26 (38.2%) |
| College/Associate Degree | 64 (100.0%) | 0 (0.0%) |
| Bachelor's Degree or higher | 257 (89.2%) | 31 (10.8%) |
Occupancy by Age of Householder in Kittredge
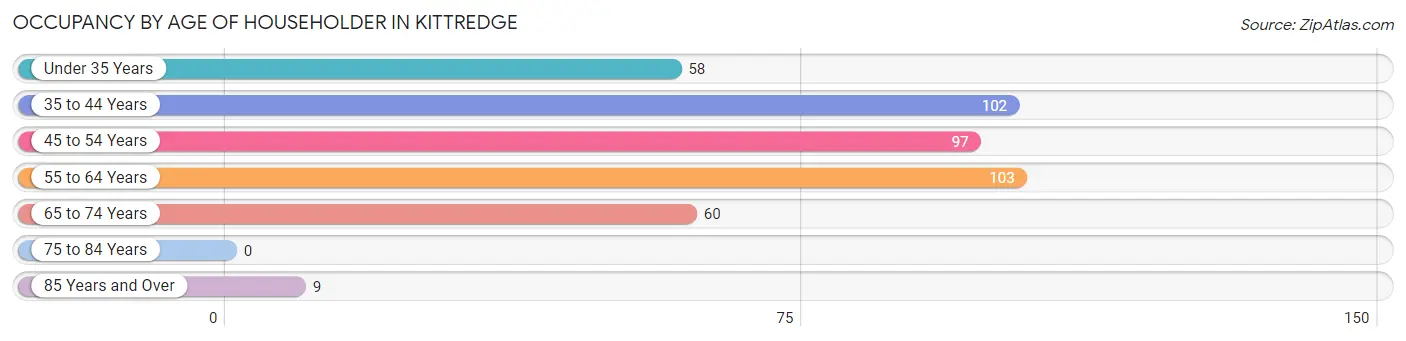
| Age Bracket | # Households | % Households |
| Under 35 Years | 58 | 13.5% |
| 35 to 44 Years | 102 | 23.8% |
| 45 to 54 Years | 97 | 22.6% |
| 55 to 64 Years | 103 | 24.0% |
| 65 to 74 Years | 60 | 14.0% |
| 75 to 84 Years | 0 | 0.0% |
| 85 Years and Over | 9 | 2.1% |
| Total | 429 | 100.0% |
Housing Finances in Kittredge
Median Income by Occupancy in Kittredge
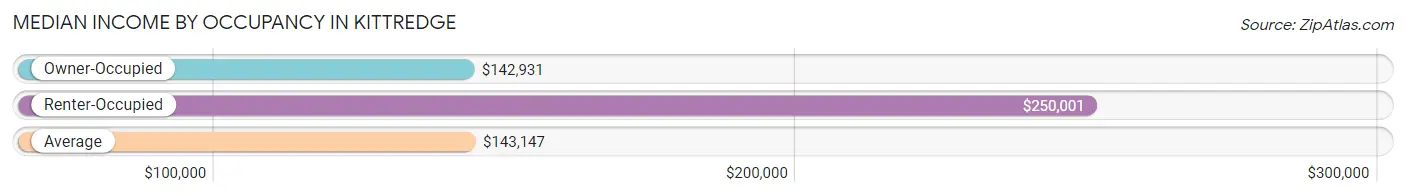
| Occupancy Type | # Households | Median Income |
| Owner-Occupied | 372 (86.7%) | $142,931 |
| Renter-Occupied | 57 (13.3%) | $250,001 |
| Average | 429 (100.0%) | $143,147 |
Occupancy by Householder Income Bracket in Kittredge
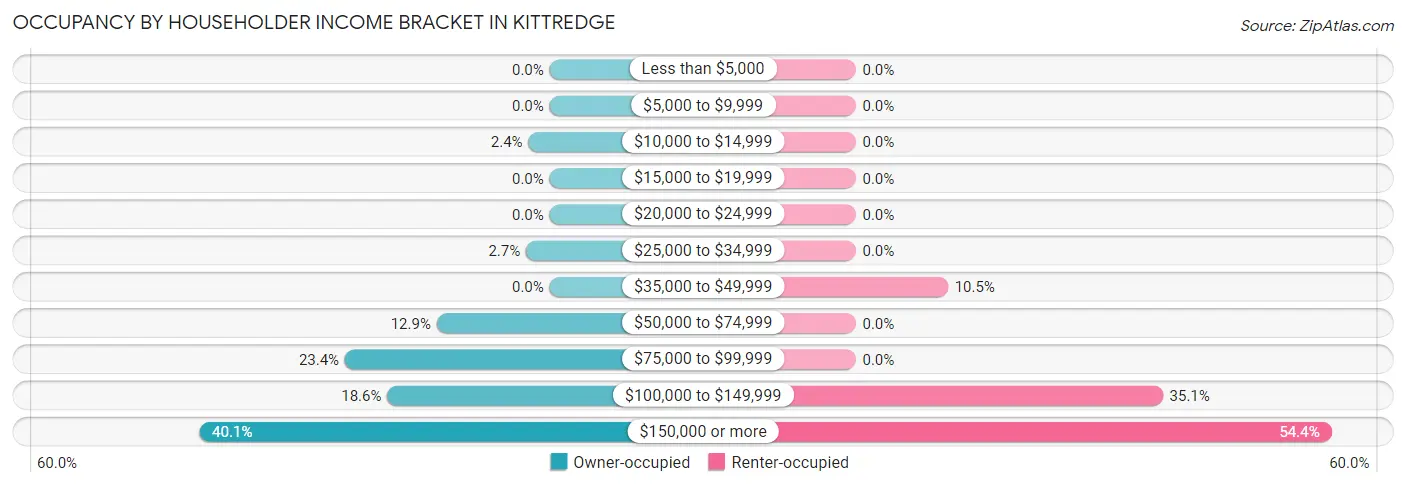
| Income Bracket | Owner-occupied | Renter-occupied |
| Less than $5,000 | 0 (0.0%) | 0 (0.0%) |
| $5,000 to $9,999 | 0 (0.0%) | 0 (0.0%) |
| $10,000 to $14,999 | 9 (2.4%) | 0 (0.0%) |
| $15,000 to $19,999 | 0 (0.0%) | 0 (0.0%) |
| $20,000 to $24,999 | 0 (0.0%) | 0 (0.0%) |
| $25,000 to $34,999 | 10 (2.7%) | 0 (0.0%) |
| $35,000 to $49,999 | 0 (0.0%) | 6 (10.5%) |
| $50,000 to $74,999 | 48 (12.9%) | 0 (0.0%) |
| $75,000 to $99,999 | 87 (23.4%) | 0 (0.0%) |
| $100,000 to $149,999 | 69 (18.5%) | 20 (35.1%) |
| $150,000 or more | 149 (40.1%) | 31 (54.4%) |
| Total | 372 (100.0%) | 57 (100.0%) |
Monthly Housing Cost Tiers in Kittredge
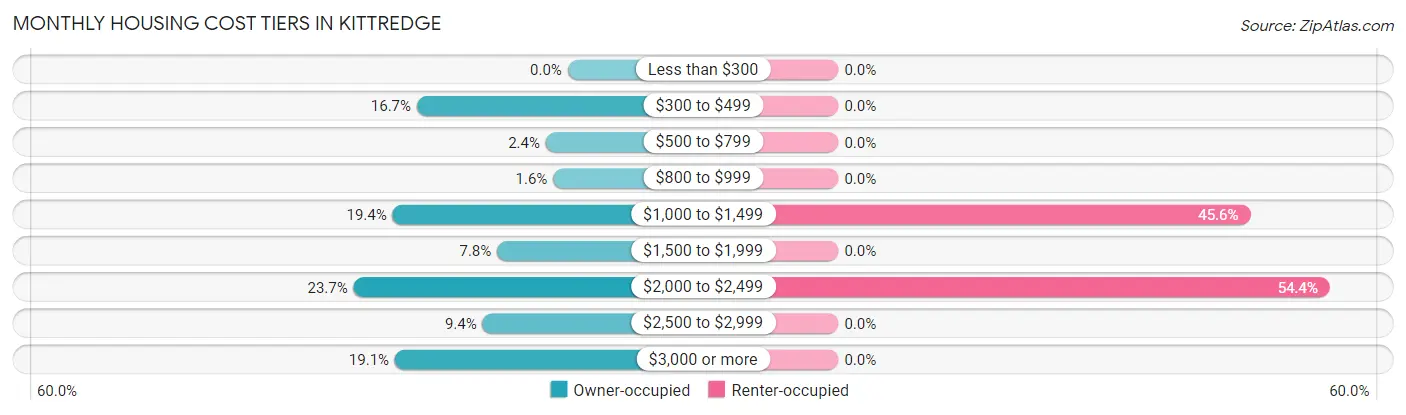
| Monthly Cost | Owner-occupied | Renter-occupied |
| Less than $300 | 0 (0.0%) | 0 (0.0%) |
| $300 to $499 | 62 (16.7%) | 0 (0.0%) |
| $500 to $799 | 9 (2.4%) | 0 (0.0%) |
| $800 to $999 | 6 (1.6%) | 0 (0.0%) |
| $1,000 to $1,499 | 72 (19.4%) | 26 (45.6%) |
| $1,500 to $1,999 | 29 (7.8%) | 0 (0.0%) |
| $2,000 to $2,499 | 88 (23.7%) | 31 (54.4%) |
| $2,500 to $2,999 | 35 (9.4%) | 0 (0.0%) |
| $3,000 or more | 71 (19.1%) | 0 (0.0%) |
| Total | 372 (100.0%) | 57 (100.0%) |
Physical Housing Characteristics in Kittredge
Housing Structures in Kittredge
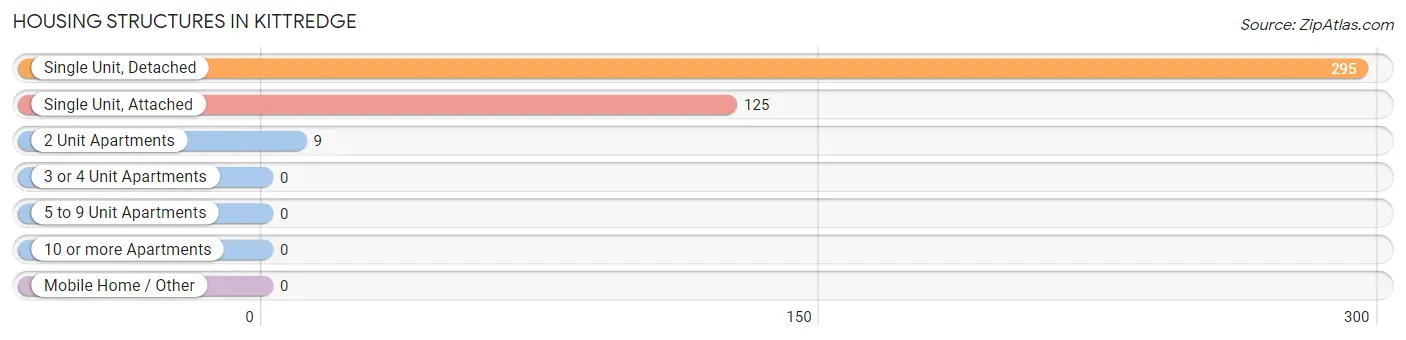
| Structure Type | # Housing Units | % Housing Units |
| Single Unit, Detached | 295 | 68.8% |
| Single Unit, Attached | 125 | 29.1% |
| 2 Unit Apartments | 9 | 2.1% |
| 3 or 4 Unit Apartments | 0 | 0.0% |
| 5 to 9 Unit Apartments | 0 | 0.0% |
| 10 or more Apartments | 0 | 0.0% |
| Mobile Home / Other | 0 | 0.0% |
| Total | 429 | 100.0% |
Housing Structures by Occupancy in Kittredge
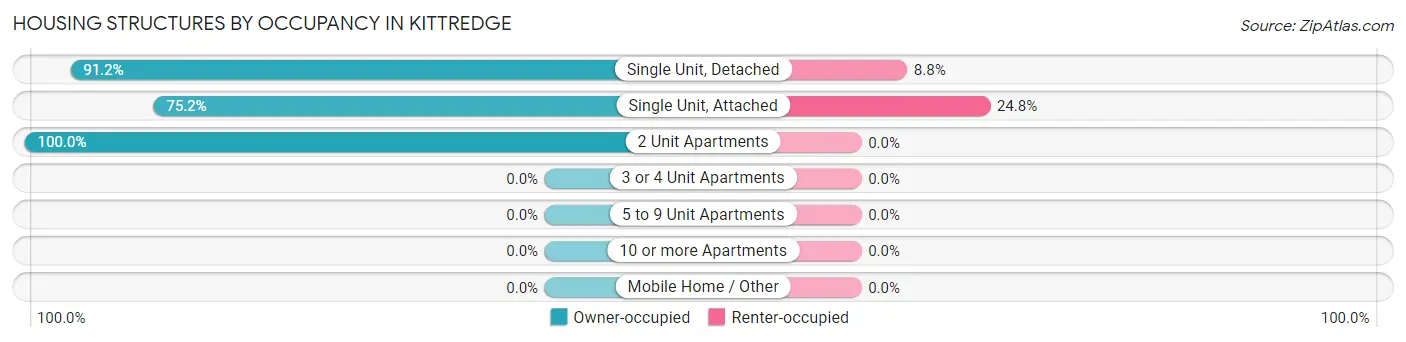
| Structure Type | Owner-occupied | Renter-occupied |
| Single Unit, Detached | 269 (91.2%) | 26 (8.8%) |
| Single Unit, Attached | 94 (75.2%) | 31 (24.8%) |
| 2 Unit Apartments | 9 (100.0%) | 0 (0.0%) |
| 3 or 4 Unit Apartments | 0 (0.0%) | 0 (0.0%) |
| 5 to 9 Unit Apartments | 0 (0.0%) | 0 (0.0%) |
| 10 or more Apartments | 0 (0.0%) | 0 (0.0%) |
| Mobile Home / Other | 0 (0.0%) | 0 (0.0%) |
| Total | 372 (86.7%) | 57 (13.3%) |
Housing Structures by Number of Rooms in Kittredge
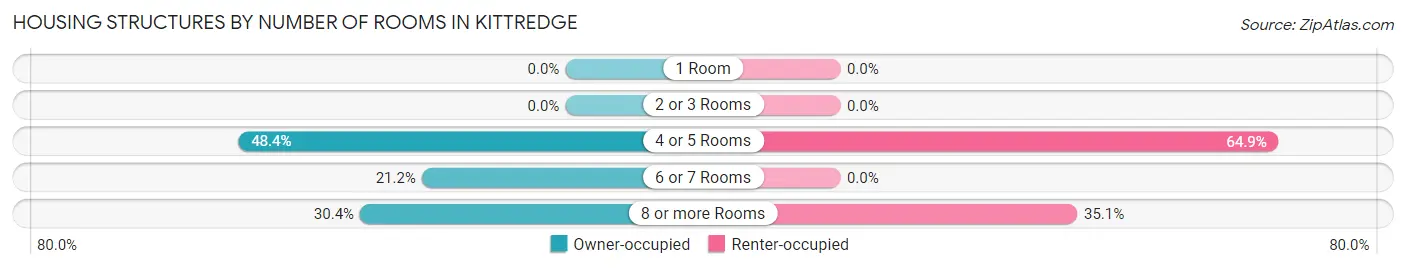
| Number of Rooms | Owner-occupied | Renter-occupied |
| 1 Room | 0 (0.0%) | 0 (0.0%) |
| 2 or 3 Rooms | 0 (0.0%) | 0 (0.0%) |
| 4 or 5 Rooms | 180 (48.4%) | 37 (64.9%) |
| 6 or 7 Rooms | 79 (21.2%) | 0 (0.0%) |
| 8 or more Rooms | 113 (30.4%) | 20 (35.1%) |
| Total | 372 (100.0%) | 57 (100.0%) |
Housing Structure by Heating Type in Kittredge
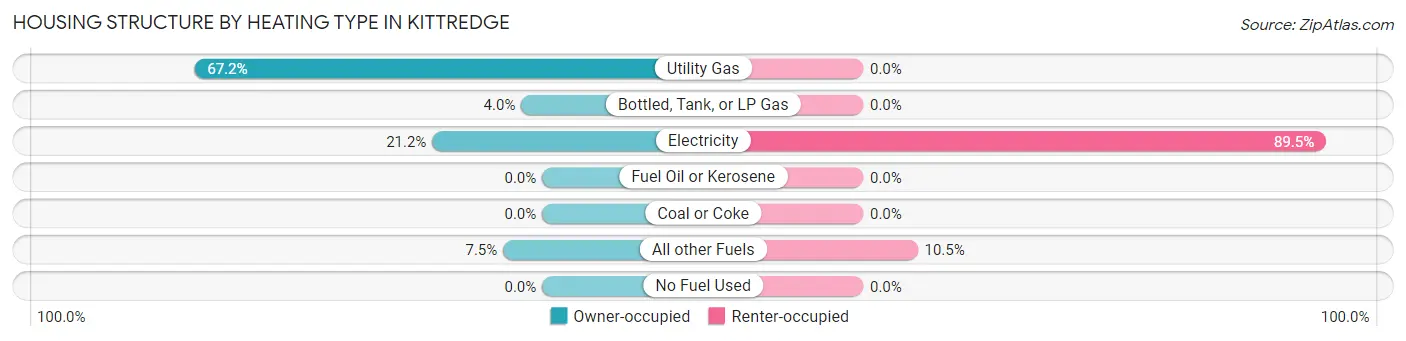
| Heating Type | Owner-occupied | Renter-occupied |
| Utility Gas | 250 (67.2%) | 0 (0.0%) |
| Bottled, Tank, or LP Gas | 15 (4.0%) | 0 (0.0%) |
| Electricity | 79 (21.2%) | 51 (89.5%) |
| Fuel Oil or Kerosene | 0 (0.0%) | 0 (0.0%) |
| Coal or Coke | 0 (0.0%) | 0 (0.0%) |
| All other Fuels | 28 (7.5%) | 6 (10.5%) |
| No Fuel Used | 0 (0.0%) | 0 (0.0%) |
| Total | 372 (100.0%) | 57 (100.0%) |
Household Vehicle Usage in Kittredge
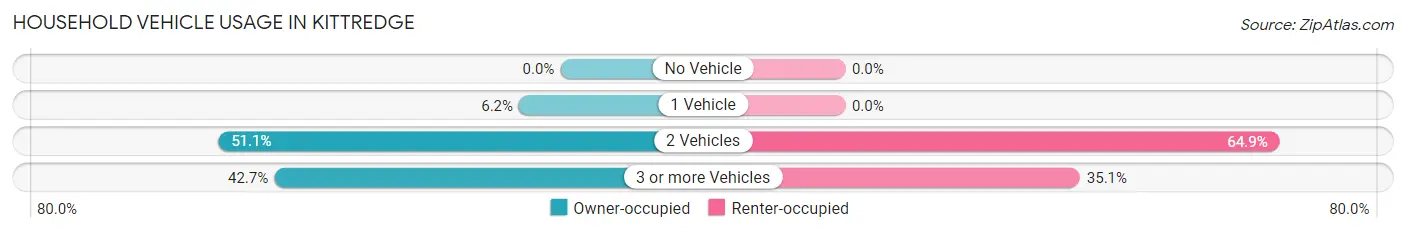
| Vehicles per Household | Owner-occupied | Renter-occupied |
| No Vehicle | 0 (0.0%) | 0 (0.0%) |
| 1 Vehicle | 23 (6.2%) | 0 (0.0%) |
| 2 Vehicles | 190 (51.1%) | 37 (64.9%) |
| 3 or more Vehicles | 159 (42.7%) | 20 (35.1%) |
| Total | 372 (100.0%) | 57 (100.0%) |
Real Estate & Mortgages in Kittredge
Real Estate and Mortgage Overview in Kittredge
| Characteristic | Without Mortgage | With Mortgage |
| Housing Units | 86 | 286 |
| Median Property Value | $481,000 | $669,900 |
| Median Household Income | $79,833 | $149 |
| Monthly Housing Costs | $463 | $71 |
| Real Estate Taxes | $1,814 | $0 |
Property Value by Mortgage Status in Kittredge
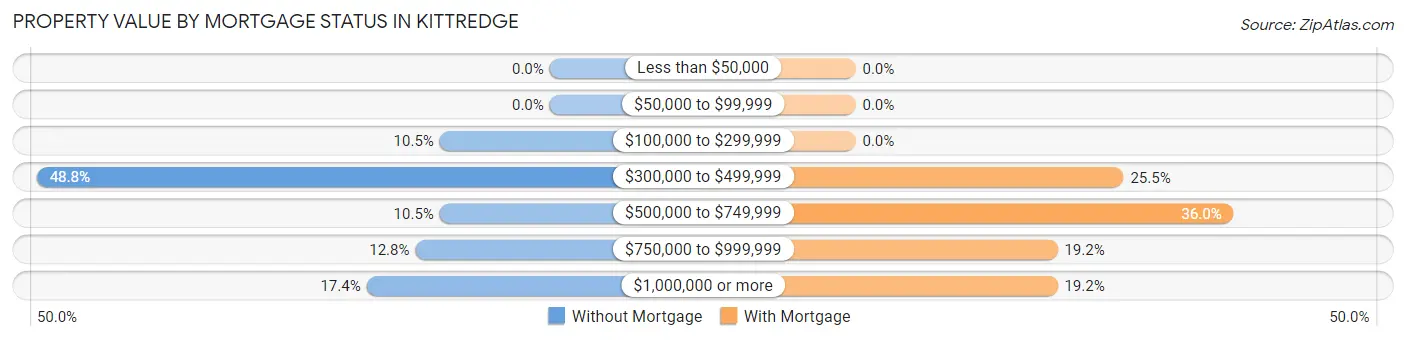
| Property Value | Without Mortgage | With Mortgage |
| Less than $50,000 | 0 (0.0%) | 0 (0.0%) |
| $50,000 to $99,999 | 0 (0.0%) | 0 (0.0%) |
| $100,000 to $299,999 | 9 (10.5%) | 0 (0.0%) |
| $300,000 to $499,999 | 42 (48.8%) | 73 (25.5%) |
| $500,000 to $749,999 | 9 (10.5%) | 103 (36.0%) |
| $750,000 to $999,999 | 11 (12.8%) | 55 (19.2%) |
| $1,000,000 or more | 15 (17.4%) | 55 (19.2%) |
| Total | 86 (100.0%) | 286 (100.0%) |
Household Income by Mortgage Status in Kittredge
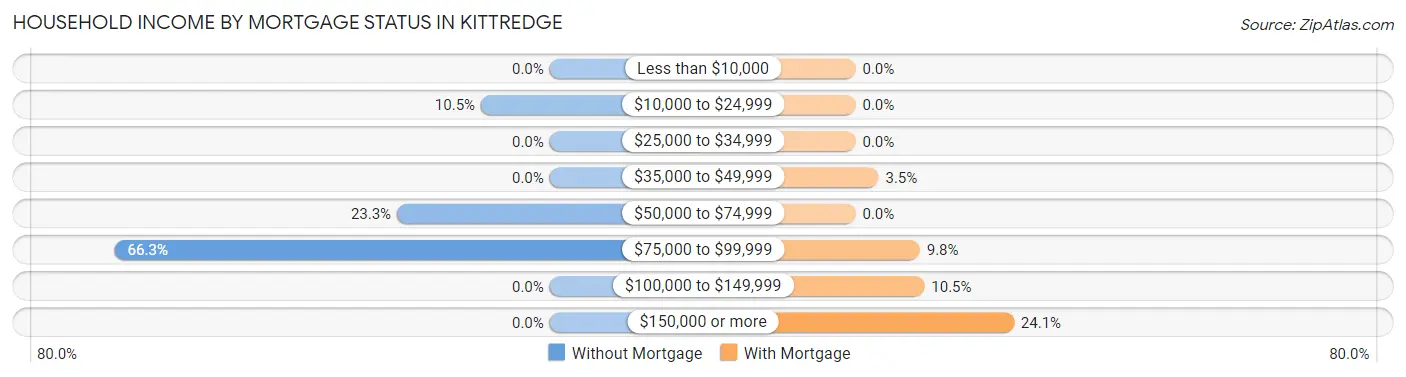
| Household Income | Without Mortgage | With Mortgage |
| Less than $10,000 | 0 (0.0%) | 0 (0.0%) |
| $10,000 to $24,999 | 9 (10.5%) | 0 (0.0%) |
| $25,000 to $34,999 | 0 (0.0%) | 0 (0.0%) |
| $35,000 to $49,999 | 0 (0.0%) | 10 (3.5%) |
| $50,000 to $74,999 | 20 (23.3%) | 0 (0.0%) |
| $75,000 to $99,999 | 57 (66.3%) | 28 (9.8%) |
| $100,000 to $149,999 | 0 (0.0%) | 30 (10.5%) |
| $150,000 or more | 0 (0.0%) | 69 (24.1%) |
| Total | 86 (100.0%) | 286 (100.0%) |
Property Value to Household Income Ratio in Kittredge
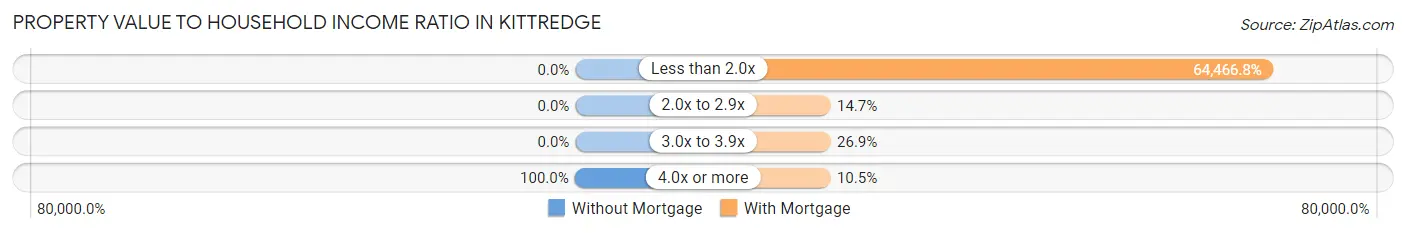
| Value-to-Income Ratio | Without Mortgage | With Mortgage |
| Less than 2.0x | 0 (0.0%) | 184,375 (64,466.8%) |
| 2.0x to 2.9x | 0 (0.0%) | 42 (14.7%) |
| 3.0x to 3.9x | 0 (0.0%) | 77 (26.9%) |
| 4.0x or more | 86 (100.0%) | 30 (10.5%) |
| Total | 86 (100.0%) | 286 (100.0%) |
Real Estate Taxes by Mortgage Status in Kittredge
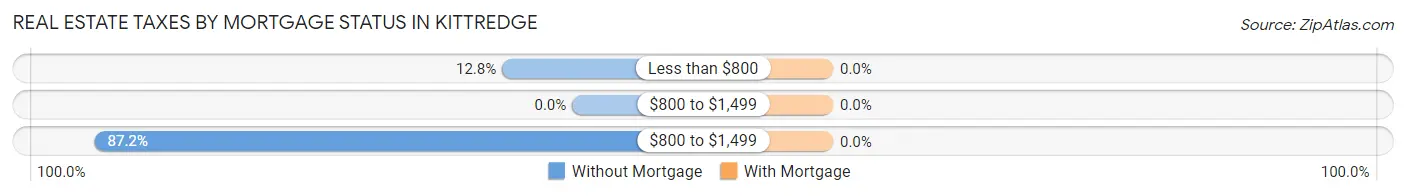
| Property Taxes | Without Mortgage | With Mortgage |
| Less than $800 | 11 (12.8%) | 0 (0.0%) |
| $800 to $1,499 | 0 (0.0%) | 0 (0.0%) |
| $800 to $1,499 | 75 (87.2%) | 0 (0.0%) |
| Total | 86 (100.0%) | 286 (100.0%) |
Health & Disability in Kittredge
Health Insurance Coverage by Age in Kittredge
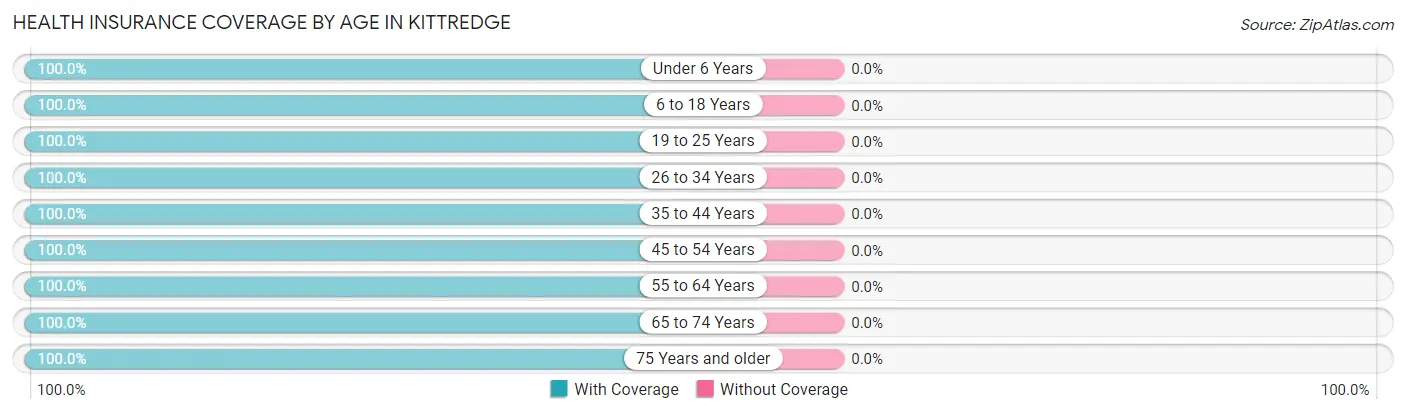
| Age Bracket | With Coverage | Without Coverage |
| Under 6 Years | 65 (100.0%) | 0 (0.0%) |
| 6 to 18 Years | 124 (100.0%) | 0 (0.0%) |
| 19 to 25 Years | 76 (100.0%) | 0 (0.0%) |
| 26 to 34 Years | 146 (100.0%) | 0 (0.0%) |
| 35 to 44 Years | 227 (100.0%) | 0 (0.0%) |
| 45 to 54 Years | 119 (100.0%) | 0 (0.0%) |
| 55 to 64 Years | 162 (100.0%) | 0 (0.0%) |
| 65 to 74 Years | 81 (100.0%) | 0 (0.0%) |
| 75 Years and older | 21 (100.0%) | 0 (0.0%) |
| Total | 1,021 (100.0%) | 0 (0.0%) |
Health Insurance Coverage by Citizenship Status in Kittredge
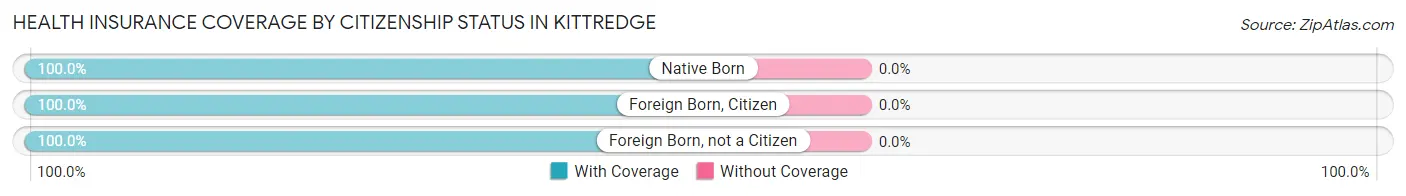
| Citizenship Status | With Coverage | Without Coverage |
| Native Born | 65 (100.0%) | 0 (0.0%) |
| Foreign Born, Citizen | 124 (100.0%) | 0 (0.0%) |
| Foreign Born, not a Citizen | 76 (100.0%) | 0 (0.0%) |
Health Insurance Coverage by Household Income in Kittredge
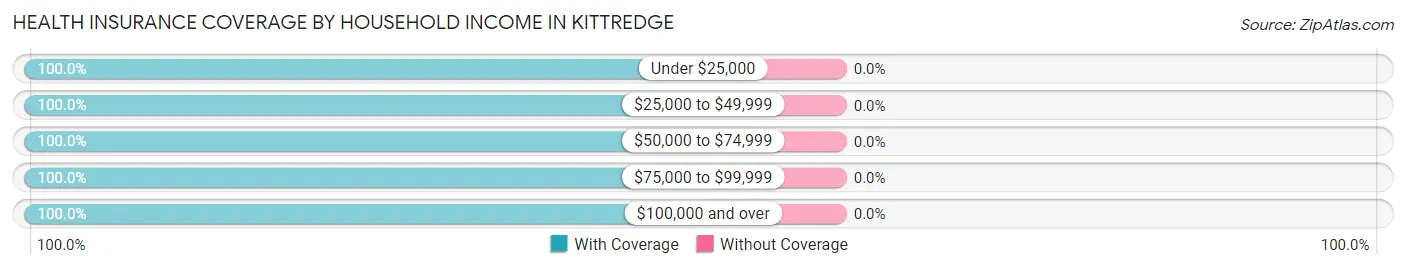
| Household Income | With Coverage | Without Coverage |
| Under $25,000 | 9 (100.0%) | 0 (0.0%) |
| $25,000 to $49,999 | 38 (100.0%) | 0 (0.0%) |
| $50,000 to $74,999 | 78 (100.0%) | 0 (0.0%) |
| $75,000 to $99,999 | 163 (100.0%) | 0 (0.0%) |
| $100,000 and over | 733 (100.0%) | 0 (0.0%) |
Public vs Private Health Insurance Coverage by Age in Kittredge
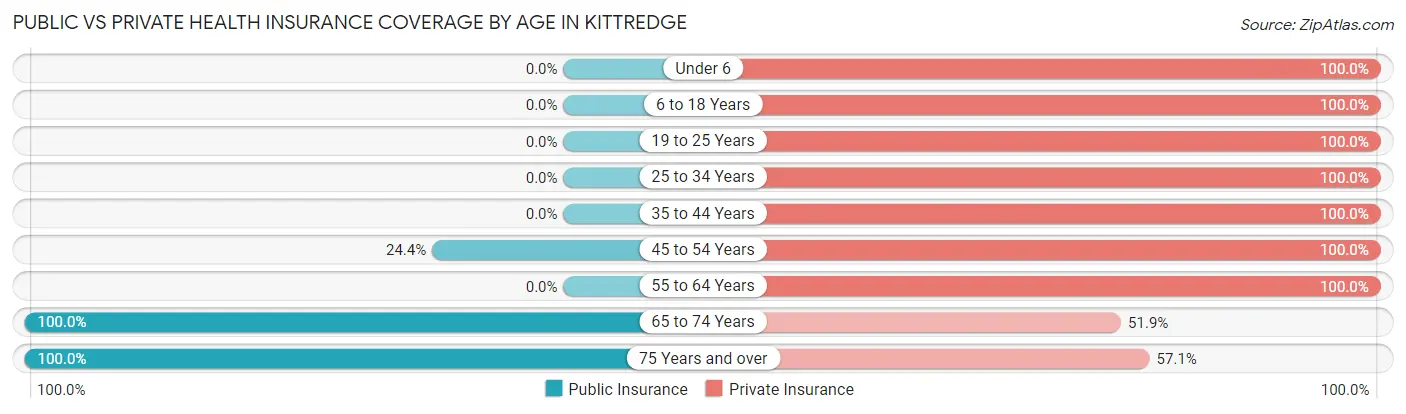
| Age Bracket | Public Insurance | Private Insurance |
| Under 6 | 0 (0.0%) | 65 (100.0%) |
| 6 to 18 Years | 0 (0.0%) | 124 (100.0%) |
| 19 to 25 Years | 0 (0.0%) | 76 (100.0%) |
| 25 to 34 Years | 0 (0.0%) | 146 (100.0%) |
| 35 to 44 Years | 0 (0.0%) | 227 (100.0%) |
| 45 to 54 Years | 29 (24.4%) | 119 (100.0%) |
| 55 to 64 Years | 0 (0.0%) | 162 (100.0%) |
| 65 to 74 Years | 81 (100.0%) | 42 (51.8%) |
| 75 Years and over | 21 (100.0%) | 12 (57.1%) |
| Total | 131 (12.8%) | 973 (95.3%) |
Disability Status by Sex by Age in Kittredge
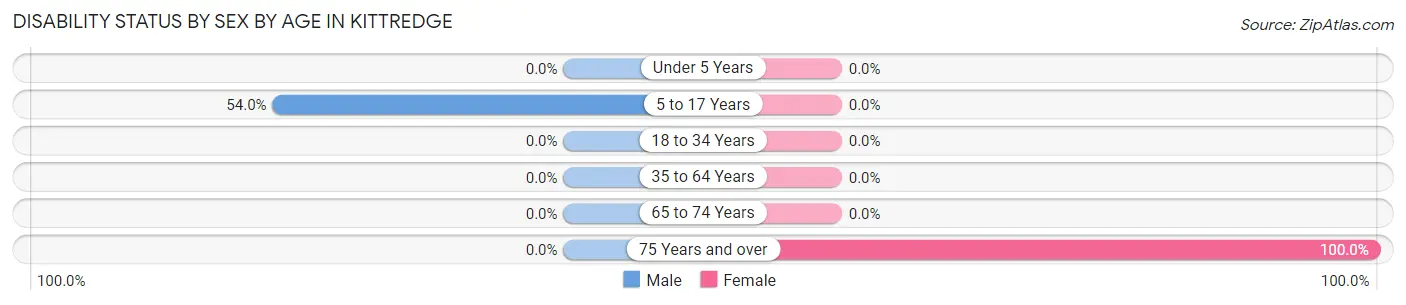
| Age Bracket | Male | Female |
| Under 5 Years | 0 (0.0%) | 0 (0.0%) |
| 5 to 17 Years | 27 (54.0%) | 0 (0.0%) |
| 18 to 34 Years | 0 (0.0%) | 0 (0.0%) |
| 35 to 64 Years | 0 (0.0%) | 0 (0.0%) |
| 65 to 74 Years | 0 (0.0%) | 0 (0.0%) |
| 75 Years and over | 0 (0.0%) | 21 (100.0%) |
Disability Class by Sex by Age in Kittredge
Disability Class: Hearing Difficulty
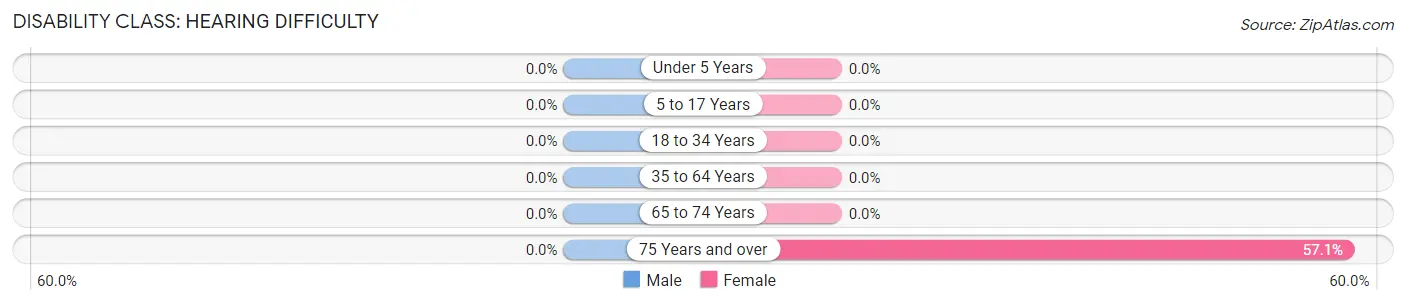
| Age Bracket | Male | Female |
| Under 5 Years | 0 (0.0%) | 0 (0.0%) |
| 5 to 17 Years | 0 (0.0%) | 0 (0.0%) |
| 18 to 34 Years | 0 (0.0%) | 0 (0.0%) |
| 35 to 64 Years | 0 (0.0%) | 0 (0.0%) |
| 65 to 74 Years | 0 (0.0%) | 0 (0.0%) |
| 75 Years and over | 0 (0.0%) | 12 (57.1%) |
Disability Class: Vision Difficulty
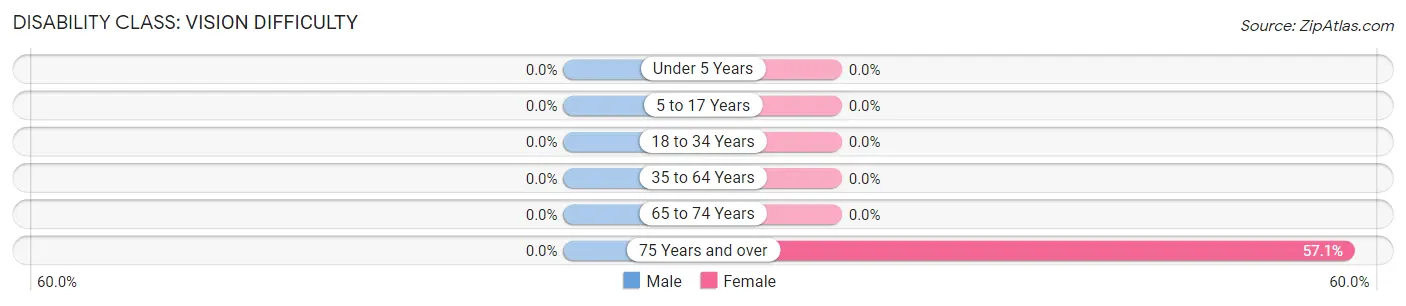
| Age Bracket | Male | Female |
| Under 5 Years | 0 (0.0%) | 0 (0.0%) |
| 5 to 17 Years | 0 (0.0%) | 0 (0.0%) |
| 18 to 34 Years | 0 (0.0%) | 0 (0.0%) |
| 35 to 64 Years | 0 (0.0%) | 0 (0.0%) |
| 65 to 74 Years | 0 (0.0%) | 0 (0.0%) |
| 75 Years and over | 0 (0.0%) | 12 (57.1%) |
Disability Class: Cognitive Difficulty
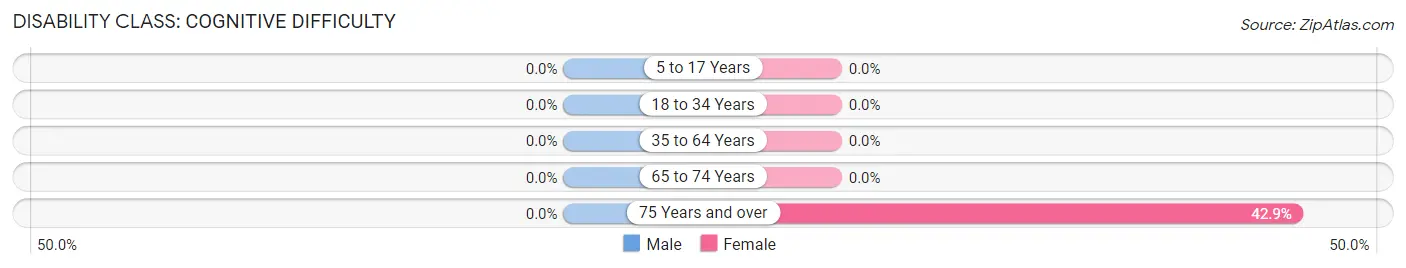
| Age Bracket | Male | Female |
| 5 to 17 Years | 0 (0.0%) | 0 (0.0%) |
| 18 to 34 Years | 0 (0.0%) | 0 (0.0%) |
| 35 to 64 Years | 0 (0.0%) | 0 (0.0%) |
| 65 to 74 Years | 0 (0.0%) | 0 (0.0%) |
| 75 Years and over | 0 (0.0%) | 9 (42.9%) |
Disability Class: Ambulatory Difficulty
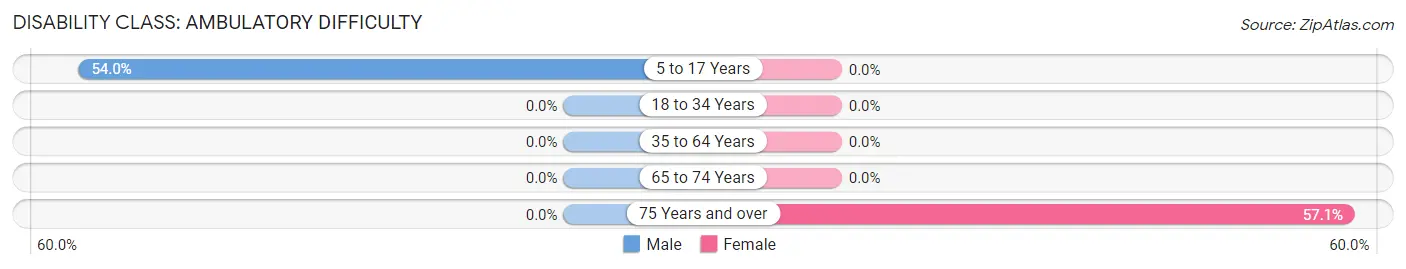
| Age Bracket | Male | Female |
| 5 to 17 Years | 27 (54.0%) | 0 (0.0%) |
| 18 to 34 Years | 0 (0.0%) | 0 (0.0%) |
| 35 to 64 Years | 0 (0.0%) | 0 (0.0%) |
| 65 to 74 Years | 0 (0.0%) | 0 (0.0%) |
| 75 Years and over | 0 (0.0%) | 12 (57.1%) |
Disability Class: Self-Care Difficulty
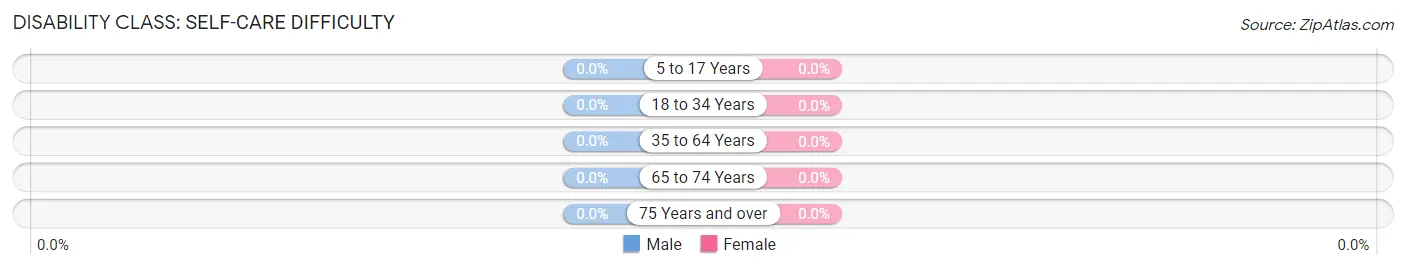
| Age Bracket | Male | Female |
| 5 to 17 Years | 0 (0.0%) | 0 (0.0%) |
| 18 to 34 Years | 0 (0.0%) | 0 (0.0%) |
| 35 to 64 Years | 0 (0.0%) | 0 (0.0%) |
| 65 to 74 Years | 0 (0.0%) | 0 (0.0%) |
| 75 Years and over | 0 (0.0%) | 0 (0.0%) |
Technology Access in Kittredge
Computing Device Access in Kittredge
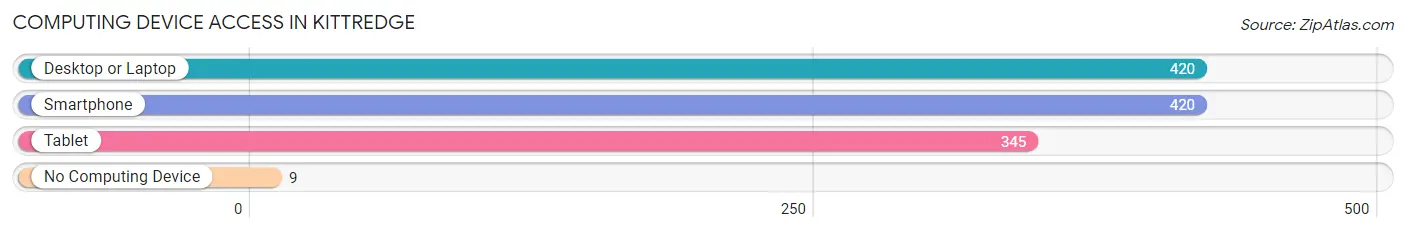
| Device Type | # Households | % Households |
| Desktop or Laptop | 420 | 97.9% |
| Smartphone | 420 | 97.9% |
| Tablet | 345 | 80.4% |
| No Computing Device | 9 | 2.1% |
| Total | 429 | 100.0% |
Internet Access in Kittredge
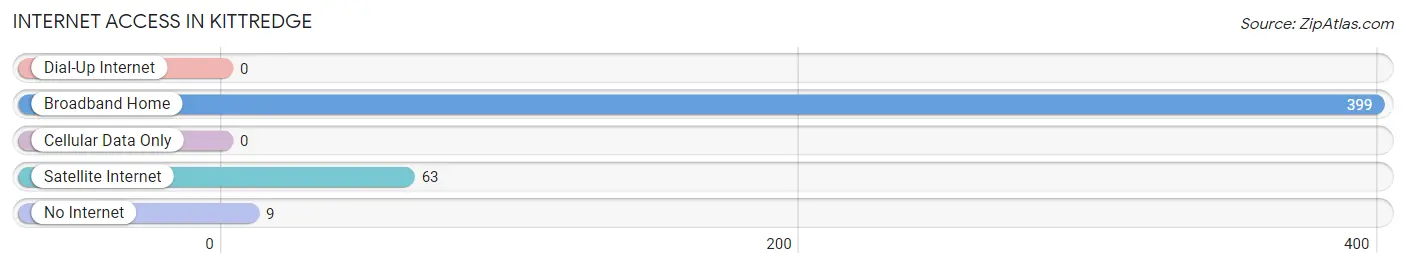
| Internet Type | # Households | % Households |
| Dial-Up Internet | 0 | 0.0% |
| Broadband Home | 399 | 93.0% |
| Cellular Data Only | 0 | 0.0% |
| Satellite Internet | 63 | 14.7% |
| No Internet | 9 | 2.1% |
| Total | 429 | 100.0% |
Kittredge Summary
Kittredge is a small unincorporated community located in Jefferson County, Colorado, United States. It is situated in the foothills of the Rocky Mountains, approximately 20 miles west of Denver. The town is located along the South Platte River and is surrounded by the Pike National Forest. Kittredge has a population of approximately 1,000 people and is home to a variety of businesses, including a post office, a library, a grocery store, and several restaurants.
History
Kittredge was founded in 1876 by William Kittredge, a prospector who discovered gold in the area. The town was originally known as “Kittredge’s Camp” and was home to a number of miners and prospectors. In 1877, the town was officially incorporated and renamed “Kittredge”.
In the late 19th century, Kittredge was a thriving mining town. The town was home to several mines, including the Kittredge Mine, which was one of the largest gold mines in the area. The town also had a number of businesses, including a hotel, a saloon, and a general store.
In the early 20th century, the mining industry in Kittredge began to decline and the town’s population began to dwindle. In the 1950s, the town was revitalized when the Denver Water Board began to build a reservoir in the area. The reservoir, which is now known as the Evergreen Lake, provided the town with a new source of water and helped to attract new residents.
Geography
Kittredge is located in the foothills of the Rocky Mountains, approximately 20 miles west of Denver. The town is situated along the South Platte River and is surrounded by the Pike National Forest. The town has an elevation of 6,890 feet and has a total area of 0.7 square miles.
Economy
Kittredge is a small, rural community with a population of approximately 1,000 people. The town’s economy is largely based on tourism, as it is a popular destination for outdoor activities such as hiking, fishing, and camping. The town is also home to a number of businesses, including a post office, a library, a grocery store, and several restaurants.
Demographics
As of the 2010 census, Kittredge had a population of 1,000 people. The town has a median household income of $50,000 and a median home value of $250,000. The town is predominantly white (94.7%) and has a small Hispanic population (3.3%). The town also has a small Native American population (0.7%).
Common Questions
What is Per Capita Income in Kittredge?
Per Capita income in Kittredge is $80,689.
What is the Median Family Income in Kittredge?
Median Family Income in Kittredge is $220,417.
What is the Median Household income in Kittredge?
Median Household Income in Kittredge is $143,147.
What is Income or Wage Gap in Kittredge?
Income or Wage Gap in Kittredge is 58.5%.
Women in Kittredge earn 41.5 cents for every dollar earned by a man.
What is Inequality or Gini Index in Kittredge?
Inequality or Gini Index in Kittredge is 0.39.
What is the Total Population of Kittredge?
Total Population of Kittredge is 1,021.
What is the Total Male Population of Kittredge?
Total Male Population of Kittredge is 460.
What is the Total Female Population of Kittredge?
Total Female Population of Kittredge is 561.
What is the Ratio of Males per 100 Females in Kittredge?
There are 82.00 Males per 100 Females in Kittredge.
What is the Ratio of Females per 100 Males in Kittredge?
There are 121.96 Females per 100 Males in Kittredge.
What is the Median Population Age in Kittredge?
Median Population Age in Kittredge is 40.3 Years.
What is the Average Family Size in Kittredge
Average Family Size in Kittredge is 2.9 People.
What is the Average Household Size in Kittredge
Average Household Size in Kittredge is 2.4 People.
How Large is the Labor Force in Kittredge?
There are 705 People in the Labor Forcein in Kittredge.
What is the Percentage of People in the Labor Force in Kittredge?
84.7% of People are in the Labor Force in Kittredge.
What is the Unemployment Rate in Kittredge?
Unemployment Rate in Kittredge is 4.8%.