Julesburg, CO Map & Demographics
Julesburg Map
Julesburg Overview
$25,653
PER CAPITA INCOME
$65,197
AVG FAMILY INCOME
$37,232
AVG HOUSEHOLD INCOME
26.9%
WAGE / INCOME GAP [ % ]
73.1¢/ $1
WAGE / INCOME GAP [ $ ]
$8,506
FAMILY INCOME DEFICIT
0.43
INEQUALITY / GINI INDEX
1,187
TOTAL POPULATION
560
MALE POPULATION
627
FEMALE POPULATION
89.31
MALES / 100 FEMALES
111.96
FEMALES / 100 MALES
42.7
MEDIAN AGE
2.9
AVG FAMILY SIZE
2.0
AVG HOUSEHOLD SIZE
521
LABOR FORCE [ PEOPLE ]
54.5%
PERCENT IN LABOR FORCE
4.2%
UNEMPLOYMENT RATE
Julesburg Zip Codes
Julesburg Area Codes
Income in Julesburg
Income Overview in Julesburg
Per Capita Income in Julesburg is $25,653, while median incomes of families and households are $65,197 and $37,232 respectively.
| Characteristic | Number | Measure |
| Per Capita Income | 1,187 | $25,653 |
| Median Family Income | 289 | $65,197 |
| Mean Family Income | 289 | $69,439 |
| Median Household Income | 563 | $37,232 |
| Mean Household Income | 563 | $50,359 |
| Income Deficit | 289 | $8,506 |
| Wage / Income Gap (%) | 1,187 | 26.85% |
| Wage / Income Gap ($) | 1,187 | 73.15¢ per $1 |
| Gini / Inequality Index | 1,187 | 0.43 |
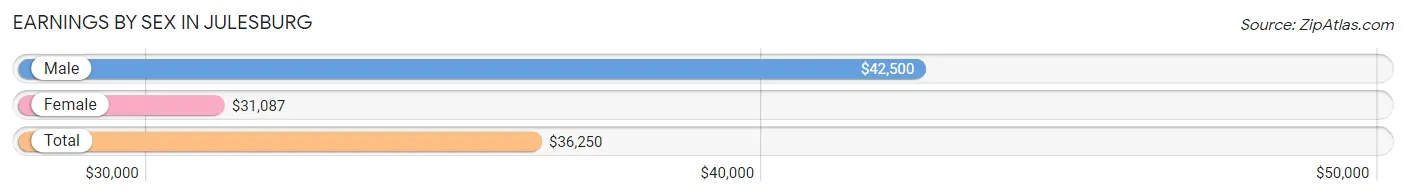
Earnings by Sex in Julesburg
Average Earnings in Julesburg are $36,250, $42,500 for men and $31,087 for women, a difference of 26.9%.
| Sex | Number | Average Earnings |
| Male | 258 (46.4%) | $42,500 |
| Female | 298 (53.6%) | $31,087 |
| Total | 556 (100.0%) | $36,250 |
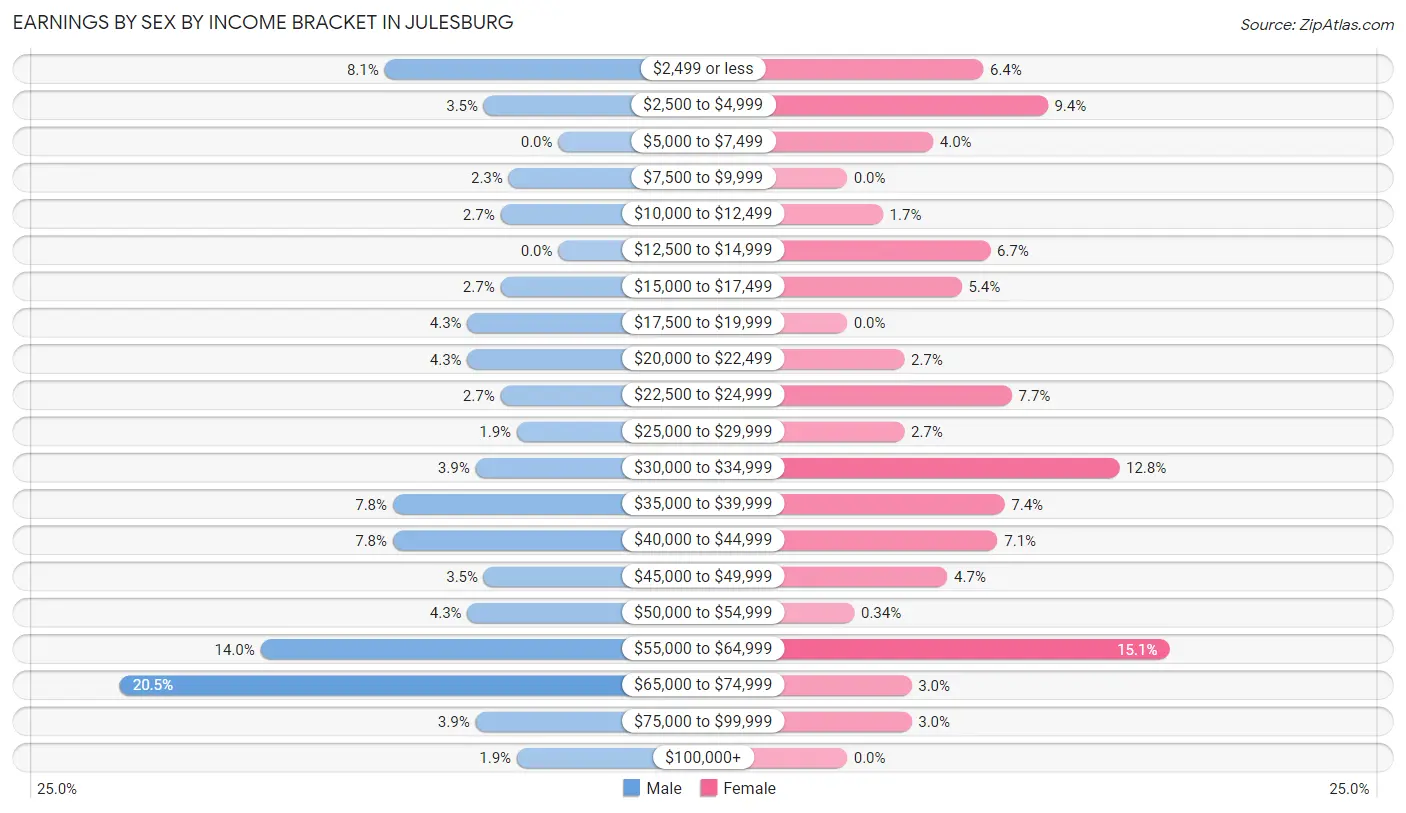
Earnings by Sex by Income Bracket in Julesburg
The most common earnings brackets in Julesburg are $65,000 to $74,999 for men (53 | 20.5%) and $55,000 to $64,999 for women (45 | 15.1%).
| Income | Male | Female |
| $2,499 or less | 21 (8.1%) | 19 (6.4%) |
| $2,500 to $4,999 | 9 (3.5%) | 28 (9.4%) |
| $5,000 to $7,499 | 0 (0.0%) | 12 (4.0%) |
| $7,500 to $9,999 | 6 (2.3%) | 0 (0.0%) |
| $10,000 to $12,499 | 7 (2.7%) | 5 (1.7%) |
| $12,500 to $14,999 | 0 (0.0%) | 20 (6.7%) |
| $15,000 to $17,499 | 7 (2.7%) | 16 (5.4%) |
| $17,500 to $19,999 | 11 (4.3%) | 0 (0.0%) |
| $20,000 to $22,499 | 11 (4.3%) | 8 (2.7%) |
| $22,500 to $24,999 | 7 (2.7%) | 23 (7.7%) |
| $25,000 to $29,999 | 5 (1.9%) | 8 (2.7%) |
| $30,000 to $34,999 | 10 (3.9%) | 38 (12.8%) |
| $35,000 to $39,999 | 20 (7.7%) | 22 (7.4%) |
| $40,000 to $44,999 | 20 (7.7%) | 21 (7.0%) |
| $45,000 to $49,999 | 9 (3.5%) | 14 (4.7%) |
| $50,000 to $54,999 | 11 (4.3%) | 1 (0.3%) |
| $55,000 to $64,999 | 36 (14.0%) | 45 (15.1%) |
| $65,000 to $74,999 | 53 (20.5%) | 9 (3.0%) |
| $75,000 to $99,999 | 10 (3.9%) | 9 (3.0%) |
| $100,000+ | 5 (1.9%) | 0 (0.0%) |
| Total | 258 (100.0%) | 298 (100.0%) |
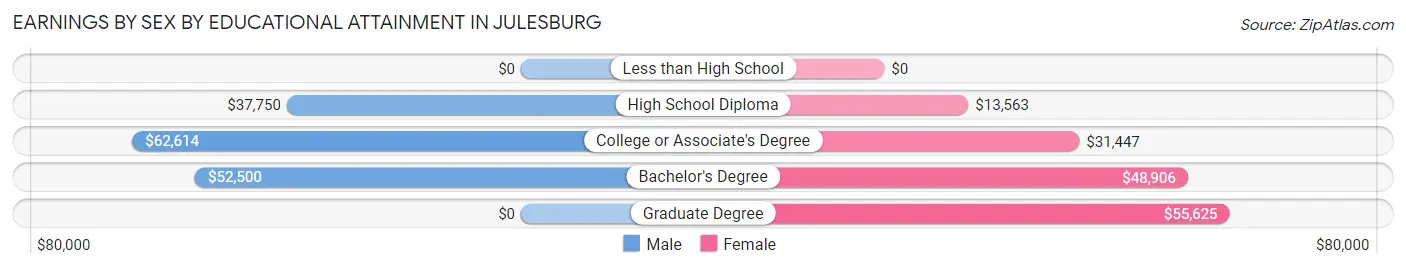
Earnings by Sex by Educational Attainment in Julesburg
Average earnings in Julesburg are $51,250 for men and $32,174 for women, a difference of 37.2%. Men with an educational attainment of college or associate's degree enjoy the highest average annual earnings of $62,614, while those with high school diploma education earn the least with $37,750. Women with an educational attainment of graduate degree earn the most with the average annual earnings of $55,625, while those with high school diploma education have the smallest earnings of $13,563.
| Educational Attainment | Male Income | Female Income |
| Less than High School | - | - |
| High School Diploma | $37,750 | $13,563 |
| College or Associate's Degree | $62,614 | $31,447 |
| Bachelor's Degree | $52,500 | $48,906 |
| Graduate Degree | - | - |
| Total | $51,250 | $32,174 |
Family Income in Julesburg
Family Income Brackets in Julesburg
According to the Julesburg family income data, there are 74 families falling into the $100,000 to $149,999 income range, which is the most common income bracket and makes up 25.6% of all families.
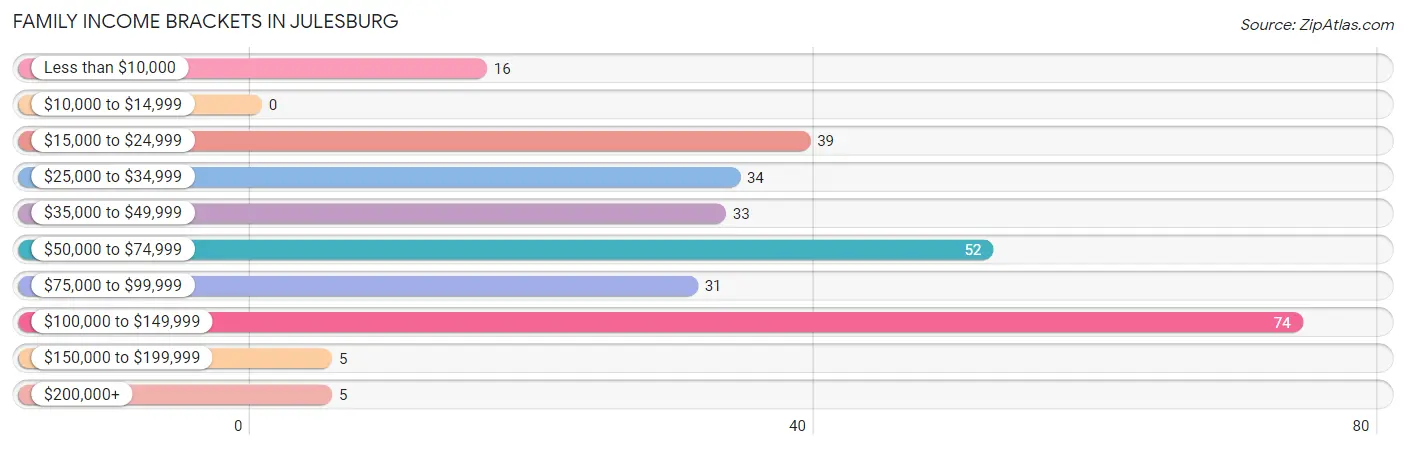
| Income Bracket | # Families | % Families |
| Less than $10,000 | 16 | 5.5% |
| $10,000 to $14,999 | 0 | 0.0% |
| $15,000 to $24,999 | 39 | 13.5% |
| $25,000 to $34,999 | 34 | 11.8% |
| $35,000 to $49,999 | 33 | 11.4% |
| $50,000 to $74,999 | 52 | 18.0% |
| $75,000 to $99,999 | 31 | 10.7% |
| $100,000 to $149,999 | 74 | 25.6% |
| $150,000 to $199,999 | 5 | 1.7% |
| $200,000+ | 5 | 1.7% |
Family Income by Famaliy Size in Julesburg
4-person families (53 | 18.3%) account for the highest median family income in Julesburg with $122,361 per family, while 2-person families (151 | 52.2%) have the highest median income of $32,796 per family member.
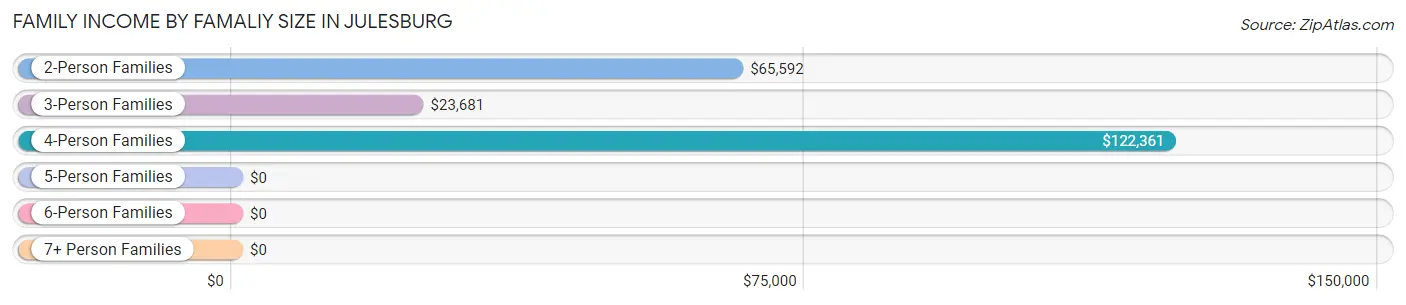
| Income Bracket | # Families | Median Income |
| 2-Person Families | 151 (52.2%) | $65,592 |
| 3-Person Families | 77 (26.6%) | $23,681 |
| 4-Person Families | 53 (18.3%) | $122,361 |
| 5-Person Families | 3 (1.0%) | $0 |
| 6-Person Families | 0 (0.0%) | $0 |
| 7+ Person Families | 5 (1.7%) | $0 |
| Total | 289 (100.0%) | $65,197 |
Family Income by Number of Earners in Julesburg
The median family income in Julesburg is $65,197, with families comprising 3+ earners (11) having the highest median family income of $113,125, while families with no earners (68) have the lowest median family income of $26,667, accounting for 3.8% and 23.5% of families, respectively.
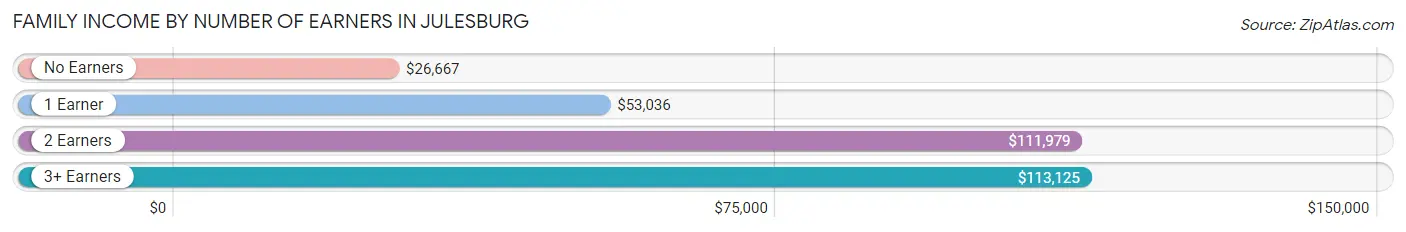
| Number of Earners | # Families | Median Income |
| No Earners | 68 (23.5%) | $26,667 |
| 1 Earner | 99 (34.3%) | $53,036 |
| 2 Earners | 111 (38.4%) | $111,979 |
| 3+ Earners | 11 (3.8%) | $113,125 |
| Total | 289 (100.0%) | $65,197 |
Household Income in Julesburg
Household Income Brackets in Julesburg
With 118 households falling in the category, the $15,000 to $24,999 income range is the most frequent in Julesburg, accounting for 21.0% of all households. In contrast, only 5 households (0.9%) fall into the $150,000 to $199,999 income bracket, making it the least populous group.
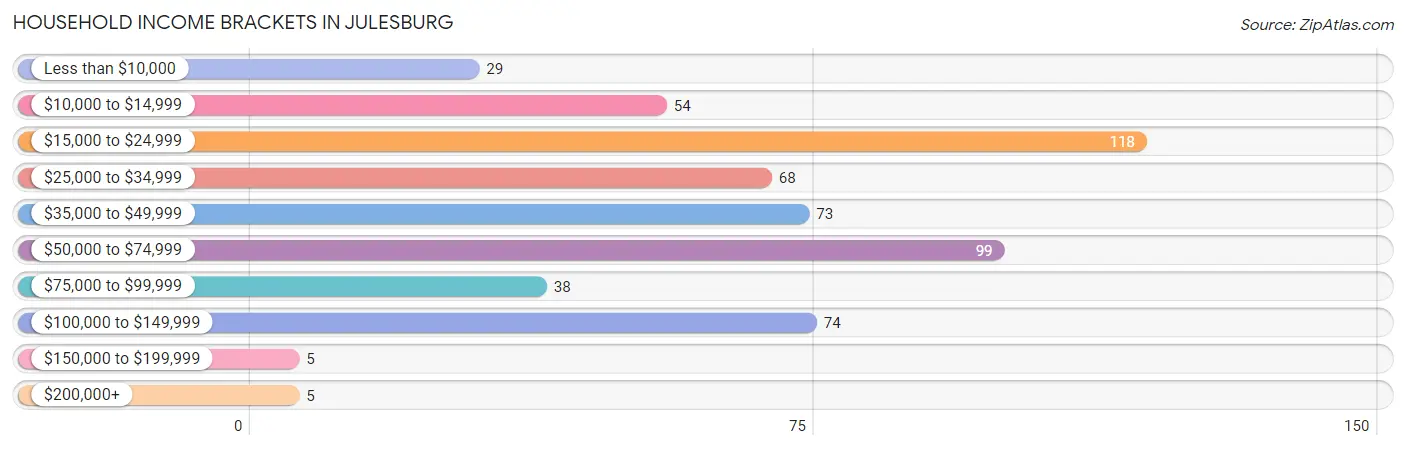
| Income Bracket | # Households | % Households |
| Less than $10,000 | 29 | 5.2% |
| $10,000 to $14,999 | 54 | 9.6% |
| $15,000 to $24,999 | 118 | 21.0% |
| $25,000 to $34,999 | 68 | 12.1% |
| $35,000 to $49,999 | 73 | 13.0% |
| $50,000 to $74,999 | 99 | 17.6% |
| $75,000 to $99,999 | 38 | 6.7% |
| $100,000 to $149,999 | 74 | 13.1% |
| $150,000 to $199,999 | 5 | 0.9% |
| $200,000+ | 5 | 0.9% |
Household Income by Householder Age in Julesburg
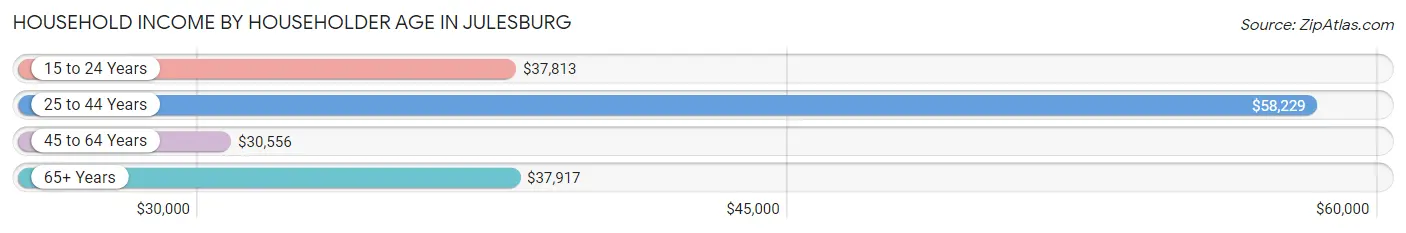
The median household income in Julesburg is $37,232, with the highest median household income of $58,229 found in the 25 to 44 years age bracket for the primary householder. A total of 157 households (27.9%) fall into this category. Meanwhile, the 45 to 64 years age bracket for the primary householder has the lowest median household income of $30,556, with 196 households (34.8%) in this group.
| Income Bracket | # Households | Median Income |
| 15 to 24 Years | 32 (5.7%) | $37,813 |
| 25 to 44 Years | 157 (27.9%) | $58,229 |
| 45 to 64 Years | 196 (34.8%) | $30,556 |
| 65+ Years | 178 (31.6%) | $37,917 |
| Total | 563 (100.0%) | $37,232 |
Poverty in Julesburg
Income Below Poverty by Sex and Age in Julesburg
With 14.3% poverty level for males and 28.2% for females among the residents of Julesburg, 6 to 11 year old males and under 5 year old females are the most vulnerable to poverty, with 17 males (73.9%) and 26 females (59.1%) in their respective age groups living below the poverty level.
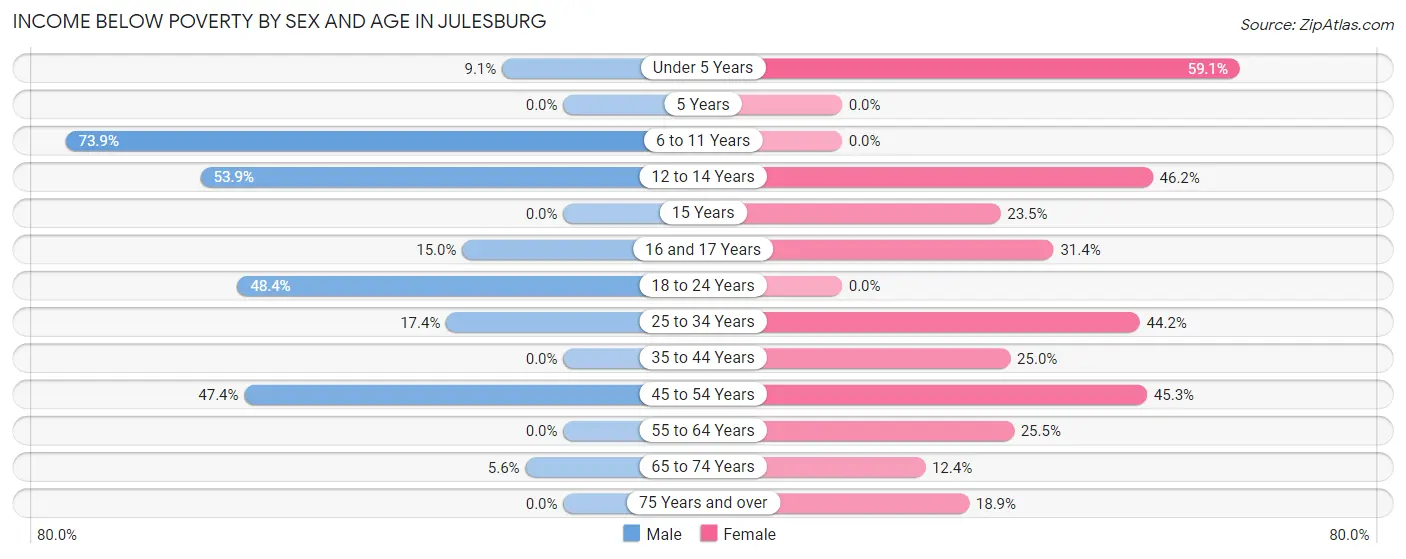
| Age Bracket | Male | Female |
| Under 5 Years | 7 (9.1%) | 26 (59.1%) |
| 5 Years | 0 (0.0%) | 0 (0.0%) |
| 6 to 11 Years | 17 (73.9%) | 0 (0.0%) |
| 12 to 14 Years | 7 (53.8%) | 12 (46.2%) |
| 15 Years | 0 (0.0%) | 4 (23.5%) |
| 16 and 17 Years | 3 (15.0%) | 11 (31.4%) |
| 18 to 24 Years | 15 (48.4%) | 0 (0.0%) |
| 25 to 34 Years | 8 (17.4%) | 23 (44.2%) |
| 35 to 44 Years | 0 (0.0%) | 21 (25.0%) |
| 45 to 54 Years | 18 (47.4%) | 29 (45.3%) |
| 55 to 64 Years | 0 (0.0%) | 24 (25.5%) |
| 65 to 74 Years | 4 (5.6%) | 10 (12.3%) |
| 75 Years and over | 0 (0.0%) | 10 (18.9%) |
| Total | 79 (14.3%) | 170 (28.2%) |
Income Above Poverty by Sex and Age in Julesburg
According to the poverty statistics in Julesburg, males aged 5 years and females aged 5 years are the age groups that are most secure financially, with 100.0% of males and 100.0% of females in these age groups living above the poverty line.
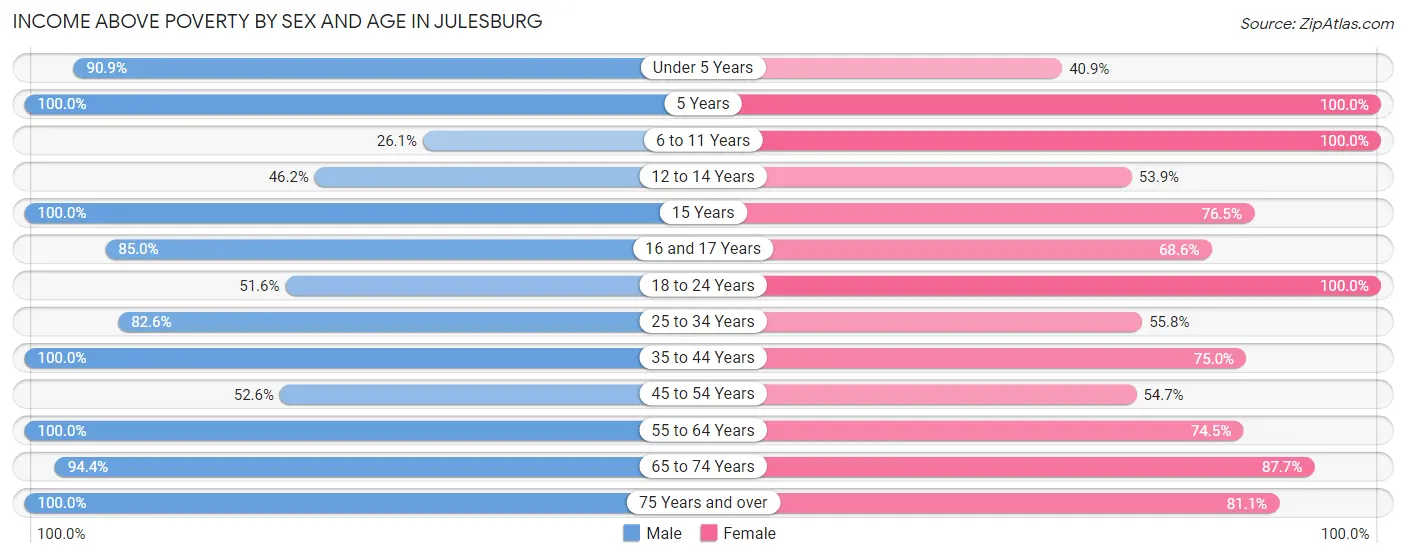
| Age Bracket | Male | Female |
| Under 5 Years | 70 (90.9%) | 18 (40.9%) |
| 5 Years | 3 (100.0%) | 16 (100.0%) |
| 6 to 11 Years | 6 (26.1%) | 7 (100.0%) |
| 12 to 14 Years | 6 (46.2%) | 14 (53.8%) |
| 15 Years | 5 (100.0%) | 13 (76.5%) |
| 16 and 17 Years | 17 (85.0%) | 24 (68.6%) |
| 18 to 24 Years | 16 (51.6%) | 30 (100.0%) |
| 25 to 34 Years | 38 (82.6%) | 29 (55.8%) |
| 35 to 44 Years | 87 (100.0%) | 63 (75.0%) |
| 45 to 54 Years | 20 (52.6%) | 35 (54.7%) |
| 55 to 64 Years | 97 (100.0%) | 70 (74.5%) |
| 65 to 74 Years | 67 (94.4%) | 71 (87.6%) |
| 75 Years and over | 41 (100.0%) | 43 (81.1%) |
| Total | 473 (85.7%) | 433 (71.8%) |
Income Below Poverty Among Married-Couple Families in Julesburg
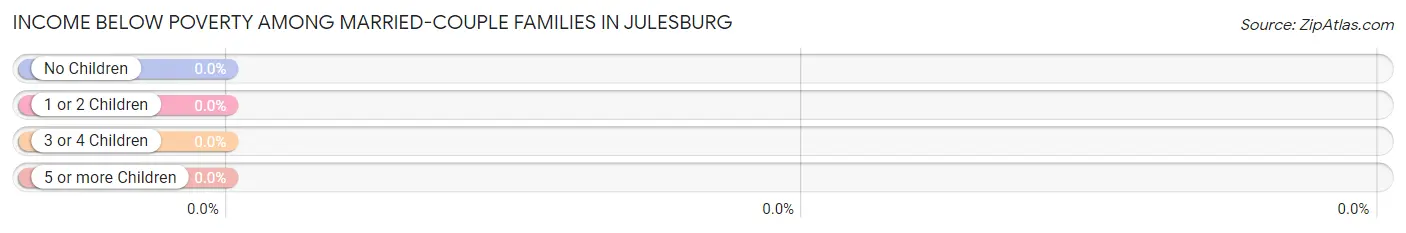
| Children | Above Poverty | Below Poverty |
| No Children | 137 (100.0%) | 0 (0.0%) |
| 1 or 2 Children | 60 (100.0%) | 0 (0.0%) |
| 3 or 4 Children | 1 (100.0%) | 0 (0.0%) |
| 5 or more Children | 5 (100.0%) | 0 (0.0%) |
| Total | 203 (100.0%) | 0 (0.0%) |
Income Below Poverty Among Single-Parent Households in Julesburg
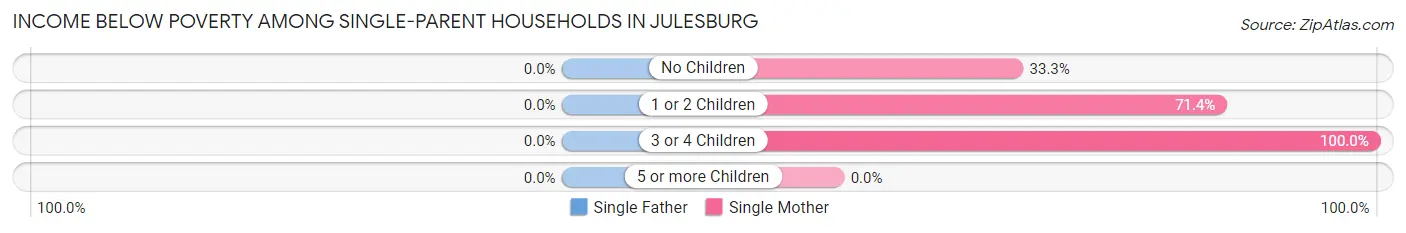
| Children | Single Father | Single Mother |
| No Children | 0 (0.0%) | 7 (33.3%) |
| 1 or 2 Children | 0 (0.0%) | 45 (71.4%) |
| 3 or 4 Children | 0 (0.0%) | 2 (100.0%) |
| 5 or more Children | 0 (0.0%) | 0 (0.0%) |
| Total | 0 (0.0%) | 54 (62.8%) |
Income Below Poverty Among Married-Couple vs Single-Parent Households in Julesburg
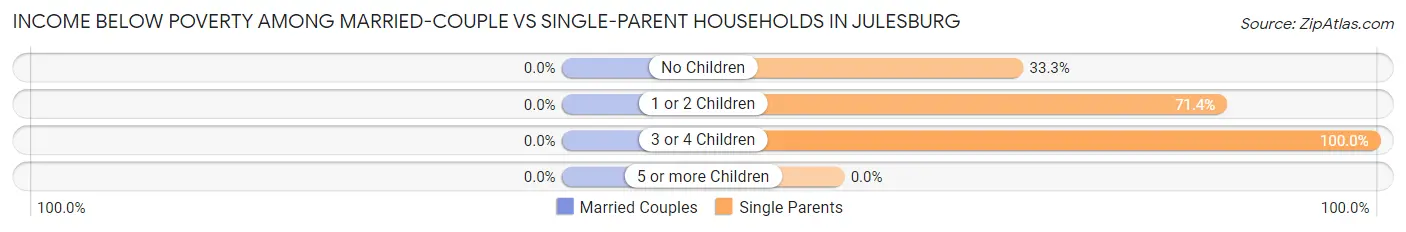
| Children | Married-Couple Families | Single-Parent Households |
| No Children | 0 (0.0%) | 7 (33.3%) |
| 1 or 2 Children | 0 (0.0%) | 45 (71.4%) |
| 3 or 4 Children | 0 (0.0%) | 2 (100.0%) |
| 5 or more Children | 0 (0.0%) | 0 (0.0%) |
| Total | 0 (0.0%) | 54 (62.8%) |
Race in Julesburg
The most populous races in Julesburg are White / Caucasian (1,108 | 93.3%), Hispanic or Latino (172 | 14.5%), and Two or more Races (34 | 2.9%).
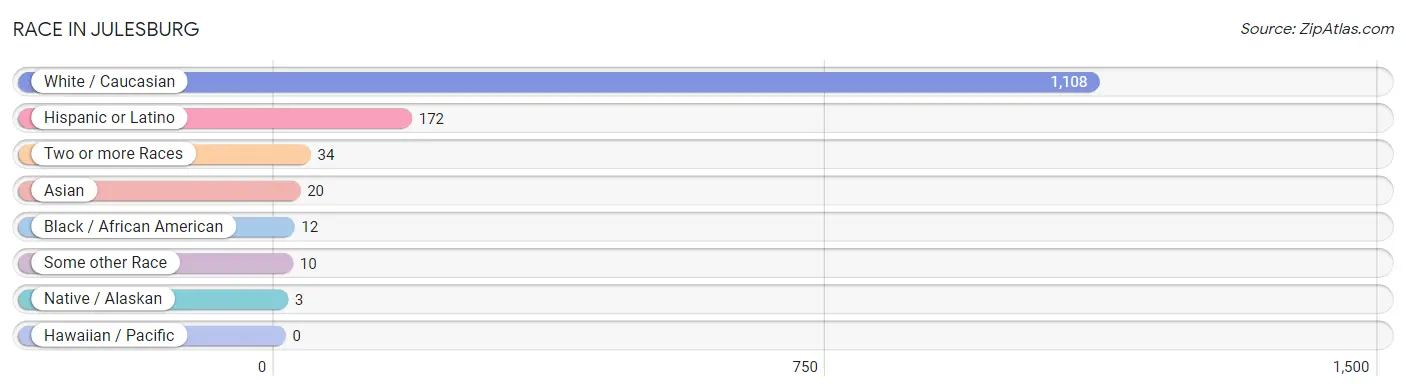
| Race | # Population | % Population |
| Asian | 20 | 1.7% |
| Black / African American | 12 | 1.0% |
| Hawaiian / Pacific | 0 | 0.0% |
| Hispanic or Latino | 172 | 14.5% |
| Native / Alaskan | 3 | 0.3% |
| White / Caucasian | 1,108 | 93.3% |
| Two or more Races | 34 | 2.9% |
| Some other Race | 10 | 0.8% |
| Total | 1,187 | 100.0% |
Ancestry in Julesburg
The most populous ancestries reported in Julesburg are German (415 | 35.0%), Mexican (163 | 13.7%), Irish (128 | 10.8%), English (125 | 10.5%), and Dutch (79 | 6.7%), together accounting for 76.7% of all Julesburg residents.
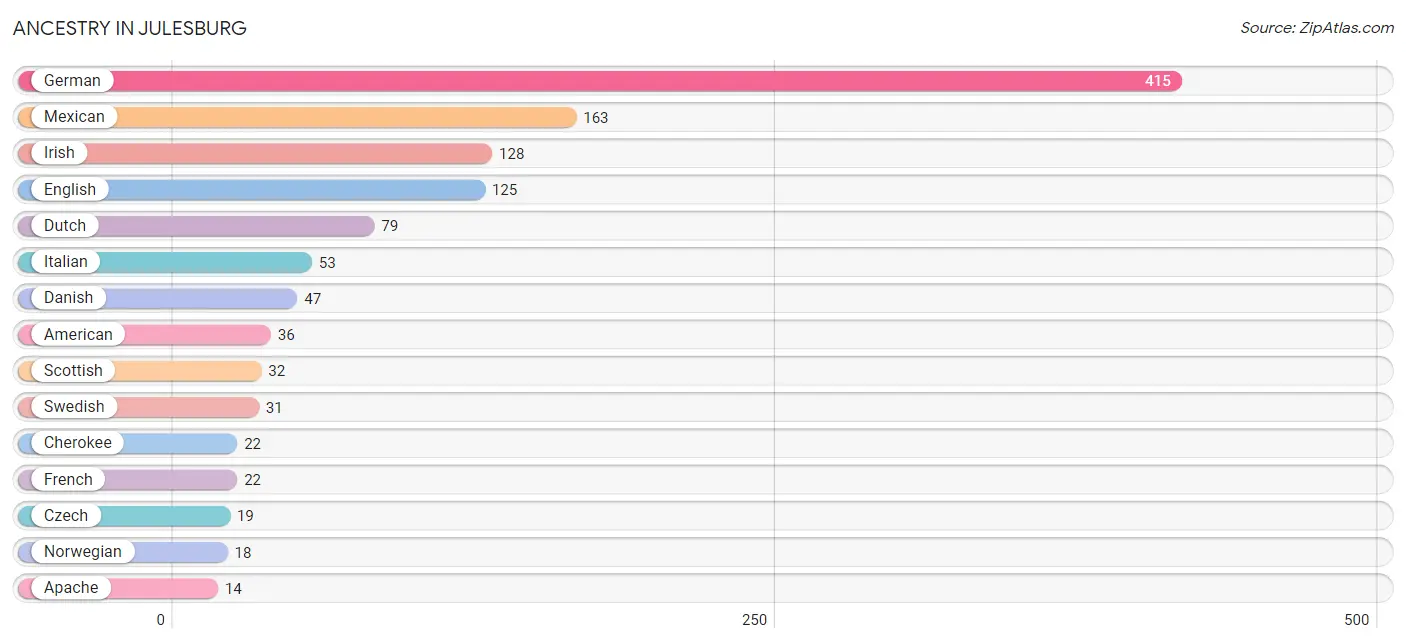
| Ancestry | # Population | % Population |
| American | 36 | 3.0% |
| Apache | 14 | 1.2% |
| Bhutanese | 2 | 0.2% |
| British | 4 | 0.3% |
| Burmese | 5 | 0.4% |
| Cherokee | 22 | 1.8% |
| Cuban | 4 | 0.3% |
| Czech | 19 | 1.6% |
| Czechoslovakian | 6 | 0.5% |
| Danish | 47 | 4.0% |
| Dutch | 79 | 6.7% |
| English | 125 | 10.5% |
| European | 6 | 0.5% |
| French | 22 | 1.8% |
| French Canadian | 13 | 1.1% |
| German | 415 | 35.0% |
| Indian (Asian) | 13 | 1.1% |
| Irish | 128 | 10.8% |
| Italian | 53 | 4.5% |
| Mexican | 163 | 13.7% |
| Navajo | 14 | 1.2% |
| Norwegian | 18 | 1.5% |
| Polish | 4 | 0.3% |
| Puerto Rican | 3 | 0.3% |
| Romanian | 7 | 0.6% |
| Scandinavian | 12 | 1.0% |
| Scotch-Irish | 14 | 1.2% |
| Scottish | 32 | 2.7% |
| Swedish | 31 | 2.6% |
| Welsh | 3 | 0.3% |
| Yugoslavian | 3 | 0.3% | View All 31 Rows |
Immigrants in Julesburg
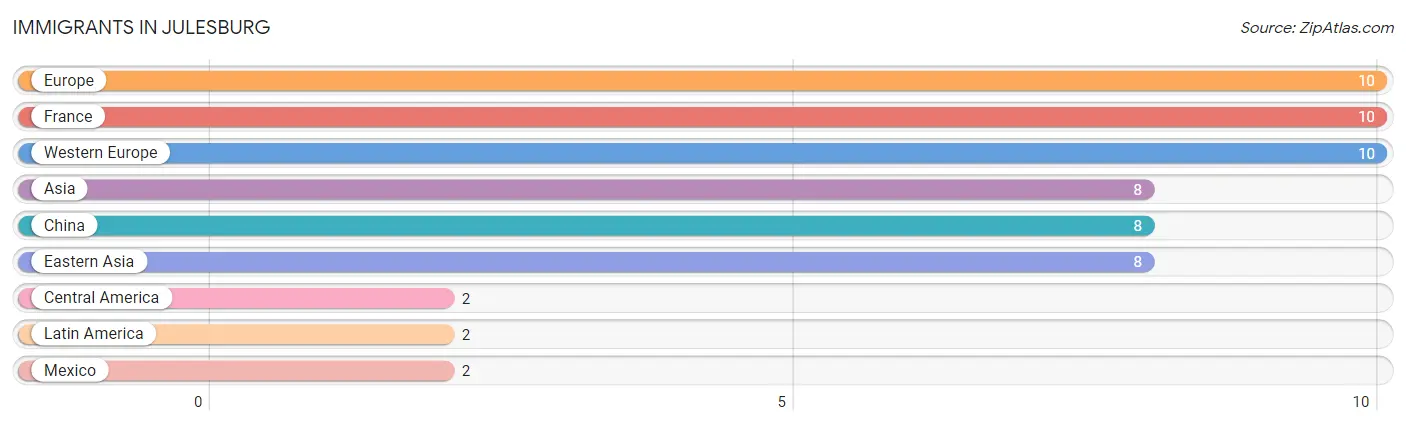
The most numerous immigrant groups reported in Julesburg came from Europe (10 | 0.8%), France (10 | 0.8%), Western Europe (10 | 0.8%), Asia (8 | 0.7%), and China (8 | 0.7%), together accounting for 3.9% of all Julesburg residents.
| Immigration Origin | # Population | % Population |
| Asia | 8 | 0.7% |
| Central America | 2 | 0.2% |
| China | 8 | 0.7% |
| Eastern Asia | 8 | 0.7% |
| Europe | 10 | 0.8% |
| France | 10 | 0.8% |
| Latin America | 2 | 0.2% |
| Mexico | 2 | 0.2% |
| Western Europe | 10 | 0.8% | View All 9 Rows |
Sex and Age in Julesburg
Sex and Age in Julesburg
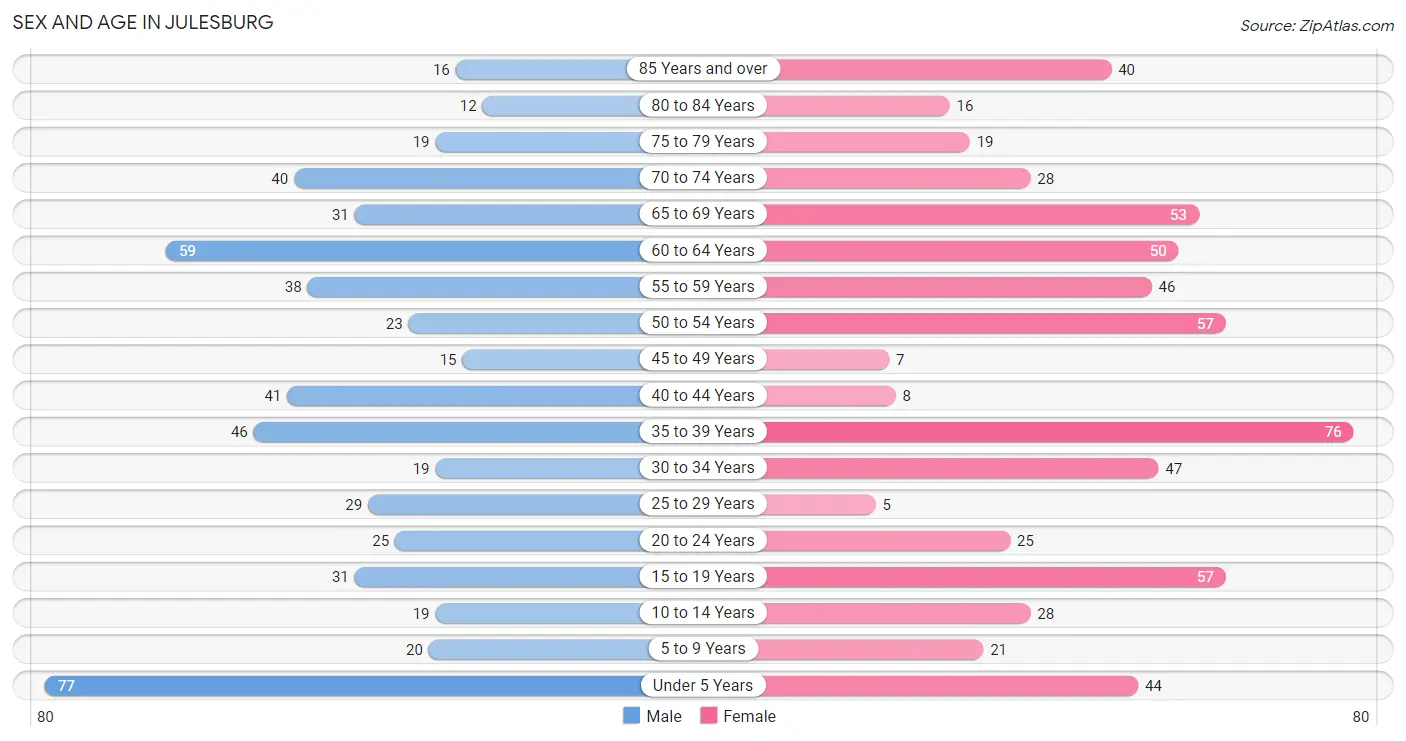
The most populous age groups in Julesburg are Under 5 Years (77 | 13.8%) for men and 35 to 39 Years (76 | 12.1%) for women.
| Age Bracket | Male | Female |
| Under 5 Years | 77 (13.8%) | 44 (7.0%) |
| 5 to 9 Years | 20 (3.6%) | 21 (3.4%) |
| 10 to 14 Years | 19 (3.4%) | 28 (4.5%) |
| 15 to 19 Years | 31 (5.5%) | 57 (9.1%) |
| 20 to 24 Years | 25 (4.5%) | 25 (4.0%) |
| 25 to 29 Years | 29 (5.2%) | 5 (0.8%) |
| 30 to 34 Years | 19 (3.4%) | 47 (7.5%) |
| 35 to 39 Years | 46 (8.2%) | 76 (12.1%) |
| 40 to 44 Years | 41 (7.3%) | 8 (1.3%) |
| 45 to 49 Years | 15 (2.7%) | 7 (1.1%) |
| 50 to 54 Years | 23 (4.1%) | 57 (9.1%) |
| 55 to 59 Years | 38 (6.8%) | 46 (7.3%) |
| 60 to 64 Years | 59 (10.5%) | 50 (8.0%) |
| 65 to 69 Years | 31 (5.5%) | 53 (8.5%) |
| 70 to 74 Years | 40 (7.1%) | 28 (4.5%) |
| 75 to 79 Years | 19 (3.4%) | 19 (3.0%) |
| 80 to 84 Years | 12 (2.1%) | 16 (2.5%) |
| 85 Years and over | 16 (2.9%) | 40 (6.4%) |
| Total | 560 (100.0%) | 627 (100.0%) |
Families and Households in Julesburg
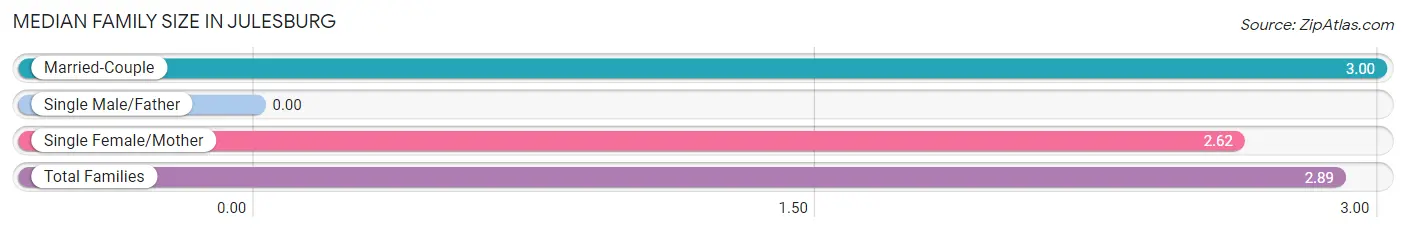
Median Family Size in Julesburg
| Family Type | # Families | Family Size |
| Married-Couple | 203 (70.2%) | 3.00 |
| Single Male/Father | 0 (0.0%) | - |
| Single Female/Mother | 86 (29.8%) | 2.62 |
| Total Families | 289 (100.0%) | 2.89 |
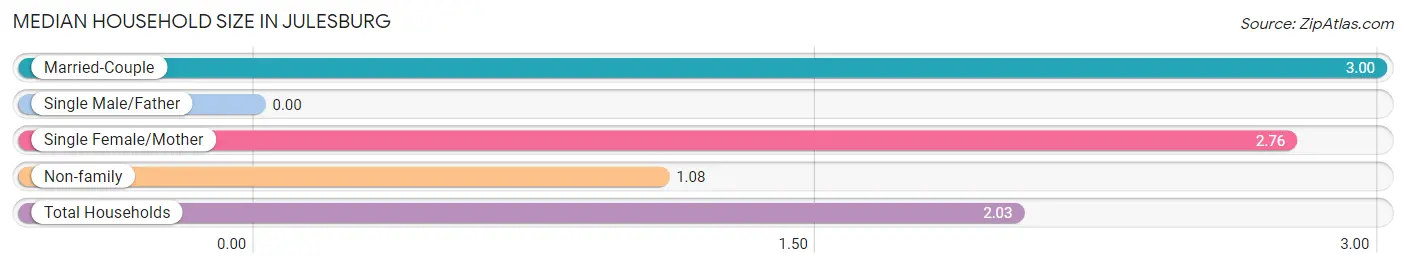
Median Household Size in Julesburg
| Household Type | # Households | Household Size |
| Married-Couple | 203 (36.1%) | 3.00 |
| Single Male/Father | 0 (0.0%) | - |
| Single Female/Mother | 86 (15.3%) | 2.76 |
| Non-family | 274 (48.7%) | 1.08 |
| Total Households | 563 (100.0%) | 2.03 |
Household Size by Marriage Status in Julesburg
Out of a total of 563 households in Julesburg, 289 (51.3%) are family households, while 274 (48.7%) are nonfamily households. The most numerous type of family households are 2-person households, comprising 148, and the most common type of nonfamily households are 1-person households, comprising 261.
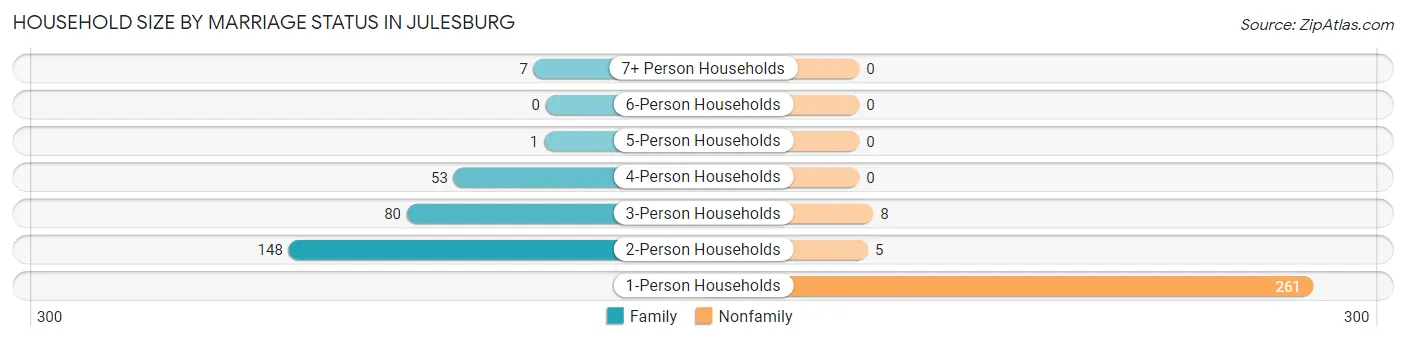
| Household Size | Family Households | Nonfamily Households |
| 1-Person Households | - | 261 (46.4%) |
| 2-Person Households | 148 (26.3%) | 5 (0.9%) |
| 3-Person Households | 80 (14.2%) | 8 (1.4%) |
| 4-Person Households | 53 (9.4%) | 0 (0.0%) |
| 5-Person Households | 1 (0.2%) | 0 (0.0%) |
| 6-Person Households | 0 (0.0%) | 0 (0.0%) |
| 7+ Person Households | 7 (1.2%) | 0 (0.0%) |
| Total | 289 (51.3%) | 274 (48.7%) |
Female Fertility in Julesburg
Fertility by Age in Julesburg
Average fertility rate in Julesburg is 92.0 births per 1,000 women. Women in the age bracket of 20 to 34 years have the highest fertility rate with 273.0 births per 1,000 women. Women in the age bracket of 20 to 34 years acount for 100.0% of all women with births.
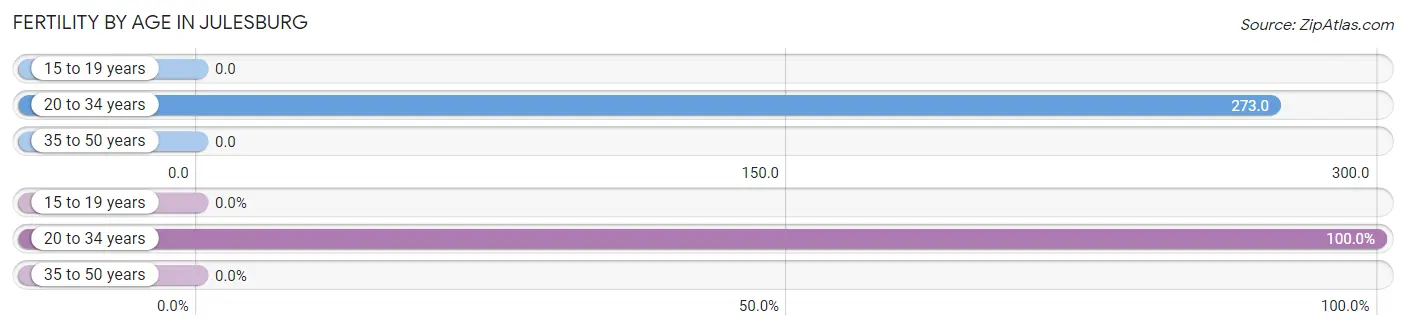
| Age Bracket | Women with Births | Births / 1,000 Women |
| 15 to 19 years | 0 (0.0%) | 0.0 |
| 20 to 34 years | 21 (100.0%) | 273.0 |
| 35 to 50 years | 0 (0.0%) | 0.0 |
| Total | 21 (100.0%) | 92.0 |
Fertility by Age by Marriage Status in Julesburg
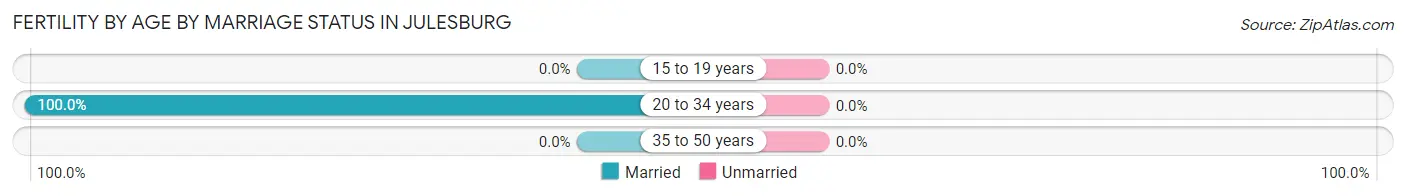
| Age Bracket | Married | Unmarried |
| 15 to 19 years | 0 (0.0%) | 0 (0.0%) |
| 20 to 34 years | 21 (100.0%) | 0 (0.0%) |
| 35 to 50 years | 0 (0.0%) | 0 (0.0%) |
| Total | 21 (100.0%) | 0 (0.0%) |
Fertility by Education in Julesburg
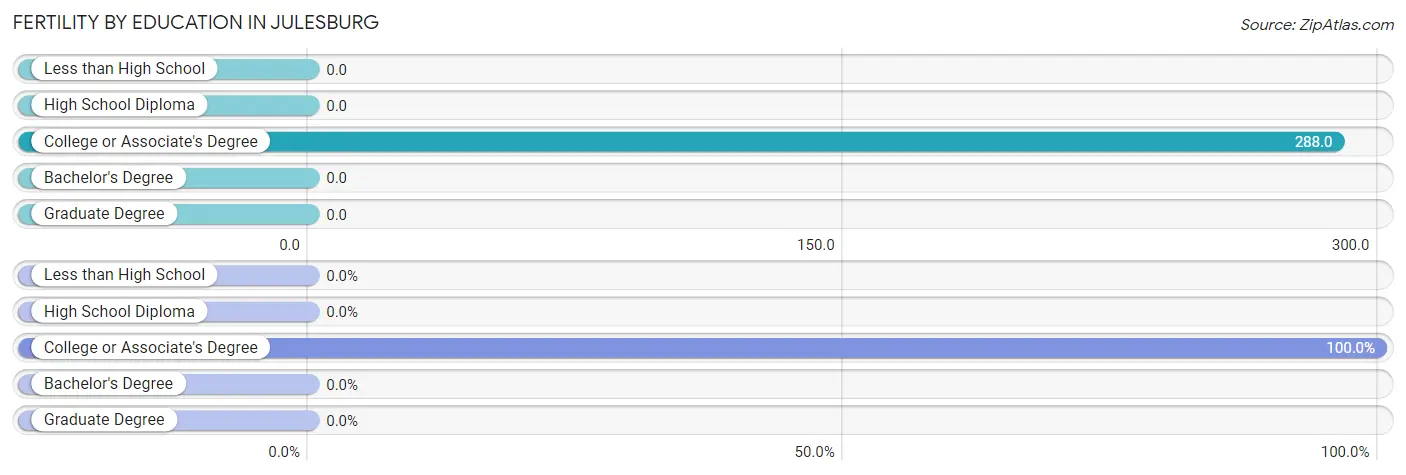
| Educational Attainment | Women with Births | Births / 1,000 Women |
| Less than High School | 0 (0.0%) | 0.0 |
| High School Diploma | 0 (0.0%) | 0.0 |
| College or Associate's Degree | 21 (100.0%) | 288.0 |
| Bachelor's Degree | 0 (0.0%) | 0.0 |
| Graduate Degree | 0 (0.0%) | 0.0 |
| Total | 21 (100.0%) | 92.0 |
Fertility by Education by Marriage Status in Julesburg
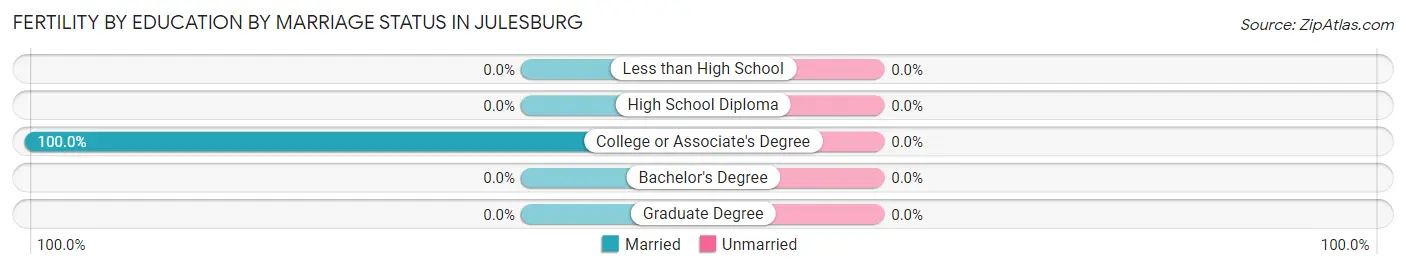
| Educational Attainment | Married | Unmarried |
| Less than High School | 0 (0.0%) | 0 (0.0%) |
| High School Diploma | 0 (0.0%) | 0 (0.0%) |
| College or Associate's Degree | 21 (100.0%) | 0 (0.0%) |
| Bachelor's Degree | 0 (0.0%) | 0 (0.0%) |
| Graduate Degree | 0 (0.0%) | 0 (0.0%) |
| Total | 21 (100.0%) | 0 (0.0%) |
Employment Characteristics in Julesburg
Employment by Class of Employer in Julesburg
Among the 488 employed individuals in Julesburg, private company employees (306 | 62.7%), local government employees (58 | 11.9%), and not-for-profit organizations (35 | 7.2%) make up the most common classes of employment.
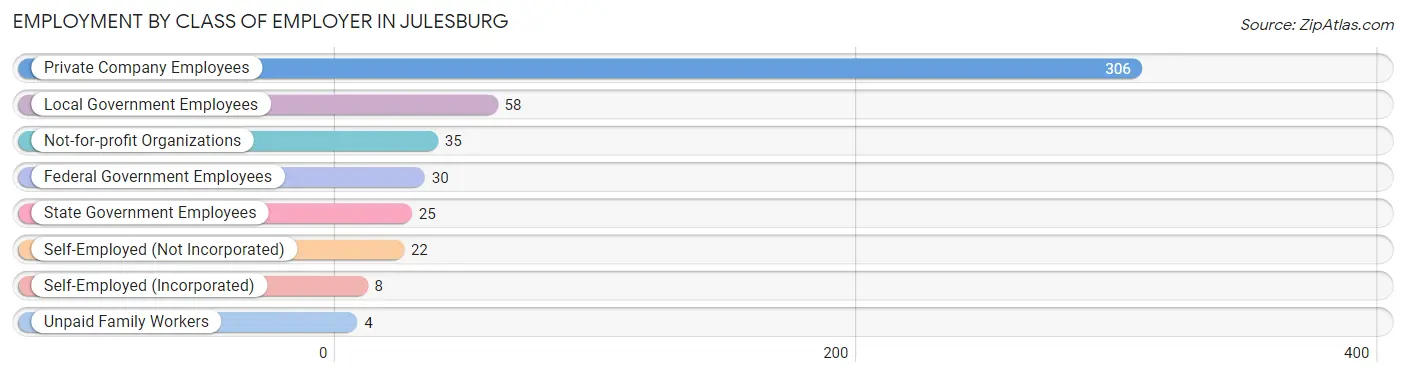
| Employer Class | # Employees | % Employees |
| Private Company Employees | 306 | 62.7% |
| Self-Employed (Incorporated) | 8 | 1.6% |
| Self-Employed (Not Incorporated) | 22 | 4.5% |
| Not-for-profit Organizations | 35 | 7.2% |
| Local Government Employees | 58 | 11.9% |
| State Government Employees | 25 | 5.1% |
| Federal Government Employees | 30 | 6.1% |
| Unpaid Family Workers | 4 | 0.8% |
| Total | 488 | 100.0% |
Employment Status by Age in Julesburg
According to the labor force statistics for Julesburg, out of the total population over 16 years of age (956), 54.5% or 521 individuals are in the labor force, with 4.2% or 22 of them unemployed. The age group with the highest labor force participation rate is 20 to 24 years, with 100.0% or 50 individuals in the labor force. Within the labor force, the 30 to 34 years age range has the highest percentage of unemployed individuals, with 16.0% or 8 of them being unemployed.
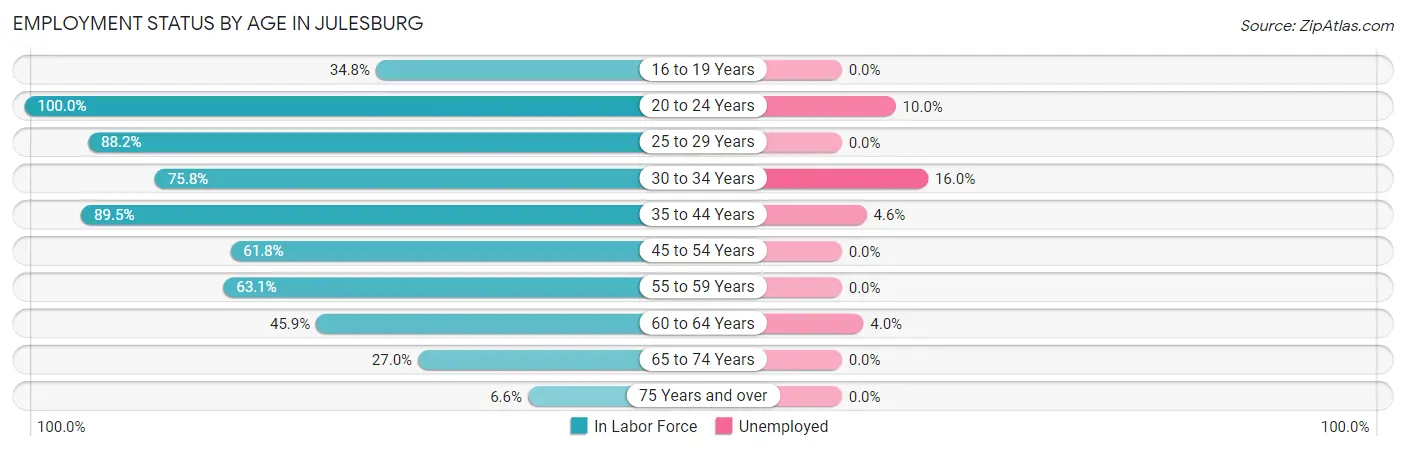
| Age Bracket | In Labor Force | Unemployed |
| 16 to 19 Years | 23 (34.8%) | 0 (0.0%) |
| 20 to 24 Years | 50 (100.0%) | 5 (10.0%) |
| 25 to 29 Years | 30 (88.2%) | 0 (0.0%) |
| 30 to 34 Years | 50 (75.8%) | 8 (16.0%) |
| 35 to 44 Years | 153 (89.5%) | 7 (4.6%) |
| 45 to 54 Years | 63 (61.8%) | 0 (0.0%) |
| 55 to 59 Years | 53 (63.1%) | 0 (0.0%) |
| 60 to 64 Years | 50 (45.9%) | 2 (4.0%) |
| 65 to 74 Years | 41 (27.0%) | 0 (0.0%) |
| 75 Years and over | 8 (6.6%) | 0 (0.0%) |
| Total | 521 (54.5%) | 22 (4.2%) |
Employment Status by Educational Attainment in Julesburg
According to labor force statistics for Julesburg, 70.5% of individuals (399) out of the total population between 25 and 64 years of age (566) are in the labor force, with 4.3% or 17 of them being unemployed. The group with the highest labor force participation rate are those with the educational attainment of college / associate degree, with 87.5% or 223 individuals in the labor force. Within the labor force, individuals with high school diploma education have the highest percentage of unemployment, with 9.1% or 7 of them being unemployed.
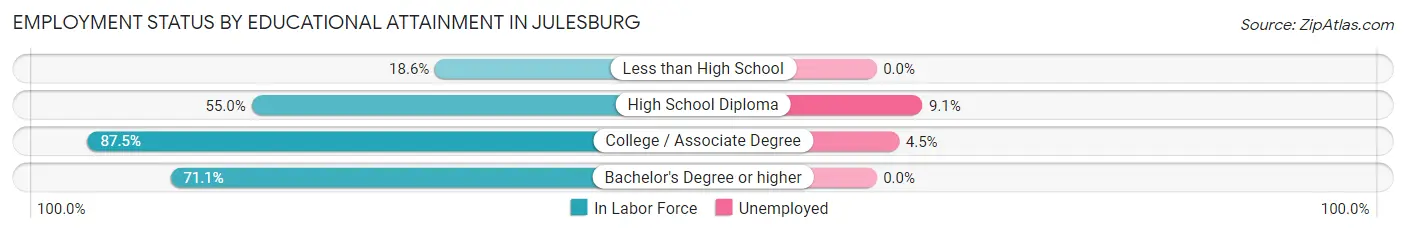
| Educational Attainment | In Labor Force | Unemployed |
| Less than High School | 8 (18.6%) | 0 (0.0%) |
| High School Diploma | 77 (55.0%) | 13 (9.1%) |
| College / Associate Degree | 223 (87.5%) | 11 (4.5%) |
| Bachelor's Degree or higher | 91 (71.1%) | 0 (0.0%) |
| Total | 399 (70.5%) | 24 (4.3%) |
Employment Occupations by Sex in Julesburg
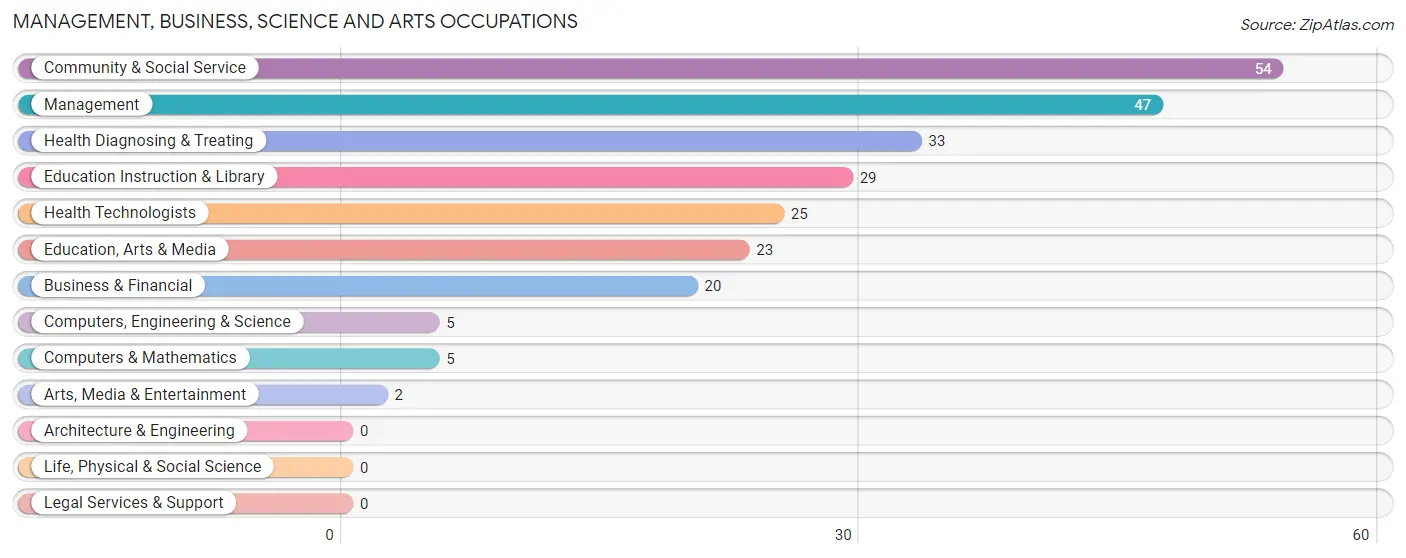
Management, Business, Science and Arts Occupations
The most common Management, Business, Science and Arts occupations in Julesburg are Community & Social Service (54 | 10.8%), Management (47 | 9.4%), Health Diagnosing & Treating (33 | 6.6%), Education Instruction & Library (29 | 5.8%), and Health Technologists (25 | 5.0%).
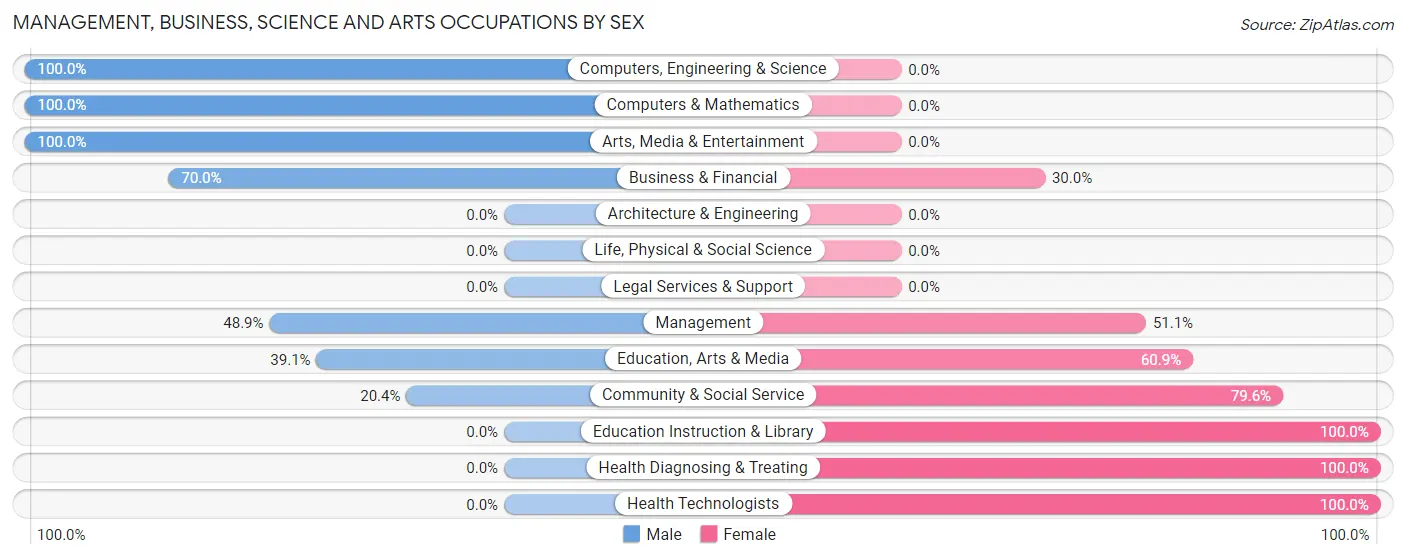
Management, Business, Science and Arts Occupations by Sex
Within the Management, Business, Science and Arts occupations in Julesburg, the most male-oriented occupations are Computers, Engineering & Science (100.0%), Computers & Mathematics (100.0%), and Arts, Media & Entertainment (100.0%), while the most female-oriented occupations are Education Instruction & Library (100.0%), Health Diagnosing & Treating (100.0%), and Health Technologists (100.0%).
| Occupation | Male | Female |
| Management | 23 (48.9%) | 24 (51.1%) |
| Business & Financial | 14 (70.0%) | 6 (30.0%) |
| Computers, Engineering & Science | 5 (100.0%) | 0 (0.0%) |
| Computers & Mathematics | 5 (100.0%) | 0 (0.0%) |
| Architecture & Engineering | 0 (0.0%) | 0 (0.0%) |
| Life, Physical & Social Science | 0 (0.0%) | 0 (0.0%) |
| Community & Social Service | 11 (20.4%) | 43 (79.6%) |
| Education, Arts & Media | 9 (39.1%) | 14 (60.9%) |
| Legal Services & Support | 0 (0.0%) | 0 (0.0%) |
| Education Instruction & Library | 0 (0.0%) | 29 (100.0%) |
| Arts, Media & Entertainment | 2 (100.0%) | 0 (0.0%) |
| Health Diagnosing & Treating | 0 (0.0%) | 33 (100.0%) |
| Health Technologists | 0 (0.0%) | 25 (100.0%) |
| Total (Category) | 53 (33.3%) | 106 (66.7%) |
| Total (Overall) | 223 (44.7%) | 276 (55.3%) |
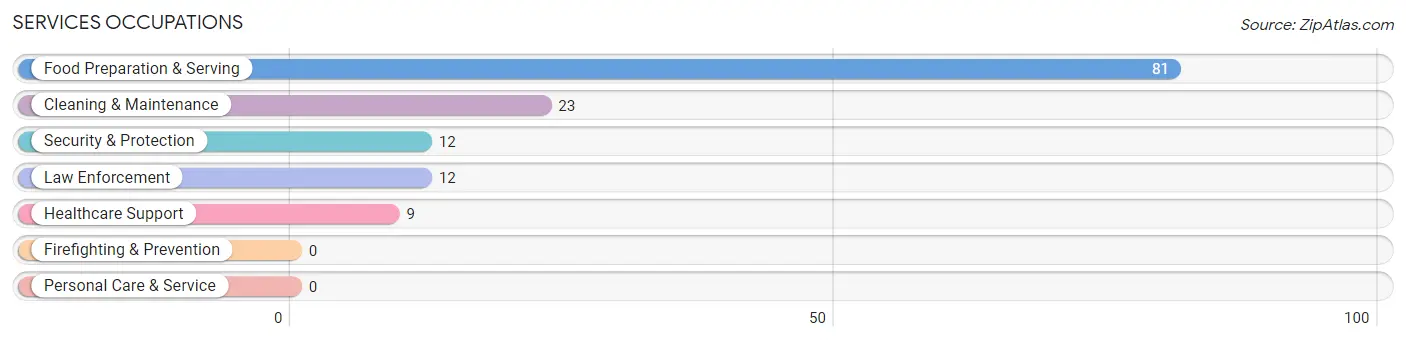
Services Occupations
The most common Services occupations in Julesburg are Food Preparation & Serving (81 | 16.2%), Cleaning & Maintenance (23 | 4.6%), Security & Protection (12 | 2.4%), Law Enforcement (12 | 2.4%), and Healthcare Support (9 | 1.8%).
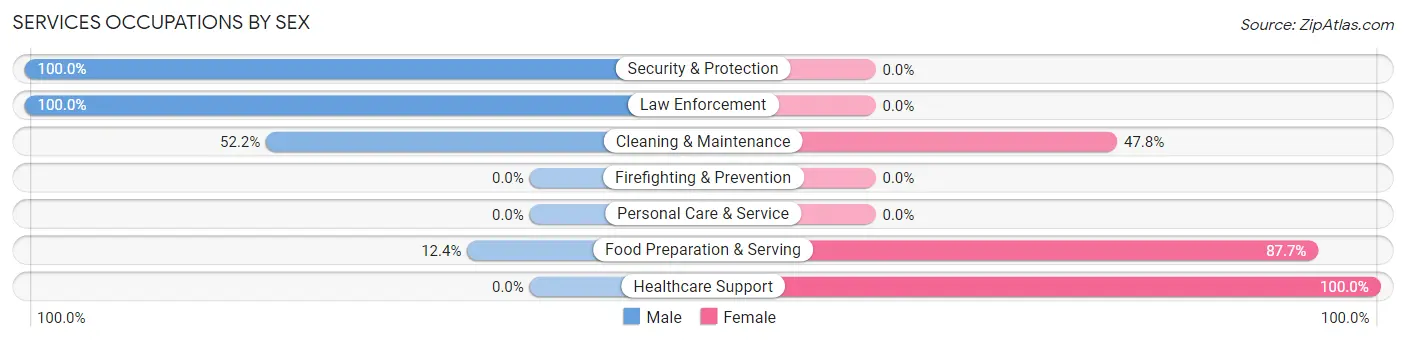
Services Occupations by Sex
Within the Services occupations in Julesburg, the most male-oriented occupations are Security & Protection (100.0%), Law Enforcement (100.0%), and Cleaning & Maintenance (52.2%), while the most female-oriented occupations are Healthcare Support (100.0%), Food Preparation & Serving (87.6%), and Cleaning & Maintenance (47.8%).
| Occupation | Male | Female |
| Healthcare Support | 0 (0.0%) | 9 (100.0%) |
| Security & Protection | 12 (100.0%) | 0 (0.0%) |
| Firefighting & Prevention | 0 (0.0%) | 0 (0.0%) |
| Law Enforcement | 12 (100.0%) | 0 (0.0%) |
| Food Preparation & Serving | 10 (12.3%) | 71 (87.6%) |
| Cleaning & Maintenance | 12 (52.2%) | 11 (47.8%) |
| Personal Care & Service | 0 (0.0%) | 0 (0.0%) |
| Total (Category) | 34 (27.2%) | 91 (72.8%) |
| Total (Overall) | 223 (44.7%) | 276 (55.3%) |
Sales and Office Occupations
The most common Sales and Office occupations in Julesburg are Sales & Related (71 | 14.2%), and Office & Administration (36 | 7.2%).
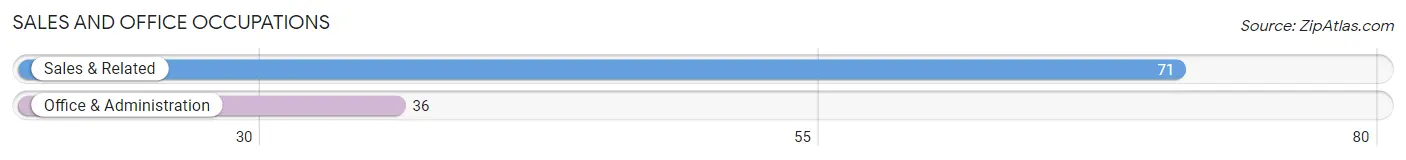
Sales and Office Occupations by Sex
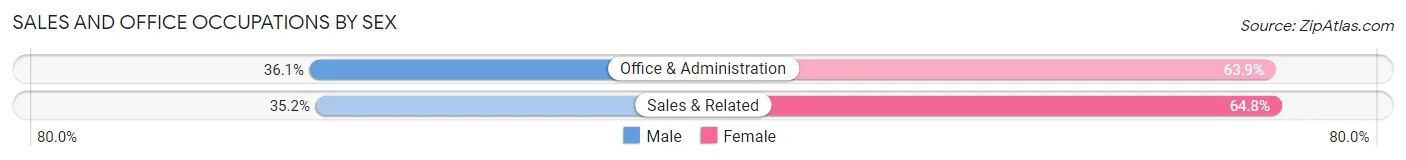
| Occupation | Male | Female |
| Sales & Related | 25 (35.2%) | 46 (64.8%) |
| Office & Administration | 13 (36.1%) | 23 (63.9%) |
| Total (Category) | 38 (35.5%) | 69 (64.5%) |
| Total (Overall) | 223 (44.7%) | 276 (55.3%) |
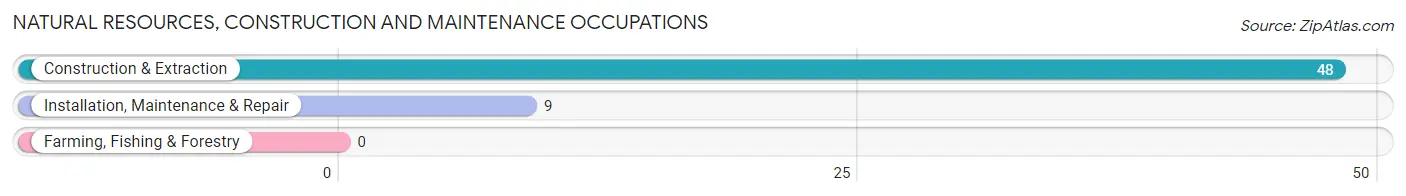
Natural Resources, Construction and Maintenance Occupations
The most common Natural Resources, Construction and Maintenance occupations in Julesburg are Construction & Extraction (48 | 9.6%), and Installation, Maintenance & Repair (9 | 1.8%).
Natural Resources, Construction and Maintenance Occupations by Sex
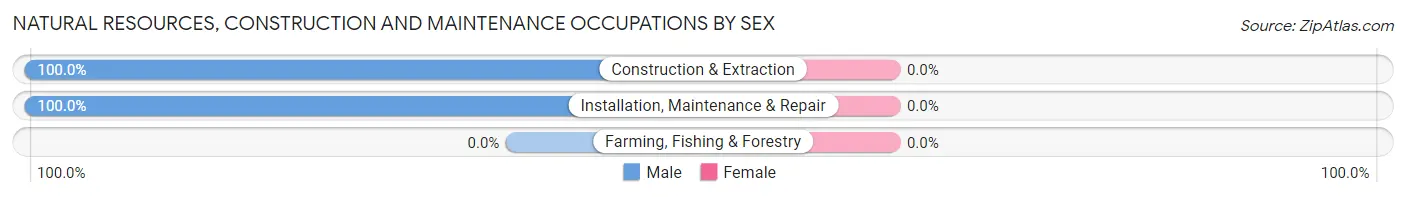
| Occupation | Male | Female |
| Farming, Fishing & Forestry | 0 (0.0%) | 0 (0.0%) |
| Construction & Extraction | 48 (100.0%) | 0 (0.0%) |
| Installation, Maintenance & Repair | 9 (100.0%) | 0 (0.0%) |
| Total (Category) | 57 (100.0%) | 0 (0.0%) |
| Total (Overall) | 223 (44.7%) | 276 (55.3%) |
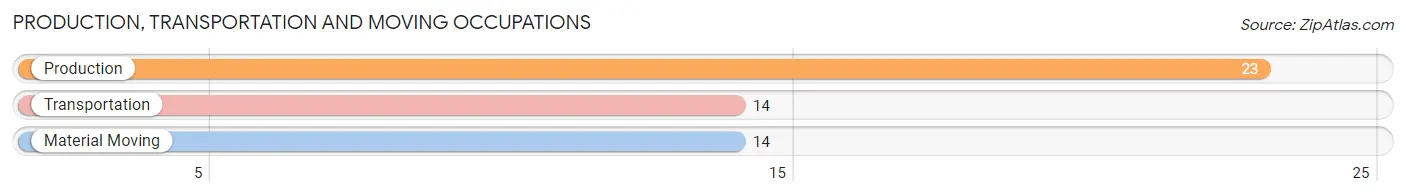
Production, Transportation and Moving Occupations
The most common Production, Transportation and Moving occupations in Julesburg are Production (23 | 4.6%), Transportation (14 | 2.8%), and Material Moving (14 | 2.8%).
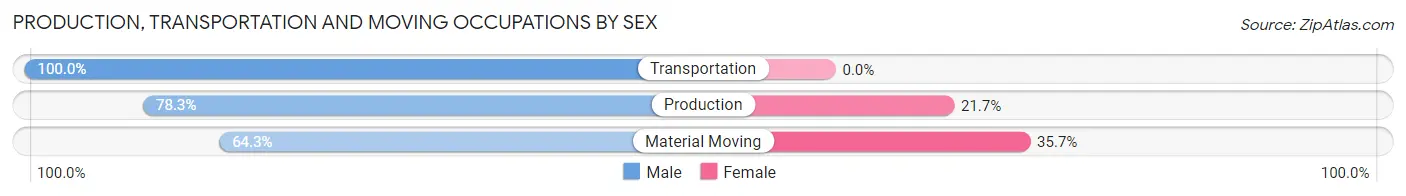
Production, Transportation and Moving Occupations by Sex
| Occupation | Male | Female |
| Production | 18 (78.3%) | 5 (21.7%) |
| Transportation | 14 (100.0%) | 0 (0.0%) |
| Material Moving | 9 (64.3%) | 5 (35.7%) |
| Total (Category) | 41 (80.4%) | 10 (19.6%) |
| Total (Overall) | 223 (44.7%) | 276 (55.3%) |
Employment Industries by Sex in Julesburg
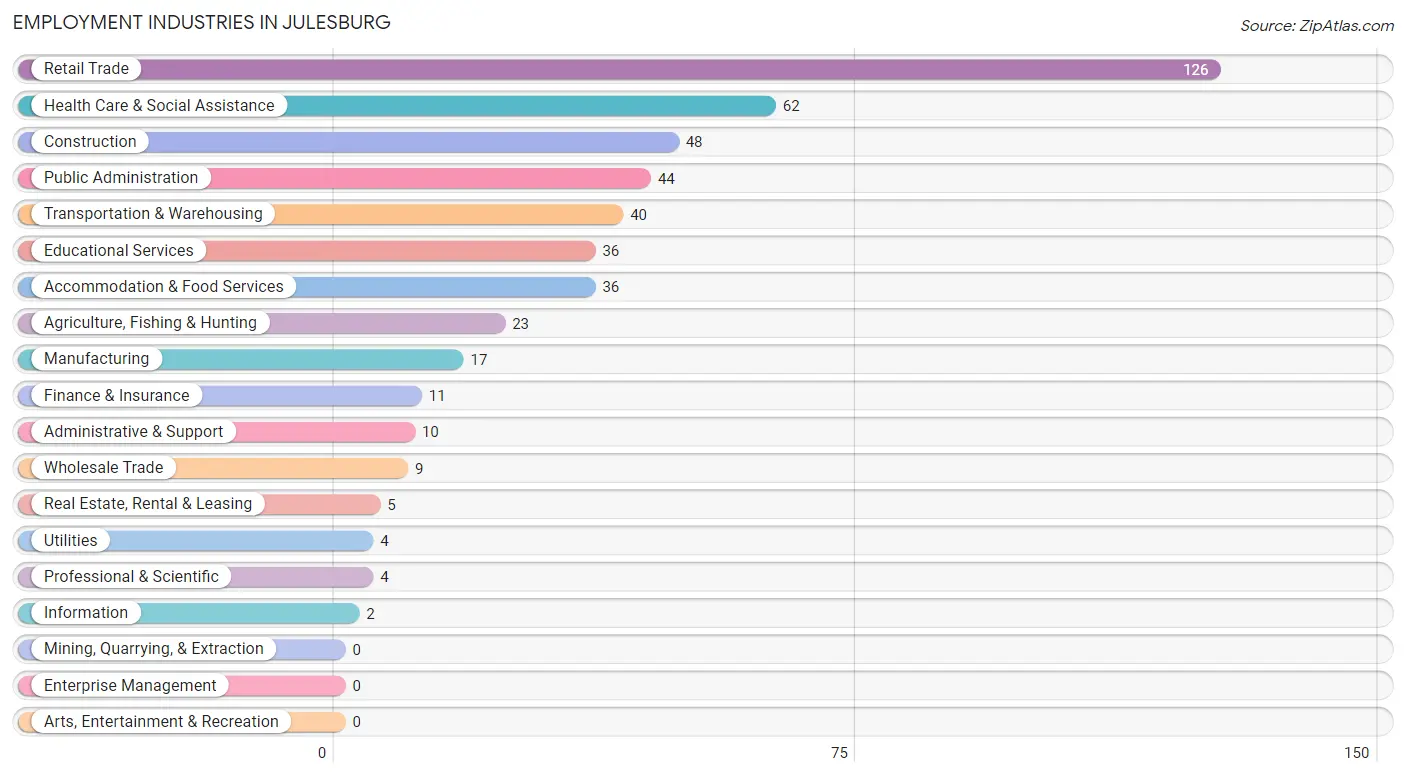
Employment Industries in Julesburg
The major employment industries in Julesburg include Retail Trade (126 | 25.3%), Health Care & Social Assistance (62 | 12.4%), Construction (48 | 9.6%), Public Administration (44 | 8.8%), and Transportation & Warehousing (40 | 8.0%).
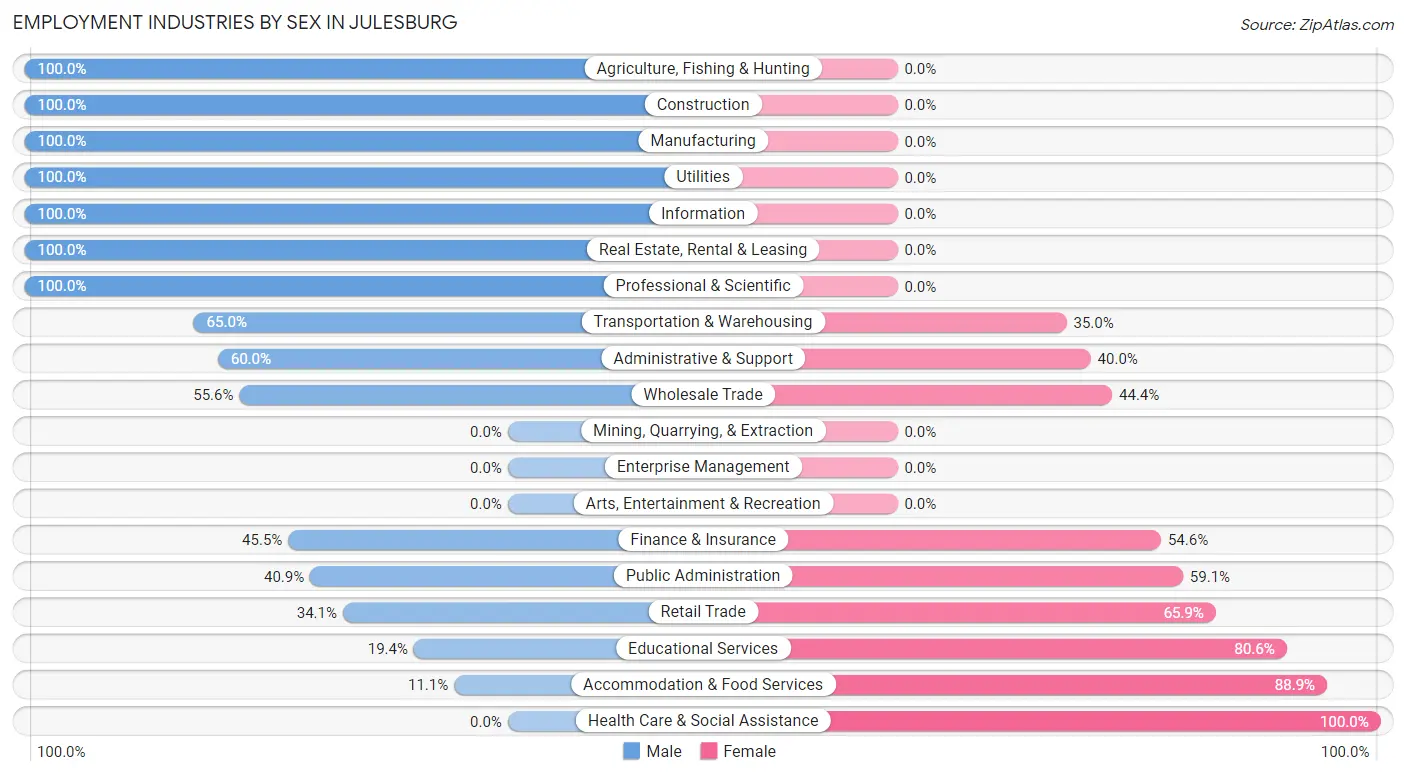
Employment Industries by Sex in Julesburg
The Julesburg industries that see more men than women are Agriculture, Fishing & Hunting (100.0%), Construction (100.0%), and Manufacturing (100.0%), whereas the industries that tend to have a higher number of women are Health Care & Social Assistance (100.0%), Accommodation & Food Services (88.9%), and Educational Services (80.6%).
| Industry | Male | Female |
| Agriculture, Fishing & Hunting | 23 (100.0%) | 0 (0.0%) |
| Mining, Quarrying, & Extraction | 0 (0.0%) | 0 (0.0%) |
| Construction | 48 (100.0%) | 0 (0.0%) |
| Manufacturing | 17 (100.0%) | 0 (0.0%) |
| Wholesale Trade | 5 (55.6%) | 4 (44.4%) |
| Retail Trade | 43 (34.1%) | 83 (65.9%) |
| Transportation & Warehousing | 26 (65.0%) | 14 (35.0%) |
| Utilities | 4 (100.0%) | 0 (0.0%) |
| Information | 2 (100.0%) | 0 (0.0%) |
| Finance & Insurance | 5 (45.5%) | 6 (54.5%) |
| Real Estate, Rental & Leasing | 5 (100.0%) | 0 (0.0%) |
| Professional & Scientific | 4 (100.0%) | 0 (0.0%) |
| Enterprise Management | 0 (0.0%) | 0 (0.0%) |
| Administrative & Support | 6 (60.0%) | 4 (40.0%) |
| Educational Services | 7 (19.4%) | 29 (80.6%) |
| Health Care & Social Assistance | 0 (0.0%) | 62 (100.0%) |
| Arts, Entertainment & Recreation | 0 (0.0%) | 0 (0.0%) |
| Accommodation & Food Services | 4 (11.1%) | 32 (88.9%) |
| Public Administration | 18 (40.9%) | 26 (59.1%) |
| Total | 223 (44.7%) | 276 (55.3%) |
Education in Julesburg
School Enrollment in Julesburg
The most common levels of schooling among the 209 students in Julesburg are high school (86 | 41.1%), middle school (38 | 18.2%), and nursery / preschool (33 | 15.8%).
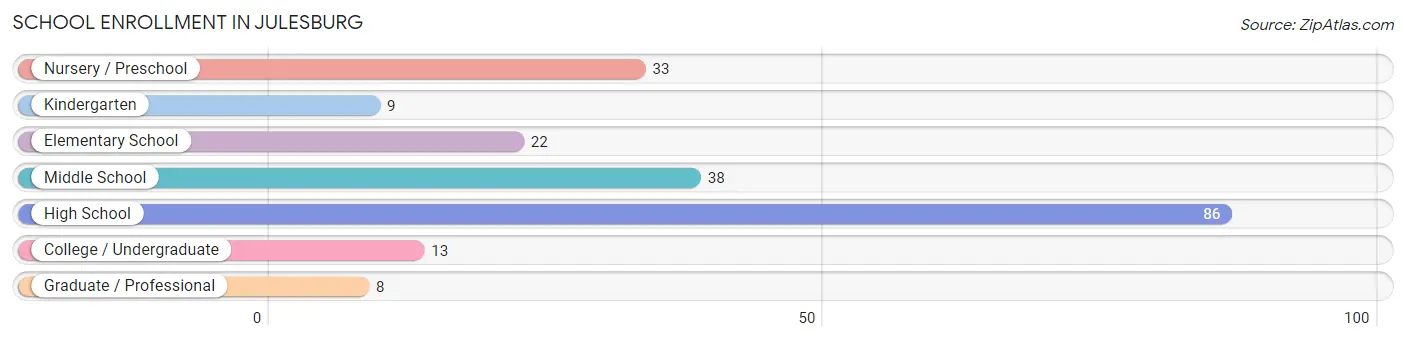
| School Level | # Students | % Students |
| Nursery / Preschool | 33 | 15.8% |
| Kindergarten | 9 | 4.3% |
| Elementary School | 22 | 10.5% |
| Middle School | 38 | 18.2% |
| High School | 86 | 41.1% |
| College / Undergraduate | 13 | 6.2% |
| Graduate / Professional | 8 | 3.8% |
| Total | 209 | 100.0% |
School Enrollment by Age by Funding Source in Julesburg
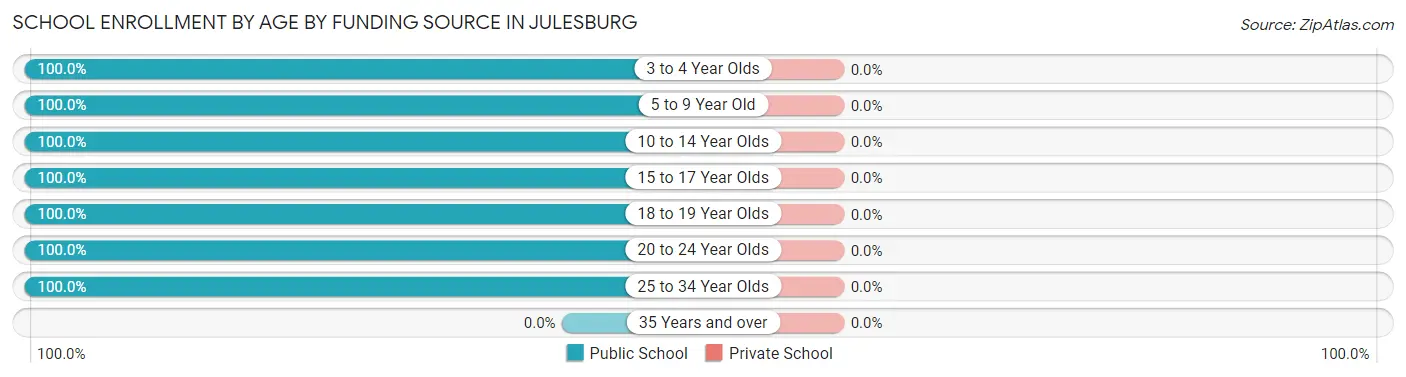
| Age Bracket | Public School | Private School |
| 3 to 4 Year Olds | 18 (100.0%) | 0 (0.0%) |
| 5 to 9 Year Old | 41 (100.0%) | 0 (0.0%) |
| 10 to 14 Year Olds | 47 (100.0%) | 0 (0.0%) |
| 15 to 17 Year Olds | 77 (100.0%) | 0 (0.0%) |
| 18 to 19 Year Olds | 5 (100.0%) | 0 (0.0%) |
| 20 to 24 Year Olds | 13 (100.0%) | 0 (0.0%) |
| 25 to 34 Year Olds | 8 (100.0%) | 0 (0.0%) |
| 35 Years and over | 0 (0.0%) | 0 (0.0%) |
| Total | 209 (100.0%) | 0 (0.0%) |
Educational Attainment by Field of Study in Julesburg
Education (44 | 21.3%), bio, nature & agricultural (26 | 12.6%), business (24 | 11.6%), arts & humanities (18 | 8.7%), and engineering (16 | 7.7%) are the most common fields of study among 207 individuals in Julesburg who have obtained a bachelor's degree or higher.
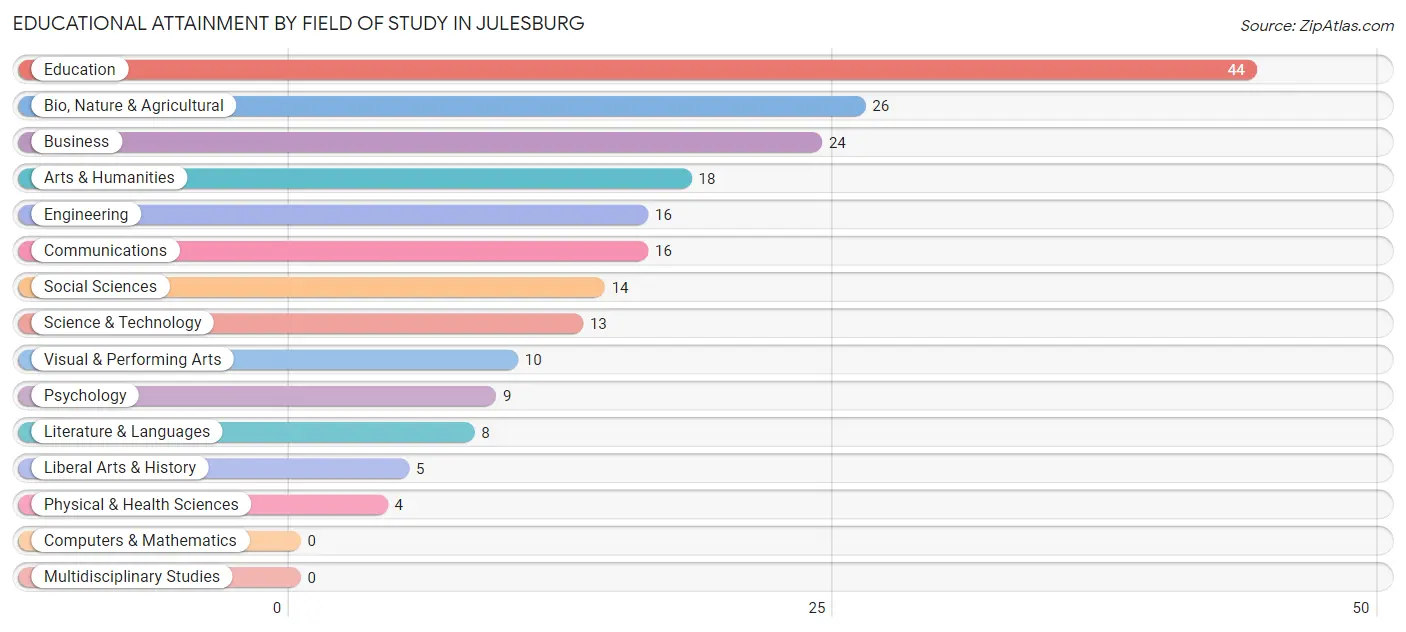
| Field of Study | # Graduates | % Graduates |
| Computers & Mathematics | 0 | 0.0% |
| Bio, Nature & Agricultural | 26 | 12.6% |
| Physical & Health Sciences | 4 | 1.9% |
| Psychology | 9 | 4.3% |
| Social Sciences | 14 | 6.8% |
| Engineering | 16 | 7.7% |
| Multidisciplinary Studies | 0 | 0.0% |
| Science & Technology | 13 | 6.3% |
| Business | 24 | 11.6% |
| Education | 44 | 21.3% |
| Literature & Languages | 8 | 3.9% |
| Liberal Arts & History | 5 | 2.4% |
| Visual & Performing Arts | 10 | 4.8% |
| Communications | 16 | 7.7% |
| Arts & Humanities | 18 | 8.7% |
| Total | 207 | 100.0% |
Transportation & Commute in Julesburg
Vehicle Availability by Sex in Julesburg
The most prevalent vehicle ownership categories in Julesburg are males with 2 vehicles (65, accounting for 29.5%) and females with 2 vehicles (74, making up 24.2%).
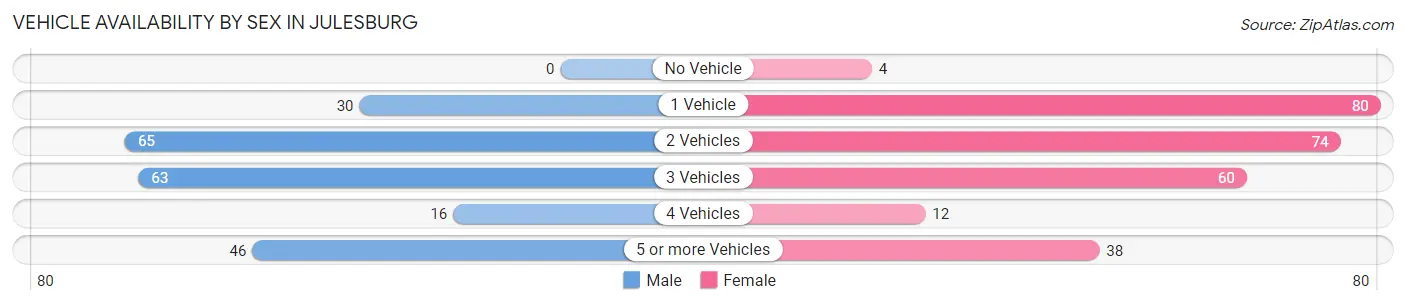
| Vehicles Available | Male | Female |
| No Vehicle | 0 (0.0%) | 4 (1.5%) |
| 1 Vehicle | 30 (13.6%) | 80 (29.8%) |
| 2 Vehicles | 65 (29.5%) | 74 (27.6%) |
| 3 Vehicles | 63 (28.6%) | 60 (22.4%) |
| 4 Vehicles | 16 (7.3%) | 12 (4.5%) |
| 5 or more Vehicles | 46 (20.9%) | 38 (14.2%) |
| Total | 220 (100.0%) | 268 (100.0%) |
Commute Time in Julesburg
The most frequently occuring commute durations in Julesburg are less than 5 minutes (140 commuters, 29.2%), 5 to 9 minutes (120 commuters, 25.1%), and 10 to 14 minutes (53 commuters, 11.1%).
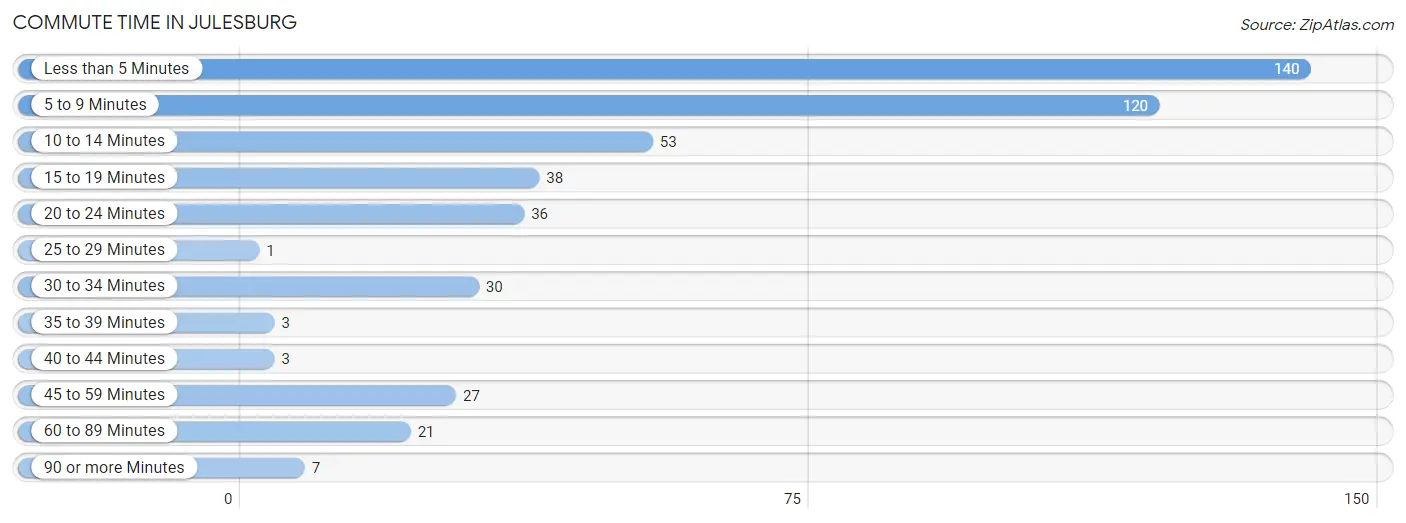
| Commute Time | # Commuters | % Commuters |
| Less than 5 Minutes | 140 | 29.2% |
| 5 to 9 Minutes | 120 | 25.1% |
| 10 to 14 Minutes | 53 | 11.1% |
| 15 to 19 Minutes | 38 | 7.9% |
| 20 to 24 Minutes | 36 | 7.5% |
| 25 to 29 Minutes | 1 | 0.2% |
| 30 to 34 Minutes | 30 | 6.3% |
| 35 to 39 Minutes | 3 | 0.6% |
| 40 to 44 Minutes | 3 | 0.6% |
| 45 to 59 Minutes | 27 | 5.6% |
| 60 to 89 Minutes | 21 | 4.4% |
| 90 or more Minutes | 7 | 1.5% |
Commute Time by Sex in Julesburg
The most common commute times in Julesburg are 5 to 9 minutes (58 commuters, 26.6%) for males and less than 5 minutes (92 commuters, 35.2%) for females.
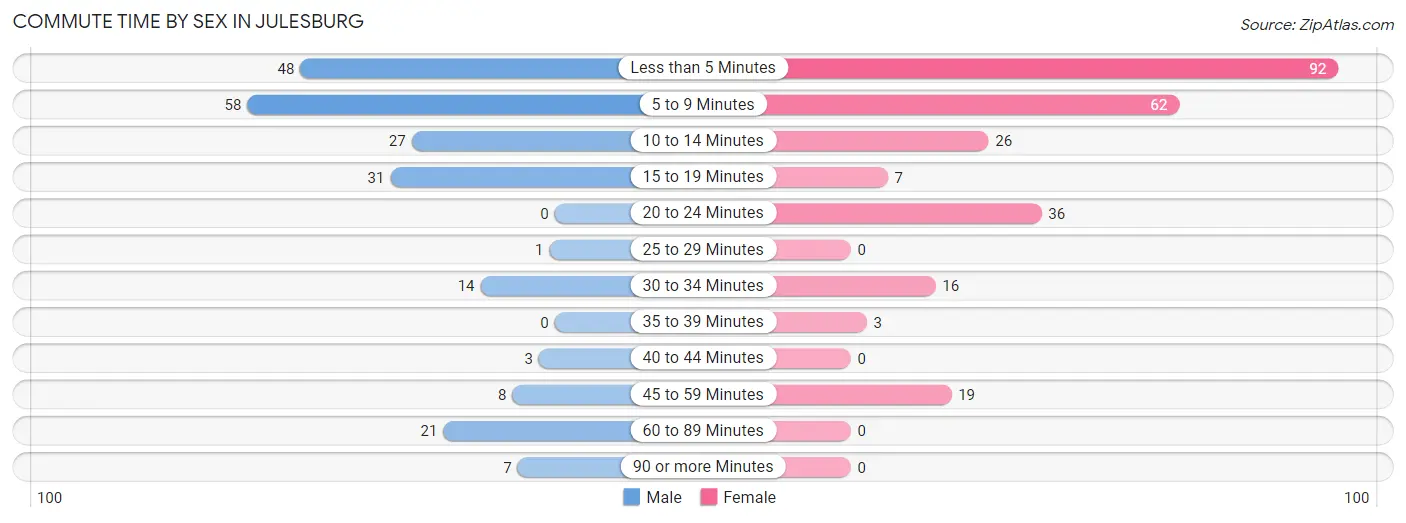
| Commute Time | Male | Female |
| Less than 5 Minutes | 48 (22.0%) | 92 (35.2%) |
| 5 to 9 Minutes | 58 (26.6%) | 62 (23.7%) |
| 10 to 14 Minutes | 27 (12.4%) | 26 (10.0%) |
| 15 to 19 Minutes | 31 (14.2%) | 7 (2.7%) |
| 20 to 24 Minutes | 0 (0.0%) | 36 (13.8%) |
| 25 to 29 Minutes | 1 (0.5%) | 0 (0.0%) |
| 30 to 34 Minutes | 14 (6.4%) | 16 (6.1%) |
| 35 to 39 Minutes | 0 (0.0%) | 3 (1.1%) |
| 40 to 44 Minutes | 3 (1.4%) | 0 (0.0%) |
| 45 to 59 Minutes | 8 (3.7%) | 19 (7.3%) |
| 60 to 89 Minutes | 21 (9.6%) | 0 (0.0%) |
| 90 or more Minutes | 7 (3.2%) | 0 (0.0%) |
Time of Departure to Work by Sex in Julesburg
The most frequent times of departure to work in Julesburg are 5:30 AM to 5:59 AM (46, 21.1%) for males and 7:30 AM to 7:59 AM (89, 34.1%) for females.
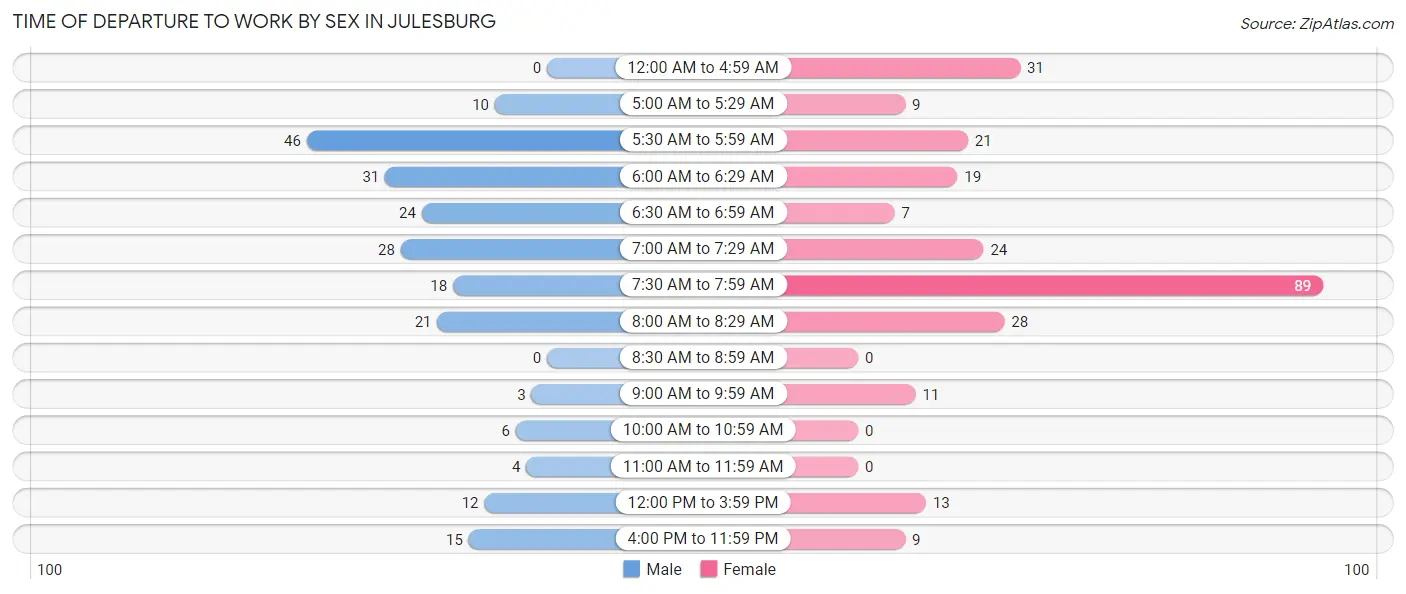
| Time of Departure | Male | Female |
| 12:00 AM to 4:59 AM | 0 (0.0%) | 31 (11.9%) |
| 5:00 AM to 5:29 AM | 10 (4.6%) | 9 (3.5%) |
| 5:30 AM to 5:59 AM | 46 (21.1%) | 21 (8.1%) |
| 6:00 AM to 6:29 AM | 31 (14.2%) | 19 (7.3%) |
| 6:30 AM to 6:59 AM | 24 (11.0%) | 7 (2.7%) |
| 7:00 AM to 7:29 AM | 28 (12.8%) | 24 (9.2%) |
| 7:30 AM to 7:59 AM | 18 (8.3%) | 89 (34.1%) |
| 8:00 AM to 8:29 AM | 21 (9.6%) | 28 (10.7%) |
| 8:30 AM to 8:59 AM | 0 (0.0%) | 0 (0.0%) |
| 9:00 AM to 9:59 AM | 3 (1.4%) | 11 (4.2%) |
| 10:00 AM to 10:59 AM | 6 (2.8%) | 0 (0.0%) |
| 11:00 AM to 11:59 AM | 4 (1.8%) | 0 (0.0%) |
| 12:00 PM to 3:59 PM | 12 (5.5%) | 13 (5.0%) |
| 4:00 PM to 11:59 PM | 15 (6.9%) | 9 (3.5%) |
| Total | 218 (100.0%) | 261 (100.0%) |
Housing Occupancy in Julesburg
Occupancy by Ownership in Julesburg
Of the total 563 dwellings in Julesburg, owner-occupied units account for 315 (55.9%), while renter-occupied units make up 248 (44.1%).
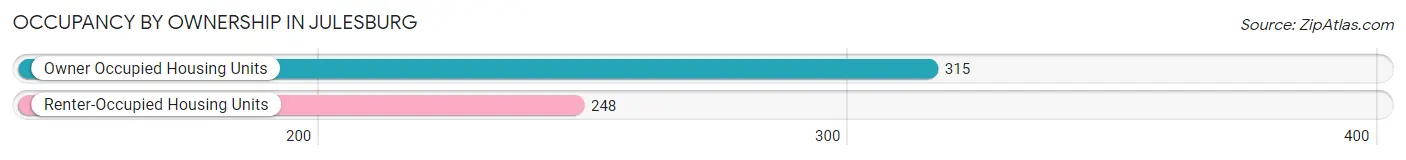
| Occupancy | # Housing Units | % Housing Units |
| Owner Occupied Housing Units | 315 | 55.9% |
| Renter-Occupied Housing Units | 248 | 44.1% |
| Total Occupied Housing Units | 563 | 100.0% |
Occupancy by Household Size in Julesburg
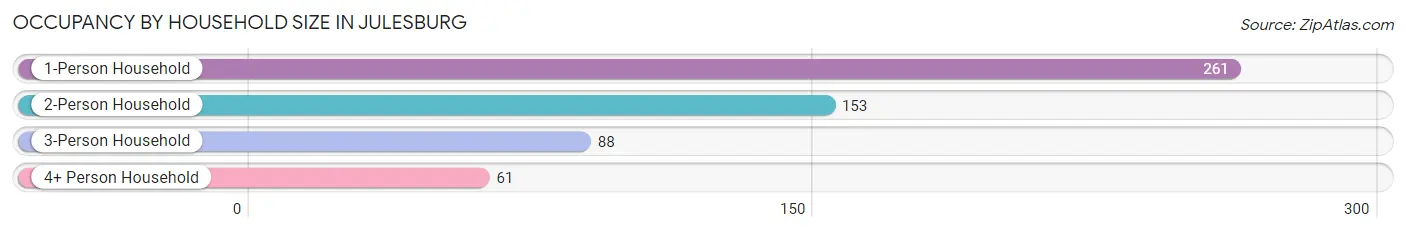
| Household Size | # Housing Units | % Housing Units |
| 1-Person Household | 261 | 46.4% |
| 2-Person Household | 153 | 27.2% |
| 3-Person Household | 88 | 15.6% |
| 4+ Person Household | 61 | 10.8% |
| Total Housing Units | 563 | 100.0% |
Occupancy by Ownership by Household Size in Julesburg
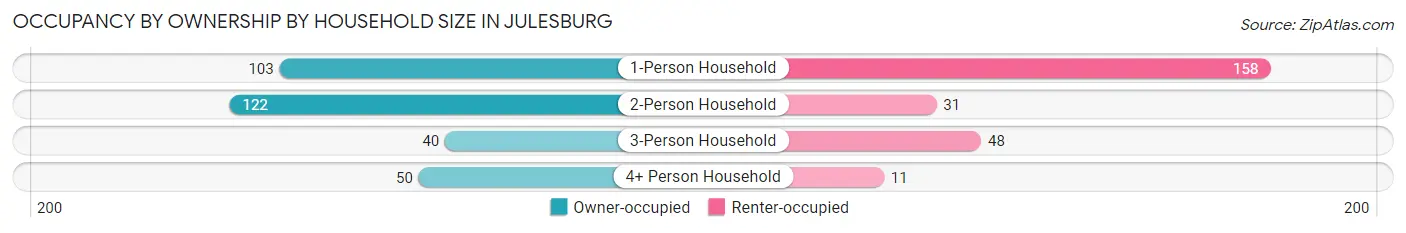
| Household Size | Owner-occupied | Renter-occupied |
| 1-Person Household | 103 (39.5%) | 158 (60.5%) |
| 2-Person Household | 122 (79.7%) | 31 (20.3%) |
| 3-Person Household | 40 (45.5%) | 48 (54.5%) |
| 4+ Person Household | 50 (82.0%) | 11 (18.0%) |
| Total Housing Units | 315 (55.9%) | 248 (44.1%) |
Occupancy by Educational Attainment in Julesburg
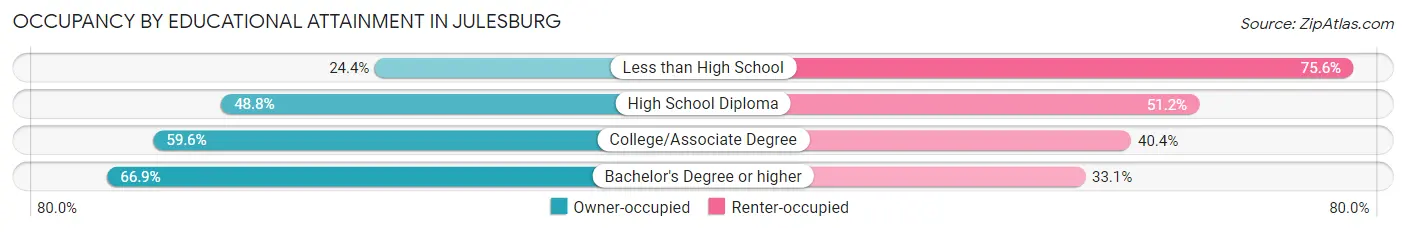
| Household Size | Owner-occupied | Renter-occupied |
| Less than High School | 10 (24.4%) | 31 (75.6%) |
| High School Diploma | 82 (48.8%) | 86 (51.2%) |
| College/Associate Degree | 112 (59.6%) | 76 (40.4%) |
| Bachelor's Degree or higher | 111 (66.9%) | 55 (33.1%) |
Occupancy by Age of Householder in Julesburg
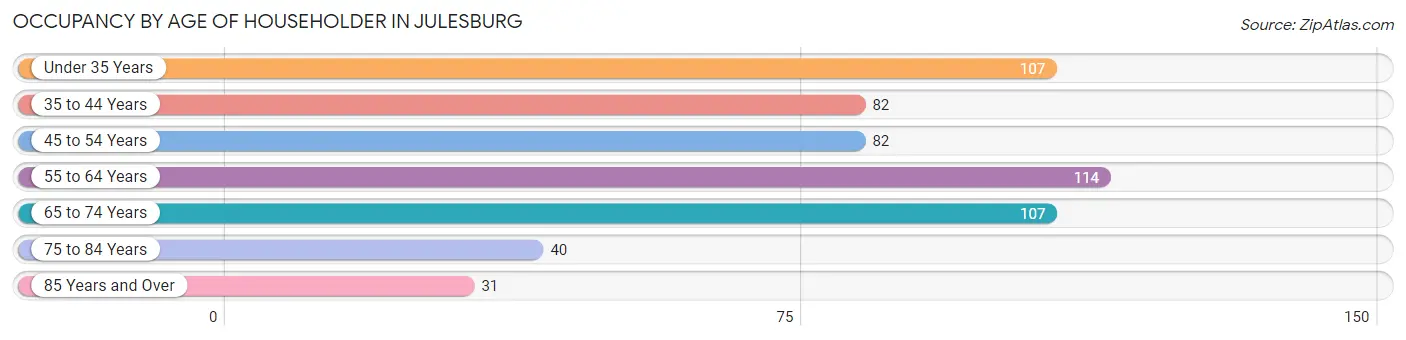
| Age Bracket | # Households | % Households |
| Under 35 Years | 107 | 19.0% |
| 35 to 44 Years | 82 | 14.6% |
| 45 to 54 Years | 82 | 14.6% |
| 55 to 64 Years | 114 | 20.3% |
| 65 to 74 Years | 107 | 19.0% |
| 75 to 84 Years | 40 | 7.1% |
| 85 Years and Over | 31 | 5.5% |
| Total | 563 | 100.0% |
Housing Finances in Julesburg
Median Income by Occupancy in Julesburg
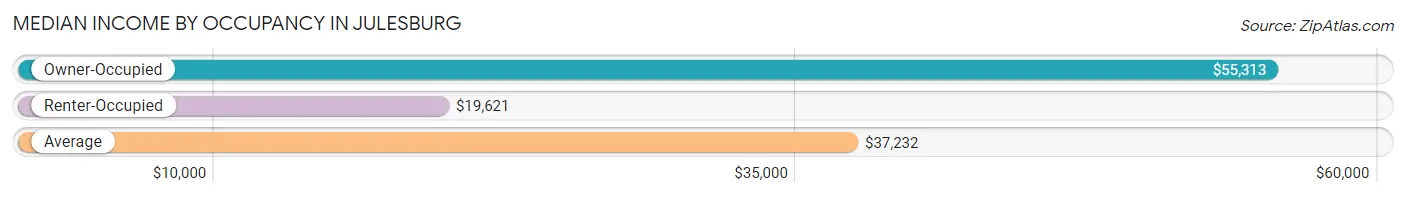
| Occupancy Type | # Households | Median Income |
| Owner-Occupied | 315 (55.9%) | $55,313 |
| Renter-Occupied | 248 (44.1%) | $19,621 |
| Average | 563 (100.0%) | $37,232 |
Occupancy by Householder Income Bracket in Julesburg
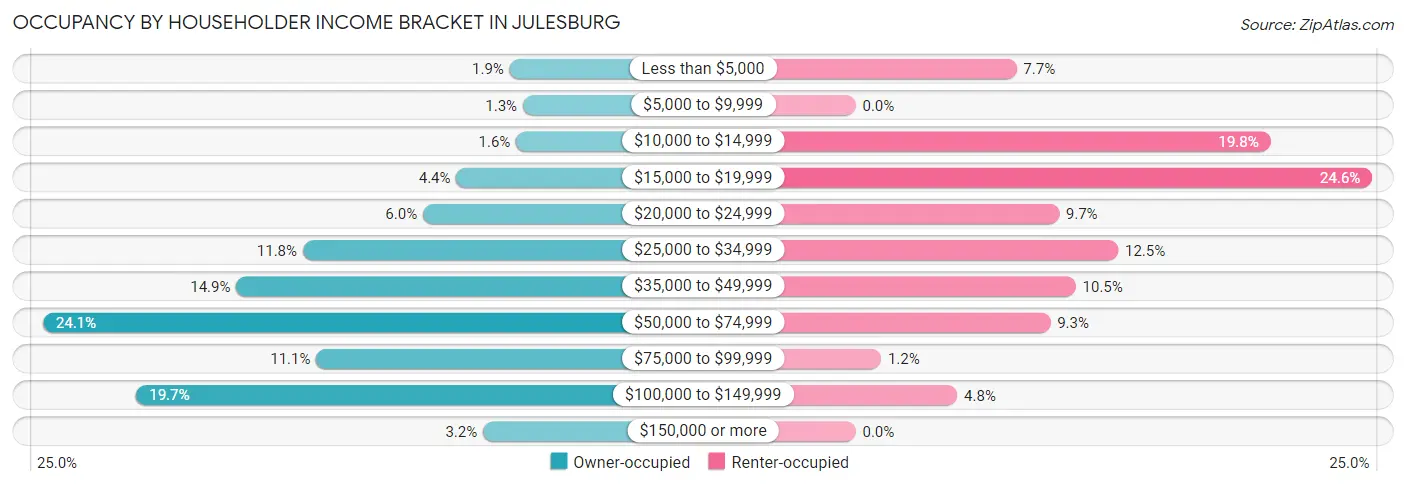
| Income Bracket | Owner-occupied | Renter-occupied |
| Less than $5,000 | 6 (1.9%) | 19 (7.7%) |
| $5,000 to $9,999 | 4 (1.3%) | 0 (0.0%) |
| $10,000 to $14,999 | 5 (1.6%) | 49 (19.8%) |
| $15,000 to $19,999 | 14 (4.4%) | 61 (24.6%) |
| $20,000 to $24,999 | 19 (6.0%) | 24 (9.7%) |
| $25,000 to $34,999 | 37 (11.7%) | 31 (12.5%) |
| $35,000 to $49,999 | 47 (14.9%) | 26 (10.5%) |
| $50,000 to $74,999 | 76 (24.1%) | 23 (9.3%) |
| $75,000 to $99,999 | 35 (11.1%) | 3 (1.2%) |
| $100,000 to $149,999 | 62 (19.7%) | 12 (4.8%) |
| $150,000 or more | 10 (3.2%) | 0 (0.0%) |
| Total | 315 (100.0%) | 248 (100.0%) |
Monthly Housing Cost Tiers in Julesburg
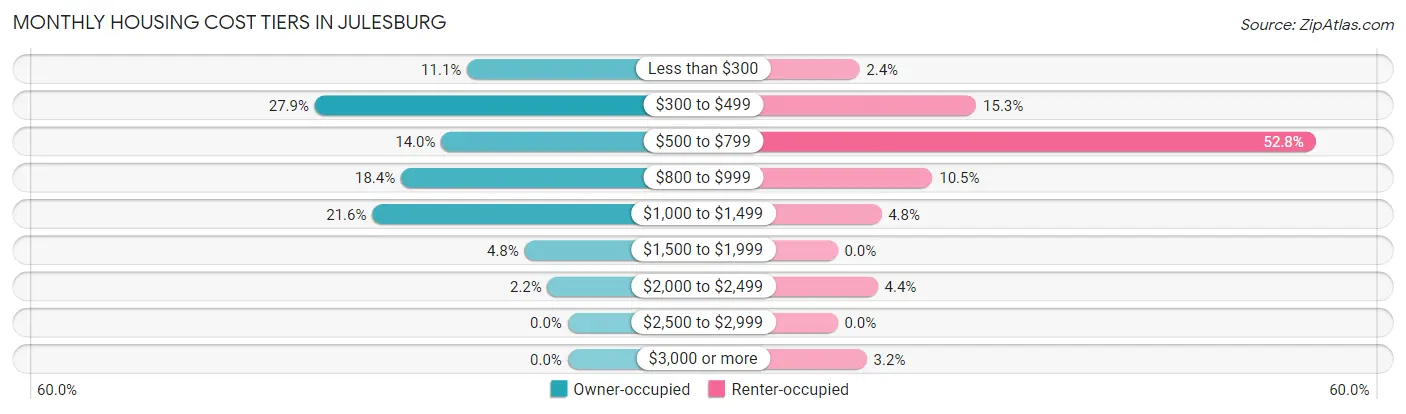
| Monthly Cost | Owner-occupied | Renter-occupied |
| Less than $300 | 35 (11.1%) | 6 (2.4%) |
| $300 to $499 | 88 (27.9%) | 38 (15.3%) |
| $500 to $799 | 44 (14.0%) | 131 (52.8%) |
| $800 to $999 | 58 (18.4%) | 26 (10.5%) |
| $1,000 to $1,499 | 68 (21.6%) | 12 (4.8%) |
| $1,500 to $1,999 | 15 (4.8%) | 0 (0.0%) |
| $2,000 to $2,499 | 7 (2.2%) | 11 (4.4%) |
| $2,500 to $2,999 | 0 (0.0%) | 0 (0.0%) |
| $3,000 or more | 0 (0.0%) | 8 (3.2%) |
| Total | 315 (100.0%) | 248 (100.0%) |
Physical Housing Characteristics in Julesburg
Housing Structures in Julesburg
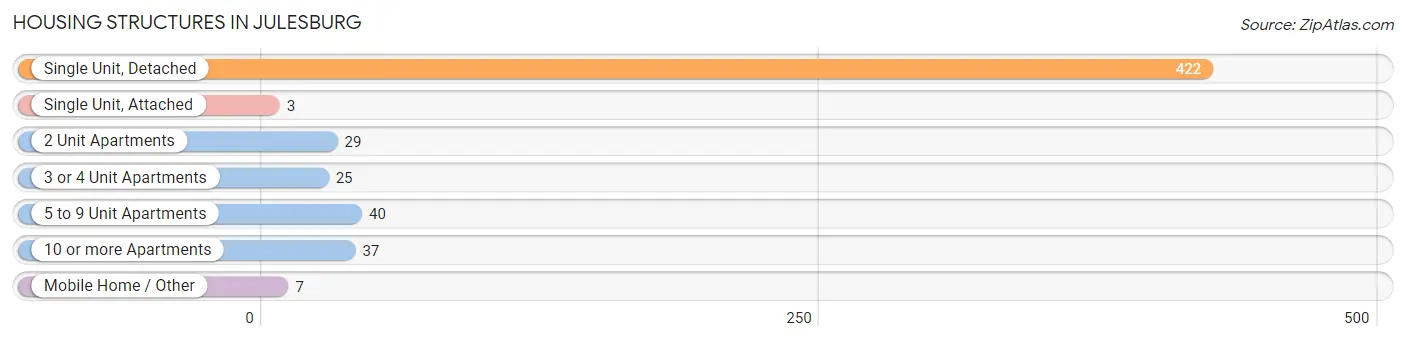
| Structure Type | # Housing Units | % Housing Units |
| Single Unit, Detached | 422 | 75.0% |
| Single Unit, Attached | 3 | 0.5% |
| 2 Unit Apartments | 29 | 5.1% |
| 3 or 4 Unit Apartments | 25 | 4.4% |
| 5 to 9 Unit Apartments | 40 | 7.1% |
| 10 or more Apartments | 37 | 6.6% |
| Mobile Home / Other | 7 | 1.2% |
| Total | 563 | 100.0% |
Housing Structures by Occupancy in Julesburg
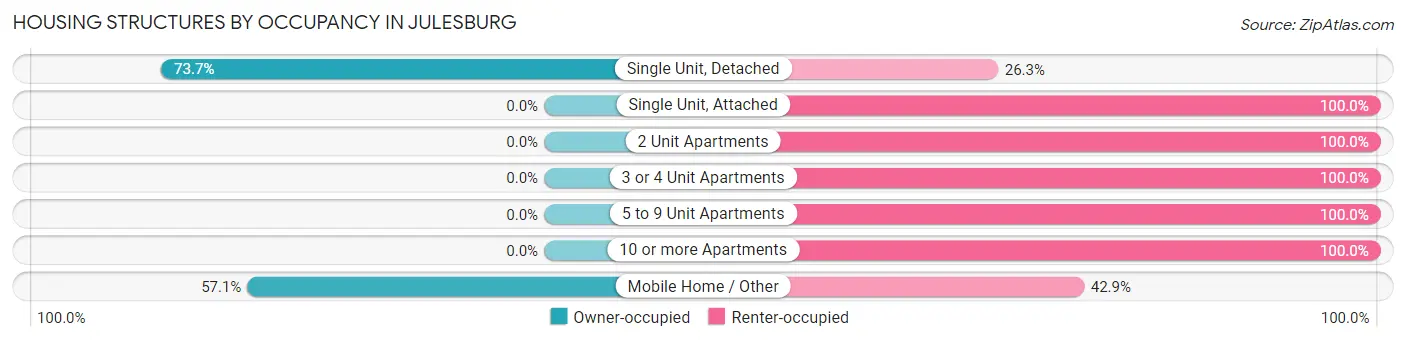
| Structure Type | Owner-occupied | Renter-occupied |
| Single Unit, Detached | 311 (73.7%) | 111 (26.3%) |
| Single Unit, Attached | 0 (0.0%) | 3 (100.0%) |
| 2 Unit Apartments | 0 (0.0%) | 29 (100.0%) |
| 3 or 4 Unit Apartments | 0 (0.0%) | 25 (100.0%) |
| 5 to 9 Unit Apartments | 0 (0.0%) | 40 (100.0%) |
| 10 or more Apartments | 0 (0.0%) | 37 (100.0%) |
| Mobile Home / Other | 4 (57.1%) | 3 (42.9%) |
| Total | 315 (55.9%) | 248 (44.1%) |
Housing Structures by Number of Rooms in Julesburg
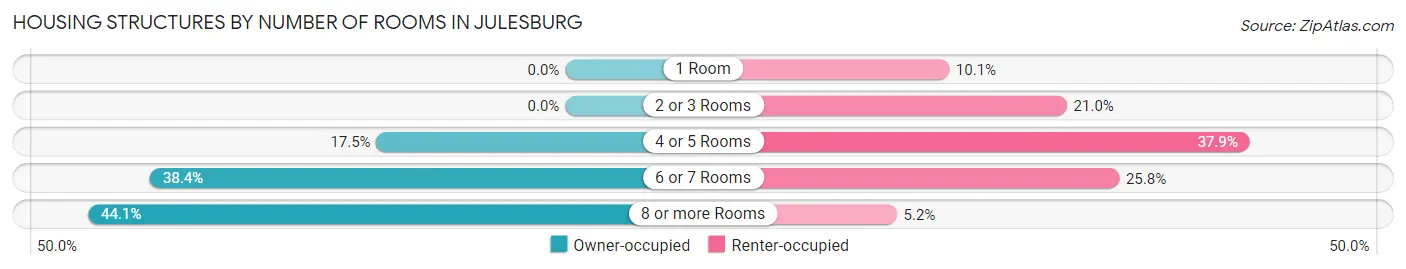
| Number of Rooms | Owner-occupied | Renter-occupied |
| 1 Room | 0 (0.0%) | 25 (10.1%) |
| 2 or 3 Rooms | 0 (0.0%) | 52 (21.0%) |
| 4 or 5 Rooms | 55 (17.5%) | 94 (37.9%) |
| 6 or 7 Rooms | 121 (38.4%) | 64 (25.8%) |
| 8 or more Rooms | 139 (44.1%) | 13 (5.2%) |
| Total | 315 (100.0%) | 248 (100.0%) |
Housing Structure by Heating Type in Julesburg
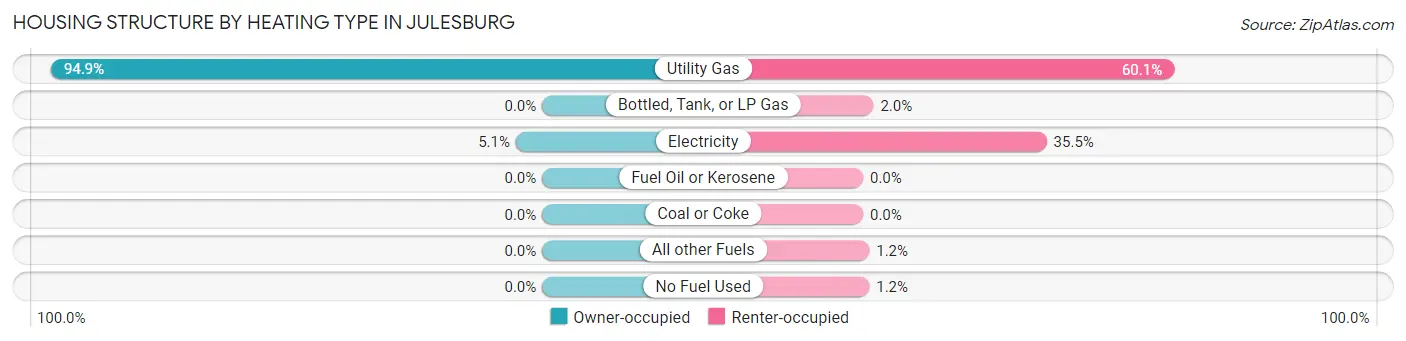
| Heating Type | Owner-occupied | Renter-occupied |
| Utility Gas | 299 (94.9%) | 149 (60.1%) |
| Bottled, Tank, or LP Gas | 0 (0.0%) | 5 (2.0%) |
| Electricity | 16 (5.1%) | 88 (35.5%) |
| Fuel Oil or Kerosene | 0 (0.0%) | 0 (0.0%) |
| Coal or Coke | 0 (0.0%) | 0 (0.0%) |
| All other Fuels | 0 (0.0%) | 3 (1.2%) |
| No Fuel Used | 0 (0.0%) | 3 (1.2%) |
| Total | 315 (100.0%) | 248 (100.0%) |
Household Vehicle Usage in Julesburg
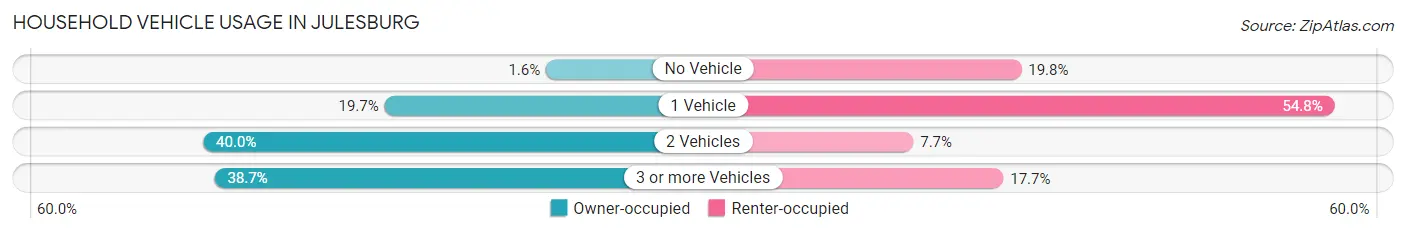
| Vehicles per Household | Owner-occupied | Renter-occupied |
| No Vehicle | 5 (1.6%) | 49 (19.8%) |
| 1 Vehicle | 62 (19.7%) | 136 (54.8%) |
| 2 Vehicles | 126 (40.0%) | 19 (7.7%) |
| 3 or more Vehicles | 122 (38.7%) | 44 (17.7%) |
| Total | 315 (100.0%) | 248 (100.0%) |
Real Estate & Mortgages in Julesburg
Real Estate and Mortgage Overview in Julesburg
| Characteristic | Without Mortgage | With Mortgage |
| Housing Units | 158 | 157 |
| Median Property Value | $100,000 | $149,300 |
| Median Household Income | $42,500 | $5 |
| Monthly Housing Costs | $387 | $0 |
| Real Estate Taxes | $514 | $0 |
Property Value by Mortgage Status in Julesburg
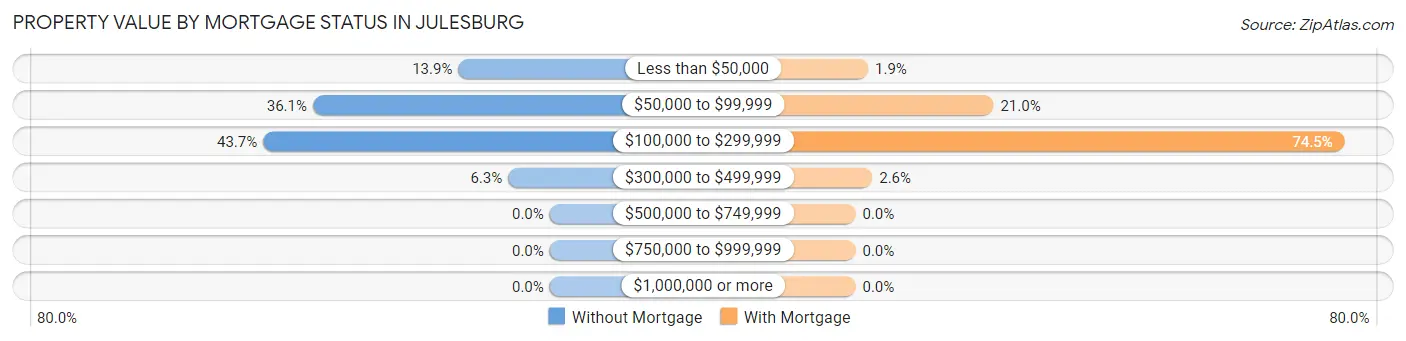
| Property Value | Without Mortgage | With Mortgage |
| Less than $50,000 | 22 (13.9%) | 3 (1.9%) |
| $50,000 to $99,999 | 57 (36.1%) | 33 (21.0%) |
| $100,000 to $299,999 | 69 (43.7%) | 117 (74.5%) |
| $300,000 to $499,999 | 10 (6.3%) | 4 (2.5%) |
| $500,000 to $749,999 | 0 (0.0%) | 0 (0.0%) |
| $750,000 to $999,999 | 0 (0.0%) | 0 (0.0%) |
| $1,000,000 or more | 0 (0.0%) | 0 (0.0%) |
| Total | 158 (100.0%) | 157 (100.0%) |
Household Income by Mortgage Status in Julesburg
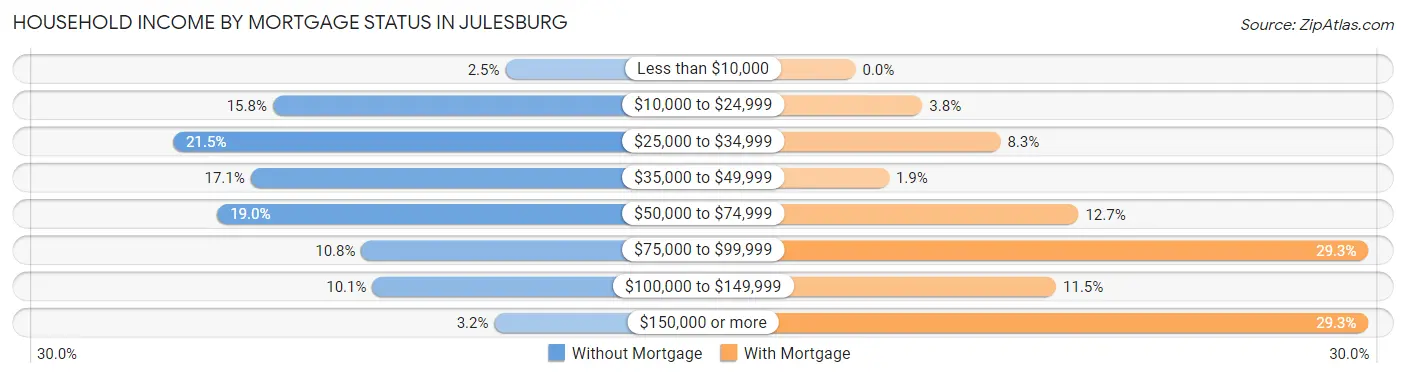
| Household Income | Without Mortgage | With Mortgage |
| Less than $10,000 | 4 (2.5%) | 0 (0.0%) |
| $10,000 to $24,999 | 25 (15.8%) | 6 (3.8%) |
| $25,000 to $34,999 | 34 (21.5%) | 13 (8.3%) |
| $35,000 to $49,999 | 27 (17.1%) | 3 (1.9%) |
| $50,000 to $74,999 | 30 (19.0%) | 20 (12.7%) |
| $75,000 to $99,999 | 17 (10.8%) | 46 (29.3%) |
| $100,000 to $149,999 | 16 (10.1%) | 18 (11.5%) |
| $150,000 or more | 5 (3.2%) | 46 (29.3%) |
| Total | 158 (100.0%) | 157 (100.0%) |
Property Value to Household Income Ratio in Julesburg
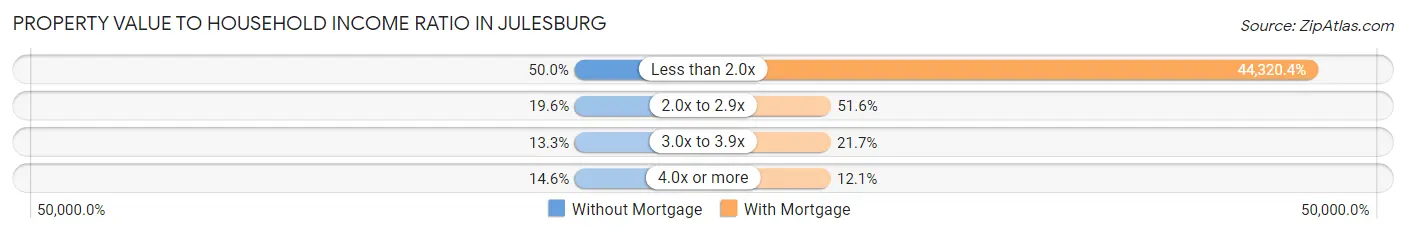
| Value-to-Income Ratio | Without Mortgage | With Mortgage |
| Less than 2.0x | 79 (50.0%) | 69,583 (44,320.4%) |
| 2.0x to 2.9x | 31 (19.6%) | 81 (51.6%) |
| 3.0x to 3.9x | 21 (13.3%) | 34 (21.7%) |
| 4.0x or more | 23 (14.6%) | 19 (12.1%) |
| Total | 158 (100.0%) | 157 (100.0%) |
Real Estate Taxes by Mortgage Status in Julesburg
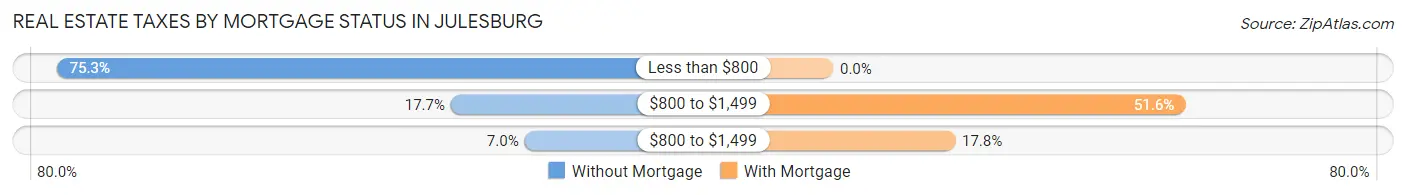
| Property Taxes | Without Mortgage | With Mortgage |
| Less than $800 | 119 (75.3%) | 0 (0.0%) |
| $800 to $1,499 | 28 (17.7%) | 81 (51.6%) |
| $800 to $1,499 | 11 (7.0%) | 28 (17.8%) |
| Total | 158 (100.0%) | 157 (100.0%) |
Health & Disability in Julesburg
Health Insurance Coverage by Age in Julesburg
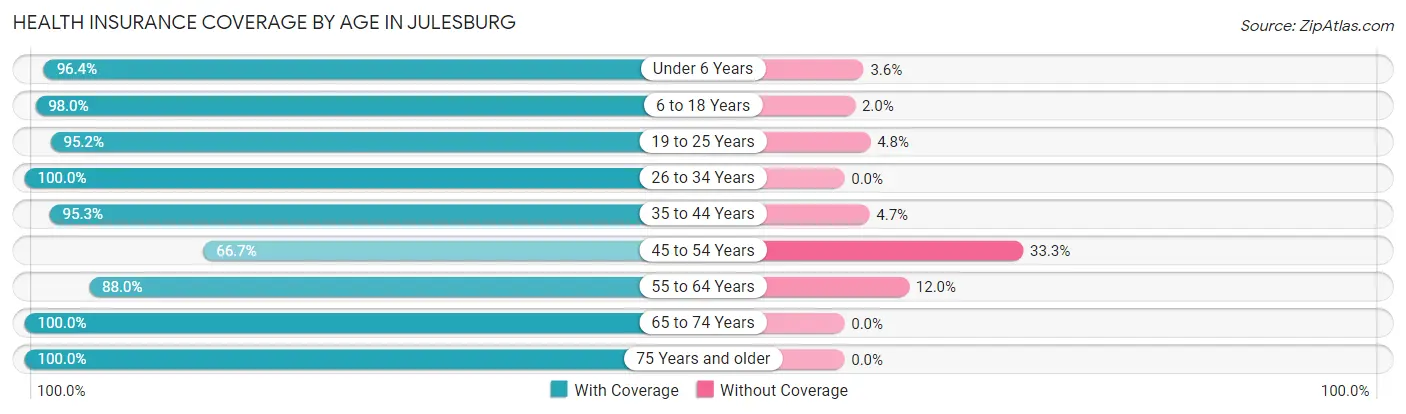
| Age Bracket | With Coverage | Without Coverage |
| Under 6 Years | 135 (96.4%) | 5 (3.6%) |
| 6 to 18 Years | 148 (98.0%) | 3 (2.0%) |
| 19 to 25 Years | 59 (95.2%) | 3 (4.8%) |
| 26 to 34 Years | 92 (100.0%) | 0 (0.0%) |
| 35 to 44 Years | 163 (95.3%) | 8 (4.7%) |
| 45 to 54 Years | 68 (66.7%) | 34 (33.3%) |
| 55 to 64 Years | 168 (88.0%) | 23 (12.0%) |
| 65 to 74 Years | 152 (100.0%) | 0 (0.0%) |
| 75 Years and older | 94 (100.0%) | 0 (0.0%) |
| Total | 1,079 (93.4%) | 76 (6.6%) |
Health Insurance Coverage by Citizenship Status in Julesburg
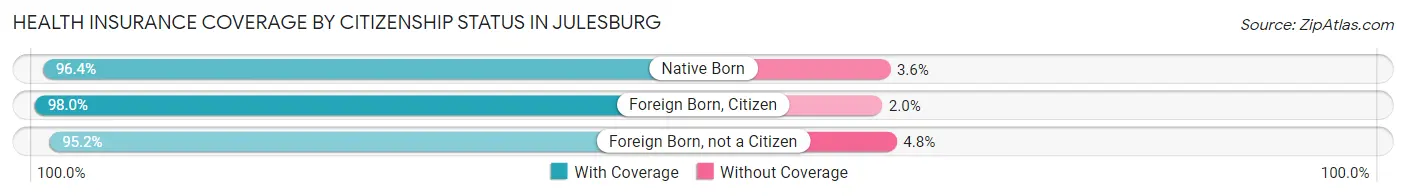
| Citizenship Status | With Coverage | Without Coverage |
| Native Born | 135 (96.4%) | 5 (3.6%) |
| Foreign Born, Citizen | 148 (98.0%) | 3 (2.0%) |
| Foreign Born, not a Citizen | 59 (95.2%) | 3 (4.8%) |
Health Insurance Coverage by Household Income in Julesburg
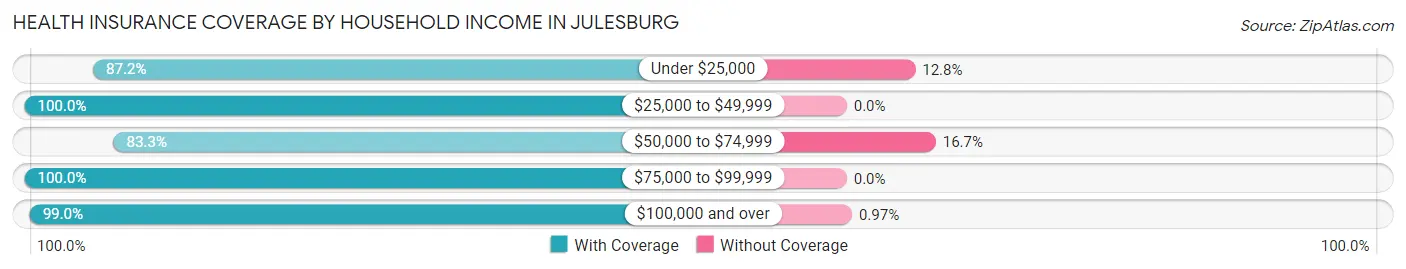
| Household Income | With Coverage | Without Coverage |
| Under $25,000 | 258 (87.2%) | 38 (12.8%) |
| $25,000 to $49,999 | 210 (100.0%) | 0 (0.0%) |
| $50,000 to $74,999 | 175 (83.3%) | 35 (16.7%) |
| $75,000 to $99,999 | 116 (100.0%) | 0 (0.0%) |
| $100,000 and over | 306 (99.0%) | 3 (1.0%) |
Public vs Private Health Insurance Coverage by Age in Julesburg
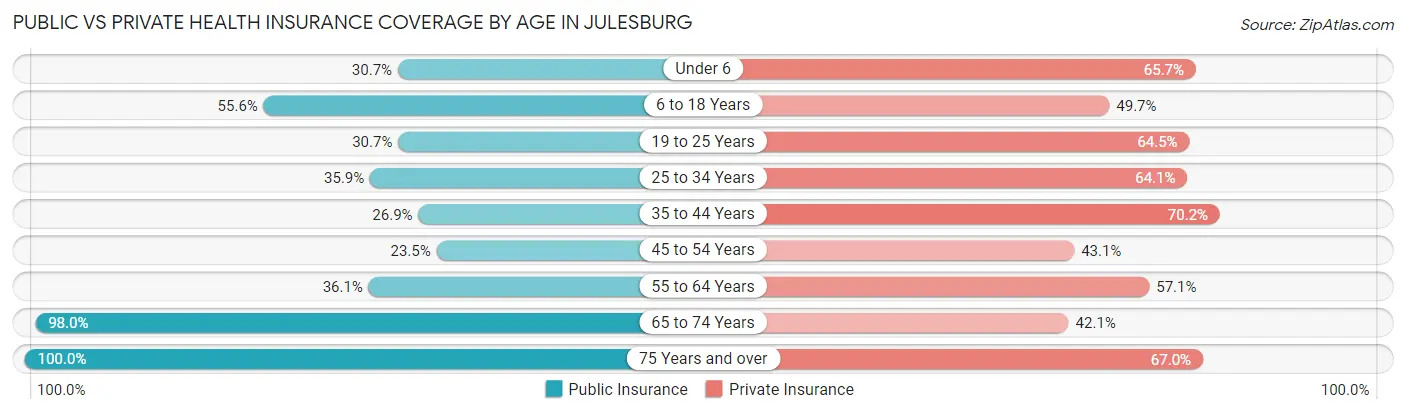
| Age Bracket | Public Insurance | Private Insurance |
| Under 6 | 43 (30.7%) | 92 (65.7%) |
| 6 to 18 Years | 84 (55.6%) | 75 (49.7%) |
| 19 to 25 Years | 19 (30.6%) | 40 (64.5%) |
| 25 to 34 Years | 33 (35.9%) | 59 (64.1%) |
| 35 to 44 Years | 46 (26.9%) | 120 (70.2%) |
| 45 to 54 Years | 24 (23.5%) | 44 (43.1%) |
| 55 to 64 Years | 69 (36.1%) | 109 (57.1%) |
| 65 to 74 Years | 149 (98.0%) | 64 (42.1%) |
| 75 Years and over | 94 (100.0%) | 63 (67.0%) |
| Total | 561 (48.6%) | 666 (57.7%) |
Disability Status by Sex by Age in Julesburg
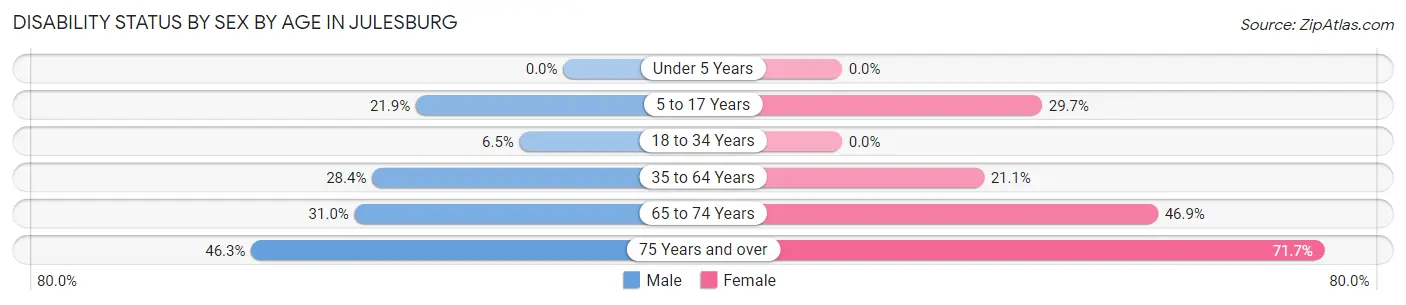
| Age Bracket | Male | Female |
| Under 5 Years | 0 (0.0%) | 0 (0.0%) |
| 5 to 17 Years | 14 (21.9%) | 30 (29.7%) |
| 18 to 34 Years | 5 (6.5%) | 0 (0.0%) |
| 35 to 64 Years | 63 (28.4%) | 51 (21.1%) |
| 65 to 74 Years | 22 (31.0%) | 38 (46.9%) |
| 75 Years and over | 19 (46.3%) | 38 (71.7%) |
Disability Class by Sex by Age in Julesburg
Disability Class: Hearing Difficulty
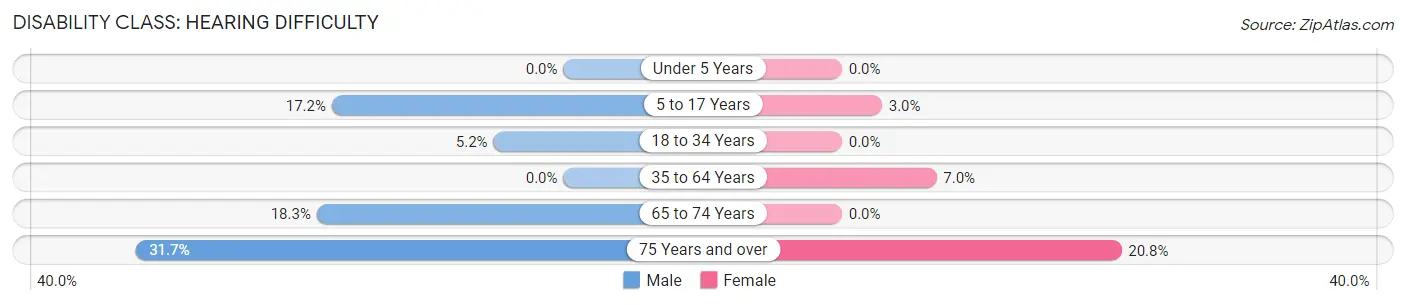
| Age Bracket | Male | Female |
| Under 5 Years | 0 (0.0%) | 0 (0.0%) |
| 5 to 17 Years | 11 (17.2%) | 3 (3.0%) |
| 18 to 34 Years | 4 (5.2%) | 0 (0.0%) |
| 35 to 64 Years | 0 (0.0%) | 17 (7.0%) |
| 65 to 74 Years | 13 (18.3%) | 0 (0.0%) |
| 75 Years and over | 13 (31.7%) | 11 (20.7%) |
Disability Class: Vision Difficulty
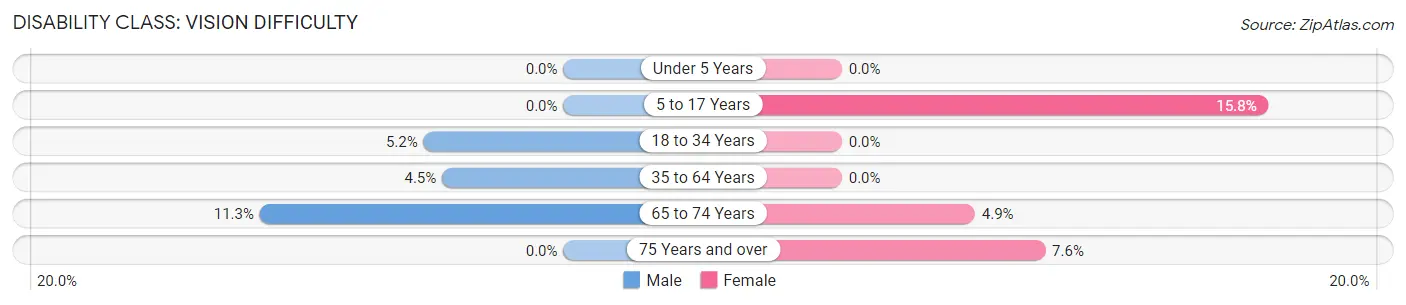
| Age Bracket | Male | Female |
| Under 5 Years | 0 (0.0%) | 0 (0.0%) |
| 5 to 17 Years | 0 (0.0%) | 16 (15.8%) |
| 18 to 34 Years | 4 (5.2%) | 0 (0.0%) |
| 35 to 64 Years | 10 (4.5%) | 0 (0.0%) |
| 65 to 74 Years | 8 (11.3%) | 4 (4.9%) |
| 75 Years and over | 0 (0.0%) | 4 (7.5%) |
Disability Class: Cognitive Difficulty
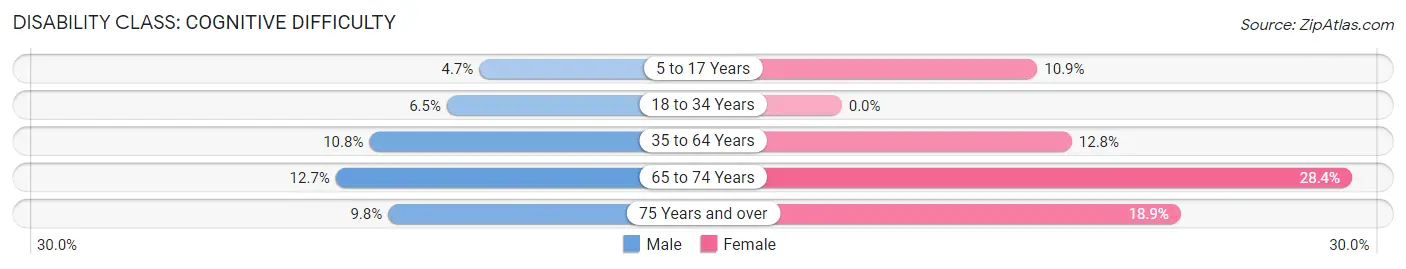
| Age Bracket | Male | Female |
| 5 to 17 Years | 3 (4.7%) | 11 (10.9%) |
| 18 to 34 Years | 5 (6.5%) | 0 (0.0%) |
| 35 to 64 Years | 24 (10.8%) | 31 (12.8%) |
| 65 to 74 Years | 9 (12.7%) | 23 (28.4%) |
| 75 Years and over | 4 (9.8%) | 10 (18.9%) |
Disability Class: Ambulatory Difficulty
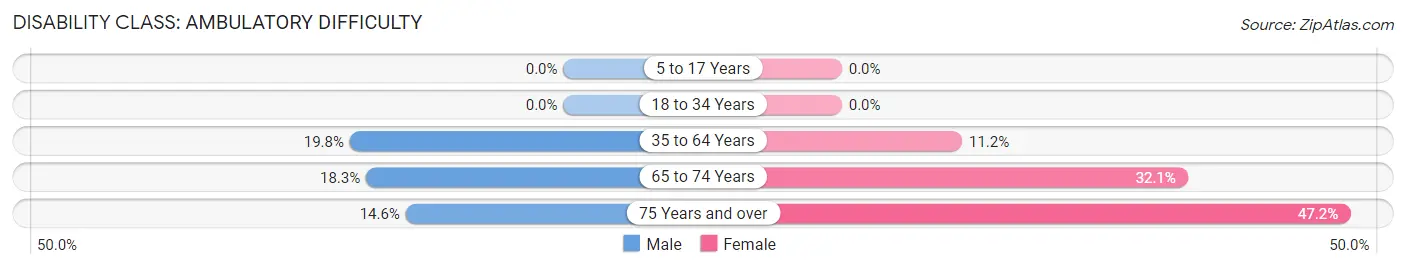
| Age Bracket | Male | Female |
| 5 to 17 Years | 0 (0.0%) | 0 (0.0%) |
| 18 to 34 Years | 0 (0.0%) | 0 (0.0%) |
| 35 to 64 Years | 44 (19.8%) | 27 (11.2%) |
| 65 to 74 Years | 13 (18.3%) | 26 (32.1%) |
| 75 Years and over | 6 (14.6%) | 25 (47.2%) |
Disability Class: Self-Care Difficulty
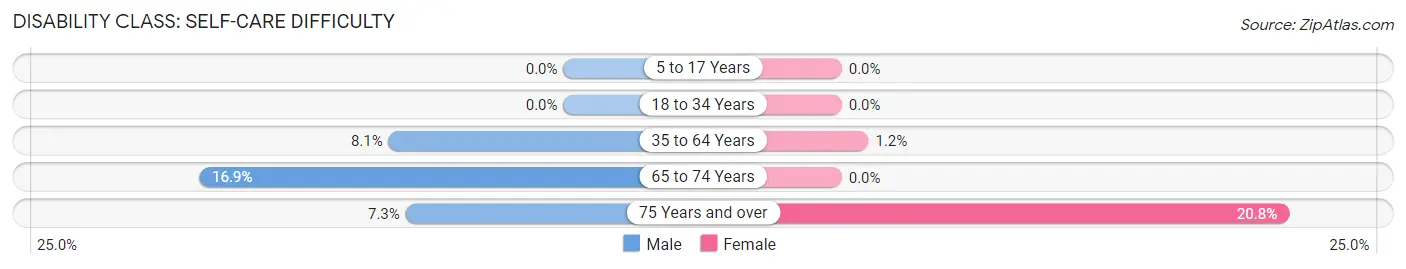
| Age Bracket | Male | Female |
| 5 to 17 Years | 0 (0.0%) | 0 (0.0%) |
| 18 to 34 Years | 0 (0.0%) | 0 (0.0%) |
| 35 to 64 Years | 18 (8.1%) | 3 (1.2%) |
| 65 to 74 Years | 12 (16.9%) | 0 (0.0%) |
| 75 Years and over | 3 (7.3%) | 11 (20.7%) |
Technology Access in Julesburg
Computing Device Access in Julesburg
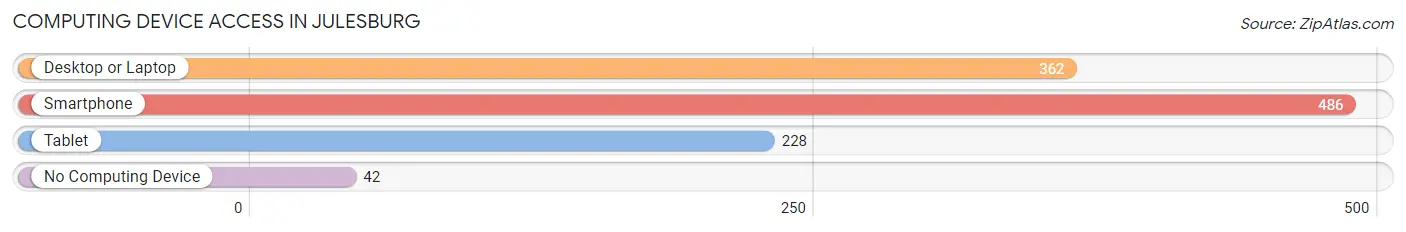
| Device Type | # Households | % Households |
| Desktop or Laptop | 362 | 64.3% |
| Smartphone | 486 | 86.3% |
| Tablet | 228 | 40.5% |
| No Computing Device | 42 | 7.5% |
| Total | 563 | 100.0% |
Internet Access in Julesburg
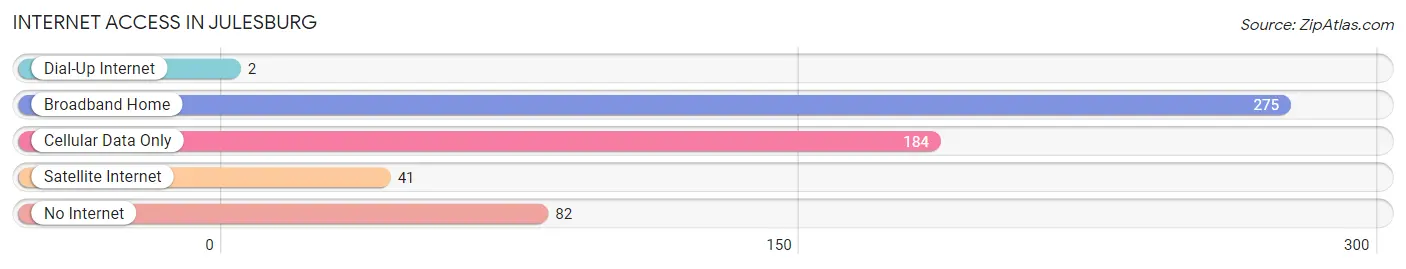
| Internet Type | # Households | % Households |
| Dial-Up Internet | 2 | 0.4% |
| Broadband Home | 275 | 48.8% |
| Cellular Data Only | 184 | 32.7% |
| Satellite Internet | 41 | 7.3% |
| No Internet | 82 | 14.6% |
| Total | 563 | 100.0% |
Julesburg Summary
Julesburg, Colorado is a small town located in Sedgwick County in the northeastern corner of the state. It is situated along the South Platte River, near the Nebraska border. The town was founded in 1867 and named after Jules Beni, a French-Canadian fur trader who had a trading post in the area.
History
Julesburg was founded in 1867 by a group of settlers from Nebraska. The town was named after Jules Beni, a French-Canadian fur trader who had a trading post in the area. The town was originally a stop on the Union Pacific Railroad, and it quickly grew into a bustling community. In 1868, the first post office was established, and the town was incorporated in 1873.
In the late 1800s, Julesburg was a major stop on the Overland Trail, a route used by settlers heading west. The town was also a major stop on the Pony Express, and it was the site of a major battle between the U.S. Army and the Cheyenne and Arapaho tribes in 1864.
Geography
Julesburg is located in the northeastern corner of Colorado, near the Nebraska border. It is situated along the South Platte River, and it is surrounded by rolling hills and prairies. The town is located at an elevation of 4,092 feet above sea level.
The climate in Julesburg is semi-arid, with hot summers and cold winters. The average annual temperature is 54 degrees Fahrenheit, and the average annual precipitation is 16.5 inches.
Economy
The economy of Julesburg is largely based on agriculture and ranching. The town is home to several large farms and ranches, and it is also a major center for the production of hay and other feed crops.
In addition to agriculture, Julesburg is home to several small businesses, including a grocery store, a hardware store, and a few restaurants. The town is also home to a small airport, which serves as a hub for private and commercial flights.
Demographics
As of the 2010 census, the population of Julesburg was 1,225. The racial makeup of the town was 95.3% White, 0.2% African American, 0.2% Native American, 0.2% Asian, 0.2% Pacific Islander, 0.2% from other races, and 3.9% from two or more races. Hispanic or Latino of any race were 4.2% of the population.
The median household income in Julesburg was $41,250, and the median family income was $45,833. The per capita income was $19,945. About 11.2% of families and 13.2% of the population were below the poverty line, including 16.7% of those under age 18 and 8.3% of those age 65 or over.
Julesburg is served by the Sedgwick County School District, which includes one elementary school, one middle school, and one high school. The town is also home to a branch of Northeastern Junior College.
Common Questions
What is Per Capita Income in Julesburg?
Per Capita income in Julesburg is $25,653.
What is the Median Family Income in Julesburg?
Median Family Income in Julesburg is $65,197.
What is the Median Household income in Julesburg?
Median Household Income in Julesburg is $37,232.
What is Income or Wage Gap in Julesburg?
Income or Wage Gap in Julesburg is 26.9%.
Women in Julesburg earn 73.1 cents for every dollar earned by a man.
What is Family Income Deficit in Julesburg?
Family Income Deficit in Julesburg is $8,506.
Families that are below poverty line in Julesburg earn $8,506 less on average than the poverty threshold level.
What is Inequality or Gini Index in Julesburg?
Inequality or Gini Index in Julesburg is 0.43.
What is the Total Population of Julesburg?
Total Population of Julesburg is 1,187.
What is the Total Male Population of Julesburg?
Total Male Population of Julesburg is 560.
What is the Total Female Population of Julesburg?
Total Female Population of Julesburg is 627.
What is the Ratio of Males per 100 Females in Julesburg?
There are 89.31 Males per 100 Females in Julesburg.
What is the Ratio of Females per 100 Males in Julesburg?
There are 111.96 Females per 100 Males in Julesburg.
What is the Median Population Age in Julesburg?
Median Population Age in Julesburg is 42.7 Years.
What is the Average Family Size in Julesburg
Average Family Size in Julesburg is 2.9 People.
What is the Average Household Size in Julesburg
Average Household Size in Julesburg is 2.0 People.
How Large is the Labor Force in Julesburg?
There are 521 People in the Labor Forcein in Julesburg.
What is the Percentage of People in the Labor Force in Julesburg?
54.5% of People are in the Labor Force in Julesburg.
What is the Unemployment Rate in Julesburg?
Unemployment Rate in Julesburg is 4.2%.