Ignacio, CO Map & Demographics
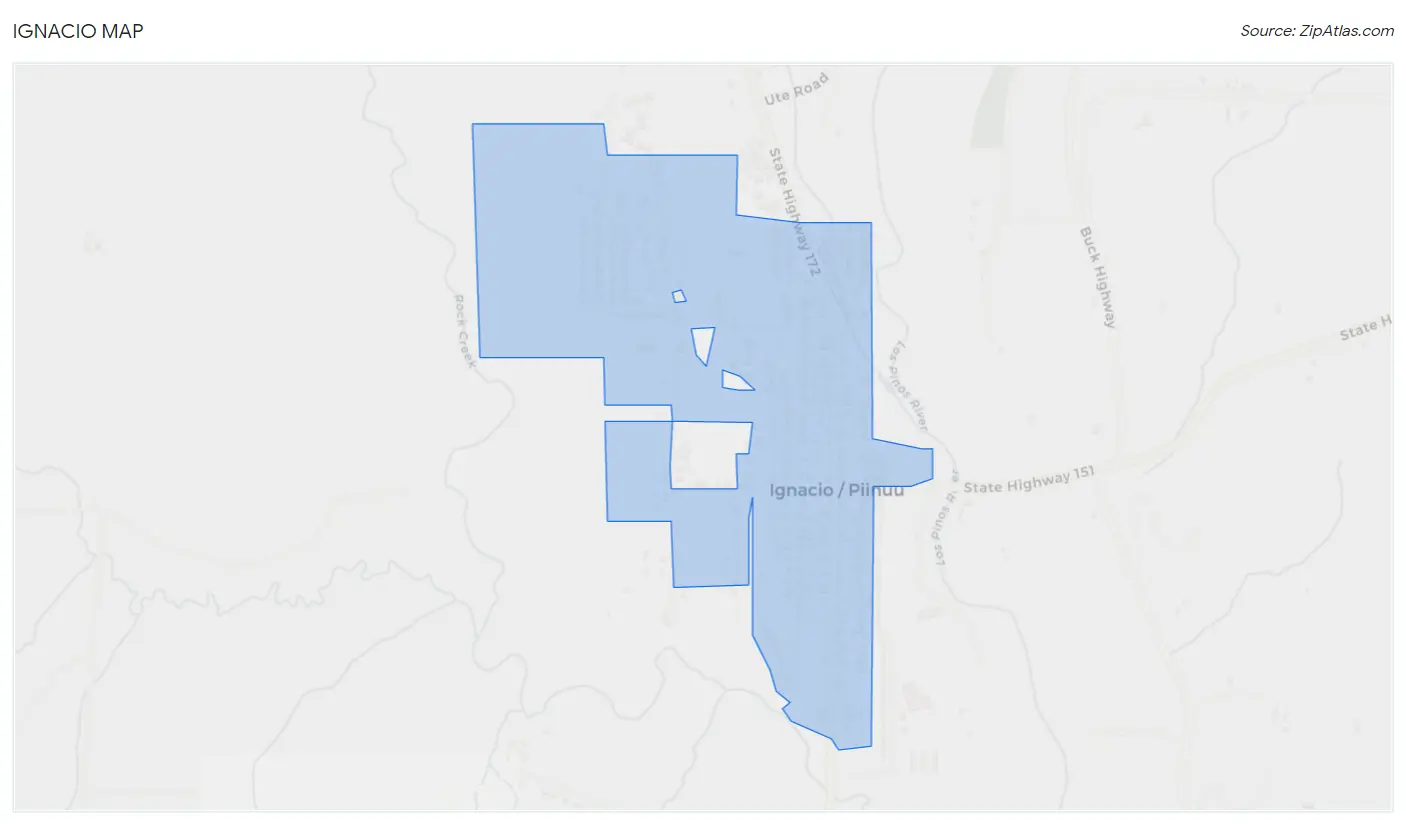
Ignacio Map
Ignacio Overview
$32,521
PER CAPITA INCOME
$82,813
AVG FAMILY INCOME
$62,833
AVG HOUSEHOLD INCOME
16.9%
WAGE / INCOME GAP [ % ]
83.1¢/ $1
WAGE / INCOME GAP [ $ ]
0.44
INEQUALITY / GINI INDEX
1,257
TOTAL POPULATION
645
MALE POPULATION
612
FEMALE POPULATION
105.39
MALES / 100 FEMALES
94.88
FEMALES / 100 MALES
38.1
MEDIAN AGE
3.7
AVG FAMILY SIZE
2.7
AVG HOUSEHOLD SIZE
666
LABOR FORCE [ PEOPLE ]
67.9%
PERCENT IN LABOR FORCE
7.7%
UNEMPLOYMENT RATE
Ignacio Zip Codes
Ignacio Area Codes
Income in Ignacio
Income Overview in Ignacio
Per Capita Income in Ignacio is $32,521, while median incomes of families and households are $82,813 and $62,833 respectively.
| Characteristic | Number | Measure |
| Per Capita Income | 1,257 | $32,521 |
| Median Family Income | 262 | $82,813 |
| Mean Family Income | 262 | $103,805 |
| Median Household Income | 462 | $62,833 |
| Mean Household Income | 462 | $79,532 |
| Income Deficit | 262 | $0 |
| Wage / Income Gap (%) | 1,257 | 16.86% |
| Wage / Income Gap ($) | 1,257 | 83.14¢ per $1 |
| Gini / Inequality Index | 1,257 | 0.44 |
Earnings by Sex in Ignacio
Average Earnings in Ignacio are $41,143, $46,029 for men and $38,269 for women, a difference of 16.9%.
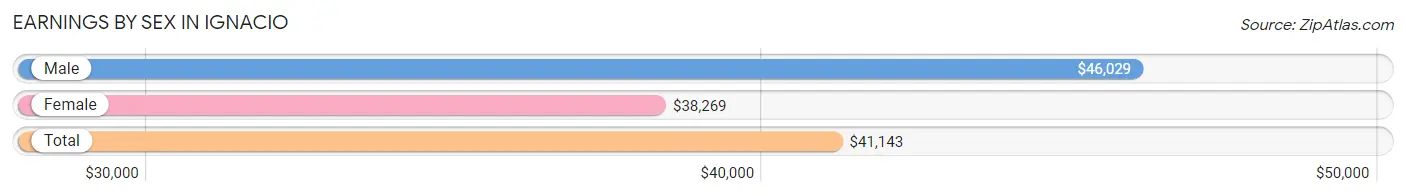
| Sex | Number | Average Earnings |
| Male | 320 (50.5%) | $46,029 |
| Female | 314 (49.5%) | $38,269 |
| Total | 634 (100.0%) | $41,143 |
Earnings by Sex by Income Bracket in Ignacio
The most common earnings brackets in Ignacio are $65,000 to $74,999 for men (59 | 18.4%) and $40,000 to $44,999 for women (49 | 15.6%).
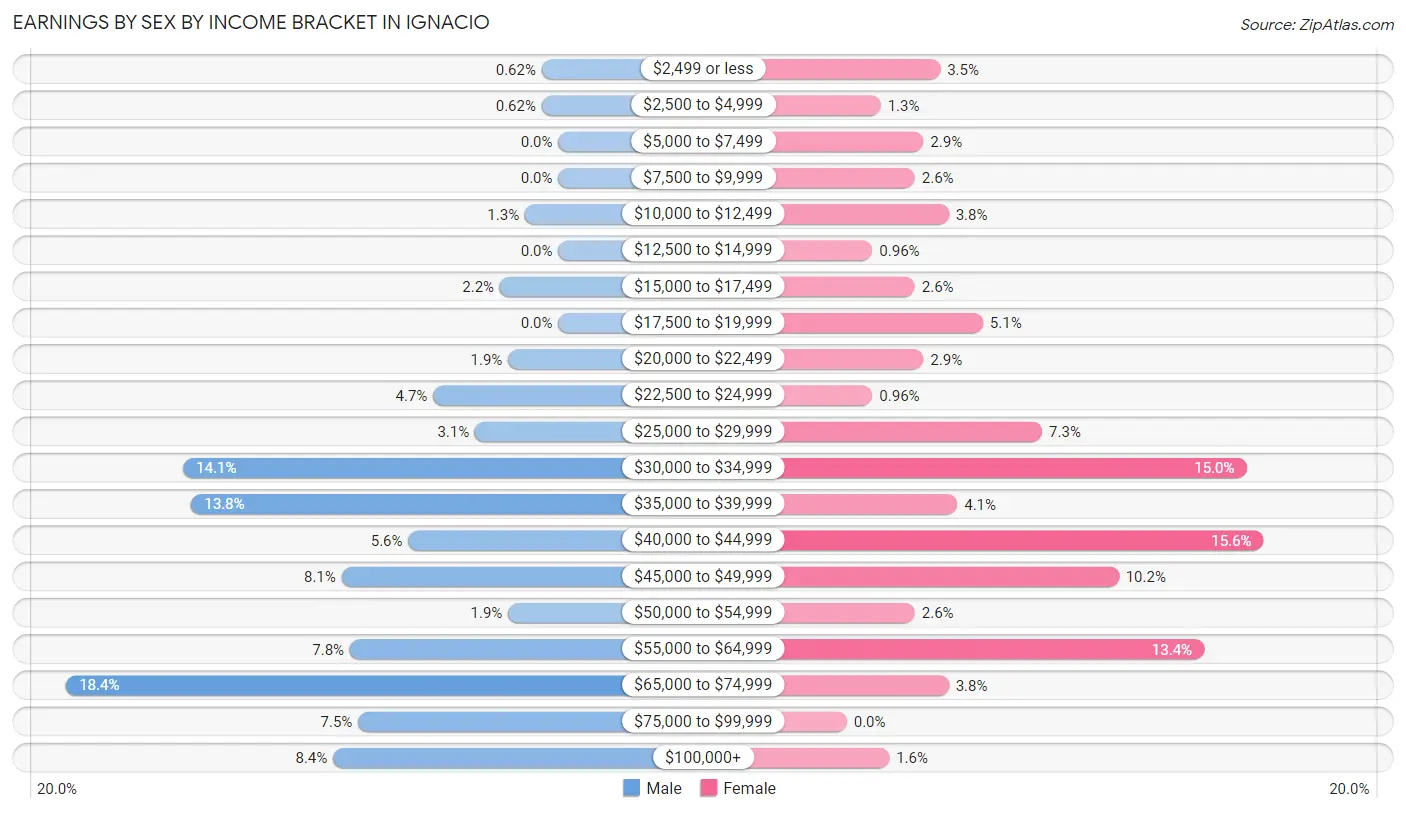
| Income | Male | Female |
| $2,499 or less | 2 (0.6%) | 11 (3.5%) |
| $2,500 to $4,999 | 2 (0.6%) | 4 (1.3%) |
| $5,000 to $7,499 | 0 (0.0%) | 9 (2.9%) |
| $7,500 to $9,999 | 0 (0.0%) | 8 (2.5%) |
| $10,000 to $12,499 | 4 (1.3%) | 12 (3.8%) |
| $12,500 to $14,999 | 0 (0.0%) | 3 (1.0%) |
| $15,000 to $17,499 | 7 (2.2%) | 8 (2.5%) |
| $17,500 to $19,999 | 0 (0.0%) | 16 (5.1%) |
| $20,000 to $22,499 | 6 (1.9%) | 9 (2.9%) |
| $22,500 to $24,999 | 15 (4.7%) | 3 (1.0%) |
| $25,000 to $29,999 | 10 (3.1%) | 23 (7.3%) |
| $30,000 to $34,999 | 45 (14.1%) | 47 (15.0%) |
| $35,000 to $39,999 | 44 (13.8%) | 13 (4.1%) |
| $40,000 to $44,999 | 18 (5.6%) | 49 (15.6%) |
| $45,000 to $49,999 | 26 (8.1%) | 32 (10.2%) |
| $50,000 to $54,999 | 6 (1.9%) | 8 (2.5%) |
| $55,000 to $64,999 | 25 (7.8%) | 42 (13.4%) |
| $65,000 to $74,999 | 59 (18.4%) | 12 (3.8%) |
| $75,000 to $99,999 | 24 (7.5%) | 0 (0.0%) |
| $100,000+ | 27 (8.4%) | 5 (1.6%) |
| Total | 320 (100.0%) | 314 (100.0%) |
Earnings by Sex by Educational Attainment in Ignacio
Average earnings in Ignacio are $49,722 for men and $39,808 for women, a difference of 19.9%. Men with an educational attainment of college or associate's degree enjoy the highest average annual earnings of $68,203, while those with bachelor's degree education earn the least with $39,583. Women with an educational attainment of bachelor's degree earn the most with the average annual earnings of $53,750, while those with less than high school education have the smallest earnings of $33,000.
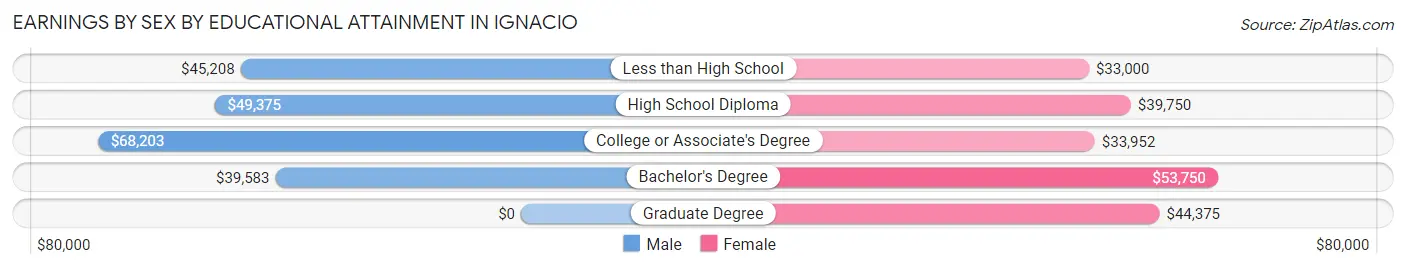
| Educational Attainment | Male Income | Female Income |
| Less than High School | $45,208 | $33,000 |
| High School Diploma | $49,375 | $39,750 |
| College or Associate's Degree | $68,203 | $33,952 |
| Bachelor's Degree | $39,583 | $53,750 |
| Graduate Degree | - | - |
| Total | $49,722 | $39,808 |
Family Income in Ignacio
Family Income Brackets in Ignacio
According to the Ignacio family income data, there are 54 families falling into the $100,000 to $149,999 income range, which is the most common income bracket and makes up 20.6% of all families. Conversely, the $10,000 to $14,999 income bracket is the least frequent group with only 4 families (1.5%) belonging to this category.
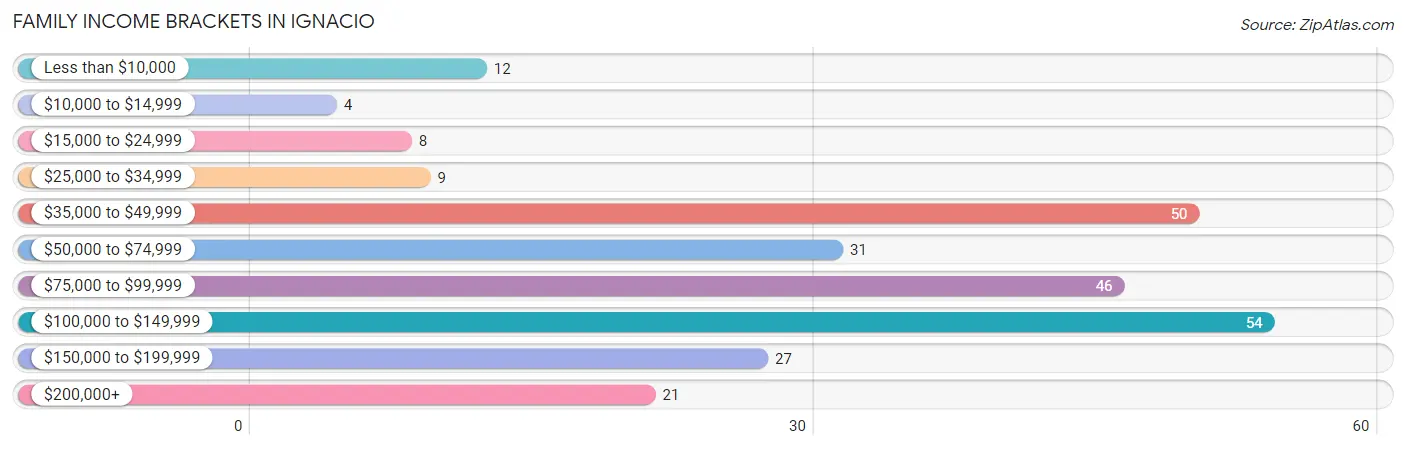
| Income Bracket | # Families | % Families |
| Less than $10,000 | 12 | 4.6% |
| $10,000 to $14,999 | 4 | 1.5% |
| $15,000 to $24,999 | 8 | 3.1% |
| $25,000 to $34,999 | 9 | 3.4% |
| $35,000 to $49,999 | 50 | 19.1% |
| $50,000 to $74,999 | 31 | 11.8% |
| $75,000 to $99,999 | 46 | 17.6% |
| $100,000 to $149,999 | 54 | 20.6% |
| $150,000 to $199,999 | 27 | 10.3% |
| $200,000+ | 21 | 8.0% |
Family Income by Famaliy Size in Ignacio
4-person families (36 | 13.7%) account for the highest median family income in Ignacio with $131,250 per family, while 2-person families (118 | 45.0%) have the highest median income of $34,286 per family member.
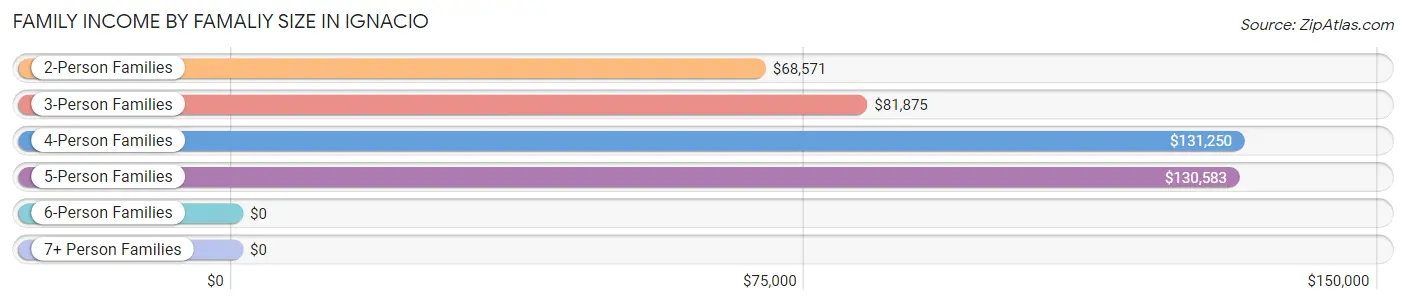
| Income Bracket | # Families | Median Income |
| 2-Person Families | 118 (45.0%) | $68,571 |
| 3-Person Families | 35 (13.4%) | $81,875 |
| 4-Person Families | 36 (13.7%) | $131,250 |
| 5-Person Families | 53 (20.2%) | $130,583 |
| 6-Person Families | 17 (6.5%) | $0 |
| 7+ Person Families | 3 (1.1%) | $0 |
| Total | 262 (100.0%) | $82,813 |
Family Income by Number of Earners in Ignacio
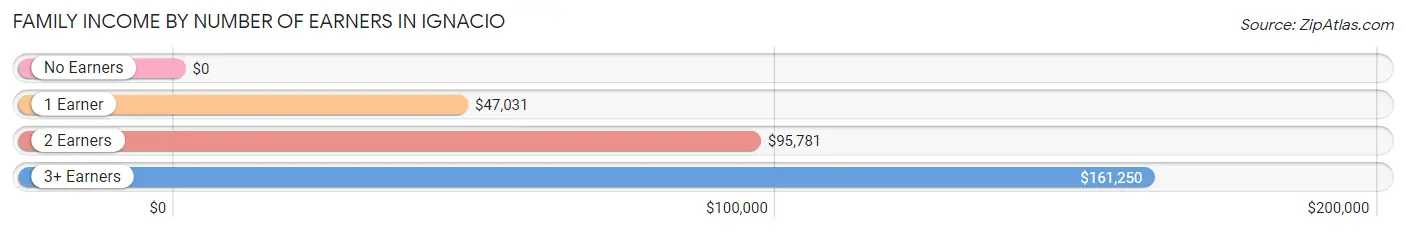
| Number of Earners | # Families | Median Income |
| No Earners | 30 (11.5%) | $0 |
| 1 Earner | 69 (26.3%) | $47,031 |
| 2 Earners | 127 (48.5%) | $95,781 |
| 3+ Earners | 36 (13.7%) | $161,250 |
| Total | 262 (100.0%) | $82,813 |
Household Income in Ignacio
Household Income Brackets in Ignacio
With 82 households falling in the category, the $50,000 to $74,999 income range is the most frequent in Ignacio, accounting for 17.7% of all households. In contrast, only 20 households (4.3%) fall into the $10,000 to $14,999 income bracket, making it the least populous group.
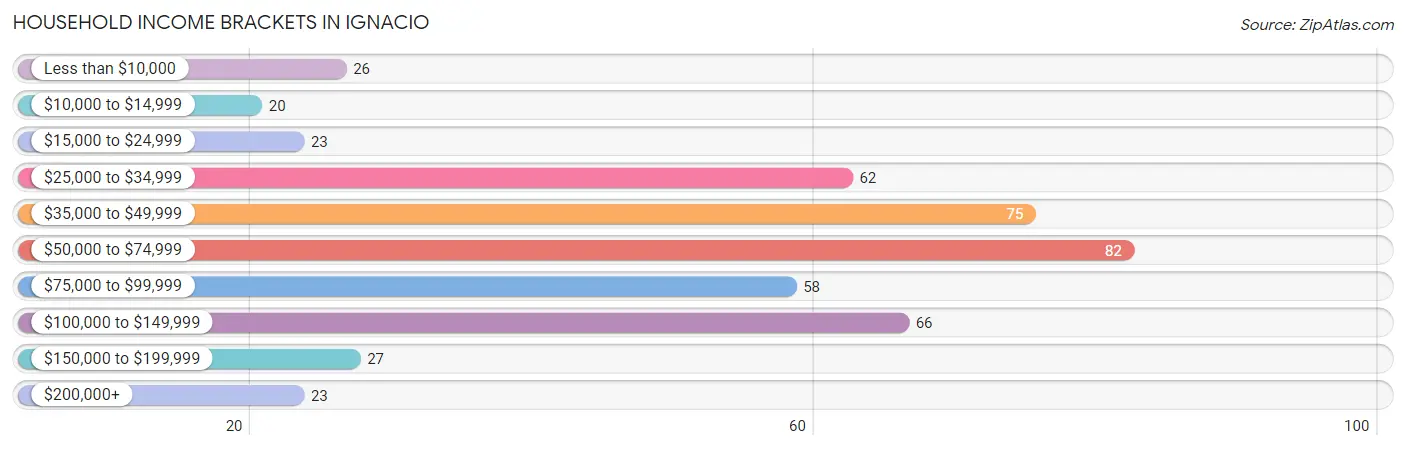
| Income Bracket | # Households | % Households |
| Less than $10,000 | 26 | 5.6% |
| $10,000 to $14,999 | 20 | 4.3% |
| $15,000 to $24,999 | 23 | 5.0% |
| $25,000 to $34,999 | 62 | 13.4% |
| $35,000 to $49,999 | 75 | 16.2% |
| $50,000 to $74,999 | 82 | 17.7% |
| $75,000 to $99,999 | 58 | 12.6% |
| $100,000 to $149,999 | 66 | 14.3% |
| $150,000 to $199,999 | 27 | 5.8% |
| $200,000+ | 23 | 5.0% |
Household Income by Householder Age in Ignacio
The median household income in Ignacio is $62,833, with the highest median household income of $65,714 found in the 45 to 64 years age bracket for the primary householder. A total of 172 households (37.2%) fall into this category. Meanwhile, the 25 to 44 years age bracket for the primary householder has the lowest median household income of $49,107, with 165 households (35.7%) in this group.
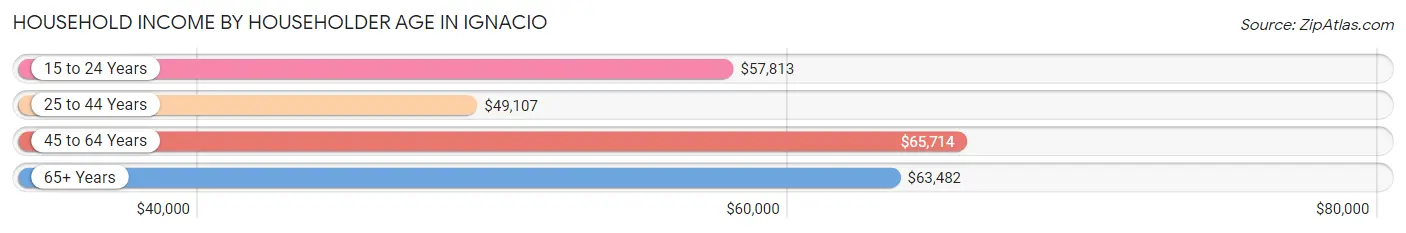
| Income Bracket | # Households | Median Income |
| 15 to 24 Years | 13 (2.8%) | $57,813 |
| 25 to 44 Years | 165 (35.7%) | $49,107 |
| 45 to 64 Years | 172 (37.2%) | $65,714 |
| 65+ Years | 112 (24.2%) | $63,482 |
| Total | 462 (100.0%) | $62,833 |
Poverty in Ignacio
Income Below Poverty by Sex and Age in Ignacio
With 9.1% poverty level for males and 19.0% for females among the residents of Ignacio, under 5 year old males and 6 to 11 year old females are the most vulnerable to poverty, with 22 males (66.7%) and 23 females (74.2%) in their respective age groups living below the poverty level.
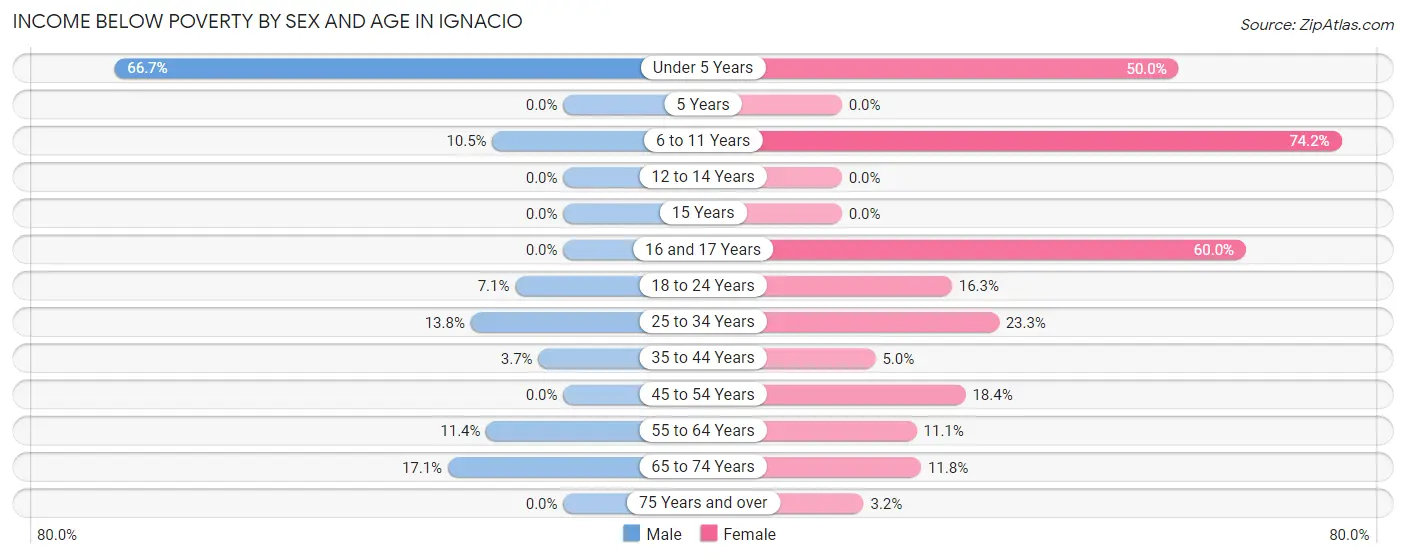
| Age Bracket | Male | Female |
| Under 5 Years | 22 (66.7%) | 21 (50.0%) |
| 5 Years | 0 (0.0%) | 0 (0.0%) |
| 6 to 11 Years | 4 (10.5%) | 23 (74.2%) |
| 12 to 14 Years | 0 (0.0%) | 0 (0.0%) |
| 15 Years | 0 (0.0%) | 0 (0.0%) |
| 16 and 17 Years | 0 (0.0%) | 6 (60.0%) |
| 18 to 24 Years | 4 (7.1%) | 8 (16.3%) |
| 25 to 34 Years | 11 (13.8%) | 24 (23.3%) |
| 35 to 44 Years | 3 (3.7%) | 4 (5.0%) |
| 45 to 54 Years | 0 (0.0%) | 9 (18.4%) |
| 55 to 64 Years | 8 (11.4%) | 13 (11.1%) |
| 65 to 74 Years | 6 (17.1%) | 6 (11.8%) |
| 75 Years and over | 0 (0.0%) | 1 (3.2%) |
| Total | 58 (9.1%) | 115 (19.0%) |
Income Above Poverty by Sex and Age in Ignacio
According to the poverty statistics in Ignacio, males aged 5 years and females aged 5 years are the age groups that are most secure financially, with 100.0% of males and 100.0% of females in these age groups living above the poverty line.
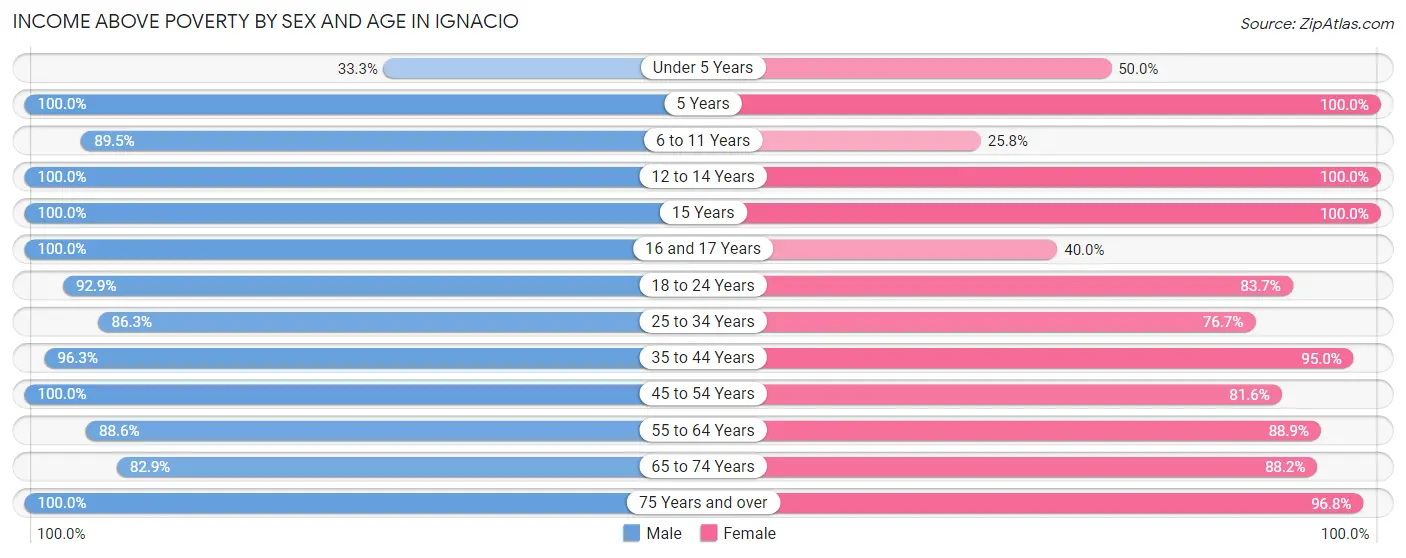
| Age Bracket | Male | Female |
| Under 5 Years | 11 (33.3%) | 21 (50.0%) |
| 5 Years | 27 (100.0%) | 2 (100.0%) |
| 6 to 11 Years | 34 (89.5%) | 8 (25.8%) |
| 12 to 14 Years | 40 (100.0%) | 22 (100.0%) |
| 15 Years | 8 (100.0%) | 18 (100.0%) |
| 16 and 17 Years | 16 (100.0%) | 4 (40.0%) |
| 18 to 24 Years | 52 (92.9%) | 41 (83.7%) |
| 25 to 34 Years | 69 (86.3%) | 79 (76.7%) |
| 35 to 44 Years | 78 (96.3%) | 76 (95.0%) |
| 45 to 54 Years | 110 (100.0%) | 40 (81.6%) |
| 55 to 64 Years | 62 (88.6%) | 104 (88.9%) |
| 65 to 74 Years | 29 (82.9%) | 45 (88.2%) |
| 75 Years and over | 43 (100.0%) | 30 (96.8%) |
| Total | 579 (90.9%) | 490 (81.0%) |
Income Below Poverty Among Married-Couple Families in Ignacio
The poverty statistics for married-couple families in Ignacio show that 4.3% or 8 of the total 187 families live below the poverty line. Families with 3 or 4 children have the highest poverty rate of 21.6%, comprising of 8 families. On the other hand, families with no children have the lowest poverty rate of 0.0%, which includes 0 families.
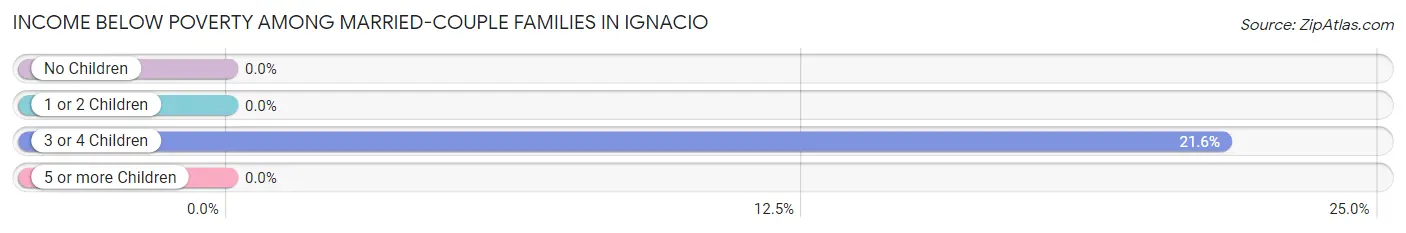
| Children | Above Poverty | Below Poverty |
| No Children | 103 (100.0%) | 0 (0.0%) |
| 1 or 2 Children | 44 (100.0%) | 0 (0.0%) |
| 3 or 4 Children | 29 (78.4%) | 8 (21.6%) |
| 5 or more Children | 3 (100.0%) | 0 (0.0%) |
| Total | 179 (95.7%) | 8 (4.3%) |
Income Below Poverty Among Single-Parent Households in Ignacio
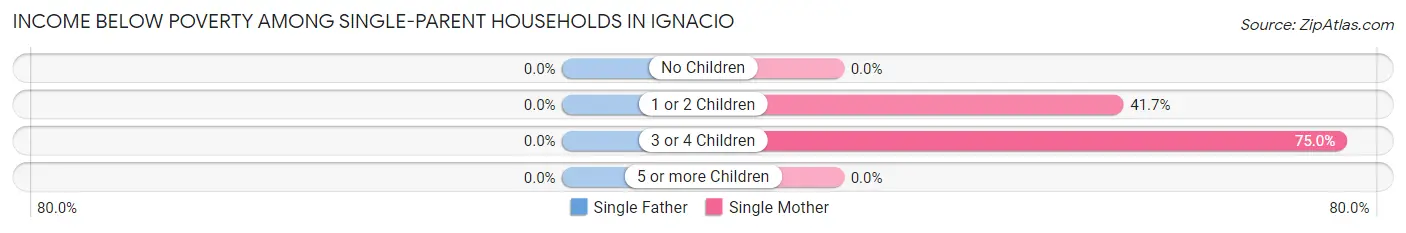
| Children | Single Father | Single Mother |
| No Children | 0 (0.0%) | 0 (0.0%) |
| 1 or 2 Children | 0 (0.0%) | 10 (41.7%) |
| 3 or 4 Children | 0 (0.0%) | 9 (75.0%) |
| 5 or more Children | 0 (0.0%) | 0 (0.0%) |
| Total | 0 (0.0%) | 19 (30.6%) |
Income Below Poverty Among Married-Couple vs Single-Parent Households in Ignacio
The poverty data for Ignacio shows that 8 of the married-couple family households (4.3%) and 19 of the single-parent households (25.3%) are living below the poverty level. Within the married-couple family households, those with 3 or 4 children have the highest poverty rate, with 8 households (21.6%) falling below the poverty line. Among the single-parent households, those with 3 or 4 children have the highest poverty rate, with 9 household (64.3%) living below poverty.
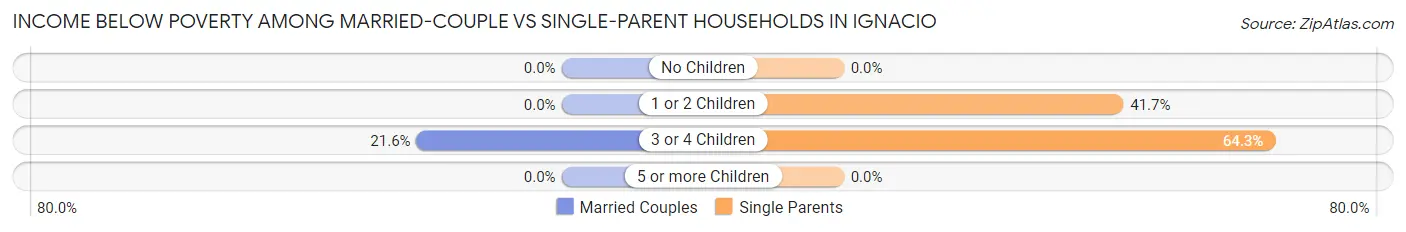
| Children | Married-Couple Families | Single-Parent Households |
| No Children | 0 (0.0%) | 0 (0.0%) |
| 1 or 2 Children | 0 (0.0%) | 10 (41.7%) |
| 3 or 4 Children | 8 (21.6%) | 9 (64.3%) |
| 5 or more Children | 0 (0.0%) | 0 (0.0%) |
| Total | 8 (4.3%) | 19 (25.3%) |
Race in Ignacio
The most populous races in Ignacio are White / Caucasian (854 | 67.9%), Hispanic or Latino (444 | 35.3%), and Native / Alaskan (240 | 19.1%).
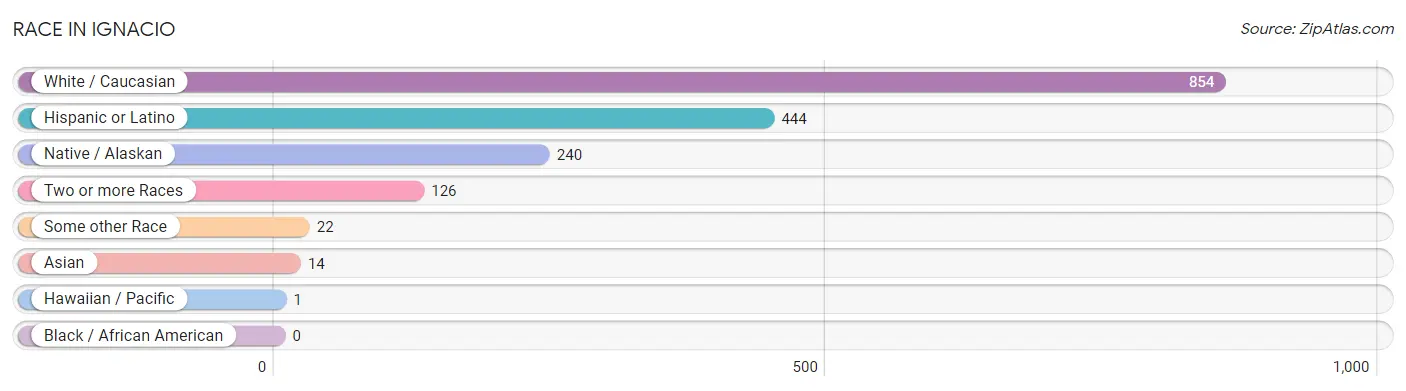
| Race | # Population | % Population |
| Asian | 14 | 1.1% |
| Black / African American | 0 | 0.0% |
| Hawaiian / Pacific | 1 | 0.1% |
| Hispanic or Latino | 444 | 35.3% |
| Native / Alaskan | 240 | 19.1% |
| White / Caucasian | 854 | 67.9% |
| Two or more Races | 126 | 10.0% |
| Some other Race | 22 | 1.8% |
| Total | 1,257 | 100.0% |
Ancestry in Ignacio
The most populous ancestries reported in Ignacio are Spanish (177 | 14.1%), Navajo (154 | 12.2%), Irish (135 | 10.7%), Mexican (130 | 10.3%), and English (99 | 7.9%), together accounting for 55.3% of all Ignacio residents.
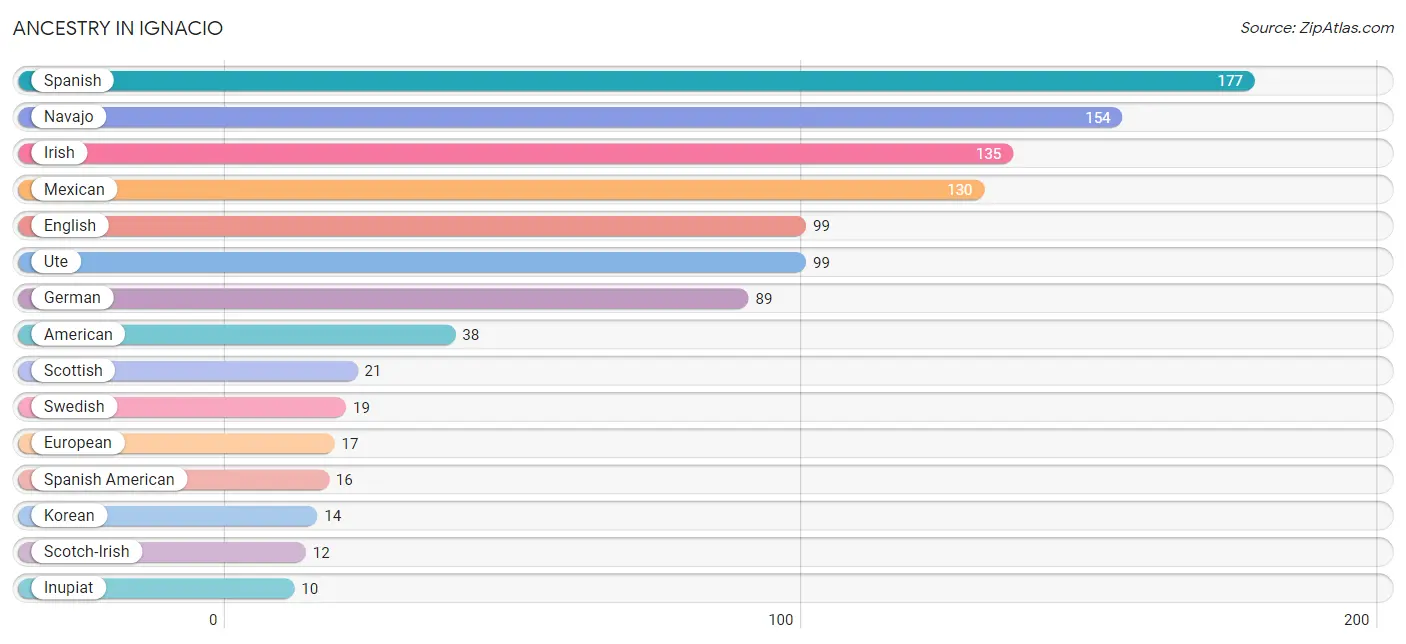
| Ancestry | # Population | % Population |
| American | 38 | 3.0% |
| Arab | 4 | 0.3% |
| Central American | 2 | 0.2% |
| Cherokee | 5 | 0.4% |
| Cheyenne | 4 | 0.3% |
| Chippewa | 4 | 0.3% |
| Choctaw | 2 | 0.2% |
| Czech | 2 | 0.2% |
| Dutch | 8 | 0.6% |
| Egyptian | 4 | 0.3% |
| English | 99 | 7.9% |
| European | 17 | 1.3% |
| Finnish | 2 | 0.2% |
| German | 89 | 7.1% |
| Honduran | 2 | 0.2% |
| Inupiat | 10 | 0.8% |
| Irish | 135 | 10.7% |
| Italian | 8 | 0.6% |
| Korean | 14 | 1.1% |
| Mexican | 130 | 10.3% |
| Native Hawaiian | 1 | 0.1% |
| Navajo | 154 | 12.2% |
| Norwegian | 2 | 0.2% |
| Polish | 2 | 0.2% |
| Portuguese | 3 | 0.2% |
| Pueblo | 3 | 0.2% |
| Samoan | 1 | 0.1% |
| Scandinavian | 6 | 0.5% |
| Scotch-Irish | 12 | 0.9% |
| Scottish | 21 | 1.7% |
| Slovak | 4 | 0.3% |
| Spaniard | 8 | 0.6% |
| Spanish | 177 | 14.1% |
| Spanish American | 16 | 1.3% |
| Swedish | 19 | 1.5% |
| Thai | 3 | 0.2% |
| Ute | 99 | 7.9% | View All 37 Rows |
Immigrants in Ignacio
The most numerous immigrant groups reported in Ignacio came from Asia (9 | 0.7%), Philippines (9 | 0.7%), South Eastern Asia (9 | 0.7%), Central America (6 | 0.5%), and Latin America (6 | 0.5%), together accounting for 3.1% of all Ignacio residents.
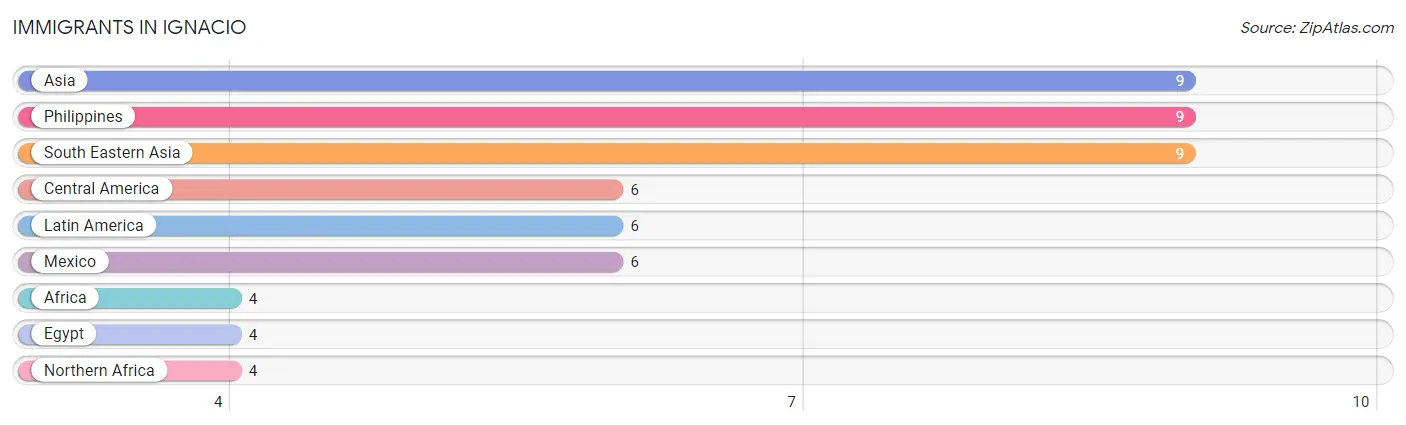
| Immigration Origin | # Population | % Population |
| Africa | 4 | 0.3% |
| Asia | 9 | 0.7% |
| Central America | 6 | 0.5% |
| Egypt | 4 | 0.3% |
| Latin America | 6 | 0.5% |
| Mexico | 6 | 0.5% |
| Northern Africa | 4 | 0.3% |
| Philippines | 9 | 0.7% |
| South Eastern Asia | 9 | 0.7% | View All 9 Rows |
Sex and Age in Ignacio
Sex and Age in Ignacio
The most populous age groups in Ignacio are 10 to 14 Years (65 | 10.1%) for men and 25 to 29 Years (64 | 10.5%) for women.
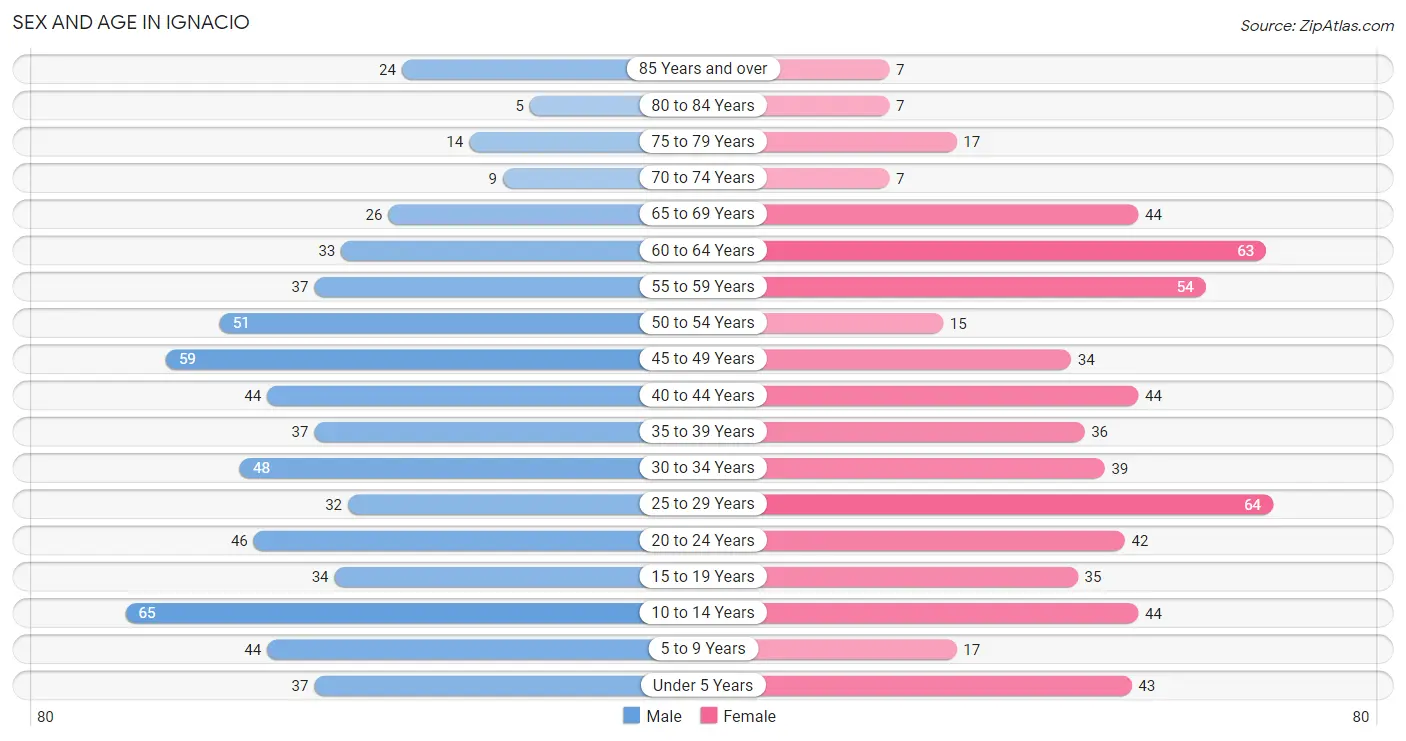
| Age Bracket | Male | Female |
| Under 5 Years | 37 (5.7%) | 43 (7.0%) |
| 5 to 9 Years | 44 (6.8%) | 17 (2.8%) |
| 10 to 14 Years | 65 (10.1%) | 44 (7.2%) |
| 15 to 19 Years | 34 (5.3%) | 35 (5.7%) |
| 20 to 24 Years | 46 (7.1%) | 42 (6.9%) |
| 25 to 29 Years | 32 (5.0%) | 64 (10.5%) |
| 30 to 34 Years | 48 (7.4%) | 39 (6.4%) |
| 35 to 39 Years | 37 (5.7%) | 36 (5.9%) |
| 40 to 44 Years | 44 (6.8%) | 44 (7.2%) |
| 45 to 49 Years | 59 (9.1%) | 34 (5.6%) |
| 50 to 54 Years | 51 (7.9%) | 15 (2.5%) |
| 55 to 59 Years | 37 (5.7%) | 54 (8.8%) |
| 60 to 64 Years | 33 (5.1%) | 63 (10.3%) |
| 65 to 69 Years | 26 (4.0%) | 44 (7.2%) |
| 70 to 74 Years | 9 (1.4%) | 7 (1.1%) |
| 75 to 79 Years | 14 (2.2%) | 17 (2.8%) |
| 80 to 84 Years | 5 (0.8%) | 7 (1.1%) |
| 85 Years and over | 24 (3.7%) | 7 (1.1%) |
| Total | 645 (100.0%) | 612 (100.0%) |
Families and Households in Ignacio
Median Family Size in Ignacio
The median family size in Ignacio is 3.71 persons per family, with single male/father families (13 | 5.0%) accounting for the largest median family size of 4.62 persons per family. On the other hand, single female/mother families (62 | 23.7%) represent the smallest median family size with 3.11 persons per family.
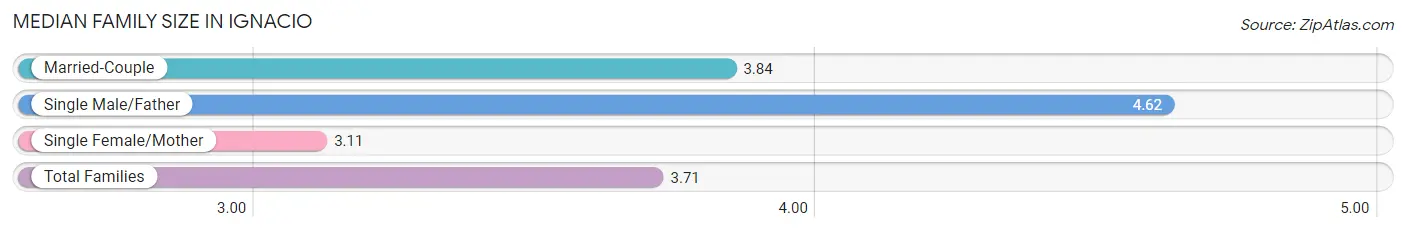
| Family Type | # Families | Family Size |
| Married-Couple | 187 (71.4%) | 3.84 |
| Single Male/Father | 13 (5.0%) | 4.62 |
| Single Female/Mother | 62 (23.7%) | 3.11 |
| Total Families | 262 (100.0%) | 3.71 |
Median Household Size in Ignacio
The median household size in Ignacio is 2.72 persons per household, with single male/father households (13 | 2.8%) accounting for the largest median household size of 6.15 persons per household. non-family households (200 | 43.3%) represent the smallest median household size with 1.28 persons per household.
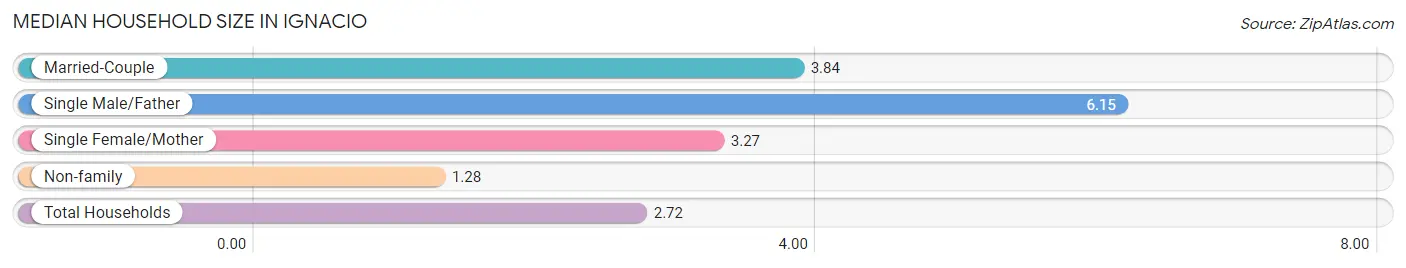
| Household Type | # Households | Household Size |
| Married-Couple | 187 (40.5%) | 3.84 |
| Single Male/Father | 13 (2.8%) | 6.15 |
| Single Female/Mother | 62 (13.4%) | 3.27 |
| Non-family | 200 (43.3%) | 1.28 |
| Total Households | 462 (100.0%) | 2.72 |
Household Size by Marriage Status in Ignacio
Out of a total of 462 households in Ignacio, 262 (56.7%) are family households, while 200 (43.3%) are nonfamily households. The most numerous type of family households are 2-person households, comprising 111, and the most common type of nonfamily households are 1-person households, comprising 167.
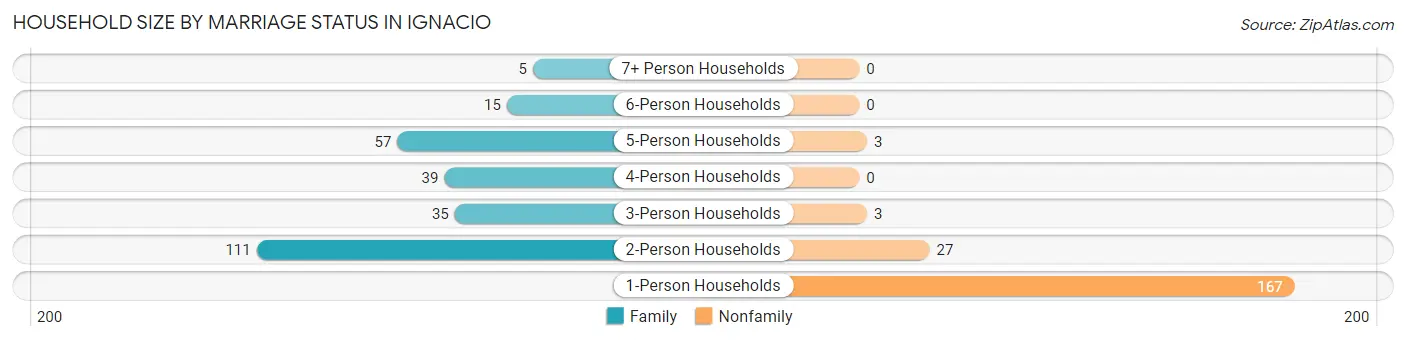
| Household Size | Family Households | Nonfamily Households |
| 1-Person Households | - | 167 (36.1%) |
| 2-Person Households | 111 (24.0%) | 27 (5.8%) |
| 3-Person Households | 35 (7.6%) | 3 (0.6%) |
| 4-Person Households | 39 (8.4%) | 0 (0.0%) |
| 5-Person Households | 57 (12.3%) | 3 (0.6%) |
| 6-Person Households | 15 (3.3%) | 0 (0.0%) |
| 7+ Person Households | 5 (1.1%) | 0 (0.0%) |
| Total | 262 (56.7%) | 200 (43.3%) |
Female Fertility in Ignacio
Fertility by Age in Ignacio
Average fertility rate in Ignacio is 43.0 births per 1,000 women. Women in the age bracket of 20 to 34 years have the highest fertility rate with 90.0 births per 1,000 women. Women in the age bracket of 20 to 34 years acount for 100.0% of all women with births.
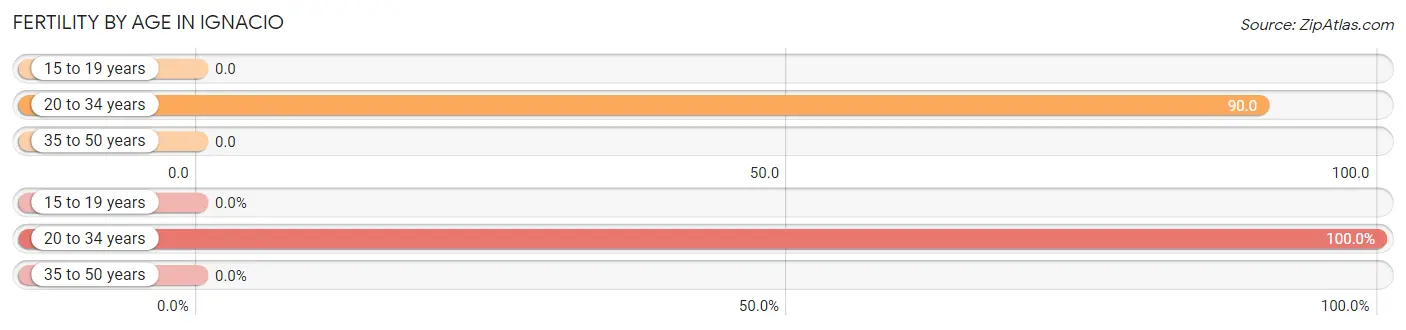
| Age Bracket | Women with Births | Births / 1,000 Women |
| 15 to 19 years | 0 (0.0%) | 0.0 |
| 20 to 34 years | 13 (100.0%) | 90.0 |
| 35 to 50 years | 0 (0.0%) | 0.0 |
| Total | 13 (100.0%) | 43.0 |
Fertility by Age by Marriage Status in Ignacio
15.4% of women with births (13) in Ignacio are married. The highest percentage of unmarried women with births falls into 20 to 34 years age bracket with 84.6% of them unmarried at the time of birth, while the lowest percentage of unmarried women with births belong to 20 to 34 years age bracket with 84.6% of them unmarried.
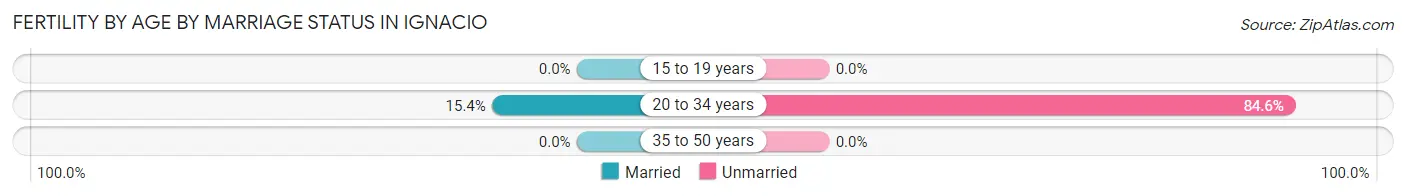
| Age Bracket | Married | Unmarried |
| 15 to 19 years | 0 (0.0%) | 0 (0.0%) |
| 20 to 34 years | 2 (15.4%) | 11 (84.6%) |
| 35 to 50 years | 0 (0.0%) | 0 (0.0%) |
| Total | 2 (15.4%) | 11 (84.6%) |
Fertility by Education in Ignacio
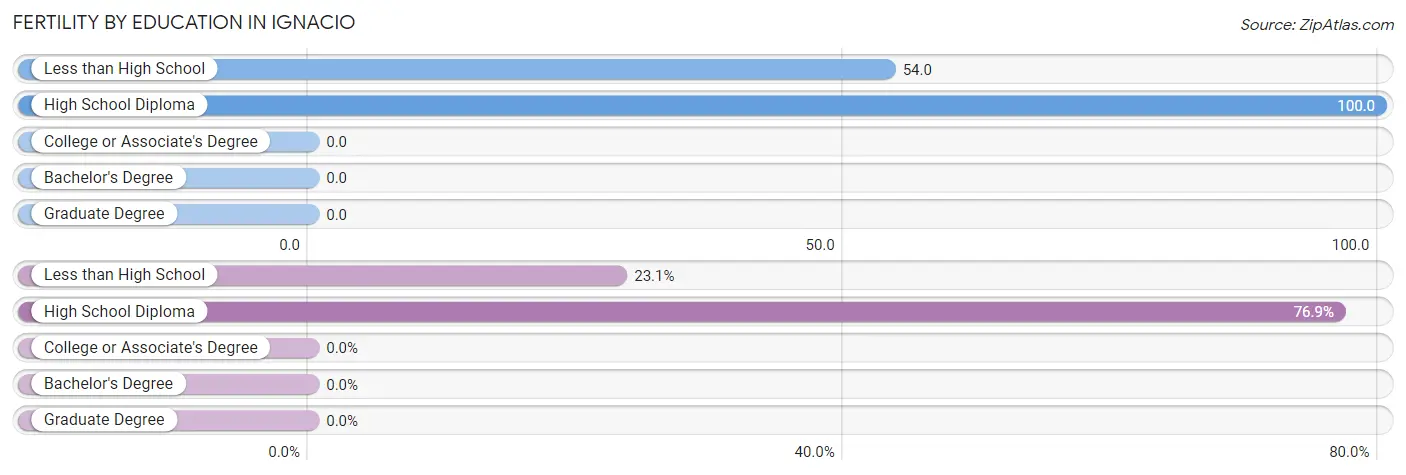
| Educational Attainment | Women with Births | Births / 1,000 Women |
| Less than High School | 3 (23.1%) | 54.0 |
| High School Diploma | 10 (76.9%) | 100.0 |
| College or Associate's Degree | 0 (0.0%) | 0.0 |
| Bachelor's Degree | 0 (0.0%) | 0.0 |
| Graduate Degree | 0 (0.0%) | 0.0 |
| Total | 13 (100.0%) | 43.0 |
Fertility by Education by Marriage Status in Ignacio
84.6% of women with births in Ignacio are unmarried. Women with the educational attainment of high school diploma are most likely to be married with 20.0% of them married at childbirth, while women with the educational attainment of less than high school are least likely to be married with 100.0% of them unmarried at childbirth.
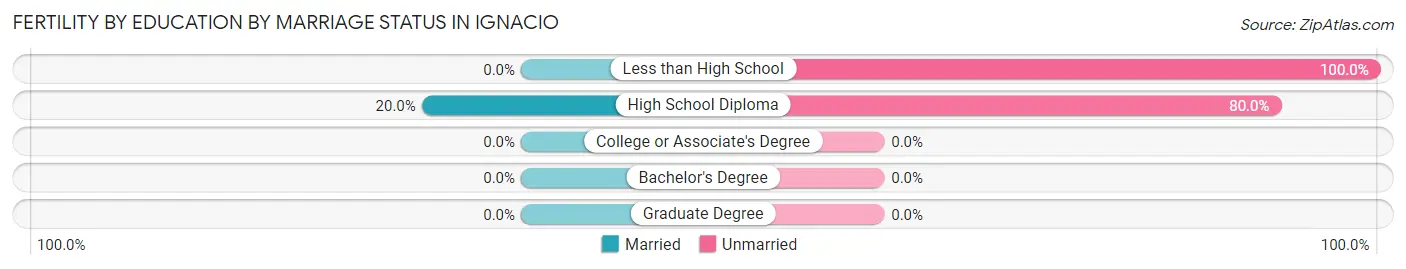
| Educational Attainment | Married | Unmarried |
| Less than High School | 0 (0.0%) | 3 (100.0%) |
| High School Diploma | 2 (20.0%) | 8 (80.0%) |
| College or Associate's Degree | 0 (0.0%) | 0 (0.0%) |
| Bachelor's Degree | 0 (0.0%) | 0 (0.0%) |
| Graduate Degree | 0 (0.0%) | 0 (0.0%) |
| Total | 2 (15.4%) | 11 (84.6%) |
Employment Characteristics in Ignacio
Employment by Class of Employer in Ignacio
Among the 615 employed individuals in Ignacio, private company employees (253 | 41.1%), local government employees (189 | 30.7%), and federal government employees (54 | 8.8%) make up the most common classes of employment.
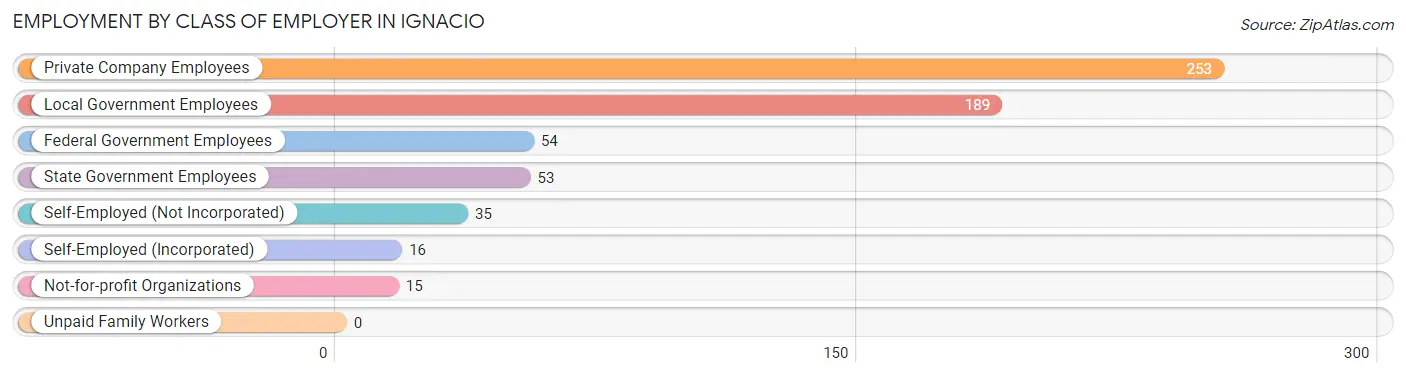
| Employer Class | # Employees | % Employees |
| Private Company Employees | 253 | 41.1% |
| Self-Employed (Incorporated) | 16 | 2.6% |
| Self-Employed (Not Incorporated) | 35 | 5.7% |
| Not-for-profit Organizations | 15 | 2.4% |
| Local Government Employees | 189 | 30.7% |
| State Government Employees | 53 | 8.6% |
| Federal Government Employees | 54 | 8.8% |
| Unpaid Family Workers | 0 | 0.0% |
| Total | 615 | 100.0% |
Employment Status by Age in Ignacio
According to the labor force statistics for Ignacio, out of the total population over 16 years of age (981), 67.9% or 666 individuals are in the labor force, with 7.7% or 51 of them unemployed. The age group with the highest labor force participation rate is 25 to 29 years, with 84.4% or 81 individuals in the labor force. Within the labor force, the 16 to 19 years age range has the highest percentage of unemployed individuals, with 47.1% or 8 of them being unemployed.
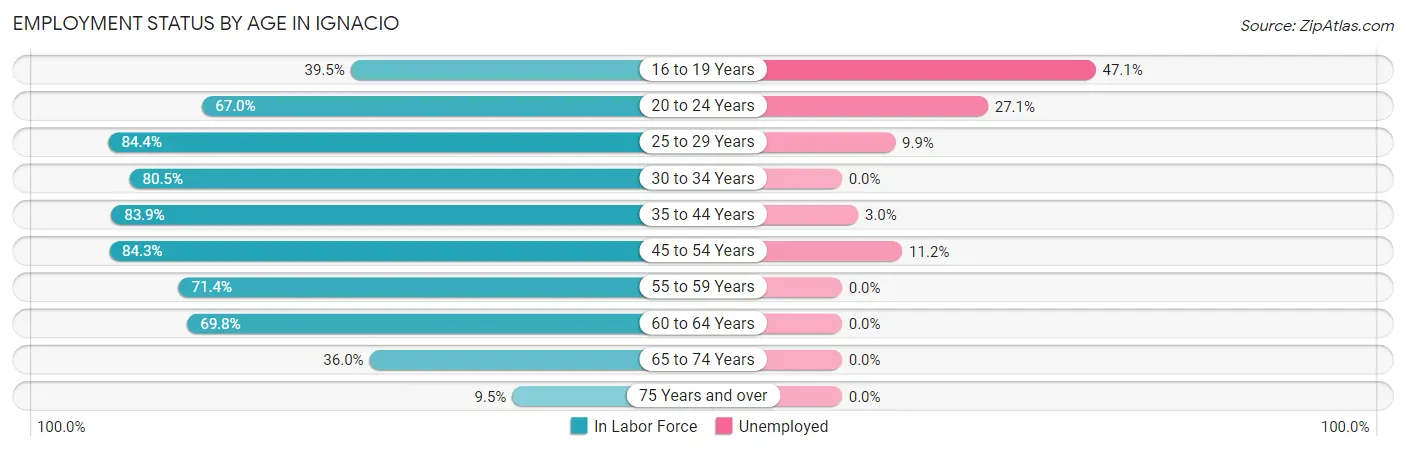
| Age Bracket | In Labor Force | Unemployed |
| 16 to 19 Years | 17 (39.5%) | 8 (47.1%) |
| 20 to 24 Years | 59 (67.0%) | 16 (27.1%) |
| 25 to 29 Years | 81 (84.4%) | 8 (9.9%) |
| 30 to 34 Years | 70 (80.5%) | 0 (0.0%) |
| 35 to 44 Years | 135 (83.9%) | 4 (3.0%) |
| 45 to 54 Years | 134 (84.3%) | 15 (11.2%) |
| 55 to 59 Years | 65 (71.4%) | 0 (0.0%) |
| 60 to 64 Years | 67 (69.8%) | 0 (0.0%) |
| 65 to 74 Years | 31 (36.0%) | 0 (0.0%) |
| 75 Years and over | 7 (9.5%) | 0 (0.0%) |
| Total | 666 (67.9%) | 51 (7.7%) |
Employment Status by Educational Attainment in Ignacio
According to labor force statistics for Ignacio, 80.0% of individuals (552) out of the total population between 25 and 64 years of age (690) are in the labor force, with 4.9% or 27 of them being unemployed. The group with the highest labor force participation rate are those with the educational attainment of college / associate degree, with 91.1% or 174 individuals in the labor force. Within the labor force, individuals with less than high school education have the highest percentage of unemployment, with 25.4% or 15 of them being unemployed.
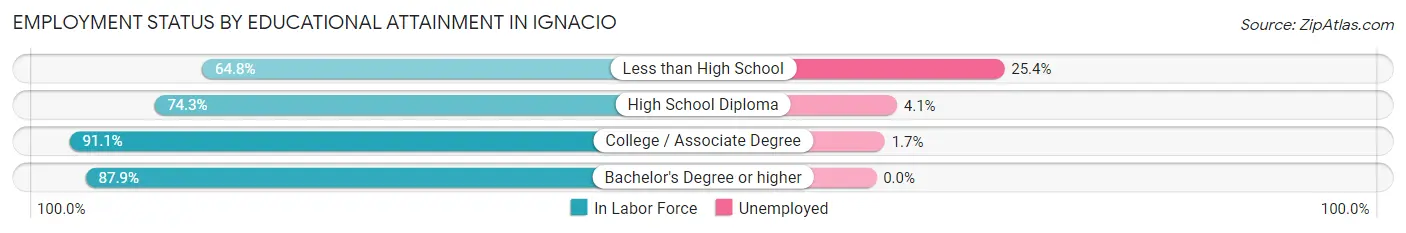
| Educational Attainment | In Labor Force | Unemployed |
| Less than High School | 59 (64.8%) | 23 (25.4%) |
| High School Diploma | 217 (74.3%) | 12 (4.1%) |
| College / Associate Degree | 174 (91.1%) | 3 (1.7%) |
| Bachelor's Degree or higher | 102 (87.9%) | 0 (0.0%) |
| Total | 552 (80.0%) | 34 (4.9%) |
Employment Occupations by Sex in Ignacio
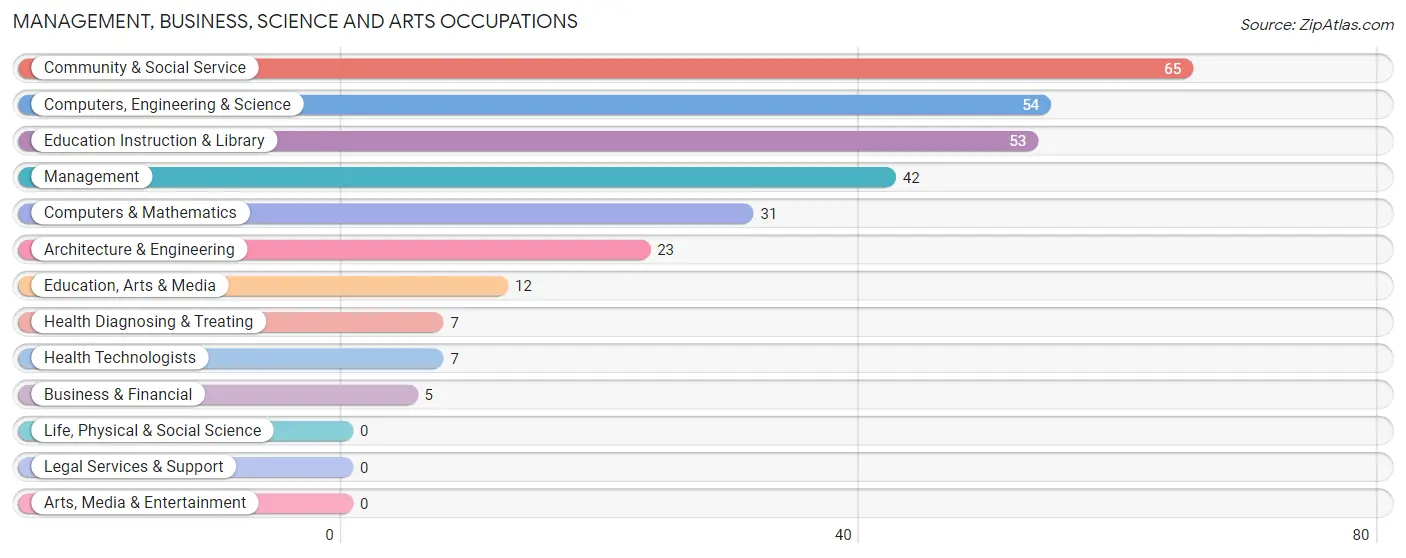
Management, Business, Science and Arts Occupations
The most common Management, Business, Science and Arts occupations in Ignacio are Community & Social Service (65 | 10.6%), Computers, Engineering & Science (54 | 8.8%), Education Instruction & Library (53 | 8.6%), Management (42 | 6.8%), and Computers & Mathematics (31 | 5.0%).
Management, Business, Science and Arts Occupations by Sex
Within the Management, Business, Science and Arts occupations in Ignacio, the most male-oriented occupations are Architecture & Engineering (100.0%), Computers, Engineering & Science (66.7%), and Management (61.9%), while the most female-oriented occupations are Business & Financial (100.0%), Health Diagnosing & Treating (100.0%), and Health Technologists (100.0%).
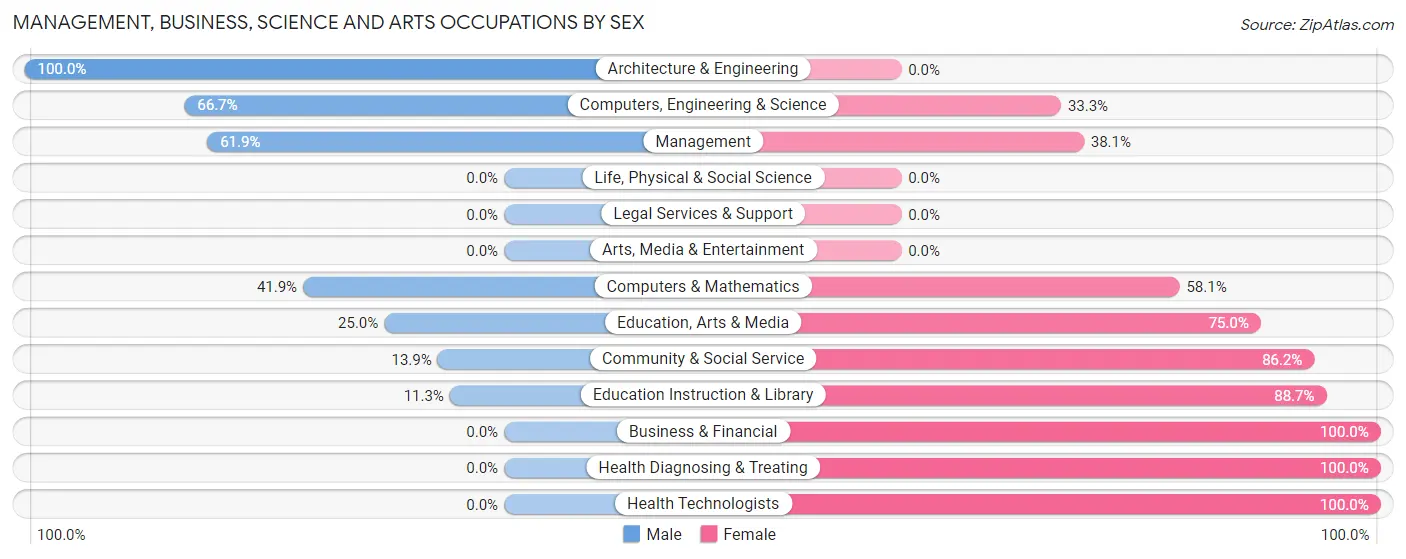
| Occupation | Male | Female |
| Management | 26 (61.9%) | 16 (38.1%) |
| Business & Financial | 0 (0.0%) | 5 (100.0%) |
| Computers, Engineering & Science | 36 (66.7%) | 18 (33.3%) |
| Computers & Mathematics | 13 (41.9%) | 18 (58.1%) |
| Architecture & Engineering | 23 (100.0%) | 0 (0.0%) |
| Life, Physical & Social Science | 0 (0.0%) | 0 (0.0%) |
| Community & Social Service | 9 (13.9%) | 56 (86.2%) |
| Education, Arts & Media | 3 (25.0%) | 9 (75.0%) |
| Legal Services & Support | 0 (0.0%) | 0 (0.0%) |
| Education Instruction & Library | 6 (11.3%) | 47 (88.7%) |
| Arts, Media & Entertainment | 0 (0.0%) | 0 (0.0%) |
| Health Diagnosing & Treating | 0 (0.0%) | 7 (100.0%) |
| Health Technologists | 0 (0.0%) | 7 (100.0%) |
| Total (Category) | 71 (41.0%) | 102 (59.0%) |
| Total (Overall) | 311 (50.6%) | 304 (49.4%) |
Services Occupations
The most common Services occupations in Ignacio are Cleaning & Maintenance (89 | 14.5%), Food Preparation & Serving (67 | 10.9%), Security & Protection (37 | 6.0%), Firefighting & Prevention (29 | 4.7%), and Personal Care & Service (25 | 4.1%).
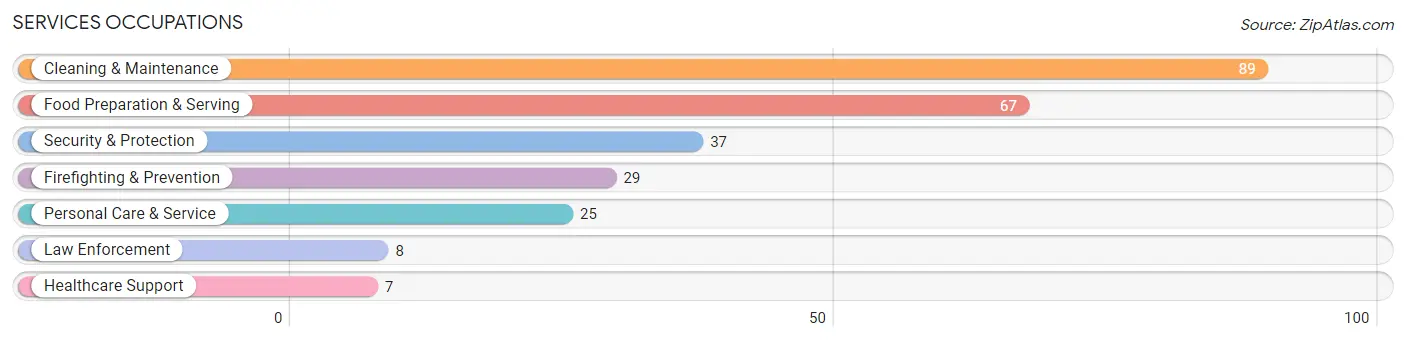
Services Occupations by Sex
Within the Services occupations in Ignacio, the most male-oriented occupations are Law Enforcement (100.0%), Cleaning & Maintenance (59.6%), and Food Preparation & Serving (49.2%), while the most female-oriented occupations are Healthcare Support (100.0%), Firefighting & Prevention (93.1%), and Personal Care & Service (76.0%).
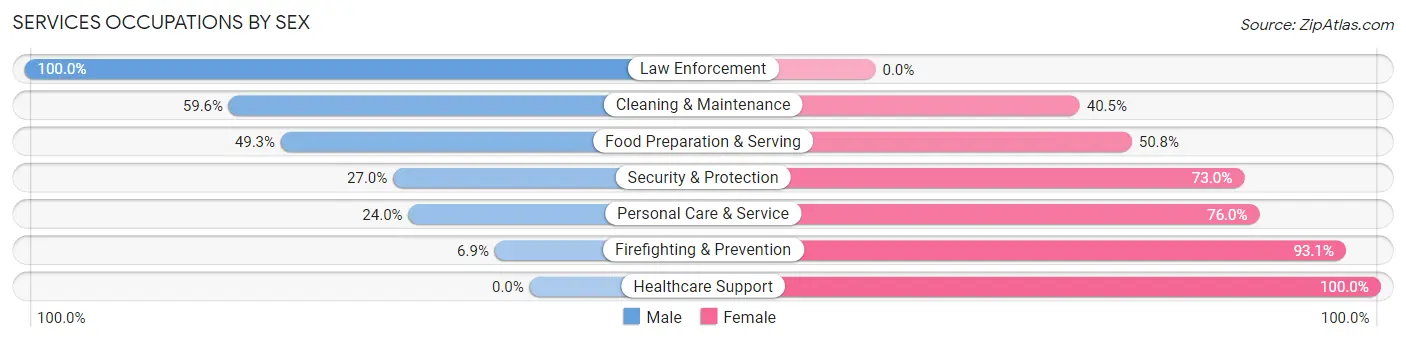
| Occupation | Male | Female |
| Healthcare Support | 0 (0.0%) | 7 (100.0%) |
| Security & Protection | 10 (27.0%) | 27 (73.0%) |
| Firefighting & Prevention | 2 (6.9%) | 27 (93.1%) |
| Law Enforcement | 8 (100.0%) | 0 (0.0%) |
| Food Preparation & Serving | 33 (49.2%) | 34 (50.7%) |
| Cleaning & Maintenance | 53 (59.6%) | 36 (40.5%) |
| Personal Care & Service | 6 (24.0%) | 19 (76.0%) |
| Total (Category) | 102 (45.3%) | 123 (54.7%) |
| Total (Overall) | 311 (50.6%) | 304 (49.4%) |
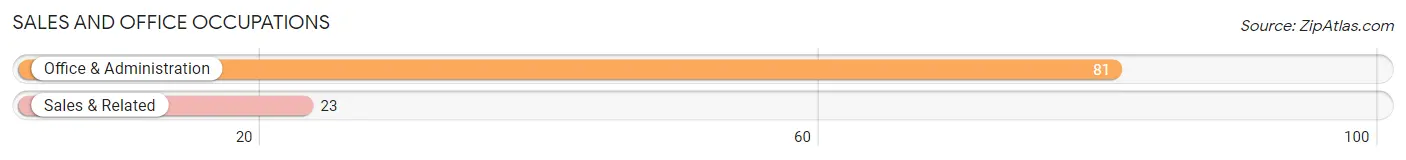
Sales and Office Occupations
The most common Sales and Office occupations in Ignacio are Office & Administration (81 | 13.2%), and Sales & Related (23 | 3.7%).
Sales and Office Occupations by Sex
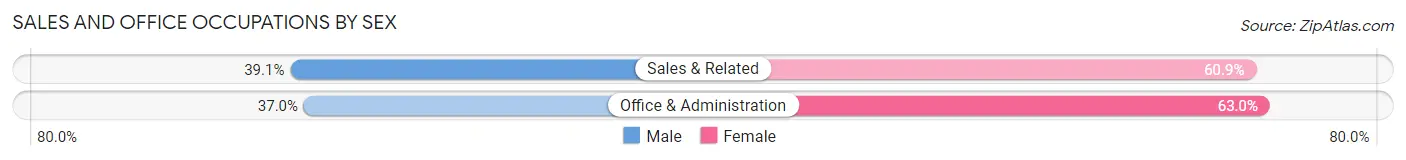
| Occupation | Male | Female |
| Sales & Related | 9 (39.1%) | 14 (60.9%) |
| Office & Administration | 30 (37.0%) | 51 (63.0%) |
| Total (Category) | 39 (37.5%) | 65 (62.5%) |
| Total (Overall) | 311 (50.6%) | 304 (49.4%) |
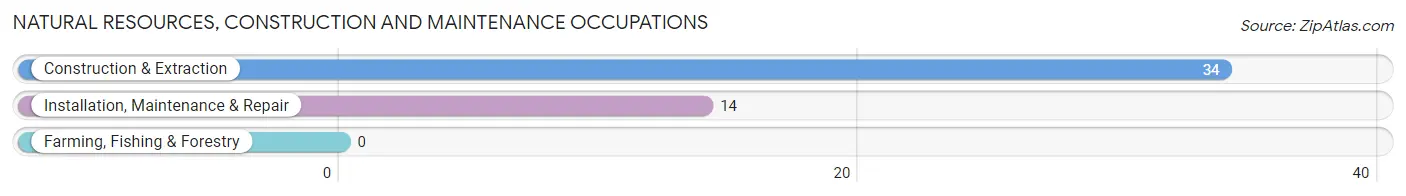
Natural Resources, Construction and Maintenance Occupations
The most common Natural Resources, Construction and Maintenance occupations in Ignacio are Construction & Extraction (34 | 5.5%), and Installation, Maintenance & Repair (14 | 2.3%).
Natural Resources, Construction and Maintenance Occupations by Sex
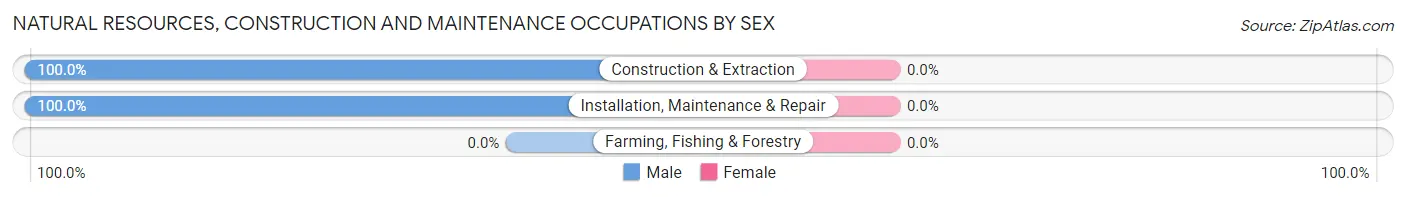
| Occupation | Male | Female |
| Farming, Fishing & Forestry | 0 (0.0%) | 0 (0.0%) |
| Construction & Extraction | 34 (100.0%) | 0 (0.0%) |
| Installation, Maintenance & Repair | 14 (100.0%) | 0 (0.0%) |
| Total (Category) | 48 (100.0%) | 0 (0.0%) |
| Total (Overall) | 311 (50.6%) | 304 (49.4%) |
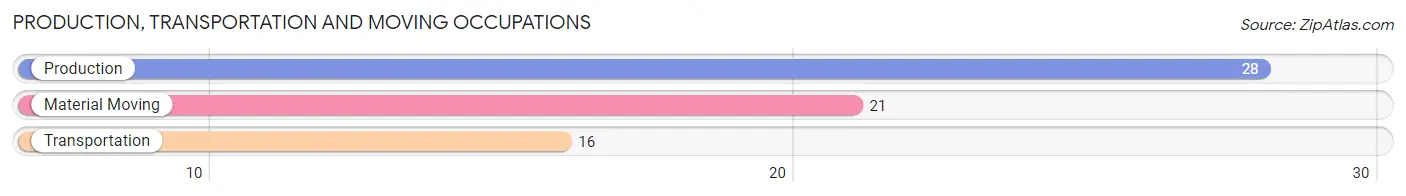
Production, Transportation and Moving Occupations
The most common Production, Transportation and Moving occupations in Ignacio are Production (28 | 4.5%), Material Moving (21 | 3.4%), and Transportation (16 | 2.6%).
Production, Transportation and Moving Occupations by Sex
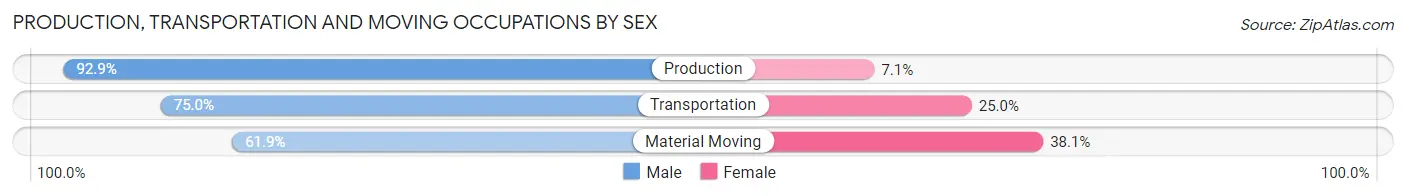
| Occupation | Male | Female |
| Production | 26 (92.9%) | 2 (7.1%) |
| Transportation | 12 (75.0%) | 4 (25.0%) |
| Material Moving | 13 (61.9%) | 8 (38.1%) |
| Total (Category) | 51 (78.5%) | 14 (21.5%) |
| Total (Overall) | 311 (50.6%) | 304 (49.4%) |
Employment Industries by Sex in Ignacio
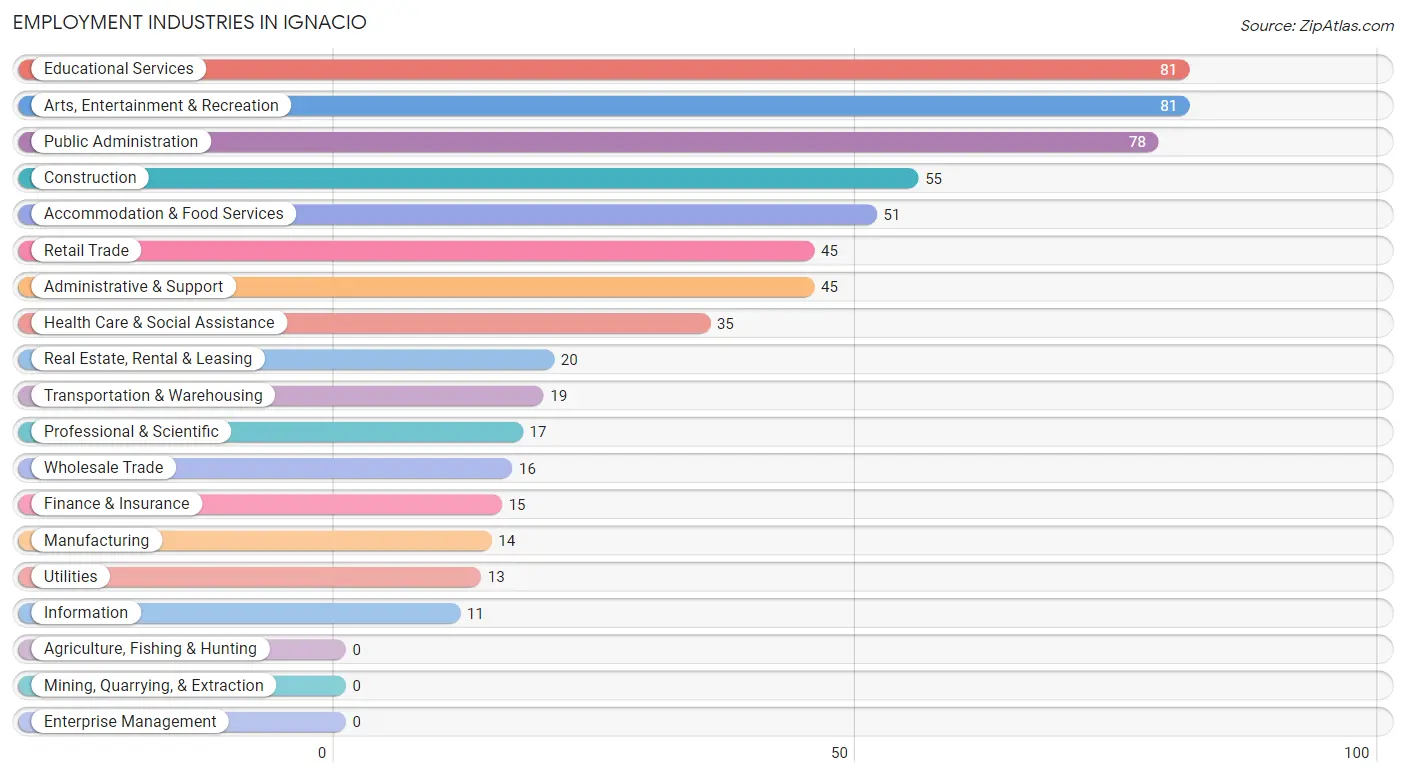
Employment Industries in Ignacio
The major employment industries in Ignacio include Educational Services (81 | 13.2%), Arts, Entertainment & Recreation (81 | 13.2%), Public Administration (78 | 12.7%), Construction (55 | 8.9%), and Accommodation & Food Services (51 | 8.3%).
Employment Industries by Sex in Ignacio
The Ignacio industries that see more men than women are Construction (100.0%), Wholesale Trade (100.0%), and Transportation & Warehousing (100.0%), whereas the industries that tend to have a higher number of women are Finance & Insurance (100.0%), Health Care & Social Assistance (85.7%), and Administrative & Support (75.6%).
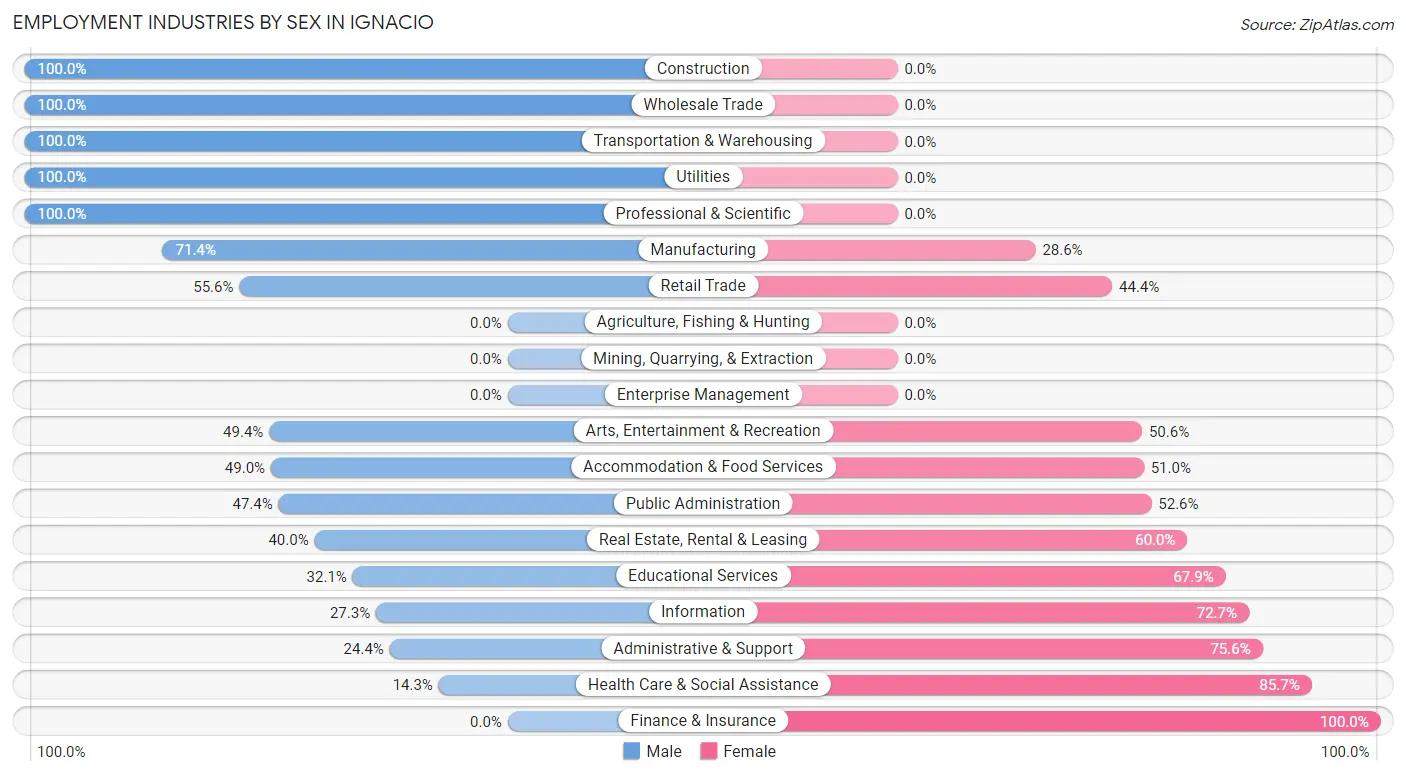
| Industry | Male | Female |
| Agriculture, Fishing & Hunting | 0 (0.0%) | 0 (0.0%) |
| Mining, Quarrying, & Extraction | 0 (0.0%) | 0 (0.0%) |
| Construction | 55 (100.0%) | 0 (0.0%) |
| Manufacturing | 10 (71.4%) | 4 (28.6%) |
| Wholesale Trade | 16 (100.0%) | 0 (0.0%) |
| Retail Trade | 25 (55.6%) | 20 (44.4%) |
| Transportation & Warehousing | 19 (100.0%) | 0 (0.0%) |
| Utilities | 13 (100.0%) | 0 (0.0%) |
| Information | 3 (27.3%) | 8 (72.7%) |
| Finance & Insurance | 0 (0.0%) | 15 (100.0%) |
| Real Estate, Rental & Leasing | 8 (40.0%) | 12 (60.0%) |
| Professional & Scientific | 17 (100.0%) | 0 (0.0%) |
| Enterprise Management | 0 (0.0%) | 0 (0.0%) |
| Administrative & Support | 11 (24.4%) | 34 (75.6%) |
| Educational Services | 26 (32.1%) | 55 (67.9%) |
| Health Care & Social Assistance | 5 (14.3%) | 30 (85.7%) |
| Arts, Entertainment & Recreation | 40 (49.4%) | 41 (50.6%) |
| Accommodation & Food Services | 25 (49.0%) | 26 (51.0%) |
| Public Administration | 37 (47.4%) | 41 (52.6%) |
| Total | 311 (50.6%) | 304 (49.4%) |
Education in Ignacio
School Enrollment in Ignacio
The most common levels of schooling among the 266 students in Ignacio are middle school (90 | 33.8%), high school (76 | 28.6%), and kindergarten (39 | 14.7%).
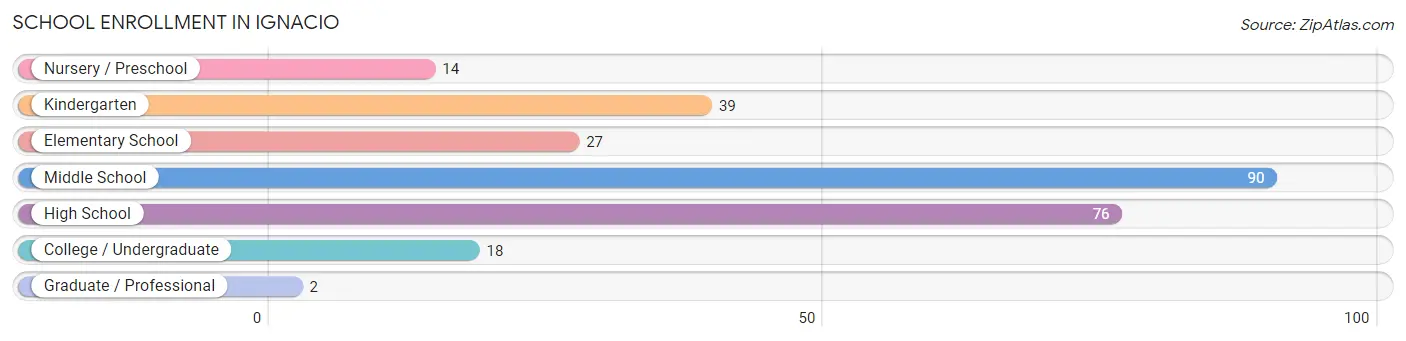
| School Level | # Students | % Students |
| Nursery / Preschool | 14 | 5.3% |
| Kindergarten | 39 | 14.7% |
| Elementary School | 27 | 10.2% |
| Middle School | 90 | 33.8% |
| High School | 76 | 28.6% |
| College / Undergraduate | 18 | 6.8% |
| Graduate / Professional | 2 | 0.7% |
| Total | 266 | 100.0% |
School Enrollment by Age by Funding Source in Ignacio
Out of a total of 266 students who are enrolled in schools in Ignacio, 30 (11.3%) attend a private institution, while the remaining 236 (88.7%) are enrolled in public schools. The age group of 20 to 24 year olds has the highest likelihood of being enrolled in private schools, with 4 (100.0% in the age bracket) enrolled. Conversely, the age group of 5 to 9 year old has the lowest likelihood of being enrolled in a private school, with 61 (100.0% in the age bracket) attending a public institution.
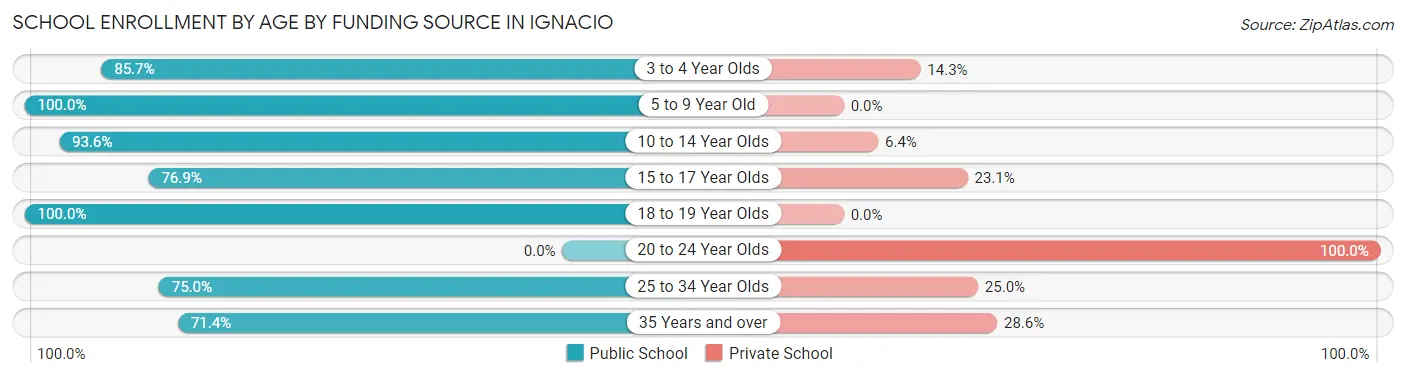
| Age Bracket | Public School | Private School |
| 3 to 4 Year Olds | 12 (85.7%) | 2 (14.3%) |
| 5 to 9 Year Old | 61 (100.0%) | 0 (0.0%) |
| 10 to 14 Year Olds | 102 (93.6%) | 7 (6.4%) |
| 15 to 17 Year Olds | 40 (76.9%) | 12 (23.1%) |
| 18 to 19 Year Olds | 7 (100.0%) | 0 (0.0%) |
| 20 to 24 Year Olds | 0 (0.0%) | 4 (100.0%) |
| 25 to 34 Year Olds | 9 (75.0%) | 3 (25.0%) |
| 35 Years and over | 5 (71.4%) | 2 (28.6%) |
| Total | 236 (88.7%) | 30 (11.3%) |
Educational Attainment by Field of Study in Ignacio
Education (34 | 22.4%), liberal arts & history (27 | 17.8%), computers & mathematics (25 | 16.5%), social sciences (18 | 11.8%), and science & technology (14 | 9.2%) are the most common fields of study among 152 individuals in Ignacio who have obtained a bachelor's degree or higher.
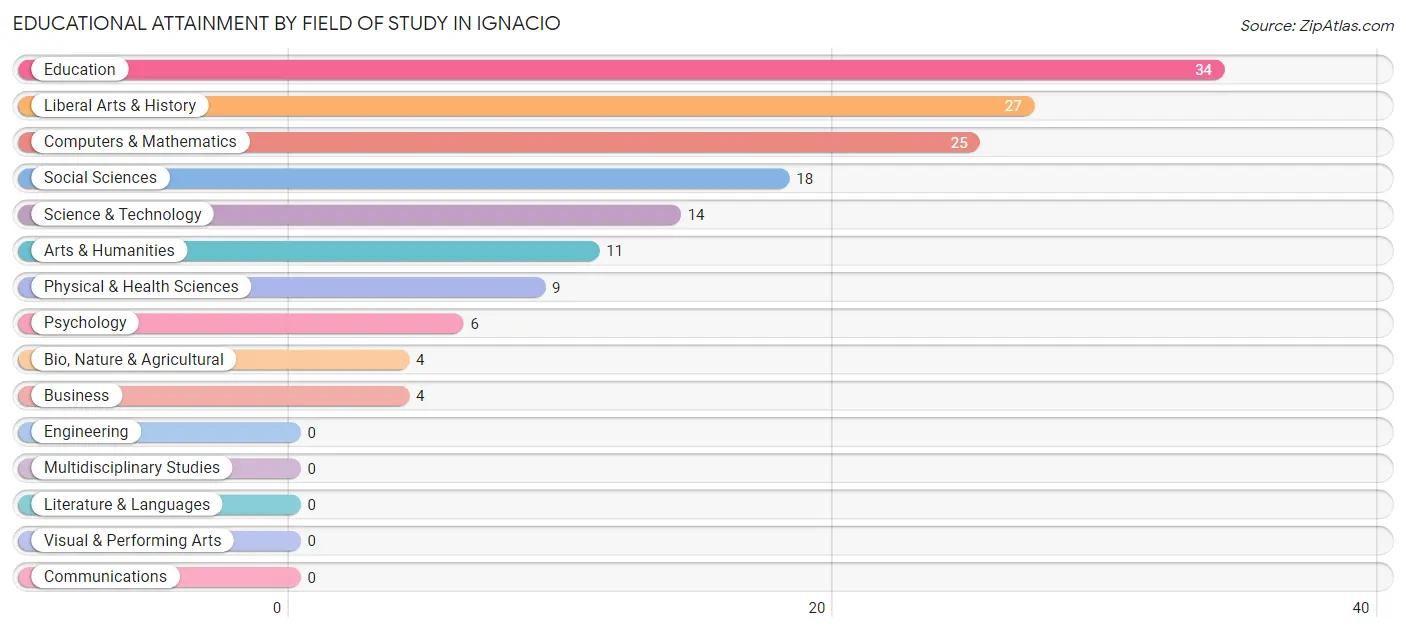
| Field of Study | # Graduates | % Graduates |
| Computers & Mathematics | 25 | 16.5% |
| Bio, Nature & Agricultural | 4 | 2.6% |
| Physical & Health Sciences | 9 | 5.9% |
| Psychology | 6 | 4.0% |
| Social Sciences | 18 | 11.8% |
| Engineering | 0 | 0.0% |
| Multidisciplinary Studies | 0 | 0.0% |
| Science & Technology | 14 | 9.2% |
| Business | 4 | 2.6% |
| Education | 34 | 22.4% |
| Literature & Languages | 0 | 0.0% |
| Liberal Arts & History | 27 | 17.8% |
| Visual & Performing Arts | 0 | 0.0% |
| Communications | 0 | 0.0% |
| Arts & Humanities | 11 | 7.2% |
| Total | 152 | 100.0% |
Transportation & Commute in Ignacio
Vehicle Availability by Sex in Ignacio
The most prevalent vehicle ownership categories in Ignacio are males with 3 vehicles (117, accounting for 37.6%) and females with 3 vehicles (69, making up 38.5%).
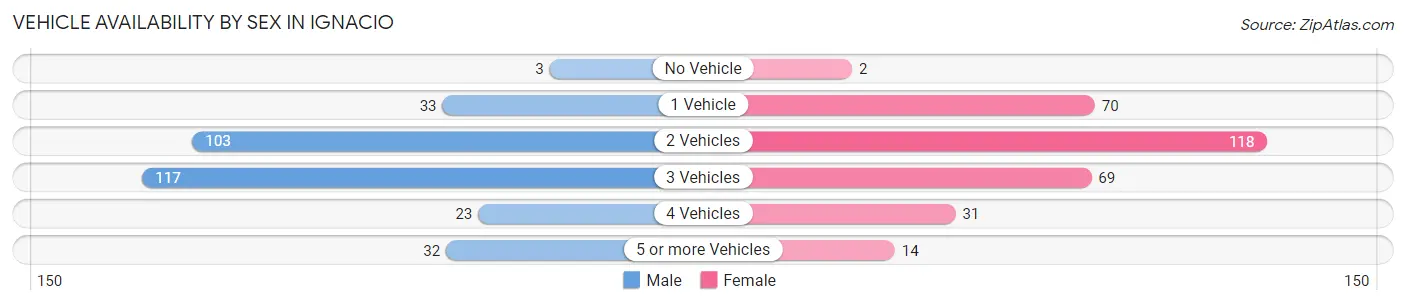
| Vehicles Available | Male | Female |
| No Vehicle | 3 (1.0%) | 2 (0.7%) |
| 1 Vehicle | 33 (10.6%) | 70 (23.0%) |
| 2 Vehicles | 103 (33.1%) | 118 (38.8%) |
| 3 Vehicles | 117 (37.6%) | 69 (22.7%) |
| 4 Vehicles | 23 (7.4%) | 31 (10.2%) |
| 5 or more Vehicles | 32 (10.3%) | 14 (4.6%) |
| Total | 311 (100.0%) | 304 (100.0%) |
Commute Time in Ignacio
The most frequently occuring commute durations in Ignacio are 5 to 9 minutes (161 commuters, 27.5%), 30 to 34 minutes (132 commuters, 22.5%), and 10 to 14 minutes (83 commuters, 14.2%).
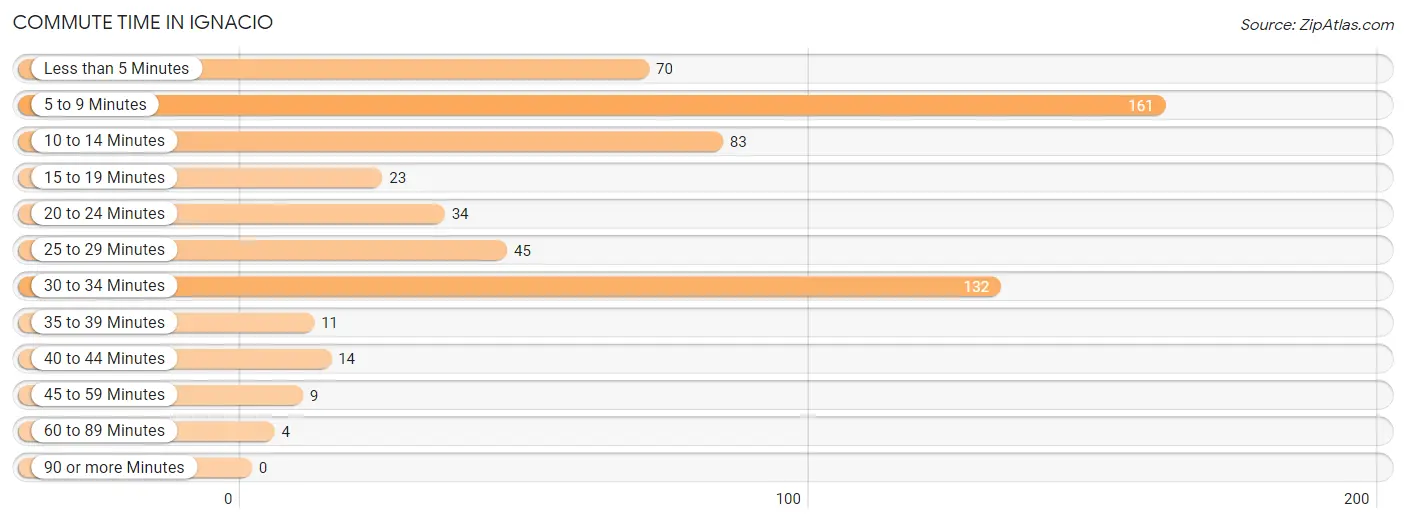
| Commute Time | # Commuters | % Commuters |
| Less than 5 Minutes | 70 | 11.9% |
| 5 to 9 Minutes | 161 | 27.5% |
| 10 to 14 Minutes | 83 | 14.2% |
| 15 to 19 Minutes | 23 | 3.9% |
| 20 to 24 Minutes | 34 | 5.8% |
| 25 to 29 Minutes | 45 | 7.7% |
| 30 to 34 Minutes | 132 | 22.5% |
| 35 to 39 Minutes | 11 | 1.9% |
| 40 to 44 Minutes | 14 | 2.4% |
| 45 to 59 Minutes | 9 | 1.5% |
| 60 to 89 Minutes | 4 | 0.7% |
| 90 or more Minutes | 0 | 0.0% |
Commute Time by Sex in Ignacio
The most common commute times in Ignacio are 30 to 34 minutes (74 commuters, 24.7%) for males and 5 to 9 minutes (114 commuters, 39.7%) for females.
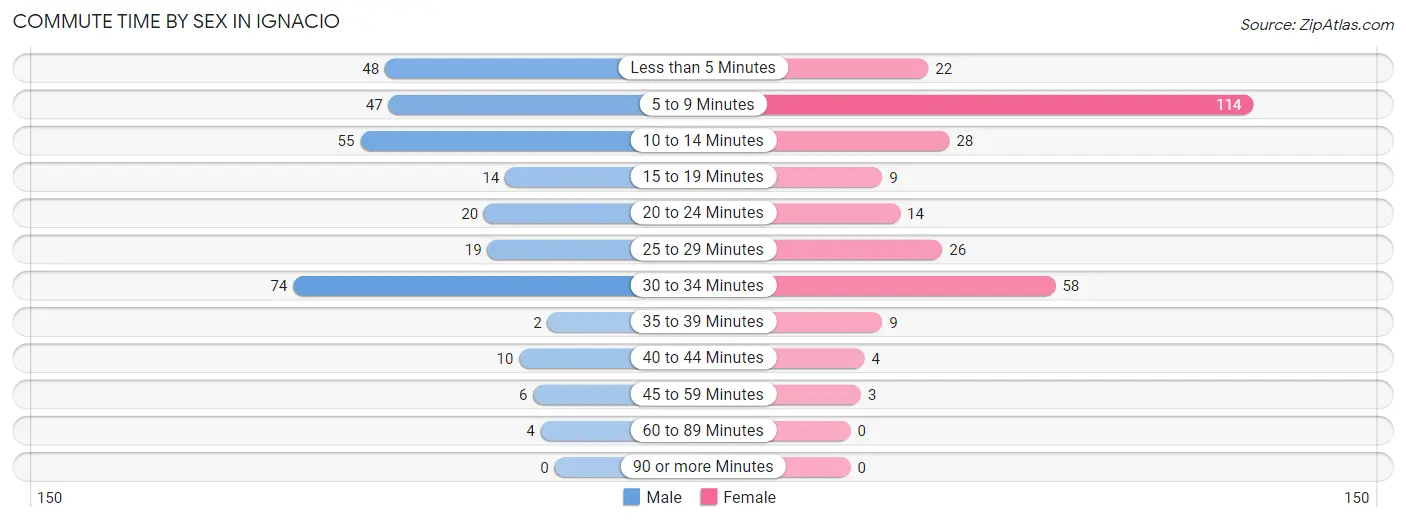
| Commute Time | Male | Female |
| Less than 5 Minutes | 48 (16.1%) | 22 (7.7%) |
| 5 to 9 Minutes | 47 (15.7%) | 114 (39.7%) |
| 10 to 14 Minutes | 55 (18.4%) | 28 (9.8%) |
| 15 to 19 Minutes | 14 (4.7%) | 9 (3.1%) |
| 20 to 24 Minutes | 20 (6.7%) | 14 (4.9%) |
| 25 to 29 Minutes | 19 (6.4%) | 26 (9.1%) |
| 30 to 34 Minutes | 74 (24.7%) | 58 (20.2%) |
| 35 to 39 Minutes | 2 (0.7%) | 9 (3.1%) |
| 40 to 44 Minutes | 10 (3.3%) | 4 (1.4%) |
| 45 to 59 Minutes | 6 (2.0%) | 3 (1.1%) |
| 60 to 89 Minutes | 4 (1.3%) | 0 (0.0%) |
| 90 or more Minutes | 0 (0.0%) | 0 (0.0%) |
Time of Departure to Work by Sex in Ignacio
The most frequent times of departure to work in Ignacio are 7:00 AM to 7:29 AM (106, 35.4%) for males and 7:30 AM to 7:59 AM (80, 27.9%) for females.
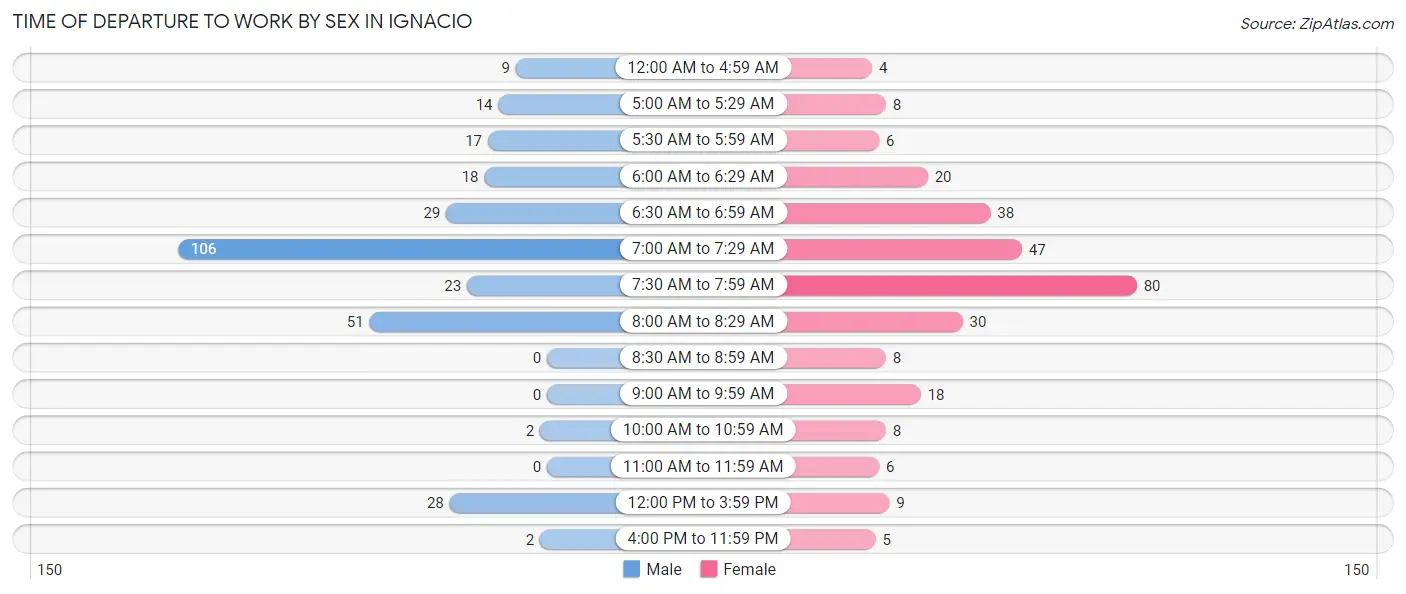
| Time of Departure | Male | Female |
| 12:00 AM to 4:59 AM | 9 (3.0%) | 4 (1.4%) |
| 5:00 AM to 5:29 AM | 14 (4.7%) | 8 (2.8%) |
| 5:30 AM to 5:59 AM | 17 (5.7%) | 6 (2.1%) |
| 6:00 AM to 6:29 AM | 18 (6.0%) | 20 (7.0%) |
| 6:30 AM to 6:59 AM | 29 (9.7%) | 38 (13.2%) |
| 7:00 AM to 7:29 AM | 106 (35.4%) | 47 (16.4%) |
| 7:30 AM to 7:59 AM | 23 (7.7%) | 80 (27.9%) |
| 8:00 AM to 8:29 AM | 51 (17.1%) | 30 (10.4%) |
| 8:30 AM to 8:59 AM | 0 (0.0%) | 8 (2.8%) |
| 9:00 AM to 9:59 AM | 0 (0.0%) | 18 (6.3%) |
| 10:00 AM to 10:59 AM | 2 (0.7%) | 8 (2.8%) |
| 11:00 AM to 11:59 AM | 0 (0.0%) | 6 (2.1%) |
| 12:00 PM to 3:59 PM | 28 (9.4%) | 9 (3.1%) |
| 4:00 PM to 11:59 PM | 2 (0.7%) | 5 (1.7%) |
| Total | 299 (100.0%) | 287 (100.0%) |
Housing Occupancy in Ignacio
Occupancy by Ownership in Ignacio
Of the total 462 dwellings in Ignacio, owner-occupied units account for 288 (62.3%), while renter-occupied units make up 174 (37.7%).
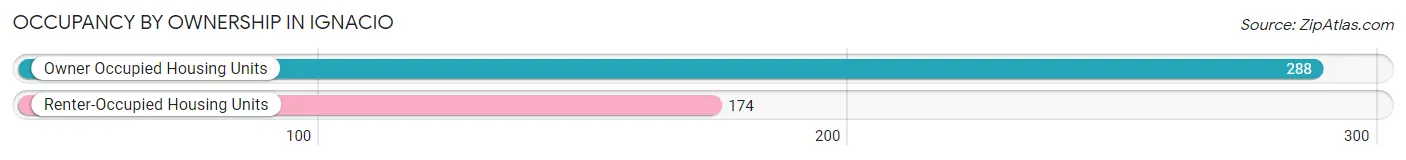
| Occupancy | # Housing Units | % Housing Units |
| Owner Occupied Housing Units | 288 | 62.3% |
| Renter-Occupied Housing Units | 174 | 37.7% |
| Total Occupied Housing Units | 462 | 100.0% |
Occupancy by Household Size in Ignacio
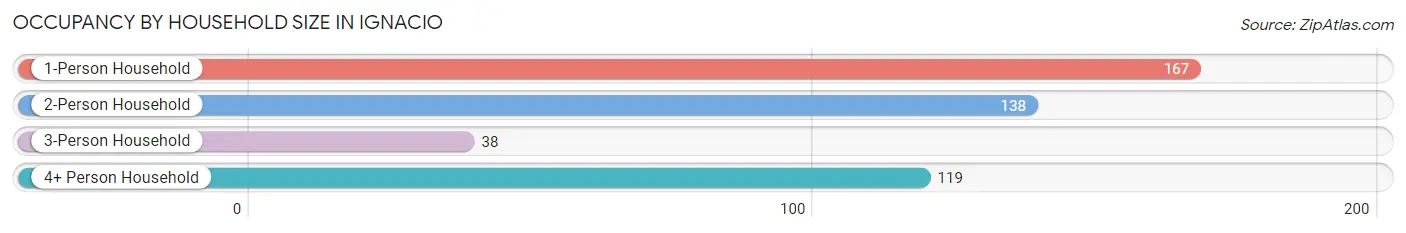
| Household Size | # Housing Units | % Housing Units |
| 1-Person Household | 167 | 36.1% |
| 2-Person Household | 138 | 29.9% |
| 3-Person Household | 38 | 8.2% |
| 4+ Person Household | 119 | 25.8% |
| Total Housing Units | 462 | 100.0% |
Occupancy by Ownership by Household Size in Ignacio
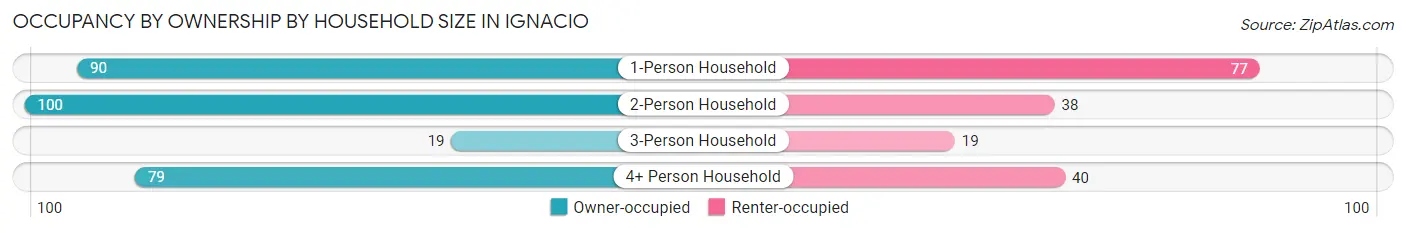
| Household Size | Owner-occupied | Renter-occupied |
| 1-Person Household | 90 (53.9%) | 77 (46.1%) |
| 2-Person Household | 100 (72.5%) | 38 (27.5%) |
| 3-Person Household | 19 (50.0%) | 19 (50.0%) |
| 4+ Person Household | 79 (66.4%) | 40 (33.6%) |
| Total Housing Units | 288 (62.3%) | 174 (37.7%) |
Occupancy by Educational Attainment in Ignacio
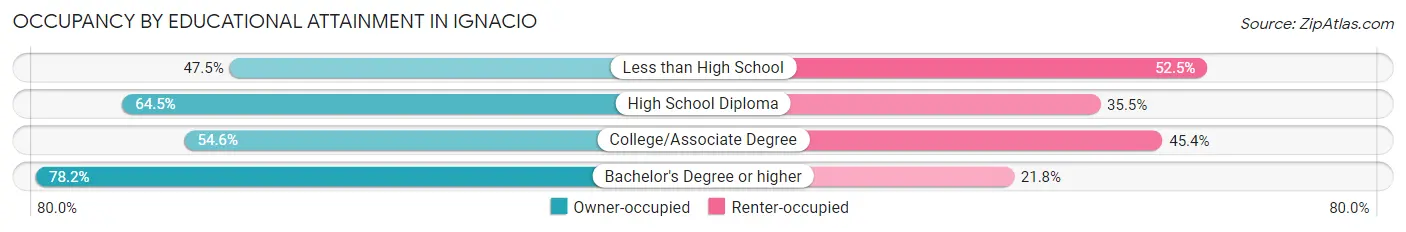
| Household Size | Owner-occupied | Renter-occupied |
| Less than High School | 19 (47.5%) | 21 (52.5%) |
| High School Diploma | 118 (64.5%) | 65 (35.5%) |
| College/Associate Degree | 83 (54.6%) | 69 (45.4%) |
| Bachelor's Degree or higher | 68 (78.2%) | 19 (21.8%) |
Occupancy by Age of Householder in Ignacio
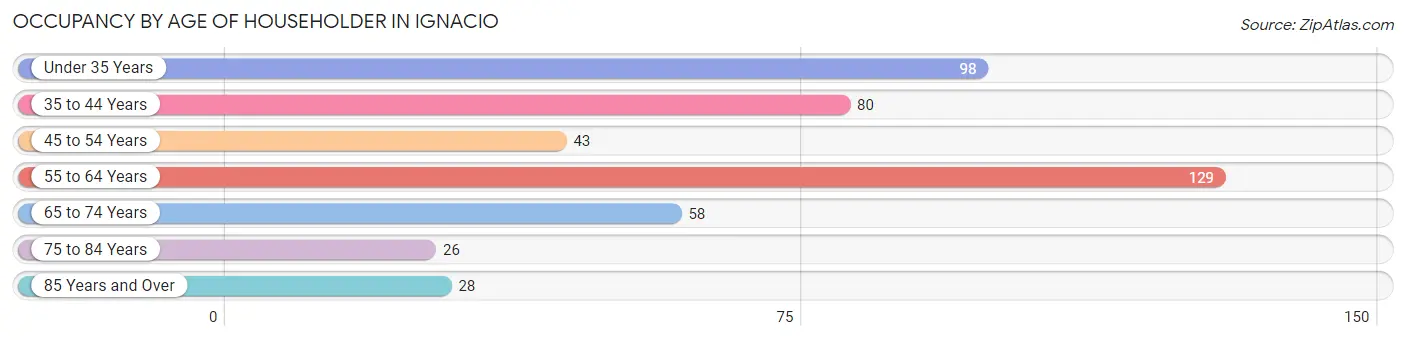
| Age Bracket | # Households | % Households |
| Under 35 Years | 98 | 21.2% |
| 35 to 44 Years | 80 | 17.3% |
| 45 to 54 Years | 43 | 9.3% |
| 55 to 64 Years | 129 | 27.9% |
| 65 to 74 Years | 58 | 12.6% |
| 75 to 84 Years | 26 | 5.6% |
| 85 Years and Over | 28 | 6.1% |
| Total | 462 | 100.0% |
Housing Finances in Ignacio
Median Income by Occupancy in Ignacio
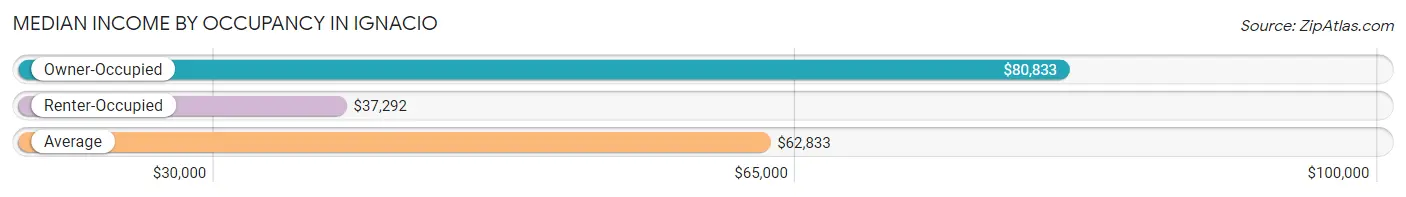
| Occupancy Type | # Households | Median Income |
| Owner-Occupied | 288 (62.3%) | $80,833 |
| Renter-Occupied | 174 (37.7%) | $37,292 |
| Average | 462 (100.0%) | $62,833 |
Occupancy by Householder Income Bracket in Ignacio
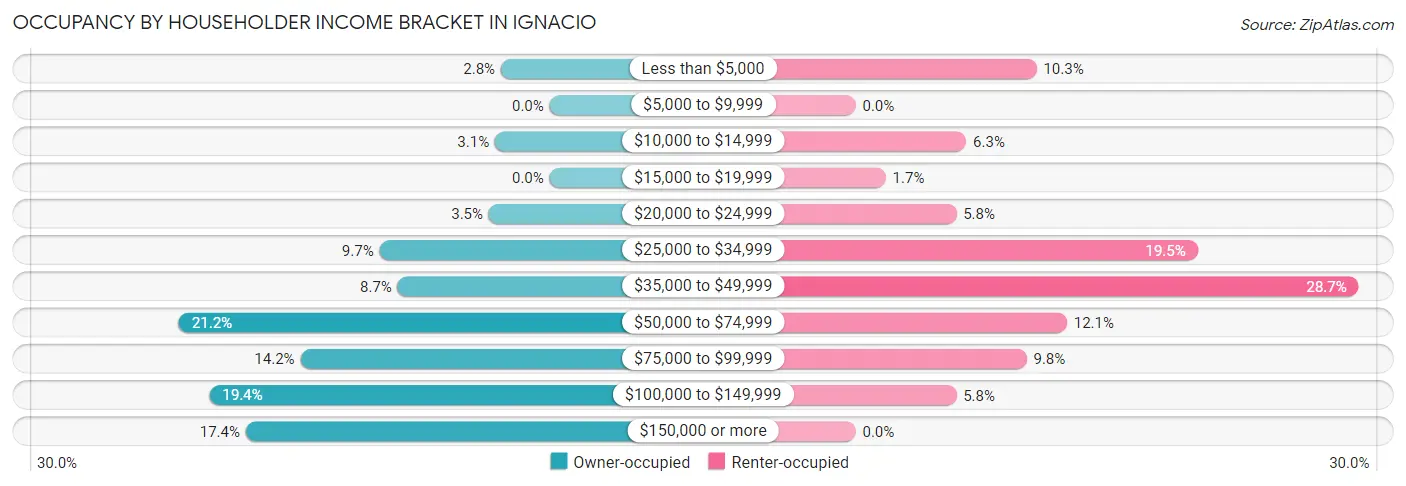
| Income Bracket | Owner-occupied | Renter-occupied |
| Less than $5,000 | 8 (2.8%) | 18 (10.3%) |
| $5,000 to $9,999 | 0 (0.0%) | 0 (0.0%) |
| $10,000 to $14,999 | 9 (3.1%) | 11 (6.3%) |
| $15,000 to $19,999 | 0 (0.0%) | 3 (1.7%) |
| $20,000 to $24,999 | 10 (3.5%) | 10 (5.8%) |
| $25,000 to $34,999 | 28 (9.7%) | 34 (19.5%) |
| $35,000 to $49,999 | 25 (8.7%) | 50 (28.7%) |
| $50,000 to $74,999 | 61 (21.2%) | 21 (12.1%) |
| $75,000 to $99,999 | 41 (14.2%) | 17 (9.8%) |
| $100,000 to $149,999 | 56 (19.4%) | 10 (5.8%) |
| $150,000 or more | 50 (17.4%) | 0 (0.0%) |
| Total | 288 (100.0%) | 174 (100.0%) |
Monthly Housing Cost Tiers in Ignacio
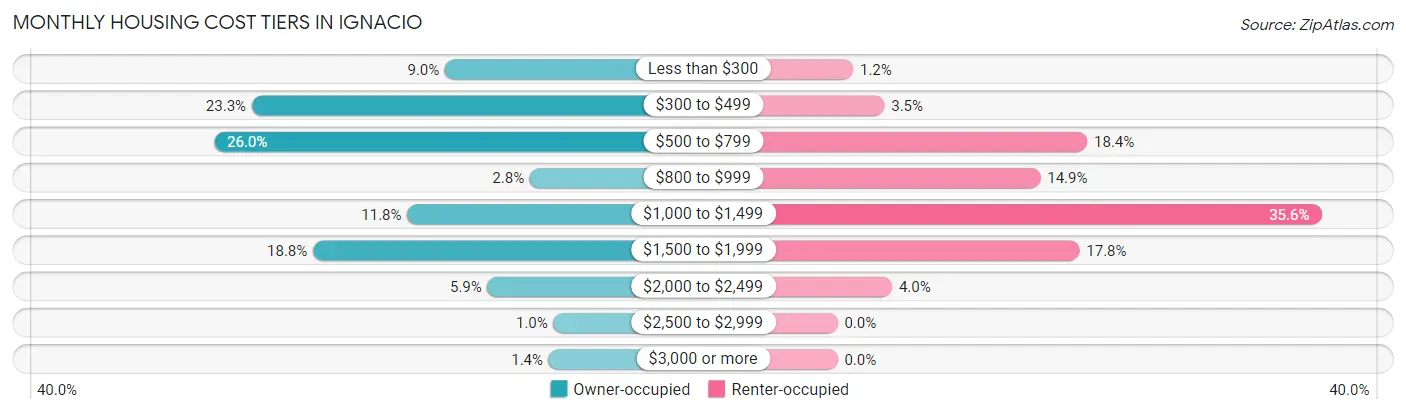
| Monthly Cost | Owner-occupied | Renter-occupied |
| Less than $300 | 26 (9.0%) | 2 (1.1%) |
| $300 to $499 | 67 (23.3%) | 6 (3.5%) |
| $500 to $799 | 75 (26.0%) | 32 (18.4%) |
| $800 to $999 | 8 (2.8%) | 26 (14.9%) |
| $1,000 to $1,499 | 34 (11.8%) | 62 (35.6%) |
| $1,500 to $1,999 | 54 (18.8%) | 31 (17.8%) |
| $2,000 to $2,499 | 17 (5.9%) | 7 (4.0%) |
| $2,500 to $2,999 | 3 (1.0%) | 0 (0.0%) |
| $3,000 or more | 4 (1.4%) | 0 (0.0%) |
| Total | 288 (100.0%) | 174 (100.0%) |
Physical Housing Characteristics in Ignacio
Housing Structures in Ignacio
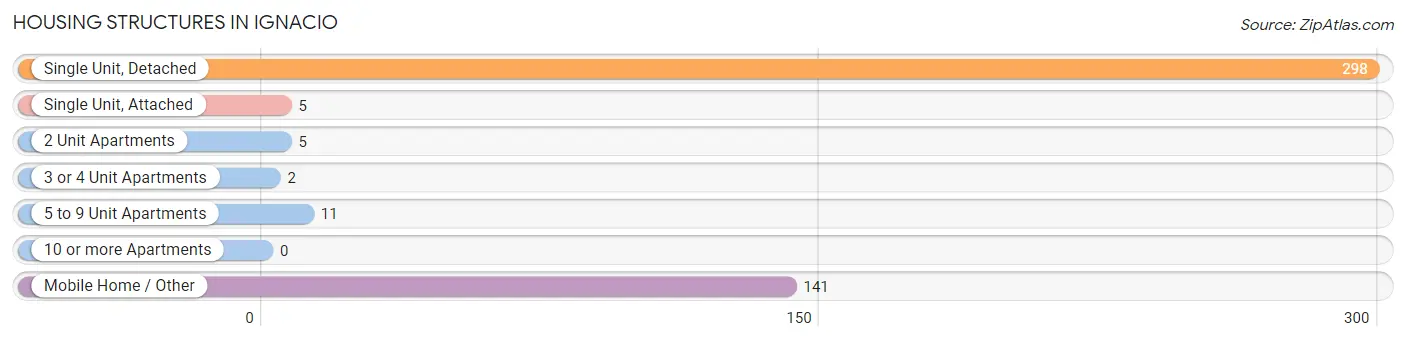
| Structure Type | # Housing Units | % Housing Units |
| Single Unit, Detached | 298 | 64.5% |
| Single Unit, Attached | 5 | 1.1% |
| 2 Unit Apartments | 5 | 1.1% |
| 3 or 4 Unit Apartments | 2 | 0.4% |
| 5 to 9 Unit Apartments | 11 | 2.4% |
| 10 or more Apartments | 0 | 0.0% |
| Mobile Home / Other | 141 | 30.5% |
| Total | 462 | 100.0% |
Housing Structures by Occupancy in Ignacio
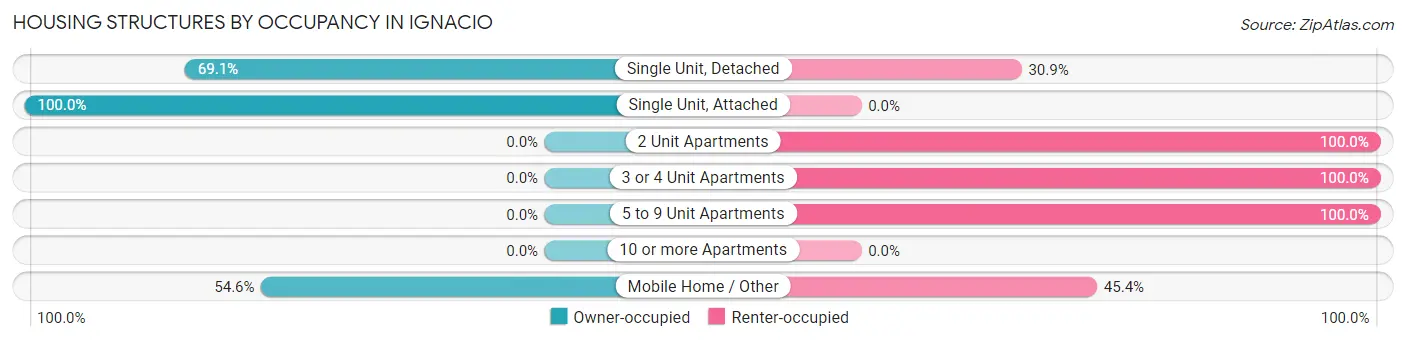
| Structure Type | Owner-occupied | Renter-occupied |
| Single Unit, Detached | 206 (69.1%) | 92 (30.9%) |
| Single Unit, Attached | 5 (100.0%) | 0 (0.0%) |
| 2 Unit Apartments | 0 (0.0%) | 5 (100.0%) |
| 3 or 4 Unit Apartments | 0 (0.0%) | 2 (100.0%) |
| 5 to 9 Unit Apartments | 0 (0.0%) | 11 (100.0%) |
| 10 or more Apartments | 0 (0.0%) | 0 (0.0%) |
| Mobile Home / Other | 77 (54.6%) | 64 (45.4%) |
| Total | 288 (62.3%) | 174 (37.7%) |
Housing Structures by Number of Rooms in Ignacio
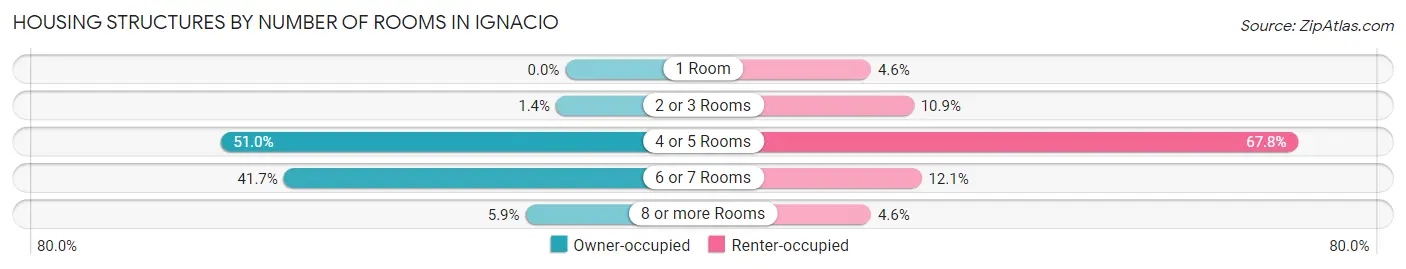
| Number of Rooms | Owner-occupied | Renter-occupied |
| 1 Room | 0 (0.0%) | 8 (4.6%) |
| 2 or 3 Rooms | 4 (1.4%) | 19 (10.9%) |
| 4 or 5 Rooms | 147 (51.0%) | 118 (67.8%) |
| 6 or 7 Rooms | 120 (41.7%) | 21 (12.1%) |
| 8 or more Rooms | 17 (5.9%) | 8 (4.6%) |
| Total | 288 (100.0%) | 174 (100.0%) |
Housing Structure by Heating Type in Ignacio
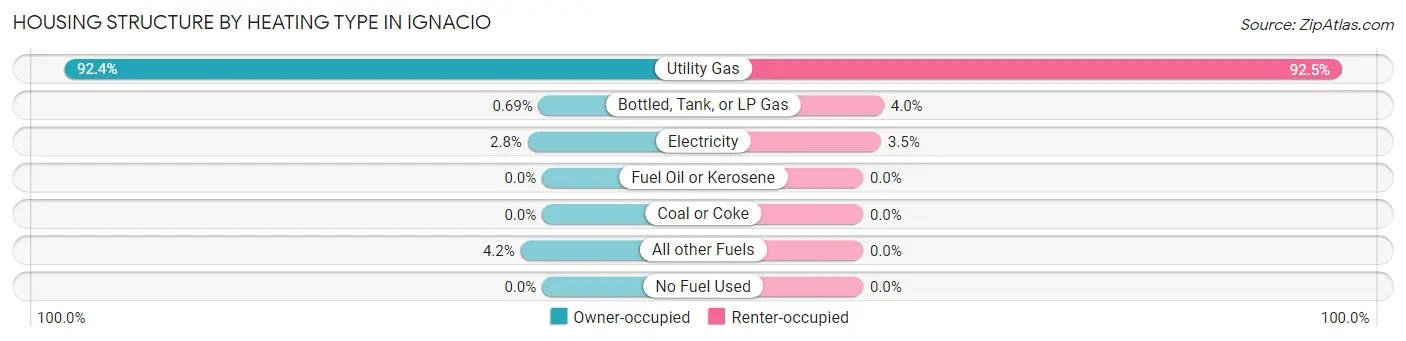
| Heating Type | Owner-occupied | Renter-occupied |
| Utility Gas | 266 (92.4%) | 161 (92.5%) |
| Bottled, Tank, or LP Gas | 2 (0.7%) | 7 (4.0%) |
| Electricity | 8 (2.8%) | 6 (3.5%) |
| Fuel Oil or Kerosene | 0 (0.0%) | 0 (0.0%) |
| Coal or Coke | 0 (0.0%) | 0 (0.0%) |
| All other Fuels | 12 (4.2%) | 0 (0.0%) |
| No Fuel Used | 0 (0.0%) | 0 (0.0%) |
| Total | 288 (100.0%) | 174 (100.0%) |
Household Vehicle Usage in Ignacio
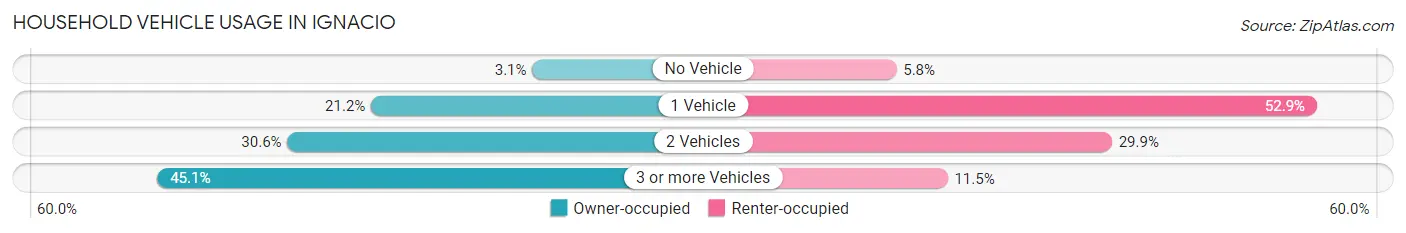
| Vehicles per Household | Owner-occupied | Renter-occupied |
| No Vehicle | 9 (3.1%) | 10 (5.8%) |
| 1 Vehicle | 61 (21.2%) | 92 (52.9%) |
| 2 Vehicles | 88 (30.6%) | 52 (29.9%) |
| 3 or more Vehicles | 130 (45.1%) | 20 (11.5%) |
| Total | 288 (100.0%) | 174 (100.0%) |
Real Estate & Mortgages in Ignacio
Real Estate and Mortgage Overview in Ignacio
| Characteristic | Without Mortgage | With Mortgage |
| Housing Units | 165 | 123 |
| Median Property Value | $260,700 | $234,800 |
| Median Household Income | $67,625 | $25 |
| Monthly Housing Costs | $473 | $4 |
| Real Estate Taxes | $413 | $8 |
Property Value by Mortgage Status in Ignacio
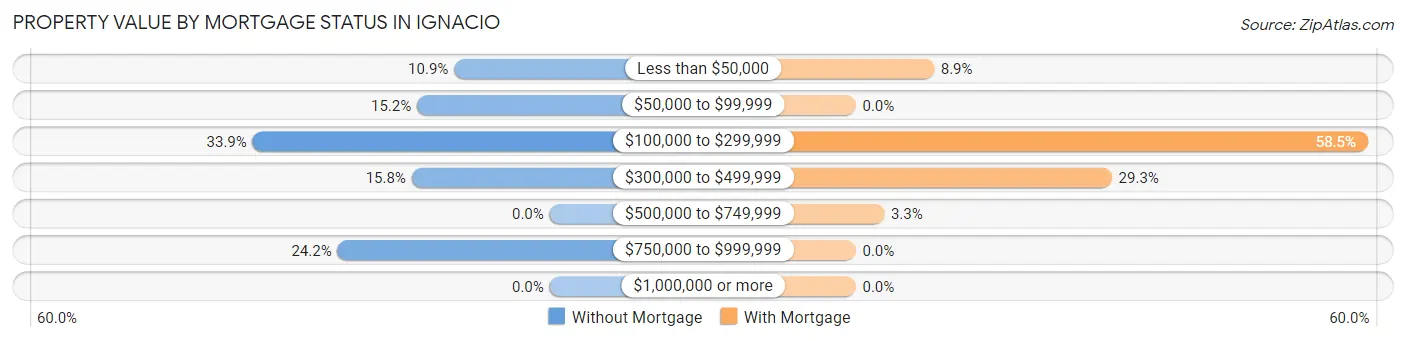
| Property Value | Without Mortgage | With Mortgage |
| Less than $50,000 | 18 (10.9%) | 11 (8.9%) |
| $50,000 to $99,999 | 25 (15.1%) | 0 (0.0%) |
| $100,000 to $299,999 | 56 (33.9%) | 72 (58.5%) |
| $300,000 to $499,999 | 26 (15.8%) | 36 (29.3%) |
| $500,000 to $749,999 | 0 (0.0%) | 4 (3.3%) |
| $750,000 to $999,999 | 40 (24.2%) | 0 (0.0%) |
| $1,000,000 or more | 0 (0.0%) | 0 (0.0%) |
| Total | 165 (100.0%) | 123 (100.0%) |
Household Income by Mortgage Status in Ignacio
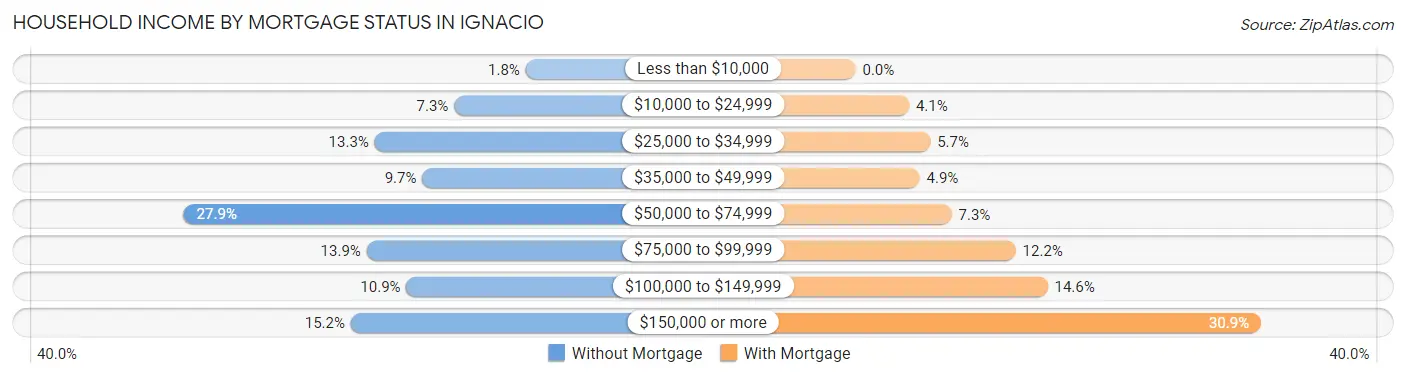
| Household Income | Without Mortgage | With Mortgage |
| Less than $10,000 | 3 (1.8%) | 0 (0.0%) |
| $10,000 to $24,999 | 12 (7.3%) | 5 (4.1%) |
| $25,000 to $34,999 | 22 (13.3%) | 7 (5.7%) |
| $35,000 to $49,999 | 16 (9.7%) | 6 (4.9%) |
| $50,000 to $74,999 | 46 (27.9%) | 9 (7.3%) |
| $75,000 to $99,999 | 23 (13.9%) | 15 (12.2%) |
| $100,000 to $149,999 | 18 (10.9%) | 18 (14.6%) |
| $150,000 or more | 25 (15.1%) | 38 (30.9%) |
| Total | 165 (100.0%) | 123 (100.0%) |
Property Value to Household Income Ratio in Ignacio
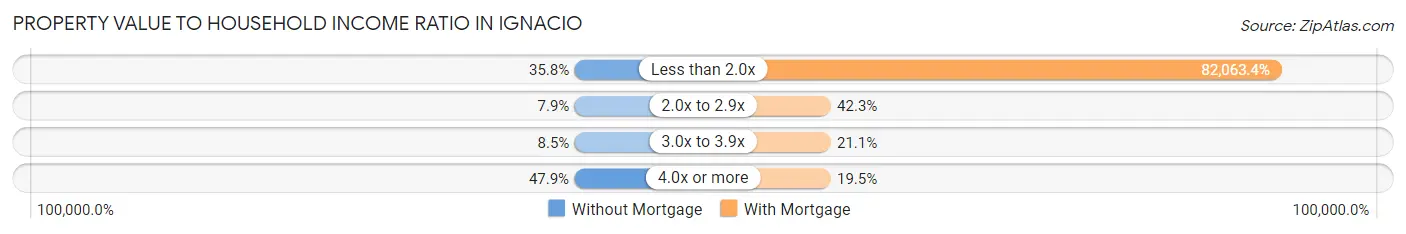
| Value-to-Income Ratio | Without Mortgage | With Mortgage |
| Less than 2.0x | 59 (35.8%) | 100,938 (82,063.4%) |
| 2.0x to 2.9x | 13 (7.9%) | 52 (42.3%) |
| 3.0x to 3.9x | 14 (8.5%) | 26 (21.1%) |
| 4.0x or more | 79 (47.9%) | 24 (19.5%) |
| Total | 165 (100.0%) | 123 (100.0%) |
Real Estate Taxes by Mortgage Status in Ignacio
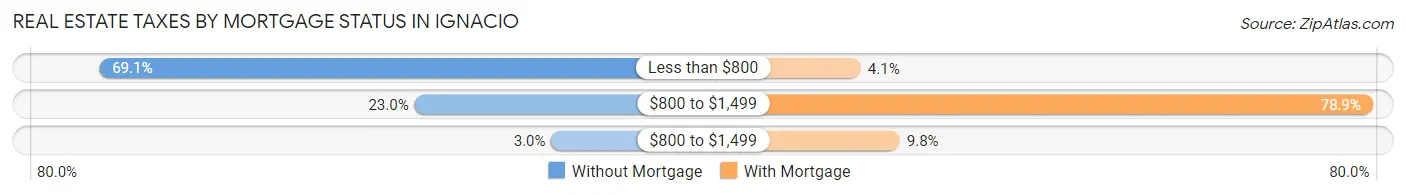
| Property Taxes | Without Mortgage | With Mortgage |
| Less than $800 | 114 (69.1%) | 5 (4.1%) |
| $800 to $1,499 | 38 (23.0%) | 97 (78.9%) |
| $800 to $1,499 | 5 (3.0%) | 12 (9.8%) |
| Total | 165 (100.0%) | 123 (100.0%) |
Health & Disability in Ignacio
Health Insurance Coverage by Age in Ignacio
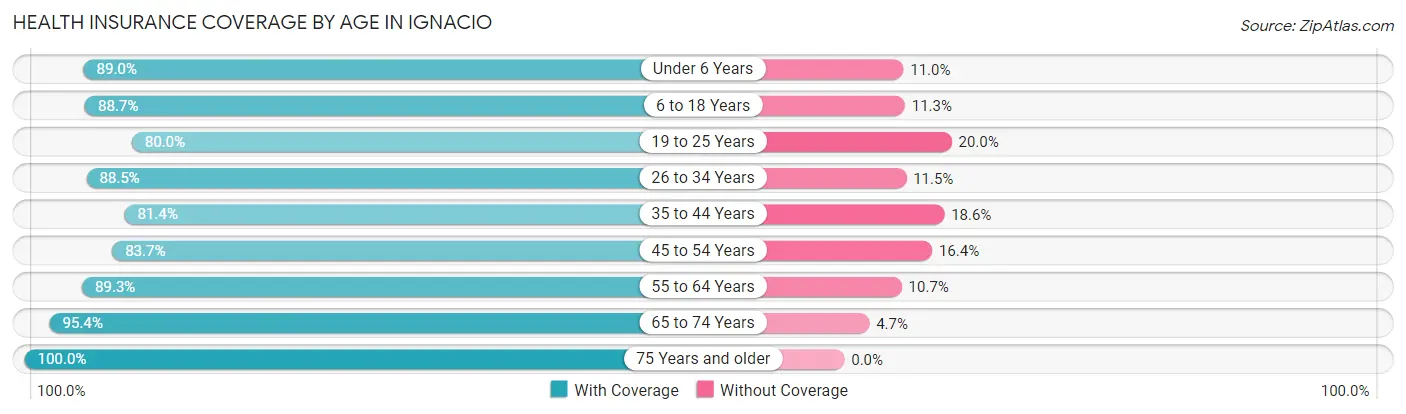
| Age Bracket | With Coverage | Without Coverage |
| Under 6 Years | 97 (89.0%) | 12 (11.0%) |
| 6 to 18 Years | 173 (88.7%) | 22 (11.3%) |
| 19 to 25 Years | 104 (80.0%) | 26 (20.0%) |
| 26 to 34 Years | 138 (88.5%) | 18 (11.5%) |
| 35 to 44 Years | 131 (81.4%) | 30 (18.6%) |
| 45 to 54 Years | 133 (83.7%) | 26 (16.4%) |
| 55 to 64 Years | 167 (89.3%) | 20 (10.7%) |
| 65 to 74 Years | 82 (95.4%) | 4 (4.6%) |
| 75 Years and older | 74 (100.0%) | 0 (0.0%) |
| Total | 1,099 (87.4%) | 158 (12.6%) |
Health Insurance Coverage by Citizenship Status in Ignacio
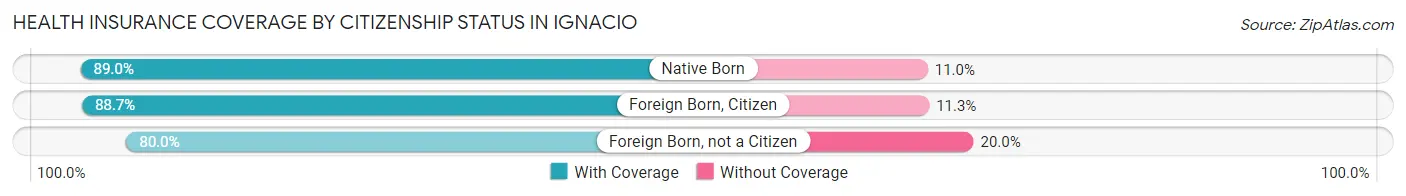
| Citizenship Status | With Coverage | Without Coverage |
| Native Born | 97 (89.0%) | 12 (11.0%) |
| Foreign Born, Citizen | 173 (88.7%) | 22 (11.3%) |
| Foreign Born, not a Citizen | 104 (80.0%) | 26 (20.0%) |
Health Insurance Coverage by Household Income in Ignacio
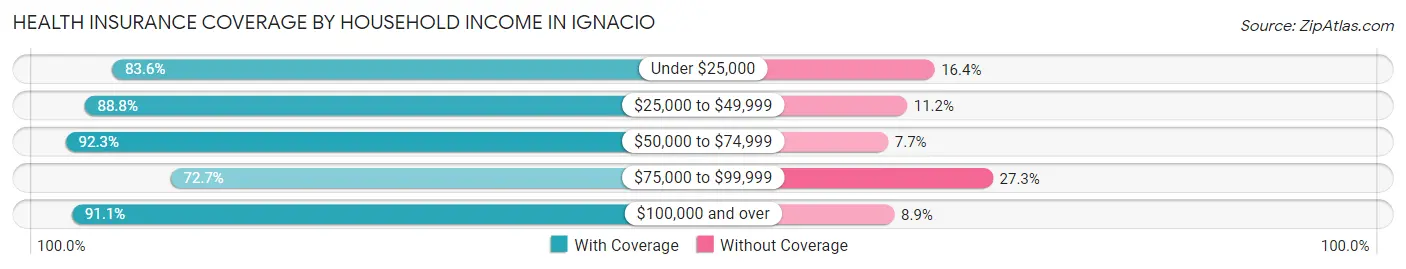
| Household Income | With Coverage | Without Coverage |
| Under $25,000 | 97 (83.6%) | 19 (16.4%) |
| $25,000 to $49,999 | 237 (88.8%) | 30 (11.2%) |
| $50,000 to $74,999 | 180 (92.3%) | 15 (7.7%) |
| $75,000 to $99,999 | 133 (72.7%) | 50 (27.3%) |
| $100,000 and over | 452 (91.1%) | 44 (8.9%) |
Public vs Private Health Insurance Coverage by Age in Ignacio
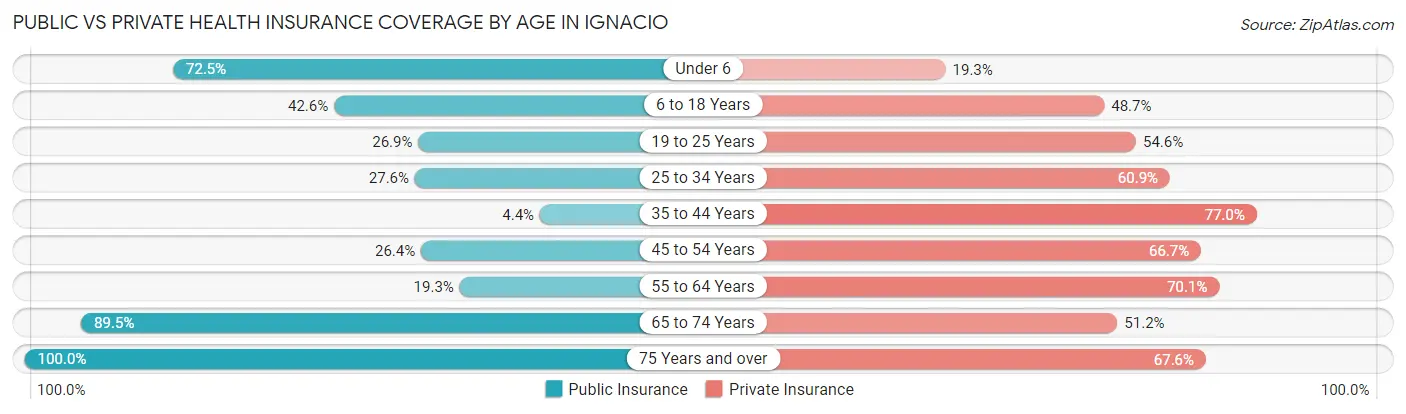
| Age Bracket | Public Insurance | Private Insurance |
| Under 6 | 79 (72.5%) | 21 (19.3%) |
| 6 to 18 Years | 83 (42.6%) | 95 (48.7%) |
| 19 to 25 Years | 35 (26.9%) | 71 (54.6%) |
| 25 to 34 Years | 43 (27.6%) | 95 (60.9%) |
| 35 to 44 Years | 7 (4.3%) | 124 (77.0%) |
| 45 to 54 Years | 42 (26.4%) | 106 (66.7%) |
| 55 to 64 Years | 36 (19.3%) | 131 (70.1%) |
| 65 to 74 Years | 77 (89.5%) | 44 (51.2%) |
| 75 Years and over | 74 (100.0%) | 50 (67.6%) |
| Total | 476 (37.9%) | 737 (58.6%) |
Disability Status by Sex by Age in Ignacio
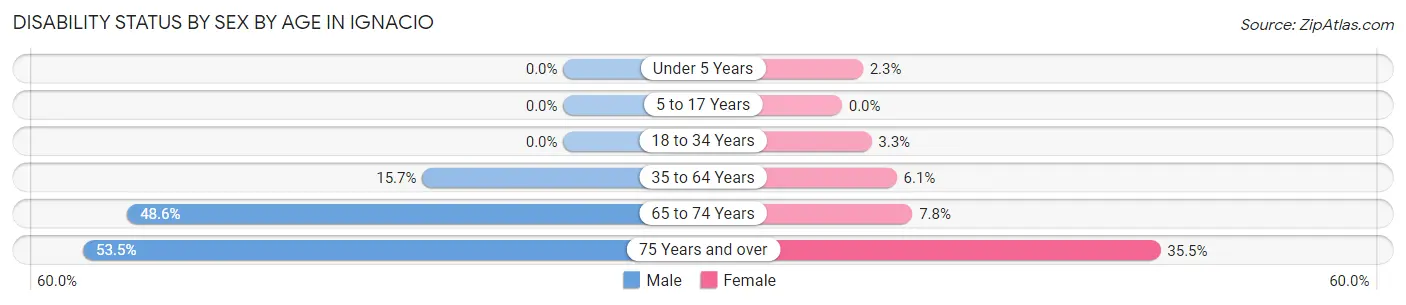
| Age Bracket | Male | Female |
| Under 5 Years | 0 (0.0%) | 1 (2.3%) |
| 5 to 17 Years | 0 (0.0%) | 0 (0.0%) |
| 18 to 34 Years | 0 (0.0%) | 5 (3.3%) |
| 35 to 64 Years | 41 (15.7%) | 15 (6.1%) |
| 65 to 74 Years | 17 (48.6%) | 4 (7.8%) |
| 75 Years and over | 23 (53.5%) | 11 (35.5%) |
Disability Class by Sex by Age in Ignacio
Disability Class: Hearing Difficulty
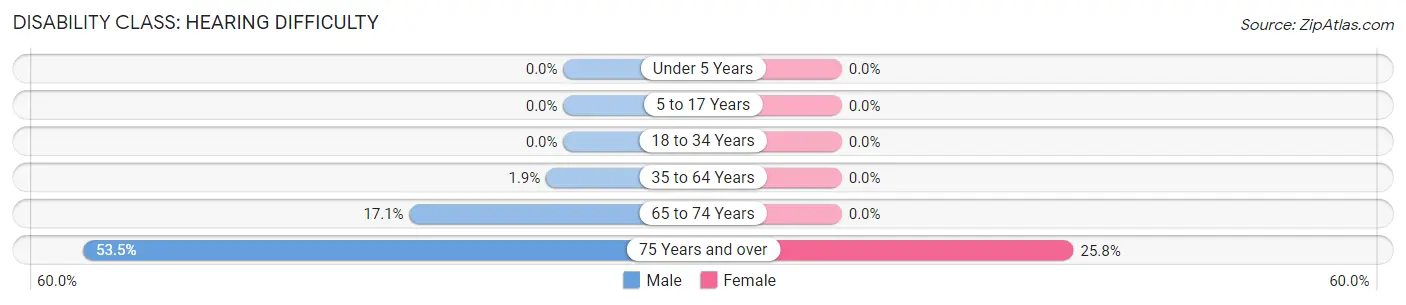
| Age Bracket | Male | Female |
| Under 5 Years | 0 (0.0%) | 0 (0.0%) |
| 5 to 17 Years | 0 (0.0%) | 0 (0.0%) |
| 18 to 34 Years | 0 (0.0%) | 0 (0.0%) |
| 35 to 64 Years | 5 (1.9%) | 0 (0.0%) |
| 65 to 74 Years | 6 (17.1%) | 0 (0.0%) |
| 75 Years and over | 23 (53.5%) | 8 (25.8%) |
Disability Class: Vision Difficulty
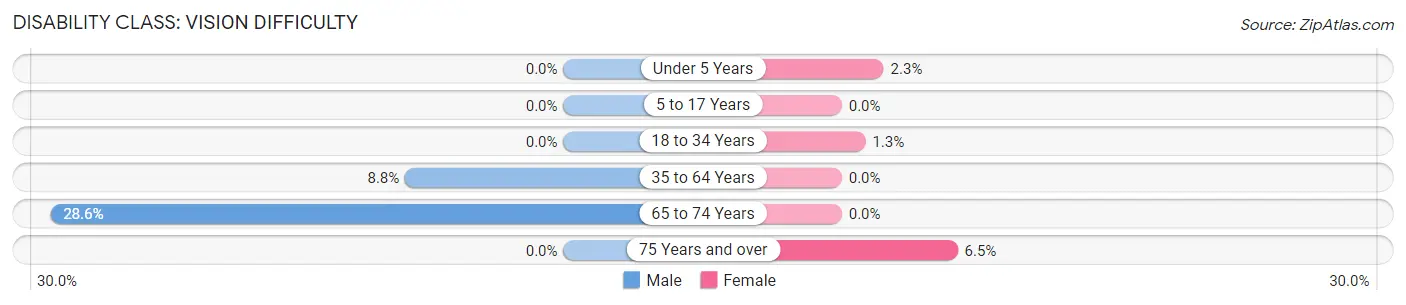
| Age Bracket | Male | Female |
| Under 5 Years | 0 (0.0%) | 1 (2.3%) |
| 5 to 17 Years | 0 (0.0%) | 0 (0.0%) |
| 18 to 34 Years | 0 (0.0%) | 2 (1.3%) |
| 35 to 64 Years | 23 (8.8%) | 0 (0.0%) |
| 65 to 74 Years | 10 (28.6%) | 0 (0.0%) |
| 75 Years and over | 0 (0.0%) | 2 (6.5%) |
Disability Class: Cognitive Difficulty
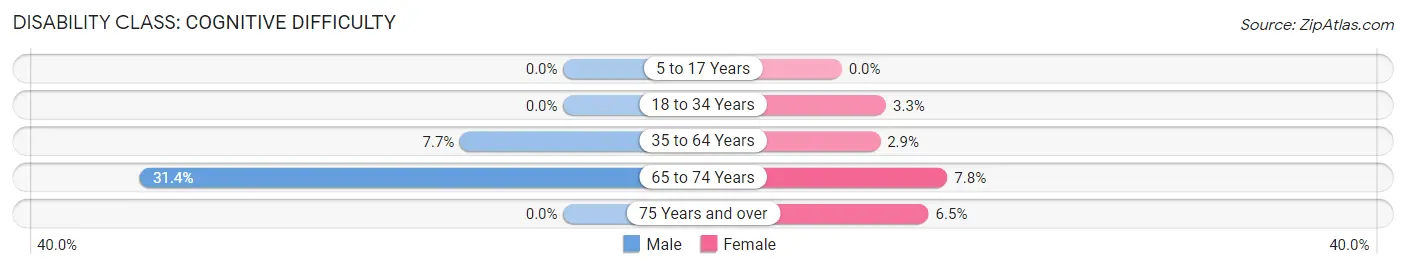
| Age Bracket | Male | Female |
| 5 to 17 Years | 0 (0.0%) | 0 (0.0%) |
| 18 to 34 Years | 0 (0.0%) | 5 (3.3%) |
| 35 to 64 Years | 20 (7.7%) | 7 (2.9%) |
| 65 to 74 Years | 11 (31.4%) | 4 (7.8%) |
| 75 Years and over | 0 (0.0%) | 2 (6.5%) |
Disability Class: Ambulatory Difficulty
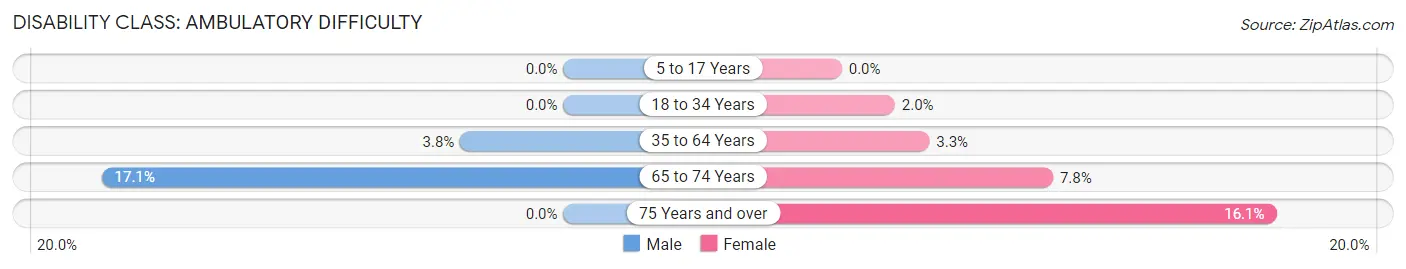
| Age Bracket | Male | Female |
| 5 to 17 Years | 0 (0.0%) | 0 (0.0%) |
| 18 to 34 Years | 0 (0.0%) | 3 (2.0%) |
| 35 to 64 Years | 10 (3.8%) | 8 (3.3%) |
| 65 to 74 Years | 6 (17.1%) | 4 (7.8%) |
| 75 Years and over | 0 (0.0%) | 5 (16.1%) |
Disability Class: Self-Care Difficulty
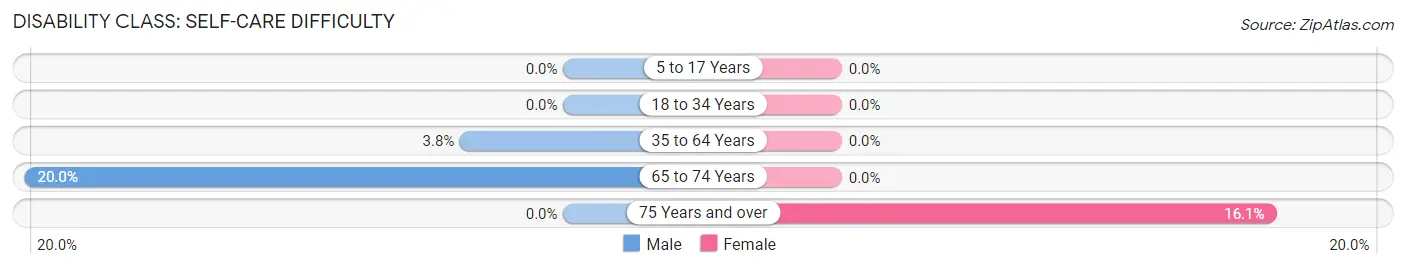
| Age Bracket | Male | Female |
| 5 to 17 Years | 0 (0.0%) | 0 (0.0%) |
| 18 to 34 Years | 0 (0.0%) | 0 (0.0%) |
| 35 to 64 Years | 10 (3.8%) | 0 (0.0%) |
| 65 to 74 Years | 7 (20.0%) | 0 (0.0%) |
| 75 Years and over | 0 (0.0%) | 5 (16.1%) |
Technology Access in Ignacio
Computing Device Access in Ignacio
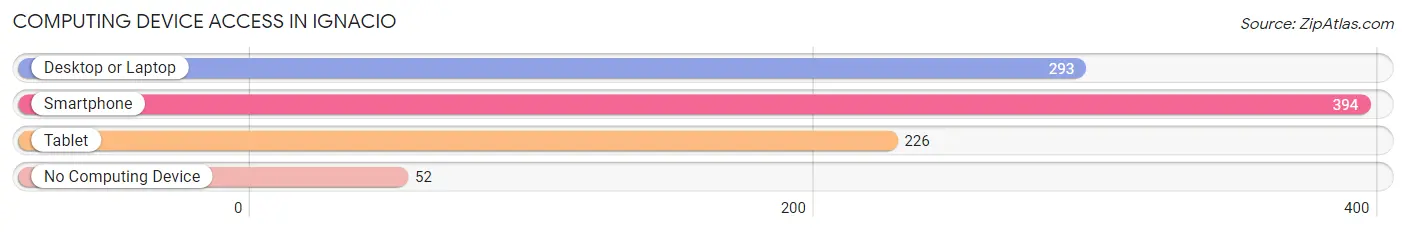
| Device Type | # Households | % Households |
| Desktop or Laptop | 293 | 63.4% |
| Smartphone | 394 | 85.3% |
| Tablet | 226 | 48.9% |
| No Computing Device | 52 | 11.3% |
| Total | 462 | 100.0% |
Internet Access in Ignacio
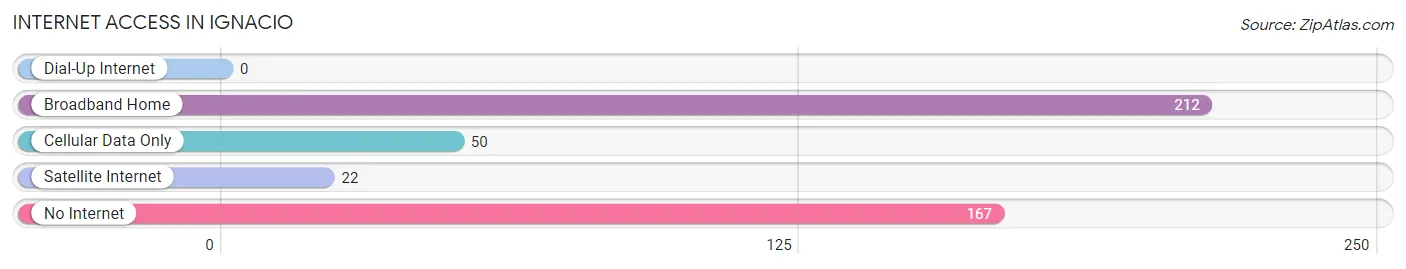
| Internet Type | # Households | % Households |
| Dial-Up Internet | 0 | 0.0% |
| Broadband Home | 212 | 45.9% |
| Cellular Data Only | 50 | 10.8% |
| Satellite Internet | 22 | 4.8% |
| No Internet | 167 | 36.1% |
| Total | 462 | 100.0% |
Ignacio Summary
Nestled in the San Juan Mountains of southwestern Colorado, the small town of Ignacio is a picturesque mountain community with a rich history and a bright future. Located in La Plata County, Ignacio is home to approximately 1,500 people and is the county seat. The town is situated at an elevation of 6,845 feet and is surrounded by the Southern Ute Indian Reservation.
History
The area that is now Ignacio was originally inhabited by the Ute Indians, who were the first to settle in the area. The Ute Indians were nomadic hunter-gatherers who lived in the area for centuries before the arrival of the Spanish in the late 1700s. The Spanish were the first Europeans to settle in the area, and they established a trading post in Ignacio in 1868. The town was officially founded in 1876 and was named after Ignacio Baca, a prominent local rancher.
In the late 1800s, Ignacio was a bustling mining town, with gold, silver, and copper being mined in the surrounding mountains. The town also had a thriving agricultural industry, with farmers growing potatoes, wheat, and other crops. The town was also home to a number of businesses, including a hotel, a bank, and a newspaper.
In the early 1900s, Ignacio began to decline as the mining industry declined and the population began to dwindle. The town was nearly abandoned by the 1950s, but in the 1960s, the town began to experience a resurgence. The Southern Ute Indian Tribe purchased land in the area and began to develop it, bringing new businesses and jobs to the area.
Geography
Ignacio is located in the San Juan Mountains of southwestern Colorado. The town is situated at an elevation of 6,845 feet and is surrounded by the Southern Ute Indian Reservation. The town is located near the Animas River, which flows through the area. The town is also located near the San Juan National Forest, which provides a variety of outdoor recreational opportunities.
The climate in Ignacio is semi-arid, with hot summers and cold winters. The average high temperature in the summer is around 85 degrees Fahrenheit, while the average low temperature in the winter is around 10 degrees Fahrenheit. The town receives an average of 16 inches of precipitation per year, with most of it falling in the form of snow.
Economy
The economy of Ignacio is largely based on tourism and agriculture. The town is home to a number of tourist attractions, including the Southern Ute Cultural Center and Museum, the Ignacio Community Library, and the Ignacio Golf Course. The town is also home to a number of agricultural businesses, including a potato farm, a dairy farm, and a winery.
The town is also home to a number of businesses, including restaurants, retail stores, and a variety of service-based businesses. The town is also home to a number of government offices, including the La Plata County Courthouse and the Southern Ute Indian Tribe offices.
Demographics
As of the 2010 census, the population of Ignacio was 1,541. The town is predominantly white, with approximately 85% of the population identifying as white. The town is also home to a large Native American population, with approximately 10% of the population identifying as Native American. The town is also home to a small Hispanic population, with approximately 5% of the population identifying as Hispanic.
The median household income in Ignacio is $37,500, and the median home value is $150,000. The town has a poverty rate of approximately 15%, which is slightly higher than the national average. The town also has a high unemployment rate, with approximately 10% of the population being unemployed.
Conclusion
Ignacio is a small mountain town with a rich history and a bright future. The town is home to a diverse population and a thriving economy. The town is also home to a variety of tourist attractions and outdoor recreational opportunities. Ignacio is a great place to live, work, and play, and it is sure to continue to grow and thrive in the years to come.
Common Questions
What is Per Capita Income in Ignacio?
Per Capita income in Ignacio is $32,521.
What is the Median Family Income in Ignacio?
Median Family Income in Ignacio is $82,813.
What is the Median Household income in Ignacio?
Median Household Income in Ignacio is $62,833.
What is Income or Wage Gap in Ignacio?
Income or Wage Gap in Ignacio is 16.9%.
Women in Ignacio earn 83.1 cents for every dollar earned by a man.
What is Inequality or Gini Index in Ignacio?
Inequality or Gini Index in Ignacio is 0.44.
What is the Total Population of Ignacio?
Total Population of Ignacio is 1,257.
What is the Total Male Population of Ignacio?
Total Male Population of Ignacio is 645.
What is the Total Female Population of Ignacio?
Total Female Population of Ignacio is 612.
What is the Ratio of Males per 100 Females in Ignacio?
There are 105.39 Males per 100 Females in Ignacio.
What is the Ratio of Females per 100 Males in Ignacio?
There are 94.88 Females per 100 Males in Ignacio.
What is the Median Population Age in Ignacio?
Median Population Age in Ignacio is 38.1 Years.
What is the Average Family Size in Ignacio
Average Family Size in Ignacio is 3.7 People.
What is the Average Household Size in Ignacio
Average Household Size in Ignacio is 2.7 People.
How Large is the Labor Force in Ignacio?
There are 666 People in the Labor Forcein in Ignacio.
What is the Percentage of People in the Labor Force in Ignacio?
67.9% of People are in the Labor Force in Ignacio.
What is the Unemployment Rate in Ignacio?
Unemployment Rate in Ignacio is 7.7%.