Haxtun, CO Map & Demographics
Haxtun Map
Haxtun Overview
$30,537
PER CAPITA INCOME
$82,917
AVG FAMILY INCOME
$50,500
AVG HOUSEHOLD INCOME
40.3%
WAGE / INCOME GAP [ % ]
59.7¢/ $1
WAGE / INCOME GAP [ $ ]
0.47
INEQUALITY / GINI INDEX
917
TOTAL POPULATION
379
MALE POPULATION
538
FEMALE POPULATION
70.45
MALES / 100 FEMALES
141.95
FEMALES / 100 MALES
46.7
MEDIAN AGE
3.1
AVG FAMILY SIZE
2.2
AVG HOUSEHOLD SIZE
447
LABOR FORCE [ PEOPLE ]
61.1%
PERCENT IN LABOR FORCE
4.9%
UNEMPLOYMENT RATE
Haxtun Zip Codes
Haxtun Area Codes
Income in Haxtun
Income Overview in Haxtun
Per Capita Income in Haxtun is $30,537, while median incomes of families and households are $82,917 and $50,500 respectively.
| Characteristic | Number | Measure |
| Per Capita Income | 917 | $30,537 |
| Median Family Income | 228 | $82,917 |
| Mean Family Income | 228 | $91,000 |
| Median Household Income | 410 | $50,500 |
| Mean Household Income | 410 | $68,813 |
| Income Deficit | 228 | $0 |
| Wage / Income Gap (%) | 917 | 40.31% |
| Wage / Income Gap ($) | 917 | 59.69¢ per $1 |
| Gini / Inequality Index | 917 | 0.47 |
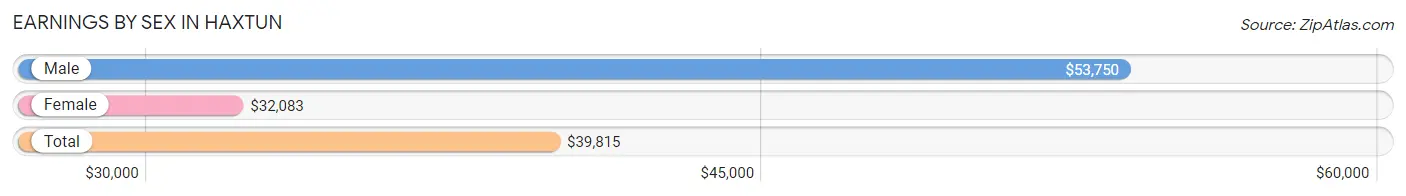
Earnings by Sex in Haxtun
Average Earnings in Haxtun are $39,815, $53,750 for men and $32,083 for women, a difference of 40.3%.
| Sex | Number | Average Earnings |
| Male | 222 (47.0%) | $53,750 |
| Female | 250 (53.0%) | $32,083 |
| Total | 472 (100.0%) | $39,815 |
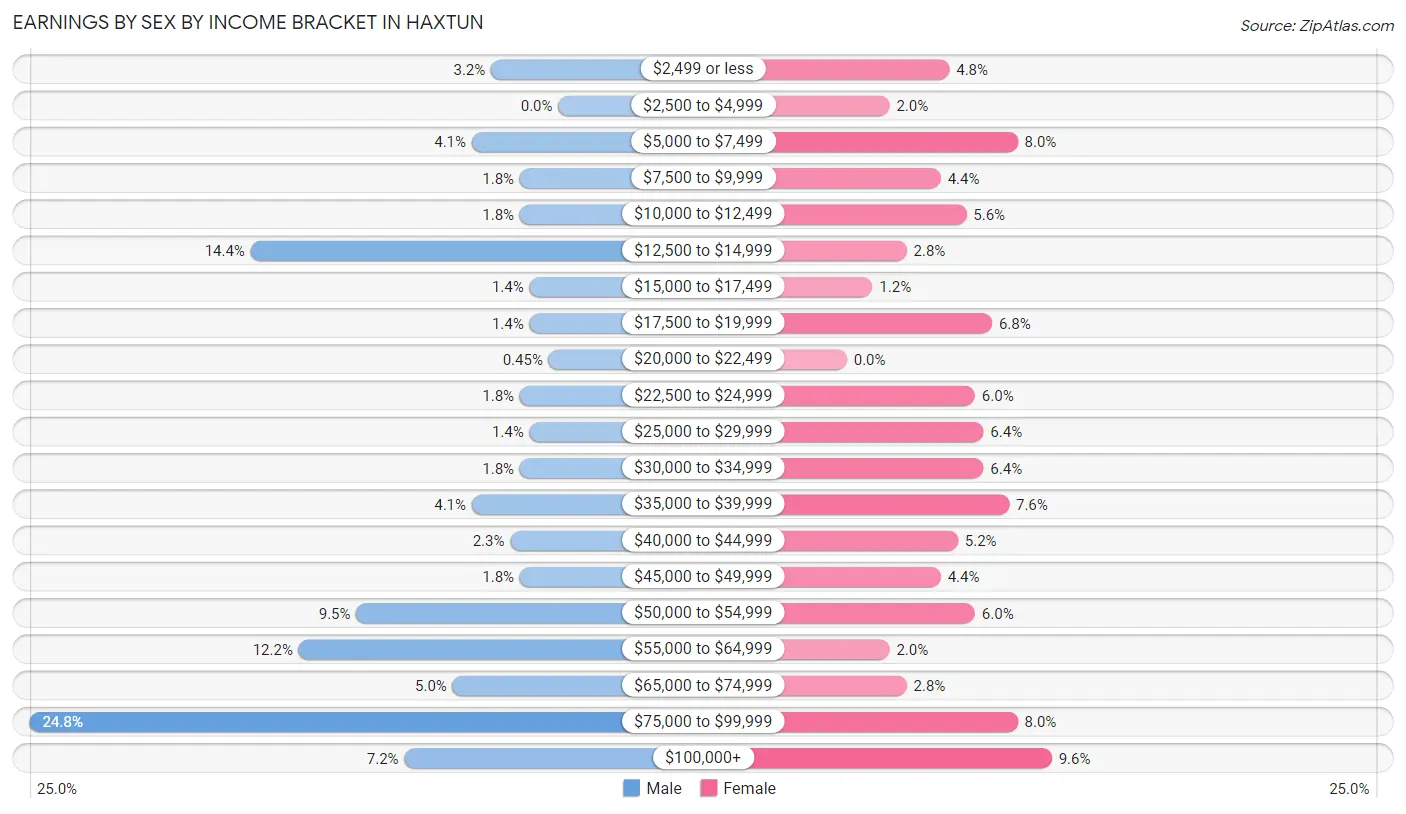
Earnings by Sex by Income Bracket in Haxtun
The most common earnings brackets in Haxtun are $75,000 to $99,999 for men (55 | 24.8%) and $100,000+ for women (24 | 9.6%).
| Income | Male | Female |
| $2,499 or less | 7 (3.2%) | 12 (4.8%) |
| $2,500 to $4,999 | 0 (0.0%) | 5 (2.0%) |
| $5,000 to $7,499 | 9 (4.1%) | 20 (8.0%) |
| $7,500 to $9,999 | 4 (1.8%) | 11 (4.4%) |
| $10,000 to $12,499 | 4 (1.8%) | 14 (5.6%) |
| $12,500 to $14,999 | 32 (14.4%) | 7 (2.8%) |
| $15,000 to $17,499 | 3 (1.3%) | 3 (1.2%) |
| $17,500 to $19,999 | 3 (1.3%) | 17 (6.8%) |
| $20,000 to $22,499 | 1 (0.4%) | 0 (0.0%) |
| $22,500 to $24,999 | 4 (1.8%) | 15 (6.0%) |
| $25,000 to $29,999 | 3 (1.3%) | 16 (6.4%) |
| $30,000 to $34,999 | 4 (1.8%) | 16 (6.4%) |
| $35,000 to $39,999 | 9 (4.1%) | 19 (7.6%) |
| $40,000 to $44,999 | 5 (2.2%) | 13 (5.2%) |
| $45,000 to $49,999 | 4 (1.8%) | 11 (4.4%) |
| $50,000 to $54,999 | 21 (9.5%) | 15 (6.0%) |
| $55,000 to $64,999 | 27 (12.2%) | 5 (2.0%) |
| $65,000 to $74,999 | 11 (5.0%) | 7 (2.8%) |
| $75,000 to $99,999 | 55 (24.8%) | 20 (8.0%) |
| $100,000+ | 16 (7.2%) | 24 (9.6%) |
| Total | 222 (100.0%) | 250 (100.0%) |
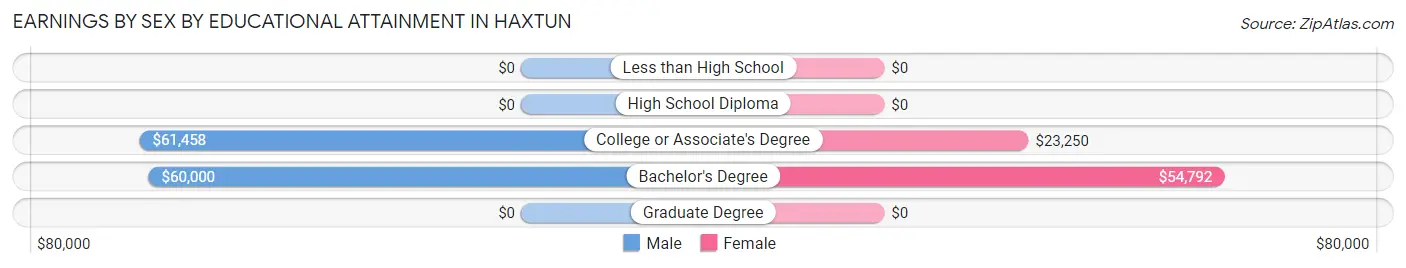
Earnings by Sex by Educational Attainment in Haxtun
Average earnings in Haxtun are $53,750 for men and $34,500 for women, a difference of 35.8%. Men with an educational attainment of college or associate's degree enjoy the highest average annual earnings of $61,458, while those with bachelor's degree education earn the least with $60,000. Women with an educational attainment of bachelor's degree earn the most with the average annual earnings of $54,792, while those with college or associate's degree education have the smallest earnings of $23,250.
| Educational Attainment | Male Income | Female Income |
| Less than High School | - | - |
| High School Diploma | - | - |
| College or Associate's Degree | $61,458 | $23,250 |
| Bachelor's Degree | $60,000 | $54,792 |
| Graduate Degree | - | - |
| Total | $53,750 | $34,500 |
Family Income in Haxtun
Family Income Brackets in Haxtun
According to the Haxtun family income data, there are 47 families falling into the $150,000 to $199,999 income range, which is the most common income bracket and makes up 20.6% of all families. Conversely, the $200,000+ income bracket is the least frequent group with only 1 families (0.4%) belonging to this category.
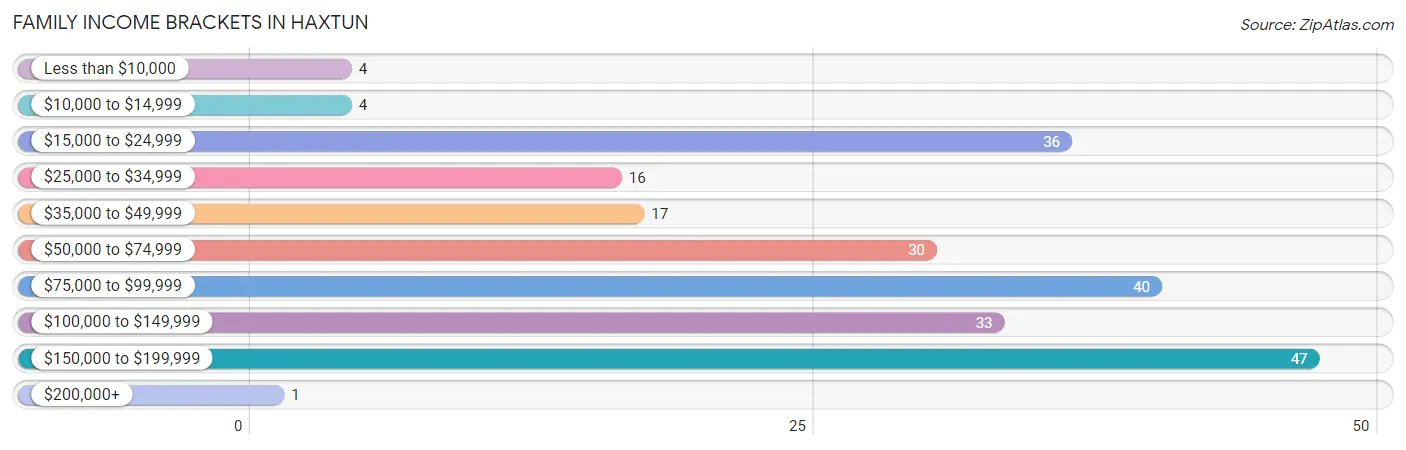
| Income Bracket | # Families | % Families |
| Less than $10,000 | 4 | 1.8% |
| $10,000 to $14,999 | 4 | 1.8% |
| $15,000 to $24,999 | 36 | 15.8% |
| $25,000 to $34,999 | 16 | 7.0% |
| $35,000 to $49,999 | 17 | 7.5% |
| $50,000 to $74,999 | 30 | 13.2% |
| $75,000 to $99,999 | 40 | 17.5% |
| $100,000 to $149,999 | 33 | 14.5% |
| $150,000 to $199,999 | 47 | 20.6% |
| $200,000+ | 1 | 0.4% |
Family Income by Famaliy Size in Haxtun
3-person families (54 | 23.7%) account for the highest median family income in Haxtun with $96,000 per family, while 2-person families (86 | 37.7%) have the highest median income of $38,125 per family member.
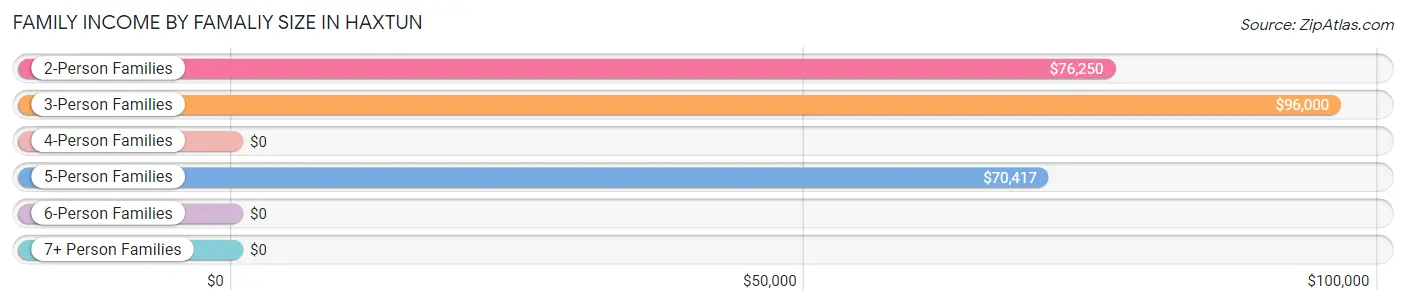
| Income Bracket | # Families | Median Income |
| 2-Person Families | 86 (37.7%) | $76,250 |
| 3-Person Families | 54 (23.7%) | $96,000 |
| 4-Person Families | 83 (36.4%) | $0 |
| 5-Person Families | 5 (2.2%) | $70,417 |
| 6-Person Families | 0 (0.0%) | $0 |
| 7+ Person Families | 0 (0.0%) | $0 |
| Total | 228 (100.0%) | $82,917 |
Family Income by Number of Earners in Haxtun
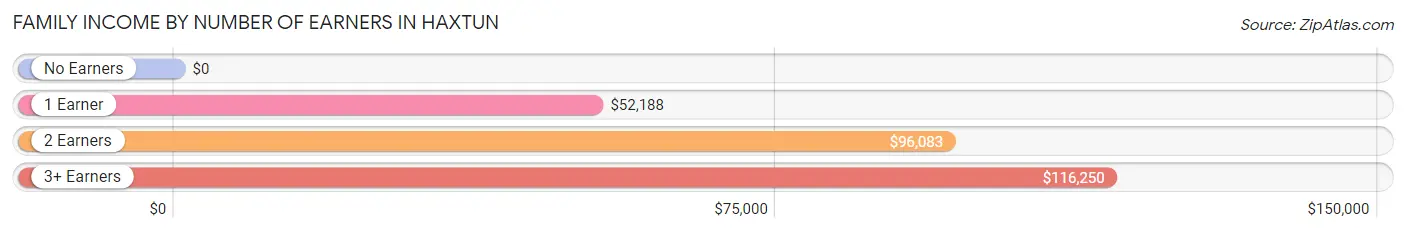
| Number of Earners | # Families | Median Income |
| No Earners | 15 (6.6%) | $0 |
| 1 Earner | 51 (22.4%) | $52,188 |
| 2 Earners | 153 (67.1%) | $96,083 |
| 3+ Earners | 9 (4.0%) | $116,250 |
| Total | 228 (100.0%) | $82,917 |
Household Income in Haxtun
Household Income Brackets in Haxtun
With 71 households falling in the category, the $50,000 to $74,999 income range is the most frequent in Haxtun, accounting for 17.3% of all households. In contrast, only 6 households (1.5%) fall into the $200,000+ income bracket, making it the least populous group.
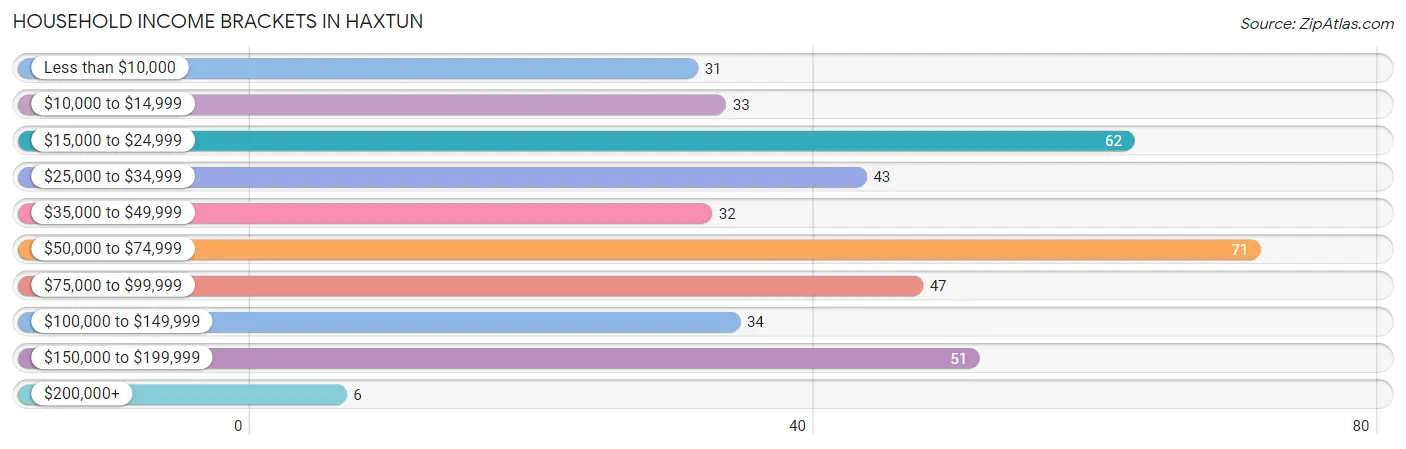
| Income Bracket | # Households | % Households |
| Less than $10,000 | 31 | 7.6% |
| $10,000 to $14,999 | 33 | 8.0% |
| $15,000 to $24,999 | 62 | 15.1% |
| $25,000 to $34,999 | 43 | 10.5% |
| $35,000 to $49,999 | 32 | 7.8% |
| $50,000 to $74,999 | 71 | 17.3% |
| $75,000 to $99,999 | 47 | 11.5% |
| $100,000 to $149,999 | 34 | 8.3% |
| $150,000 to $199,999 | 51 | 12.4% |
| $200,000+ | 6 | 1.5% |
Household Income by Householder Age in Haxtun
The median household income in Haxtun is $50,500, with the highest median household income of $50,313 found in the 45 to 64 years age bracket for the primary householder. A total of 181 households (44.2%) fall into this category.
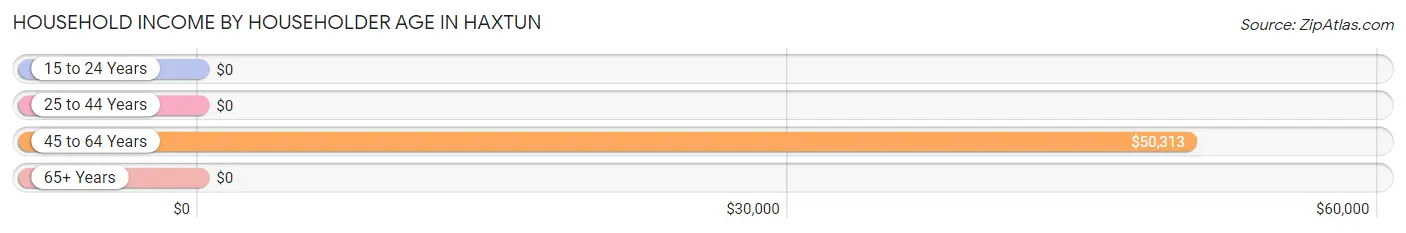
| Income Bracket | # Households | Median Income |
| 15 to 24 Years | 0 (0.0%) | $0 |
| 25 to 44 Years | 110 (26.8%) | $0 |
| 45 to 64 Years | 181 (44.2%) | $50,313 |
| 65+ Years | 119 (29.0%) | $0 |
| Total | 410 (100.0%) | $50,500 |
Poverty in Haxtun
Income Below Poverty by Sex and Age in Haxtun
With 23.9% poverty level for males and 31.2% for females among the residents of Haxtun, 18 to 24 year old males and 18 to 24 year old females are the most vulnerable to poverty, with 9 males (60.0%) and 19 females (54.3%) in their respective age groups living below the poverty level.
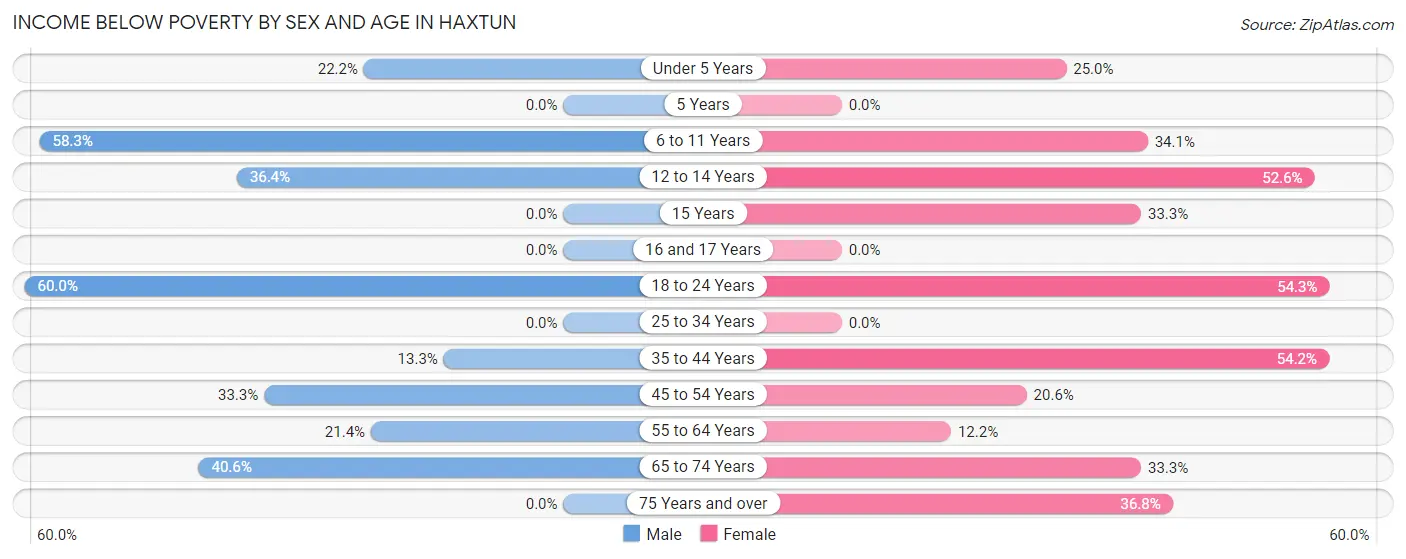
| Age Bracket | Male | Female |
| Under 5 Years | 2 (22.2%) | 4 (25.0%) |
| 5 Years | 0 (0.0%) | 0 (0.0%) |
| 6 to 11 Years | 14 (58.3%) | 31 (34.1%) |
| 12 to 14 Years | 4 (36.4%) | 10 (52.6%) |
| 15 Years | 0 (0.0%) | 5 (33.3%) |
| 16 and 17 Years | 0 (0.0%) | 0 (0.0%) |
| 18 to 24 Years | 9 (60.0%) | 19 (54.3%) |
| 25 to 34 Years | 0 (0.0%) | 0 (0.0%) |
| 35 to 44 Years | 8 (13.3%) | 32 (54.2%) |
| 45 to 54 Years | 24 (33.3%) | 14 (20.6%) |
| 55 to 64 Years | 15 (21.4%) | 9 (12.2%) |
| 65 to 74 Years | 13 (40.6%) | 15 (33.3%) |
| 75 Years and over | 0 (0.0%) | 21 (36.8%) |
| Total | 89 (23.9%) | 160 (31.2%) |
Income Above Poverty by Sex and Age in Haxtun
According to the poverty statistics in Haxtun, males aged 15 years and females aged 16 and 17 years are the age groups that are most secure financially, with 100.0% of males and 100.0% of females in these age groups living above the poverty line.
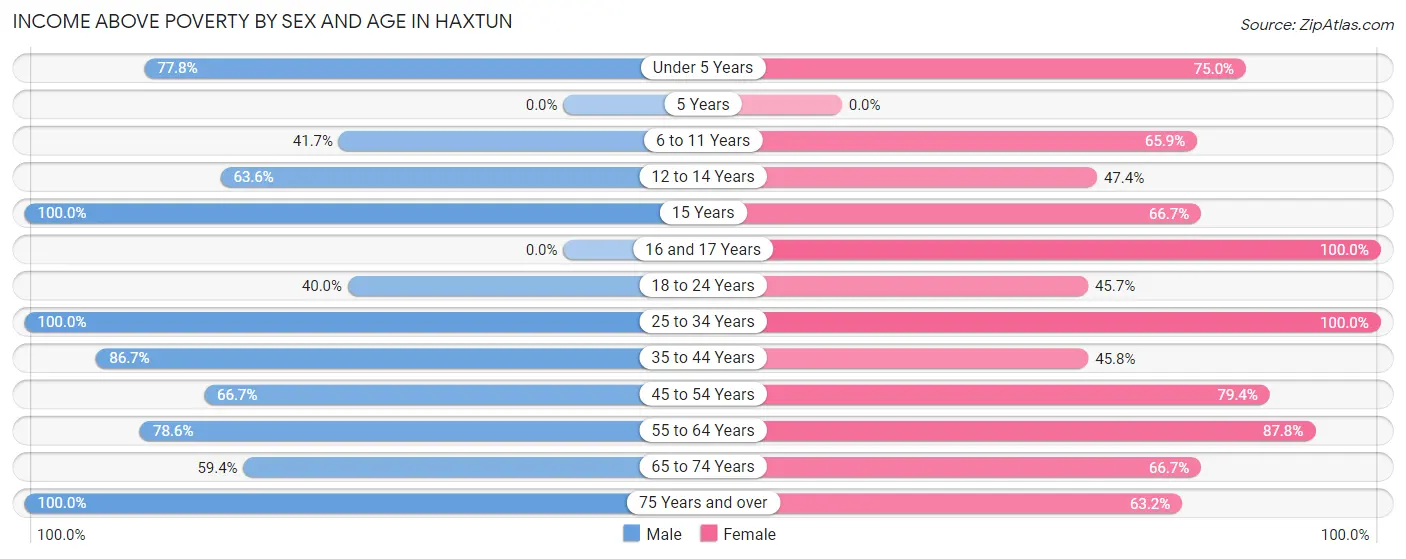
| Age Bracket | Male | Female |
| Under 5 Years | 7 (77.8%) | 12 (75.0%) |
| 5 Years | 0 (0.0%) | 0 (0.0%) |
| 6 to 11 Years | 10 (41.7%) | 60 (65.9%) |
| 12 to 14 Years | 7 (63.6%) | 9 (47.4%) |
| 15 Years | 1 (100.0%) | 10 (66.7%) |
| 16 and 17 Years | 0 (0.0%) | 2 (100.0%) |
| 18 to 24 Years | 6 (40.0%) | 16 (45.7%) |
| 25 to 34 Years | 36 (100.0%) | 32 (100.0%) |
| 35 to 44 Years | 52 (86.7%) | 27 (45.8%) |
| 45 to 54 Years | 48 (66.7%) | 54 (79.4%) |
| 55 to 64 Years | 55 (78.6%) | 65 (87.8%) |
| 65 to 74 Years | 19 (59.4%) | 30 (66.7%) |
| 75 Years and over | 43 (100.0%) | 36 (63.2%) |
| Total | 284 (76.1%) | 353 (68.8%) |
Income Below Poverty Among Married-Couple Families in Haxtun
The poverty statistics for married-couple families in Haxtun show that 18.6% or 37 of the total 199 families live below the poverty line. Families with 1 or 2 children have the highest poverty rate of 40.5%, comprising of 36 families. On the other hand, families with no children have the lowest poverty rate of 0.0%, which includes 0 families.
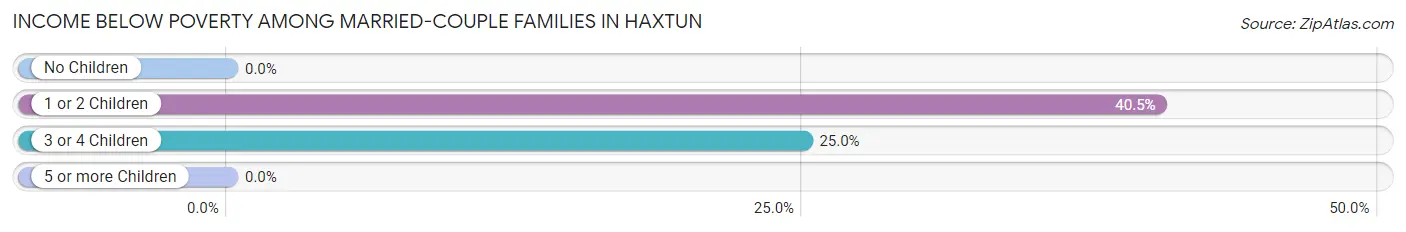
| Children | Above Poverty | Below Poverty |
| No Children | 106 (100.0%) | 0 (0.0%) |
| 1 or 2 Children | 53 (59.6%) | 36 (40.5%) |
| 3 or 4 Children | 3 (75.0%) | 1 (25.0%) |
| 5 or more Children | 0 (0.0%) | 0 (0.0%) |
| Total | 162 (81.4%) | 37 (18.6%) |
Income Below Poverty Among Single-Parent Households in Haxtun
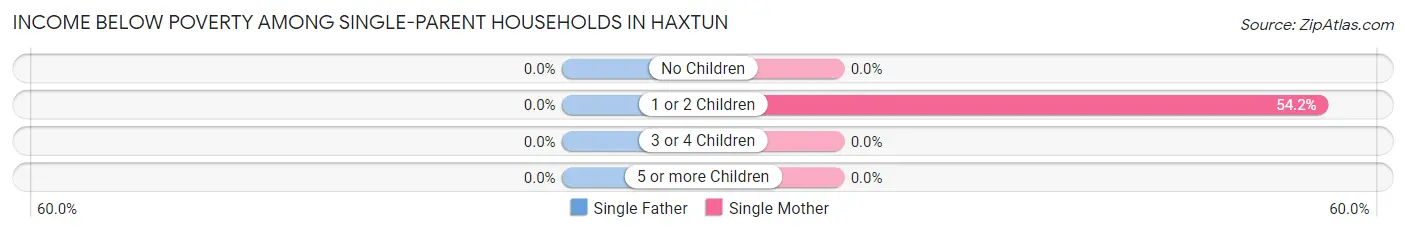
| Children | Single Father | Single Mother |
| No Children | 0 (0.0%) | 0 (0.0%) |
| 1 or 2 Children | 0 (0.0%) | 13 (54.2%) |
| 3 or 4 Children | 0 (0.0%) | 0 (0.0%) |
| 5 or more Children | 0 (0.0%) | 0 (0.0%) |
| Total | 0 (0.0%) | 13 (46.4%) |
Income Below Poverty Among Married-Couple vs Single-Parent Households in Haxtun
The poverty data for Haxtun shows that 37 of the married-couple family households (18.6%) and 13 of the single-parent households (44.8%) are living below the poverty level. Within the married-couple family households, those with 1 or 2 children have the highest poverty rate, with 36 households (40.5%) falling below the poverty line. Among the single-parent households, those with 1 or 2 children have the highest poverty rate, with 13 household (52.0%) living below poverty.
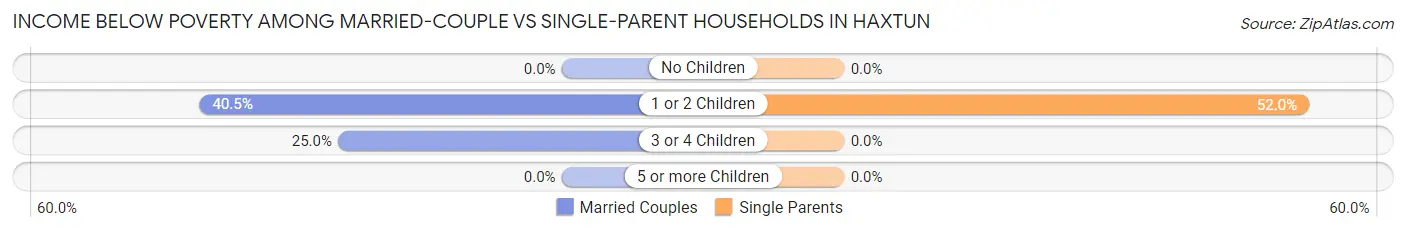
| Children | Married-Couple Families | Single-Parent Households |
| No Children | 0 (0.0%) | 0 (0.0%) |
| 1 or 2 Children | 36 (40.5%) | 13 (52.0%) |
| 3 or 4 Children | 1 (25.0%) | 0 (0.0%) |
| 5 or more Children | 0 (0.0%) | 0 (0.0%) |
| Total | 37 (18.6%) | 13 (44.8%) |
Race in Haxtun
The most populous races in Haxtun are White / Caucasian (813 | 88.7%), Hispanic or Latino (110 | 12.0%), and Two or more Races (99 | 10.8%).
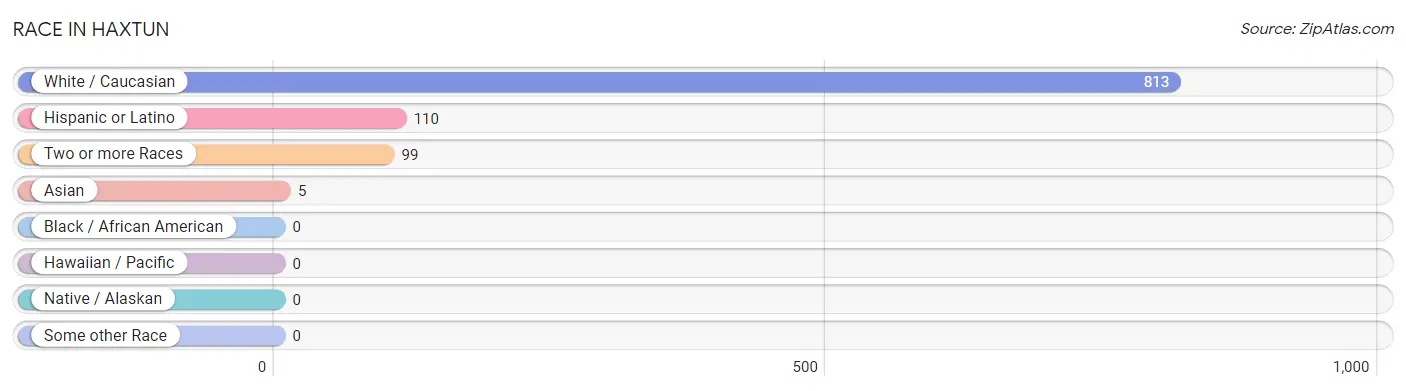
| Race | # Population | % Population |
| Asian | 5 | 0.5% |
| Black / African American | 0 | 0.0% |
| Hawaiian / Pacific | 0 | 0.0% |
| Hispanic or Latino | 110 | 12.0% |
| Native / Alaskan | 0 | 0.0% |
| White / Caucasian | 813 | 88.7% |
| Two or more Races | 99 | 10.8% |
| Some other Race | 0 | 0.0% |
| Total | 917 | 100.0% |
Ancestry in Haxtun
The most populous ancestries reported in Haxtun are German (248 | 27.0%), Irish (93 | 10.1%), Mexican (81 | 8.8%), English (44 | 4.8%), and Dutch (27 | 2.9%), together accounting for 53.7% of all Haxtun residents.
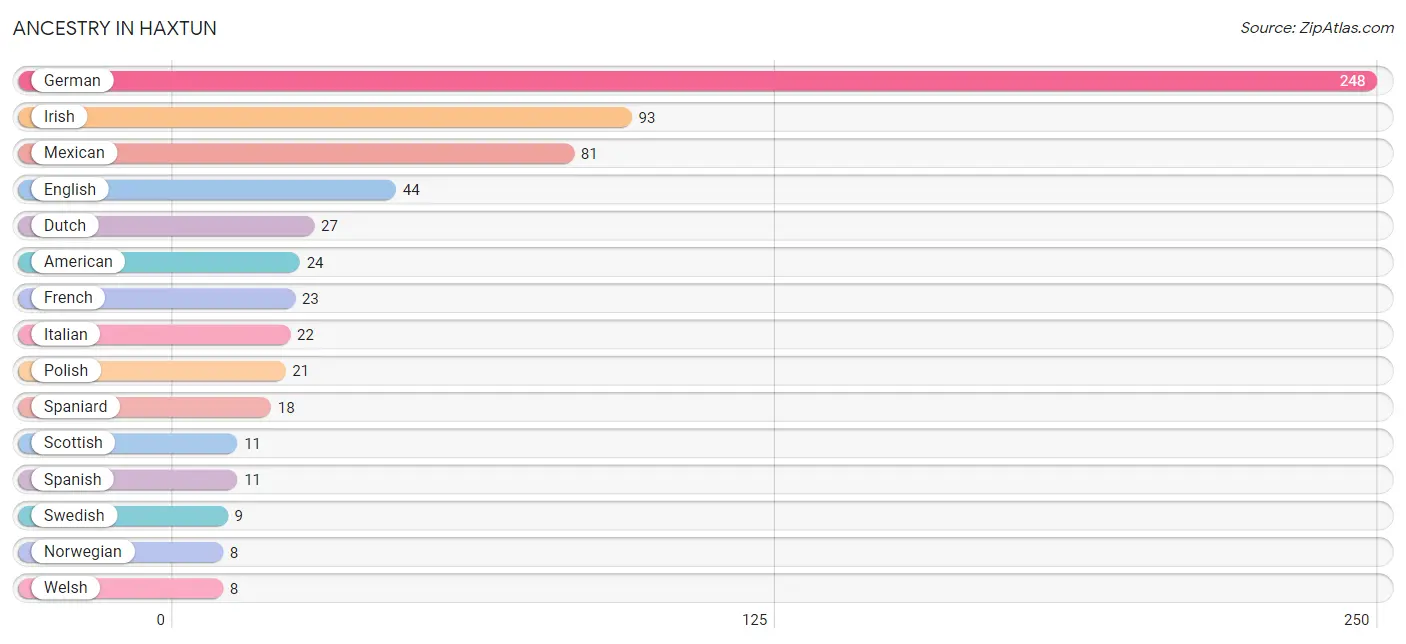
| Ancestry | # Population | % Population |
| American | 24 | 2.6% |
| Czech | 2 | 0.2% |
| Danish | 4 | 0.4% |
| Dutch | 27 | 2.9% |
| English | 44 | 4.8% |
| European | 6 | 0.6% |
| French | 23 | 2.5% |
| German | 248 | 27.0% |
| Irish | 93 | 10.1% |
| Italian | 22 | 2.4% |
| Korean | 5 | 0.5% |
| Mexican | 81 | 8.8% |
| Native Hawaiian | 7 | 0.8% |
| Norwegian | 8 | 0.9% |
| Polish | 21 | 2.3% |
| Scotch-Irish | 1 | 0.1% |
| Scottish | 11 | 1.2% |
| Spaniard | 18 | 2.0% |
| Spanish | 11 | 1.2% |
| Swedish | 9 | 1.0% |
| Welsh | 8 | 0.9% | View All 21 Rows |
Immigrants in Haxtun
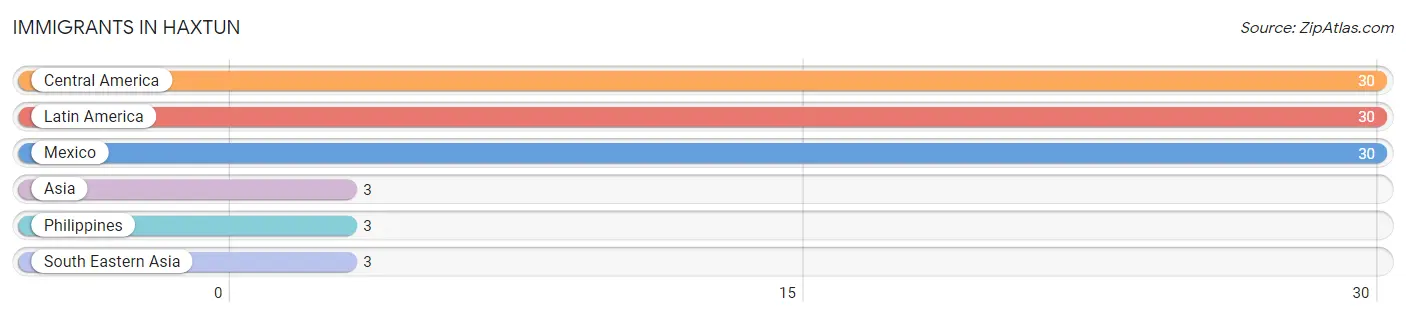
The most numerous immigrant groups reported in Haxtun came from Central America (30 | 3.3%), Latin America (30 | 3.3%), Mexico (30 | 3.3%), Asia (3 | 0.3%), and Philippines (3 | 0.3%), together accounting for 10.5% of all Haxtun residents.
| Immigration Origin | # Population | % Population |
| Asia | 3 | 0.3% |
| Central America | 30 | 3.3% |
| Latin America | 30 | 3.3% |
| Mexico | 30 | 3.3% |
| Philippines | 3 | 0.3% |
| South Eastern Asia | 3 | 0.3% | View All 6 Rows |
Sex and Age in Haxtun
Sex and Age in Haxtun
The most populous age groups in Haxtun are 50 to 54 Years (39 | 10.3%) for men and 10 to 14 Years (56 | 10.4%) for women.
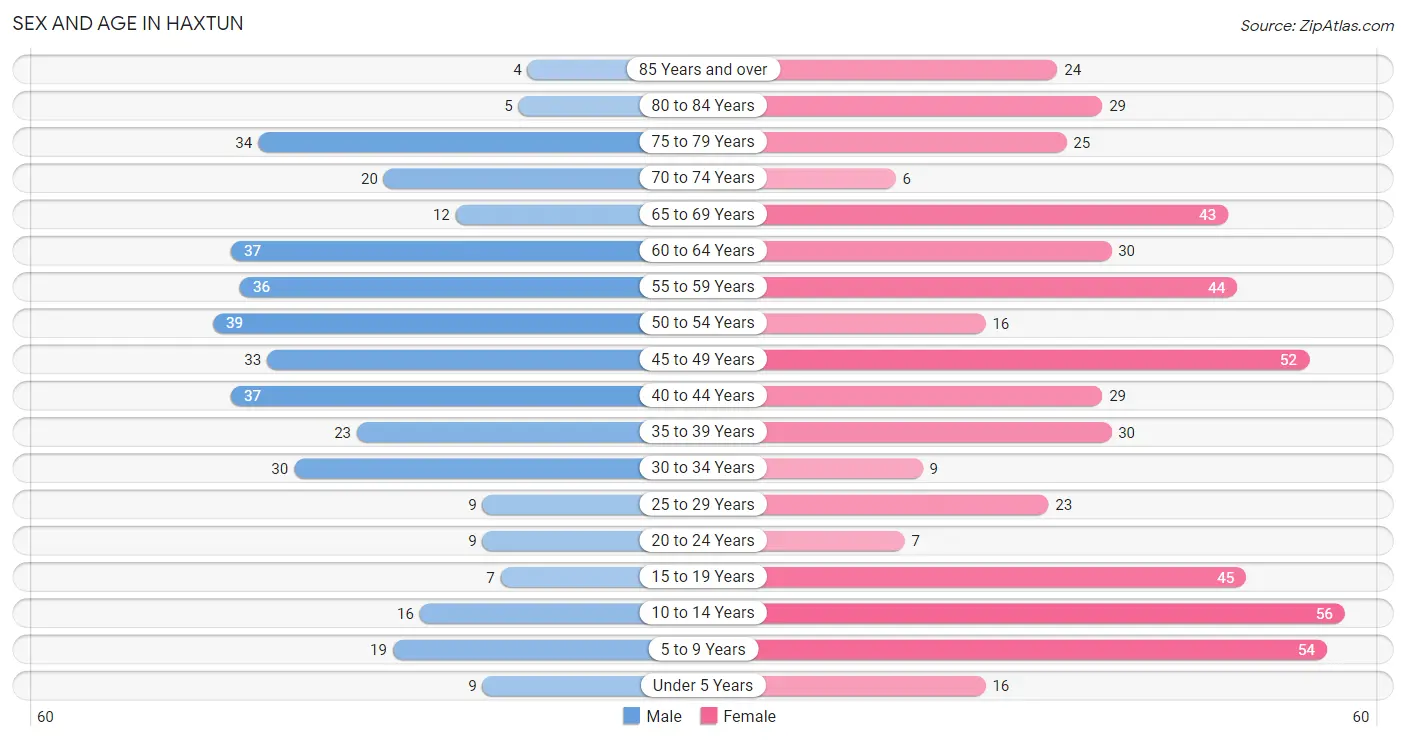
| Age Bracket | Male | Female |
| Under 5 Years | 9 (2.4%) | 16 (3.0%) |
| 5 to 9 Years | 19 (5.0%) | 54 (10.0%) |
| 10 to 14 Years | 16 (4.2%) | 56 (10.4%) |
| 15 to 19 Years | 7 (1.8%) | 45 (8.4%) |
| 20 to 24 Years | 9 (2.4%) | 7 (1.3%) |
| 25 to 29 Years | 9 (2.4%) | 23 (4.3%) |
| 30 to 34 Years | 30 (7.9%) | 9 (1.7%) |
| 35 to 39 Years | 23 (6.1%) | 30 (5.6%) |
| 40 to 44 Years | 37 (9.8%) | 29 (5.4%) |
| 45 to 49 Years | 33 (8.7%) | 52 (9.7%) |
| 50 to 54 Years | 39 (10.3%) | 16 (3.0%) |
| 55 to 59 Years | 36 (9.5%) | 44 (8.2%) |
| 60 to 64 Years | 37 (9.8%) | 30 (5.6%) |
| 65 to 69 Years | 12 (3.2%) | 43 (8.0%) |
| 70 to 74 Years | 20 (5.3%) | 6 (1.1%) |
| 75 to 79 Years | 34 (9.0%) | 25 (4.6%) |
| 80 to 84 Years | 5 (1.3%) | 29 (5.4%) |
| 85 Years and over | 4 (1.1%) | 24 (4.5%) |
| Total | 379 (100.0%) | 538 (100.0%) |
Families and Households in Haxtun
Median Family Size in Haxtun
The median family size in Haxtun is 3.06 persons per family, with single male/father families (1 | 0.4%) accounting for the largest median family size of 5 persons per family. On the other hand, single female/mother families (28 | 12.3%) represent the smallest median family size with 3.00 persons per family.
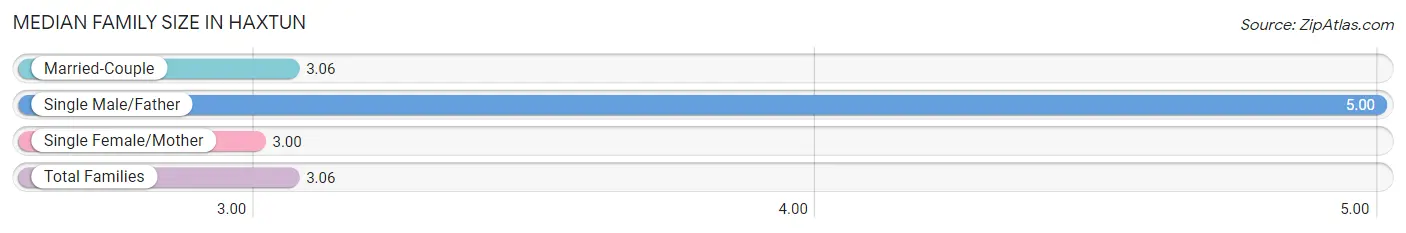
| Family Type | # Families | Family Size |
| Married-Couple | 199 (87.3%) | 3.06 |
| Single Male/Father | 1 (0.4%) | 5.00 |
| Single Female/Mother | 28 (12.3%) | 3.00 |
| Total Families | 228 (100.0%) | 3.06 |
Median Household Size in Haxtun
The median household size in Haxtun is 2.16 persons per household, with single male/father households (1 | 0.2%) accounting for the largest median household size of 5 persons per household. non-family households (182 | 44.4%) represent the smallest median household size with 1.04 persons per household.
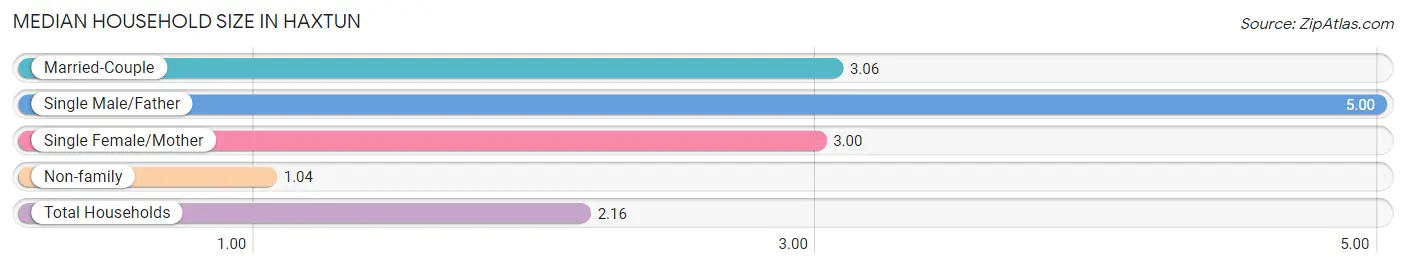
| Household Type | # Households | Household Size |
| Married-Couple | 199 (48.5%) | 3.06 |
| Single Male/Father | 1 (0.2%) | 5.00 |
| Single Female/Mother | 28 (6.8%) | 3.00 |
| Non-family | 182 (44.4%) | 1.04 |
| Total Households | 410 (100.0%) | 2.16 |
Household Size by Marriage Status in Haxtun
Out of a total of 410 households in Haxtun, 228 (55.6%) are family households, while 182 (44.4%) are nonfamily households. The most numerous type of family households are 2-person households, comprising 86, and the most common type of nonfamily households are 1-person households, comprising 174.
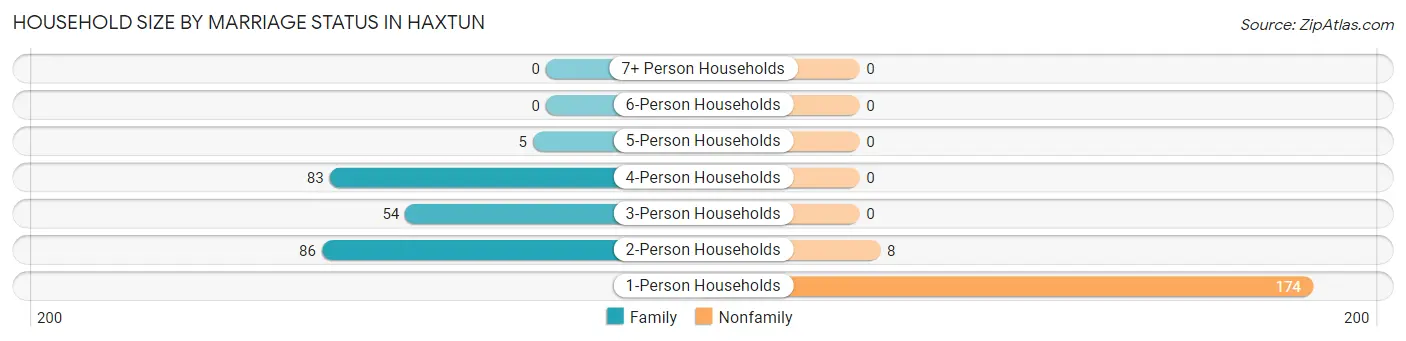
| Household Size | Family Households | Nonfamily Households |
| 1-Person Households | - | 174 (42.4%) |
| 2-Person Households | 86 (21.0%) | 8 (1.9%) |
| 3-Person Households | 54 (13.2%) | 0 (0.0%) |
| 4-Person Households | 83 (20.2%) | 0 (0.0%) |
| 5-Person Households | 5 (1.2%) | 0 (0.0%) |
| 6-Person Households | 0 (0.0%) | 0 (0.0%) |
| 7+ Person Households | 0 (0.0%) | 0 (0.0%) |
| Total | 228 (55.6%) | 182 (44.4%) |
Female Fertility in Haxtun
Fertility by Age in Haxtun
| Age Bracket | Women with Births | Births / 1,000 Women |
| 15 to 19 years | 0 (0.0%) | 0.0 |
| 20 to 34 years | 0 (0.0%) | 0.0 |
| 35 to 50 years | 0 (0.0%) | 0.0 |
| Total | 0 (0.0%) | 0.0 |
Fertility by Age by Marriage Status in Haxtun
| Age Bracket | Married | Unmarried |
| 15 to 19 years | 0 (0.0%) | 0 (0.0%) |
| 20 to 34 years | 0 (0.0%) | 0 (0.0%) |
| 35 to 50 years | 0 (0.0%) | 0 (0.0%) |
| Total | 0 (0.0%) | 0 (0.0%) |
Fertility by Education in Haxtun
| Educational Attainment | Women with Births | Births / 1,000 Women |
| Less than High School | 0 (0.0%) | 0.0 |
| High School Diploma | 0 (0.0%) | 0.0 |
| College or Associate's Degree | 0 (0.0%) | 0.0 |
| Bachelor's Degree | 0 (0.0%) | 0.0 |
| Graduate Degree | 0 (0.0%) | 0.0 |
| Total | 0 (0.0%) | 0.0 |
Fertility by Education by Marriage Status in Haxtun
| Educational Attainment | Married | Unmarried |
| Less than High School | 0 (0.0%) | 0 (0.0%) |
| High School Diploma | 0 (0.0%) | 0 (0.0%) |
| College or Associate's Degree | 0 (0.0%) | 0 (0.0%) |
| Bachelor's Degree | 0 (0.0%) | 0 (0.0%) |
| Graduate Degree | 0 (0.0%) | 0 (0.0%) |
| Total | 0 (0.0%) | 0 (0.0%) |
Employment Characteristics in Haxtun
Employment by Class of Employer in Haxtun
Among the 410 employed individuals in Haxtun, private company employees (239 | 58.3%), self-employed (not incorporated) (76 | 18.5%), and local government employees (60 | 14.6%) make up the most common classes of employment.
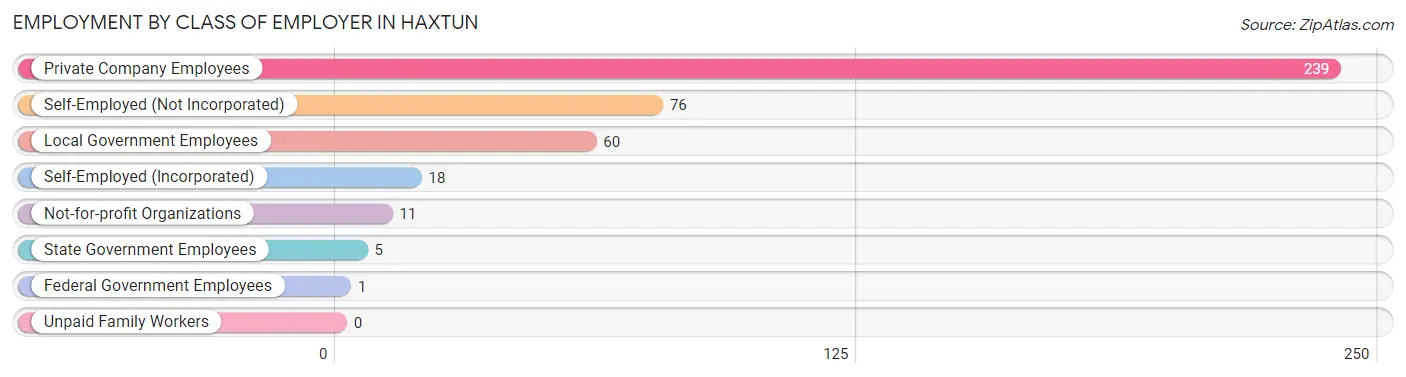
| Employer Class | # Employees | % Employees |
| Private Company Employees | 239 | 58.3% |
| Self-Employed (Incorporated) | 18 | 4.4% |
| Self-Employed (Not Incorporated) | 76 | 18.5% |
| Not-for-profit Organizations | 11 | 2.7% |
| Local Government Employees | 60 | 14.6% |
| State Government Employees | 5 | 1.2% |
| Federal Government Employees | 1 | 0.2% |
| Unpaid Family Workers | 0 | 0.0% |
| Total | 410 | 100.0% |
Employment Status by Age in Haxtun
According to the labor force statistics for Haxtun, out of the total population over 16 years of age (731), 61.1% or 447 individuals are in the labor force, with 4.9% or 22 of them unemployed. The age group with the highest labor force participation rate is 25 to 29 years, with 100.0% or 32 individuals in the labor force. Within the labor force, the 16 to 19 years age range has the highest percentage of unemployed individuals, with 60.0% or 6 of them being unemployed.
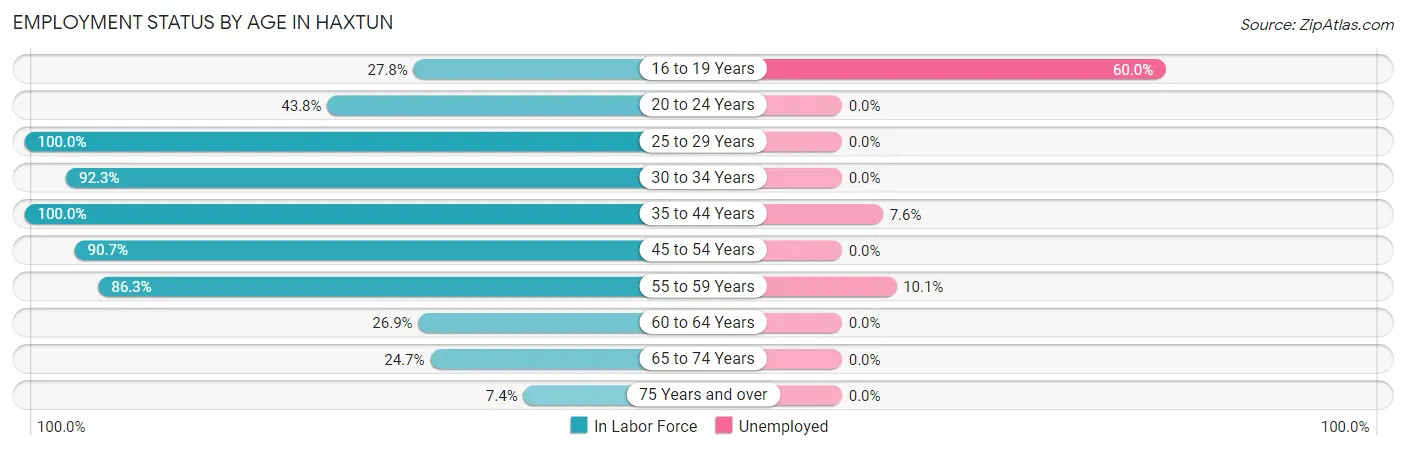
| Age Bracket | In Labor Force | Unemployed |
| 16 to 19 Years | 10 (27.8%) | 6 (60.0%) |
| 20 to 24 Years | 7 (43.8%) | 0 (0.0%) |
| 25 to 29 Years | 32 (100.0%) | 0 (0.0%) |
| 30 to 34 Years | 36 (92.3%) | 0 (0.0%) |
| 35 to 44 Years | 119 (100.0%) | 9 (7.6%) |
| 45 to 54 Years | 127 (90.7%) | 0 (0.0%) |
| 55 to 59 Years | 69 (86.3%) | 7 (10.1%) |
| 60 to 64 Years | 18 (26.9%) | 0 (0.0%) |
| 65 to 74 Years | 20 (24.7%) | 0 (0.0%) |
| 75 Years and over | 9 (7.4%) | 0 (0.0%) |
| Total | 447 (61.1%) | 22 (4.9%) |
Employment Status by Educational Attainment in Haxtun
According to labor force statistics for Haxtun, 84.1% of individuals (401) out of the total population between 25 and 64 years of age (477) are in the labor force, with 4.0% or 16 of them being unemployed. The group with the highest labor force participation rate are those with the educational attainment of less than high school, with 100.0% or 15 individuals in the labor force. Within the labor force, individuals with college / associate degree education have the highest percentage of unemployment, with 9.4% or 16 of them being unemployed.
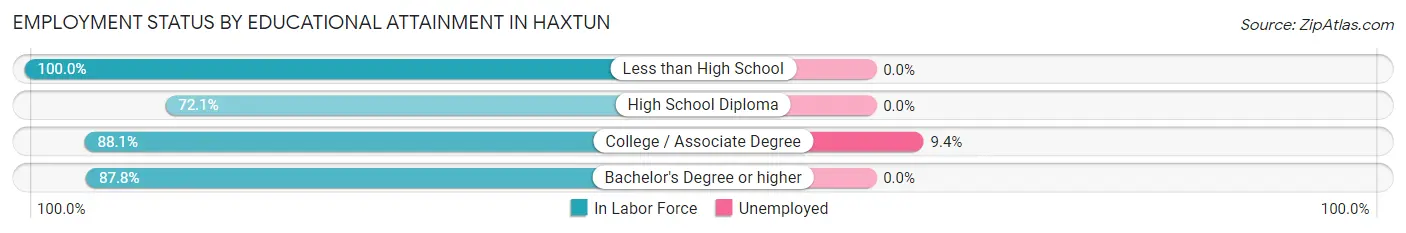
| Educational Attainment | In Labor Force | Unemployed |
| Less than High School | 15 (100.0%) | 0 (0.0%) |
| High School Diploma | 93 (72.1%) | 0 (0.0%) |
| College / Associate Degree | 171 (88.1%) | 18 (9.4%) |
| Bachelor's Degree or higher | 122 (87.8%) | 0 (0.0%) |
| Total | 401 (84.1%) | 19 (4.0%) |
Employment Occupations by Sex in Haxtun
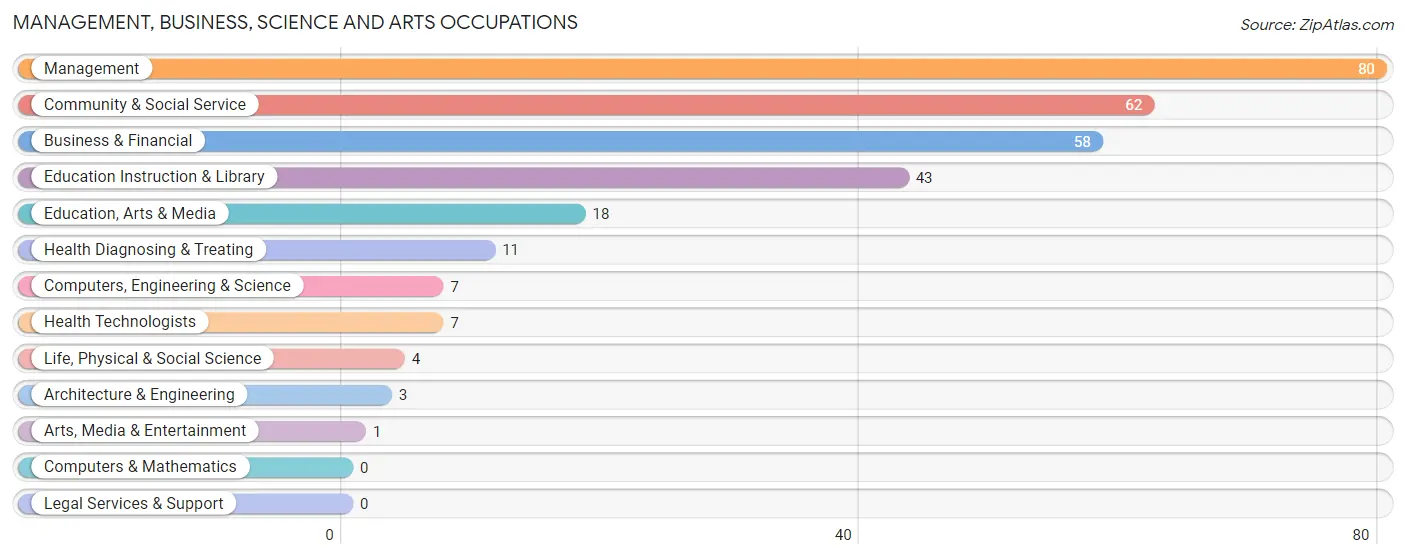
Management, Business, Science and Arts Occupations
The most common Management, Business, Science and Arts occupations in Haxtun are Management (80 | 18.8%), Community & Social Service (62 | 14.6%), Business & Financial (58 | 13.7%), Education Instruction & Library (43 | 10.1%), and Education, Arts & Media (18 | 4.2%).
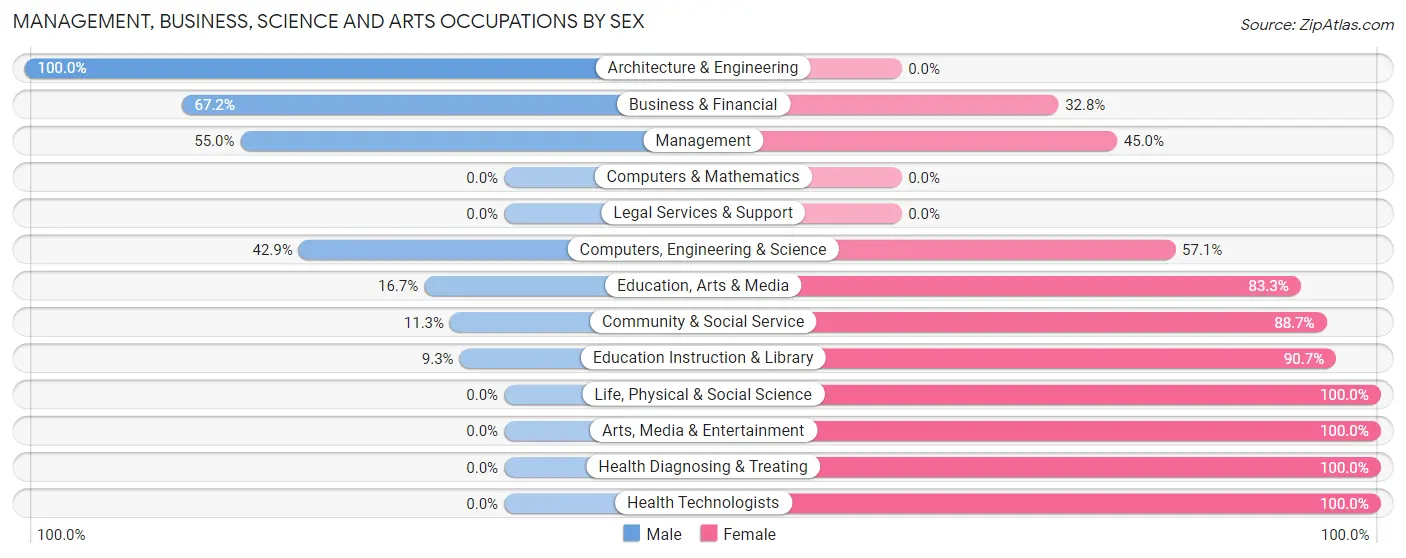
Management, Business, Science and Arts Occupations by Sex
Within the Management, Business, Science and Arts occupations in Haxtun, the most male-oriented occupations are Architecture & Engineering (100.0%), Business & Financial (67.2%), and Management (55.0%), while the most female-oriented occupations are Life, Physical & Social Science (100.0%), Arts, Media & Entertainment (100.0%), and Health Diagnosing & Treating (100.0%).
| Occupation | Male | Female |
| Management | 44 (55.0%) | 36 (45.0%) |
| Business & Financial | 39 (67.2%) | 19 (32.8%) |
| Computers, Engineering & Science | 3 (42.9%) | 4 (57.1%) |
| Computers & Mathematics | 0 (0.0%) | 0 (0.0%) |
| Architecture & Engineering | 3 (100.0%) | 0 (0.0%) |
| Life, Physical & Social Science | 0 (0.0%) | 4 (100.0%) |
| Community & Social Service | 7 (11.3%) | 55 (88.7%) |
| Education, Arts & Media | 3 (16.7%) | 15 (83.3%) |
| Legal Services & Support | 0 (0.0%) | 0 (0.0%) |
| Education Instruction & Library | 4 (9.3%) | 39 (90.7%) |
| Arts, Media & Entertainment | 0 (0.0%) | 1 (100.0%) |
| Health Diagnosing & Treating | 0 (0.0%) | 11 (100.0%) |
| Health Technologists | 0 (0.0%) | 7 (100.0%) |
| Total (Category) | 93 (42.7%) | 125 (57.3%) |
| Total (Overall) | 208 (48.9%) | 217 (51.1%) |
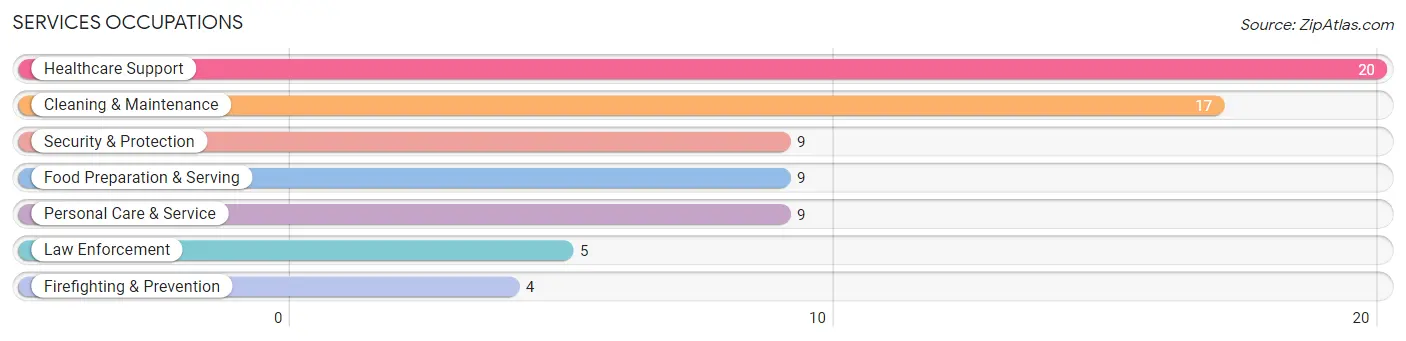
Services Occupations
The most common Services occupations in Haxtun are Healthcare Support (20 | 4.7%), Cleaning & Maintenance (17 | 4.0%), Security & Protection (9 | 2.1%), Food Preparation & Serving (9 | 2.1%), and Personal Care & Service (9 | 2.1%).
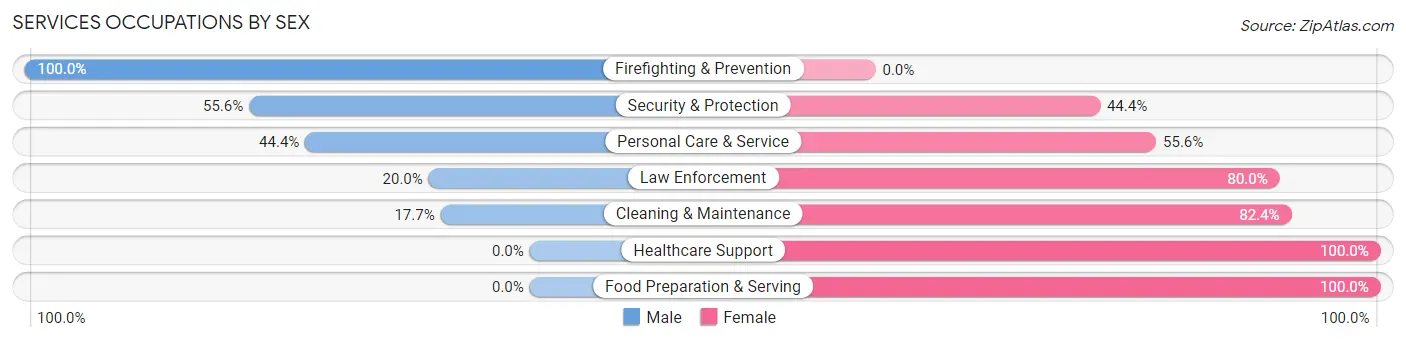
Services Occupations by Sex
Within the Services occupations in Haxtun, the most male-oriented occupations are Firefighting & Prevention (100.0%), Security & Protection (55.6%), and Personal Care & Service (44.4%), while the most female-oriented occupations are Healthcare Support (100.0%), Food Preparation & Serving (100.0%), and Cleaning & Maintenance (82.4%).
| Occupation | Male | Female |
| Healthcare Support | 0 (0.0%) | 20 (100.0%) |
| Security & Protection | 5 (55.6%) | 4 (44.4%) |
| Firefighting & Prevention | 4 (100.0%) | 0 (0.0%) |
| Law Enforcement | 1 (20.0%) | 4 (80.0%) |
| Food Preparation & Serving | 0 (0.0%) | 9 (100.0%) |
| Cleaning & Maintenance | 3 (17.6%) | 14 (82.4%) |
| Personal Care & Service | 4 (44.4%) | 5 (55.6%) |
| Total (Category) | 12 (18.8%) | 52 (81.2%) |
| Total (Overall) | 208 (48.9%) | 217 (51.1%) |
Sales and Office Occupations
The most common Sales and Office occupations in Haxtun are Sales & Related (28 | 6.6%), and Office & Administration (14 | 3.3%).
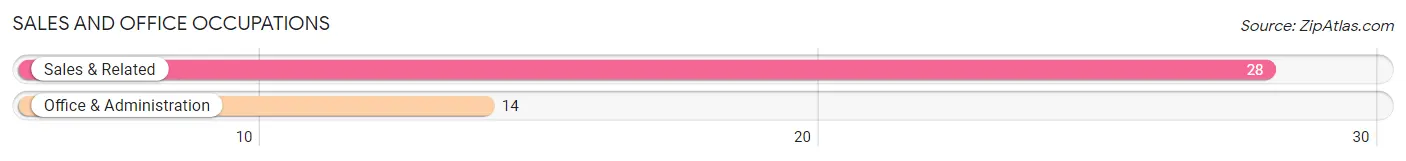
Sales and Office Occupations by Sex
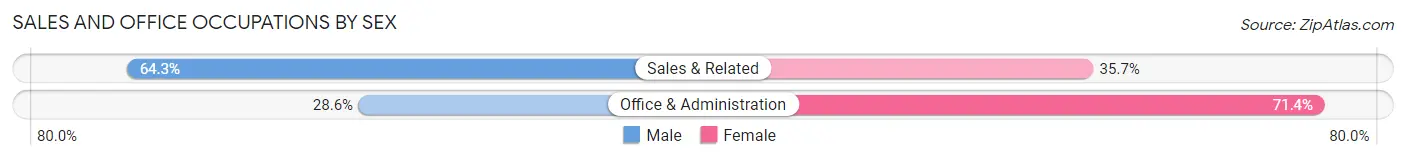
| Occupation | Male | Female |
| Sales & Related | 18 (64.3%) | 10 (35.7%) |
| Office & Administration | 4 (28.6%) | 10 (71.4%) |
| Total (Category) | 22 (52.4%) | 20 (47.6%) |
| Total (Overall) | 208 (48.9%) | 217 (51.1%) |
Natural Resources, Construction and Maintenance Occupations
The most common Natural Resources, Construction and Maintenance occupations in Haxtun are Construction & Extraction (28 | 6.6%), and Installation, Maintenance & Repair (13 | 3.1%).
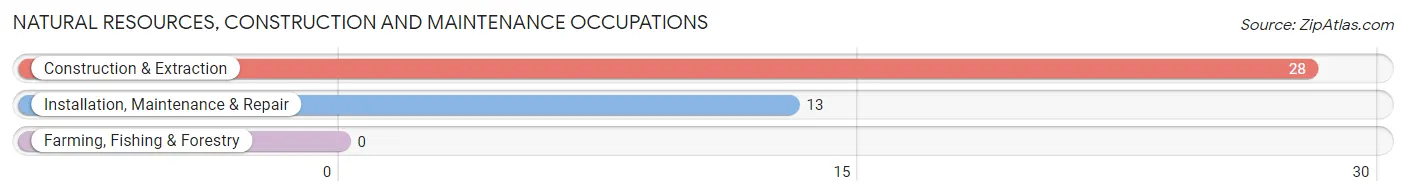
Natural Resources, Construction and Maintenance Occupations by Sex
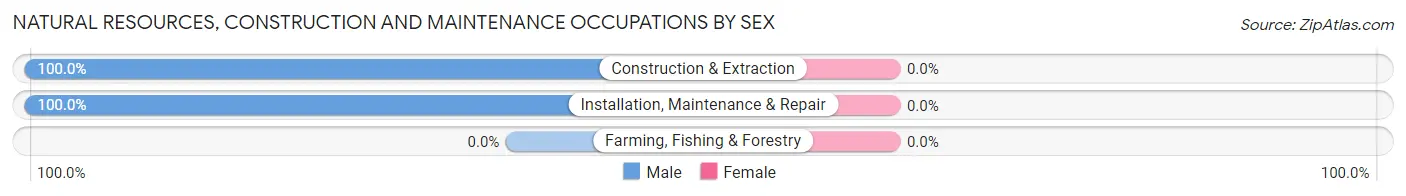
| Occupation | Male | Female |
| Farming, Fishing & Forestry | 0 (0.0%) | 0 (0.0%) |
| Construction & Extraction | 28 (100.0%) | 0 (0.0%) |
| Installation, Maintenance & Repair | 13 (100.0%) | 0 (0.0%) |
| Total (Category) | 41 (100.0%) | 0 (0.0%) |
| Total (Overall) | 208 (48.9%) | 217 (51.1%) |
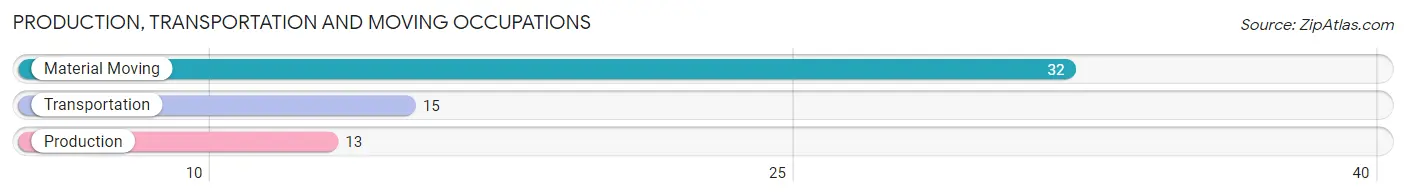
Production, Transportation and Moving Occupations
The most common Production, Transportation and Moving occupations in Haxtun are Material Moving (32 | 7.5%), Transportation (15 | 3.5%), and Production (13 | 3.1%).
Production, Transportation and Moving Occupations by Sex
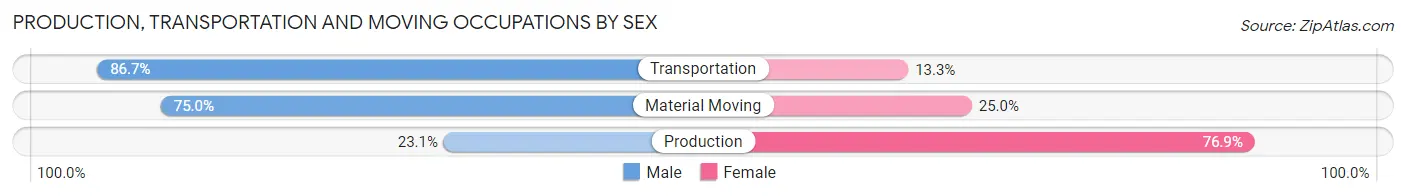
| Occupation | Male | Female |
| Production | 3 (23.1%) | 10 (76.9%) |
| Transportation | 13 (86.7%) | 2 (13.3%) |
| Material Moving | 24 (75.0%) | 8 (25.0%) |
| Total (Category) | 40 (66.7%) | 20 (33.3%) |
| Total (Overall) | 208 (48.9%) | 217 (51.1%) |
Employment Industries by Sex in Haxtun
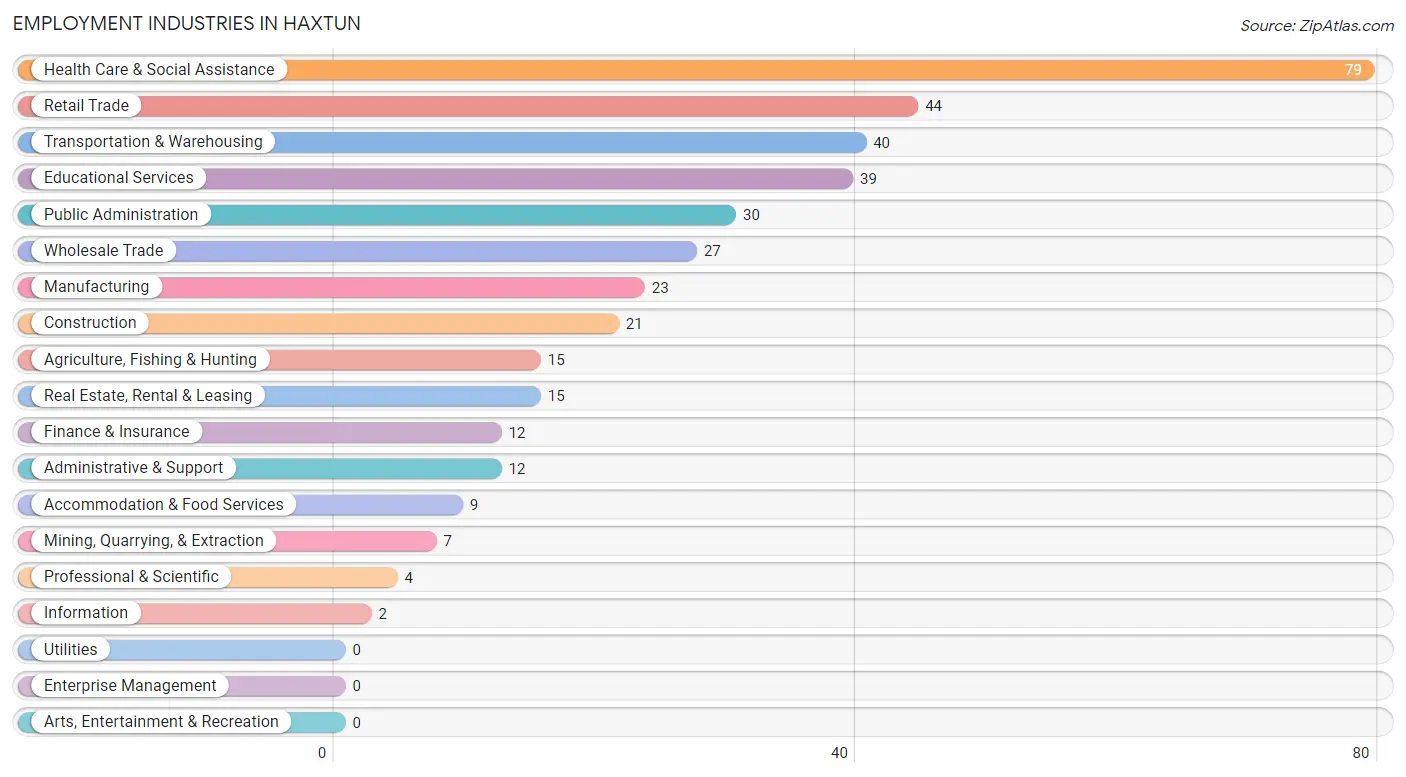
Employment Industries in Haxtun
The major employment industries in Haxtun include Health Care & Social Assistance (79 | 18.6%), Retail Trade (44 | 10.3%), Transportation & Warehousing (40 | 9.4%), Educational Services (39 | 9.2%), and Public Administration (30 | 7.1%).
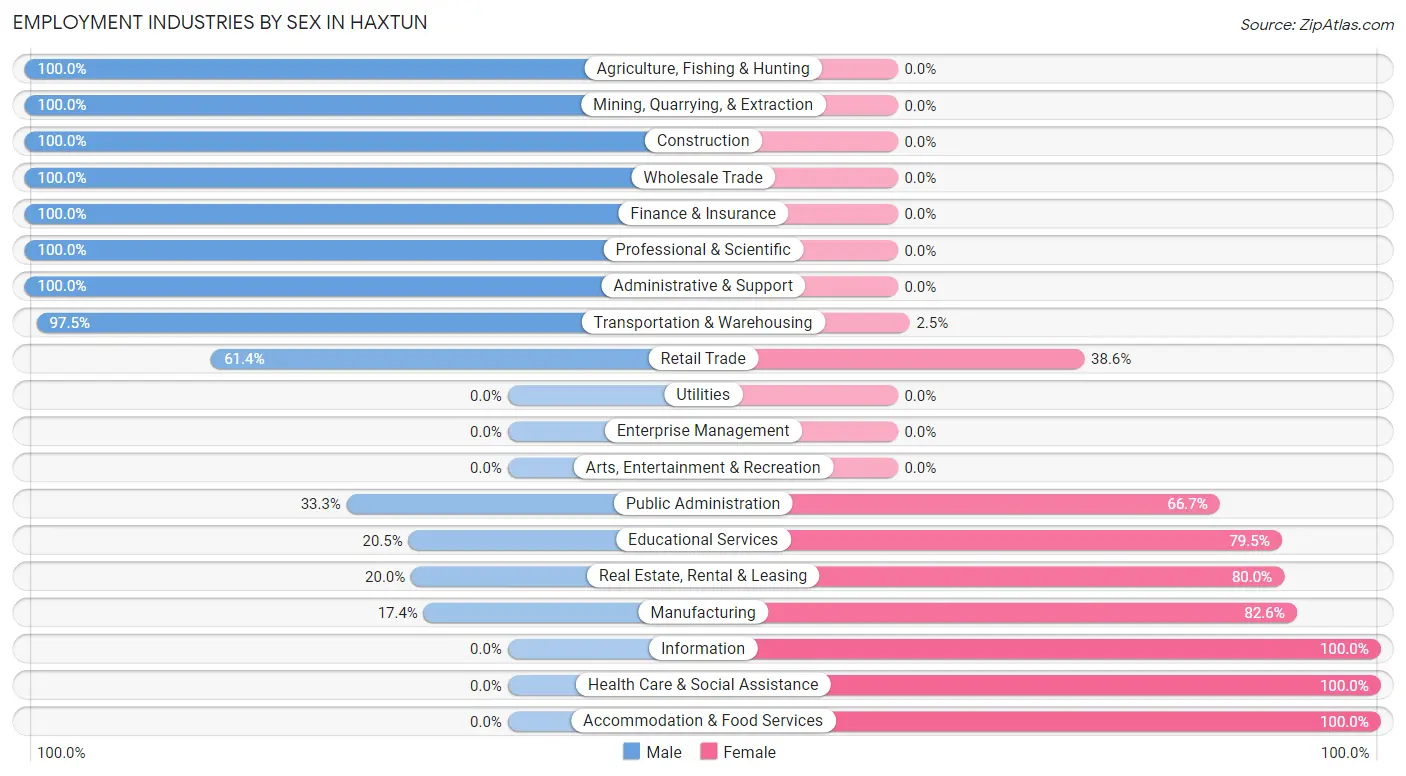
Employment Industries by Sex in Haxtun
The Haxtun industries that see more men than women are Agriculture, Fishing & Hunting (100.0%), Mining, Quarrying, & Extraction (100.0%), and Construction (100.0%), whereas the industries that tend to have a higher number of women are Information (100.0%), Health Care & Social Assistance (100.0%), and Accommodation & Food Services (100.0%).
| Industry | Male | Female |
| Agriculture, Fishing & Hunting | 15 (100.0%) | 0 (0.0%) |
| Mining, Quarrying, & Extraction | 7 (100.0%) | 0 (0.0%) |
| Construction | 21 (100.0%) | 0 (0.0%) |
| Manufacturing | 4 (17.4%) | 19 (82.6%) |
| Wholesale Trade | 27 (100.0%) | 0 (0.0%) |
| Retail Trade | 27 (61.4%) | 17 (38.6%) |
| Transportation & Warehousing | 39 (97.5%) | 1 (2.5%) |
| Utilities | 0 (0.0%) | 0 (0.0%) |
| Information | 0 (0.0%) | 2 (100.0%) |
| Finance & Insurance | 12 (100.0%) | 0 (0.0%) |
| Real Estate, Rental & Leasing | 3 (20.0%) | 12 (80.0%) |
| Professional & Scientific | 4 (100.0%) | 0 (0.0%) |
| Enterprise Management | 0 (0.0%) | 0 (0.0%) |
| Administrative & Support | 12 (100.0%) | 0 (0.0%) |
| Educational Services | 8 (20.5%) | 31 (79.5%) |
| Health Care & Social Assistance | 0 (0.0%) | 79 (100.0%) |
| Arts, Entertainment & Recreation | 0 (0.0%) | 0 (0.0%) |
| Accommodation & Food Services | 0 (0.0%) | 9 (100.0%) |
| Public Administration | 10 (33.3%) | 20 (66.7%) |
| Total | 208 (48.9%) | 217 (51.1%) |
Education in Haxtun
School Enrollment in Haxtun
The most common levels of schooling among the 245 students in Haxtun are elementary school (77 | 31.4%), high school (65 | 26.5%), and middle school (62 | 25.3%).
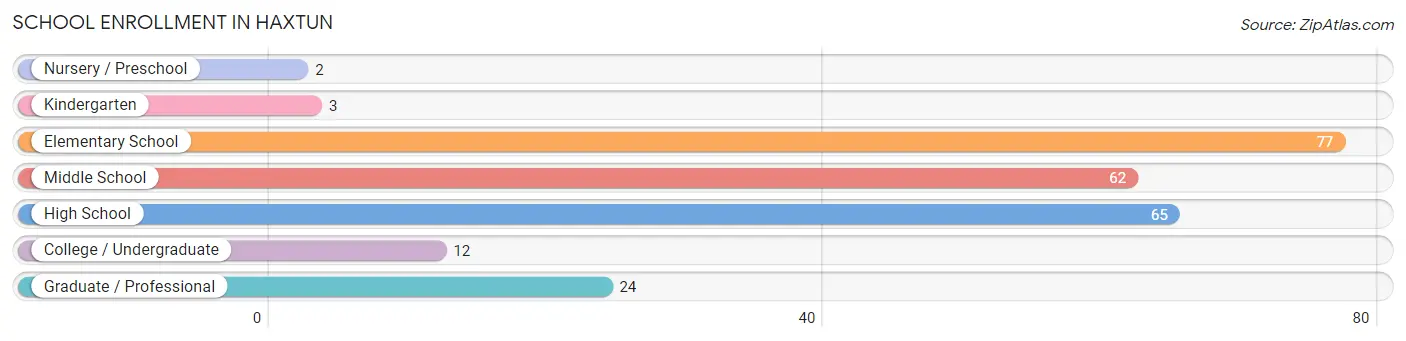
| School Level | # Students | % Students |
| Nursery / Preschool | 2 | 0.8% |
| Kindergarten | 3 | 1.2% |
| Elementary School | 77 | 31.4% |
| Middle School | 62 | 25.3% |
| High School | 65 | 26.5% |
| College / Undergraduate | 12 | 4.9% |
| Graduate / Professional | 24 | 9.8% |
| Total | 245 | 100.0% |
School Enrollment by Age by Funding Source in Haxtun
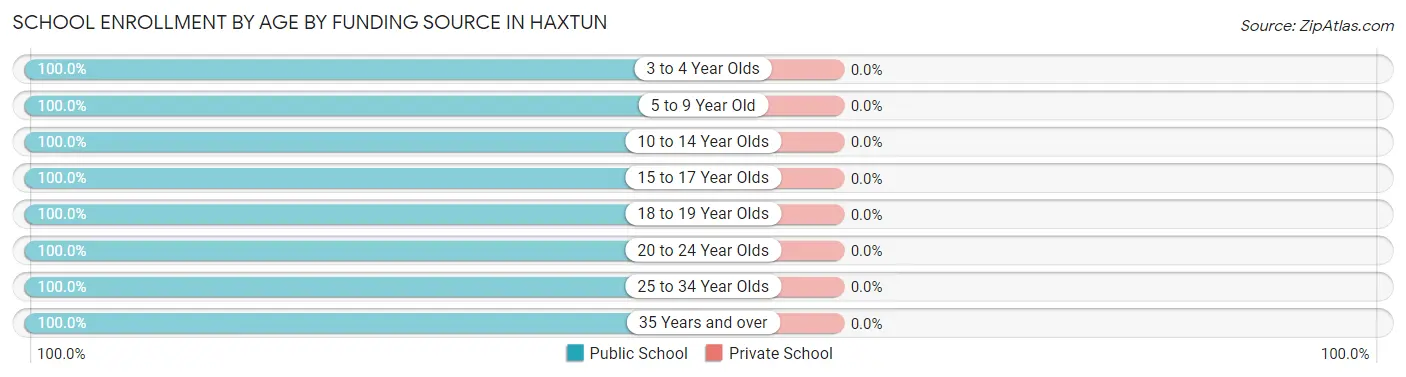
| Age Bracket | Public School | Private School |
| 3 to 4 Year Olds | 2 (100.0%) | 0 (0.0%) |
| 5 to 9 Year Old | 73 (100.0%) | 0 (0.0%) |
| 10 to 14 Year Olds | 72 (100.0%) | 0 (0.0%) |
| 15 to 17 Year Olds | 18 (100.0%) | 0 (0.0%) |
| 18 to 19 Year Olds | 34 (100.0%) | 0 (0.0%) |
| 20 to 24 Year Olds | 16 (100.0%) | 0 (0.0%) |
| 25 to 34 Year Olds | 1 (100.0%) | 0 (0.0%) |
| 35 Years and over | 29 (100.0%) | 0 (0.0%) |
| Total | 245 (100.0%) | 0 (0.0%) |
Educational Attainment by Field of Study in Haxtun
Business (34 | 19.9%), science & technology (31 | 18.1%), bio, nature & agricultural (25 | 14.6%), arts & humanities (24 | 14.0%), and education (21 | 12.3%) are the most common fields of study among 171 individuals in Haxtun who have obtained a bachelor's degree or higher.
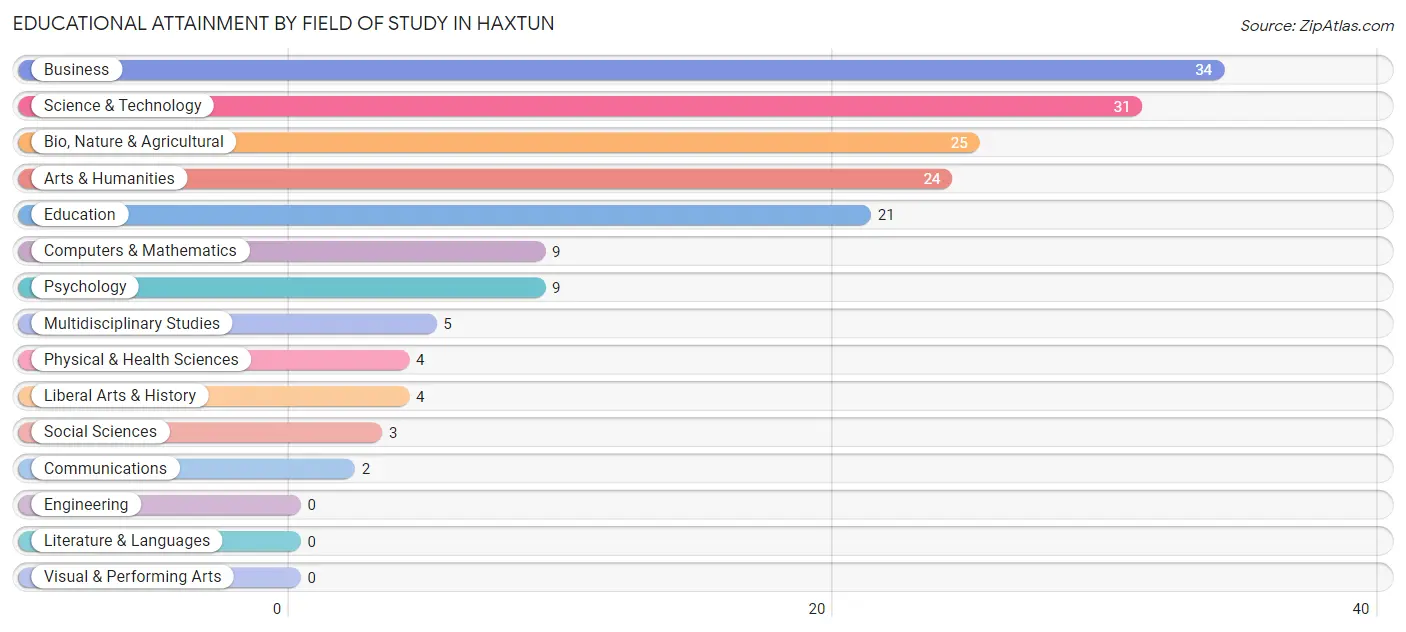
| Field of Study | # Graduates | % Graduates |
| Computers & Mathematics | 9 | 5.3% |
| Bio, Nature & Agricultural | 25 | 14.6% |
| Physical & Health Sciences | 4 | 2.3% |
| Psychology | 9 | 5.3% |
| Social Sciences | 3 | 1.8% |
| Engineering | 0 | 0.0% |
| Multidisciplinary Studies | 5 | 2.9% |
| Science & Technology | 31 | 18.1% |
| Business | 34 | 19.9% |
| Education | 21 | 12.3% |
| Literature & Languages | 0 | 0.0% |
| Liberal Arts & History | 4 | 2.3% |
| Visual & Performing Arts | 0 | 0.0% |
| Communications | 2 | 1.2% |
| Arts & Humanities | 24 | 14.0% |
| Total | 171 | 100.0% |
Transportation & Commute in Haxtun
Vehicle Availability by Sex in Haxtun
The most prevalent vehicle ownership categories in Haxtun are males with 2 vehicles (98, accounting for 50.8%) and females with 2 vehicles (75, making up 45.2%).
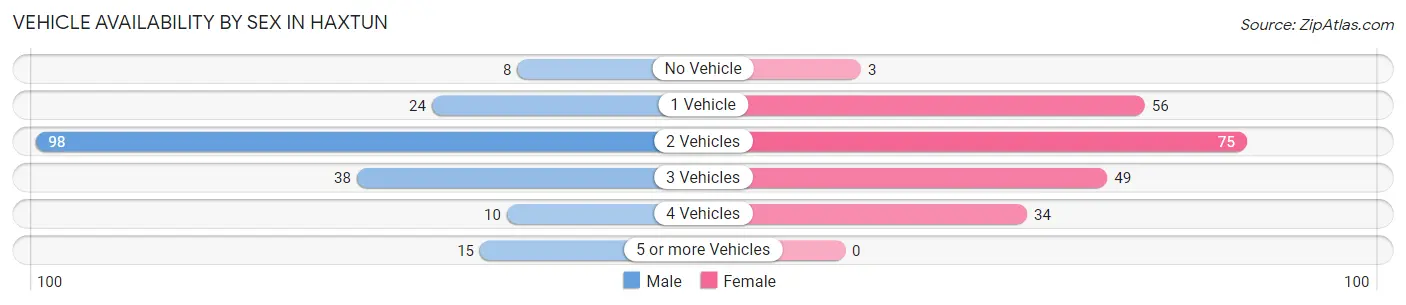
| Vehicles Available | Male | Female |
| No Vehicle | 8 (4.2%) | 3 (1.4%) |
| 1 Vehicle | 24 (12.4%) | 56 (25.8%) |
| 2 Vehicles | 98 (50.8%) | 75 (34.6%) |
| 3 Vehicles | 38 (19.7%) | 49 (22.6%) |
| 4 Vehicles | 10 (5.2%) | 34 (15.7%) |
| 5 or more Vehicles | 15 (7.8%) | 0 (0.0%) |
| Total | 193 (100.0%) | 217 (100.0%) |
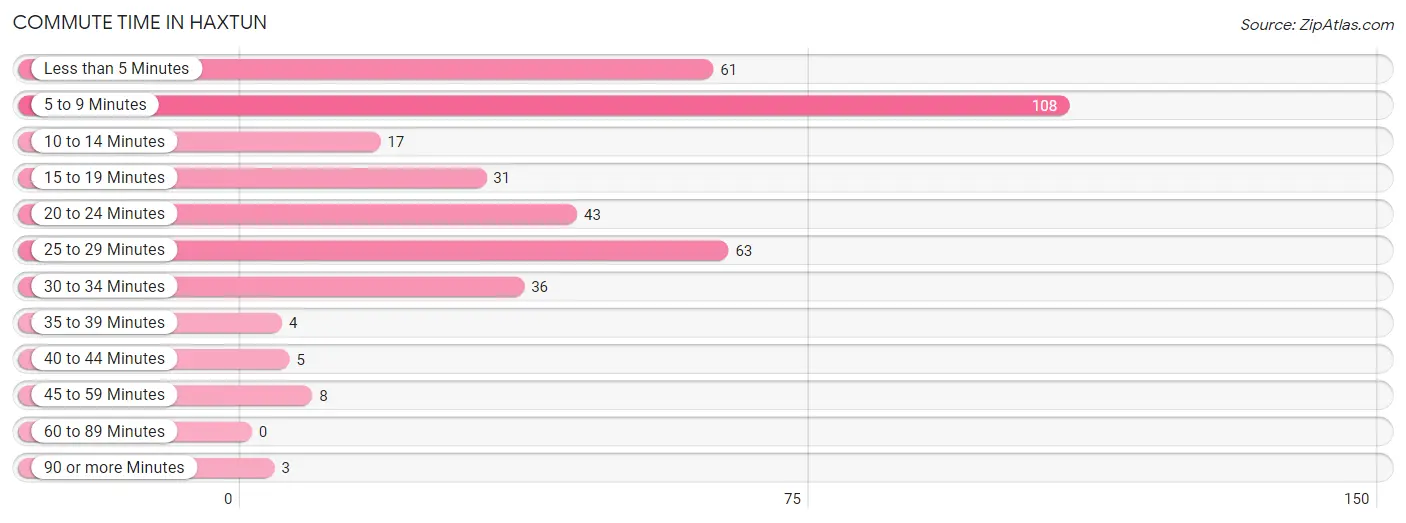
Commute Time in Haxtun
The most frequently occuring commute durations in Haxtun are 5 to 9 minutes (108 commuters, 28.5%), 25 to 29 minutes (63 commuters, 16.6%), and less than 5 minutes (61 commuters, 16.1%).
| Commute Time | # Commuters | % Commuters |
| Less than 5 Minutes | 61 | 16.1% |
| 5 to 9 Minutes | 108 | 28.5% |
| 10 to 14 Minutes | 17 | 4.5% |
| 15 to 19 Minutes | 31 | 8.2% |
| 20 to 24 Minutes | 43 | 11.4% |
| 25 to 29 Minutes | 63 | 16.6% |
| 30 to 34 Minutes | 36 | 9.5% |
| 35 to 39 Minutes | 4 | 1.1% |
| 40 to 44 Minutes | 5 | 1.3% |
| 45 to 59 Minutes | 8 | 2.1% |
| 60 to 89 Minutes | 0 | 0.0% |
| 90 or more Minutes | 3 | 0.8% |
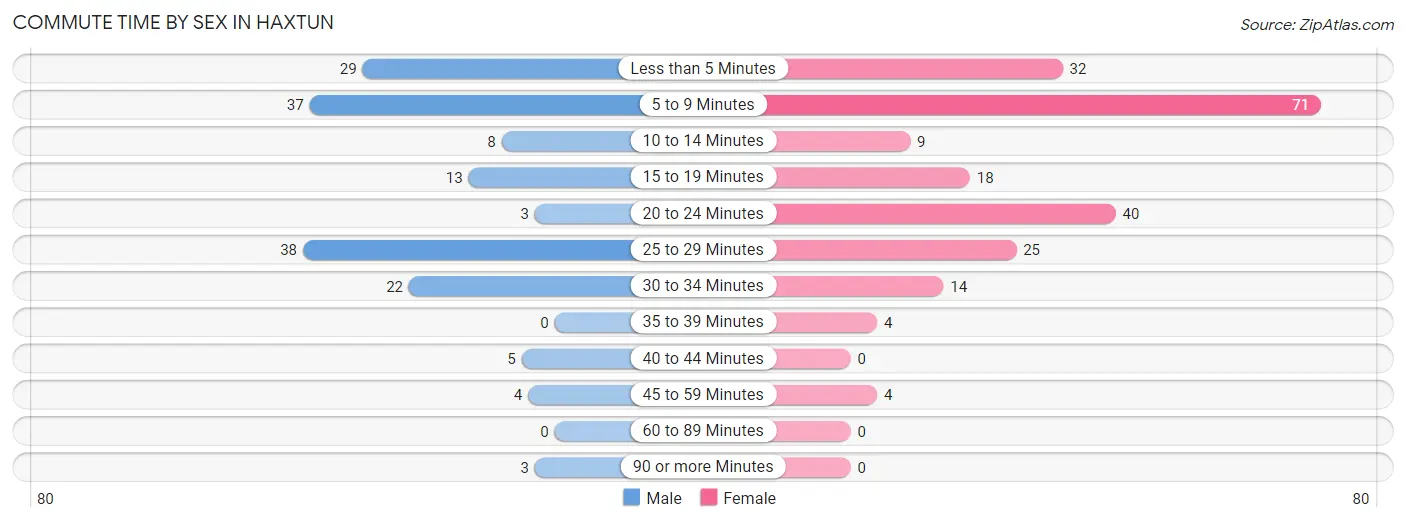
Commute Time by Sex in Haxtun
The most common commute times in Haxtun are 25 to 29 minutes (38 commuters, 23.5%) for males and 5 to 9 minutes (71 commuters, 32.7%) for females.
| Commute Time | Male | Female |
| Less than 5 Minutes | 29 (17.9%) | 32 (14.7%) |
| 5 to 9 Minutes | 37 (22.8%) | 71 (32.7%) |
| 10 to 14 Minutes | 8 (4.9%) | 9 (4.2%) |
| 15 to 19 Minutes | 13 (8.0%) | 18 (8.3%) |
| 20 to 24 Minutes | 3 (1.8%) | 40 (18.4%) |
| 25 to 29 Minutes | 38 (23.5%) | 25 (11.5%) |
| 30 to 34 Minutes | 22 (13.6%) | 14 (6.5%) |
| 35 to 39 Minutes | 0 (0.0%) | 4 (1.8%) |
| 40 to 44 Minutes | 5 (3.1%) | 0 (0.0%) |
| 45 to 59 Minutes | 4 (2.5%) | 4 (1.8%) |
| 60 to 89 Minutes | 0 (0.0%) | 0 (0.0%) |
| 90 or more Minutes | 3 (1.8%) | 0 (0.0%) |
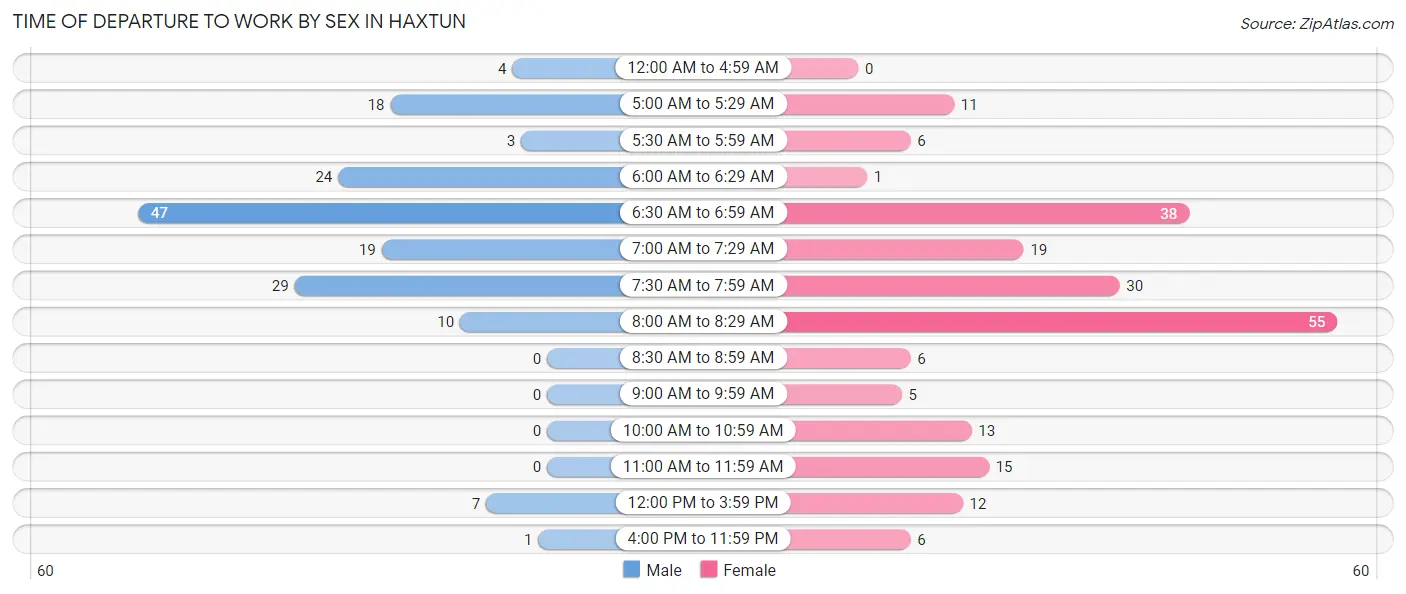
Time of Departure to Work by Sex in Haxtun
The most frequent times of departure to work in Haxtun are 6:30 AM to 6:59 AM (47, 29.0%) for males and 8:00 AM to 8:29 AM (55, 25.4%) for females.
| Time of Departure | Male | Female |
| 12:00 AM to 4:59 AM | 4 (2.5%) | 0 (0.0%) |
| 5:00 AM to 5:29 AM | 18 (11.1%) | 11 (5.1%) |
| 5:30 AM to 5:59 AM | 3 (1.8%) | 6 (2.8%) |
| 6:00 AM to 6:29 AM | 24 (14.8%) | 1 (0.5%) |
| 6:30 AM to 6:59 AM | 47 (29.0%) | 38 (17.5%) |
| 7:00 AM to 7:29 AM | 19 (11.7%) | 19 (8.8%) |
| 7:30 AM to 7:59 AM | 29 (17.9%) | 30 (13.8%) |
| 8:00 AM to 8:29 AM | 10 (6.2%) | 55 (25.4%) |
| 8:30 AM to 8:59 AM | 0 (0.0%) | 6 (2.8%) |
| 9:00 AM to 9:59 AM | 0 (0.0%) | 5 (2.3%) |
| 10:00 AM to 10:59 AM | 0 (0.0%) | 13 (6.0%) |
| 11:00 AM to 11:59 AM | 0 (0.0%) | 15 (6.9%) |
| 12:00 PM to 3:59 PM | 7 (4.3%) | 12 (5.5%) |
| 4:00 PM to 11:59 PM | 1 (0.6%) | 6 (2.8%) |
| Total | 162 (100.0%) | 217 (100.0%) |
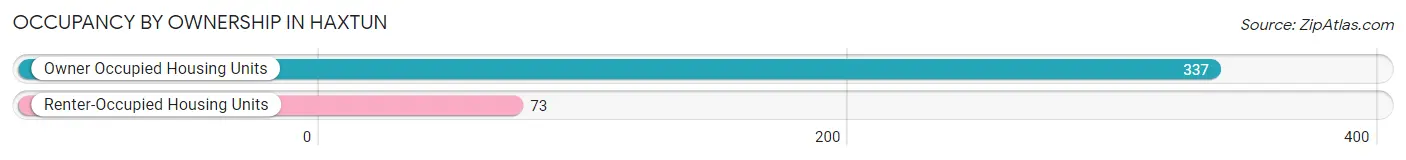
Housing Occupancy in Haxtun
Occupancy by Ownership in Haxtun
Of the total 410 dwellings in Haxtun, owner-occupied units account for 337 (82.2%), while renter-occupied units make up 73 (17.8%).
| Occupancy | # Housing Units | % Housing Units |
| Owner Occupied Housing Units | 337 | 82.2% |
| Renter-Occupied Housing Units | 73 | 17.8% |
| Total Occupied Housing Units | 410 | 100.0% |
Occupancy by Household Size in Haxtun
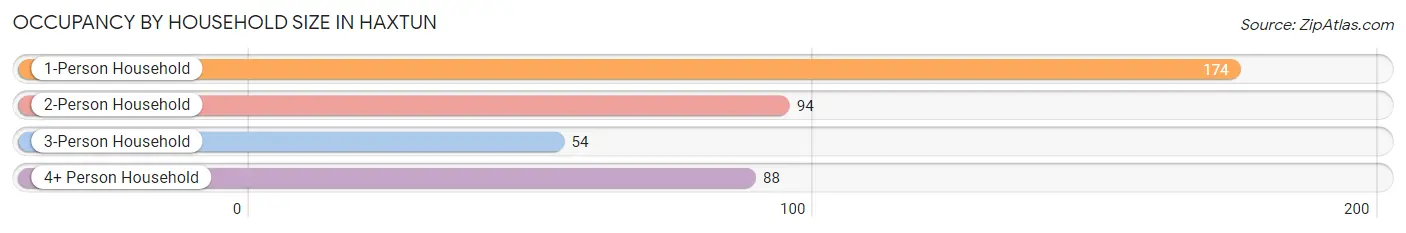
| Household Size | # Housing Units | % Housing Units |
| 1-Person Household | 174 | 42.4% |
| 2-Person Household | 94 | 22.9% |
| 3-Person Household | 54 | 13.2% |
| 4+ Person Household | 88 | 21.5% |
| Total Housing Units | 410 | 100.0% |
Occupancy by Ownership by Household Size in Haxtun
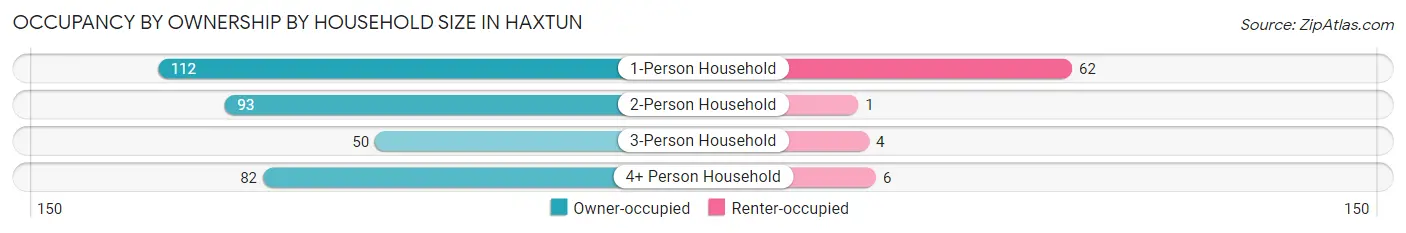
| Household Size | Owner-occupied | Renter-occupied |
| 1-Person Household | 112 (64.4%) | 62 (35.6%) |
| 2-Person Household | 93 (98.9%) | 1 (1.1%) |
| 3-Person Household | 50 (92.6%) | 4 (7.4%) |
| 4+ Person Household | 82 (93.2%) | 6 (6.8%) |
| Total Housing Units | 337 (82.2%) | 73 (17.8%) |
Occupancy by Educational Attainment in Haxtun
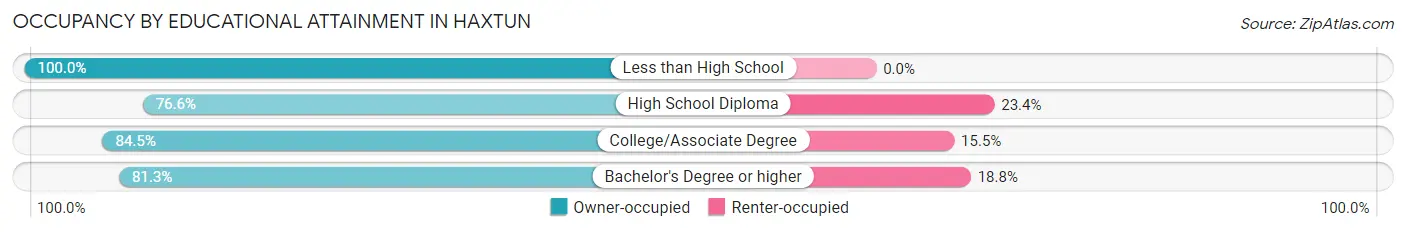
| Household Size | Owner-occupied | Renter-occupied |
| Less than High School | 12 (100.0%) | 0 (0.0%) |
| High School Diploma | 85 (76.6%) | 26 (23.4%) |
| College/Associate Degree | 175 (84.5%) | 32 (15.5%) |
| Bachelor's Degree or higher | 65 (81.2%) | 15 (18.8%) |
Occupancy by Age of Householder in Haxtun
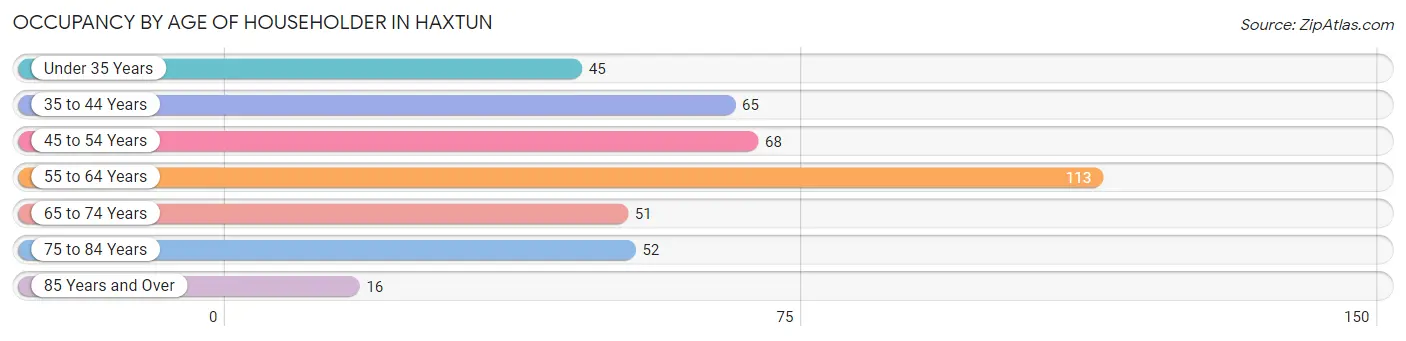
| Age Bracket | # Households | % Households |
| Under 35 Years | 45 | 11.0% |
| 35 to 44 Years | 65 | 15.9% |
| 45 to 54 Years | 68 | 16.6% |
| 55 to 64 Years | 113 | 27.6% |
| 65 to 74 Years | 51 | 12.4% |
| 75 to 84 Years | 52 | 12.7% |
| 85 Years and Over | 16 | 3.9% |
| Total | 410 | 100.0% |
Housing Finances in Haxtun
Median Income by Occupancy in Haxtun
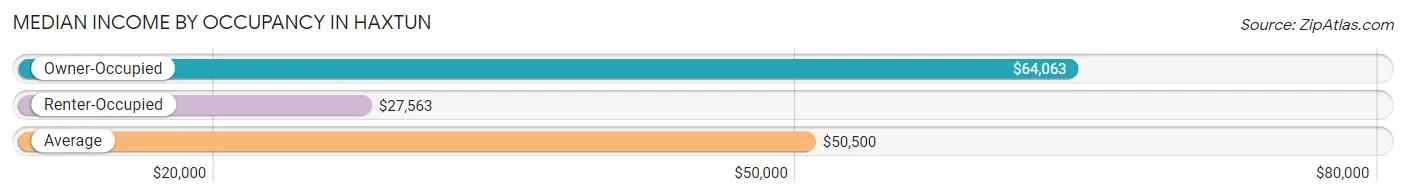
| Occupancy Type | # Households | Median Income |
| Owner-Occupied | 337 (82.2%) | $64,063 |
| Renter-Occupied | 73 (17.8%) | $27,563 |
| Average | 410 (100.0%) | $50,500 |
Occupancy by Householder Income Bracket in Haxtun
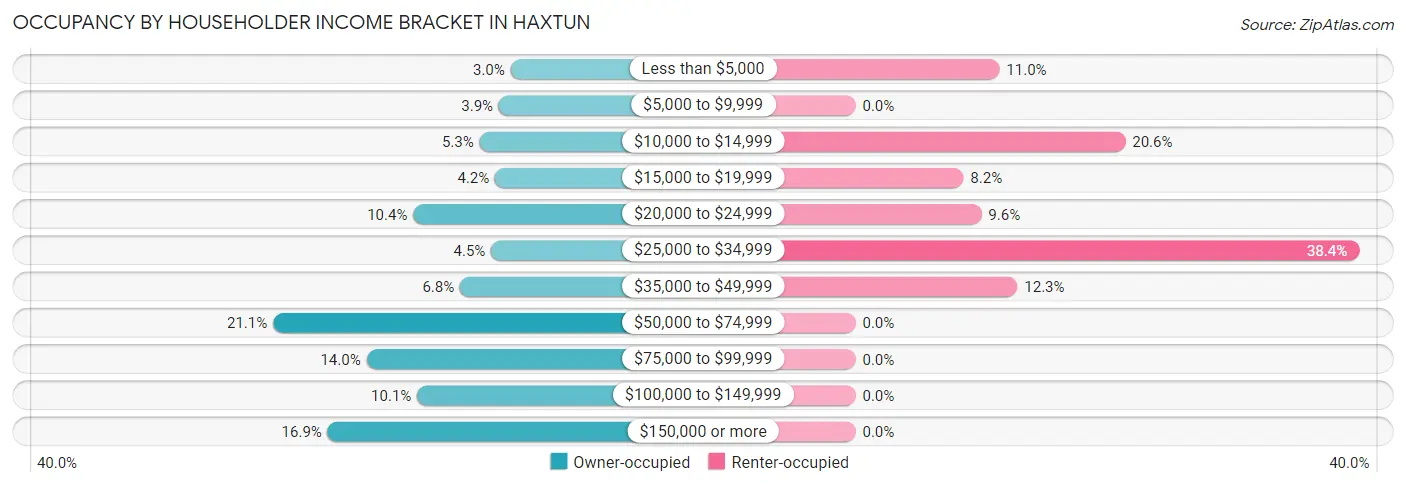
| Income Bracket | Owner-occupied | Renter-occupied |
| Less than $5,000 | 10 (3.0%) | 8 (11.0%) |
| $5,000 to $9,999 | 13 (3.9%) | 0 (0.0%) |
| $10,000 to $14,999 | 18 (5.3%) | 15 (20.5%) |
| $15,000 to $19,999 | 14 (4.2%) | 6 (8.2%) |
| $20,000 to $24,999 | 35 (10.4%) | 7 (9.6%) |
| $25,000 to $34,999 | 15 (4.4%) | 28 (38.4%) |
| $35,000 to $49,999 | 23 (6.8%) | 9 (12.3%) |
| $50,000 to $74,999 | 71 (21.1%) | 0 (0.0%) |
| $75,000 to $99,999 | 47 (14.0%) | 0 (0.0%) |
| $100,000 to $149,999 | 34 (10.1%) | 0 (0.0%) |
| $150,000 or more | 57 (16.9%) | 0 (0.0%) |
| Total | 337 (100.0%) | 73 (100.0%) |
Monthly Housing Cost Tiers in Haxtun
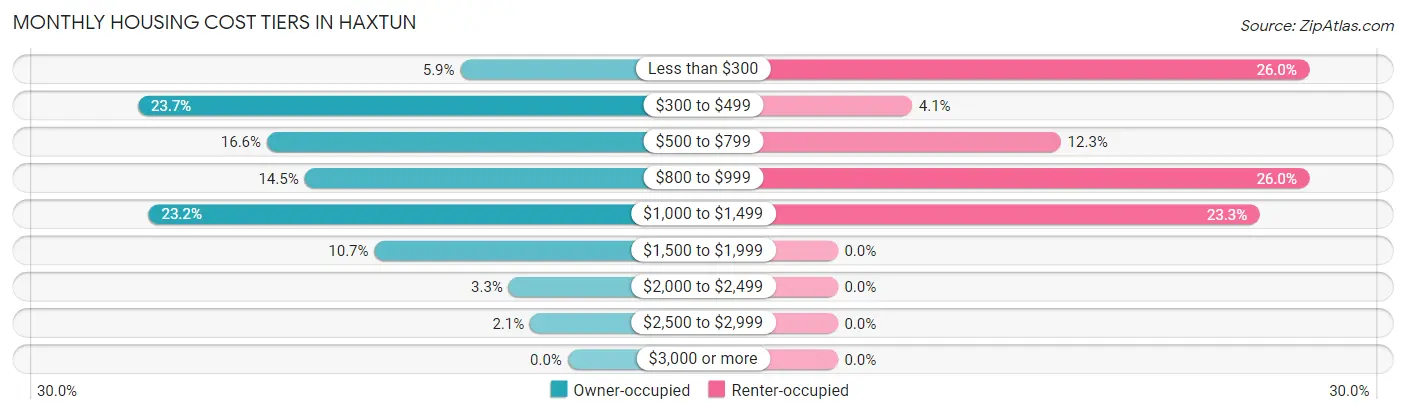
| Monthly Cost | Owner-occupied | Renter-occupied |
| Less than $300 | 20 (5.9%) | 19 (26.0%) |
| $300 to $499 | 80 (23.7%) | 3 (4.1%) |
| $500 to $799 | 56 (16.6%) | 9 (12.3%) |
| $800 to $999 | 49 (14.5%) | 19 (26.0%) |
| $1,000 to $1,499 | 78 (23.2%) | 17 (23.3%) |
| $1,500 to $1,999 | 36 (10.7%) | 0 (0.0%) |
| $2,000 to $2,499 | 11 (3.3%) | 0 (0.0%) |
| $2,500 to $2,999 | 7 (2.1%) | 0 (0.0%) |
| $3,000 or more | 0 (0.0%) | 0 (0.0%) |
| Total | 337 (100.0%) | 73 (100.0%) |
Physical Housing Characteristics in Haxtun
Housing Structures in Haxtun
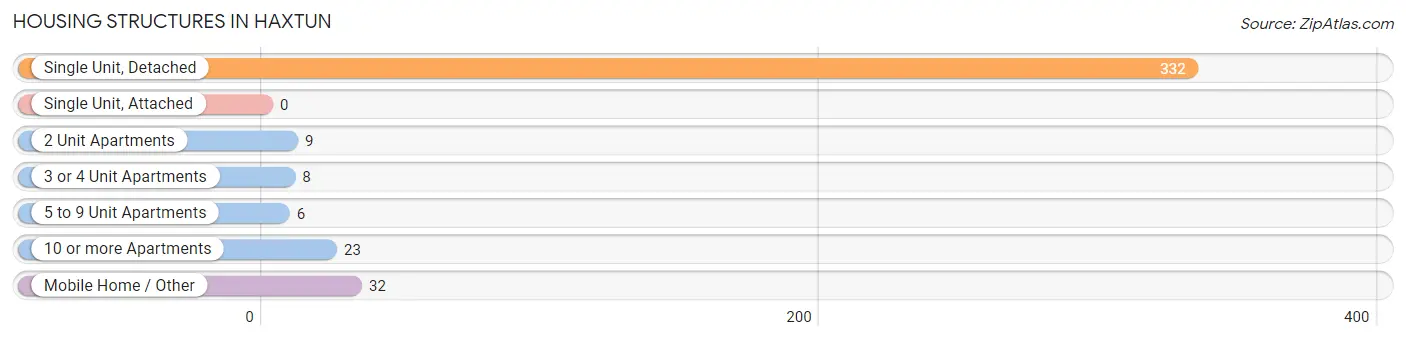
| Structure Type | # Housing Units | % Housing Units |
| Single Unit, Detached | 332 | 81.0% |
| Single Unit, Attached | 0 | 0.0% |
| 2 Unit Apartments | 9 | 2.2% |
| 3 or 4 Unit Apartments | 8 | 1.9% |
| 5 to 9 Unit Apartments | 6 | 1.5% |
| 10 or more Apartments | 23 | 5.6% |
| Mobile Home / Other | 32 | 7.8% |
| Total | 410 | 100.0% |
Housing Structures by Occupancy in Haxtun
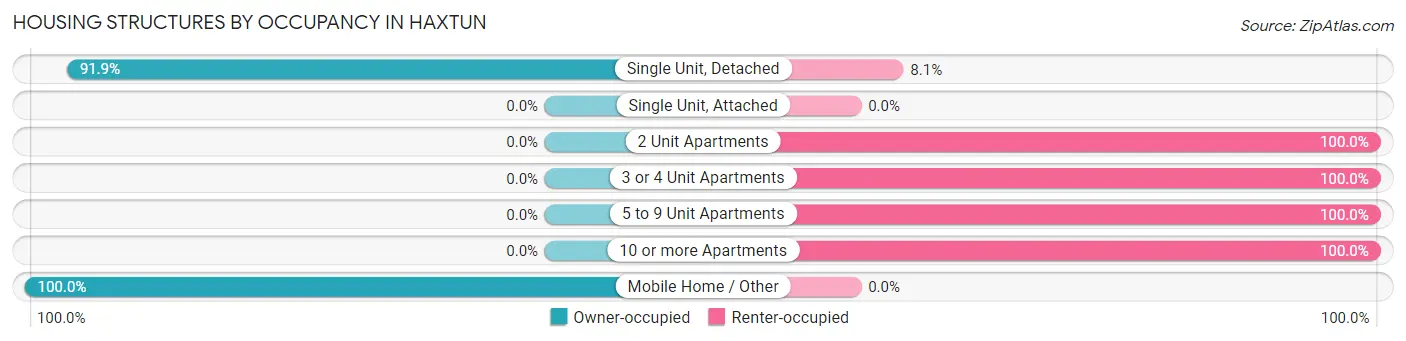
| Structure Type | Owner-occupied | Renter-occupied |
| Single Unit, Detached | 305 (91.9%) | 27 (8.1%) |
| Single Unit, Attached | 0 (0.0%) | 0 (0.0%) |
| 2 Unit Apartments | 0 (0.0%) | 9 (100.0%) |
| 3 or 4 Unit Apartments | 0 (0.0%) | 8 (100.0%) |
| 5 to 9 Unit Apartments | 0 (0.0%) | 6 (100.0%) |
| 10 or more Apartments | 0 (0.0%) | 23 (100.0%) |
| Mobile Home / Other | 32 (100.0%) | 0 (0.0%) |
| Total | 337 (82.2%) | 73 (17.8%) |
Housing Structures by Number of Rooms in Haxtun
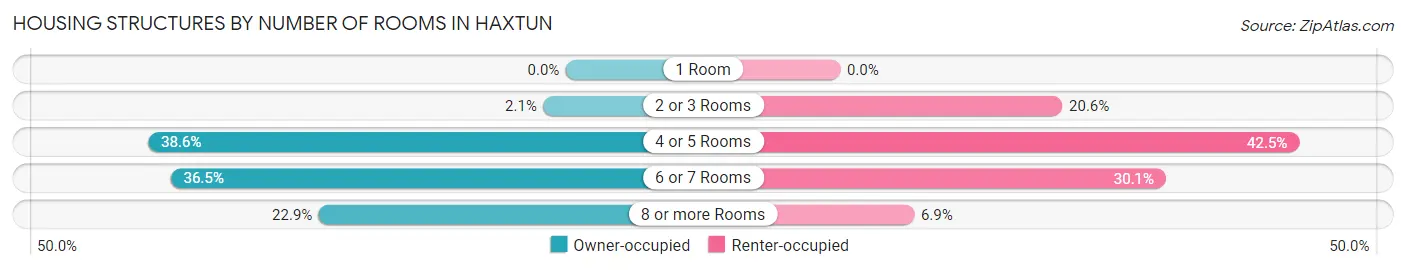
| Number of Rooms | Owner-occupied | Renter-occupied |
| 1 Room | 0 (0.0%) | 0 (0.0%) |
| 2 or 3 Rooms | 7 (2.1%) | 15 (20.5%) |
| 4 or 5 Rooms | 130 (38.6%) | 31 (42.5%) |
| 6 or 7 Rooms | 123 (36.5%) | 22 (30.1%) |
| 8 or more Rooms | 77 (22.9%) | 5 (6.9%) |
| Total | 337 (100.0%) | 73 (100.0%) |
Housing Structure by Heating Type in Haxtun
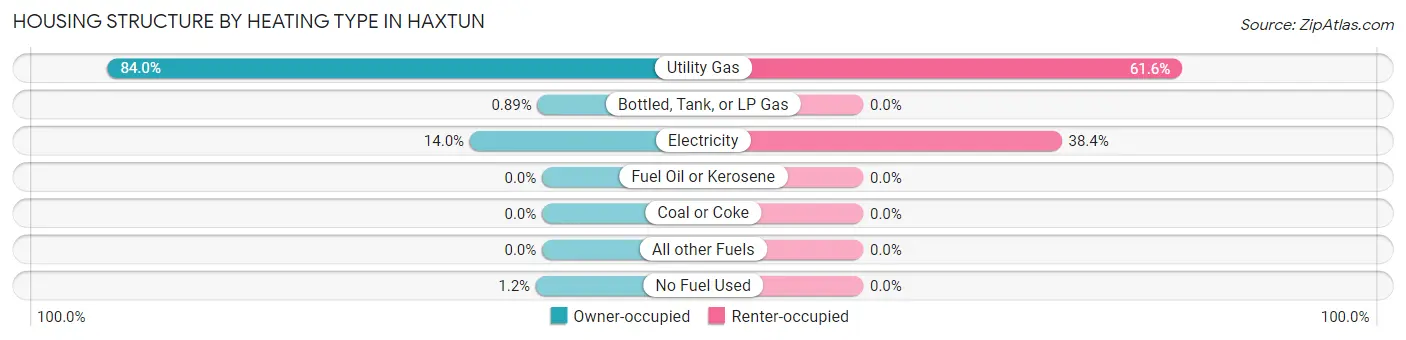
| Heating Type | Owner-occupied | Renter-occupied |
| Utility Gas | 283 (84.0%) | 45 (61.6%) |
| Bottled, Tank, or LP Gas | 3 (0.9%) | 0 (0.0%) |
| Electricity | 47 (14.0%) | 28 (38.4%) |
| Fuel Oil or Kerosene | 0 (0.0%) | 0 (0.0%) |
| Coal or Coke | 0 (0.0%) | 0 (0.0%) |
| All other Fuels | 0 (0.0%) | 0 (0.0%) |
| No Fuel Used | 4 (1.2%) | 0 (0.0%) |
| Total | 337 (100.0%) | 73 (100.0%) |
Household Vehicle Usage in Haxtun
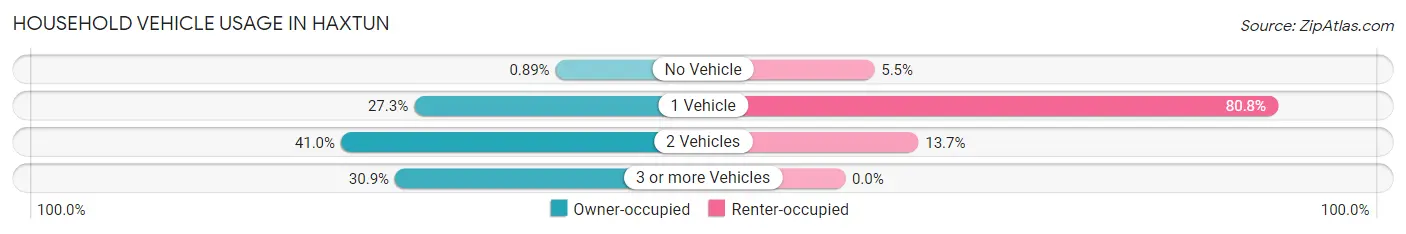
| Vehicles per Household | Owner-occupied | Renter-occupied |
| No Vehicle | 3 (0.9%) | 4 (5.5%) |
| 1 Vehicle | 92 (27.3%) | 59 (80.8%) |
| 2 Vehicles | 138 (40.9%) | 10 (13.7%) |
| 3 or more Vehicles | 104 (30.9%) | 0 (0.0%) |
| Total | 337 (100.0%) | 73 (100.0%) |
Real Estate & Mortgages in Haxtun
Real Estate and Mortgage Overview in Haxtun
| Characteristic | Without Mortgage | With Mortgage |
| Housing Units | 148 | 189 |
| Median Property Value | $161,400 | $226,000 |
| Median Household Income | - | - |
| Monthly Housing Costs | $432 | $0 |
| Real Estate Taxes | $715 | $0 |
Property Value by Mortgage Status in Haxtun
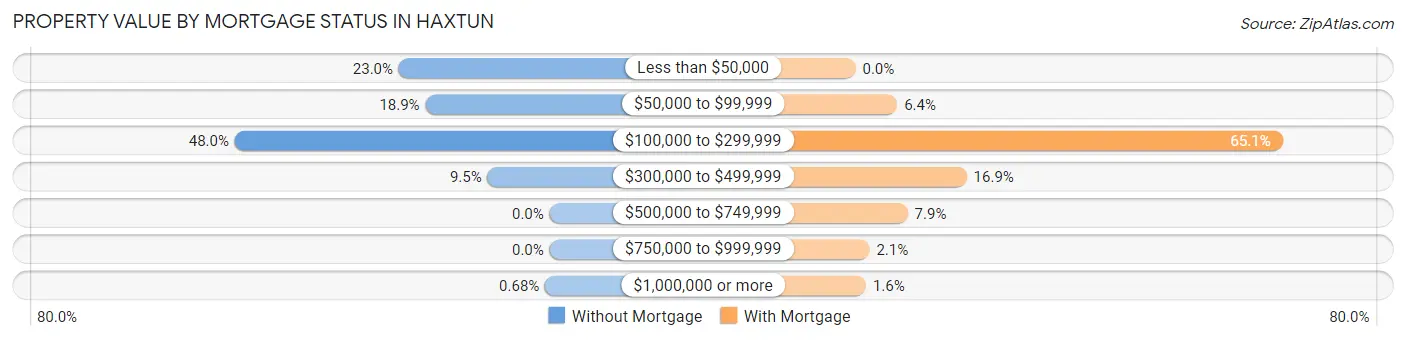
| Property Value | Without Mortgage | With Mortgage |
| Less than $50,000 | 34 (23.0%) | 0 (0.0%) |
| $50,000 to $99,999 | 28 (18.9%) | 12 (6.4%) |
| $100,000 to $299,999 | 71 (48.0%) | 123 (65.1%) |
| $300,000 to $499,999 | 14 (9.5%) | 32 (16.9%) |
| $500,000 to $749,999 | 0 (0.0%) | 15 (7.9%) |
| $750,000 to $999,999 | 0 (0.0%) | 4 (2.1%) |
| $1,000,000 or more | 1 (0.7%) | 3 (1.6%) |
| Total | 148 (100.0%) | 189 (100.0%) |
Household Income by Mortgage Status in Haxtun
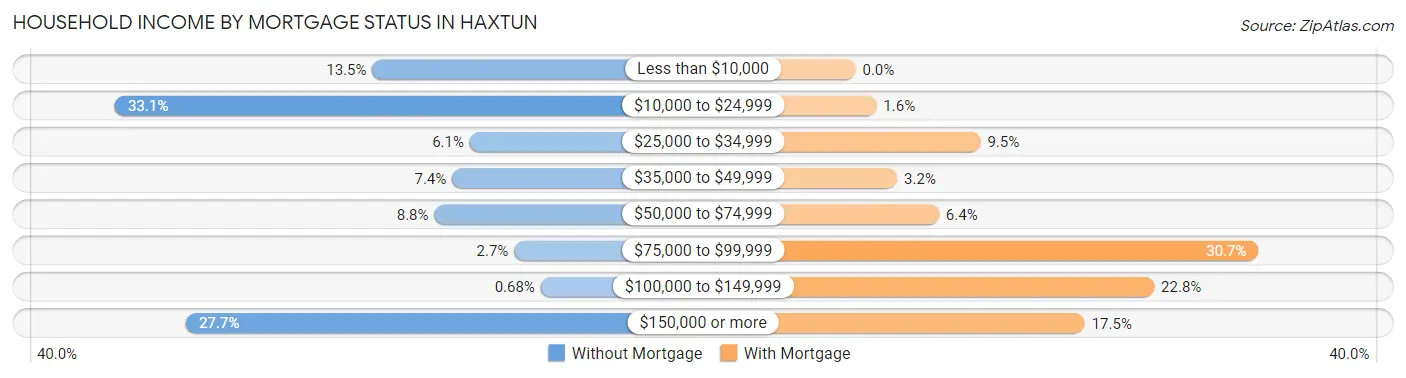
| Household Income | Without Mortgage | With Mortgage |
| Less than $10,000 | 20 (13.5%) | 0 (0.0%) |
| $10,000 to $24,999 | 49 (33.1%) | 3 (1.6%) |
| $25,000 to $34,999 | 9 (6.1%) | 18 (9.5%) |
| $35,000 to $49,999 | 11 (7.4%) | 6 (3.2%) |
| $50,000 to $74,999 | 13 (8.8%) | 12 (6.4%) |
| $75,000 to $99,999 | 4 (2.7%) | 58 (30.7%) |
| $100,000 to $149,999 | 1 (0.7%) | 43 (22.8%) |
| $150,000 or more | 41 (27.7%) | 33 (17.5%) |
| Total | 148 (100.0%) | 189 (100.0%) |
Property Value to Household Income Ratio in Haxtun
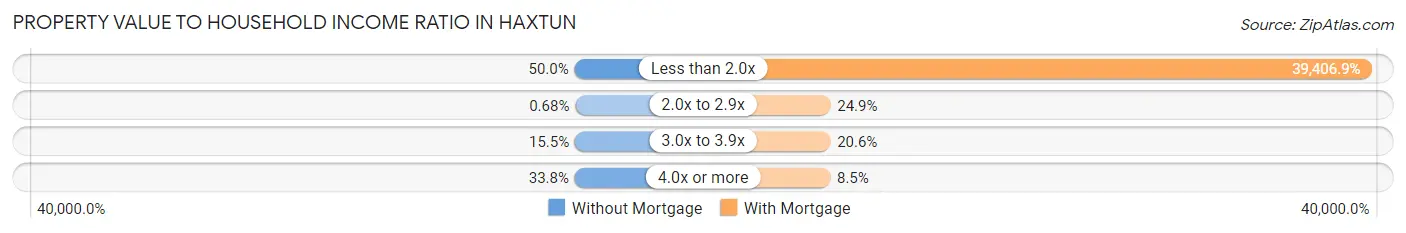
| Value-to-Income Ratio | Without Mortgage | With Mortgage |
| Less than 2.0x | 74 (50.0%) | 74,479 (39,406.9%) |
| 2.0x to 2.9x | 1 (0.7%) | 47 (24.9%) |
| 3.0x to 3.9x | 23 (15.5%) | 39 (20.6%) |
| 4.0x or more | 50 (33.8%) | 16 (8.5%) |
| Total | 148 (100.0%) | 189 (100.0%) |
Real Estate Taxes by Mortgage Status in Haxtun
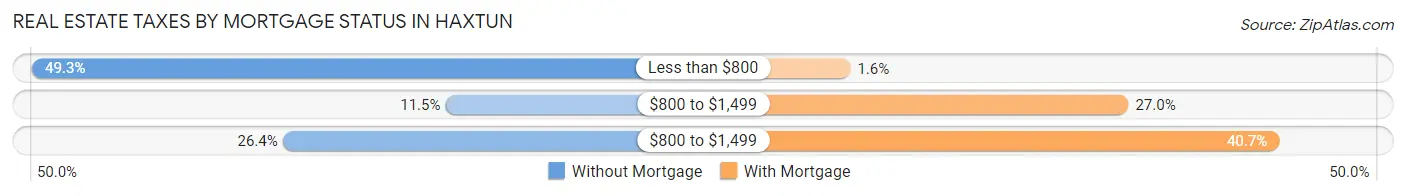
| Property Taxes | Without Mortgage | With Mortgage |
| Less than $800 | 73 (49.3%) | 3 (1.6%) |
| $800 to $1,499 | 17 (11.5%) | 51 (27.0%) |
| $800 to $1,499 | 39 (26.4%) | 77 (40.7%) |
| Total | 148 (100.0%) | 189 (100.0%) |
Health & Disability in Haxtun
Health Insurance Coverage by Age in Haxtun
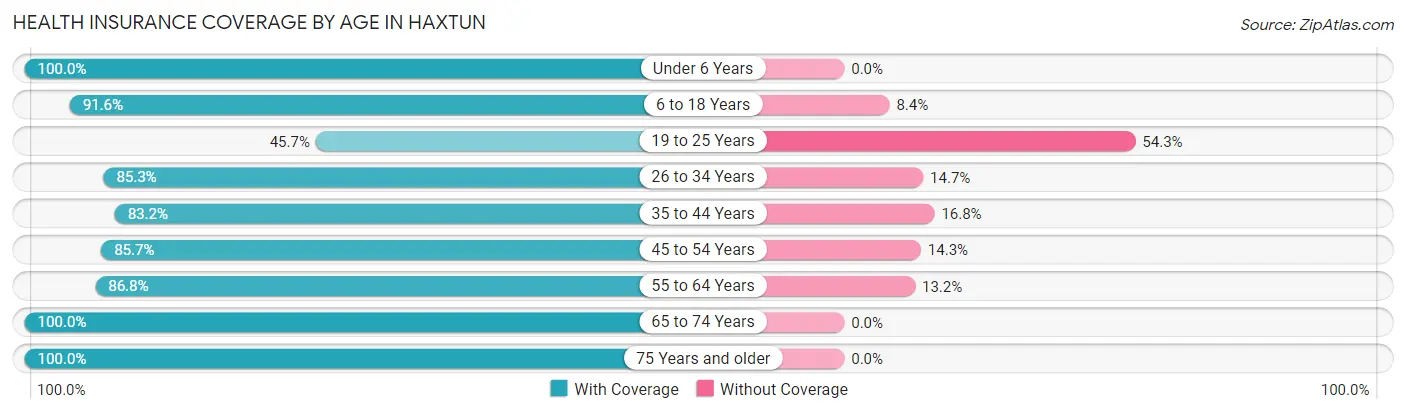
| Age Bracket | With Coverage | Without Coverage |
| Under 6 Years | 25 (100.0%) | 0 (0.0%) |
| 6 to 18 Years | 163 (91.6%) | 15 (8.4%) |
| 19 to 25 Years | 16 (45.7%) | 19 (54.3%) |
| 26 to 34 Years | 58 (85.3%) | 10 (14.7%) |
| 35 to 44 Years | 99 (83.2%) | 20 (16.8%) |
| 45 to 54 Years | 120 (85.7%) | 20 (14.3%) |
| 55 to 64 Years | 125 (86.8%) | 19 (13.2%) |
| 65 to 74 Years | 77 (100.0%) | 0 (0.0%) |
| 75 Years and older | 100 (100.0%) | 0 (0.0%) |
| Total | 783 (88.4%) | 103 (11.6%) |
Health Insurance Coverage by Citizenship Status in Haxtun
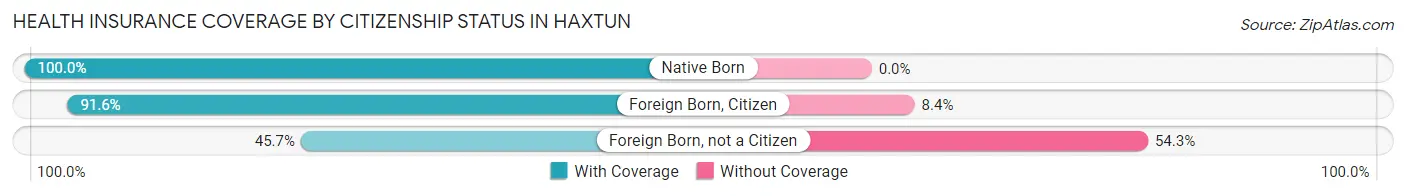
| Citizenship Status | With Coverage | Without Coverage |
| Native Born | 25 (100.0%) | 0 (0.0%) |
| Foreign Born, Citizen | 163 (91.6%) | 15 (8.4%) |
| Foreign Born, not a Citizen | 16 (45.7%) | 19 (54.3%) |
Health Insurance Coverage by Household Income in Haxtun
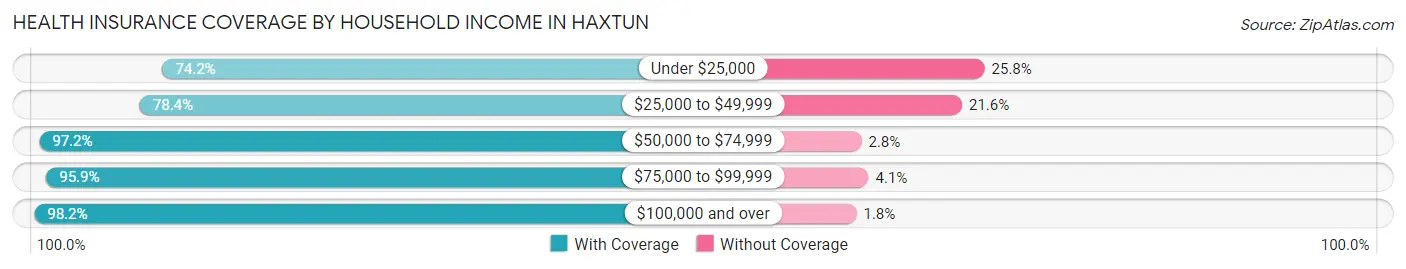
| Household Income | With Coverage | Without Coverage |
| Under $25,000 | 181 (74.2%) | 63 (25.8%) |
| $25,000 to $49,999 | 98 (78.4%) | 27 (21.6%) |
| $50,000 to $74,999 | 141 (97.2%) | 4 (2.8%) |
| $75,000 to $99,999 | 94 (95.9%) | 4 (4.1%) |
| $100,000 and over | 269 (98.2%) | 5 (1.8%) |
Public vs Private Health Insurance Coverage by Age in Haxtun
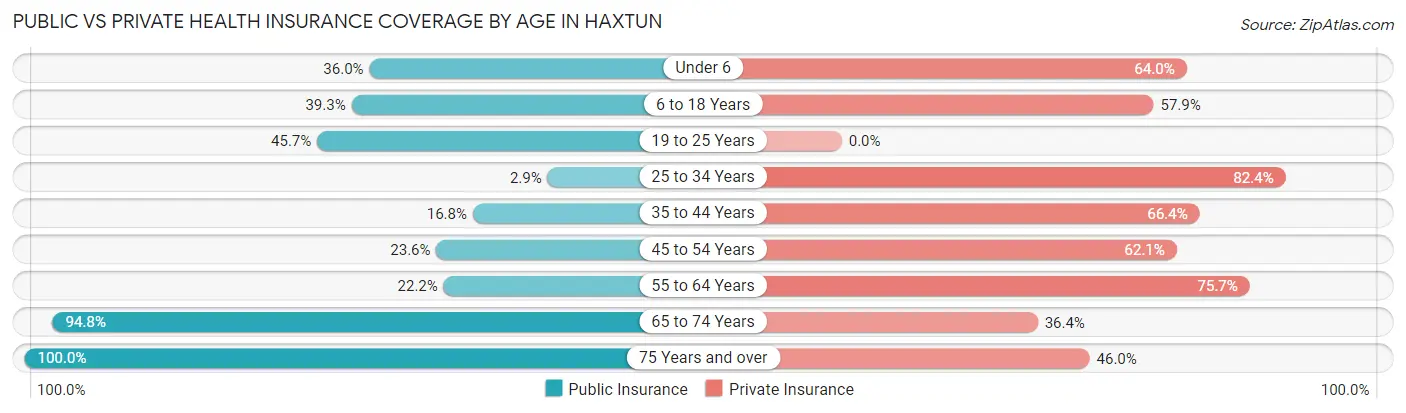
| Age Bracket | Public Insurance | Private Insurance |
| Under 6 | 9 (36.0%) | 16 (64.0%) |
| 6 to 18 Years | 70 (39.3%) | 103 (57.9%) |
| 19 to 25 Years | 16 (45.7%) | 0 (0.0%) |
| 25 to 34 Years | 2 (2.9%) | 56 (82.4%) |
| 35 to 44 Years | 20 (16.8%) | 79 (66.4%) |
| 45 to 54 Years | 33 (23.6%) | 87 (62.1%) |
| 55 to 64 Years | 32 (22.2%) | 109 (75.7%) |
| 65 to 74 Years | 73 (94.8%) | 28 (36.4%) |
| 75 Years and over | 100 (100.0%) | 46 (46.0%) |
| Total | 355 (40.1%) | 524 (59.1%) |
Disability Status by Sex by Age in Haxtun
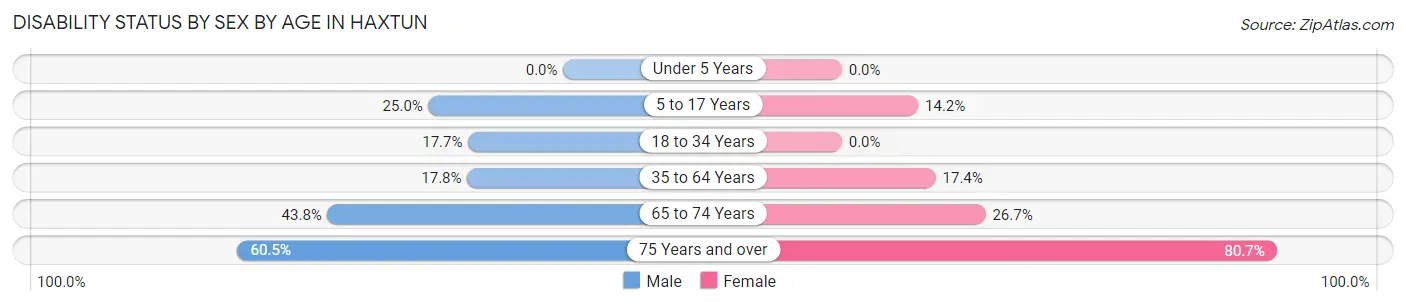
| Age Bracket | Male | Female |
| Under 5 Years | 0 (0.0%) | 0 (0.0%) |
| 5 to 17 Years | 9 (25.0%) | 18 (14.2%) |
| 18 to 34 Years | 9 (17.6%) | 0 (0.0%) |
| 35 to 64 Years | 36 (17.8%) | 35 (17.4%) |
| 65 to 74 Years | 14 (43.8%) | 12 (26.7%) |
| 75 Years and over | 26 (60.5%) | 46 (80.7%) |
Disability Class by Sex by Age in Haxtun
Disability Class: Hearing Difficulty
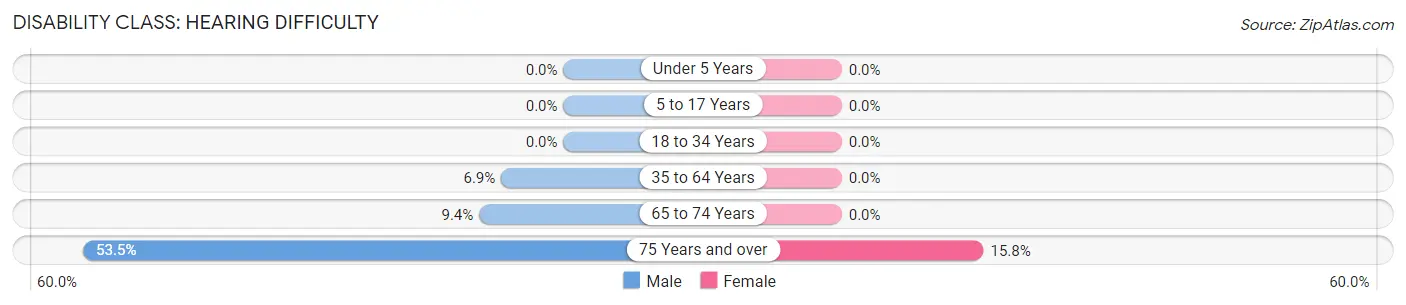
| Age Bracket | Male | Female |
| Under 5 Years | 0 (0.0%) | 0 (0.0%) |
| 5 to 17 Years | 0 (0.0%) | 0 (0.0%) |
| 18 to 34 Years | 0 (0.0%) | 0 (0.0%) |
| 35 to 64 Years | 14 (6.9%) | 0 (0.0%) |
| 65 to 74 Years | 3 (9.4%) | 0 (0.0%) |
| 75 Years and over | 23 (53.5%) | 9 (15.8%) |
Disability Class: Vision Difficulty
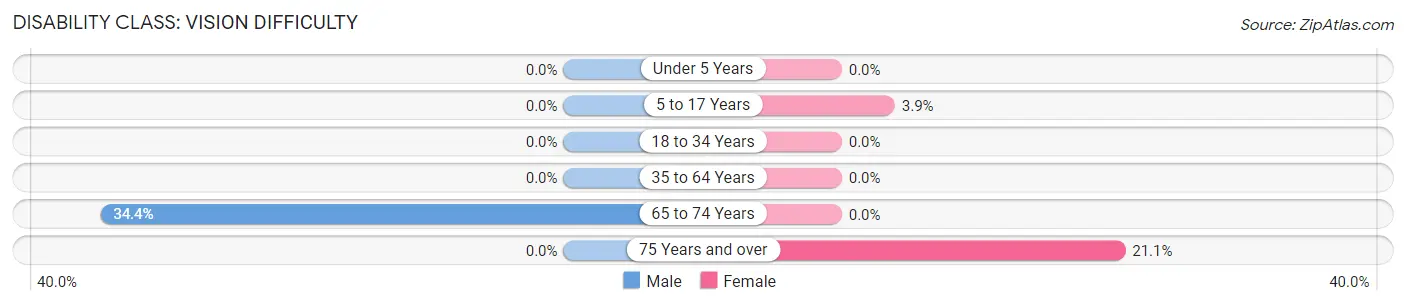
| Age Bracket | Male | Female |
| Under 5 Years | 0 (0.0%) | 0 (0.0%) |
| 5 to 17 Years | 0 (0.0%) | 5 (3.9%) |
| 18 to 34 Years | 0 (0.0%) | 0 (0.0%) |
| 35 to 64 Years | 0 (0.0%) | 0 (0.0%) |
| 65 to 74 Years | 11 (34.4%) | 0 (0.0%) |
| 75 Years and over | 0 (0.0%) | 12 (21.0%) |
Disability Class: Cognitive Difficulty
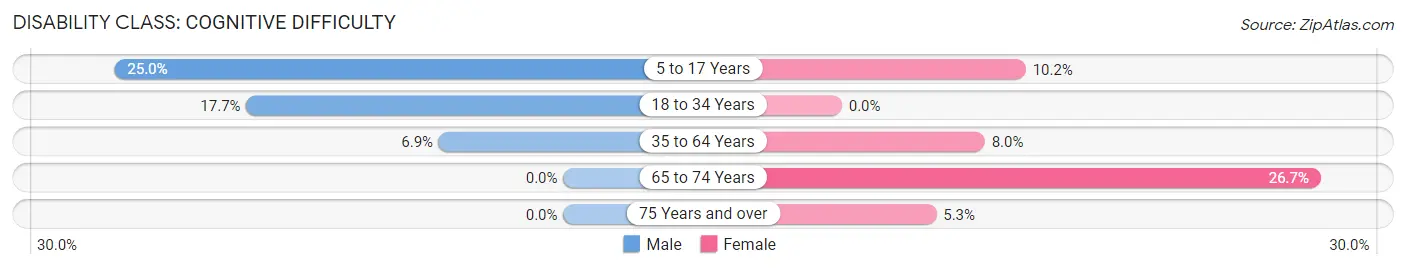
| Age Bracket | Male | Female |
| 5 to 17 Years | 9 (25.0%) | 13 (10.2%) |
| 18 to 34 Years | 9 (17.6%) | 0 (0.0%) |
| 35 to 64 Years | 14 (6.9%) | 16 (8.0%) |
| 65 to 74 Years | 0 (0.0%) | 12 (26.7%) |
| 75 Years and over | 0 (0.0%) | 3 (5.3%) |
Disability Class: Ambulatory Difficulty
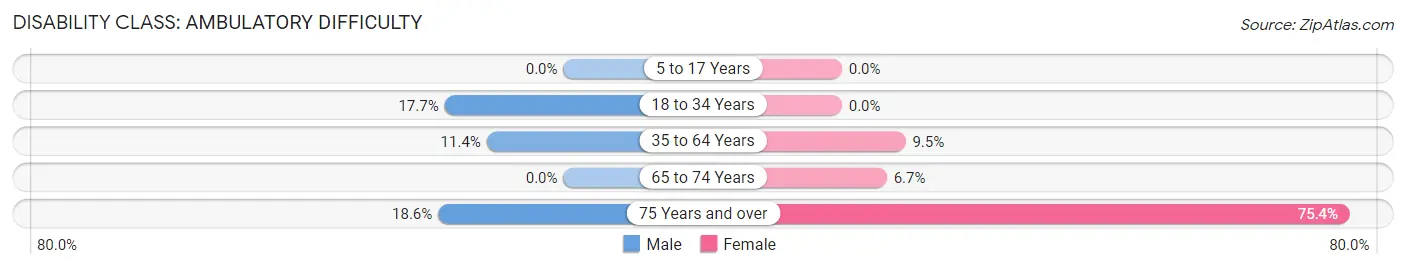
| Age Bracket | Male | Female |
| 5 to 17 Years | 0 (0.0%) | 0 (0.0%) |
| 18 to 34 Years | 9 (17.6%) | 0 (0.0%) |
| 35 to 64 Years | 23 (11.4%) | 19 (9.5%) |
| 65 to 74 Years | 0 (0.0%) | 3 (6.7%) |
| 75 Years and over | 8 (18.6%) | 43 (75.4%) |
Disability Class: Self-Care Difficulty
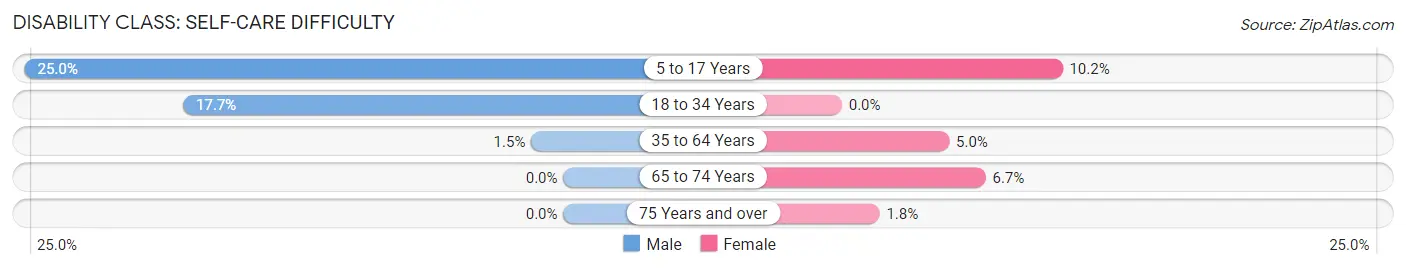
| Age Bracket | Male | Female |
| 5 to 17 Years | 9 (25.0%) | 13 (10.2%) |
| 18 to 34 Years | 9 (17.6%) | 0 (0.0%) |
| 35 to 64 Years | 3 (1.5%) | 10 (5.0%) |
| 65 to 74 Years | 0 (0.0%) | 3 (6.7%) |
| 75 Years and over | 0 (0.0%) | 1 (1.8%) |
Technology Access in Haxtun
Computing Device Access in Haxtun
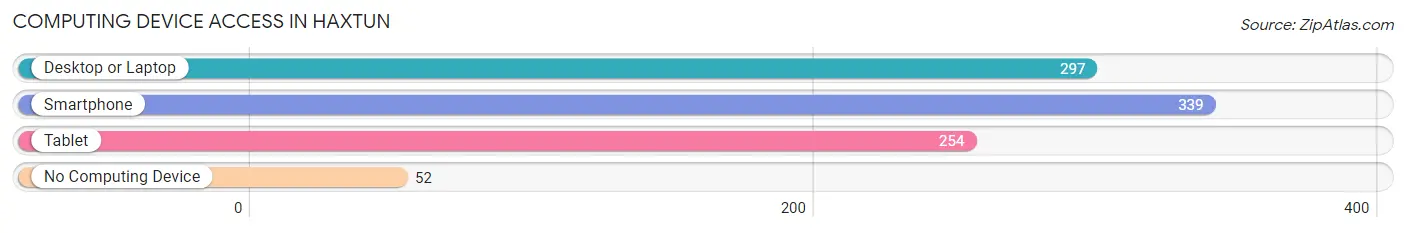
| Device Type | # Households | % Households |
| Desktop or Laptop | 297 | 72.4% |
| Smartphone | 339 | 82.7% |
| Tablet | 254 | 62.0% |
| No Computing Device | 52 | 12.7% |
| Total | 410 | 100.0% |
Internet Access in Haxtun
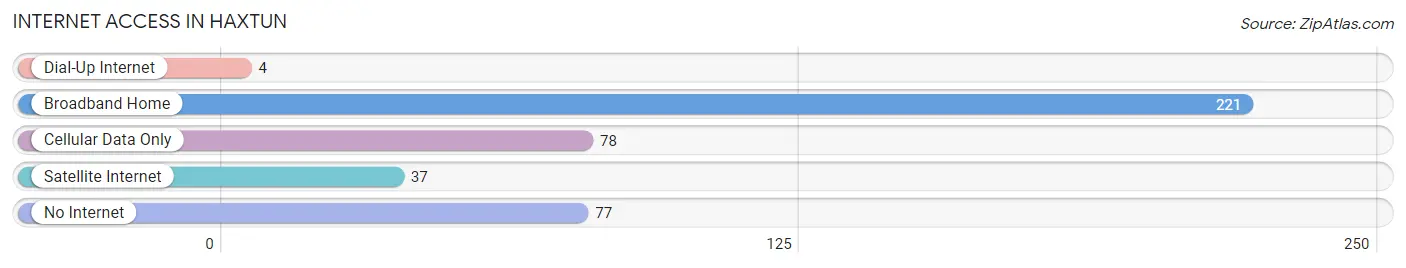
| Internet Type | # Households | % Households |
| Dial-Up Internet | 4 | 1.0% |
| Broadband Home | 221 | 53.9% |
| Cellular Data Only | 78 | 19.0% |
| Satellite Internet | 37 | 9.0% |
| No Internet | 77 | 18.8% |
| Total | 410 | 100.0% |
Haxtun Summary
Haxtun is a small town located in Phillips County, Colorado, United States. The town is situated in the northeastern part of the state, approximately 50 miles east of the state capital of Denver. As of the 2010 census, the population of Haxtun was 1,082.
History
Haxtun was founded in 1887 by a group of settlers from Nebraska. The town was named after a local rancher, John Haxtun, who had a homestead in the area. The town was incorporated in 1891 and quickly grew to become a thriving agricultural community. The town was home to a variety of businesses, including a bank, a hotel, a newspaper, and a variety of stores.
Geography
Haxtun is located at 40°45'17"N 102°17'45"W (40.754722, -102.295833). The town is situated in the northeastern part of the state, approximately 50 miles east of the state capital of Denver. The town is located in the High Plains region of Colorado, and is surrounded by rolling hills and prairies. The town is located at an elevation of 4,092 feet above sea level.
Economy
Haxtun’s economy is largely based on agriculture. The town is home to a variety of farms, including wheat, corn, and alfalfa. The town is also home to a variety of businesses, including a bank, a hotel, a newspaper, and a variety of stores. The town is also home to a variety of manufacturing businesses, including a furniture factory and a grain elevator.
Demographics
As of the 2010 census, the population of Haxtun was 1,082. The town has a total area of 0.9 square miles, all of which is land. The racial makeup of the town was 97.2% White, 0.3% African American, 0.3% Native American, 0.3% Asian, 0.2% from other races, and 1.7% from two or more races. Hispanic or Latino of any race were 1.7% of the population.
Haxtun is home to a variety of religious denominations, including Catholic, Lutheran, Methodist, and Presbyterian. The town is also home to a variety of educational institutions, including a public elementary school, a public middle school, and a public high school. The town is also home to a variety of recreational activities, including a golf course, a swimming pool, and a variety of parks.
Common Questions
What is Per Capita Income in Haxtun?
Per Capita income in Haxtun is $30,537.
What is the Median Family Income in Haxtun?
Median Family Income in Haxtun is $82,917.
What is the Median Household income in Haxtun?
Median Household Income in Haxtun is $50,500.
What is Income or Wage Gap in Haxtun?
Income or Wage Gap in Haxtun is 40.3%.
Women in Haxtun earn 59.7 cents for every dollar earned by a man.
What is Inequality or Gini Index in Haxtun?
Inequality or Gini Index in Haxtun is 0.47.
What is the Total Population of Haxtun?
Total Population of Haxtun is 917.
What is the Total Male Population of Haxtun?
Total Male Population of Haxtun is 379.
What is the Total Female Population of Haxtun?
Total Female Population of Haxtun is 538.
What is the Ratio of Males per 100 Females in Haxtun?
There are 70.45 Males per 100 Females in Haxtun.
What is the Ratio of Females per 100 Males in Haxtun?
There are 141.95 Females per 100 Males in Haxtun.
What is the Median Population Age in Haxtun?
Median Population Age in Haxtun is 46.7 Years.
What is the Average Family Size in Haxtun
Average Family Size in Haxtun is 3.1 People.
What is the Average Household Size in Haxtun
Average Household Size in Haxtun is 2.2 People.
How Large is the Labor Force in Haxtun?
There are 447 People in the Labor Forcein in Haxtun.
What is the Percentage of People in the Labor Force in Haxtun?
61.1% of People are in the Labor Force in Haxtun.
What is the Unemployment Rate in Haxtun?
Unemployment Rate in Haxtun is 4.9%.