Gunnison, CO Map & Demographics
Gunnison Map
Gunnison Overview
$31,563
PER CAPITA INCOME
$87,712
AVG FAMILY INCOME
$63,229
AVG HOUSEHOLD INCOME
9.3%
WAGE / INCOME GAP [ % ]
90.7¢/ $1
WAGE / INCOME GAP [ $ ]
0.40
INEQUALITY / GINI INDEX
6,629
TOTAL POPULATION
3,597
MALE POPULATION
3,032
FEMALE POPULATION
118.63
MALES / 100 FEMALES
84.29
FEMALES / 100 MALES
24.9
MEDIAN AGE
2.5
AVG FAMILY SIZE
1.9
AVG HOUSEHOLD SIZE
4,554
LABOR FORCE [ PEOPLE ]
77.8%
PERCENT IN LABOR FORCE
4.8%
UNEMPLOYMENT RATE
Gunnison Zip Codes
Gunnison Area Codes
Income in Gunnison
Income Overview in Gunnison
Per Capita Income in Gunnison is $31,563, while median incomes of families and households are $87,712 and $63,229 respectively.
| Characteristic | Number | Measure |
| Per Capita Income | 6,629 | $31,563 |
| Median Family Income | 1,239 | $87,712 |
| Mean Family Income | 1,239 | $94,949 |
| Median Household Income | 3,034 | $63,229 |
| Mean Household Income | 3,034 | $70,653 |
| Income Deficit | 1,239 | $0 |
| Wage / Income Gap (%) | 6,629 | 9.27% |
| Wage / Income Gap ($) | 6,629 | 90.73¢ per $1 |
| Gini / Inequality Index | 6,629 | 0.40 |
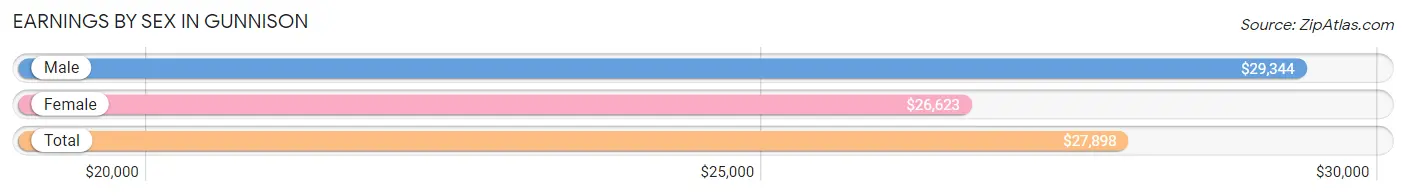
Earnings by Sex in Gunnison
Average Earnings in Gunnison are $27,898, $29,344 for men and $26,623 for women, a difference of 9.3%.
| Sex | Number | Average Earnings |
| Male | 2,704 (55.4%) | $29,344 |
| Female | 2,179 (44.6%) | $26,623 |
| Total | 4,883 (100.0%) | $27,898 |
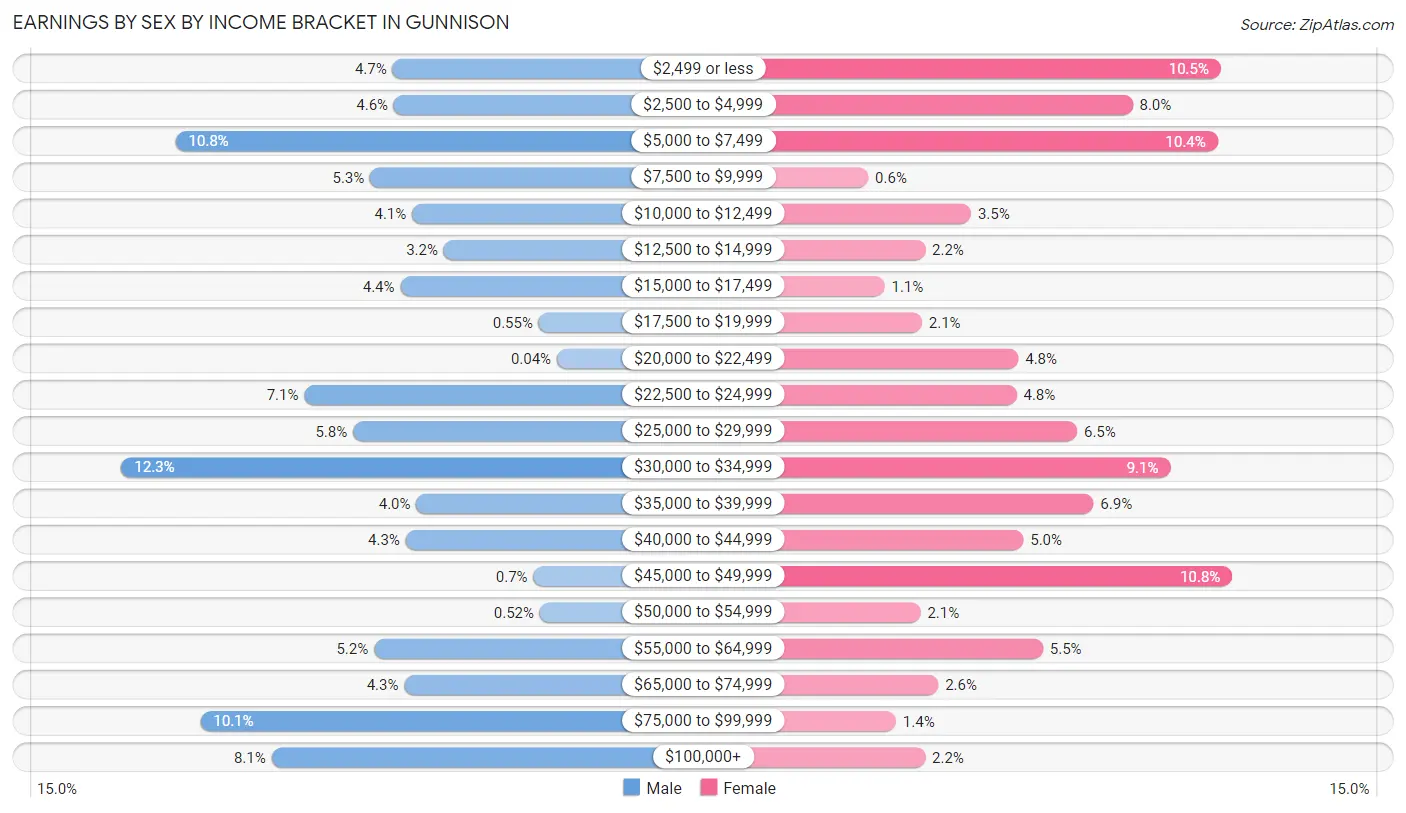
Earnings by Sex by Income Bracket in Gunnison
The most common earnings brackets in Gunnison are $30,000 to $34,999 for men (332 | 12.3%) and $45,000 to $49,999 for women (236 | 10.8%).
| Income | Male | Female |
| $2,499 or less | 126 (4.7%) | 229 (10.5%) |
| $2,500 to $4,999 | 125 (4.6%) | 175 (8.0%) |
| $5,000 to $7,499 | 291 (10.8%) | 227 (10.4%) |
| $7,500 to $9,999 | 143 (5.3%) | 13 (0.6%) |
| $10,000 to $12,499 | 111 (4.1%) | 76 (3.5%) |
| $12,500 to $14,999 | 87 (3.2%) | 48 (2.2%) |
| $15,000 to $17,499 | 120 (4.4%) | 23 (1.1%) |
| $17,500 to $19,999 | 15 (0.5%) | 46 (2.1%) |
| $20,000 to $22,499 | 1 (0.0%) | 105 (4.8%) |
| $22,500 to $24,999 | 193 (7.1%) | 104 (4.8%) |
| $25,000 to $29,999 | 156 (5.8%) | 141 (6.5%) |
| $30,000 to $34,999 | 332 (12.3%) | 198 (9.1%) |
| $35,000 to $39,999 | 108 (4.0%) | 151 (6.9%) |
| $40,000 to $44,999 | 116 (4.3%) | 108 (5.0%) |
| $45,000 to $49,999 | 19 (0.7%) | 236 (10.8%) |
| $50,000 to $54,999 | 14 (0.5%) | 45 (2.1%) |
| $55,000 to $64,999 | 140 (5.2%) | 120 (5.5%) |
| $65,000 to $74,999 | 117 (4.3%) | 56 (2.6%) |
| $75,000 to $99,999 | 272 (10.1%) | 30 (1.4%) |
| $100,000+ | 218 (8.1%) | 48 (2.2%) |
| Total | 2,704 (100.0%) | 2,179 (100.0%) |
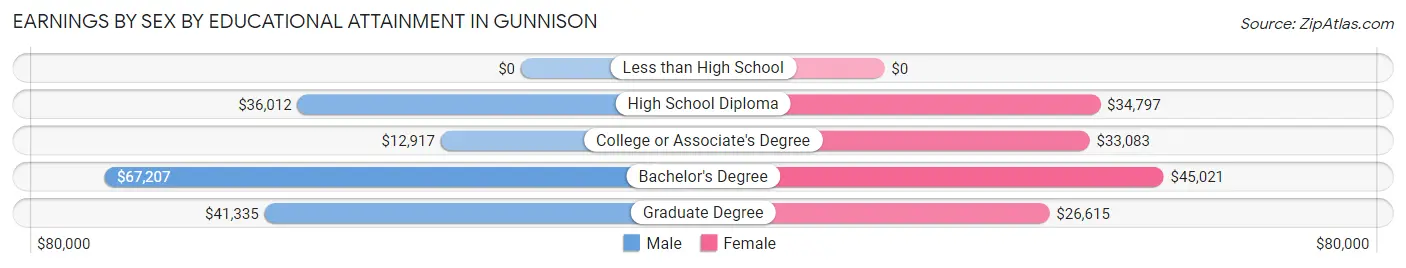
Earnings by Sex by Educational Attainment in Gunnison
Average earnings in Gunnison are $41,591 for men and $38,958 for women, a difference of 6.3%. Men with an educational attainment of bachelor's degree enjoy the highest average annual earnings of $67,207, while those with college or associate's degree education earn the least with $12,917. Women with an educational attainment of bachelor's degree earn the most with the average annual earnings of $45,021, while those with graduate degree education have the smallest earnings of $26,615.
| Educational Attainment | Male Income | Female Income |
| Less than High School | - | - |
| High School Diploma | $36,012 | $34,797 |
| College or Associate's Degree | $12,917 | $33,083 |
| Bachelor's Degree | $67,207 | $45,021 |
| Graduate Degree | $41,335 | $26,615 |
| Total | $41,591 | $38,958 |
Family Income in Gunnison
Family Income Brackets in Gunnison
According to the Gunnison family income data, there are 339 families falling into the $100,000 to $149,999 income range, which is the most common income bracket and makes up 27.4% of all families. Conversely, the $15,000 to $24,999 income bracket is the least frequent group with only 24 families (1.9%) belonging to this category.
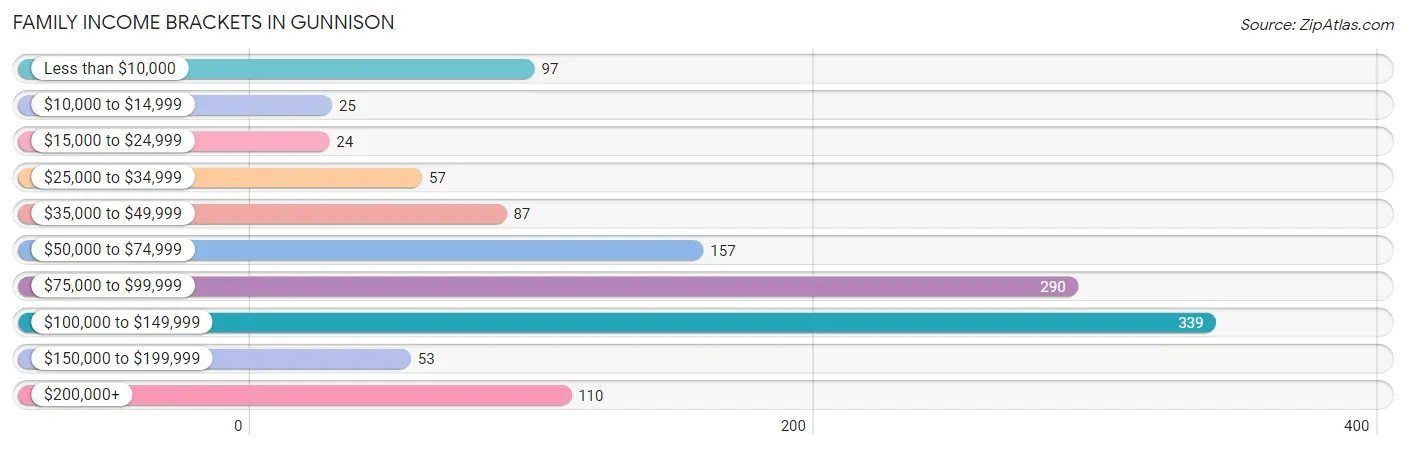
| Income Bracket | # Families | % Families |
| Less than $10,000 | 97 | 7.8% |
| $10,000 to $14,999 | 25 | 2.0% |
| $15,000 to $24,999 | 24 | 1.9% |
| $25,000 to $34,999 | 57 | 4.6% |
| $35,000 to $49,999 | 87 | 7.0% |
| $50,000 to $74,999 | 157 | 12.7% |
| $75,000 to $99,999 | 290 | 23.4% |
| $100,000 to $149,999 | 339 | 27.4% |
| $150,000 to $199,999 | 53 | 4.3% |
| $200,000+ | 110 | 8.9% |
Family Income by Famaliy Size in Gunnison
4-person families (79 | 6.4%) account for the highest median family income in Gunnison with $93,527 per family, while 2-person families (700 | 56.5%) have the highest median income of $44,292 per family member.
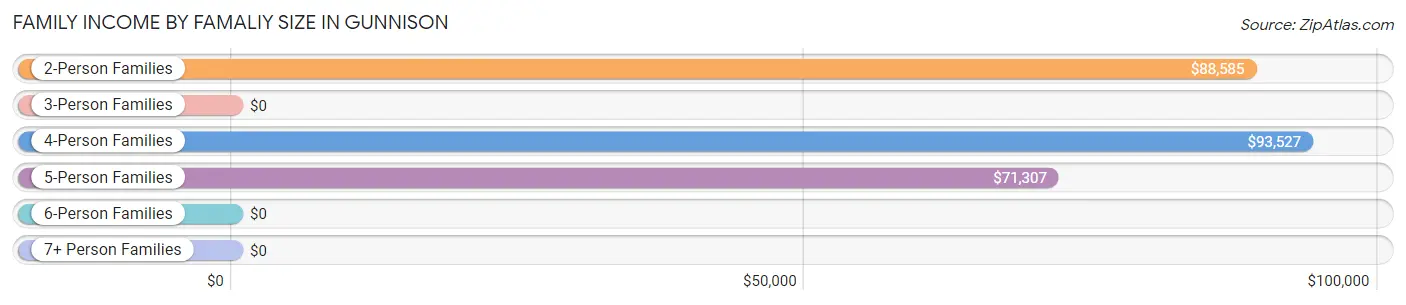
| Income Bracket | # Families | Median Income |
| 2-Person Families | 700 (56.5%) | $88,585 |
| 3-Person Families | 373 (30.1%) | $0 |
| 4-Person Families | 79 (6.4%) | $93,527 |
| 5-Person Families | 87 (7.0%) | $71,307 |
| 6-Person Families | 0 (0.0%) | $0 |
| 7+ Person Families | 0 (0.0%) | $0 |
| Total | 1,239 (100.0%) | $87,712 |
Family Income by Number of Earners in Gunnison
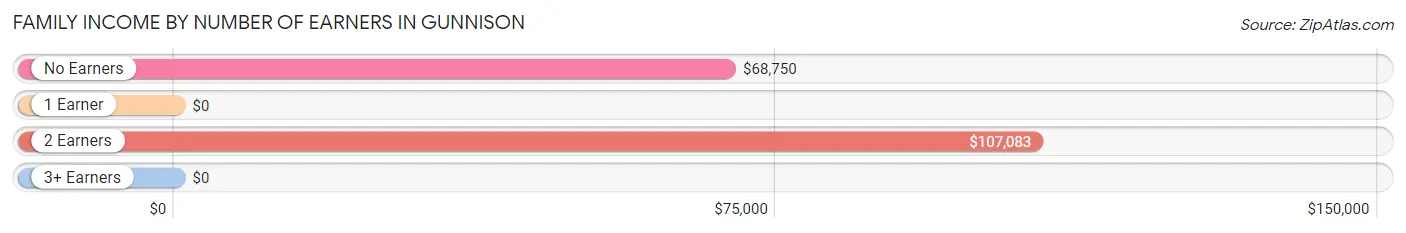
| Number of Earners | # Families | Median Income |
| No Earners | 119 (9.6%) | $68,750 |
| 1 Earner | 315 (25.4%) | $0 |
| 2 Earners | 764 (61.7%) | $107,083 |
| 3+ Earners | 41 (3.3%) | $0 |
| Total | 1,239 (100.0%) | $87,712 |
Household Income in Gunnison
Household Income Brackets in Gunnison
With 573 households falling in the category, the $50,000 to $74,999 income range is the most frequent in Gunnison, accounting for 18.9% of all households. In contrast, only 64 households (2.1%) fall into the $10,000 to $14,999 income bracket, making it the least populous group.
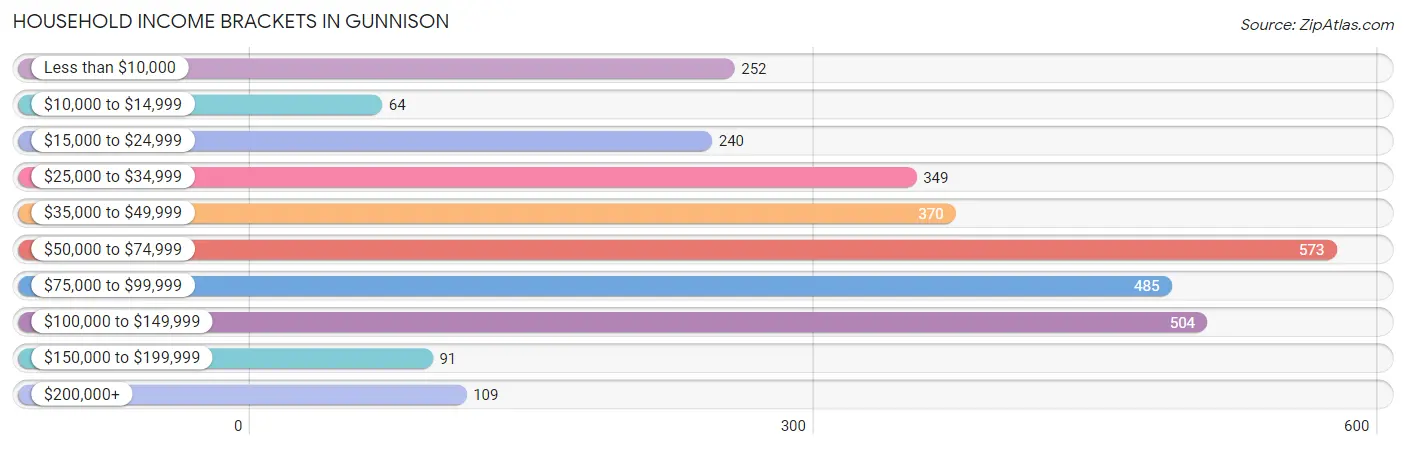
| Income Bracket | # Households | % Households |
| Less than $10,000 | 252 | 8.3% |
| $10,000 to $14,999 | 64 | 2.1% |
| $15,000 to $24,999 | 240 | 7.9% |
| $25,000 to $34,999 | 349 | 11.5% |
| $35,000 to $49,999 | 370 | 12.2% |
| $50,000 to $74,999 | 573 | 18.9% |
| $75,000 to $99,999 | 485 | 16.0% |
| $100,000 to $149,999 | 504 | 16.6% |
| $150,000 to $199,999 | 91 | 3.0% |
| $200,000+ | 109 | 3.6% |
Household Income by Householder Age in Gunnison
The median household income in Gunnison is $63,229, with the highest median household income of $93,304 found in the 45 to 64 years age bracket for the primary householder. A total of 392 households (12.9%) fall into this category. Meanwhile, the 65+ years age bracket for the primary householder has the lowest median household income of $40,769, with 504 households (16.6%) in this group.
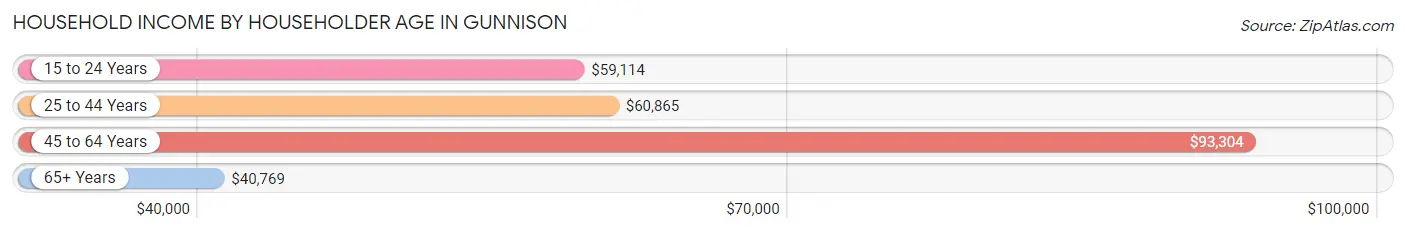
| Income Bracket | # Households | Median Income |
| 15 to 24 Years | 893 (29.4%) | $59,114 |
| 25 to 44 Years | 1,245 (41.0%) | $60,865 |
| 45 to 64 Years | 392 (12.9%) | $93,304 |
| 65+ Years | 504 (16.6%) | $40,769 |
| Total | 3,034 (100.0%) | $63,229 |
Poverty in Gunnison
Income Below Poverty by Sex and Age in Gunnison
With 19.7% poverty level for males and 21.6% for females among the residents of Gunnison, 16 and 17 year old males and 18 to 24 year old females are the most vulnerable to poverty, with 48 males (100.0%) and 351 females (54.2%) in their respective age groups living below the poverty level.
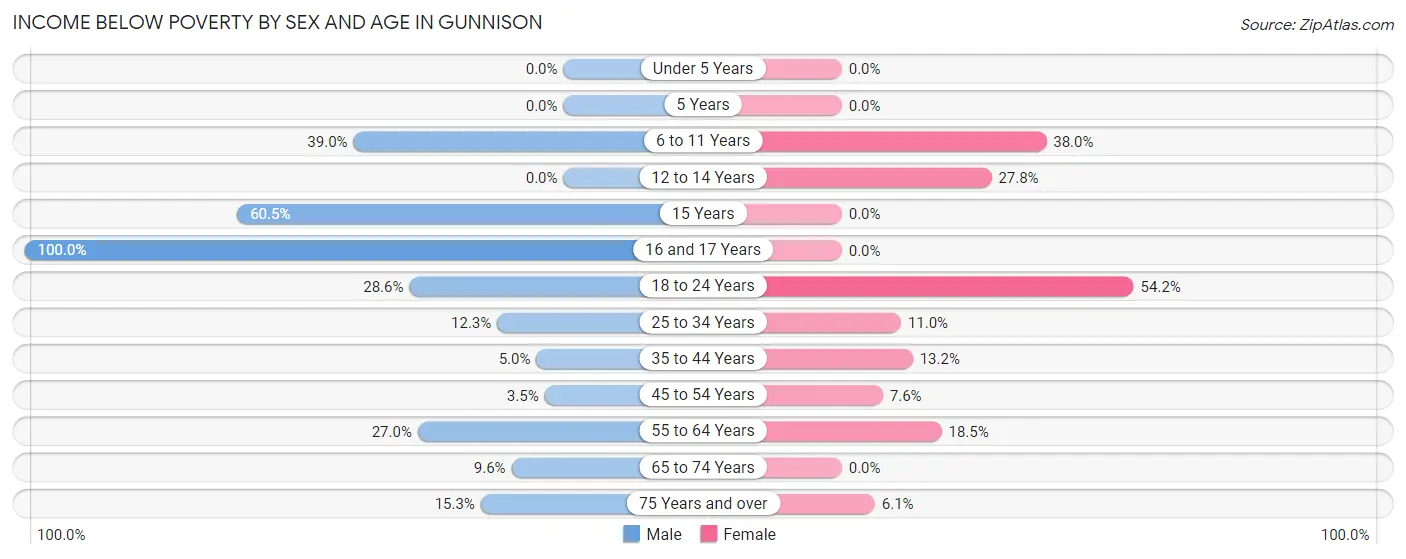
| Age Bracket | Male | Female |
| Under 5 Years | 0 (0.0%) | 0 (0.0%) |
| 5 Years | 0 (0.0%) | 0 (0.0%) |
| 6 to 11 Years | 53 (39.0%) | 63 (38.0%) |
| 12 to 14 Years | 0 (0.0%) | 10 (27.8%) |
| 15 Years | 23 (60.5%) | 0 (0.0%) |
| 16 and 17 Years | 48 (100.0%) | 0 (0.0%) |
| 18 to 24 Years | 316 (28.6%) | 351 (54.2%) |
| 25 to 34 Years | 82 (12.3%) | 74 (11.0%) |
| 35 to 44 Years | 13 (5.0%) | 37 (13.2%) |
| 45 to 54 Years | 7 (3.5%) | 16 (7.6%) |
| 55 to 64 Years | 20 (27.0%) | 30 (18.5%) |
| 65 to 74 Years | 18 (9.6%) | 0 (0.0%) |
| 75 Years and over | 25 (15.3%) | 7 (6.1%) |
| Total | 605 (19.7%) | 588 (21.6%) |
Income Above Poverty by Sex and Age in Gunnison
According to the poverty statistics in Gunnison, males aged under 5 years and females aged under 5 years are the age groups that are most secure financially, with 100.0% of males and 100.0% of females in these age groups living above the poverty line.
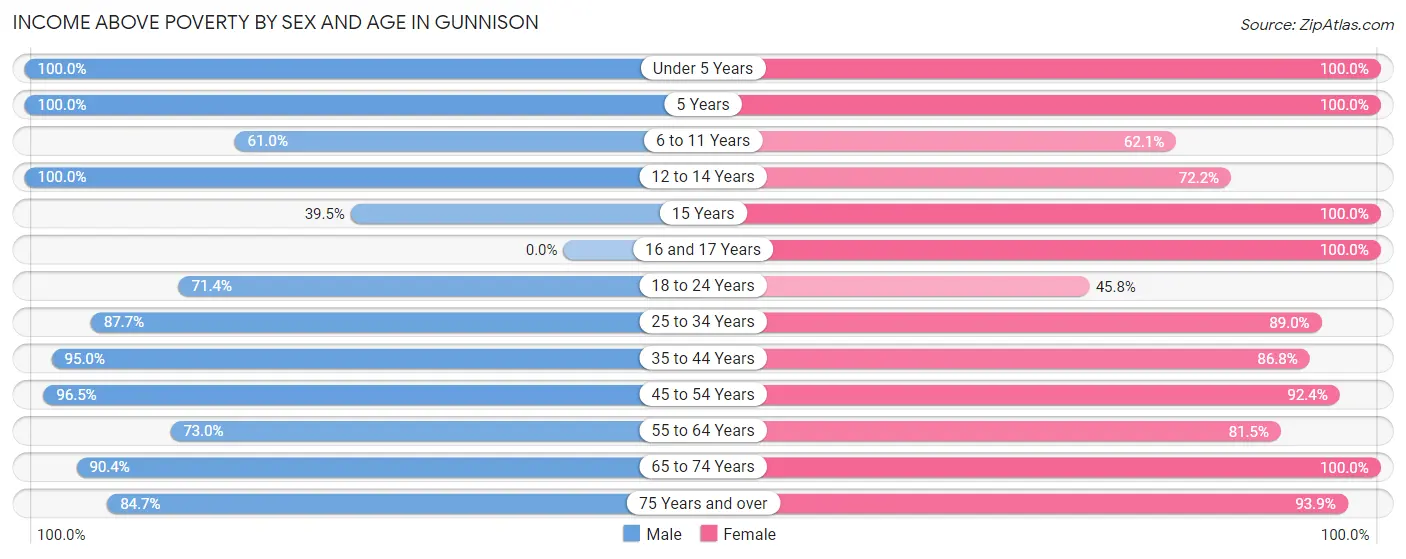
| Age Bracket | Male | Female |
| Under 5 Years | 102 (100.0%) | 76 (100.0%) |
| 5 Years | 12 (100.0%) | 58 (100.0%) |
| 6 to 11 Years | 83 (61.0%) | 103 (62.1%) |
| 12 to 14 Years | 78 (100.0%) | 26 (72.2%) |
| 15 Years | 15 (39.5%) | 17 (100.0%) |
| 16 and 17 Years | 0 (0.0%) | 77 (100.0%) |
| 18 to 24 Years | 789 (71.4%) | 297 (45.8%) |
| 25 to 34 Years | 585 (87.7%) | 600 (89.0%) |
| 35 to 44 Years | 246 (95.0%) | 244 (86.8%) |
| 45 to 54 Years | 193 (96.5%) | 194 (92.4%) |
| 55 to 64 Years | 54 (73.0%) | 132 (81.5%) |
| 65 to 74 Years | 169 (90.4%) | 197 (100.0%) |
| 75 Years and over | 138 (84.7%) | 107 (93.9%) |
| Total | 2,464 (80.3%) | 2,128 (78.3%) |
Income Below Poverty Among Married-Couple Families in Gunnison
The poverty statistics for married-couple families in Gunnison show that 2.9% or 25 of the total 872 families live below the poverty line. Families with no children have the highest poverty rate of 4.5%, comprising of 25 families. On the other hand, families with 1 or 2 children have the lowest poverty rate of 0.0%, which includes 0 families.
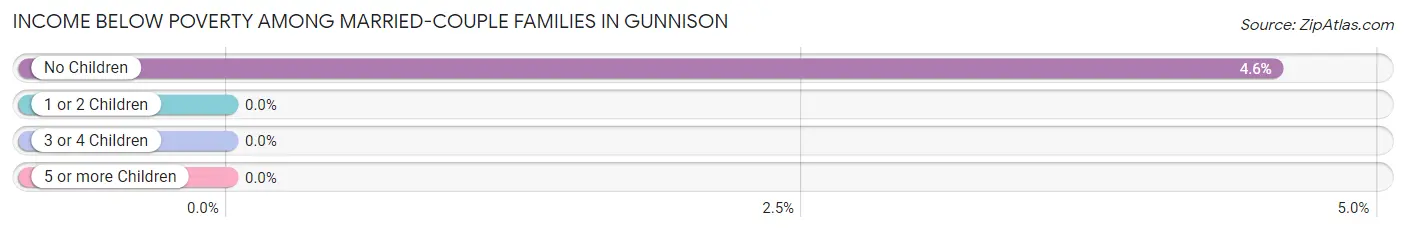
| Children | Above Poverty | Below Poverty |
| No Children | 524 (95.5%) | 25 (4.5%) |
| 1 or 2 Children | 236 (100.0%) | 0 (0.0%) |
| 3 or 4 Children | 87 (100.0%) | 0 (0.0%) |
| 5 or more Children | 0 (0.0%) | 0 (0.0%) |
| Total | 847 (97.1%) | 25 (2.9%) |
Income Below Poverty Among Single-Parent Households in Gunnison
According to the poverty data in Gunnison, 38.1% or 53 single-father households and 26.3% or 60 single-mother households are living below the poverty line. Among single-father households, those with 3 or 4 children have the highest poverty rate, with 13 households (100.0%) experiencing poverty. Likewise, among single-mother households, those with 1 or 2 children have the highest poverty rate, with 53 households (41.4%) falling below the poverty line.
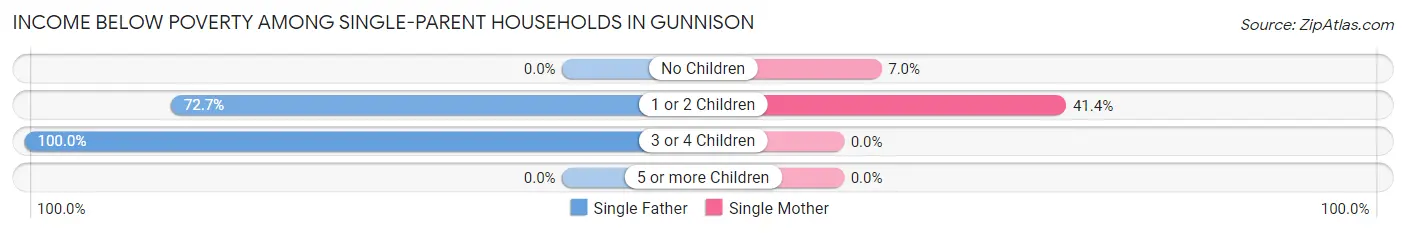
| Children | Single Father | Single Mother |
| No Children | 0 (0.0%) | 7 (7.0%) |
| 1 or 2 Children | 40 (72.7%) | 53 (41.4%) |
| 3 or 4 Children | 13 (100.0%) | 0 (0.0%) |
| 5 or more Children | 0 (0.0%) | 0 (0.0%) |
| Total | 53 (38.1%) | 60 (26.3%) |
Income Below Poverty Among Married-Couple vs Single-Parent Households in Gunnison
The poverty data for Gunnison shows that 25 of the married-couple family households (2.9%) and 113 of the single-parent households (30.8%) are living below the poverty level. Within the married-couple family households, those with no children have the highest poverty rate, with 25 households (4.5%) falling below the poverty line. Among the single-parent households, those with 3 or 4 children have the highest poverty rate, with 13 household (100.0%) living below poverty.
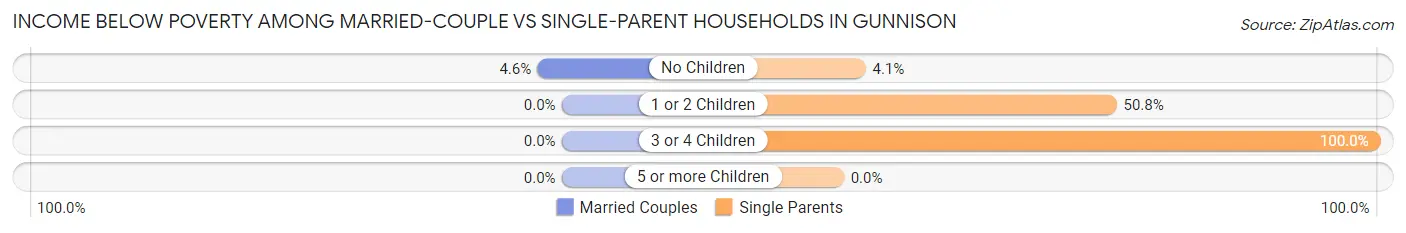
| Children | Married-Couple Families | Single-Parent Households |
| No Children | 25 (4.5%) | 7 (4.1%) |
| 1 or 2 Children | 0 (0.0%) | 93 (50.8%) |
| 3 or 4 Children | 0 (0.0%) | 13 (100.0%) |
| 5 or more Children | 0 (0.0%) | 0 (0.0%) |
| Total | 25 (2.9%) | 113 (30.8%) |
Race in Gunnison
The most populous races in Gunnison are White / Caucasian (5,741 | 86.6%), Hispanic or Latino (792 | 11.9%), and Two or more Races (577 | 8.7%).
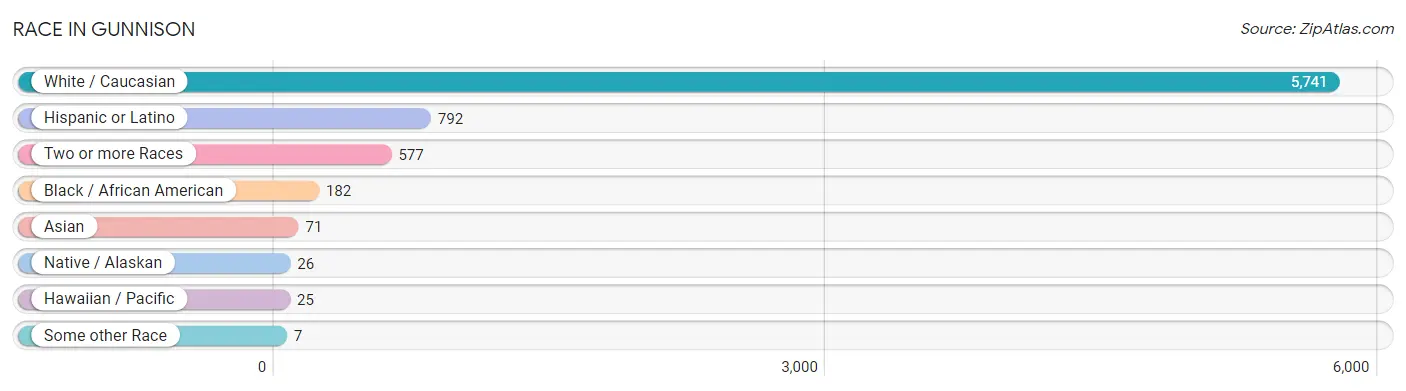
| Race | # Population | % Population |
| Asian | 71 | 1.1% |
| Black / African American | 182 | 2.8% |
| Hawaiian / Pacific | 25 | 0.4% |
| Hispanic or Latino | 792 | 11.9% |
| Native / Alaskan | 26 | 0.4% |
| White / Caucasian | 5,741 | 86.6% |
| Two or more Races | 577 | 8.7% |
| Some other Race | 7 | 0.1% |
| Total | 6,629 | 100.0% |
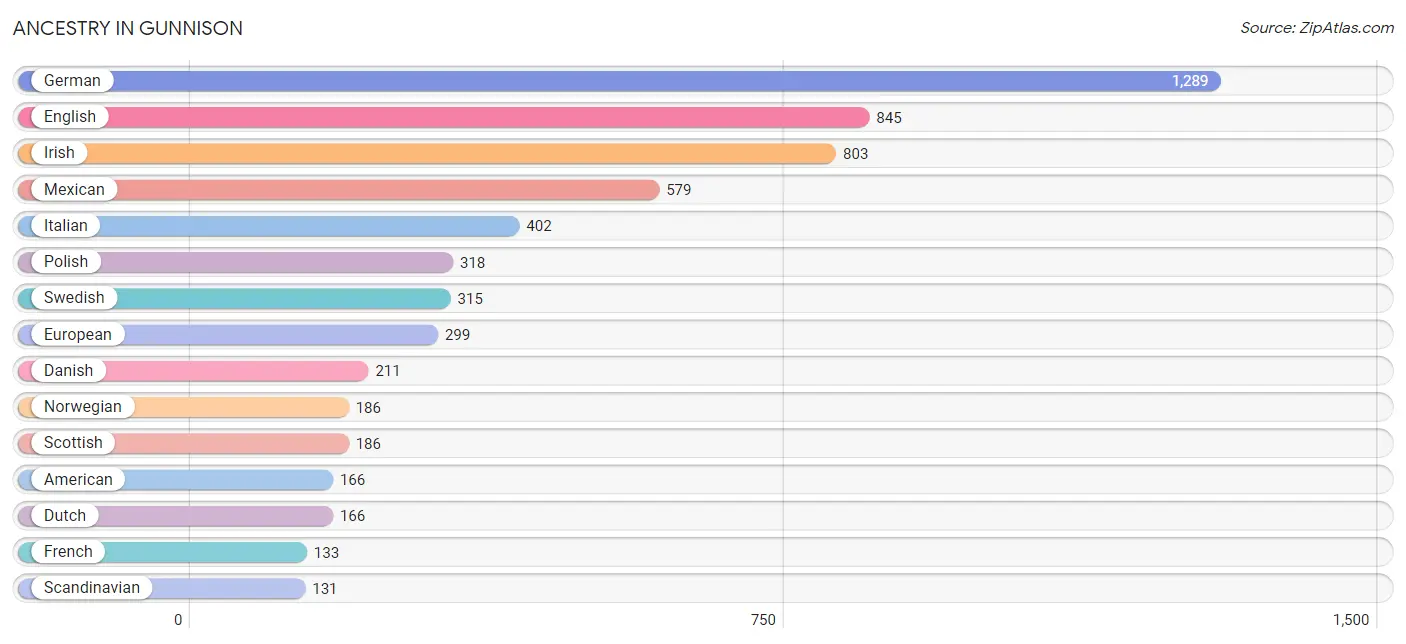
Ancestry in Gunnison
The most populous ancestries reported in Gunnison are German (1,289 | 19.4%), English (845 | 12.8%), Irish (803 | 12.1%), Mexican (579 | 8.7%), and Italian (402 | 6.1%), together accounting for 59.1% of all Gunnison residents.
| Ancestry | # Population | % Population |
| African | 89 | 1.3% |
| American | 166 | 2.5% |
| Argentinean | 47 | 0.7% |
| Armenian | 43 | 0.6% |
| Austrian | 20 | 0.3% |
| Basque | 15 | 0.2% |
| Belgian | 9 | 0.1% |
| Bhutanese | 29 | 0.4% |
| British | 67 | 1.0% |
| Burmese | 9 | 0.1% |
| Canadian | 40 | 0.6% |
| Celtic | 29 | 0.4% |
| Central American | 11 | 0.2% |
| Cherokee | 20 | 0.3% |
| Chilean | 3 | 0.1% |
| Croatian | 7 | 0.1% |
| Crow | 25 | 0.4% |
| Czech | 22 | 0.3% |
| Czechoslovakian | 10 | 0.2% |
| Danish | 211 | 3.2% |
| Dutch | 166 | 2.5% |
| Eastern European | 15 | 0.2% |
| English | 845 | 12.8% |
| European | 299 | 4.5% |
| Finnish | 67 | 1.0% |
| French | 133 | 2.0% |
| French Canadian | 25 | 0.4% |
| German | 1,289 | 19.4% |
| Greek | 4 | 0.1% |
| Honduran | 11 | 0.2% |
| Hungarian | 66 | 1.0% |
| Indian (Asian) | 36 | 0.5% |
| Irish | 803 | 12.1% |
| Italian | 402 | 6.1% |
| Korean | 25 | 0.4% |
| Mexican | 579 | 8.7% |
| Navajo | 19 | 0.3% |
| Northern European | 43 | 0.6% |
| Norwegian | 186 | 2.8% |
| Pakistani | 10 | 0.2% |
| Polish | 318 | 4.8% |
| Russian | 9 | 0.1% |
| Samoan | 50 | 0.7% |
| Scandinavian | 131 | 2.0% |
| Scotch-Irish | 77 | 1.2% |
| Scottish | 186 | 2.8% |
| Sioux | 7 | 0.1% |
| South American | 50 | 0.7% |
| Spaniard | 7 | 0.1% |
| Spanish | 13 | 0.2% |
| Sri Lankan | 25 | 0.4% |
| Subsaharan African | 89 | 1.3% |
| Swedish | 315 | 4.8% |
| Swiss | 111 | 1.7% |
| Turkish | 61 | 0.9% |
| Ukrainian | 11 | 0.2% |
| Welsh | 46 | 0.7% | View All 57 Rows |
Immigrants in Gunnison
The most numerous immigrant groups reported in Gunnison came from Asia (55 | 0.8%), Canada (40 | 0.6%), Latin America (35 | 0.5%), China (30 | 0.4%), and Eastern Asia (30 | 0.4%), together accounting for 2.9% of all Gunnison residents.
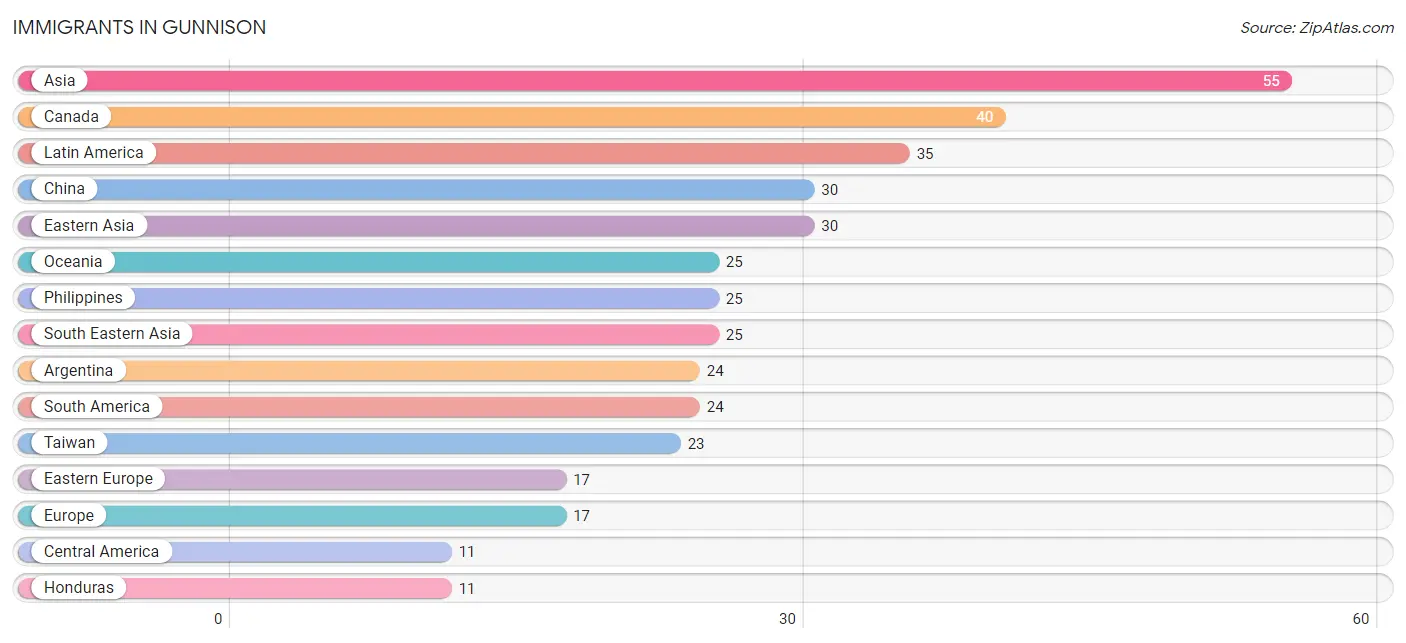
| Immigration Origin | # Population | % Population |
| Argentina | 24 | 0.4% |
| Asia | 55 | 0.8% |
| Canada | 40 | 0.6% |
| Central America | 11 | 0.2% |
| China | 30 | 0.4% |
| Eastern Asia | 30 | 0.4% |
| Eastern Europe | 17 | 0.3% |
| Europe | 17 | 0.3% |
| Honduras | 11 | 0.2% |
| Latin America | 35 | 0.5% |
| Oceania | 25 | 0.4% |
| Philippines | 25 | 0.4% |
| Romania | 8 | 0.1% |
| Russia | 9 | 0.1% |
| South America | 24 | 0.4% |
| South Eastern Asia | 25 | 0.4% |
| Taiwan | 23 | 0.4% | View All 17 Rows |
Sex and Age in Gunnison
Sex and Age in Gunnison
The most populous age groups in Gunnison are 20 to 24 Years (1,134 | 31.5%) for men and 20 to 24 Years (679 | 22.4%) for women.
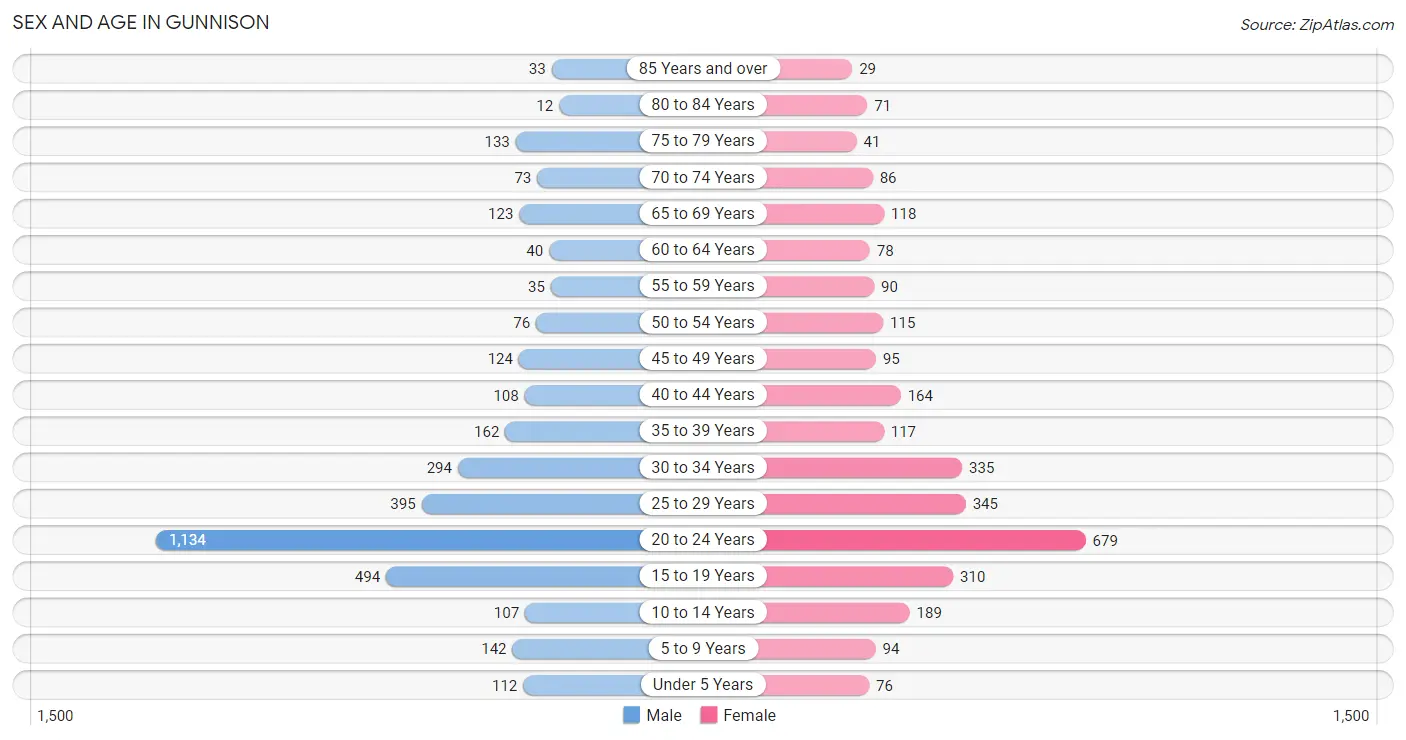
| Age Bracket | Male | Female |
| Under 5 Years | 112 (3.1%) | 76 (2.5%) |
| 5 to 9 Years | 142 (4.0%) | 94 (3.1%) |
| 10 to 14 Years | 107 (3.0%) | 189 (6.2%) |
| 15 to 19 Years | 494 (13.7%) | 310 (10.2%) |
| 20 to 24 Years | 1,134 (31.5%) | 679 (22.4%) |
| 25 to 29 Years | 395 (11.0%) | 345 (11.4%) |
| 30 to 34 Years | 294 (8.2%) | 335 (11.1%) |
| 35 to 39 Years | 162 (4.5%) | 117 (3.9%) |
| 40 to 44 Years | 108 (3.0%) | 164 (5.4%) |
| 45 to 49 Years | 124 (3.5%) | 95 (3.1%) |
| 50 to 54 Years | 76 (2.1%) | 115 (3.8%) |
| 55 to 59 Years | 35 (1.0%) | 90 (3.0%) |
| 60 to 64 Years | 40 (1.1%) | 78 (2.6%) |
| 65 to 69 Years | 123 (3.4%) | 118 (3.9%) |
| 70 to 74 Years | 73 (2.0%) | 86 (2.8%) |
| 75 to 79 Years | 133 (3.7%) | 41 (1.3%) |
| 80 to 84 Years | 12 (0.3%) | 71 (2.3%) |
| 85 Years and over | 33 (0.9%) | 29 (1.0%) |
| Total | 3,597 (100.0%) | 3,032 (100.0%) |
Families and Households in Gunnison
Median Family Size in Gunnison
The median family size in Gunnison is 2.46 persons per family, with married-couple families (872 | 70.4%) accounting for the largest median family size of 2.56 persons per family. On the other hand, single male/father families (139 | 11.2%) represent the smallest median family size with 1.85 persons per family.
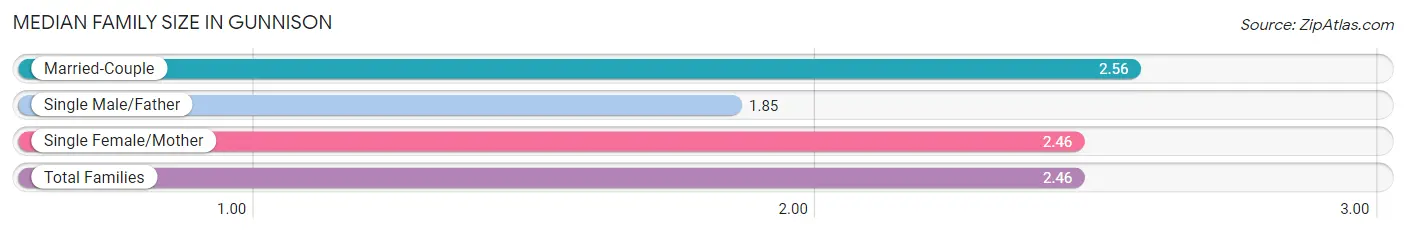
| Family Type | # Families | Family Size |
| Married-Couple | 872 (70.4%) | 2.56 |
| Single Male/Father | 139 (11.2%) | 1.85 |
| Single Female/Mother | 228 (18.4%) | 2.46 |
| Total Families | 1,239 (100.0%) | 2.46 |
Median Household Size in Gunnison
The median household size in Gunnison is 1.92 persons per household, with single male/father households (139 | 4.6%) accounting for the largest median household size of 3.14 persons per household. non-family households (1,795 | 59.2%) represent the smallest median household size with 1.40 persons per household.
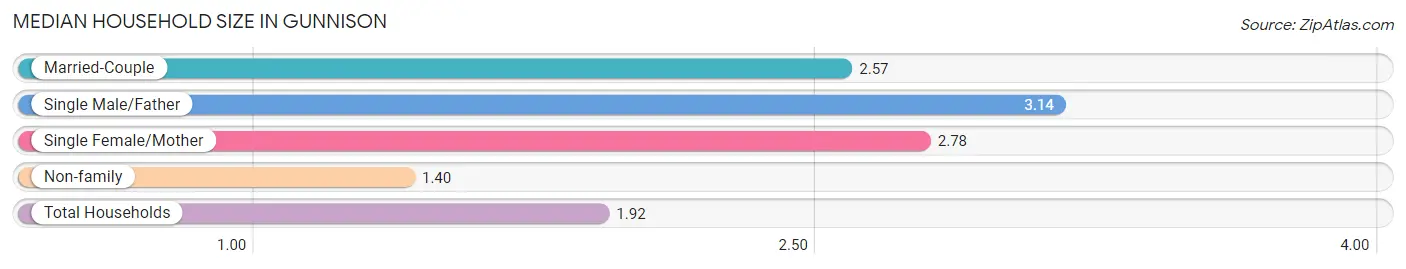
| Household Type | # Households | Household Size |
| Married-Couple | 872 (28.7%) | 2.57 |
| Single Male/Father | 139 (4.6%) | 3.14 |
| Single Female/Mother | 228 (7.5%) | 2.78 |
| Non-family | 1,795 (59.2%) | 1.40 |
| Total Households | 3,034 (100.0%) | 1.92 |
Household Size by Marriage Status in Gunnison
Out of a total of 3,034 households in Gunnison, 1,239 (40.8%) are family households, while 1,795 (59.2%) are nonfamily households. The most numerous type of family households are 2-person households, comprising 601, and the most common type of nonfamily households are 1-person households, comprising 1,027.
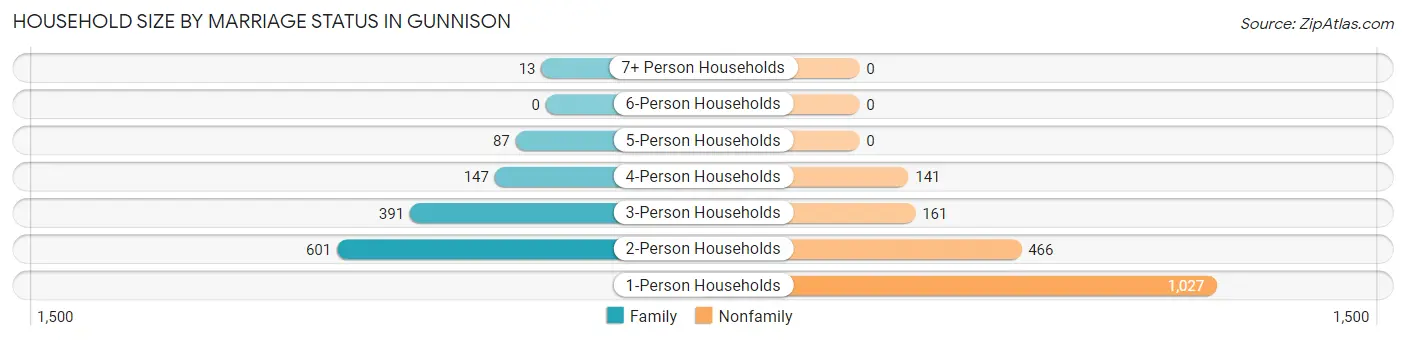
| Household Size | Family Households | Nonfamily Households |
| 1-Person Households | - | 1,027 (33.9%) |
| 2-Person Households | 601 (19.8%) | 466 (15.4%) |
| 3-Person Households | 391 (12.9%) | 161 (5.3%) |
| 4-Person Households | 147 (4.9%) | 141 (4.6%) |
| 5-Person Households | 87 (2.9%) | 0 (0.0%) |
| 6-Person Households | 0 (0.0%) | 0 (0.0%) |
| 7+ Person Households | 13 (0.4%) | 0 (0.0%) |
| Total | 1,239 (40.8%) | 1,795 (59.2%) |
Female Fertility in Gunnison
Fertility by Age in Gunnison
Average fertility rate in Gunnison is 17.0 births per 1,000 women. Women in the age bracket of 20 to 34 years have the highest fertility rate with 26.0 births per 1,000 women. Women in the age bracket of 20 to 34 years acount for 100.0% of all women with births.
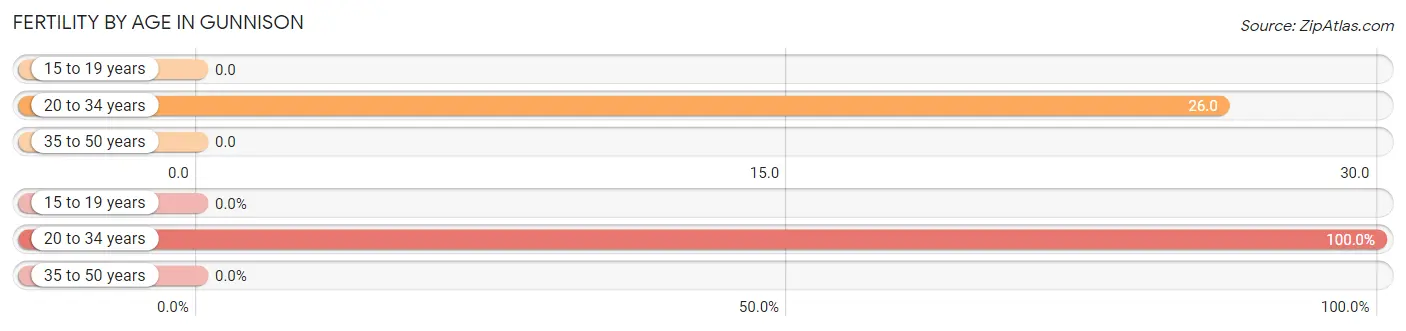
| Age Bracket | Women with Births | Births / 1,000 Women |
| 15 to 19 years | 0 (0.0%) | 0.0 |
| 20 to 34 years | 35 (100.0%) | 26.0 |
| 35 to 50 years | 0 (0.0%) | 0.0 |
| Total | 35 (100.0%) | 17.0 |
Fertility by Age by Marriage Status in Gunnison
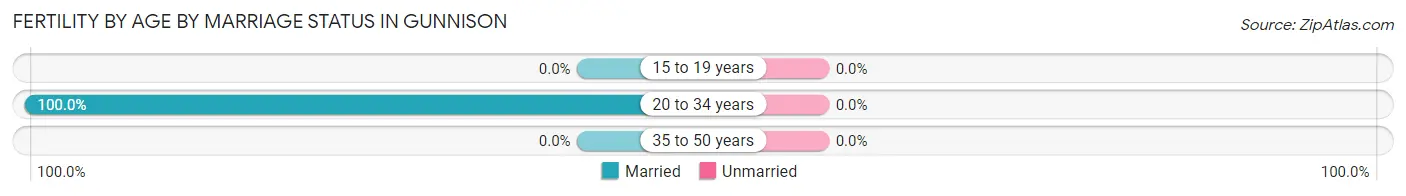
| Age Bracket | Married | Unmarried |
| 15 to 19 years | 0 (0.0%) | 0 (0.0%) |
| 20 to 34 years | 35 (100.0%) | 0 (0.0%) |
| 35 to 50 years | 0 (0.0%) | 0 (0.0%) |
| Total | 35 (100.0%) | 0 (0.0%) |
Fertility by Education in Gunnison
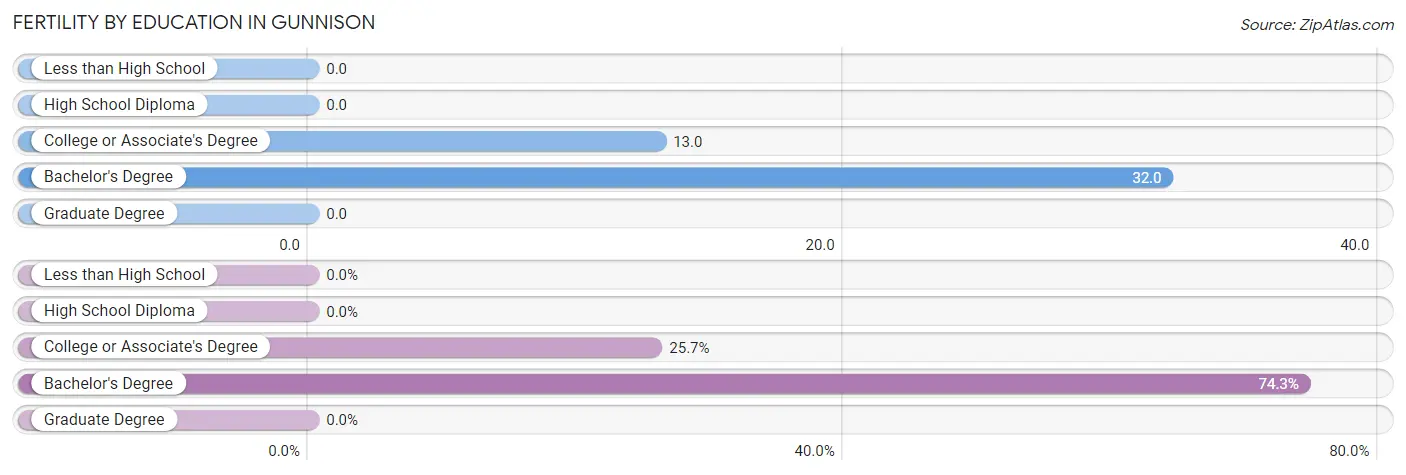
| Educational Attainment | Women with Births | Births / 1,000 Women |
| Less than High School | 0 (0.0%) | 0.0 |
| High School Diploma | 0 (0.0%) | 0.0 |
| College or Associate's Degree | 9 (25.7%) | 13.0 |
| Bachelor's Degree | 26 (74.3%) | 32.0 |
| Graduate Degree | 0 (0.0%) | 0.0 |
| Total | 35 (100.0%) | 17.0 |
Fertility by Education by Marriage Status in Gunnison
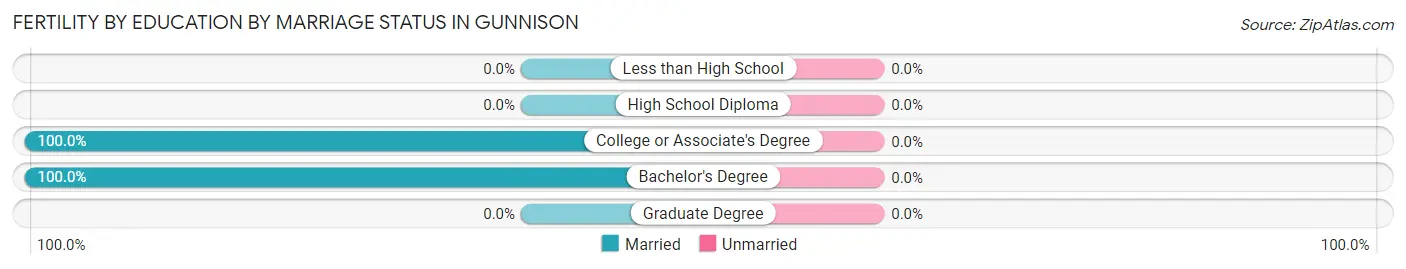
| Educational Attainment | Married | Unmarried |
| Less than High School | 0 (0.0%) | 0 (0.0%) |
| High School Diploma | 0 (0.0%) | 0 (0.0%) |
| College or Associate's Degree | 9 (100.0%) | 0 (0.0%) |
| Bachelor's Degree | 26 (100.0%) | 0 (0.0%) |
| Graduate Degree | 0 (0.0%) | 0 (0.0%) |
| Total | 35 (100.0%) | 0 (0.0%) |
Employment Characteristics in Gunnison
Employment by Class of Employer in Gunnison
Among the 4,110 employed individuals in Gunnison, private company employees (2,699 | 65.7%), self-employed (incorporated) (362 | 8.8%), and not-for-profit organizations (282 | 6.9%) make up the most common classes of employment.
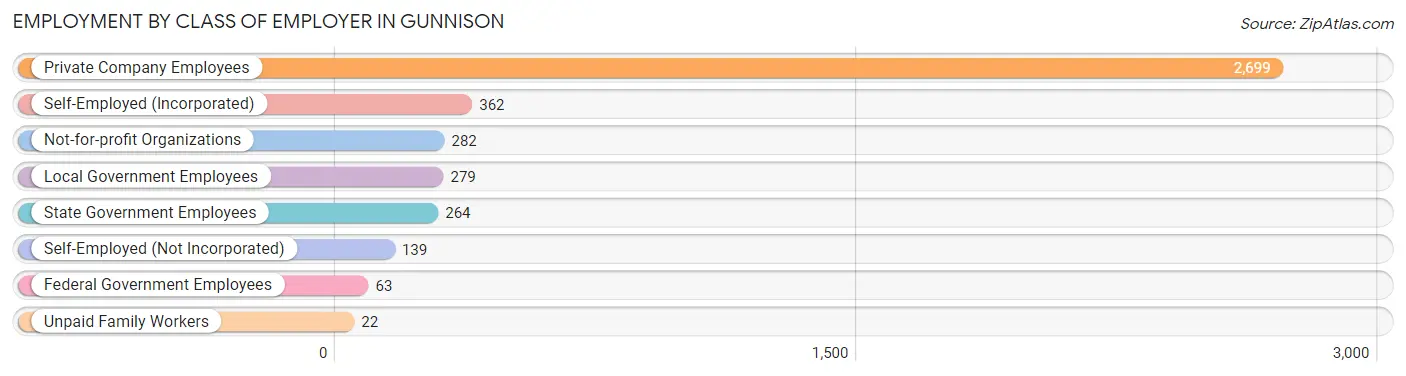
| Employer Class | # Employees | % Employees |
| Private Company Employees | 2,699 | 65.7% |
| Self-Employed (Incorporated) | 362 | 8.8% |
| Self-Employed (Not Incorporated) | 139 | 3.4% |
| Not-for-profit Organizations | 282 | 6.9% |
| Local Government Employees | 279 | 6.8% |
| State Government Employees | 264 | 6.4% |
| Federal Government Employees | 63 | 1.5% |
| Unpaid Family Workers | 22 | 0.5% |
| Total | 4,110 | 100.0% |
Employment Status by Age in Gunnison
According to the labor force statistics for Gunnison, out of the total population over 16 years of age (5,854), 77.8% or 4,554 individuals are in the labor force, with 4.8% or 219 of them unemployed. The age group with the highest labor force participation rate is 30 to 34 years, with 99.8% or 628 individuals in the labor force. Within the labor force, the 16 to 19 years age range has the highest percentage of unemployed individuals, with 28.7% or 87 of them being unemployed.
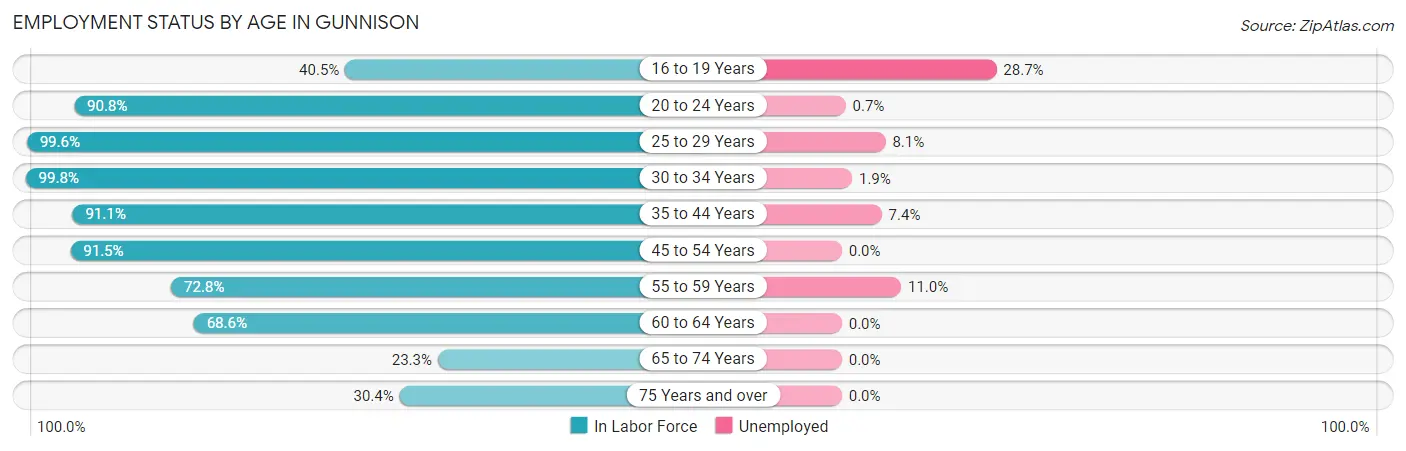
| Age Bracket | In Labor Force | Unemployed |
| 16 to 19 Years | 303 (40.5%) | 87 (28.7%) |
| 20 to 24 Years | 1,646 (90.8%) | 12 (0.7%) |
| 25 to 29 Years | 737 (99.6%) | 60 (8.1%) |
| 30 to 34 Years | 628 (99.8%) | 12 (1.9%) |
| 35 to 44 Years | 502 (91.1%) | 37 (7.4%) |
| 45 to 54 Years | 375 (91.5%) | 0 (0.0%) |
| 55 to 59 Years | 91 (72.8%) | 10 (11.0%) |
| 60 to 64 Years | 81 (68.6%) | 0 (0.0%) |
| 65 to 74 Years | 93 (23.3%) | 0 (0.0%) |
| 75 Years and over | 97 (30.4%) | 0 (0.0%) |
| Total | 4,554 (77.8%) | 219 (4.8%) |
Employment Status by Educational Attainment in Gunnison
According to labor force statistics for Gunnison, 93.8% of individuals (2,413) out of the total population between 25 and 64 years of age (2,573) are in the labor force, with 4.9% or 118 of them being unemployed. The group with the highest labor force participation rate are those with the educational attainment of bachelor's degree or higher, with 95.2% or 1,393 individuals in the labor force. Within the labor force, individuals with college / associate degree education have the highest percentage of unemployment, with 15.7% or 72 of them being unemployed.
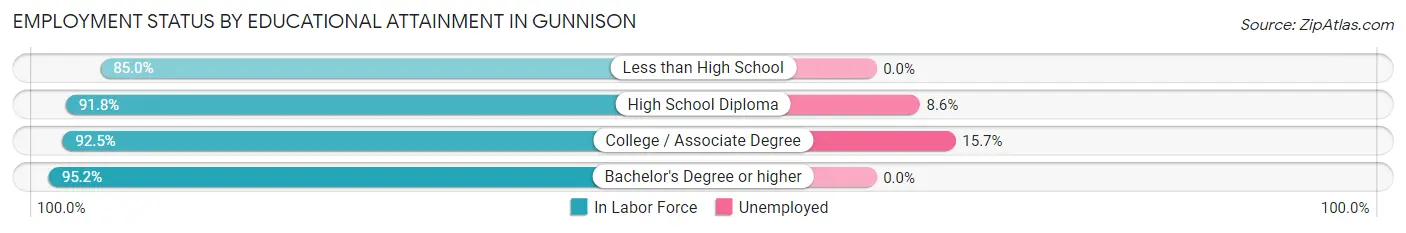
| Educational Attainment | In Labor Force | Unemployed |
| Less than High School | 17 (85.0%) | 0 (0.0%) |
| High School Diploma | 546 (91.8%) | 51 (8.6%) |
| College / Associate Degree | 458 (92.5%) | 78 (15.7%) |
| Bachelor's Degree or higher | 1,393 (95.2%) | 0 (0.0%) |
| Total | 2,413 (93.8%) | 126 (4.9%) |
Employment Occupations by Sex in Gunnison
Management, Business, Science and Arts Occupations
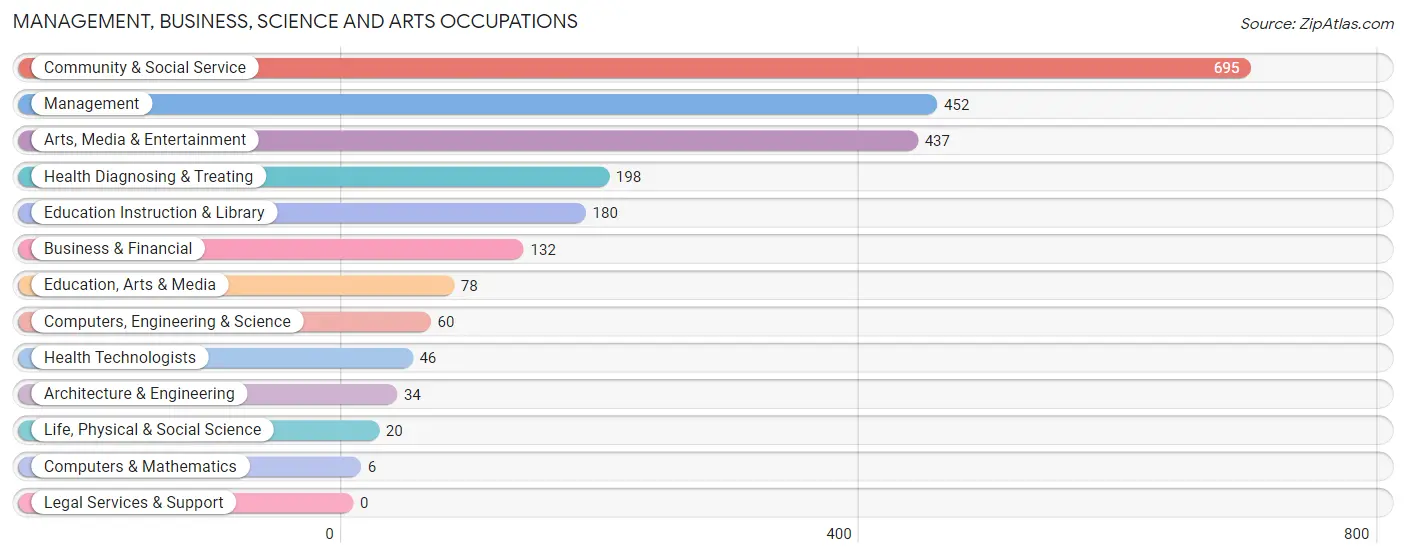
The most common Management, Business, Science and Arts occupations in Gunnison are Community & Social Service (695 | 16.0%), Management (452 | 10.4%), Arts, Media & Entertainment (437 | 10.1%), Health Diagnosing & Treating (198 | 4.6%), and Education Instruction & Library (180 | 4.2%).
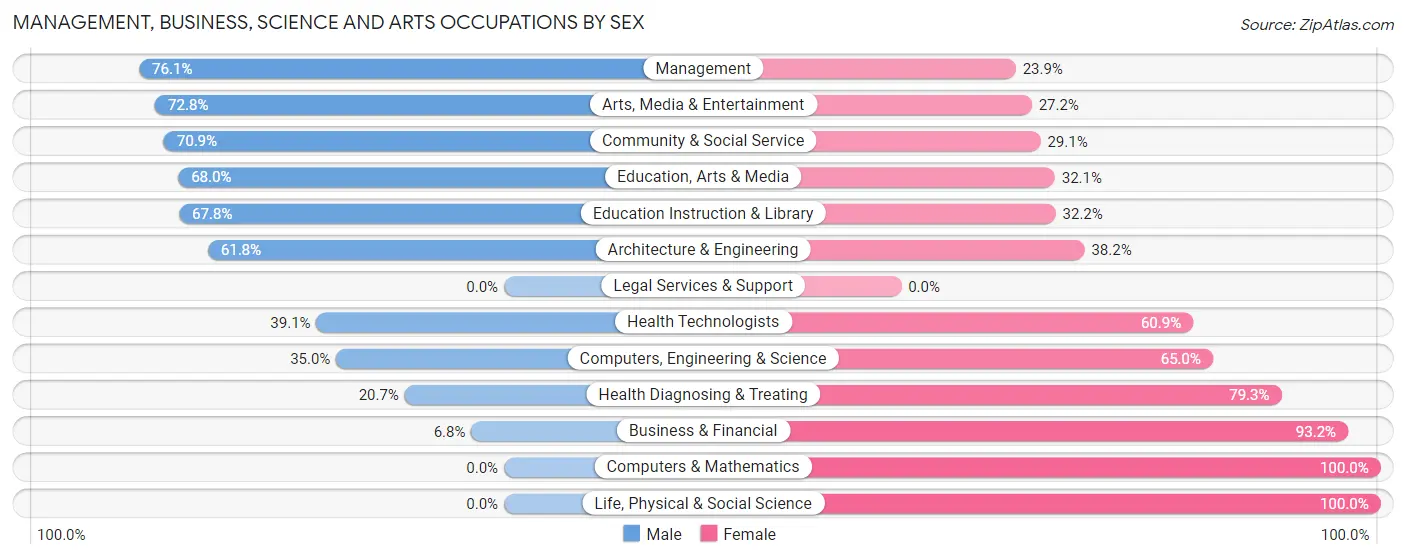
Management, Business, Science and Arts Occupations by Sex
Within the Management, Business, Science and Arts occupations in Gunnison, the most male-oriented occupations are Management (76.1%), Arts, Media & Entertainment (72.8%), and Community & Social Service (70.9%), while the most female-oriented occupations are Computers & Mathematics (100.0%), Life, Physical & Social Science (100.0%), and Business & Financial (93.2%).
| Occupation | Male | Female |
| Management | 344 (76.1%) | 108 (23.9%) |
| Business & Financial | 9 (6.8%) | 123 (93.2%) |
| Computers, Engineering & Science | 21 (35.0%) | 39 (65.0%) |
| Computers & Mathematics | 0 (0.0%) | 6 (100.0%) |
| Architecture & Engineering | 21 (61.8%) | 13 (38.2%) |
| Life, Physical & Social Science | 0 (0.0%) | 20 (100.0%) |
| Community & Social Service | 493 (70.9%) | 202 (29.1%) |
| Education, Arts & Media | 53 (67.9%) | 25 (32.1%) |
| Legal Services & Support | 0 (0.0%) | 0 (0.0%) |
| Education Instruction & Library | 122 (67.8%) | 58 (32.2%) |
| Arts, Media & Entertainment | 318 (72.8%) | 119 (27.2%) |
| Health Diagnosing & Treating | 41 (20.7%) | 157 (79.3%) |
| Health Technologists | 18 (39.1%) | 28 (60.9%) |
| Total (Category) | 908 (59.1%) | 629 (40.9%) |
| Total (Overall) | 2,317 (53.4%) | 2,019 (46.6%) |
Services Occupations
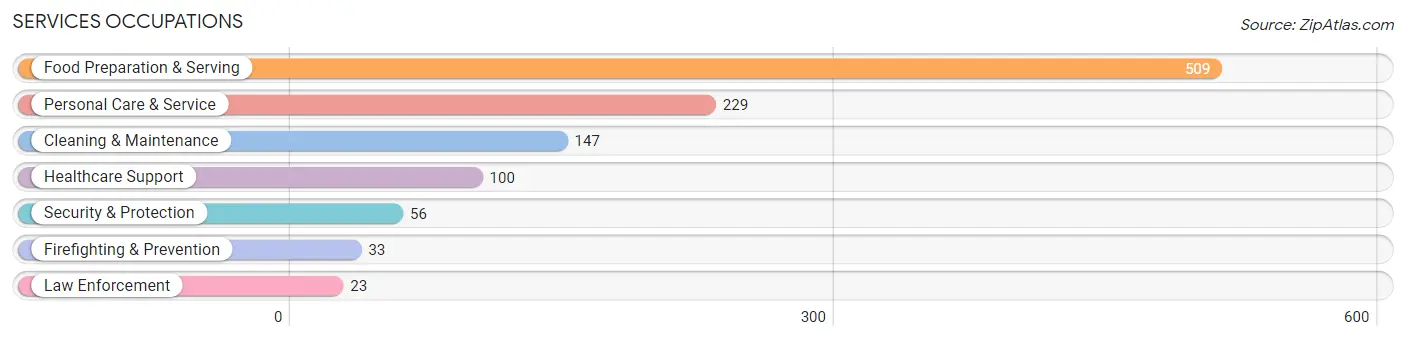
The most common Services occupations in Gunnison are Food Preparation & Serving (509 | 11.7%), Personal Care & Service (229 | 5.3%), Cleaning & Maintenance (147 | 3.4%), Healthcare Support (100 | 2.3%), and Security & Protection (56 | 1.3%).
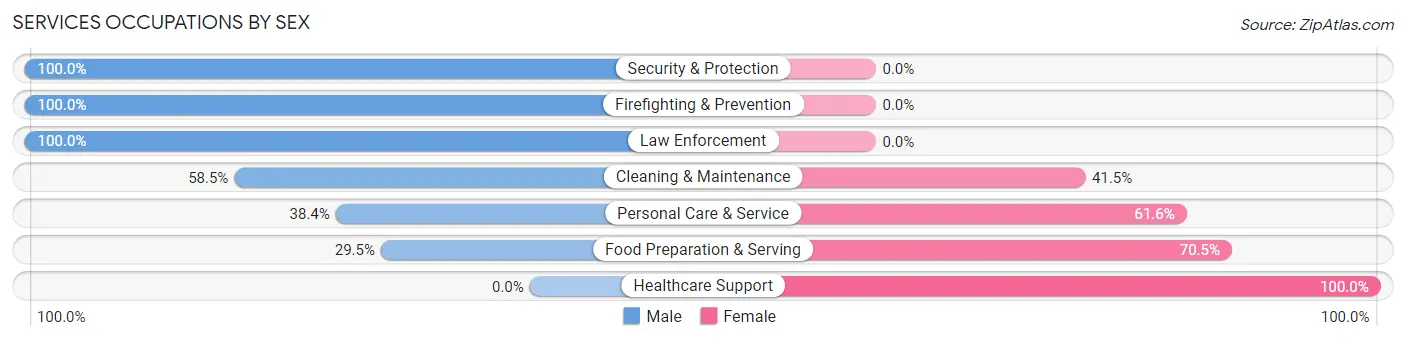
Services Occupations by Sex
Within the Services occupations in Gunnison, the most male-oriented occupations are Security & Protection (100.0%), Firefighting & Prevention (100.0%), and Law Enforcement (100.0%), while the most female-oriented occupations are Healthcare Support (100.0%), Food Preparation & Serving (70.5%), and Personal Care & Service (61.6%).
| Occupation | Male | Female |
| Healthcare Support | 0 (0.0%) | 100 (100.0%) |
| Security & Protection | 56 (100.0%) | 0 (0.0%) |
| Firefighting & Prevention | 33 (100.0%) | 0 (0.0%) |
| Law Enforcement | 23 (100.0%) | 0 (0.0%) |
| Food Preparation & Serving | 150 (29.5%) | 359 (70.5%) |
| Cleaning & Maintenance | 86 (58.5%) | 61 (41.5%) |
| Personal Care & Service | 88 (38.4%) | 141 (61.6%) |
| Total (Category) | 380 (36.5%) | 661 (63.5%) |
| Total (Overall) | 2,317 (53.4%) | 2,019 (46.6%) |
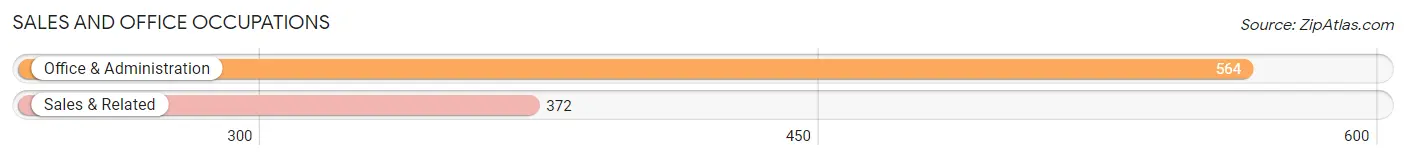
Sales and Office Occupations
The most common Sales and Office occupations in Gunnison are Office & Administration (564 | 13.0%), and Sales & Related (372 | 8.6%).
Sales and Office Occupations by Sex
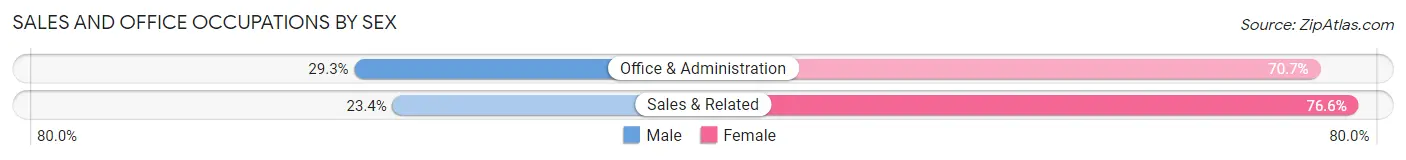
| Occupation | Male | Female |
| Sales & Related | 87 (23.4%) | 285 (76.6%) |
| Office & Administration | 165 (29.3%) | 399 (70.7%) |
| Total (Category) | 252 (26.9%) | 684 (73.1%) |
| Total (Overall) | 2,317 (53.4%) | 2,019 (46.6%) |
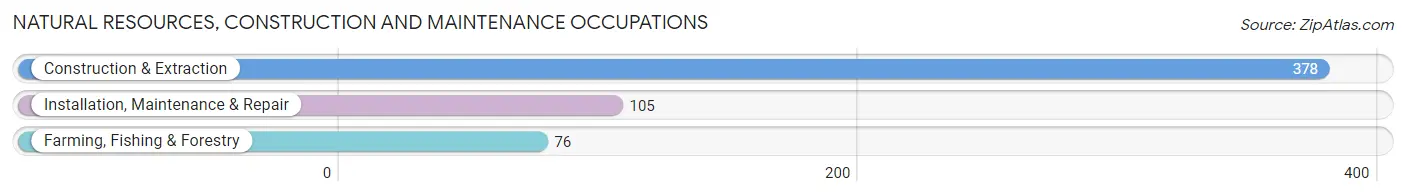
Natural Resources, Construction and Maintenance Occupations
The most common Natural Resources, Construction and Maintenance occupations in Gunnison are Construction & Extraction (378 | 8.7%), Installation, Maintenance & Repair (105 | 2.4%), and Farming, Fishing & Forestry (76 | 1.8%).
Natural Resources, Construction and Maintenance Occupations by Sex
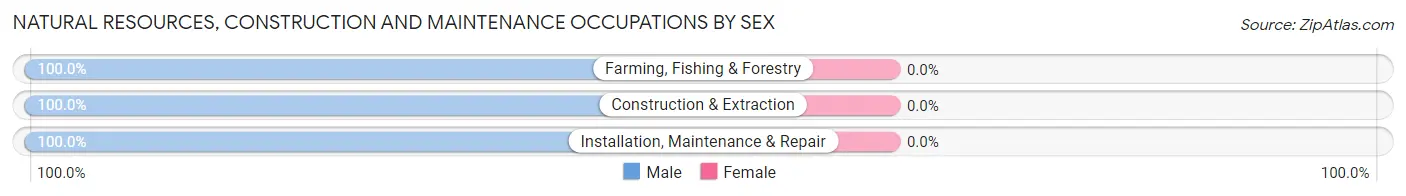
| Occupation | Male | Female |
| Farming, Fishing & Forestry | 76 (100.0%) | 0 (0.0%) |
| Construction & Extraction | 378 (100.0%) | 0 (0.0%) |
| Installation, Maintenance & Repair | 105 (100.0%) | 0 (0.0%) |
| Total (Category) | 559 (100.0%) | 0 (0.0%) |
| Total (Overall) | 2,317 (53.4%) | 2,019 (46.6%) |
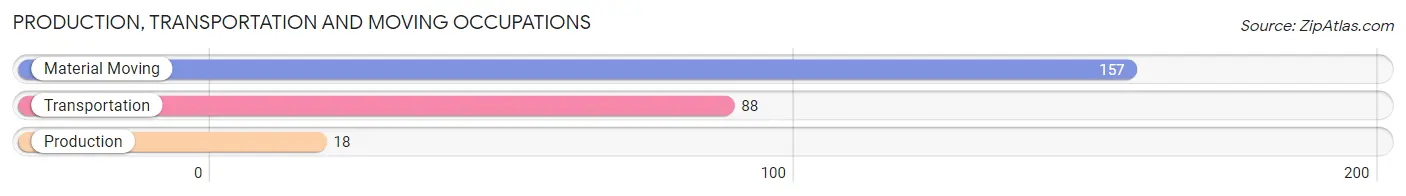
Production, Transportation and Moving Occupations
The most common Production, Transportation and Moving occupations in Gunnison are Material Moving (157 | 3.6%), Transportation (88 | 2.0%), and Production (18 | 0.4%).
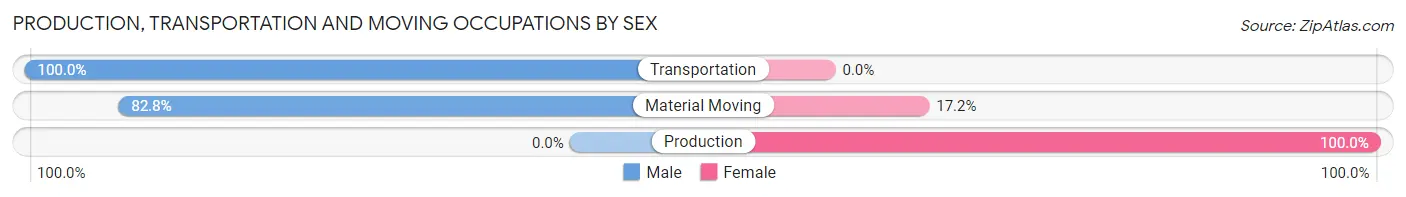
Production, Transportation and Moving Occupations by Sex
| Occupation | Male | Female |
| Production | 0 (0.0%) | 18 (100.0%) |
| Transportation | 88 (100.0%) | 0 (0.0%) |
| Material Moving | 130 (82.8%) | 27 (17.2%) |
| Total (Category) | 218 (82.9%) | 45 (17.1%) |
| Total (Overall) | 2,317 (53.4%) | 2,019 (46.6%) |
Employment Industries by Sex in Gunnison
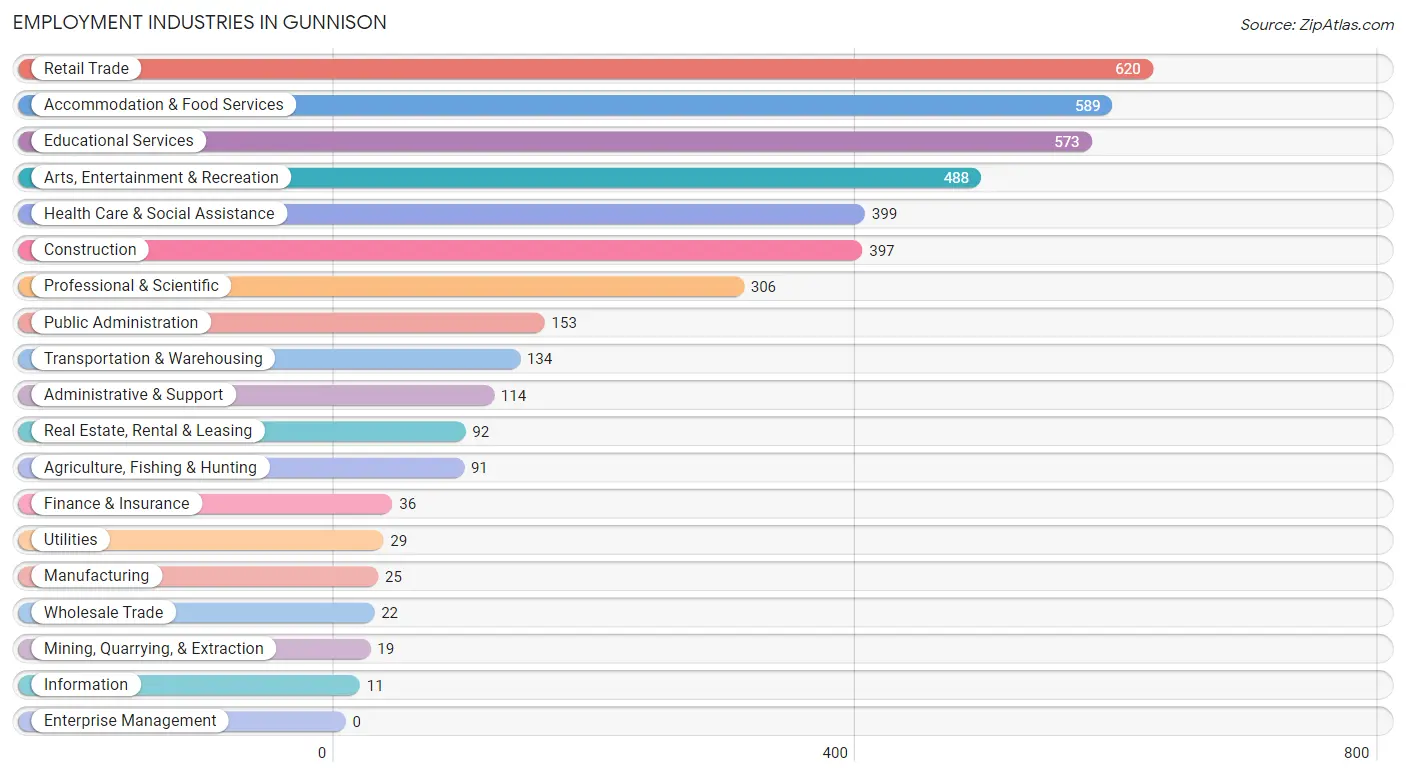
Employment Industries in Gunnison
The major employment industries in Gunnison include Retail Trade (620 | 14.3%), Accommodation & Food Services (589 | 13.6%), Educational Services (573 | 13.2%), Arts, Entertainment & Recreation (488 | 11.3%), and Health Care & Social Assistance (399 | 9.2%).
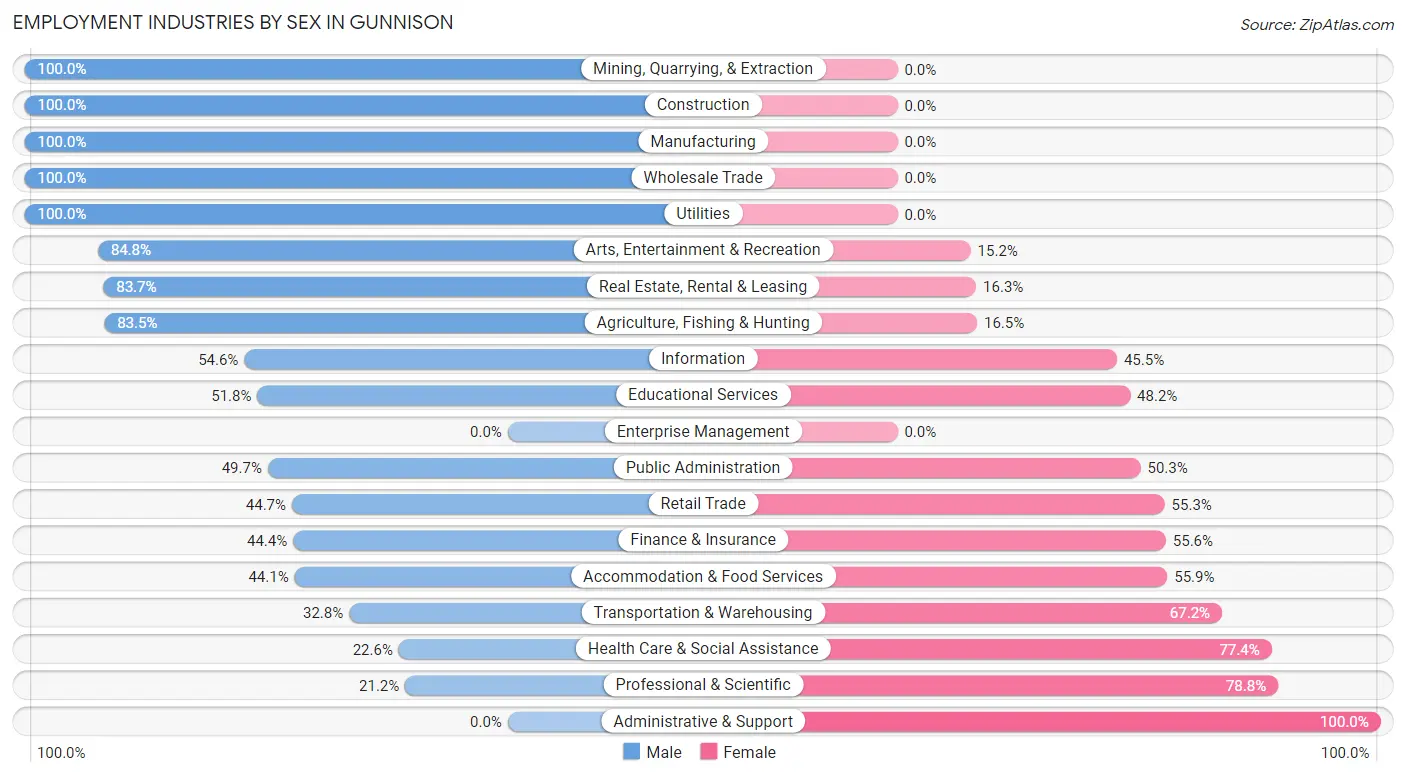
Employment Industries by Sex in Gunnison
The Gunnison industries that see more men than women are Mining, Quarrying, & Extraction (100.0%), Construction (100.0%), and Manufacturing (100.0%), whereas the industries that tend to have a higher number of women are Administrative & Support (100.0%), Professional & Scientific (78.8%), and Health Care & Social Assistance (77.4%).
| Industry | Male | Female |
| Agriculture, Fishing & Hunting | 76 (83.5%) | 15 (16.5%) |
| Mining, Quarrying, & Extraction | 19 (100.0%) | 0 (0.0%) |
| Construction | 397 (100.0%) | 0 (0.0%) |
| Manufacturing | 25 (100.0%) | 0 (0.0%) |
| Wholesale Trade | 22 (100.0%) | 0 (0.0%) |
| Retail Trade | 277 (44.7%) | 343 (55.3%) |
| Transportation & Warehousing | 44 (32.8%) | 90 (67.2%) |
| Utilities | 29 (100.0%) | 0 (0.0%) |
| Information | 6 (54.5%) | 5 (45.5%) |
| Finance & Insurance | 16 (44.4%) | 20 (55.6%) |
| Real Estate, Rental & Leasing | 77 (83.7%) | 15 (16.3%) |
| Professional & Scientific | 65 (21.2%) | 241 (78.8%) |
| Enterprise Management | 0 (0.0%) | 0 (0.0%) |
| Administrative & Support | 0 (0.0%) | 114 (100.0%) |
| Educational Services | 297 (51.8%) | 276 (48.2%) |
| Health Care & Social Assistance | 90 (22.6%) | 309 (77.4%) |
| Arts, Entertainment & Recreation | 414 (84.8%) | 74 (15.2%) |
| Accommodation & Food Services | 260 (44.1%) | 329 (55.9%) |
| Public Administration | 76 (49.7%) | 77 (50.3%) |
| Total | 2,317 (53.4%) | 2,019 (46.6%) |
Education in Gunnison
School Enrollment in Gunnison
The most common levels of schooling among the 2,487 students in Gunnison are college / undergraduate (1,701 | 68.4%), elementary school (223 | 9.0%), and middle school (223 | 9.0%).
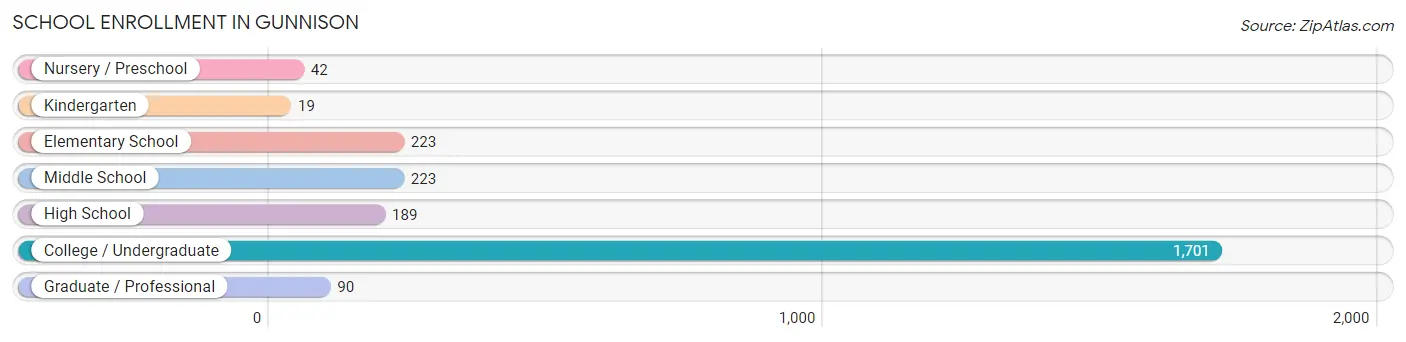
| School Level | # Students | % Students |
| Nursery / Preschool | 42 | 1.7% |
| Kindergarten | 19 | 0.8% |
| Elementary School | 223 | 9.0% |
| Middle School | 223 | 9.0% |
| High School | 189 | 7.6% |
| College / Undergraduate | 1,701 | 68.4% |
| Graduate / Professional | 90 | 3.6% |
| Total | 2,487 | 100.0% |
School Enrollment by Age by Funding Source in Gunnison
Out of a total of 2,487 students who are enrolled in schools in Gunnison, 376 (15.1%) attend a private institution, while the remaining 2,111 (84.9%) are enrolled in public schools. The age group of 35 years and over has the highest likelihood of being enrolled in private schools, with 25 (65.8% in the age bracket) enrolled. Conversely, the age group of 3 to 4 year olds has the lowest likelihood of being enrolled in a private school, with 22 (100.0% in the age bracket) attending a public institution.
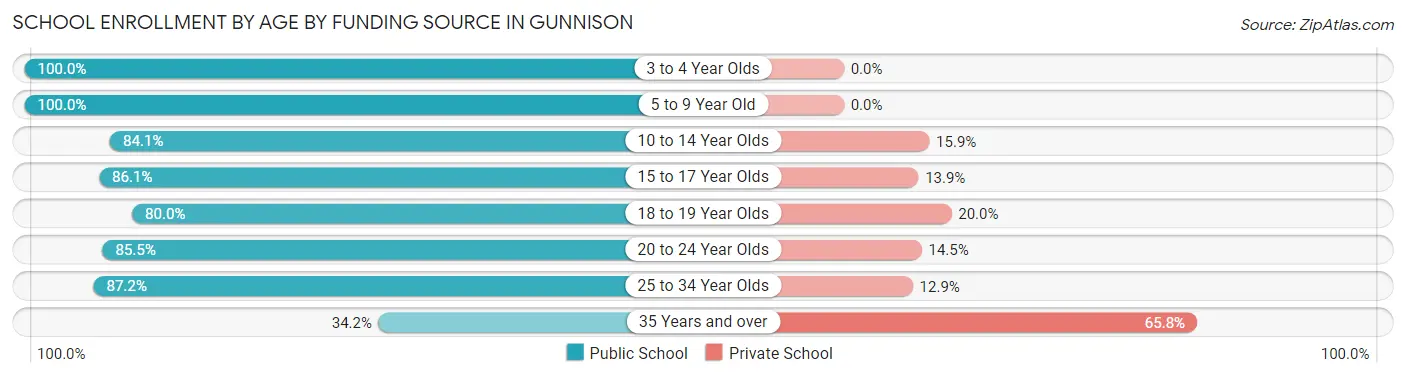
| Age Bracket | Public School | Private School |
| 3 to 4 Year Olds | 22 (100.0%) | 0 (0.0%) |
| 5 to 9 Year Old | 205 (100.0%) | 0 (0.0%) |
| 10 to 14 Year Olds | 243 (84.1%) | 46 (15.9%) |
| 15 to 17 Year Olds | 180 (86.1%) | 29 (13.9%) |
| 18 to 19 Year Olds | 403 (80.0%) | 101 (20.0%) |
| 20 to 24 Year Olds | 890 (85.5%) | 151 (14.5%) |
| 25 to 34 Year Olds | 156 (87.2%) | 23 (12.9%) |
| 35 Years and over | 13 (34.2%) | 25 (65.8%) |
| Total | 2,111 (84.9%) | 376 (15.1%) |
Educational Attainment by Field of Study in Gunnison
Business (354 | 16.3%), bio, nature & agricultural (328 | 15.1%), social sciences (260 | 11.9%), visual & performing arts (205 | 9.4%), and arts & humanities (188 | 8.6%) are the most common fields of study among 2,176 individuals in Gunnison who have obtained a bachelor's degree or higher.
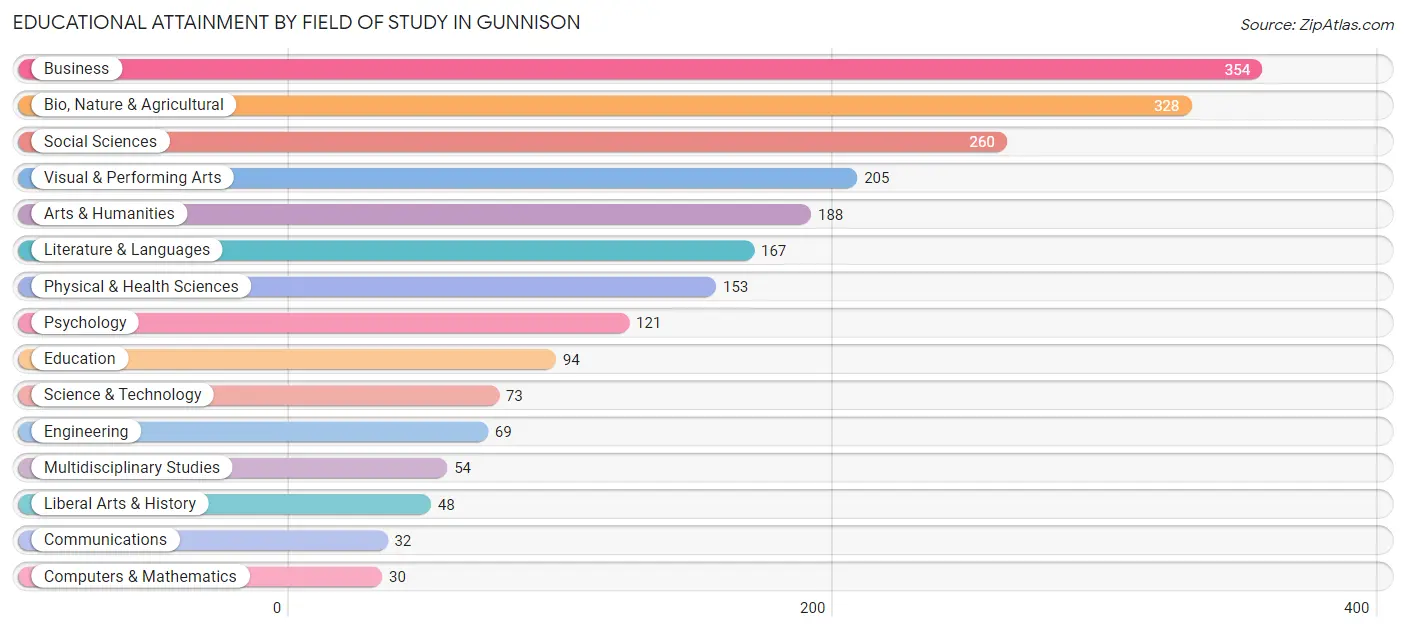
| Field of Study | # Graduates | % Graduates |
| Computers & Mathematics | 30 | 1.4% |
| Bio, Nature & Agricultural | 328 | 15.1% |
| Physical & Health Sciences | 153 | 7.0% |
| Psychology | 121 | 5.6% |
| Social Sciences | 260 | 11.9% |
| Engineering | 69 | 3.2% |
| Multidisciplinary Studies | 54 | 2.5% |
| Science & Technology | 73 | 3.4% |
| Business | 354 | 16.3% |
| Education | 94 | 4.3% |
| Literature & Languages | 167 | 7.7% |
| Liberal Arts & History | 48 | 2.2% |
| Visual & Performing Arts | 205 | 9.4% |
| Communications | 32 | 1.5% |
| Arts & Humanities | 188 | 8.6% |
| Total | 2,176 | 100.0% |
Transportation & Commute in Gunnison
Vehicle Availability by Sex in Gunnison
The most prevalent vehicle ownership categories in Gunnison are males with 3 vehicles (692, accounting for 34.5%) and females with 3 vehicles (463, making up 36.6%).
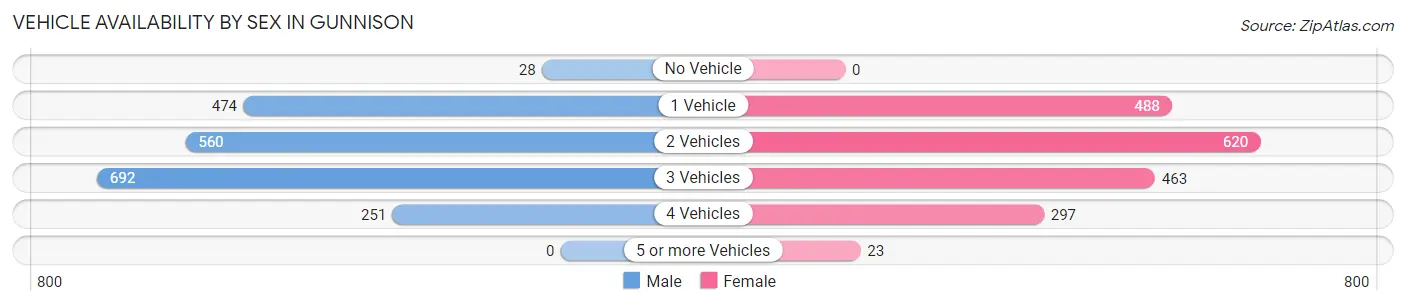
| Vehicles Available | Male | Female |
| No Vehicle | 28 (1.4%) | 0 (0.0%) |
| 1 Vehicle | 474 (23.6%) | 488 (25.8%) |
| 2 Vehicles | 560 (27.9%) | 620 (32.8%) |
| 3 Vehicles | 692 (34.5%) | 463 (24.5%) |
| 4 Vehicles | 251 (12.5%) | 297 (15.7%) |
| 5 or more Vehicles | 0 (0.0%) | 23 (1.2%) |
| Total | 2,005 (100.0%) | 1,891 (100.0%) |
Commute Time in Gunnison
The most frequently occuring commute durations in Gunnison are 5 to 9 minutes (1,370 commuters, 35.0%), less than 5 minutes (745 commuters, 19.1%), and 45 to 59 minutes (410 commuters, 10.5%).
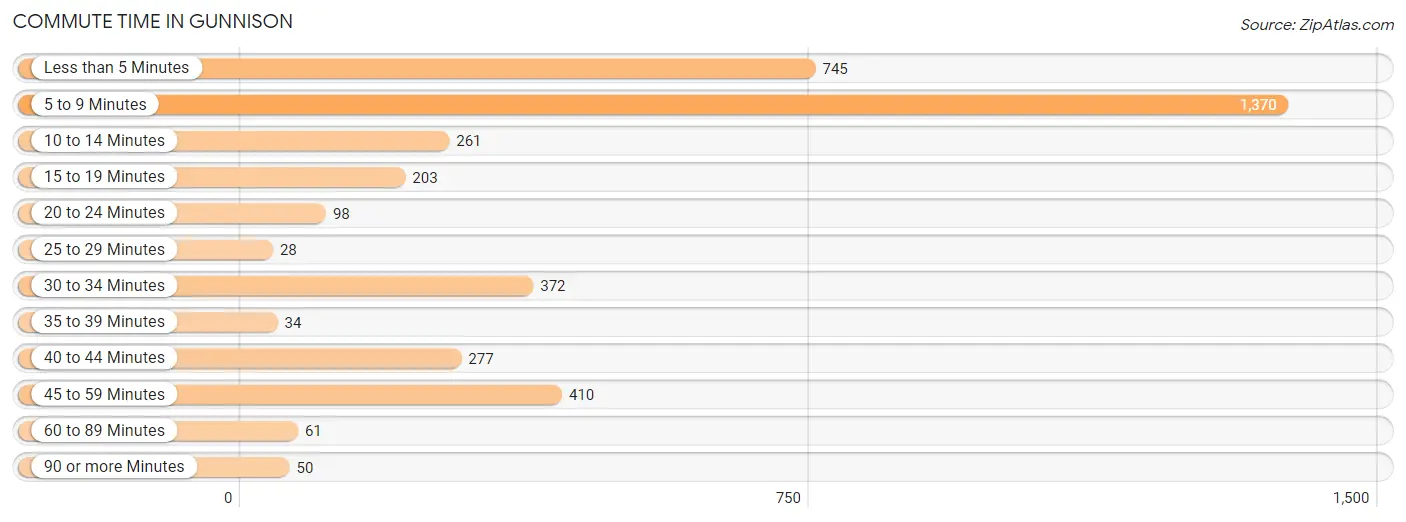
| Commute Time | # Commuters | % Commuters |
| Less than 5 Minutes | 745 | 19.1% |
| 5 to 9 Minutes | 1,370 | 35.0% |
| 10 to 14 Minutes | 261 | 6.7% |
| 15 to 19 Minutes | 203 | 5.2% |
| 20 to 24 Minutes | 98 | 2.5% |
| 25 to 29 Minutes | 28 | 0.7% |
| 30 to 34 Minutes | 372 | 9.5% |
| 35 to 39 Minutes | 34 | 0.9% |
| 40 to 44 Minutes | 277 | 7.1% |
| 45 to 59 Minutes | 410 | 10.5% |
| 60 to 89 Minutes | 61 | 1.6% |
| 90 or more Minutes | 50 | 1.3% |
Commute Time by Sex in Gunnison
The most common commute times in Gunnison are 5 to 9 minutes (601 commuters, 29.5%) for males and 5 to 9 minutes (769 commuters, 41.1%) for females.
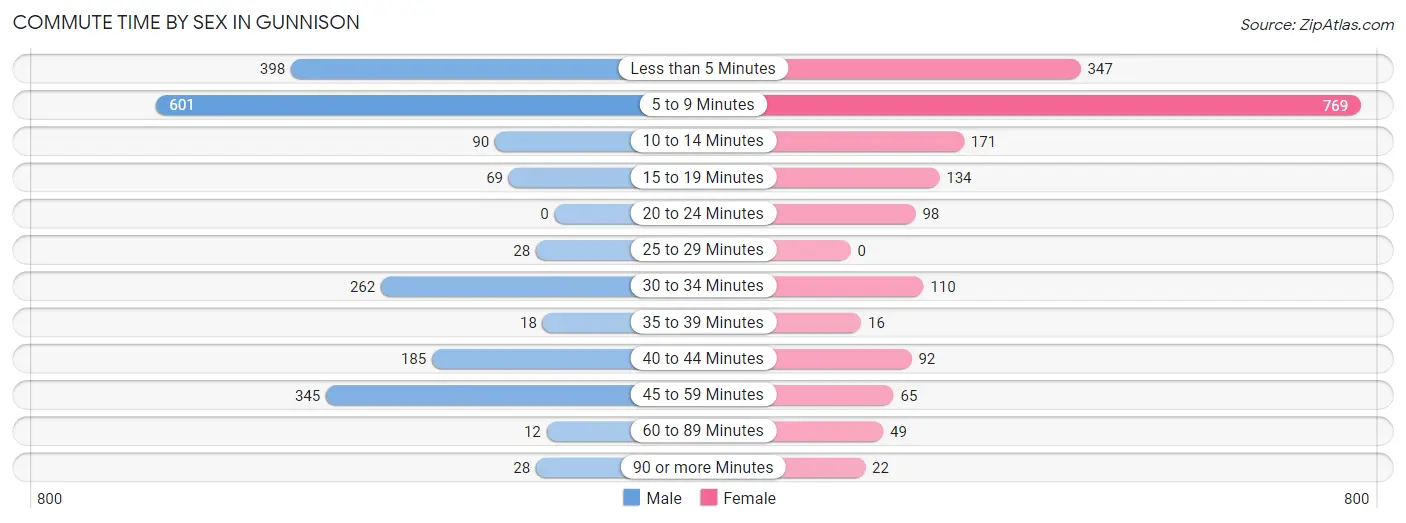
| Commute Time | Male | Female |
| Less than 5 Minutes | 398 (19.6%) | 347 (18.5%) |
| 5 to 9 Minutes | 601 (29.5%) | 769 (41.1%) |
| 10 to 14 Minutes | 90 (4.4%) | 171 (9.1%) |
| 15 to 19 Minutes | 69 (3.4%) | 134 (7.1%) |
| 20 to 24 Minutes | 0 (0.0%) | 98 (5.2%) |
| 25 to 29 Minutes | 28 (1.4%) | 0 (0.0%) |
| 30 to 34 Minutes | 262 (12.9%) | 110 (5.9%) |
| 35 to 39 Minutes | 18 (0.9%) | 16 (0.9%) |
| 40 to 44 Minutes | 185 (9.1%) | 92 (4.9%) |
| 45 to 59 Minutes | 345 (16.9%) | 65 (3.5%) |
| 60 to 89 Minutes | 12 (0.6%) | 49 (2.6%) |
| 90 or more Minutes | 28 (1.4%) | 22 (1.2%) |
Time of Departure to Work by Sex in Gunnison
The most frequent times of departure to work in Gunnison are 7:00 AM to 7:29 AM (508, 24.9%) for males and 8:00 AM to 8:29 AM (421, 22.5%) for females.
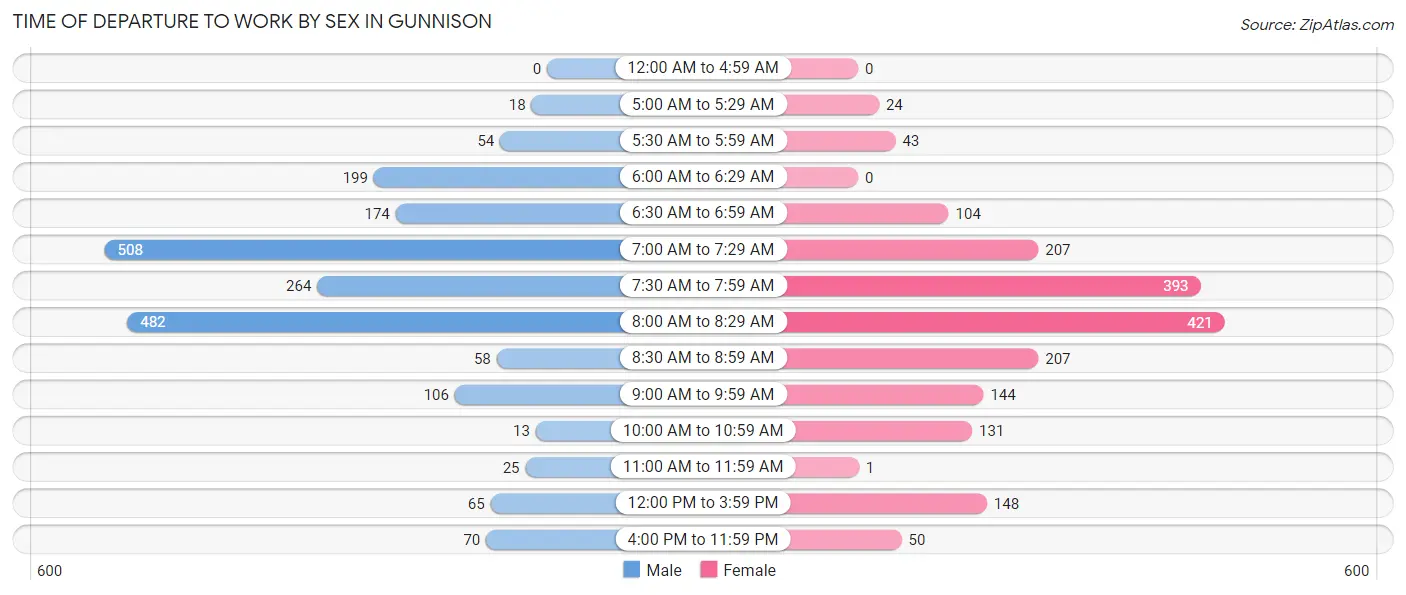
| Time of Departure | Male | Female |
| 12:00 AM to 4:59 AM | 0 (0.0%) | 0 (0.0%) |
| 5:00 AM to 5:29 AM | 18 (0.9%) | 24 (1.3%) |
| 5:30 AM to 5:59 AM | 54 (2.6%) | 43 (2.3%) |
| 6:00 AM to 6:29 AM | 199 (9.8%) | 0 (0.0%) |
| 6:30 AM to 6:59 AM | 174 (8.6%) | 104 (5.6%) |
| 7:00 AM to 7:29 AM | 508 (24.9%) | 207 (11.1%) |
| 7:30 AM to 7:59 AM | 264 (13.0%) | 393 (21.0%) |
| 8:00 AM to 8:29 AM | 482 (23.7%) | 421 (22.5%) |
| 8:30 AM to 8:59 AM | 58 (2.9%) | 207 (11.1%) |
| 9:00 AM to 9:59 AM | 106 (5.2%) | 144 (7.7%) |
| 10:00 AM to 10:59 AM | 13 (0.6%) | 131 (7.0%) |
| 11:00 AM to 11:59 AM | 25 (1.2%) | 1 (0.1%) |
| 12:00 PM to 3:59 PM | 65 (3.2%) | 148 (7.9%) |
| 4:00 PM to 11:59 PM | 70 (3.4%) | 50 (2.7%) |
| Total | 2,036 (100.0%) | 1,873 (100.0%) |
Housing Occupancy in Gunnison
Occupancy by Ownership in Gunnison
Of the total 3,034 dwellings in Gunnison, owner-occupied units account for 1,233 (40.6%), while renter-occupied units make up 1,801 (59.4%).
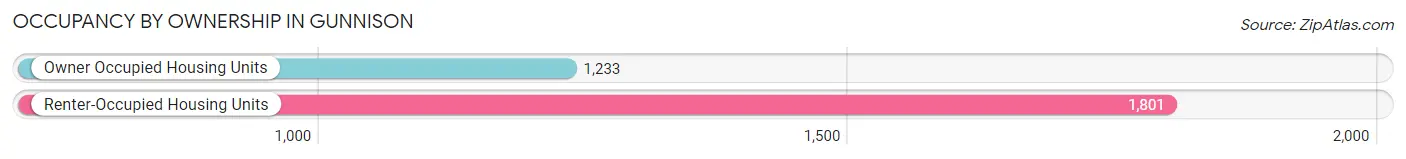
| Occupancy | # Housing Units | % Housing Units |
| Owner Occupied Housing Units | 1,233 | 40.6% |
| Renter-Occupied Housing Units | 1,801 | 59.4% |
| Total Occupied Housing Units | 3,034 | 100.0% |
Occupancy by Household Size in Gunnison
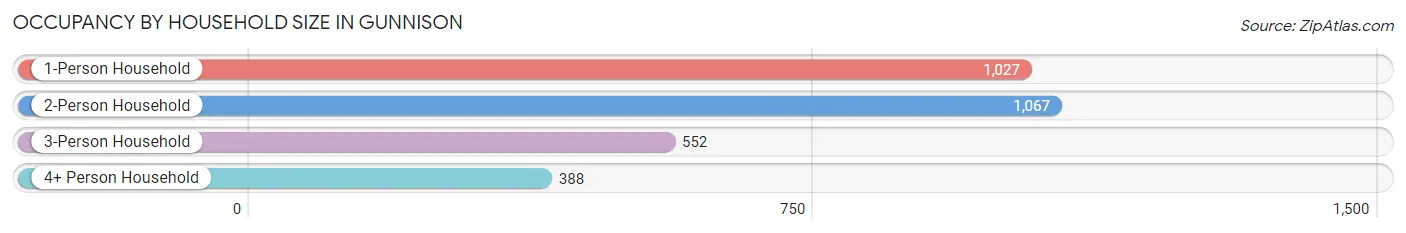
| Household Size | # Housing Units | % Housing Units |
| 1-Person Household | 1,027 | 33.9% |
| 2-Person Household | 1,067 | 35.2% |
| 3-Person Household | 552 | 18.2% |
| 4+ Person Household | 388 | 12.8% |
| Total Housing Units | 3,034 | 100.0% |
Occupancy by Ownership by Household Size in Gunnison
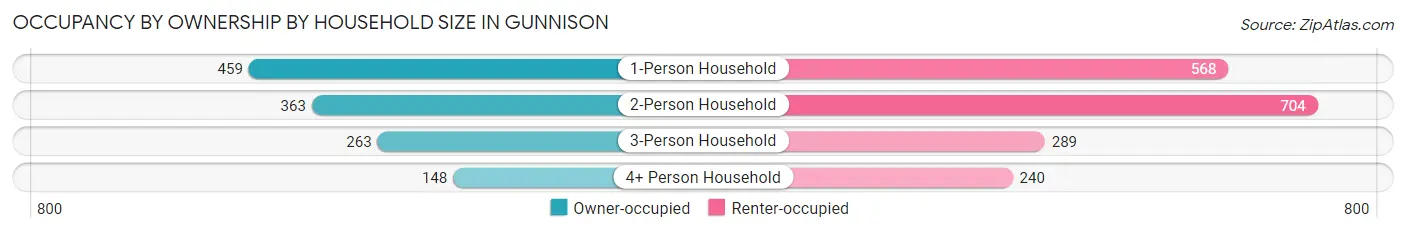
| Household Size | Owner-occupied | Renter-occupied |
| 1-Person Household | 459 (44.7%) | 568 (55.3%) |
| 2-Person Household | 363 (34.0%) | 704 (66.0%) |
| 3-Person Household | 263 (47.6%) | 289 (52.4%) |
| 4+ Person Household | 148 (38.1%) | 240 (61.9%) |
| Total Housing Units | 1,233 (40.6%) | 1,801 (59.4%) |
Occupancy by Educational Attainment in Gunnison
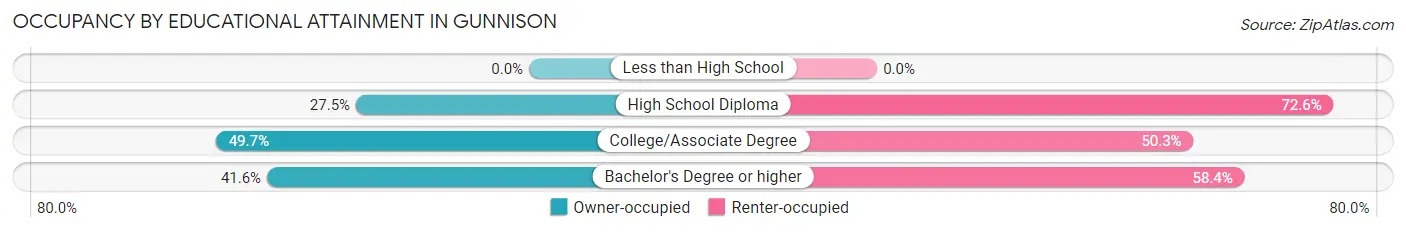
| Household Size | Owner-occupied | Renter-occupied |
| Less than High School | 0 (0.0%) | 0 (0.0%) |
| High School Diploma | 202 (27.5%) | 534 (72.6%) |
| College/Associate Degree | 465 (49.7%) | 471 (50.3%) |
| Bachelor's Degree or higher | 566 (41.6%) | 796 (58.4%) |
Occupancy by Age of Householder in Gunnison
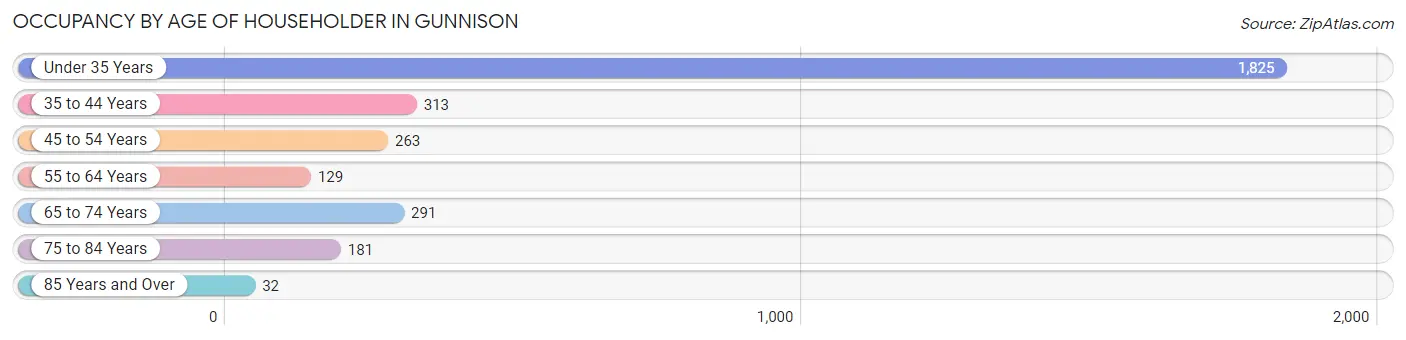
| Age Bracket | # Households | % Households |
| Under 35 Years | 1,825 | 60.2% |
| 35 to 44 Years | 313 | 10.3% |
| 45 to 54 Years | 263 | 8.7% |
| 55 to 64 Years | 129 | 4.3% |
| 65 to 74 Years | 291 | 9.6% |
| 75 to 84 Years | 181 | 6.0% |
| 85 Years and Over | 32 | 1.1% |
| Total | 3,034 | 100.0% |
Housing Finances in Gunnison
Median Income by Occupancy in Gunnison
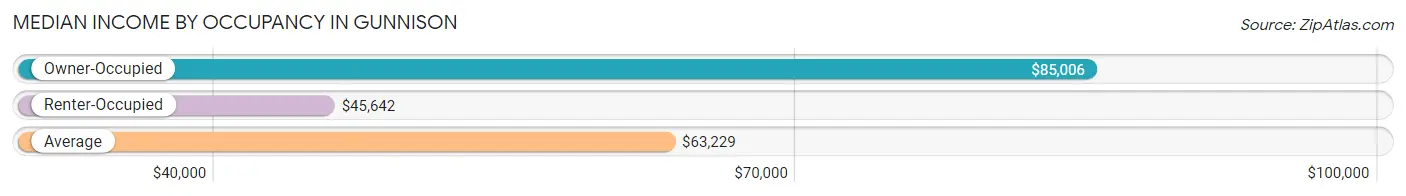
| Occupancy Type | # Households | Median Income |
| Owner-Occupied | 1,233 (40.6%) | $85,006 |
| Renter-Occupied | 1,801 (59.4%) | $45,642 |
| Average | 3,034 (100.0%) | $63,229 |
Occupancy by Householder Income Bracket in Gunnison
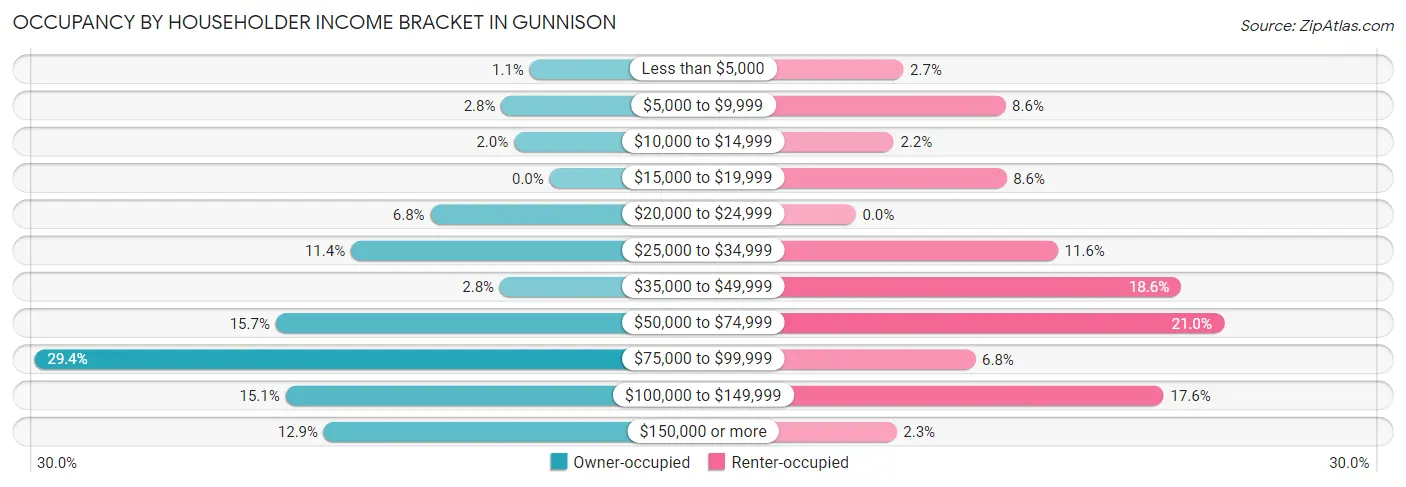
| Income Bracket | Owner-occupied | Renter-occupied |
| Less than $5,000 | 14 (1.1%) | 49 (2.7%) |
| $5,000 to $9,999 | 34 (2.8%) | 154 (8.6%) |
| $10,000 to $14,999 | 25 (2.0%) | 39 (2.2%) |
| $15,000 to $19,999 | 0 (0.0%) | 155 (8.6%) |
| $20,000 to $24,999 | 84 (6.8%) | 0 (0.0%) |
| $25,000 to $34,999 | 140 (11.4%) | 208 (11.6%) |
| $35,000 to $49,999 | 35 (2.8%) | 335 (18.6%) |
| $50,000 to $74,999 | 193 (15.7%) | 379 (21.0%) |
| $75,000 to $99,999 | 363 (29.4%) | 123 (6.8%) |
| $100,000 to $149,999 | 186 (15.1%) | 317 (17.6%) |
| $150,000 or more | 159 (12.9%) | 42 (2.3%) |
| Total | 1,233 (100.0%) | 1,801 (100.0%) |
Monthly Housing Cost Tiers in Gunnison

| Monthly Cost | Owner-occupied | Renter-occupied |
| Less than $300 | 23 (1.9%) | 37 (2.1%) |
| $300 to $499 | 319 (25.9%) | 19 (1.1%) |
| $500 to $799 | 139 (11.3%) | 202 (11.2%) |
| $800 to $999 | 7 (0.6%) | 459 (25.5%) |
| $1,000 to $1,499 | 379 (30.7%) | 483 (26.8%) |
| $1,500 to $1,999 | 269 (21.8%) | 347 (19.3%) |
| $2,000 to $2,499 | 65 (5.3%) | 167 (9.3%) |
| $2,500 to $2,999 | 22 (1.8%) | 10 (0.6%) |
| $3,000 or more | 10 (0.8%) | 33 (1.8%) |
| Total | 1,233 (100.0%) | 1,801 (100.0%) |
Physical Housing Characteristics in Gunnison
Housing Structures in Gunnison
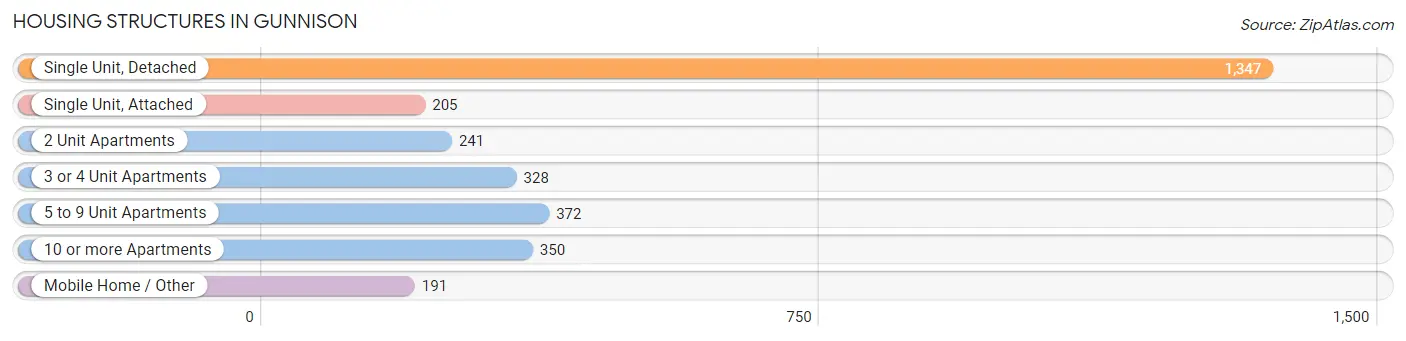
| Structure Type | # Housing Units | % Housing Units |
| Single Unit, Detached | 1,347 | 44.4% |
| Single Unit, Attached | 205 | 6.8% |
| 2 Unit Apartments | 241 | 7.9% |
| 3 or 4 Unit Apartments | 328 | 10.8% |
| 5 to 9 Unit Apartments | 372 | 12.3% |
| 10 or more Apartments | 350 | 11.5% |
| Mobile Home / Other | 191 | 6.3% |
| Total | 3,034 | 100.0% |
Housing Structures by Occupancy in Gunnison
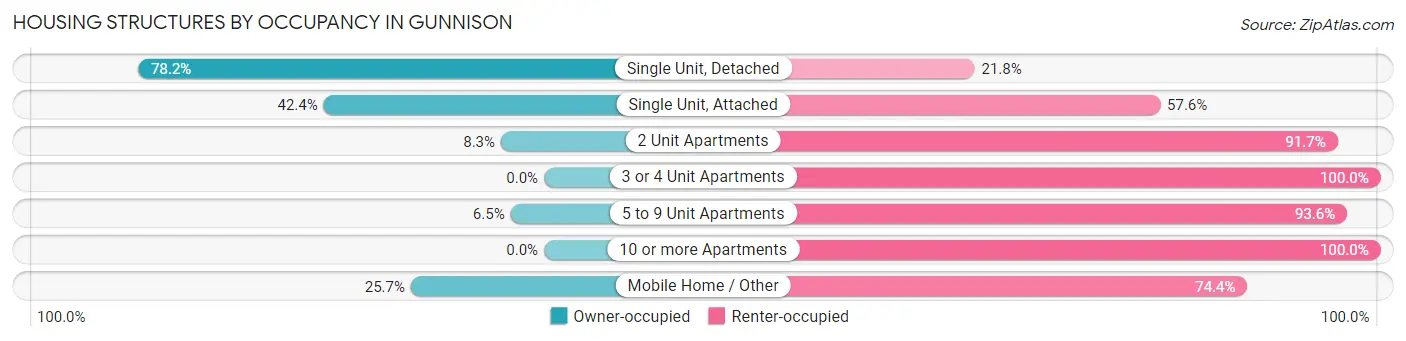
| Structure Type | Owner-occupied | Renter-occupied |
| Single Unit, Detached | 1,053 (78.2%) | 294 (21.8%) |
| Single Unit, Attached | 87 (42.4%) | 118 (57.6%) |
| 2 Unit Apartments | 20 (8.3%) | 221 (91.7%) |
| 3 or 4 Unit Apartments | 0 (0.0%) | 328 (100.0%) |
| 5 to 9 Unit Apartments | 24 (6.5%) | 348 (93.5%) |
| 10 or more Apartments | 0 (0.0%) | 350 (100.0%) |
| Mobile Home / Other | 49 (25.7%) | 142 (74.4%) |
| Total | 1,233 (40.6%) | 1,801 (59.4%) |
Housing Structures by Number of Rooms in Gunnison
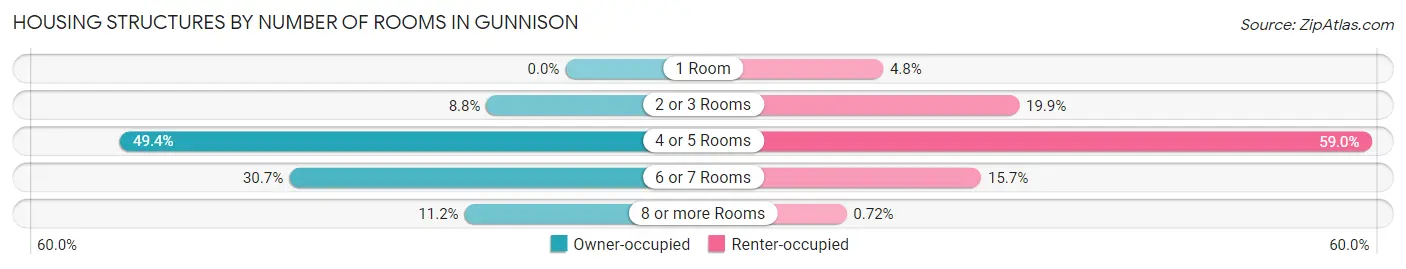
| Number of Rooms | Owner-occupied | Renter-occupied |
| 1 Room | 0 (0.0%) | 86 (4.8%) |
| 2 or 3 Rooms | 108 (8.8%) | 358 (19.9%) |
| 4 or 5 Rooms | 609 (49.4%) | 1,062 (59.0%) |
| 6 or 7 Rooms | 378 (30.7%) | 282 (15.7%) |
| 8 or more Rooms | 138 (11.2%) | 13 (0.7%) |
| Total | 1,233 (100.0%) | 1,801 (100.0%) |
Housing Structure by Heating Type in Gunnison
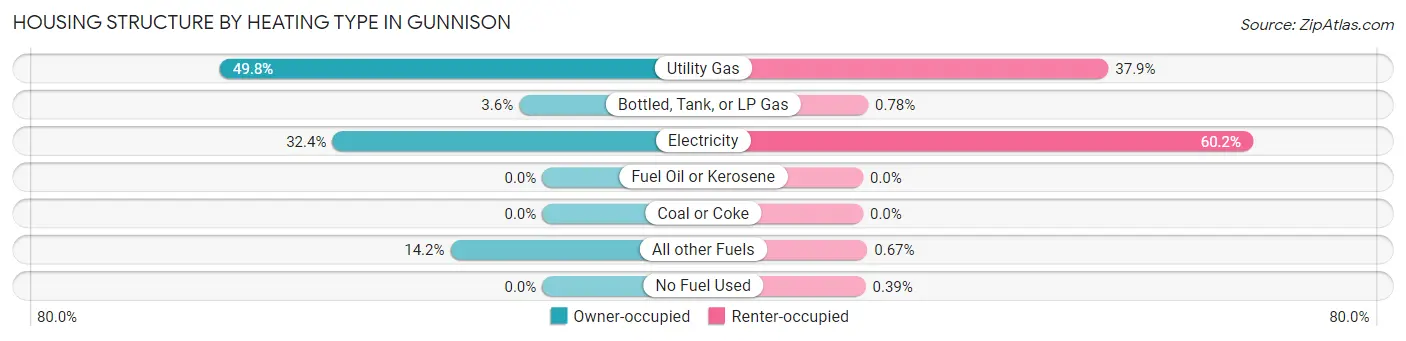
| Heating Type | Owner-occupied | Renter-occupied |
| Utility Gas | 614 (49.8%) | 683 (37.9%) |
| Bottled, Tank, or LP Gas | 44 (3.6%) | 14 (0.8%) |
| Electricity | 400 (32.4%) | 1,085 (60.2%) |
| Fuel Oil or Kerosene | 0 (0.0%) | 0 (0.0%) |
| Coal or Coke | 0 (0.0%) | 0 (0.0%) |
| All other Fuels | 175 (14.2%) | 12 (0.7%) |
| No Fuel Used | 0 (0.0%) | 7 (0.4%) |
| Total | 1,233 (100.0%) | 1,801 (100.0%) |
Household Vehicle Usage in Gunnison
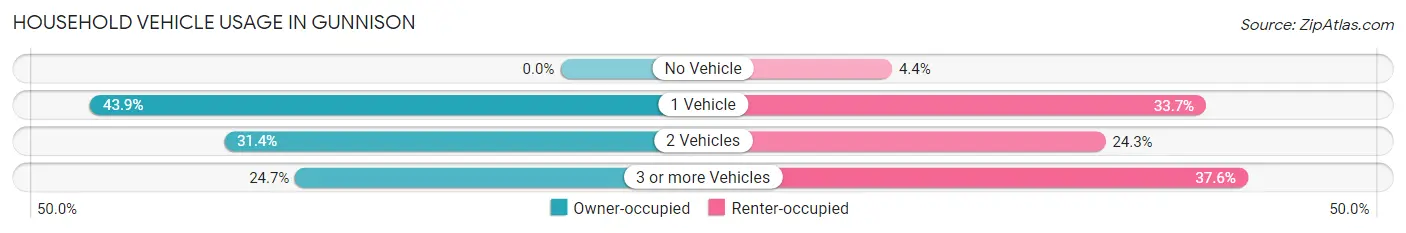
| Vehicles per Household | Owner-occupied | Renter-occupied |
| No Vehicle | 0 (0.0%) | 79 (4.4%) |
| 1 Vehicle | 541 (43.9%) | 607 (33.7%) |
| 2 Vehicles | 387 (31.4%) | 438 (24.3%) |
| 3 or more Vehicles | 305 (24.7%) | 677 (37.6%) |
| Total | 1,233 (100.0%) | 1,801 (100.0%) |
Real Estate & Mortgages in Gunnison
Real Estate and Mortgage Overview in Gunnison
| Characteristic | Without Mortgage | With Mortgage |
| Housing Units | 437 | 796 |
| Median Property Value | $414,700 | $406,300 |
| Median Household Income | $68,417 | $107 |
| Monthly Housing Costs | $433 | $10 |
| Real Estate Taxes | $1,145 | $34 |
Property Value by Mortgage Status in Gunnison
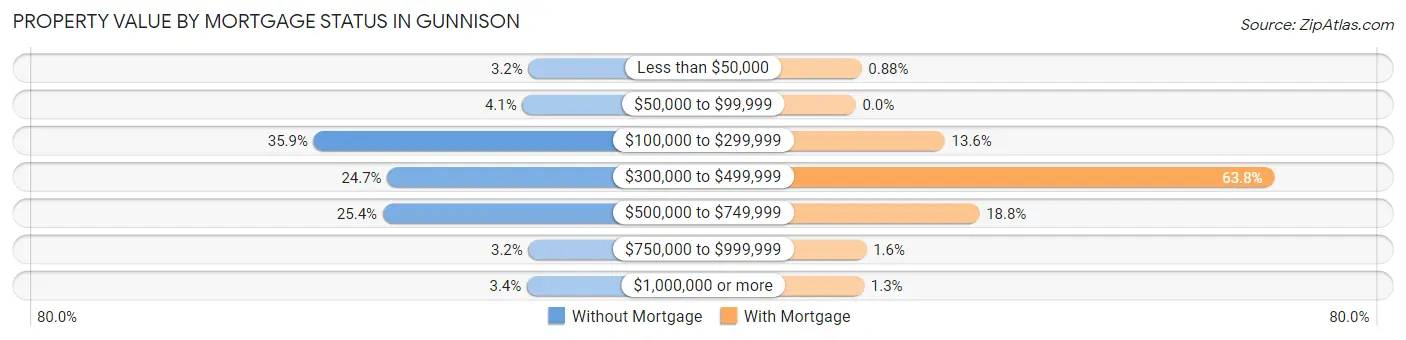
| Property Value | Without Mortgage | With Mortgage |
| Less than $50,000 | 14 (3.2%) | 7 (0.9%) |
| $50,000 to $99,999 | 18 (4.1%) | 0 (0.0%) |
| $100,000 to $299,999 | 157 (35.9%) | 108 (13.6%) |
| $300,000 to $499,999 | 108 (24.7%) | 508 (63.8%) |
| $500,000 to $749,999 | 111 (25.4%) | 150 (18.8%) |
| $750,000 to $999,999 | 14 (3.2%) | 13 (1.6%) |
| $1,000,000 or more | 15 (3.4%) | 10 (1.3%) |
| Total | 437 (100.0%) | 796 (100.0%) |
Household Income by Mortgage Status in Gunnison
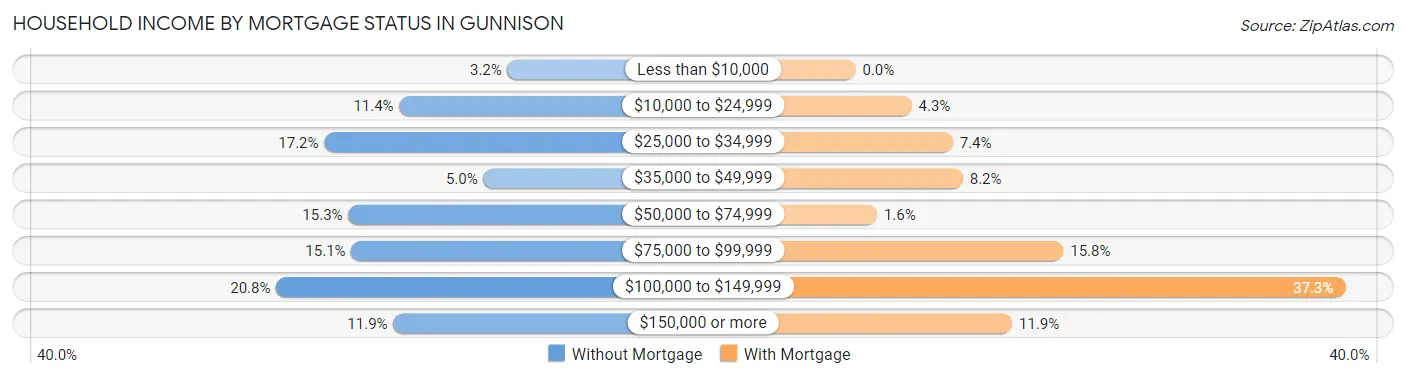
| Household Income | Without Mortgage | With Mortgage |
| Less than $10,000 | 14 (3.2%) | 0 (0.0%) |
| $10,000 to $24,999 | 50 (11.4%) | 34 (4.3%) |
| $25,000 to $34,999 | 75 (17.2%) | 59 (7.4%) |
| $35,000 to $49,999 | 22 (5.0%) | 65 (8.2%) |
| $50,000 to $74,999 | 67 (15.3%) | 13 (1.6%) |
| $75,000 to $99,999 | 66 (15.1%) | 126 (15.8%) |
| $100,000 to $149,999 | 91 (20.8%) | 297 (37.3%) |
| $150,000 or more | 52 (11.9%) | 95 (11.9%) |
| Total | 437 (100.0%) | 796 (100.0%) |
Property Value to Household Income Ratio in Gunnison
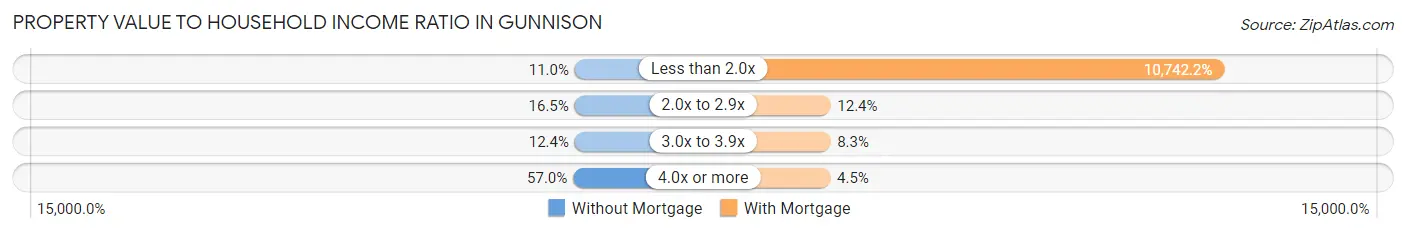
| Value-to-Income Ratio | Without Mortgage | With Mortgage |
| Less than 2.0x | 48 (11.0%) | 85,508 (10,742.2%) |
| 2.0x to 2.9x | 72 (16.5%) | 99 (12.4%) |
| 3.0x to 3.9x | 54 (12.4%) | 66 (8.3%) |
| 4.0x or more | 249 (57.0%) | 36 (4.5%) |
| Total | 437 (100.0%) | 796 (100.0%) |
Real Estate Taxes by Mortgage Status in Gunnison
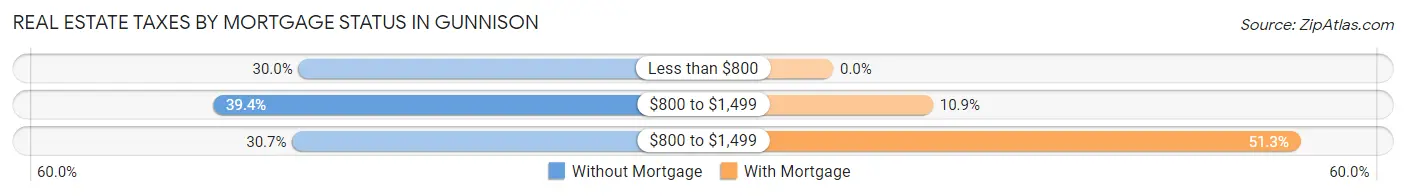
| Property Taxes | Without Mortgage | With Mortgage |
| Less than $800 | 131 (30.0%) | 0 (0.0%) |
| $800 to $1,499 | 172 (39.4%) | 87 (10.9%) |
| $800 to $1,499 | 134 (30.7%) | 408 (51.3%) |
| Total | 437 (100.0%) | 796 (100.0%) |
Health & Disability in Gunnison
Health Insurance Coverage by Age in Gunnison
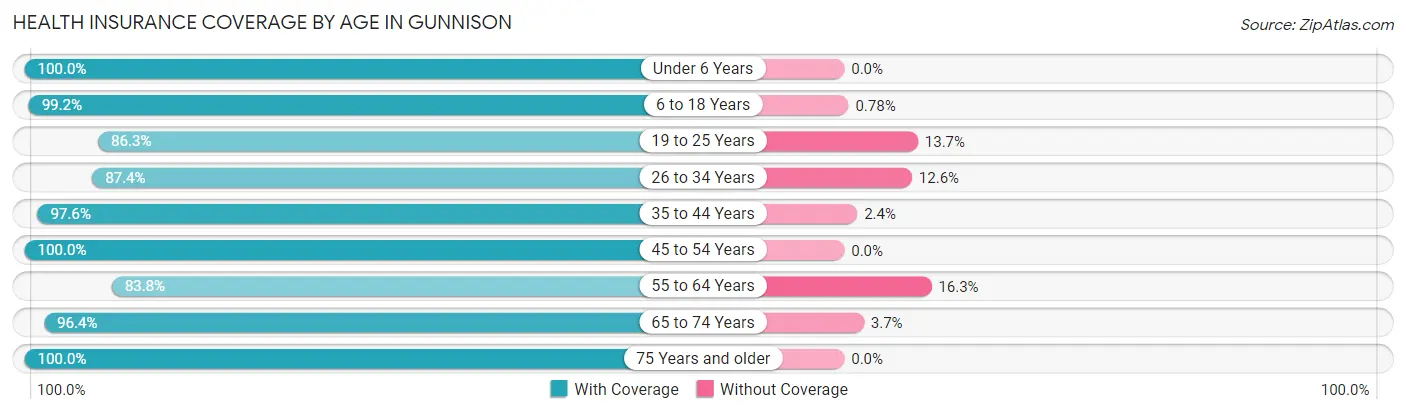
| Age Bracket | With Coverage | Without Coverage |
| Under 6 Years | 258 (100.0%) | 0 (0.0%) |
| 6 to 18 Years | 888 (99.2%) | 7 (0.8%) |
| 19 to 25 Years | 1,981 (86.3%) | 315 (13.7%) |
| 26 to 34 Years | 1,095 (87.4%) | 158 (12.6%) |
| 35 to 44 Years | 527 (97.6%) | 13 (2.4%) |
| 45 to 54 Years | 410 (100.0%) | 0 (0.0%) |
| 55 to 64 Years | 201 (83.8%) | 39 (16.3%) |
| 65 to 74 Years | 370 (96.4%) | 14 (3.6%) |
| 75 Years and older | 277 (100.0%) | 0 (0.0%) |
| Total | 6,007 (91.7%) | 546 (8.3%) |
Health Insurance Coverage by Citizenship Status in Gunnison
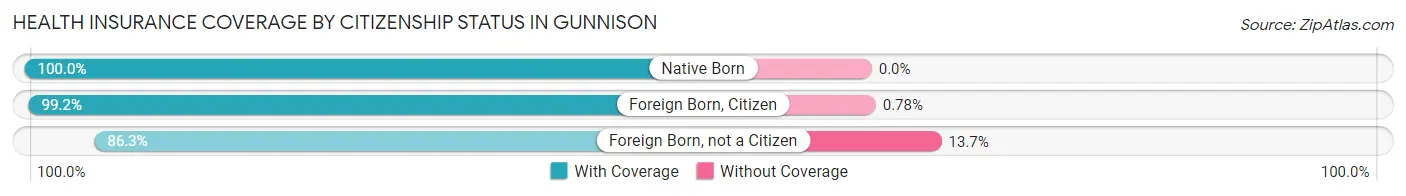
| Citizenship Status | With Coverage | Without Coverage |
| Native Born | 258 (100.0%) | 0 (0.0%) |
| Foreign Born, Citizen | 888 (99.2%) | 7 (0.8%) |
| Foreign Born, not a Citizen | 1,981 (86.3%) | 315 (13.7%) |
Health Insurance Coverage by Household Income in Gunnison
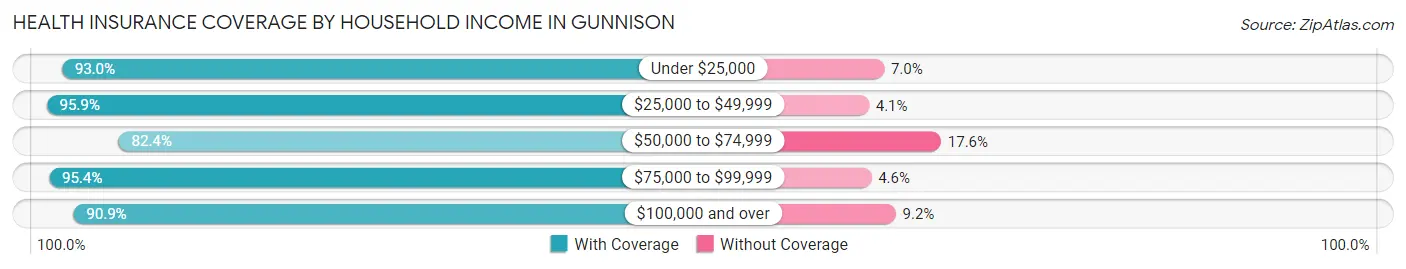
| Household Income | With Coverage | Without Coverage |
| Under $25,000 | 907 (93.0%) | 68 (7.0%) |
| $25,000 to $49,999 | 1,116 (95.9%) | 48 (4.1%) |
| $50,000 to $74,999 | 954 (82.4%) | 204 (17.6%) |
| $75,000 to $99,999 | 875 (95.4%) | 42 (4.6%) |
| $100,000 and over | 1,469 (90.8%) | 148 (9.1%) |
Public vs Private Health Insurance Coverage by Age in Gunnison
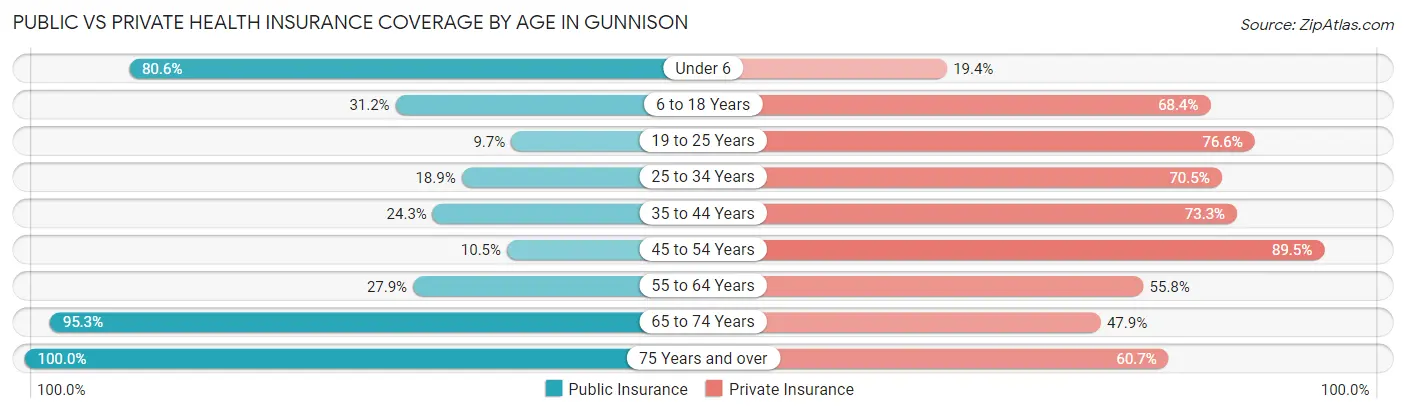
| Age Bracket | Public Insurance | Private Insurance |
| Under 6 | 208 (80.6%) | 50 (19.4%) |
| 6 to 18 Years | 279 (31.2%) | 612 (68.4%) |
| 19 to 25 Years | 223 (9.7%) | 1,759 (76.6%) |
| 25 to 34 Years | 237 (18.9%) | 883 (70.5%) |
| 35 to 44 Years | 131 (24.3%) | 396 (73.3%) |
| 45 to 54 Years | 43 (10.5%) | 367 (89.5%) |
| 55 to 64 Years | 67 (27.9%) | 134 (55.8%) |
| 65 to 74 Years | 366 (95.3%) | 184 (47.9%) |
| 75 Years and over | 277 (100.0%) | 168 (60.7%) |
| Total | 1,831 (27.9%) | 4,553 (69.5%) |
Disability Status by Sex by Age in Gunnison
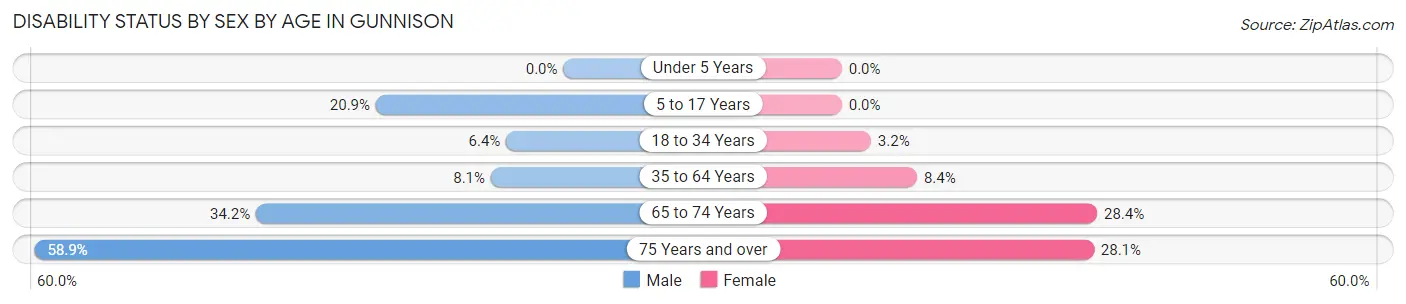
| Age Bracket | Male | Female |
| Under 5 Years | 0 (0.0%) | 0 (0.0%) |
| 5 to 17 Years | 76 (20.9%) | 0 (0.0%) |
| 18 to 34 Years | 140 (6.4%) | 51 (3.2%) |
| 35 to 64 Years | 43 (8.1%) | 55 (8.4%) |
| 65 to 74 Years | 64 (34.2%) | 56 (28.4%) |
| 75 Years and over | 96 (58.9%) | 32 (28.1%) |
Disability Class by Sex by Age in Gunnison
Disability Class: Hearing Difficulty
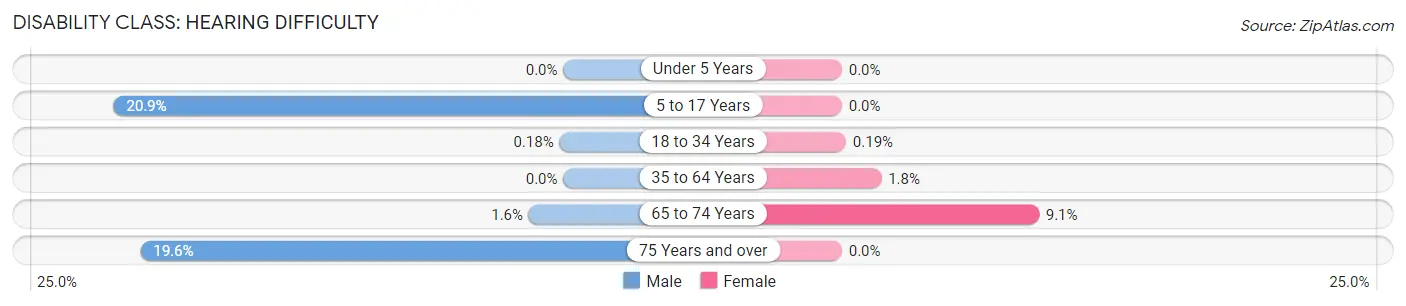
| Age Bracket | Male | Female |
| Under 5 Years | 0 (0.0%) | 0 (0.0%) |
| 5 to 17 Years | 76 (20.9%) | 0 (0.0%) |
| 18 to 34 Years | 4 (0.2%) | 3 (0.2%) |
| 35 to 64 Years | 0 (0.0%) | 12 (1.8%) |
| 65 to 74 Years | 3 (1.6%) | 18 (9.1%) |
| 75 Years and over | 32 (19.6%) | 0 (0.0%) |
Disability Class: Vision Difficulty
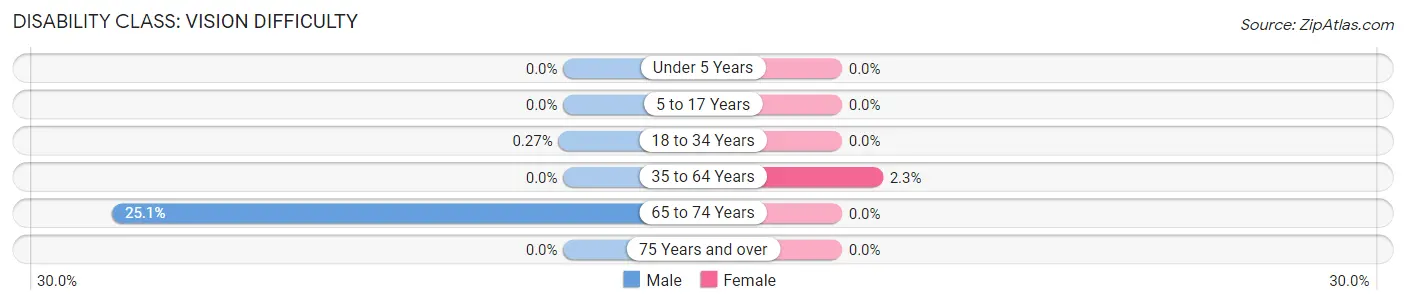
| Age Bracket | Male | Female |
| Under 5 Years | 0 (0.0%) | 0 (0.0%) |
| 5 to 17 Years | 0 (0.0%) | 0 (0.0%) |
| 18 to 34 Years | 6 (0.3%) | 0 (0.0%) |
| 35 to 64 Years | 0 (0.0%) | 15 (2.3%) |
| 65 to 74 Years | 47 (25.1%) | 0 (0.0%) |
| 75 Years and over | 0 (0.0%) | 0 (0.0%) |
Disability Class: Cognitive Difficulty
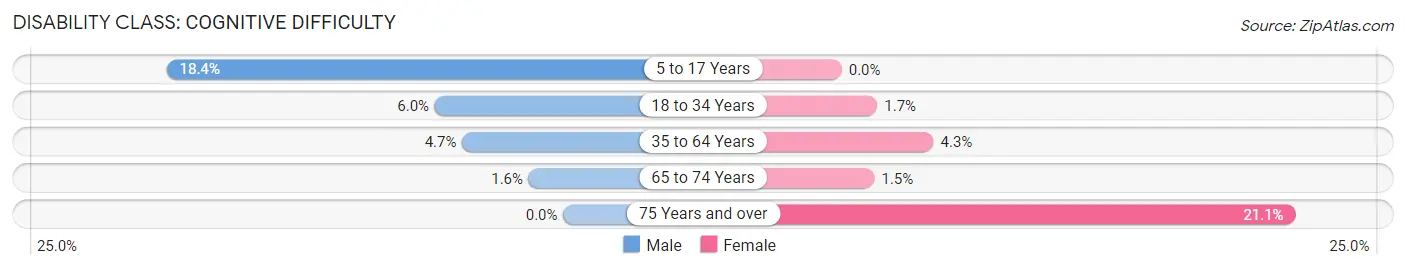
| Age Bracket | Male | Female |
| 5 to 17 Years | 67 (18.4%) | 0 (0.0%) |
| 18 to 34 Years | 131 (6.0%) | 26 (1.7%) |
| 35 to 64 Years | 25 (4.7%) | 28 (4.3%) |
| 65 to 74 Years | 3 (1.6%) | 3 (1.5%) |
| 75 Years and over | 0 (0.0%) | 24 (21.0%) |
Disability Class: Ambulatory Difficulty
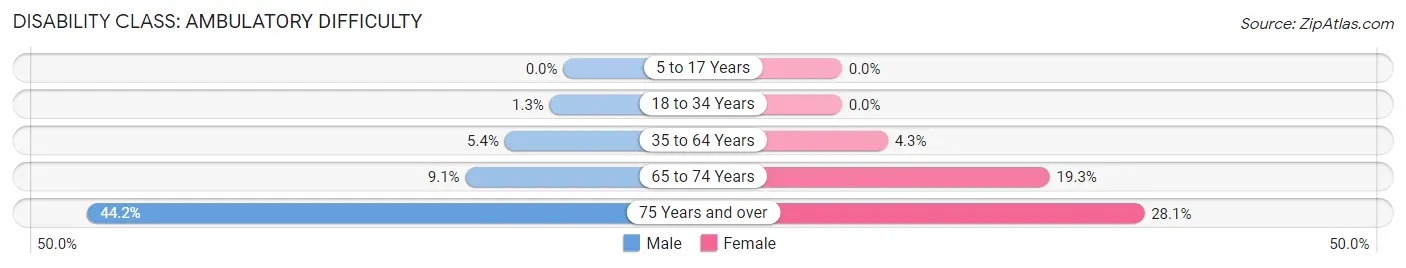
| Age Bracket | Male | Female |
| 5 to 17 Years | 0 (0.0%) | 0 (0.0%) |
| 18 to 34 Years | 28 (1.3%) | 0 (0.0%) |
| 35 to 64 Years | 29 (5.4%) | 28 (4.3%) |
| 65 to 74 Years | 17 (9.1%) | 38 (19.3%) |
| 75 Years and over | 72 (44.2%) | 32 (28.1%) |
Disability Class: Self-Care Difficulty
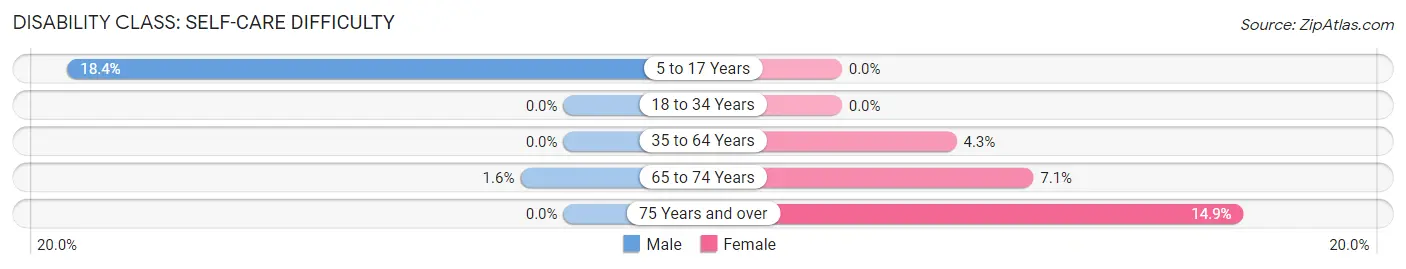
| Age Bracket | Male | Female |
| 5 to 17 Years | 67 (18.4%) | 0 (0.0%) |
| 18 to 34 Years | 0 (0.0%) | 0 (0.0%) |
| 35 to 64 Years | 0 (0.0%) | 28 (4.3%) |
| 65 to 74 Years | 3 (1.6%) | 14 (7.1%) |
| 75 Years and over | 0 (0.0%) | 17 (14.9%) |
Technology Access in Gunnison
Computing Device Access in Gunnison
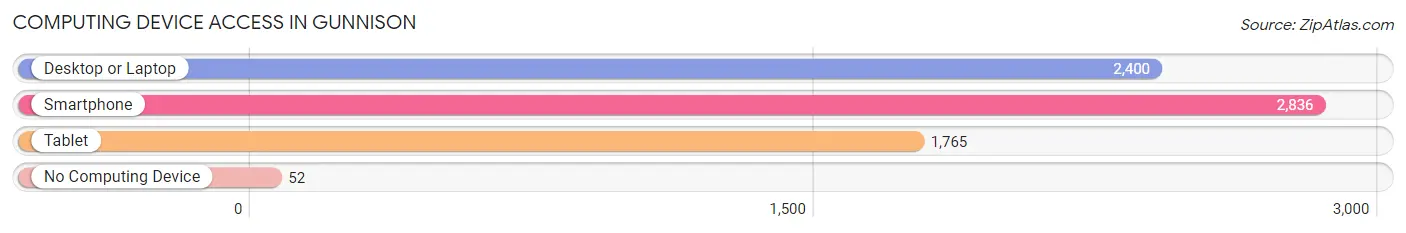
| Device Type | # Households | % Households |
| Desktop or Laptop | 2,400 | 79.1% |
| Smartphone | 2,836 | 93.5% |
| Tablet | 1,765 | 58.2% |
| No Computing Device | 52 | 1.7% |
| Total | 3,034 | 100.0% |
Internet Access in Gunnison
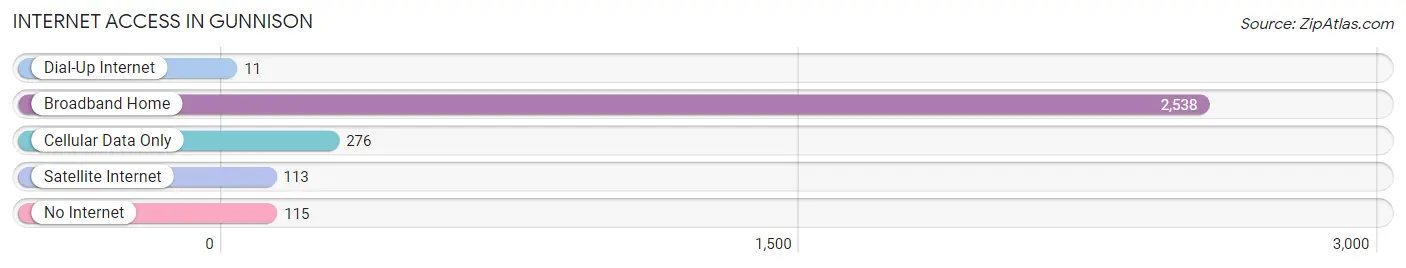
| Internet Type | # Households | % Households |
| Dial-Up Internet | 11 | 0.4% |
| Broadband Home | 2,538 | 83.7% |
| Cellular Data Only | 276 | 9.1% |
| Satellite Internet | 113 | 3.7% |
| No Internet | 115 | 3.8% |
| Total | 3,034 | 100.0% |
Gunnison Summary
Gunnison, Colorado is a small town located in the western part of the state, in Gunnison County. It is situated at an elevation of 7,703 feet, making it the highest incorporated city in the United States. The town is surrounded by the majestic Rocky Mountains, and is home to the Gunnison River, which runs through the center of town.
Gunnison was founded in 1874 by ranchers and miners who were drawn to the area by the abundance of natural resources. The town was named after John W. Gunnison, a U.S. Army officer who surveyed the area in 1853. The town quickly grew, and by 1880, it had a population of over 1,000 people.
Gunnison is located in the heart of the Rocky Mountains, and is surrounded by some of the most beautiful scenery in the state. The town is situated at the base of the West Elk Mountains, and is surrounded by the Gunnison National Forest. The area is known for its abundance of outdoor activities, including hiking, camping, fishing, and skiing.
The economy of Gunnison is largely based on tourism, as the town is a popular destination for outdoor enthusiasts. The town is also home to Western State Colorado University, which provides a variety of educational opportunities for students. The university also serves as an economic engine for the town, providing jobs and services to the local community.
The population of Gunnison in 2000 was 5,854 people. The town is predominantly white, with a small Hispanic population. The median household income in 2000 was $35,945, and the median home value was $127,400. The town has a low unemployment rate, and the cost of living is relatively low compared to other parts of the state.
Gunnison is a small town with a big heart. It is a place where people come to enjoy the outdoors, and to experience the beauty of the Rocky Mountains. The town is home to a vibrant community, and offers a variety of activities and attractions for visitors and residents alike.
Common Questions
What is Per Capita Income in Gunnison?
Per Capita income in Gunnison is $31,563.
What is the Median Family Income in Gunnison?
Median Family Income in Gunnison is $87,712.
What is the Median Household income in Gunnison?
Median Household Income in Gunnison is $63,229.
What is Income or Wage Gap in Gunnison?
Income or Wage Gap in Gunnison is 9.3%.
Women in Gunnison earn 90.7 cents for every dollar earned by a man.
What is Inequality or Gini Index in Gunnison?
Inequality or Gini Index in Gunnison is 0.40.
What is the Total Population of Gunnison?
Total Population of Gunnison is 6,629.
What is the Total Male Population of Gunnison?
Total Male Population of Gunnison is 3,597.
What is the Total Female Population of Gunnison?
Total Female Population of Gunnison is 3,032.
What is the Ratio of Males per 100 Females in Gunnison?
There are 118.63 Males per 100 Females in Gunnison.
What is the Ratio of Females per 100 Males in Gunnison?
There are 84.29 Females per 100 Males in Gunnison.
What is the Median Population Age in Gunnison?
Median Population Age in Gunnison is 24.9 Years.
What is the Average Family Size in Gunnison
Average Family Size in Gunnison is 2.5 People.
What is the Average Household Size in Gunnison
Average Household Size in Gunnison is 1.9 People.
How Large is the Labor Force in Gunnison?
There are 4,554 People in the Labor Forcein in Gunnison.
What is the Percentage of People in the Labor Force in Gunnison?
77.8% of People are in the Labor Force in Gunnison.
What is the Unemployment Rate in Gunnison?
Unemployment Rate in Gunnison is 4.8%.