Grand Lake, CO Map & Demographics
Grand Lake Map
Grand Lake Overview
$66,849
PER CAPITA INCOME
$137,813
AVG FAMILY INCOME
0.50
INEQUALITY / GINI INDEX
281
TOTAL POPULATION
134
MALE POPULATION
147
FEMALE POPULATION
91.16
MALES / 100 FEMALES
109.70
FEMALES / 100 MALES
66.4
MEDIAN AGE
2.2
AVG FAMILY SIZE
1.6
AVG HOUSEHOLD SIZE
154
LABOR FORCE [ PEOPLE ]
59.2%
PERCENT IN LABOR FORCE
2.6%
UNEMPLOYMENT RATE
Grand Lake Zip Codes
Grand Lake Area Codes
Income in Grand Lake
Income Overview in Grand Lake
| Characteristic | Number | Measure |
| Per Capita Income | 281 | $66,849 |
| Median Family Income | 64 | $137,813 |
| Mean Family Income | 64 | $146,870 |
| Median Household Income | 173 | $0 |
| Mean Household Income | 173 | $102,475 |
| Income Deficit | 64 | $0 |
| Wage / Income Gap (%) | 281 | 0.00% |
| Wage / Income Gap ($) | 281 | 100.00¢ per $1 |
| Gini / Inequality Index | 281 | 0.50 |
Earnings by Sex in Grand Lake
| Sex | Number | Average Earnings |
| Male | 74 (48.0%) | $0 |
| Female | 80 (51.9%) | $0 |
| Total | 154 (100.0%) | $0 |
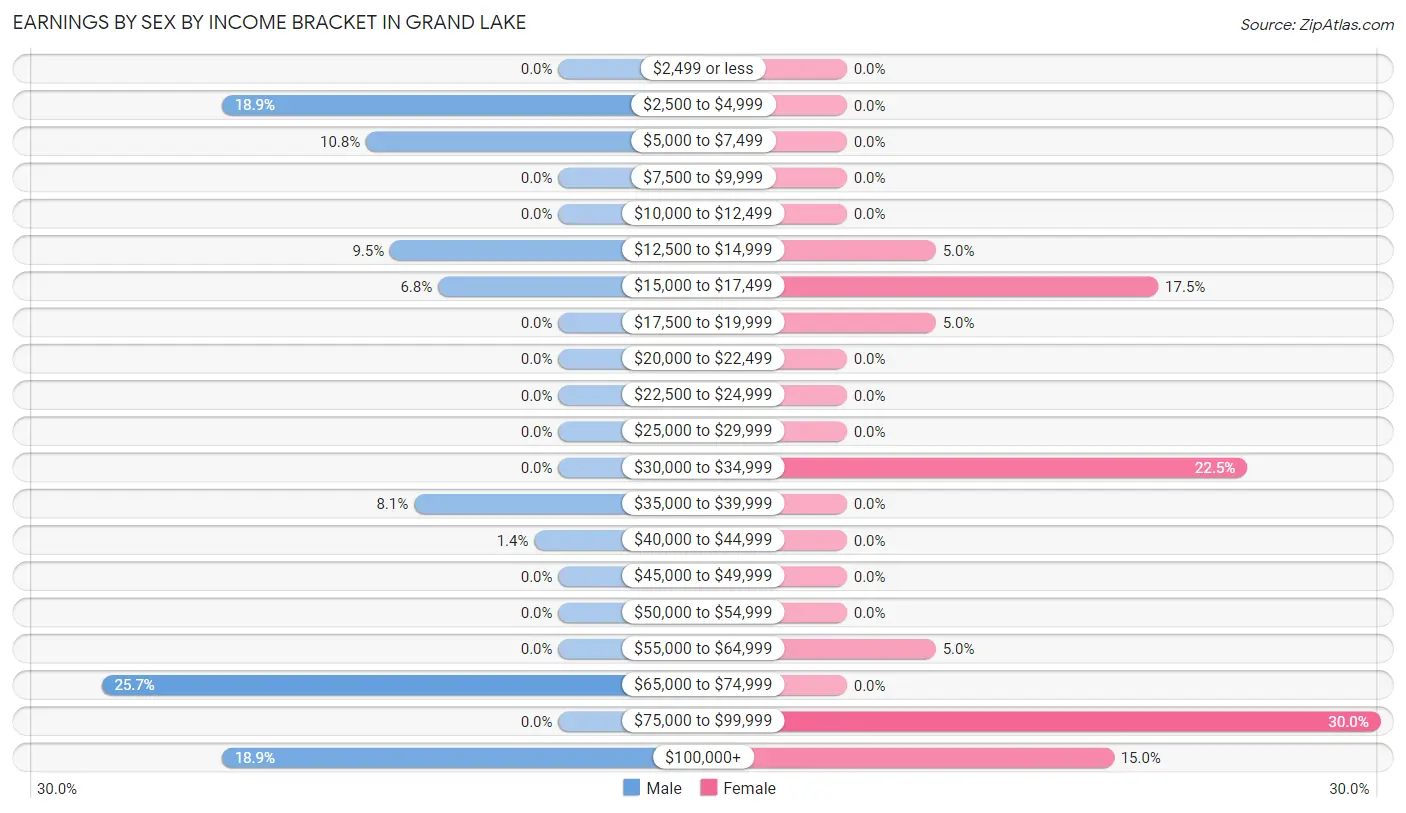
Earnings by Sex by Income Bracket in Grand Lake
The most common earnings brackets in Grand Lake are $65,000 to $74,999 for men (19 | 25.7%) and $75,000 to $99,999 for women (24 | 30.0%).
| Income | Male | Female |
| $2,499 or less | 0 (0.0%) | 0 (0.0%) |
| $2,500 to $4,999 | 14 (18.9%) | 0 (0.0%) |
| $5,000 to $7,499 | 8 (10.8%) | 0 (0.0%) |
| $7,500 to $9,999 | 0 (0.0%) | 0 (0.0%) |
| $10,000 to $12,499 | 0 (0.0%) | 0 (0.0%) |
| $12,500 to $14,999 | 7 (9.5%) | 4 (5.0%) |
| $15,000 to $17,499 | 5 (6.8%) | 14 (17.5%) |
| $17,500 to $19,999 | 0 (0.0%) | 4 (5.0%) |
| $20,000 to $22,499 | 0 (0.0%) | 0 (0.0%) |
| $22,500 to $24,999 | 0 (0.0%) | 0 (0.0%) |
| $25,000 to $29,999 | 0 (0.0%) | 0 (0.0%) |
| $30,000 to $34,999 | 0 (0.0%) | 18 (22.5%) |
| $35,000 to $39,999 | 6 (8.1%) | 0 (0.0%) |
| $40,000 to $44,999 | 1 (1.3%) | 0 (0.0%) |
| $45,000 to $49,999 | 0 (0.0%) | 0 (0.0%) |
| $50,000 to $54,999 | 0 (0.0%) | 0 (0.0%) |
| $55,000 to $64,999 | 0 (0.0%) | 4 (5.0%) |
| $65,000 to $74,999 | 19 (25.7%) | 0 (0.0%) |
| $75,000 to $99,999 | 0 (0.0%) | 24 (30.0%) |
| $100,000+ | 14 (18.9%) | 12 (15.0%) |
| Total | 74 (100.0%) | 80 (100.0%) |
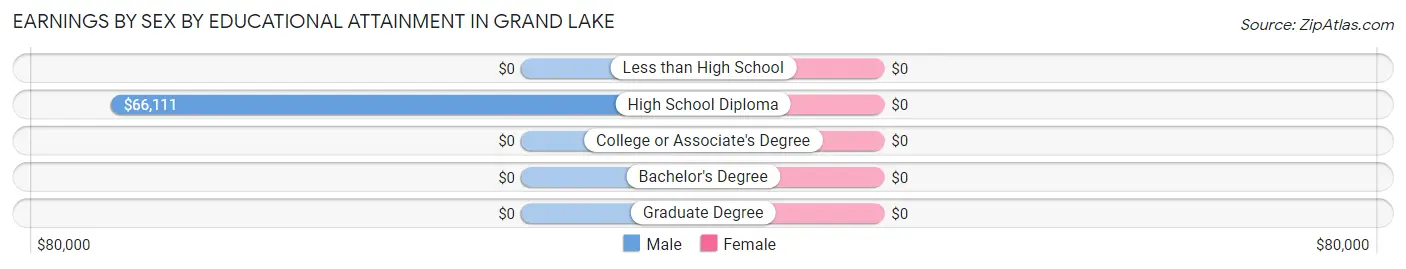
Earnings by Sex by Educational Attainment in Grand Lake
| Educational Attainment | Male Income | Female Income |
| Less than High School | - | - |
| High School Diploma | $66,111 | $0 |
| College or Associate's Degree | - | - |
| Bachelor's Degree | - | - |
| Graduate Degree | - | - |
| Total | - | - |
Family Income in Grand Lake
Family Income Brackets in Grand Lake
According to the Grand Lake family income data, there are 22 families falling into the $100,000 to $149,999 income range, which is the most common income bracket and makes up 34.4% of all families.
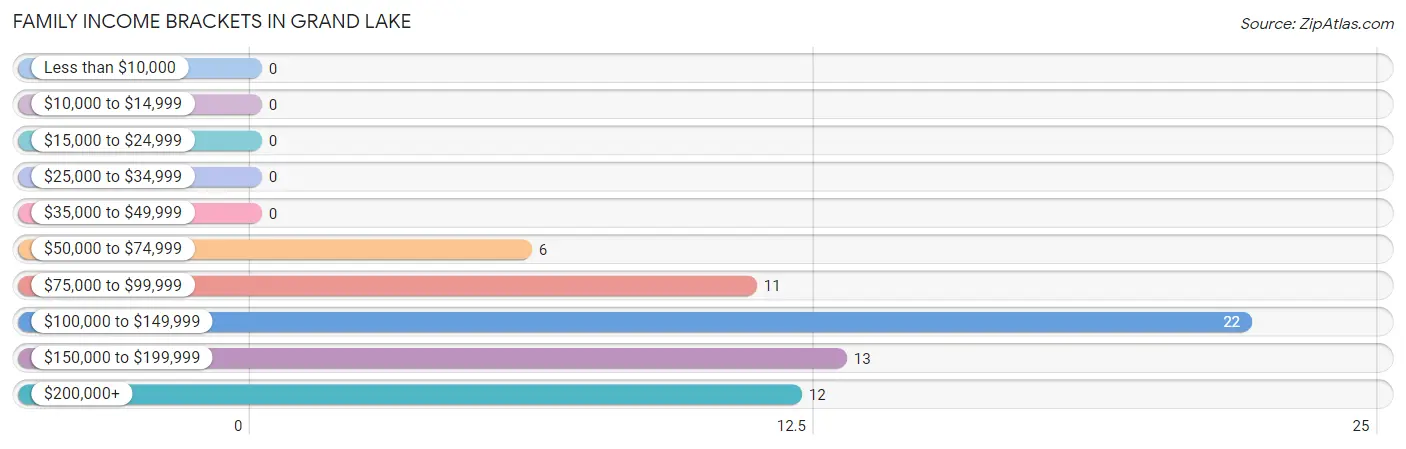
| Income Bracket | # Families | % Families |
| Less than $10,000 | 0 | 0.0% |
| $10,000 to $14,999 | 0 | 0.0% |
| $15,000 to $24,999 | 0 | 0.0% |
| $25,000 to $34,999 | 0 | 0.0% |
| $35,000 to $49,999 | 0 | 0.0% |
| $50,000 to $74,999 | 6 | 9.4% |
| $75,000 to $99,999 | 11 | 17.2% |
| $100,000 to $149,999 | 22 | 34.4% |
| $150,000 to $199,999 | 13 | 20.3% |
| $200,000+ | 12 | 18.8% |
Family Income by Famaliy Size in Grand Lake
| Income Bracket | # Families | Median Income |
| 2-Person Families | 57 (89.1%) | $0 |
| 3-Person Families | 7 (10.9%) | $0 |
| 4-Person Families | 0 (0.0%) | $0 |
| 5-Person Families | 0 (0.0%) | $0 |
| 6-Person Families | 0 (0.0%) | $0 |
| 7+ Person Families | 0 (0.0%) | $0 |
| Total | 64 (100.0%) | $137,813 |
Family Income by Number of Earners in Grand Lake
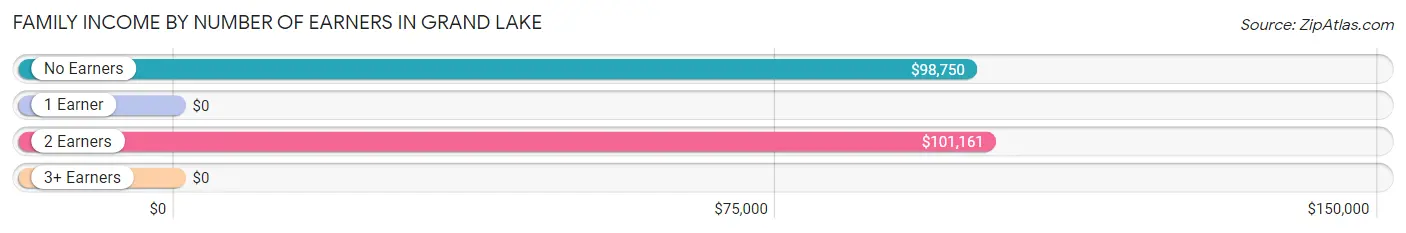
| Number of Earners | # Families | Median Income |
| No Earners | 19 (29.7%) | $98,750 |
| 1 Earner | 20 (31.2%) | $0 |
| 2 Earners | 25 (39.1%) | $101,161 |
| 3+ Earners | 0 (0.0%) | $0 |
| Total | 64 (100.0%) | $137,813 |
Household Income in Grand Lake
Household Income Brackets in Grand Lake
With 56 households falling in the category, the $35,000 to $49,999 income range is the most frequent in Grand Lake, accounting for 32.4% of all households.
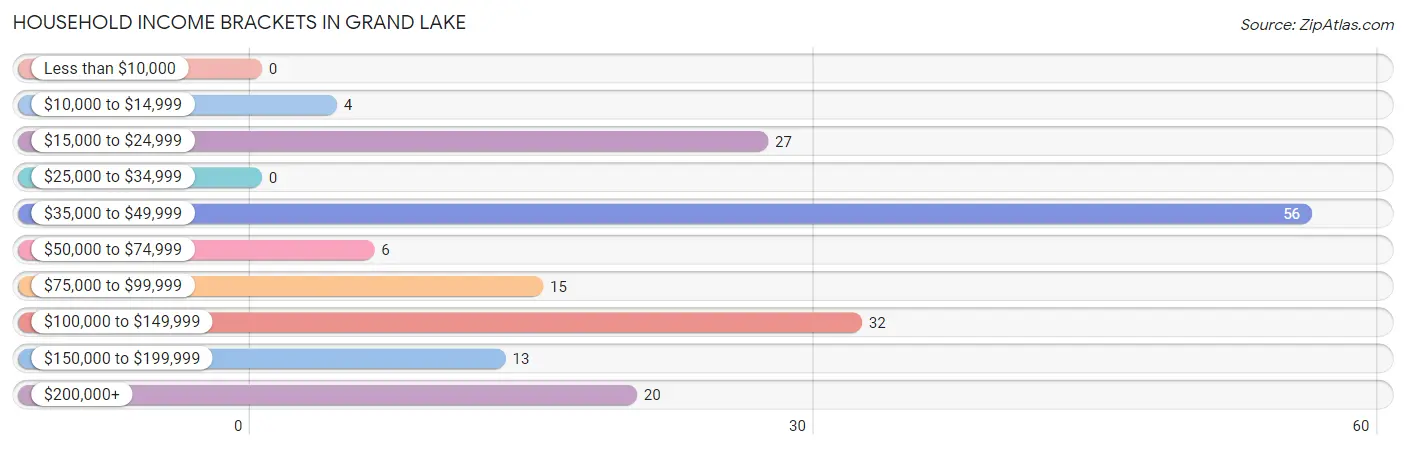
| Income Bracket | # Households | % Households |
| Less than $10,000 | 0 | 0.0% |
| $10,000 to $14,999 | 4 | 2.3% |
| $15,000 to $24,999 | 27 | 15.6% |
| $25,000 to $34,999 | 0 | 0.0% |
| $35,000 to $49,999 | 56 | 32.4% |
| $50,000 to $74,999 | 6 | 3.5% |
| $75,000 to $99,999 | 15 | 8.7% |
| $100,000 to $149,999 | 32 | 18.5% |
| $150,000 to $199,999 | 13 | 7.5% |
| $200,000+ | 20 | 11.6% |
Household Income by Householder Age in Grand Lake
The median household income in Grand Lake is $0, with the highest median household income of $100,893 found in the 45 to 64 years age bracket for the primary householder. A total of 54 households (31.2%) fall into this category.
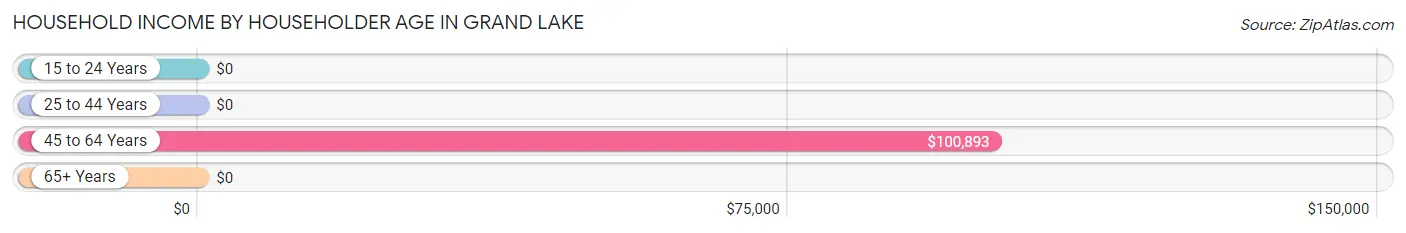
| Income Bracket | # Households | Median Income |
| 15 to 24 Years | 0 (0.0%) | $0 |
| 25 to 44 Years | 16 (9.2%) | $0 |
| 45 to 64 Years | 54 (31.2%) | $100,893 |
| 65+ Years | 103 (59.5%) | $0 |
| Total | 173 (100.0%) | $0 |
Poverty in Grand Lake
Income Below Poverty by Sex and Age in Grand Lake
With 15.7% poverty level for males and 8.8% for females among the residents of Grand Lake, 45 to 54 year old males and 35 to 44 year old females are the most vulnerable to poverty, with 14 males (70.0%) and 4 females (100.0%) in their respective age groups living below the poverty level.
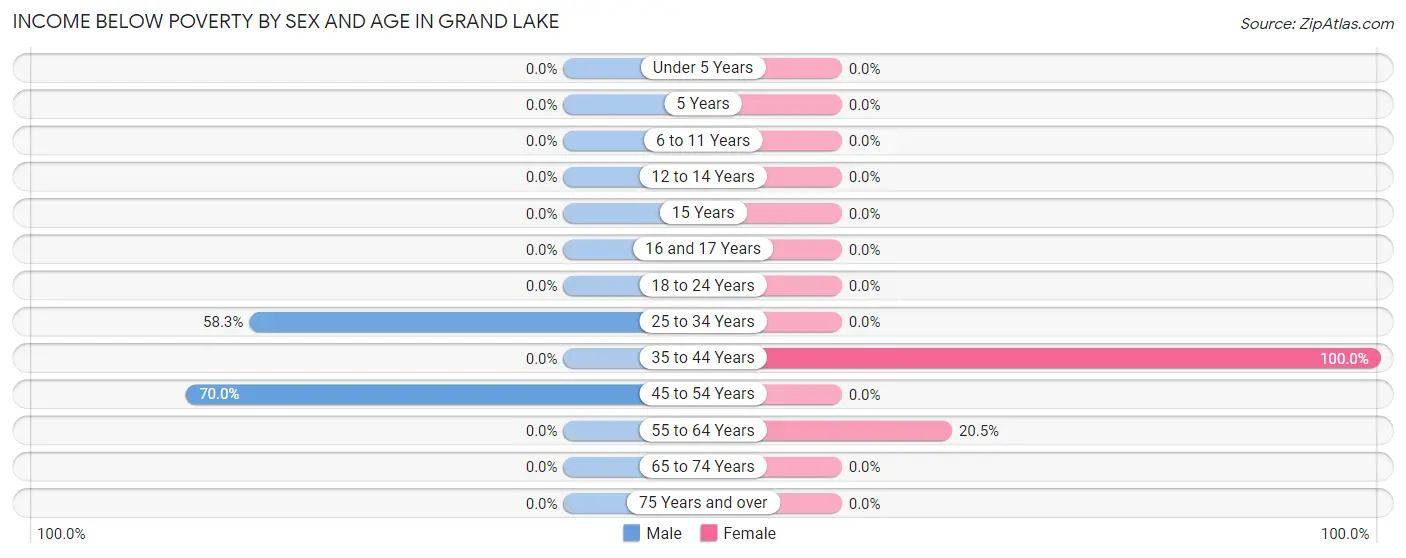
| Age Bracket | Male | Female |
| Under 5 Years | 0 (0.0%) | 0 (0.0%) |
| 5 Years | 0 (0.0%) | 0 (0.0%) |
| 6 to 11 Years | 0 (0.0%) | 0 (0.0%) |
| 12 to 14 Years | 0 (0.0%) | 0 (0.0%) |
| 15 Years | 0 (0.0%) | 0 (0.0%) |
| 16 and 17 Years | 0 (0.0%) | 0 (0.0%) |
| 18 to 24 Years | 0 (0.0%) | 0 (0.0%) |
| 25 to 34 Years | 7 (58.3%) | 0 (0.0%) |
| 35 to 44 Years | 0 (0.0%) | 4 (100.0%) |
| 45 to 54 Years | 14 (70.0%) | 0 (0.0%) |
| 55 to 64 Years | 0 (0.0%) | 9 (20.4%) |
| 65 to 74 Years | 0 (0.0%) | 0 (0.0%) |
| 75 Years and over | 0 (0.0%) | 0 (0.0%) |
| Total | 21 (15.7%) | 13 (8.8%) |
Income Above Poverty by Sex and Age in Grand Lake
According to the poverty statistics in Grand Lake, males aged 12 to 14 years and females aged 15 years are the age groups that are most secure financially, with 100.0% of males and 100.0% of females in these age groups living above the poverty line.
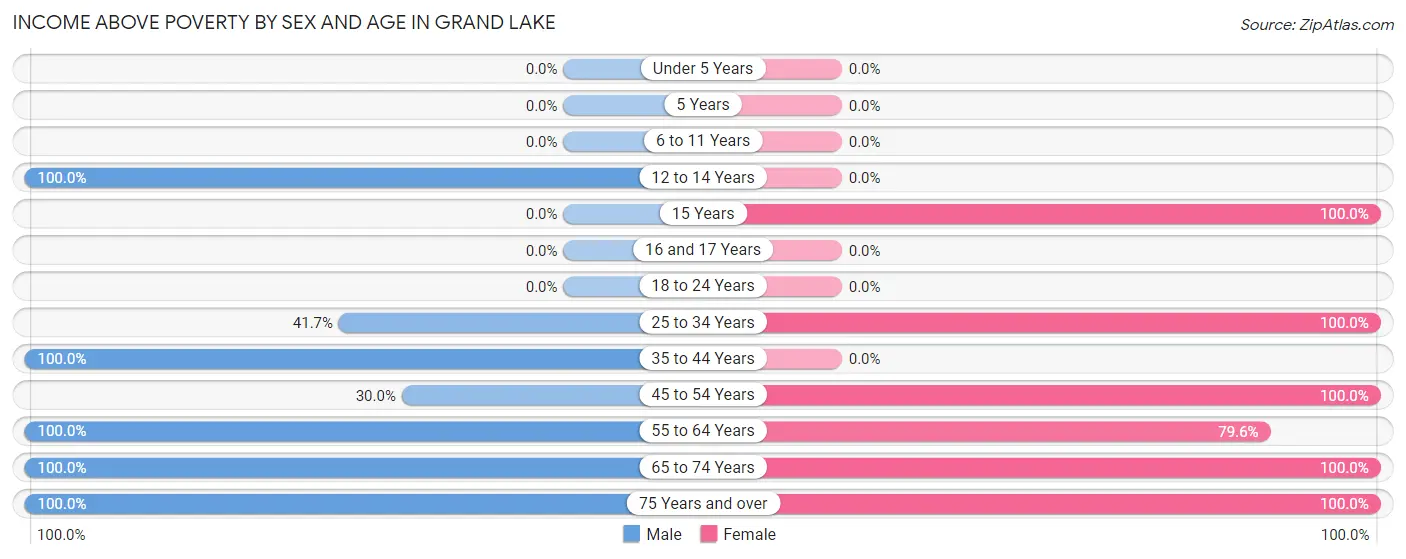
| Age Bracket | Male | Female |
| Under 5 Years | 0 (0.0%) | 0 (0.0%) |
| 5 Years | 0 (0.0%) | 0 (0.0%) |
| 6 to 11 Years | 0 (0.0%) | 0 (0.0%) |
| 12 to 14 Years | 8 (100.0%) | 0 (0.0%) |
| 15 Years | 0 (0.0%) | 13 (100.0%) |
| 16 and 17 Years | 0 (0.0%) | 0 (0.0%) |
| 18 to 24 Years | 0 (0.0%) | 0 (0.0%) |
| 25 to 34 Years | 5 (41.7%) | 4 (100.0%) |
| 35 to 44 Years | 5 (100.0%) | 0 (0.0%) |
| 45 to 54 Years | 6 (30.0%) | 12 (100.0%) |
| 55 to 64 Years | 15 (100.0%) | 35 (79.5%) |
| 65 to 74 Years | 41 (100.0%) | 17 (100.0%) |
| 75 Years and over | 33 (100.0%) | 53 (100.0%) |
| Total | 113 (84.3%) | 134 (91.2%) |
Income Below Poverty Among Married-Couple Families in Grand Lake
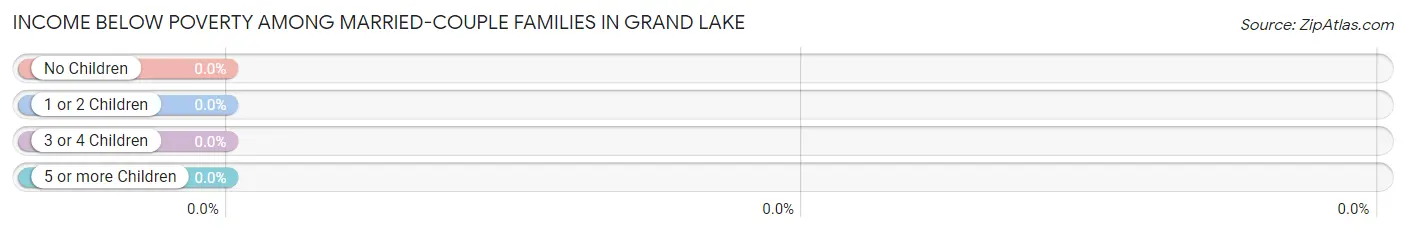
| Children | Above Poverty | Below Poverty |
| No Children | 57 (100.0%) | 0 (0.0%) |
| 1 or 2 Children | 0 (0.0%) | 0 (0.0%) |
| 3 or 4 Children | 0 (0.0%) | 0 (0.0%) |
| 5 or more Children | 0 (0.0%) | 0 (0.0%) |
| Total | 57 (100.0%) | 0 (0.0%) |
Income Below Poverty Among Single-Parent Households in Grand Lake
| Children | Single Father | Single Mother |
| No Children | 0 (0.0%) | 0 (0.0%) |
| 1 or 2 Children | 0 (0.0%) | 0 (0.0%) |
| 3 or 4 Children | 0 (0.0%) | 0 (0.0%) |
| 5 or more Children | 0 (0.0%) | 0 (0.0%) |
| Total | 0 (0.0%) | 0 (0.0%) |
Income Below Poverty Among Married-Couple vs Single-Parent Households in Grand Lake
| Children | Married-Couple Families | Single-Parent Households |
| No Children | 0 (0.0%) | 0 (0.0%) |
| 1 or 2 Children | 0 (0.0%) | 0 (0.0%) |
| 3 or 4 Children | 0 (0.0%) | 0 (0.0%) |
| 5 or more Children | 0 (0.0%) | 0 (0.0%) |
| Total | 0 (0.0%) | 0 (0.0%) |
Race in Grand Lake
The most populous races in Grand Lake are White / Caucasian (267 | 95.0%), and Two or more Races (14 | 5.0%).
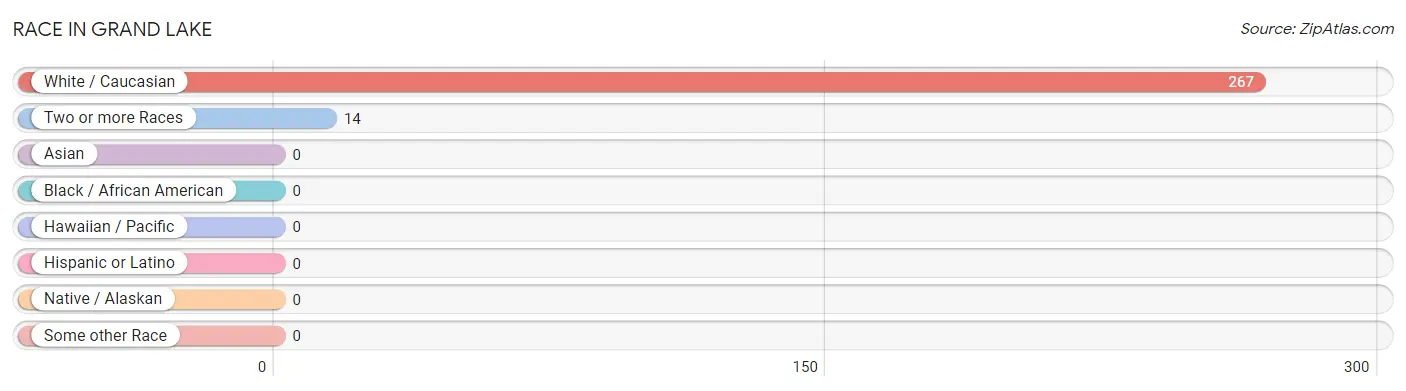
| Race | # Population | % Population |
| Asian | 0 | 0.0% |
| Black / African American | 0 | 0.0% |
| Hawaiian / Pacific | 0 | 0.0% |
| Hispanic or Latino | 0 | 0.0% |
| Native / Alaskan | 0 | 0.0% |
| White / Caucasian | 267 | 95.0% |
| Two or more Races | 14 | 5.0% |
| Some other Race | 0 | 0.0% |
| Total | 281 | 100.0% |
Ancestry in Grand Lake
The most populous ancestries reported in Grand Lake are German (72 | 25.6%), English (47 | 16.7%), Irish (41 | 14.6%), Scottish (25 | 8.9%), and French (24 | 8.5%), together accounting for 74.4% of all Grand Lake residents.
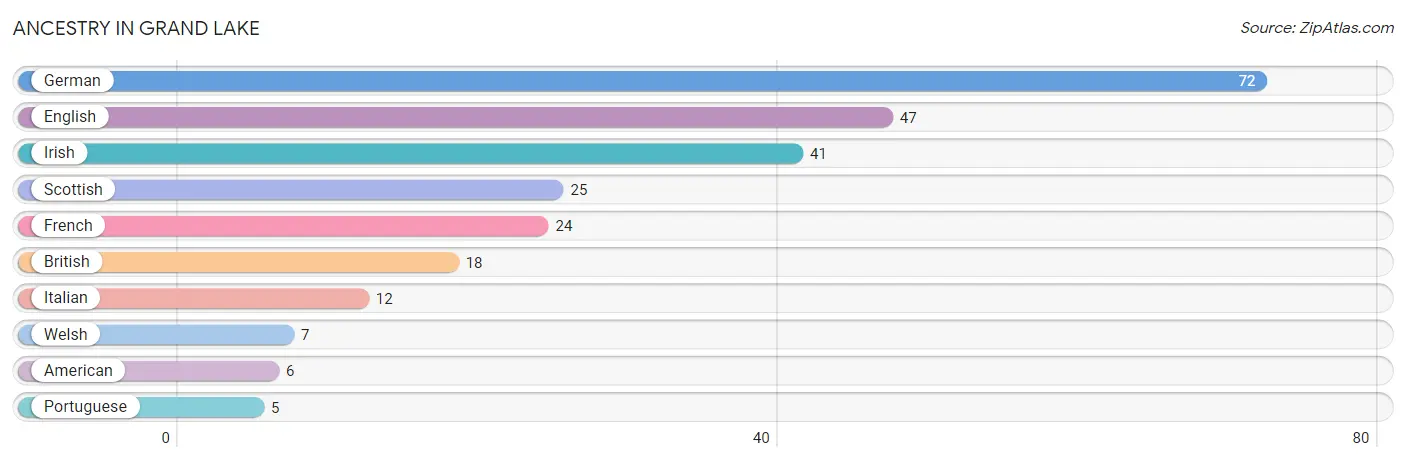
| Ancestry | # Population | % Population |
| American | 6 | 2.1% |
| British | 18 | 6.4% |
| English | 47 | 16.7% |
| French | 24 | 8.5% |
| German | 72 | 25.6% |
| Irish | 41 | 14.6% |
| Italian | 12 | 4.3% |
| Portuguese | 5 | 1.8% |
| Scottish | 25 | 8.9% |
| Welsh | 7 | 2.5% | View All 10 Rows |
Immigrants in Grand Lake

| Immigration Origin | # Population | % Population | View All 0 Rows |
Sex and Age in Grand Lake
Sex and Age in Grand Lake
The most populous age groups in Grand Lake are 70 to 74 Years (30 | 22.4%) for men and 80 to 84 Years (53 | 36.0%) for women.
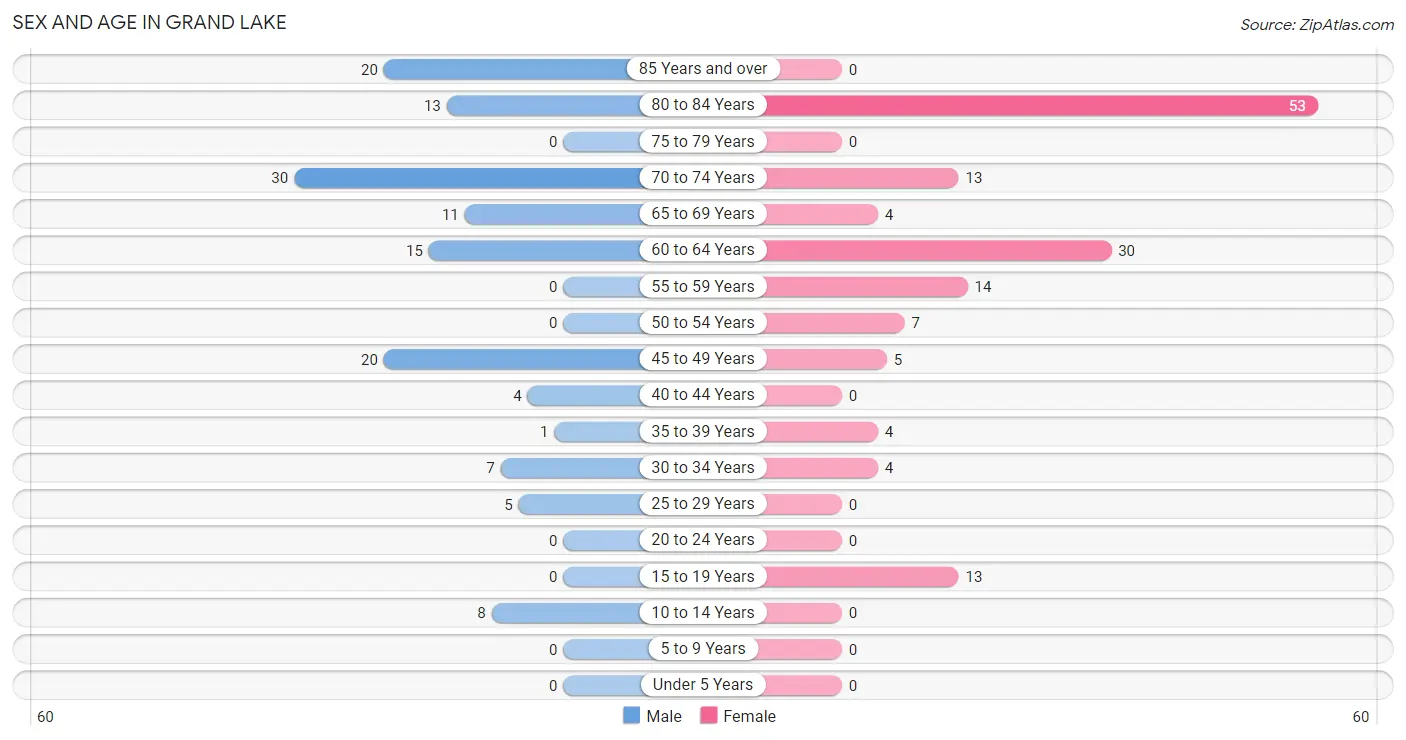
| Age Bracket | Male | Female |
| Under 5 Years | 0 (0.0%) | 0 (0.0%) |
| 5 to 9 Years | 0 (0.0%) | 0 (0.0%) |
| 10 to 14 Years | 8 (6.0%) | 0 (0.0%) |
| 15 to 19 Years | 0 (0.0%) | 13 (8.8%) |
| 20 to 24 Years | 0 (0.0%) | 0 (0.0%) |
| 25 to 29 Years | 5 (3.7%) | 0 (0.0%) |
| 30 to 34 Years | 7 (5.2%) | 4 (2.7%) |
| 35 to 39 Years | 1 (0.7%) | 4 (2.7%) |
| 40 to 44 Years | 4 (3.0%) | 0 (0.0%) |
| 45 to 49 Years | 20 (14.9%) | 5 (3.4%) |
| 50 to 54 Years | 0 (0.0%) | 7 (4.8%) |
| 55 to 59 Years | 0 (0.0%) | 14 (9.5%) |
| 60 to 64 Years | 15 (11.2%) | 30 (20.4%) |
| 65 to 69 Years | 11 (8.2%) | 4 (2.7%) |
| 70 to 74 Years | 30 (22.4%) | 13 (8.8%) |
| 75 to 79 Years | 0 (0.0%) | 0 (0.0%) |
| 80 to 84 Years | 13 (9.7%) | 53 (36.0%) |
| 85 Years and over | 20 (14.9%) | 0 (0.0%) |
| Total | 134 (100.0%) | 147 (100.0%) |
Families and Households in Grand Lake
Median Family Size in Grand Lake
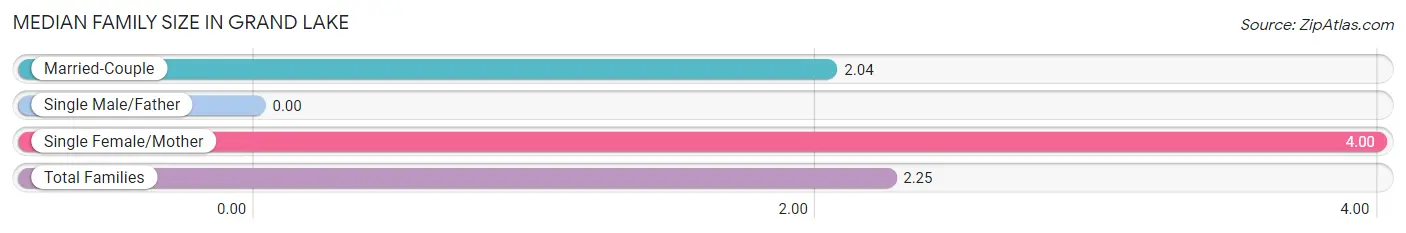
| Family Type | # Families | Family Size |
| Married-Couple | 57 (89.1%) | 2.04 |
| Single Male/Father | 0 (0.0%) | - |
| Single Female/Mother | 7 (10.9%) | 4.00 |
| Total Families | 64 (100.0%) | 2.25 |
Median Household Size in Grand Lake
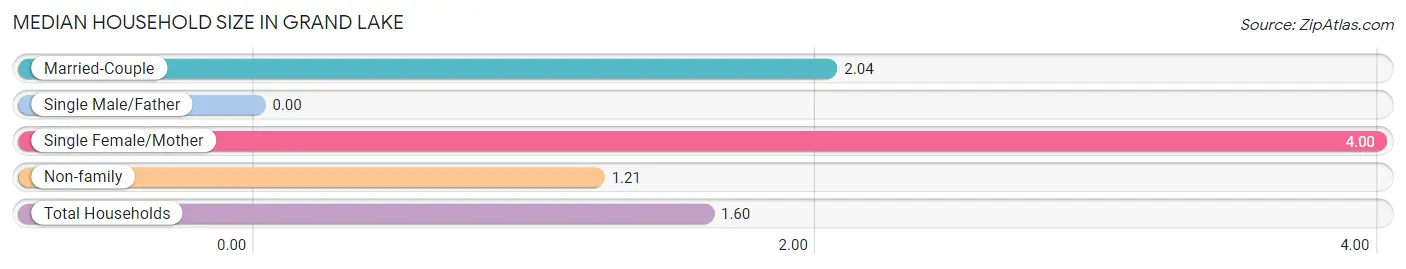
| Household Type | # Households | Household Size |
| Married-Couple | 57 (33.0%) | 2.04 |
| Single Male/Father | 0 (0.0%) | - |
| Single Female/Mother | 7 (4.1%) | 4.00 |
| Non-family | 109 (63.0%) | 1.21 |
| Total Households | 173 (100.0%) | 1.60 |
Household Size by Marriage Status in Grand Lake
Out of a total of 173 households in Grand Lake, 64 (37.0%) are family households, while 109 (63.0%) are nonfamily households. The most numerous type of family households are 2-person households, comprising 57, and the most common type of nonfamily households are 1-person households, comprising 96.
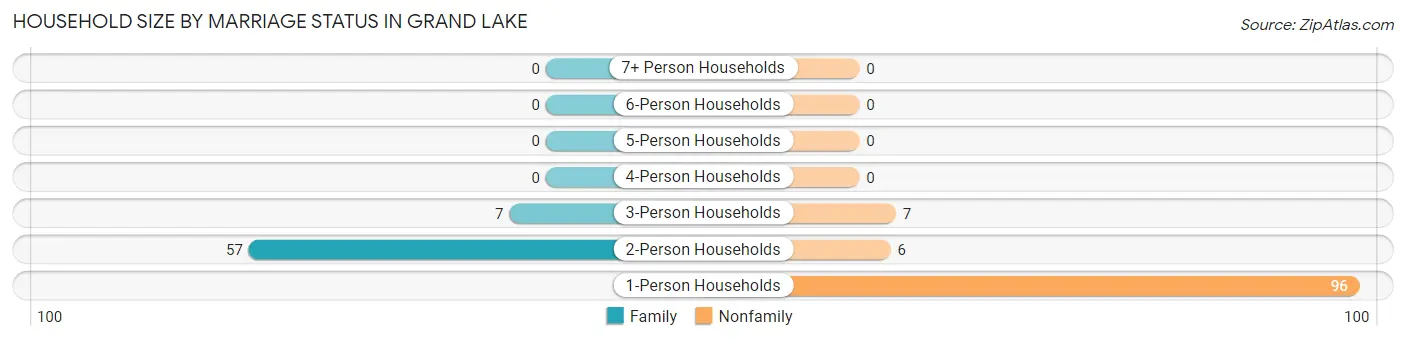
| Household Size | Family Households | Nonfamily Households |
| 1-Person Households | - | 96 (55.5%) |
| 2-Person Households | 57 (33.0%) | 6 (3.5%) |
| 3-Person Households | 7 (4.1%) | 7 (4.1%) |
| 4-Person Households | 0 (0.0%) | 0 (0.0%) |
| 5-Person Households | 0 (0.0%) | 0 (0.0%) |
| 6-Person Households | 0 (0.0%) | 0 (0.0%) |
| 7+ Person Households | 0 (0.0%) | 0 (0.0%) |
| Total | 64 (37.0%) | 109 (63.0%) |
Female Fertility in Grand Lake
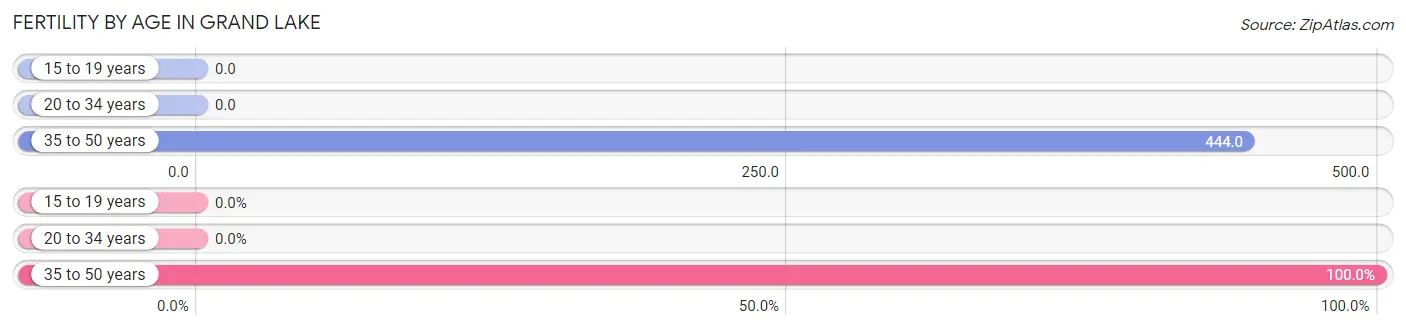
Fertility by Age in Grand Lake
Average fertility rate in Grand Lake is 154.0 births per 1,000 women. Women in the age bracket of 35 to 50 years have the highest fertility rate with 444.0 births per 1,000 women. Women in the age bracket of 35 to 50 years acount for 100.0% of all women with births.
| Age Bracket | Women with Births | Births / 1,000 Women |
| 15 to 19 years | 0 (0.0%) | 0.0 |
| 20 to 34 years | 0 (0.0%) | 0.0 |
| 35 to 50 years | 4 (100.0%) | 444.0 |
| Total | 4 (100.0%) | 154.0 |
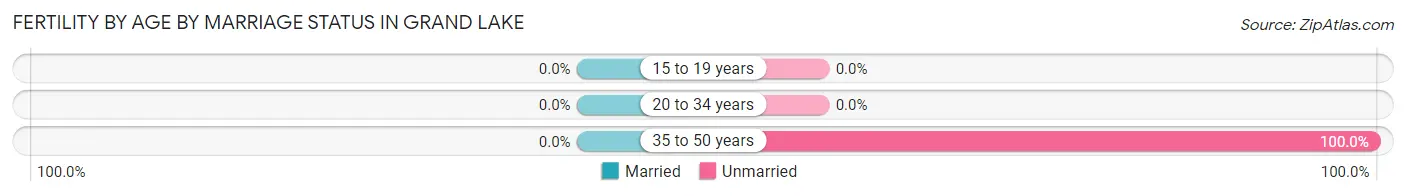
Fertility by Age by Marriage Status in Grand Lake
| Age Bracket | Married | Unmarried |
| 15 to 19 years | 0 (0.0%) | 0 (0.0%) |
| 20 to 34 years | 0 (0.0%) | 0 (0.0%) |
| 35 to 50 years | 0 (0.0%) | 4 (100.0%) |
| Total | 0 (0.0%) | 4 (100.0%) |
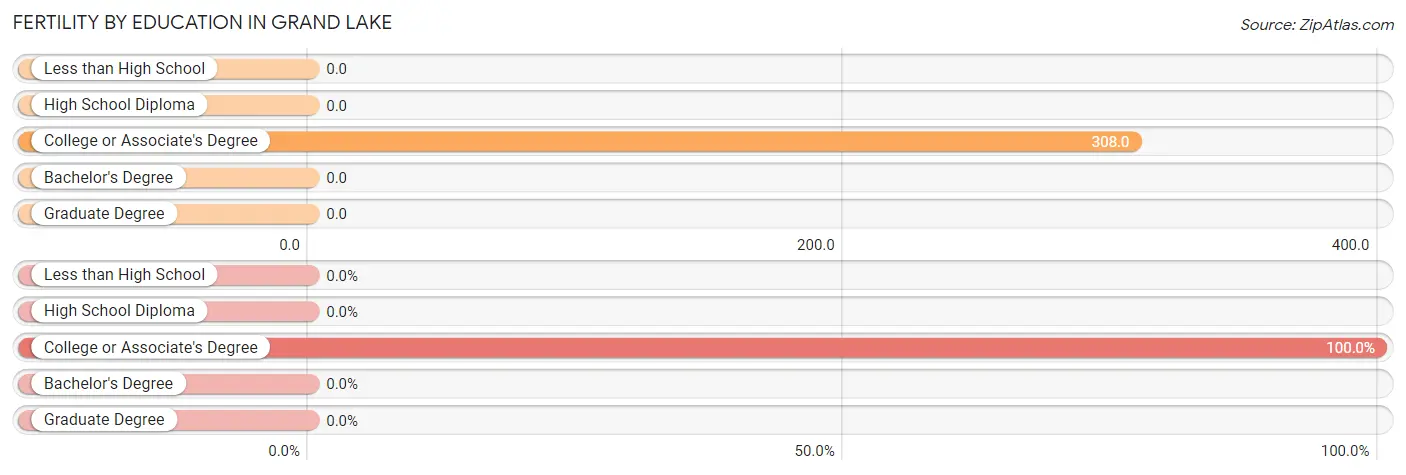
Fertility by Education in Grand Lake
| Educational Attainment | Women with Births | Births / 1,000 Women |
| Less than High School | 0 (0.0%) | 0.0 |
| High School Diploma | 0 (0.0%) | 0.0 |
| College or Associate's Degree | 4 (100.0%) | 308.0 |
| Bachelor's Degree | 0 (0.0%) | 0.0 |
| Graduate Degree | 0 (0.0%) | 0.0 |
| Total | 4 (100.0%) | 154.0 |
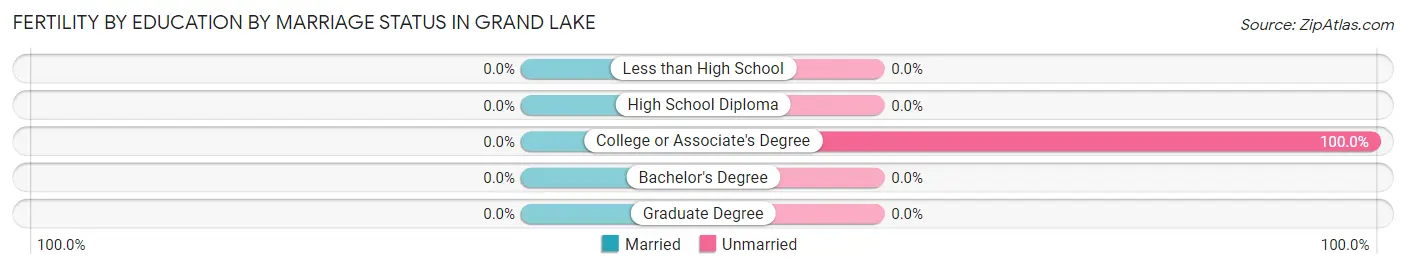
Fertility by Education by Marriage Status in Grand Lake
| Educational Attainment | Married | Unmarried |
| Less than High School | 0 (0.0%) | 0 (0.0%) |
| High School Diploma | 0 (0.0%) | 0 (0.0%) |
| College or Associate's Degree | 0 (0.0%) | 4 (100.0%) |
| Bachelor's Degree | 0 (0.0%) | 0 (0.0%) |
| Graduate Degree | 0 (0.0%) | 0 (0.0%) |
| Total | 0 (0.0%) | 4 (100.0%) |
Employment Characteristics in Grand Lake
Employment by Class of Employer in Grand Lake
Among the 150 employed individuals in Grand Lake, private company employees (101 | 67.3%), self-employed (incorporated) (23 | 15.3%), and local government employees (15 | 10.0%) make up the most common classes of employment.
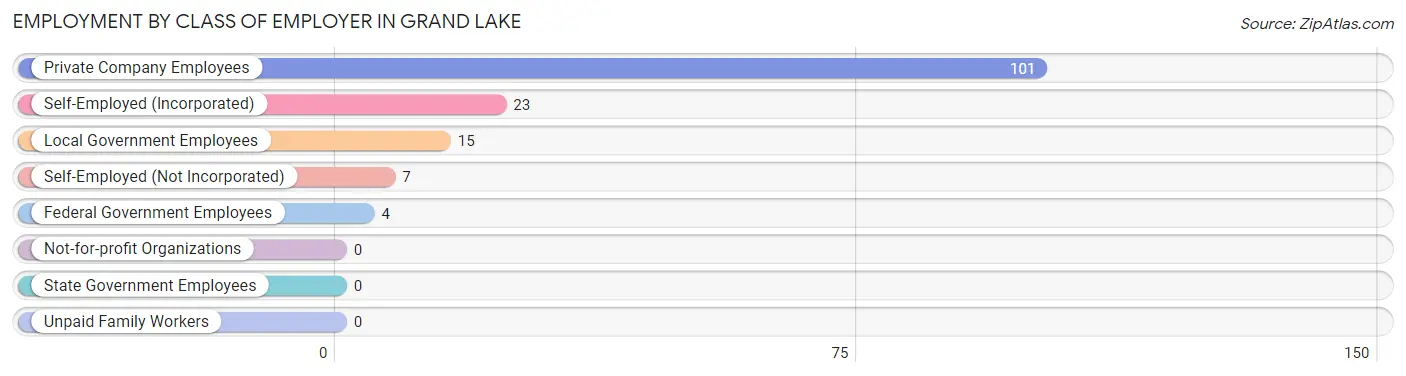
| Employer Class | # Employees | % Employees |
| Private Company Employees | 101 | 67.3% |
| Self-Employed (Incorporated) | 23 | 15.3% |
| Self-Employed (Not Incorporated) | 7 | 4.7% |
| Not-for-profit Organizations | 0 | 0.0% |
| Local Government Employees | 15 | 10.0% |
| State Government Employees | 0 | 0.0% |
| Federal Government Employees | 4 | 2.7% |
| Unpaid Family Workers | 0 | 0.0% |
| Total | 150 | 100.0% |
Employment Status by Age in Grand Lake
According to the labor force statistics for Grand Lake, out of the total population over 16 years of age (260), 59.2% or 154 individuals are in the labor force, with 2.6% or 4 of them unemployed. The age group with the highest labor force participation rate is 25 to 29 years, with 100.0% or 5 individuals in the labor force. Within the labor force, the 30 to 34 years age range has the highest percentage of unemployed individuals, with 36.4% or 4 of them being unemployed.
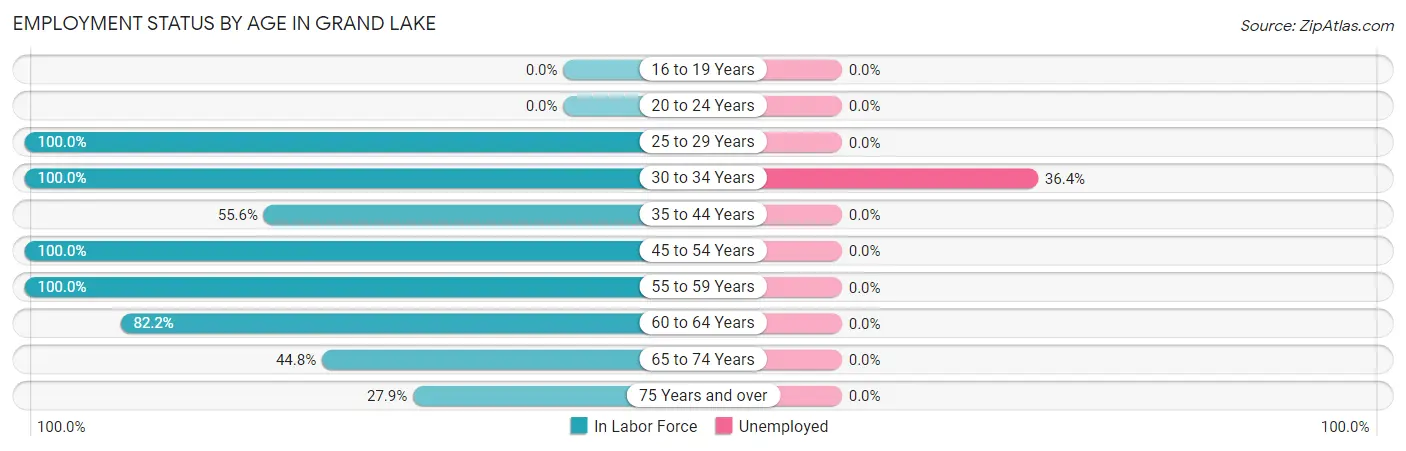
| Age Bracket | In Labor Force | Unemployed |
| 16 to 19 Years | 0 (0.0%) | 0 (0.0%) |
| 20 to 24 Years | 0 (0.0%) | 0 (0.0%) |
| 25 to 29 Years | 5 (100.0%) | 0 (0.0%) |
| 30 to 34 Years | 11 (100.0%) | 4 (36.4%) |
| 35 to 44 Years | 5 (55.6%) | 0 (0.0%) |
| 45 to 54 Years | 32 (100.0%) | 0 (0.0%) |
| 55 to 59 Years | 14 (100.0%) | 0 (0.0%) |
| 60 to 64 Years | 37 (82.2%) | 0 (0.0%) |
| 65 to 74 Years | 26 (44.8%) | 0 (0.0%) |
| 75 Years and over | 24 (27.9%) | 0 (0.0%) |
| Total | 154 (59.2%) | 4 (2.6%) |
Employment Status by Educational Attainment in Grand Lake
According to labor force statistics for Grand Lake, 89.7% of individuals (104) out of the total population between 25 and 64 years of age (116) are in the labor force, with 3.8% or 4 of them being unemployed. The group with the highest labor force participation rate are those with the educational attainment of less than high school, with 100.0% or 14 individuals in the labor force. Within the labor force, individuals with college / associate degree education have the highest percentage of unemployment, with 8.3% or 4 of them being unemployed.
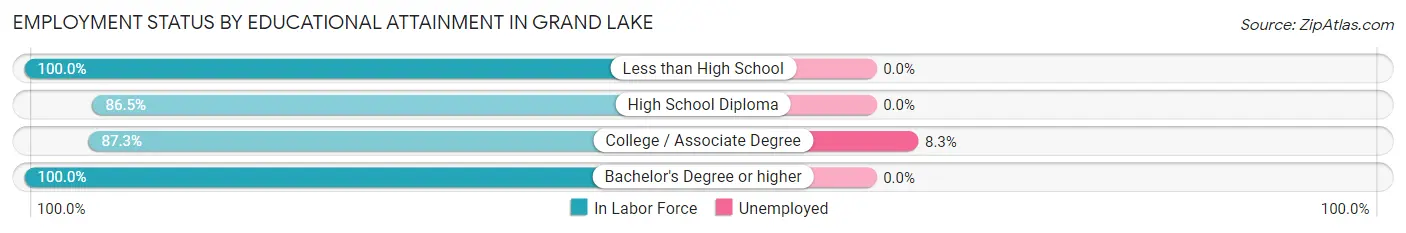
| Educational Attainment | In Labor Force | Unemployed |
| Less than High School | 14 (100.0%) | 0 (0.0%) |
| High School Diploma | 32 (86.5%) | 0 (0.0%) |
| College / Associate Degree | 48 (87.3%) | 5 (8.3%) |
| Bachelor's Degree or higher | 10 (100.0%) | 0 (0.0%) |
| Total | 104 (89.7%) | 4 (3.8%) |
Employment Occupations by Sex in Grand Lake
Management, Business, Science and Arts Occupations
The most common Management, Business, Science and Arts occupations in Grand Lake are , and Management (28 | 18.7%).
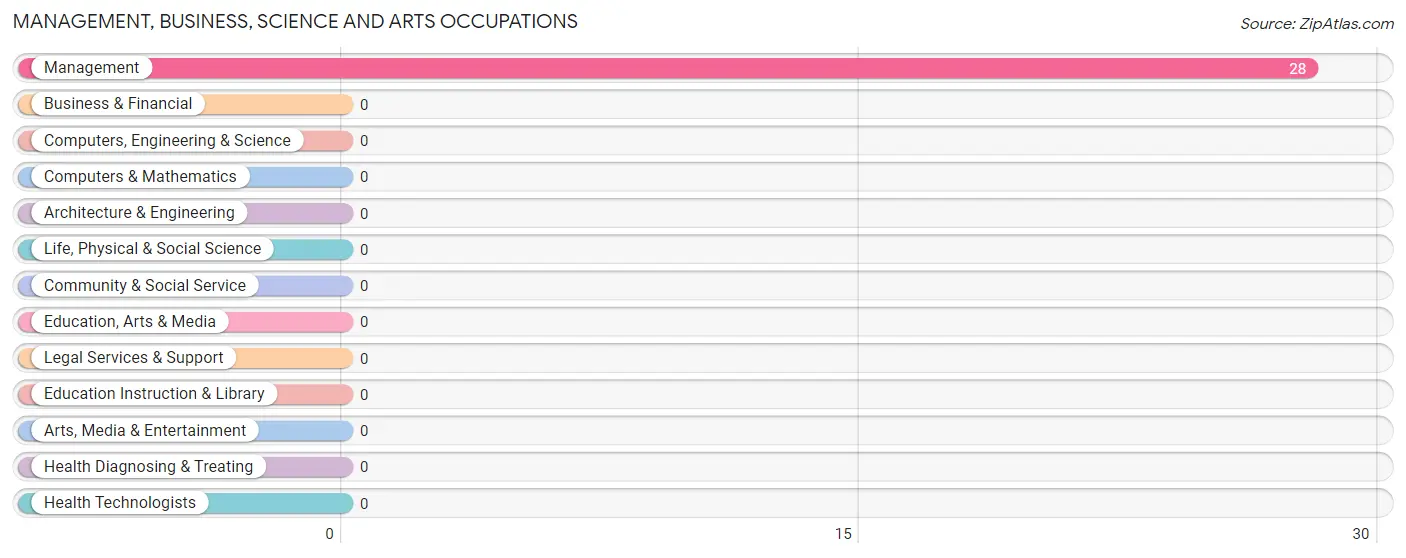
Management, Business, Science and Arts Occupations by Sex
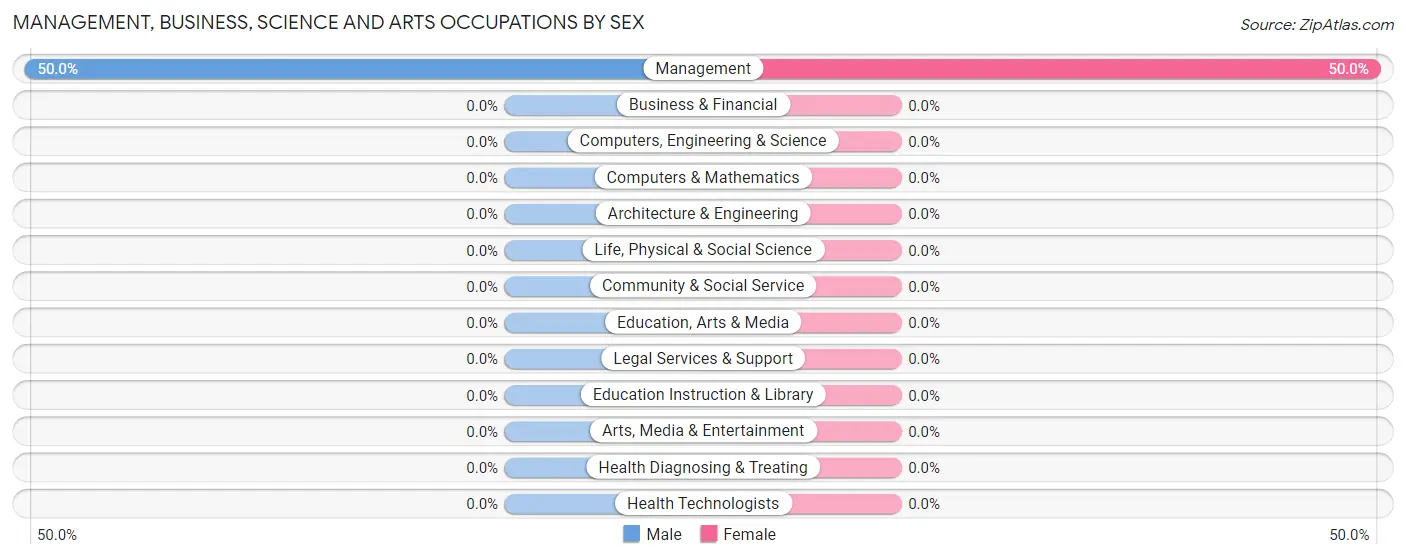
| Occupation | Male | Female |
| Management | 14 (50.0%) | 14 (50.0%) |
| Business & Financial | 0 (0.0%) | 0 (0.0%) |
| Computers, Engineering & Science | 0 (0.0%) | 0 (0.0%) |
| Computers & Mathematics | 0 (0.0%) | 0 (0.0%) |
| Architecture & Engineering | 0 (0.0%) | 0 (0.0%) |
| Life, Physical & Social Science | 0 (0.0%) | 0 (0.0%) |
| Community & Social Service | 0 (0.0%) | 0 (0.0%) |
| Education, Arts & Media | 0 (0.0%) | 0 (0.0%) |
| Legal Services & Support | 0 (0.0%) | 0 (0.0%) |
| Education Instruction & Library | 0 (0.0%) | 0 (0.0%) |
| Arts, Media & Entertainment | 0 (0.0%) | 0 (0.0%) |
| Health Diagnosing & Treating | 0 (0.0%) | 0 (0.0%) |
| Health Technologists | 0 (0.0%) | 0 (0.0%) |
| Total (Category) | 14 (50.0%) | 14 (50.0%) |
| Total (Overall) | 74 (49.3%) | 76 (50.7%) |
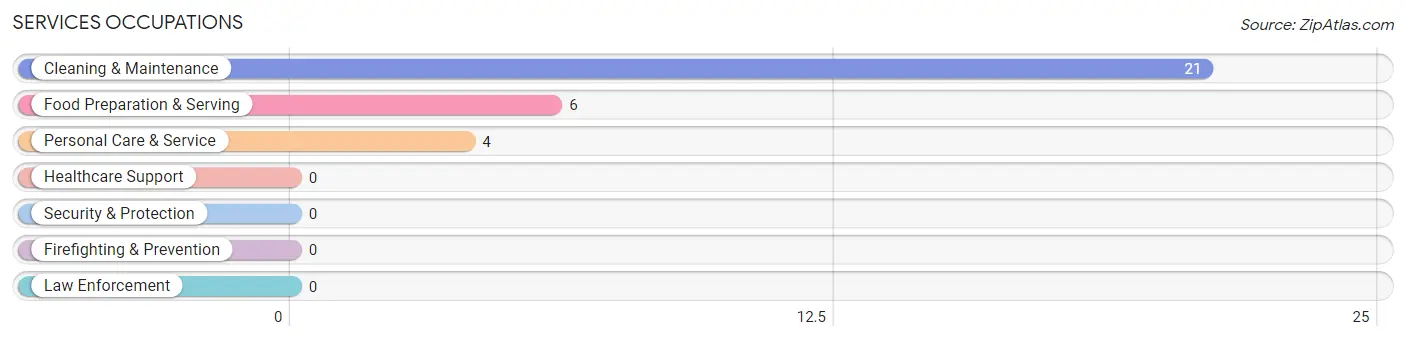
Services Occupations
The most common Services occupations in Grand Lake are Cleaning & Maintenance (21 | 14.0%), Food Preparation & Serving (6 | 4.0%), and Personal Care & Service (4 | 2.7%).
Services Occupations by Sex
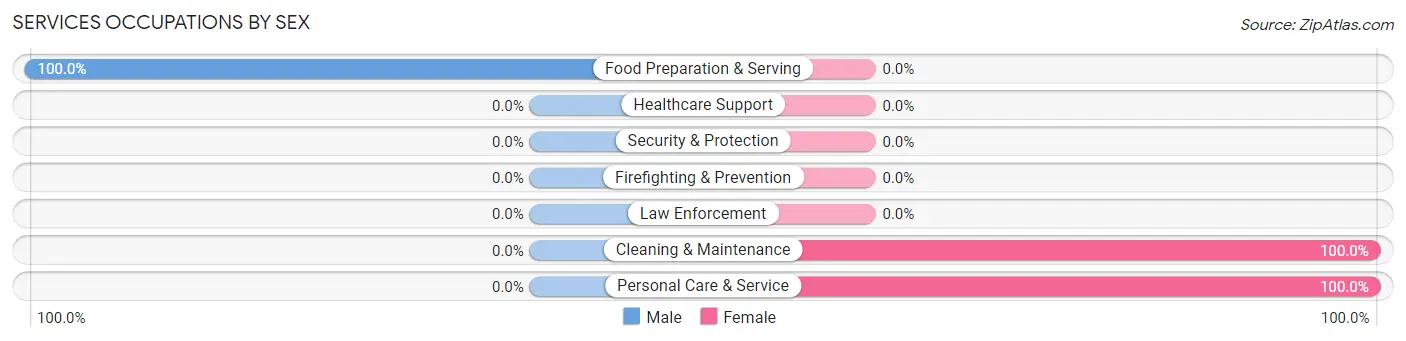
| Occupation | Male | Female |
| Healthcare Support | 0 (0.0%) | 0 (0.0%) |
| Security & Protection | 0 (0.0%) | 0 (0.0%) |
| Firefighting & Prevention | 0 (0.0%) | 0 (0.0%) |
| Law Enforcement | 0 (0.0%) | 0 (0.0%) |
| Food Preparation & Serving | 6 (100.0%) | 0 (0.0%) |
| Cleaning & Maintenance | 0 (0.0%) | 21 (100.0%) |
| Personal Care & Service | 0 (0.0%) | 4 (100.0%) |
| Total (Category) | 6 (19.4%) | 25 (80.6%) |
| Total (Overall) | 74 (49.3%) | 76 (50.7%) |
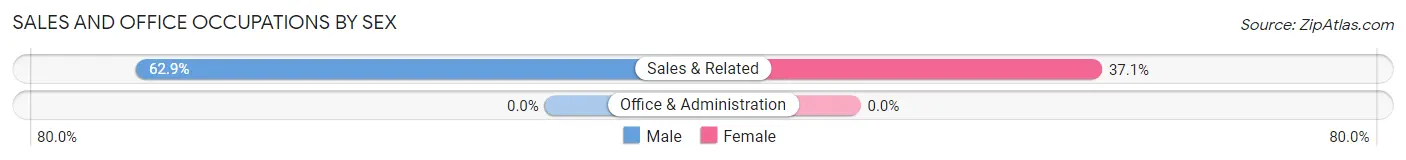
Sales and Office Occupations
The most common Sales and Office occupations in Grand Lake are , and Sales & Related (35 | 23.3%).
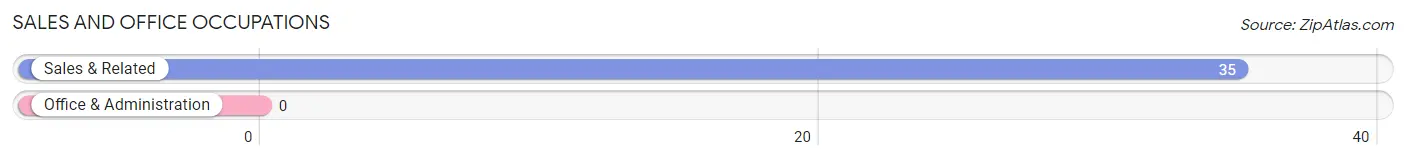
Sales and Office Occupations by Sex
| Occupation | Male | Female |
| Sales & Related | 22 (62.9%) | 13 (37.1%) |
| Office & Administration | 0 (0.0%) | 0 (0.0%) |
| Total (Category) | 22 (62.9%) | 13 (37.1%) |
| Total (Overall) | 74 (49.3%) | 76 (50.7%) |
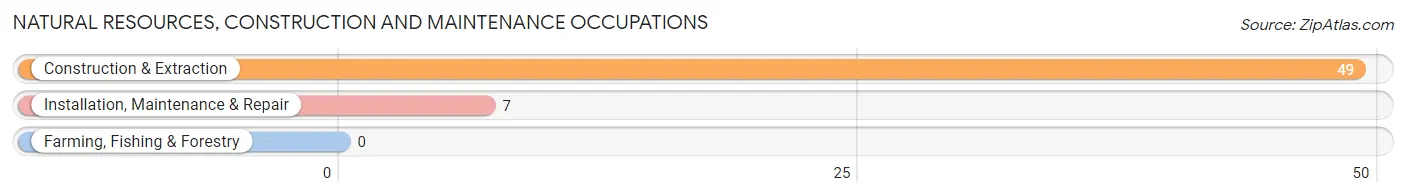
Natural Resources, Construction and Maintenance Occupations
The most common Natural Resources, Construction and Maintenance occupations in Grand Lake are Construction & Extraction (49 | 32.7%), and Installation, Maintenance & Repair (7 | 4.7%).
Natural Resources, Construction and Maintenance Occupations by Sex
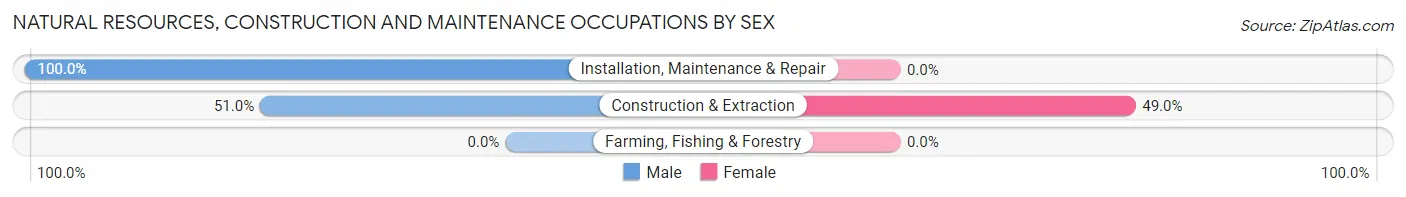
| Occupation | Male | Female |
| Farming, Fishing & Forestry | 0 (0.0%) | 0 (0.0%) |
| Construction & Extraction | 25 (51.0%) | 24 (49.0%) |
| Installation, Maintenance & Repair | 7 (100.0%) | 0 (0.0%) |
| Total (Category) | 32 (57.1%) | 24 (42.9%) |
| Total (Overall) | 74 (49.3%) | 76 (50.7%) |
Production, Transportation and Moving Occupations
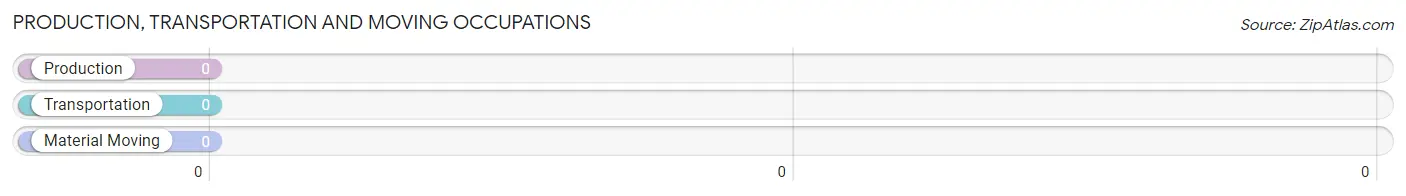
Production, Transportation and Moving Occupations by Sex
| Occupation | Male | Female |
| Production | 0 (0.0%) | 0 (0.0%) |
| Transportation | 0 (0.0%) | 0 (0.0%) |
| Material Moving | 0 (0.0%) | 0 (0.0%) |
| Total (Category) | 0 (0.0%) | 0 (0.0%) |
| Total (Overall) | 74 (49.3%) | 76 (50.7%) |
Employment Industries by Sex in Grand Lake
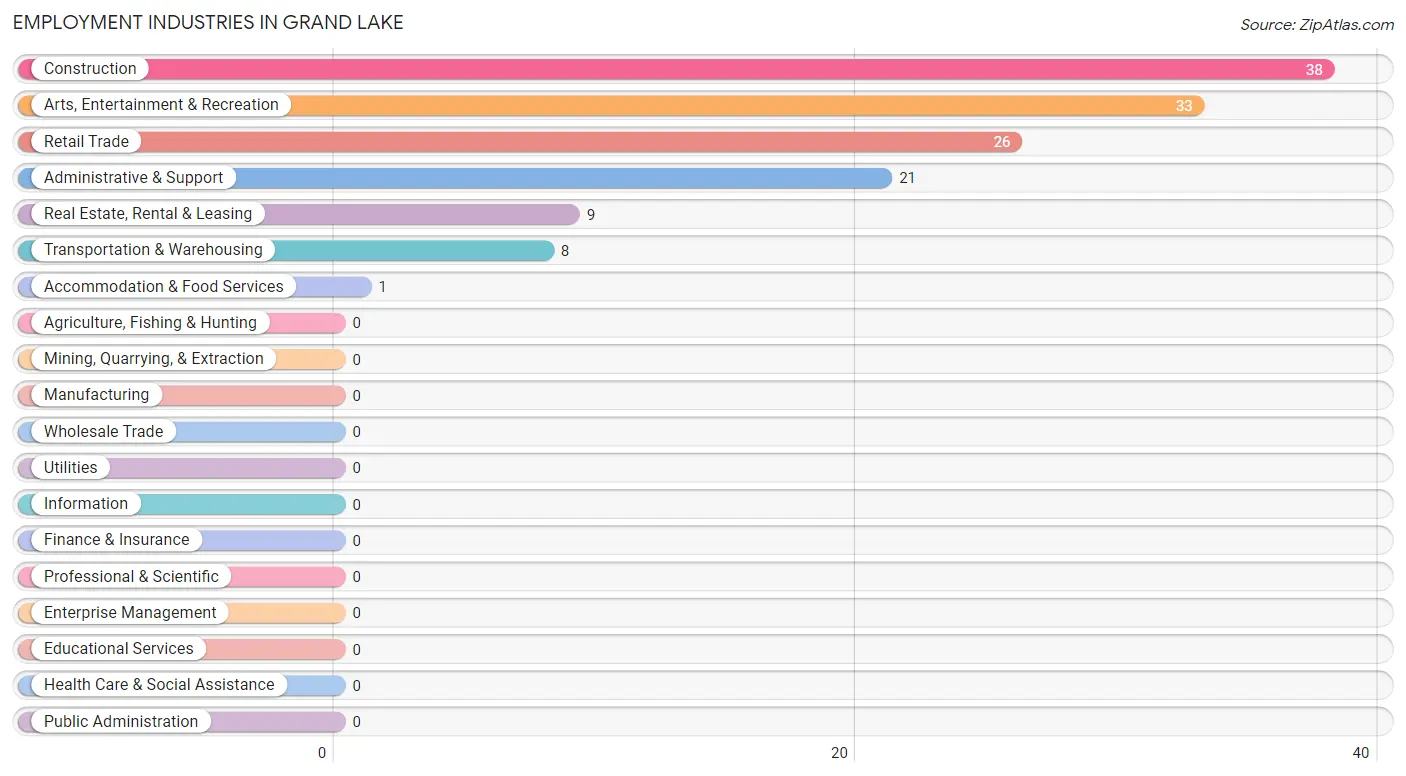
Employment Industries in Grand Lake
The major employment industries in Grand Lake include Construction (38 | 25.3%), Arts, Entertainment & Recreation (33 | 22.0%), Retail Trade (26 | 17.3%), Administrative & Support (21 | 14.0%), and Real Estate, Rental & Leasing (9 | 6.0%).
Employment Industries by Sex in Grand Lake
The Grand Lake industries that see more men than women are Construction (100.0%), Transportation & Warehousing (100.0%), and Accommodation & Food Services (100.0%), whereas the industries that tend to have a higher number of women are Real Estate, Rental & Leasing (100.0%), Administrative & Support (100.0%), and Arts, Entertainment & Recreation (84.9%).
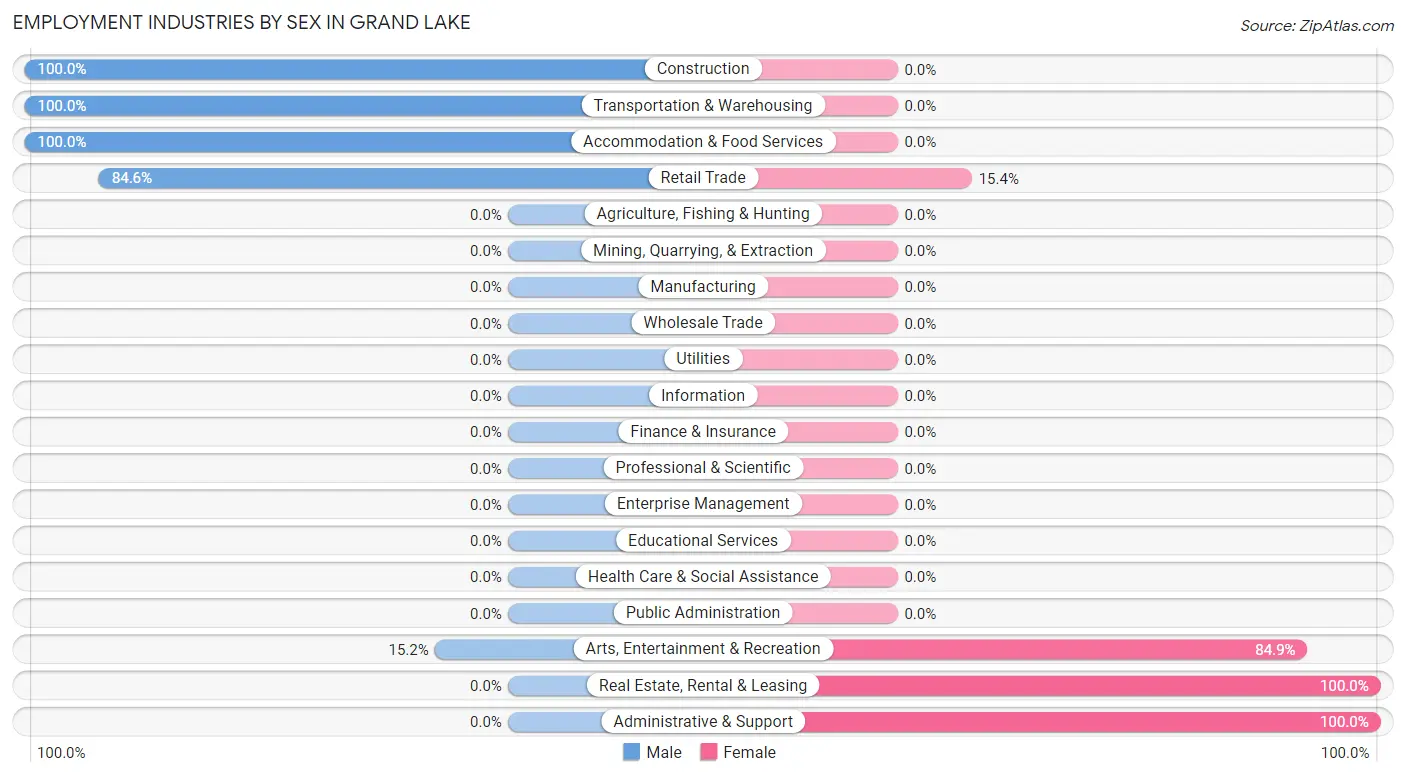
| Industry | Male | Female |
| Agriculture, Fishing & Hunting | 0 (0.0%) | 0 (0.0%) |
| Mining, Quarrying, & Extraction | 0 (0.0%) | 0 (0.0%) |
| Construction | 38 (100.0%) | 0 (0.0%) |
| Manufacturing | 0 (0.0%) | 0 (0.0%) |
| Wholesale Trade | 0 (0.0%) | 0 (0.0%) |
| Retail Trade | 22 (84.6%) | 4 (15.4%) |
| Transportation & Warehousing | 8 (100.0%) | 0 (0.0%) |
| Utilities | 0 (0.0%) | 0 (0.0%) |
| Information | 0 (0.0%) | 0 (0.0%) |
| Finance & Insurance | 0 (0.0%) | 0 (0.0%) |
| Real Estate, Rental & Leasing | 0 (0.0%) | 9 (100.0%) |
| Professional & Scientific | 0 (0.0%) | 0 (0.0%) |
| Enterprise Management | 0 (0.0%) | 0 (0.0%) |
| Administrative & Support | 0 (0.0%) | 21 (100.0%) |
| Educational Services | 0 (0.0%) | 0 (0.0%) |
| Health Care & Social Assistance | 0 (0.0%) | 0 (0.0%) |
| Arts, Entertainment & Recreation | 5 (15.1%) | 28 (84.9%) |
| Accommodation & Food Services | 1 (100.0%) | 0 (0.0%) |
| Public Administration | 0 (0.0%) | 0 (0.0%) |
| Total | 74 (49.3%) | 76 (50.7%) |
Education in Grand Lake
School Enrollment in Grand Lake
The most common levels of schooling among the 22 students in Grand Lake are middle school (21 | 95.5%), and college / undergraduate (1 | 4.5%).
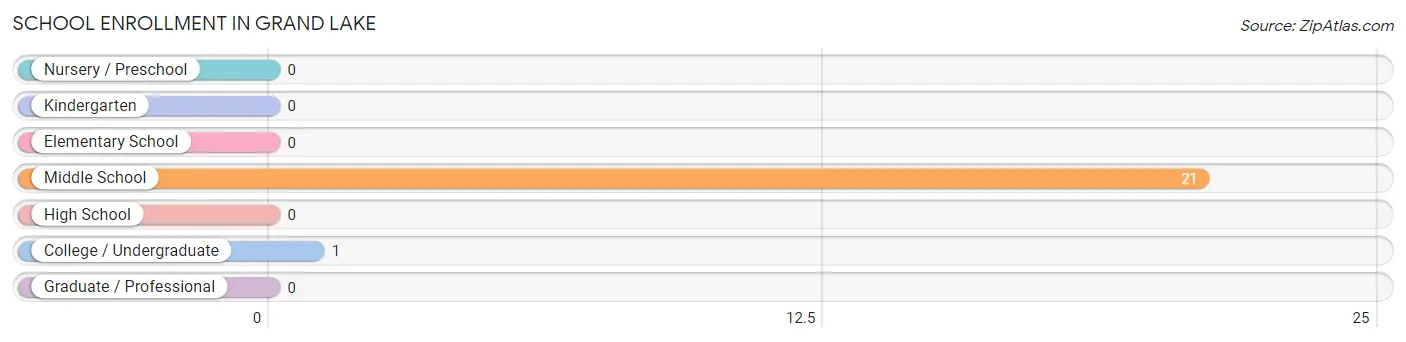
| School Level | # Students | % Students |
| Nursery / Preschool | 0 | 0.0% |
| Kindergarten | 0 | 0.0% |
| Elementary School | 0 | 0.0% |
| Middle School | 21 | 95.5% |
| High School | 0 | 0.0% |
| College / Undergraduate | 1 | 4.5% |
| Graduate / Professional | 0 | 0.0% |
| Total | 22 | 100.0% |
School Enrollment by Age by Funding Source in Grand Lake
Out of a total of 22 students who are enrolled in schools in Grand Lake, 14 (63.6%) attend a private institution, while the remaining 8 (36.4%) are enrolled in public schools. The age group of 15 to 17 year olds has the highest likelihood of being enrolled in private schools, with 13 (100.0% in the age bracket) enrolled. Conversely, the age group of 10 to 14 year olds has the lowest likelihood of being enrolled in a private school, with 8 (100.0% in the age bracket) attending a public institution.
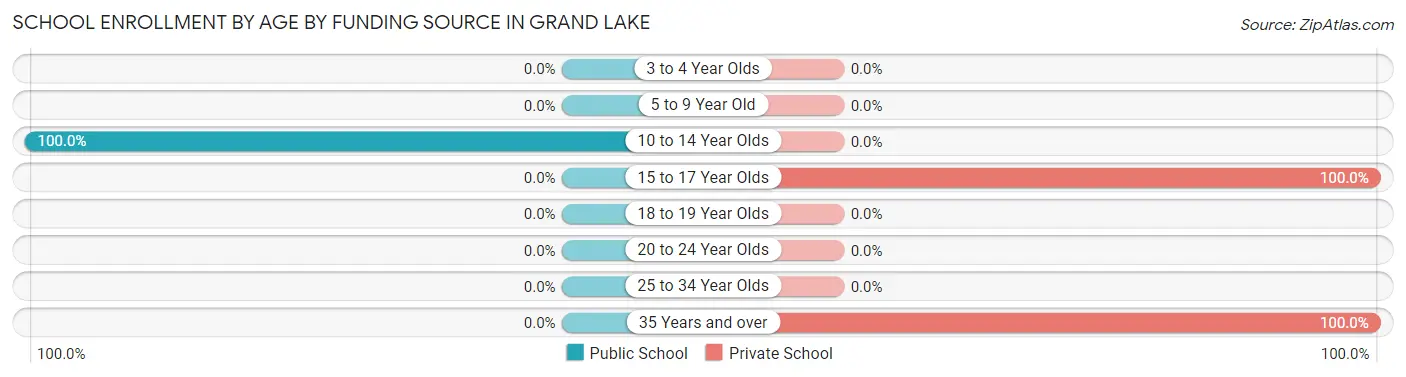
| Age Bracket | Public School | Private School |
| 3 to 4 Year Olds | 0 (0.0%) | 0 (0.0%) |
| 5 to 9 Year Old | 0 (0.0%) | 0 (0.0%) |
| 10 to 14 Year Olds | 8 (100.0%) | 0 (0.0%) |
| 15 to 17 Year Olds | 0 (0.0%) | 13 (100.0%) |
| 18 to 19 Year Olds | 0 (0.0%) | 0 (0.0%) |
| 20 to 24 Year Olds | 0 (0.0%) | 0 (0.0%) |
| 25 to 34 Year Olds | 0 (0.0%) | 0 (0.0%) |
| 35 Years and over | 0 (0.0%) | 1 (100.0%) |
| Total | 8 (36.4%) | 14 (63.6%) |
Educational Attainment by Field of Study in Grand Lake
Social sciences (32 | 23.5%), education (29 | 21.3%), science & technology (27 | 19.9%), engineering (19 | 14.0%), and business (15 | 11.0%) are the most common fields of study among 136 individuals in Grand Lake who have obtained a bachelor's degree or higher.
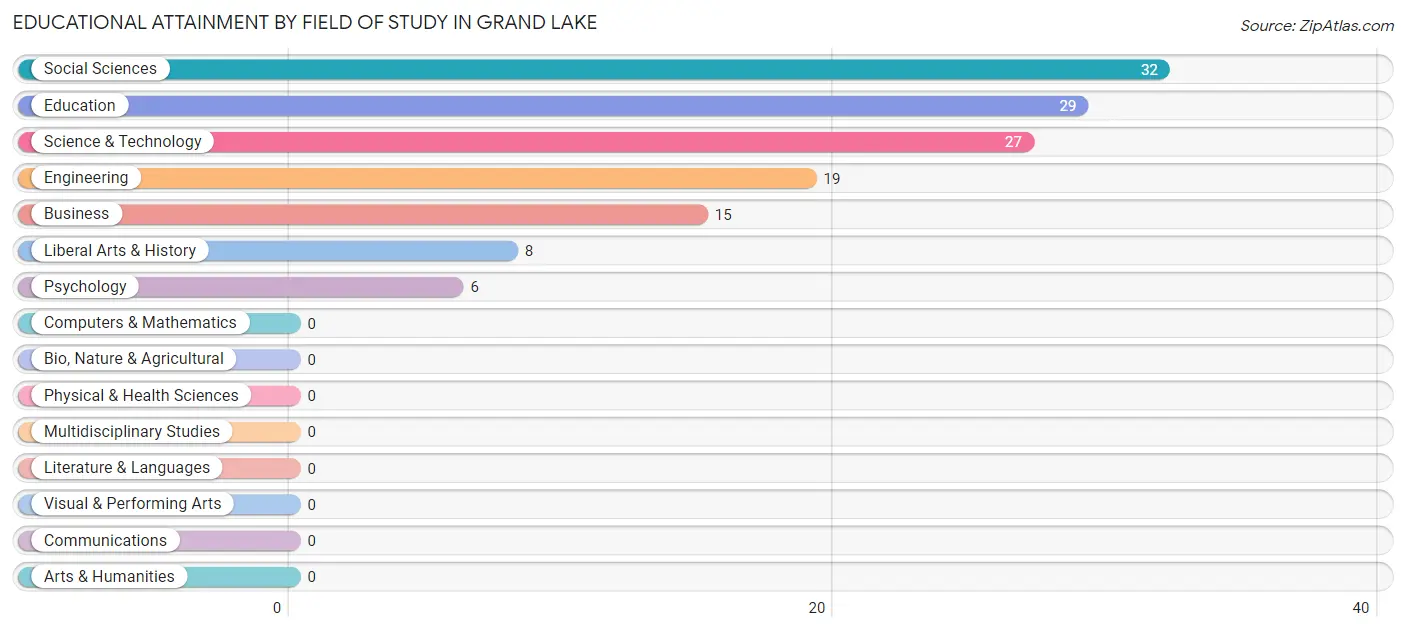
| Field of Study | # Graduates | % Graduates |
| Computers & Mathematics | 0 | 0.0% |
| Bio, Nature & Agricultural | 0 | 0.0% |
| Physical & Health Sciences | 0 | 0.0% |
| Psychology | 6 | 4.4% |
| Social Sciences | 32 | 23.5% |
| Engineering | 19 | 14.0% |
| Multidisciplinary Studies | 0 | 0.0% |
| Science & Technology | 27 | 19.9% |
| Business | 15 | 11.0% |
| Education | 29 | 21.3% |
| Literature & Languages | 0 | 0.0% |
| Liberal Arts & History | 8 | 5.9% |
| Visual & Performing Arts | 0 | 0.0% |
| Communications | 0 | 0.0% |
| Arts & Humanities | 0 | 0.0% |
| Total | 136 | 100.0% |
Transportation & Commute in Grand Lake
Vehicle Availability by Sex in Grand Lake
The most prevalent vehicle ownership categories in Grand Lake are males with 2 vehicles (27, accounting for 37.0%) and females with 2 vehicles (11, making up 35.5%).
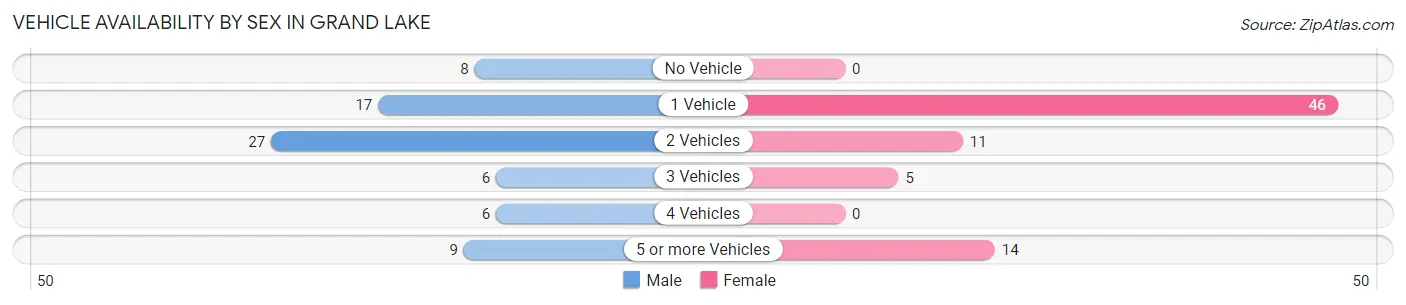
| Vehicles Available | Male | Female |
| No Vehicle | 8 (11.0%) | 0 (0.0%) |
| 1 Vehicle | 17 (23.3%) | 46 (60.5%) |
| 2 Vehicles | 27 (37.0%) | 11 (14.5%) |
| 3 Vehicles | 6 (8.2%) | 5 (6.6%) |
| 4 Vehicles | 6 (8.2%) | 0 (0.0%) |
| 5 or more Vehicles | 9 (12.3%) | 14 (18.4%) |
| Total | 73 (100.0%) | 76 (100.0%) |
Commute Time in Grand Lake
The most frequently occuring commute durations in Grand Lake are 10 to 14 minutes (45 commuters, 35.2%), 5 to 9 minutes (44 commuters, 34.4%), and 15 to 19 minutes (14 commuters, 10.9%).
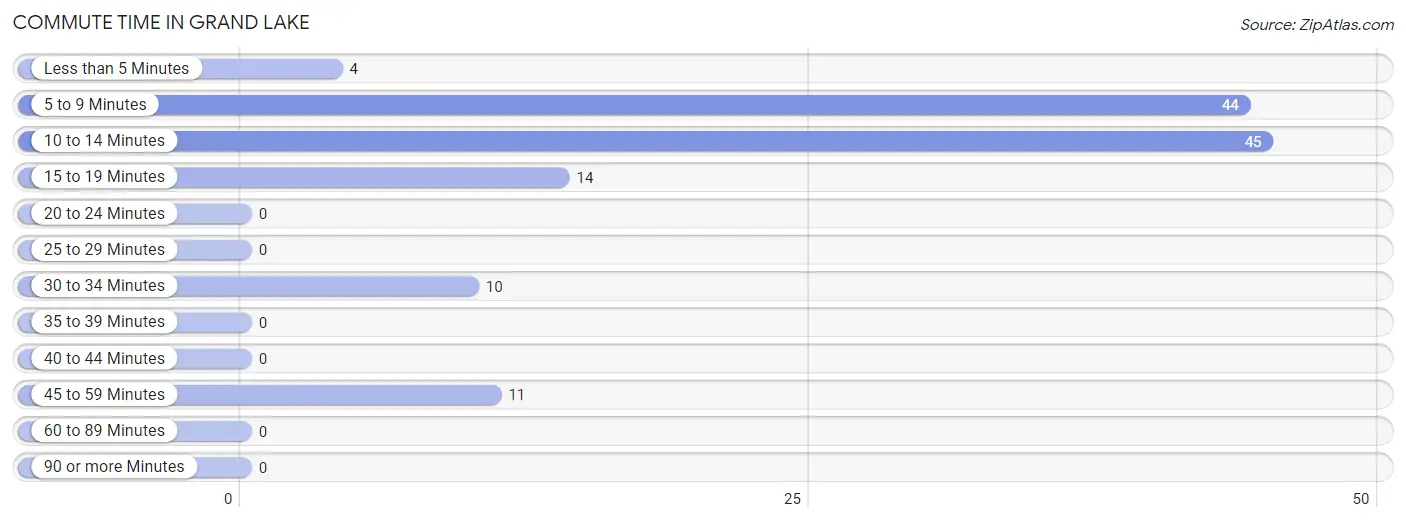
| Commute Time | # Commuters | % Commuters |
| Less than 5 Minutes | 4 | 3.1% |
| 5 to 9 Minutes | 44 | 34.4% |
| 10 to 14 Minutes | 45 | 35.2% |
| 15 to 19 Minutes | 14 | 10.9% |
| 20 to 24 Minutes | 0 | 0.0% |
| 25 to 29 Minutes | 0 | 0.0% |
| 30 to 34 Minutes | 10 | 7.8% |
| 35 to 39 Minutes | 0 | 0.0% |
| 40 to 44 Minutes | 0 | 0.0% |
| 45 to 59 Minutes | 11 | 8.6% |
| 60 to 89 Minutes | 0 | 0.0% |
| 90 or more Minutes | 0 | 0.0% |
Commute Time by Sex in Grand Lake
The most common commute times in Grand Lake are 10 to 14 minutes (24 commuters, 39.3%) for males and 5 to 9 minutes (28 commuters, 41.8%) for females.
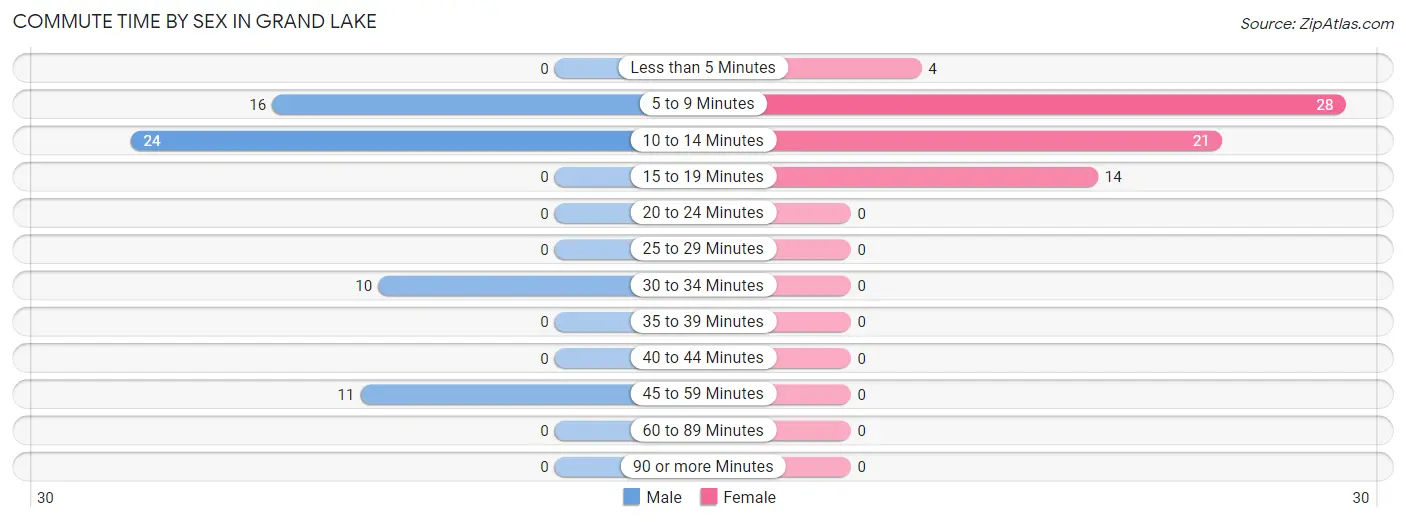
| Commute Time | Male | Female |
| Less than 5 Minutes | 0 (0.0%) | 4 (6.0%) |
| 5 to 9 Minutes | 16 (26.2%) | 28 (41.8%) |
| 10 to 14 Minutes | 24 (39.3%) | 21 (31.3%) |
| 15 to 19 Minutes | 0 (0.0%) | 14 (20.9%) |
| 20 to 24 Minutes | 0 (0.0%) | 0 (0.0%) |
| 25 to 29 Minutes | 0 (0.0%) | 0 (0.0%) |
| 30 to 34 Minutes | 10 (16.4%) | 0 (0.0%) |
| 35 to 39 Minutes | 0 (0.0%) | 0 (0.0%) |
| 40 to 44 Minutes | 0 (0.0%) | 0 (0.0%) |
| 45 to 59 Minutes | 11 (18.0%) | 0 (0.0%) |
| 60 to 89 Minutes | 0 (0.0%) | 0 (0.0%) |
| 90 or more Minutes | 0 (0.0%) | 0 (0.0%) |
Time of Departure to Work by Sex in Grand Lake
The most frequent times of departure to work in Grand Lake are 6:30 AM to 6:59 AM (19, 31.1%) for males and 11:00 AM to 11:59 AM (24, 35.8%) for females.
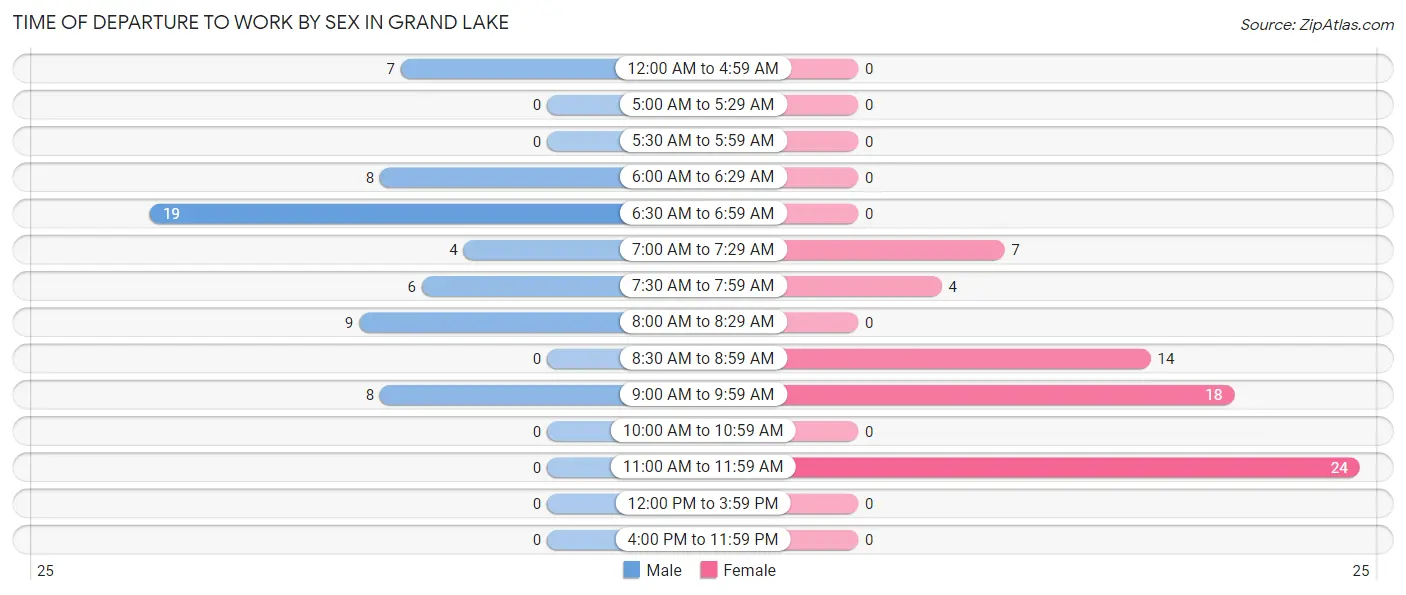
| Time of Departure | Male | Female |
| 12:00 AM to 4:59 AM | 7 (11.5%) | 0 (0.0%) |
| 5:00 AM to 5:29 AM | 0 (0.0%) | 0 (0.0%) |
| 5:30 AM to 5:59 AM | 0 (0.0%) | 0 (0.0%) |
| 6:00 AM to 6:29 AM | 8 (13.1%) | 0 (0.0%) |
| 6:30 AM to 6:59 AM | 19 (31.1%) | 0 (0.0%) |
| 7:00 AM to 7:29 AM | 4 (6.6%) | 7 (10.4%) |
| 7:30 AM to 7:59 AM | 6 (9.8%) | 4 (6.0%) |
| 8:00 AM to 8:29 AM | 9 (14.7%) | 0 (0.0%) |
| 8:30 AM to 8:59 AM | 0 (0.0%) | 14 (20.9%) |
| 9:00 AM to 9:59 AM | 8 (13.1%) | 18 (26.9%) |
| 10:00 AM to 10:59 AM | 0 (0.0%) | 0 (0.0%) |
| 11:00 AM to 11:59 AM | 0 (0.0%) | 24 (35.8%) |
| 12:00 PM to 3:59 PM | 0 (0.0%) | 0 (0.0%) |
| 4:00 PM to 11:59 PM | 0 (0.0%) | 0 (0.0%) |
| Total | 61 (100.0%) | 67 (100.0%) |
Housing Occupancy in Grand Lake
Occupancy by Ownership in Grand Lake
Of the total 173 dwellings in Grand Lake, owner-occupied units account for 125 (72.3%), while renter-occupied units make up 48 (27.8%).
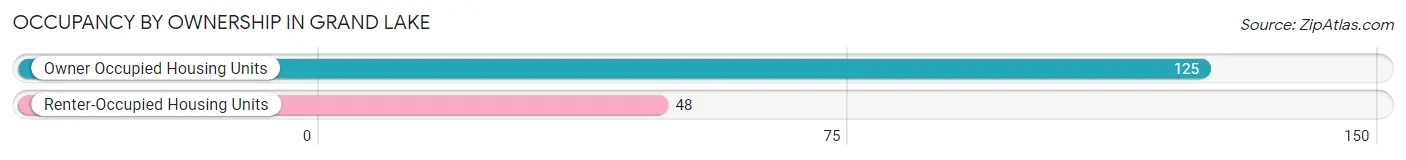
| Occupancy | # Housing Units | % Housing Units |
| Owner Occupied Housing Units | 125 | 72.3% |
| Renter-Occupied Housing Units | 48 | 27.8% |
| Total Occupied Housing Units | 173 | 100.0% |
Occupancy by Household Size in Grand Lake
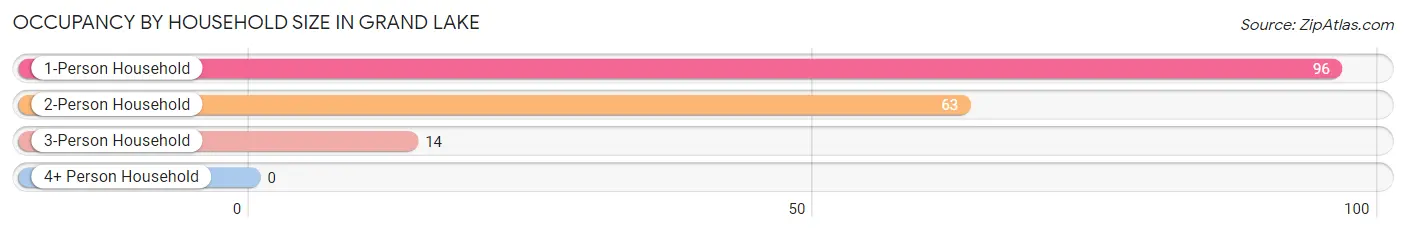
| Household Size | # Housing Units | % Housing Units |
| 1-Person Household | 96 | 55.5% |
| 2-Person Household | 63 | 36.4% |
| 3-Person Household | 14 | 8.1% |
| 4+ Person Household | 0 | 0.0% |
| Total Housing Units | 173 | 100.0% |
Occupancy by Ownership by Household Size in Grand Lake
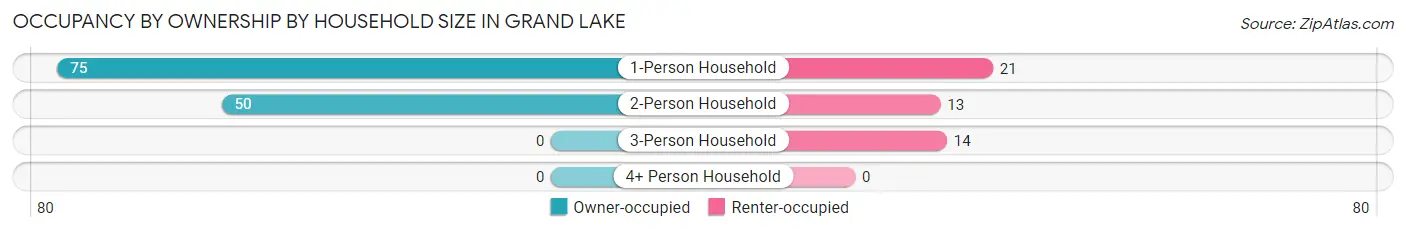
| Household Size | Owner-occupied | Renter-occupied |
| 1-Person Household | 75 (78.1%) | 21 (21.9%) |
| 2-Person Household | 50 (79.4%) | 13 (20.6%) |
| 3-Person Household | 0 (0.0%) | 14 (100.0%) |
| 4+ Person Household | 0 (0.0%) | 0 (0.0%) |
| Total Housing Units | 125 (72.3%) | 48 (27.8%) |
Occupancy by Educational Attainment in Grand Lake
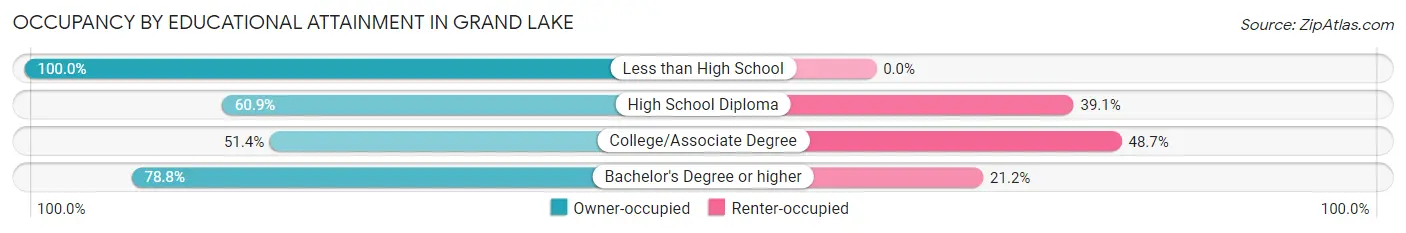
| Household Size | Owner-occupied | Renter-occupied |
| Less than High School | 14 (100.0%) | 0 (0.0%) |
| High School Diploma | 14 (60.9%) | 9 (39.1%) |
| College/Associate Degree | 19 (51.3%) | 18 (48.6%) |
| Bachelor's Degree or higher | 78 (78.8%) | 21 (21.2%) |
Occupancy by Age of Householder in Grand Lake
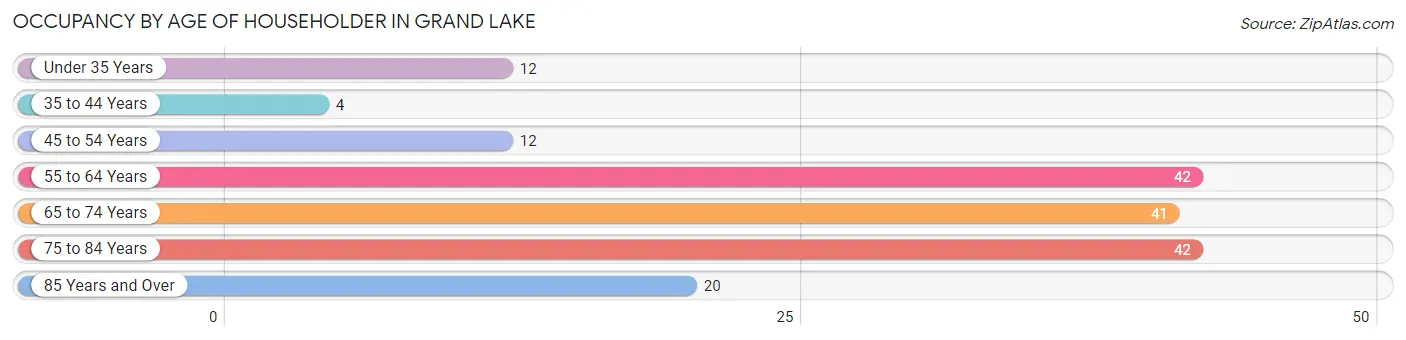
| Age Bracket | # Households | % Households |
| Under 35 Years | 12 | 6.9% |
| 35 to 44 Years | 4 | 2.3% |
| 45 to 54 Years | 12 | 6.9% |
| 55 to 64 Years | 42 | 24.3% |
| 65 to 74 Years | 41 | 23.7% |
| 75 to 84 Years | 42 | 24.3% |
| 85 Years and Over | 20 | 11.6% |
| Total | 173 | 100.0% |
Housing Finances in Grand Lake
Median Income by Occupancy in Grand Lake
| Occupancy Type | # Households | Median Income |
| Owner-Occupied | 125 (72.3%) | $0 |
| Renter-Occupied | 48 (27.8%) | $0 |
| Average | 173 (100.0%) | $0 |
Occupancy by Householder Income Bracket in Grand Lake
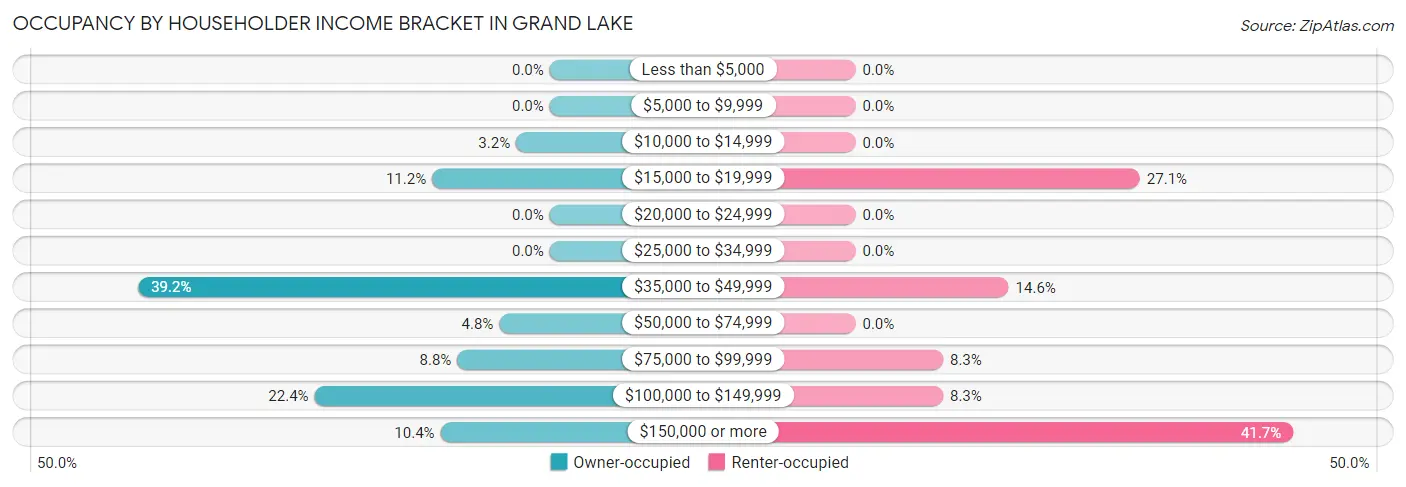
| Income Bracket | Owner-occupied | Renter-occupied |
| Less than $5,000 | 0 (0.0%) | 0 (0.0%) |
| $5,000 to $9,999 | 0 (0.0%) | 0 (0.0%) |
| $10,000 to $14,999 | 4 (3.2%) | 0 (0.0%) |
| $15,000 to $19,999 | 14 (11.2%) | 13 (27.1%) |
| $20,000 to $24,999 | 0 (0.0%) | 0 (0.0%) |
| $25,000 to $34,999 | 0 (0.0%) | 0 (0.0%) |
| $35,000 to $49,999 | 49 (39.2%) | 7 (14.6%) |
| $50,000 to $74,999 | 6 (4.8%) | 0 (0.0%) |
| $75,000 to $99,999 | 11 (8.8%) | 4 (8.3%) |
| $100,000 to $149,999 | 28 (22.4%) | 4 (8.3%) |
| $150,000 or more | 13 (10.4%) | 20 (41.7%) |
| Total | 125 (100.0%) | 48 (100.0%) |
Monthly Housing Cost Tiers in Grand Lake
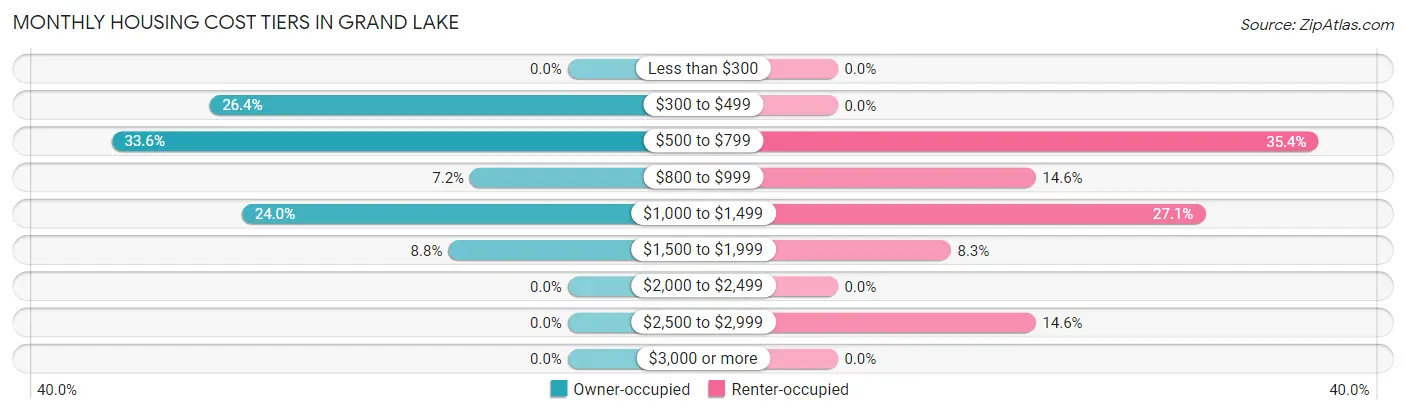
| Monthly Cost | Owner-occupied | Renter-occupied |
| Less than $300 | 0 (0.0%) | 0 (0.0%) |
| $300 to $499 | 33 (26.4%) | 0 (0.0%) |
| $500 to $799 | 42 (33.6%) | 17 (35.4%) |
| $800 to $999 | 9 (7.2%) | 7 (14.6%) |
| $1,000 to $1,499 | 30 (24.0%) | 13 (27.1%) |
| $1,500 to $1,999 | 11 (8.8%) | 4 (8.3%) |
| $2,000 to $2,499 | 0 (0.0%) | 0 (0.0%) |
| $2,500 to $2,999 | 0 (0.0%) | 7 (14.6%) |
| $3,000 or more | 0 (0.0%) | 0 (0.0%) |
| Total | 125 (100.0%) | 48 (100.0%) |
Physical Housing Characteristics in Grand Lake
Housing Structures in Grand Lake
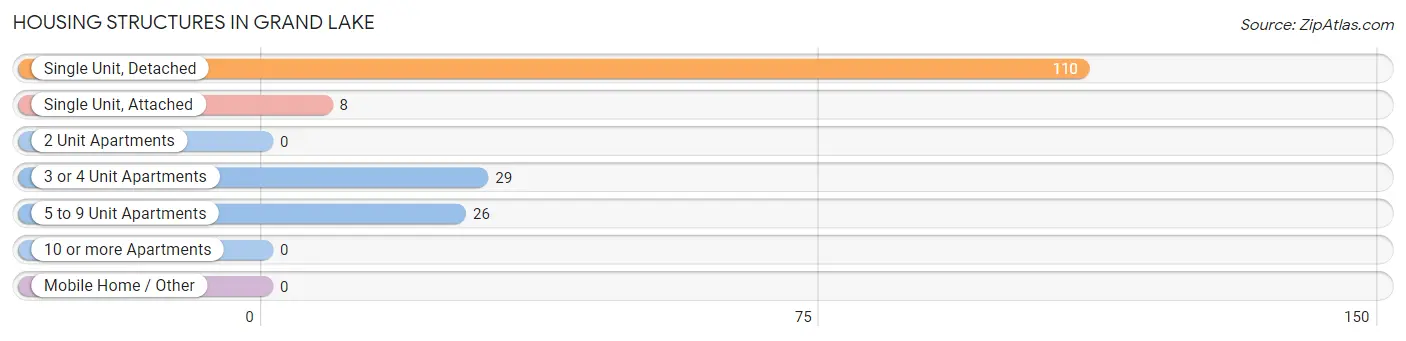
| Structure Type | # Housing Units | % Housing Units |
| Single Unit, Detached | 110 | 63.6% |
| Single Unit, Attached | 8 | 4.6% |
| 2 Unit Apartments | 0 | 0.0% |
| 3 or 4 Unit Apartments | 29 | 16.8% |
| 5 to 9 Unit Apartments | 26 | 15.0% |
| 10 or more Apartments | 0 | 0.0% |
| Mobile Home / Other | 0 | 0.0% |
| Total | 173 | 100.0% |
Housing Structures by Occupancy in Grand Lake
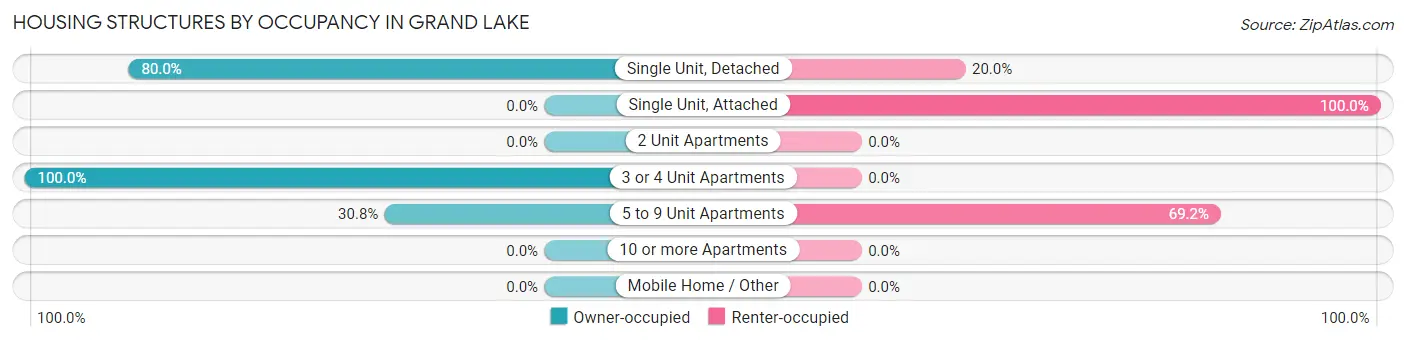
| Structure Type | Owner-occupied | Renter-occupied |
| Single Unit, Detached | 88 (80.0%) | 22 (20.0%) |
| Single Unit, Attached | 0 (0.0%) | 8 (100.0%) |
| 2 Unit Apartments | 0 (0.0%) | 0 (0.0%) |
| 3 or 4 Unit Apartments | 29 (100.0%) | 0 (0.0%) |
| 5 to 9 Unit Apartments | 8 (30.8%) | 18 (69.2%) |
| 10 or more Apartments | 0 (0.0%) | 0 (0.0%) |
| Mobile Home / Other | 0 (0.0%) | 0 (0.0%) |
| Total | 125 (72.3%) | 48 (27.8%) |
Housing Structures by Number of Rooms in Grand Lake
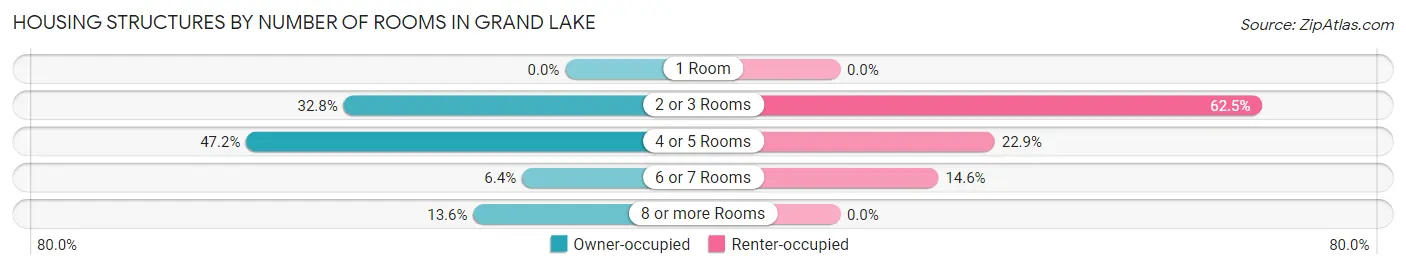
| Number of Rooms | Owner-occupied | Renter-occupied |
| 1 Room | 0 (0.0%) | 0 (0.0%) |
| 2 or 3 Rooms | 41 (32.8%) | 30 (62.5%) |
| 4 or 5 Rooms | 59 (47.2%) | 11 (22.9%) |
| 6 or 7 Rooms | 8 (6.4%) | 7 (14.6%) |
| 8 or more Rooms | 17 (13.6%) | 0 (0.0%) |
| Total | 125 (100.0%) | 48 (100.0%) |
Housing Structure by Heating Type in Grand Lake
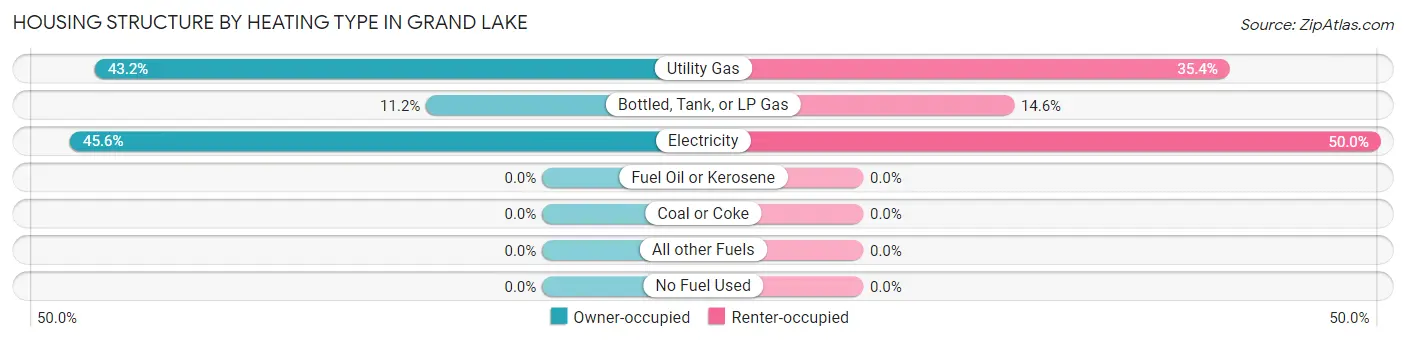
| Heating Type | Owner-occupied | Renter-occupied |
| Utility Gas | 54 (43.2%) | 17 (35.4%) |
| Bottled, Tank, or LP Gas | 14 (11.2%) | 7 (14.6%) |
| Electricity | 57 (45.6%) | 24 (50.0%) |
| Fuel Oil or Kerosene | 0 (0.0%) | 0 (0.0%) |
| Coal or Coke | 0 (0.0%) | 0 (0.0%) |
| All other Fuels | 0 (0.0%) | 0 (0.0%) |
| No Fuel Used | 0 (0.0%) | 0 (0.0%) |
| Total | 125 (100.0%) | 48 (100.0%) |
Household Vehicle Usage in Grand Lake
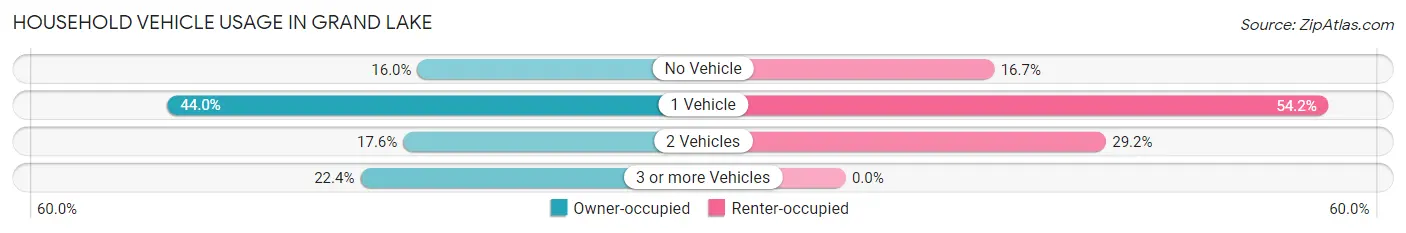
| Vehicles per Household | Owner-occupied | Renter-occupied |
| No Vehicle | 20 (16.0%) | 8 (16.7%) |
| 1 Vehicle | 55 (44.0%) | 26 (54.2%) |
| 2 Vehicles | 22 (17.6%) | 14 (29.2%) |
| 3 or more Vehicles | 28 (22.4%) | 0 (0.0%) |
| Total | 125 (100.0%) | 48 (100.0%) |
Real Estate & Mortgages in Grand Lake
Real Estate and Mortgage Overview in Grand Lake
| Characteristic | Without Mortgage | With Mortgage |
| Housing Units | 100 | 25 |
| Median Property Value | $350,000 | $0 |
| Median Household Income | $47,875 | $5 |
| Monthly Housing Costs | $550 | $0 |
| Real Estate Taxes | $1,977 | $0 |
Property Value by Mortgage Status in Grand Lake
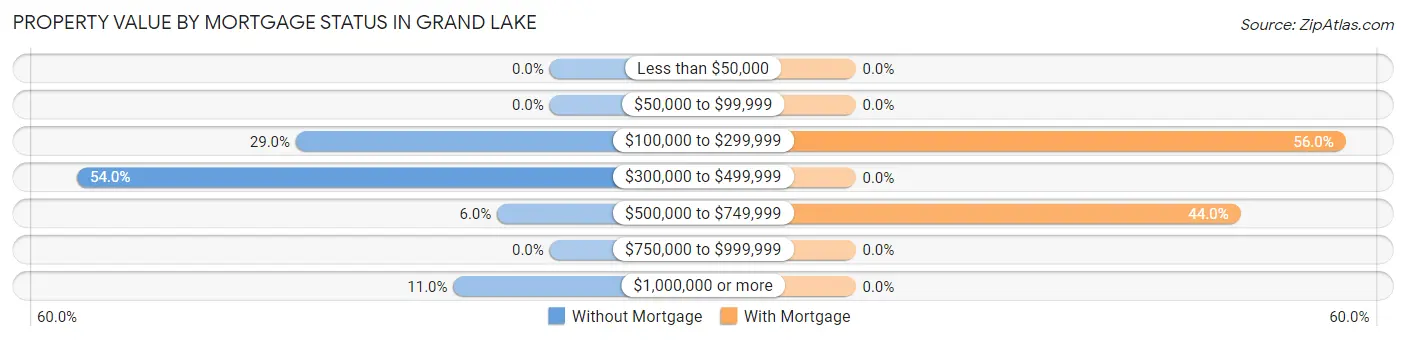
| Property Value | Without Mortgage | With Mortgage |
| Less than $50,000 | 0 (0.0%) | 0 (0.0%) |
| $50,000 to $99,999 | 0 (0.0%) | 0 (0.0%) |
| $100,000 to $299,999 | 29 (29.0%) | 14 (56.0%) |
| $300,000 to $499,999 | 54 (54.0%) | 0 (0.0%) |
| $500,000 to $749,999 | 6 (6.0%) | 11 (44.0%) |
| $750,000 to $999,999 | 0 (0.0%) | 0 (0.0%) |
| $1,000,000 or more | 11 (11.0%) | 0 (0.0%) |
| Total | 100 (100.0%) | 25 (100.0%) |
Household Income by Mortgage Status in Grand Lake
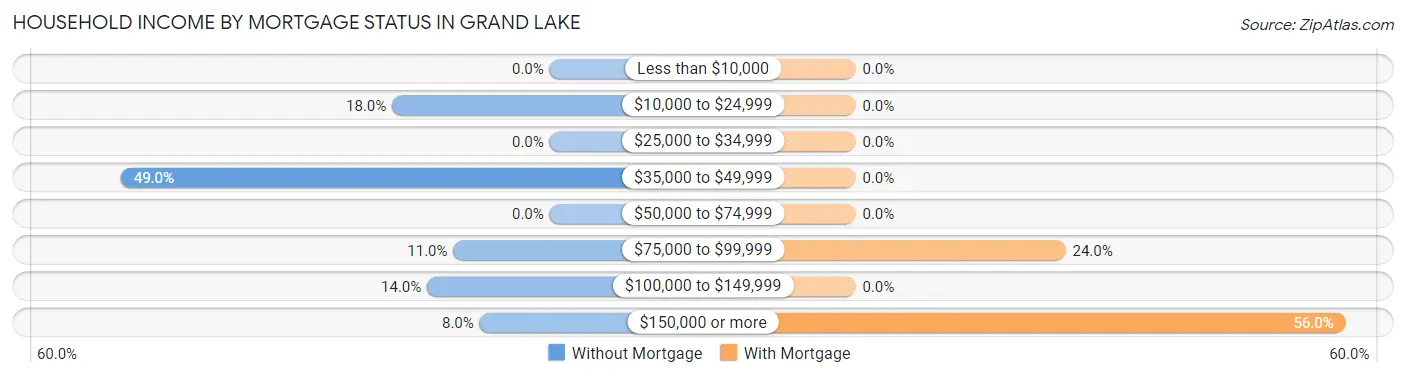
| Household Income | Without Mortgage | With Mortgage |
| Less than $10,000 | 0 (0.0%) | 0 (0.0%) |
| $10,000 to $24,999 | 18 (18.0%) | 0 (0.0%) |
| $25,000 to $34,999 | 0 (0.0%) | 0 (0.0%) |
| $35,000 to $49,999 | 49 (49.0%) | 0 (0.0%) |
| $50,000 to $74,999 | 0 (0.0%) | 0 (0.0%) |
| $75,000 to $99,999 | 11 (11.0%) | 6 (24.0%) |
| $100,000 to $149,999 | 14 (14.0%) | 0 (0.0%) |
| $150,000 or more | 8 (8.0%) | 14 (56.0%) |
| Total | 100 (100.0%) | 25 (100.0%) |
Property Value to Household Income Ratio in Grand Lake
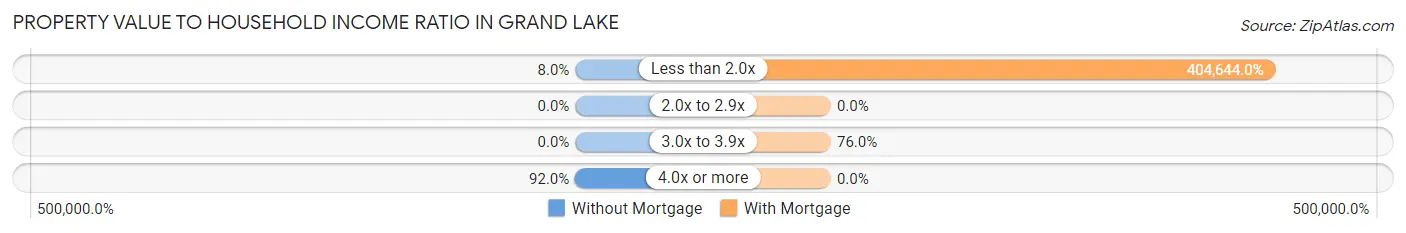
| Value-to-Income Ratio | Without Mortgage | With Mortgage |
| Less than 2.0x | 8 (8.0%) | 101,161 (404,644.0%) |
| 2.0x to 2.9x | 0 (0.0%) | 0 (0.0%) |
| 3.0x to 3.9x | 0 (0.0%) | 19 (76.0%) |
| 4.0x or more | 92 (92.0%) | 0 (0.0%) |
| Total | 100 (100.0%) | 25 (100.0%) |
Real Estate Taxes by Mortgage Status in Grand Lake
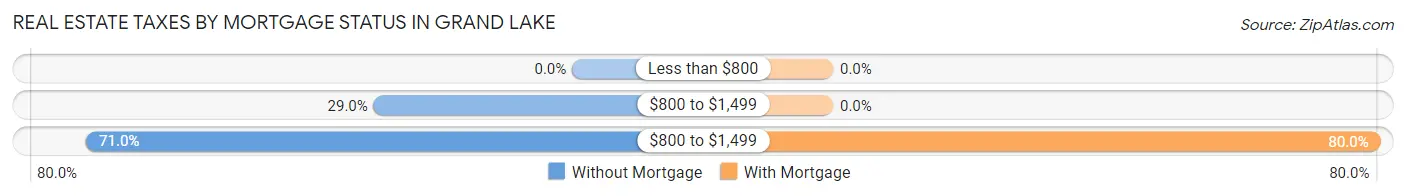
| Property Taxes | Without Mortgage | With Mortgage |
| Less than $800 | 0 (0.0%) | 0 (0.0%) |
| $800 to $1,499 | 29 (29.0%) | 0 (0.0%) |
| $800 to $1,499 | 71 (71.0%) | 20 (80.0%) |
| Total | 100 (100.0%) | 25 (100.0%) |
Health & Disability in Grand Lake
Health Insurance Coverage by Age in Grand Lake
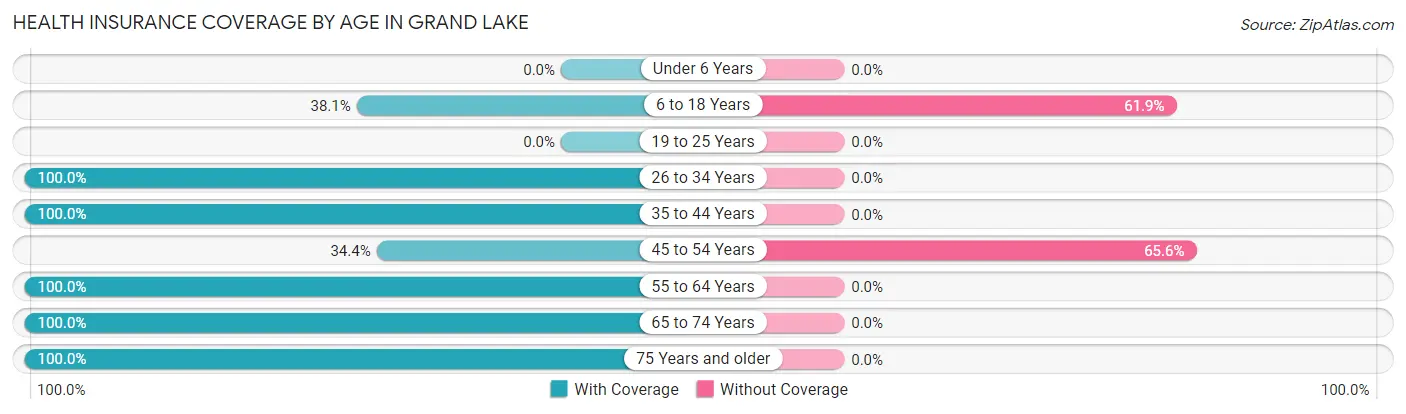
| Age Bracket | With Coverage | Without Coverage |
| Under 6 Years | 0 (0.0%) | 0 (0.0%) |
| 6 to 18 Years | 8 (38.1%) | 13 (61.9%) |
| 19 to 25 Years | 0 (0.0%) | 0 (0.0%) |
| 26 to 34 Years | 16 (100.0%) | 0 (0.0%) |
| 35 to 44 Years | 9 (100.0%) | 0 (0.0%) |
| 45 to 54 Years | 11 (34.4%) | 21 (65.6%) |
| 55 to 64 Years | 59 (100.0%) | 0 (0.0%) |
| 65 to 74 Years | 58 (100.0%) | 0 (0.0%) |
| 75 Years and older | 86 (100.0%) | 0 (0.0%) |
| Total | 247 (87.9%) | 34 (12.1%) |
Health Insurance Coverage by Citizenship Status in Grand Lake
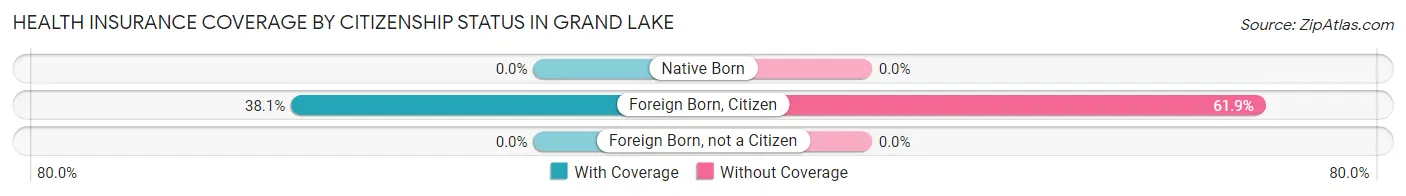
| Citizenship Status | With Coverage | Without Coverage |
| Native Born | 0 (0.0%) | 0 (0.0%) |
| Foreign Born, Citizen | 8 (38.1%) | 13 (61.9%) |
| Foreign Born, not a Citizen | 0 (0.0%) | 0 (0.0%) |
Health Insurance Coverage by Household Income in Grand Lake
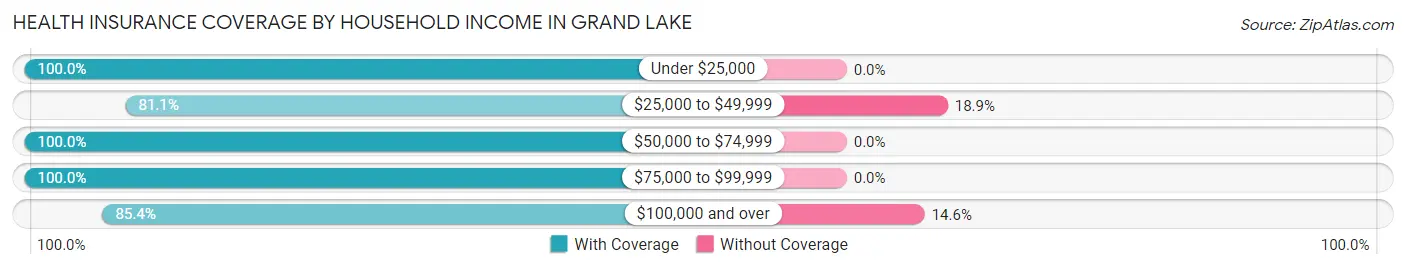
| Household Income | With Coverage | Without Coverage |
| Under $25,000 | 31 (100.0%) | 0 (0.0%) |
| $25,000 to $49,999 | 60 (81.1%) | 14 (18.9%) |
| $50,000 to $74,999 | 10 (100.0%) | 0 (0.0%) |
| $75,000 to $99,999 | 24 (100.0%) | 0 (0.0%) |
| $100,000 and over | 117 (85.4%) | 20 (14.6%) |
Public vs Private Health Insurance Coverage by Age in Grand Lake
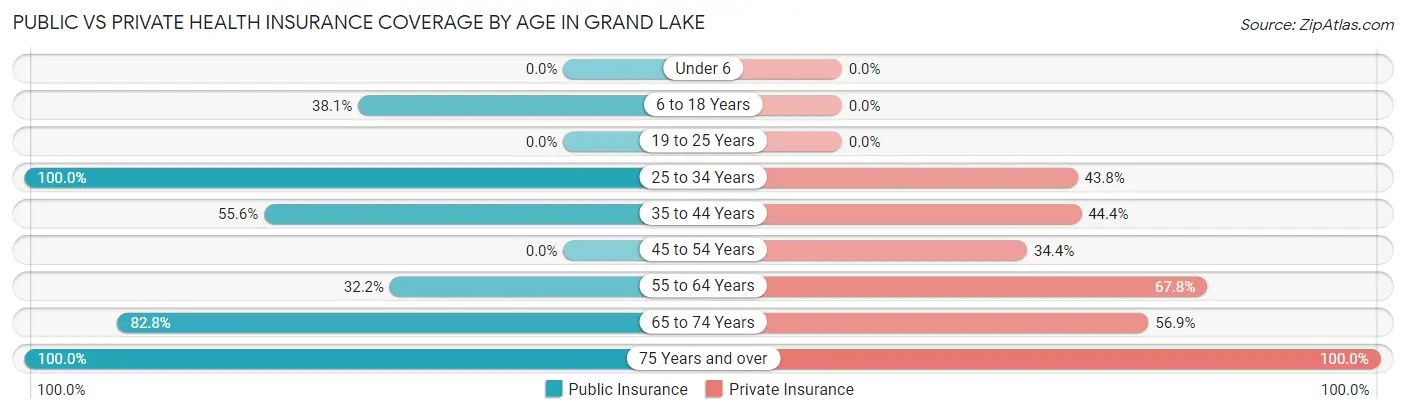
| Age Bracket | Public Insurance | Private Insurance |
| Under 6 | 0 (0.0%) | 0 (0.0%) |
| 6 to 18 Years | 8 (38.1%) | 0 (0.0%) |
| 19 to 25 Years | 0 (0.0%) | 0 (0.0%) |
| 25 to 34 Years | 16 (100.0%) | 7 (43.8%) |
| 35 to 44 Years | 5 (55.6%) | 4 (44.4%) |
| 45 to 54 Years | 0 (0.0%) | 11 (34.4%) |
| 55 to 64 Years | 19 (32.2%) | 40 (67.8%) |
| 65 to 74 Years | 48 (82.8%) | 33 (56.9%) |
| 75 Years and over | 86 (100.0%) | 86 (100.0%) |
| Total | 182 (64.8%) | 181 (64.4%) |
Disability Status by Sex by Age in Grand Lake
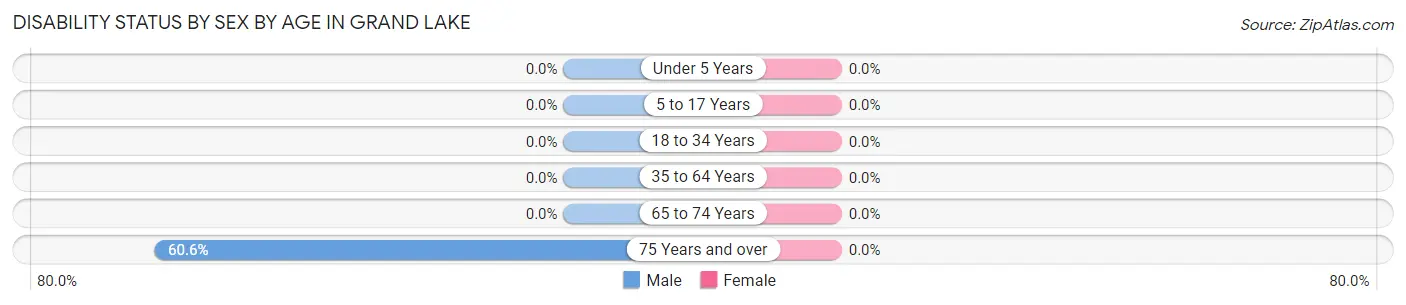
| Age Bracket | Male | Female |
| Under 5 Years | 0 (0.0%) | 0 (0.0%) |
| 5 to 17 Years | 0 (0.0%) | 0 (0.0%) |
| 18 to 34 Years | 0 (0.0%) | 0 (0.0%) |
| 35 to 64 Years | 0 (0.0%) | 0 (0.0%) |
| 65 to 74 Years | 0 (0.0%) | 0 (0.0%) |
| 75 Years and over | 20 (60.6%) | 0 (0.0%) |
Disability Class by Sex by Age in Grand Lake
Disability Class: Hearing Difficulty
| Age Bracket | Male | Female |
| Under 5 Years | 0 (0.0%) | 0 (0.0%) |
| 5 to 17 Years | 0 (0.0%) | 0 (0.0%) |
| 18 to 34 Years | 0 (0.0%) | 0 (0.0%) |
| 35 to 64 Years | 0 (0.0%) | 0 (0.0%) |
| 65 to 74 Years | 0 (0.0%) | 0 (0.0%) |
| 75 Years and over | 0 (0.0%) | 0 (0.0%) |
Disability Class: Vision Difficulty
| Age Bracket | Male | Female |
| Under 5 Years | 0 (0.0%) | 0 (0.0%) |
| 5 to 17 Years | 0 (0.0%) | 0 (0.0%) |
| 18 to 34 Years | 0 (0.0%) | 0 (0.0%) |
| 35 to 64 Years | 0 (0.0%) | 0 (0.0%) |
| 65 to 74 Years | 0 (0.0%) | 0 (0.0%) |
| 75 Years and over | 20 (60.6%) | 0 (0.0%) |
Disability Class: Cognitive Difficulty
| Age Bracket | Male | Female |
| 5 to 17 Years | 0 (0.0%) | 0 (0.0%) |
| 18 to 34 Years | 0 (0.0%) | 0 (0.0%) |
| 35 to 64 Years | 0 (0.0%) | 0 (0.0%) |
| 65 to 74 Years | 0 (0.0%) | 0 (0.0%) |
| 75 Years and over | 20 (60.6%) | 0 (0.0%) |
Disability Class: Ambulatory Difficulty

| Age Bracket | Male | Female |
| 5 to 17 Years | 0 (0.0%) | 0 (0.0%) |
| 18 to 34 Years | 0 (0.0%) | 0 (0.0%) |
| 35 to 64 Years | 0 (0.0%) | 0 (0.0%) |
| 65 to 74 Years | 0 (0.0%) | 0 (0.0%) |
| 75 Years and over | 20 (60.6%) | 0 (0.0%) |
Disability Class: Self-Care Difficulty
| Age Bracket | Male | Female |
| 5 to 17 Years | 0 (0.0%) | 0 (0.0%) |
| 18 to 34 Years | 0 (0.0%) | 0 (0.0%) |
| 35 to 64 Years | 0 (0.0%) | 0 (0.0%) |
| 65 to 74 Years | 0 (0.0%) | 0 (0.0%) |
| 75 Years and over | 0 (0.0%) | 0 (0.0%) |
Technology Access in Grand Lake
Computing Device Access in Grand Lake
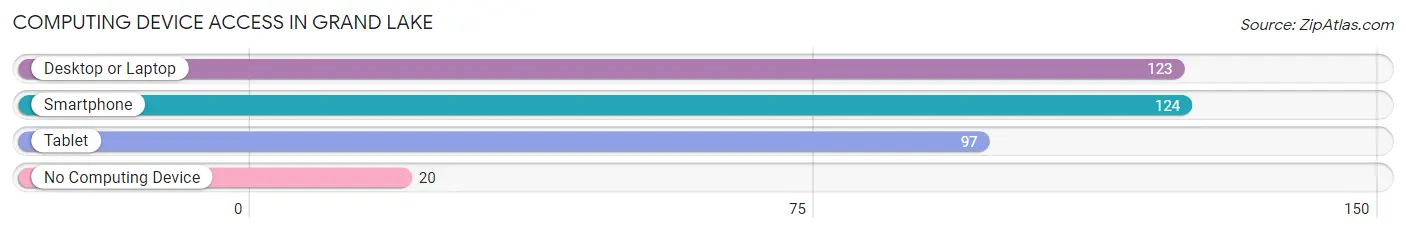
| Device Type | # Households | % Households |
| Desktop or Laptop | 123 | 71.1% |
| Smartphone | 124 | 71.7% |
| Tablet | 97 | 56.1% |
| No Computing Device | 20 | 11.6% |
| Total | 173 | 100.0% |
Internet Access in Grand Lake
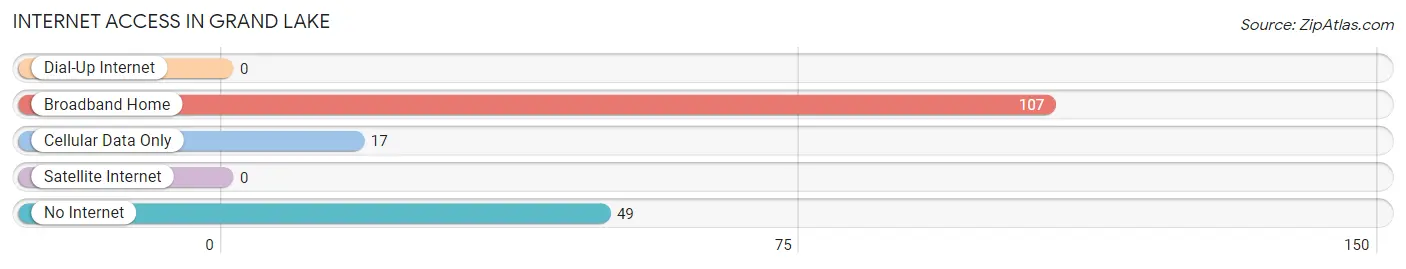
| Internet Type | # Households | % Households |
| Dial-Up Internet | 0 | 0.0% |
| Broadband Home | 107 | 61.9% |
| Cellular Data Only | 17 | 9.8% |
| Satellite Internet | 0 | 0.0% |
| No Internet | 49 | 28.3% |
| Total | 173 | 100.0% |
Grand Lake Summary
Grand Lake, Colorado is a small town located in Grand County, Colorado, United States. It is situated on the western shore of Grand Lake, the largest natural body of water in Colorado. The town is located in the Rocky Mountains, at an elevation of 8,369 feet (2,551 m). Grand Lake is the gateway to Rocky Mountain National Park, and is a popular destination for outdoor recreation.
History
Grand Lake was first settled in 1881, when a group of settlers from Kansas arrived in the area. The town was originally called Grand Lake City, but the name was changed to Grand Lake in 1883. The town was incorporated in 1944.
Grand Lake has a long history of tourism. In the late 19th century, the town was a popular destination for wealthy tourists from the East Coast. The town was also a popular destination for fishermen, and was known for its trout fishing.
In the early 20th century, Grand Lake became a popular destination for Hollywood celebrities. Many movies were filmed in the area, including “The Shining” and “Thelma and Louise.”
Geography
Grand Lake is located in Grand County, Colorado, in the Rocky Mountains. The town is situated on the western shore of Grand Lake, the largest natural body of water in Colorado. The lake is fed by the Colorado River, and is surrounded by mountains and forests.
The town is located at an elevation of 8,369 feet (2,551 m). The climate is cold and snowy in the winter, and mild and sunny in the summer.
Economy
The economy of Grand Lake is largely based on tourism. The town is a popular destination for outdoor recreation, and is the gateway to Rocky Mountain National Park. The town is also known for its trout fishing, and is a popular destination for fishermen.
The town is home to several restaurants, hotels, and other businesses that cater to tourists. The town also has a small airport, which is used by private planes and helicopters.
Demographics
As of the 2010 census, the population of Grand Lake was 462. The racial makeup of the town was 97.2% White, 0.2% African American, 0.2% Native American, 0.2% Asian, 0.2% from other races, and 1.9% from two or more races. Hispanic or Latino of any race were 1.3% of the population.
The median income for a household in the town was $45,833, and the median income for a family was $50,000. The per capita income for the town was $25,945. About 8.3% of families and 10.2% of the population were below the poverty line, including 11.1% of those under age 18 and none of those age 65 or over.
Common Questions
What is Per Capita Income in Grand Lake?
Per Capita income in Grand Lake is $66,849.
What is the Median Family Income in Grand Lake?
Median Family Income in Grand Lake is $137,813.
What is Inequality or Gini Index in Grand Lake?
Inequality or Gini Index in Grand Lake is 0.50.
What is the Total Population of Grand Lake?
Total Population of Grand Lake is 281.
What is the Total Male Population of Grand Lake?
Total Male Population of Grand Lake is 134.
What is the Total Female Population of Grand Lake?
Total Female Population of Grand Lake is 147.
What is the Ratio of Males per 100 Females in Grand Lake?
There are 91.16 Males per 100 Females in Grand Lake.
What is the Ratio of Females per 100 Males in Grand Lake?
There are 109.70 Females per 100 Males in Grand Lake.
What is the Median Population Age in Grand Lake?
Median Population Age in Grand Lake is 66.4 Years.
What is the Average Family Size in Grand Lake
Average Family Size in Grand Lake is 2.2 People.
What is the Average Household Size in Grand Lake
Average Household Size in Grand Lake is 1.6 People.
How Large is the Labor Force in Grand Lake?
There are 154 People in the Labor Forcein in Grand Lake.
What is the Percentage of People in the Labor Force in Grand Lake?
59.2% of People are in the Labor Force in Grand Lake.
What is the Unemployment Rate in Grand Lake?
Unemployment Rate in Grand Lake is 2.6%.