Granby, CO Map & Demographics
Granby Map
Granby Overview
$47,175
PER CAPITA INCOME
$112,022
AVG FAMILY INCOME
$77,679
AVG HOUSEHOLD INCOME
17.4%
WAGE / INCOME GAP [ % ]
82.6¢/ $1
WAGE / INCOME GAP [ $ ]
0.37
INEQUALITY / GINI INDEX
2,074
TOTAL POPULATION
1,137
MALE POPULATION
937
FEMALE POPULATION
121.34
MALES / 100 FEMALES
82.41
FEMALES / 100 MALES
41.6
MEDIAN AGE
2.9
AVG FAMILY SIZE
2.2
AVG HOUSEHOLD SIZE
1,223
LABOR FORCE [ PEOPLE ]
69.5%
PERCENT IN LABOR FORCE
0.2%
UNEMPLOYMENT RATE
Granby Zip Codes
Granby Area Codes
Income in Granby
Income Overview in Granby
Per Capita Income in Granby is $47,175, while median incomes of families and households are $112,022 and $77,679 respectively.
| Characteristic | Number | Measure |
| Per Capita Income | 2,074 | $47,175 |
| Median Family Income | 543 | $112,022 |
| Mean Family Income | 543 | $123,179 |
| Median Household Income | 953 | $77,679 |
| Mean Household Income | 953 | $97,046 |
| Income Deficit | 543 | $0 |
| Wage / Income Gap (%) | 2,074 | 17.41% |
| Wage / Income Gap ($) | 2,074 | 82.59¢ per $1 |
| Gini / Inequality Index | 2,074 | 0.37 |
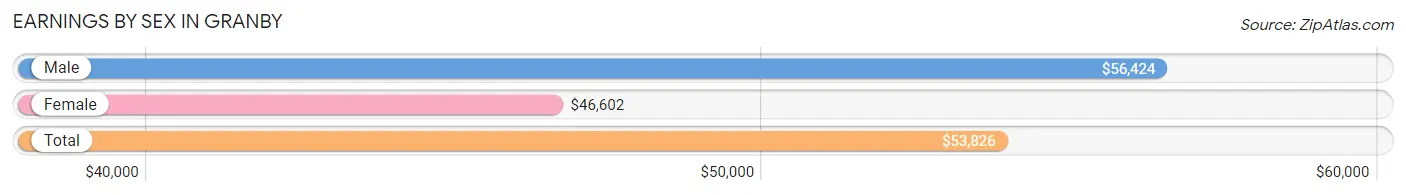
Earnings by Sex in Granby
Average Earnings in Granby are $53,826, $56,424 for men and $46,602 for women, a difference of 17.4%.
| Sex | Number | Average Earnings |
| Male | 778 (62.4%) | $56,424 |
| Female | 469 (37.6%) | $46,602 |
| Total | 1,247 (100.0%) | $53,826 |
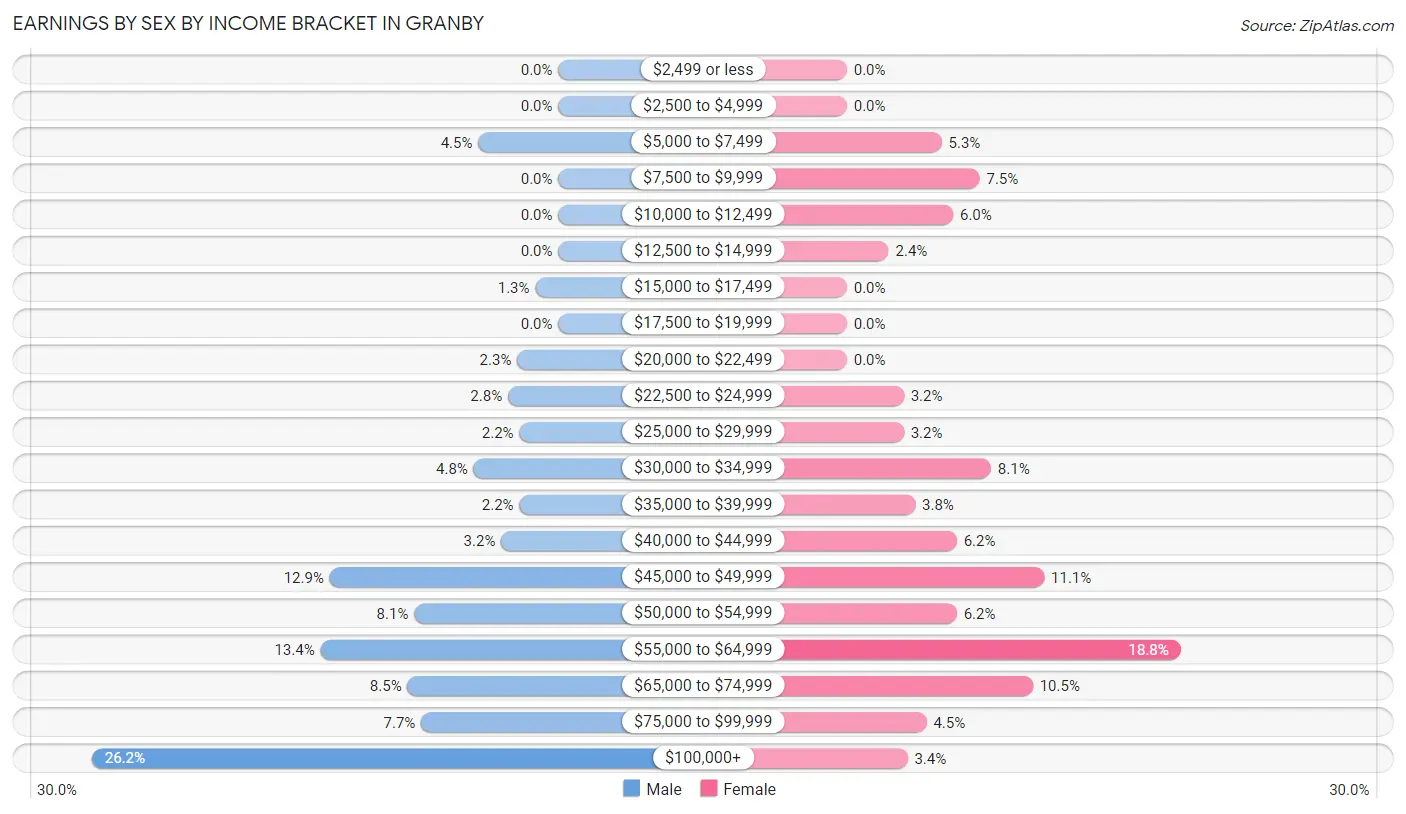
Earnings by Sex by Income Bracket in Granby
The most common earnings brackets in Granby are $100,000+ for men (204 | 26.2%) and $55,000 to $64,999 for women (88 | 18.8%).
| Income | Male | Female |
| $2,499 or less | 0 (0.0%) | 0 (0.0%) |
| $2,500 to $4,999 | 0 (0.0%) | 0 (0.0%) |
| $5,000 to $7,499 | 35 (4.5%) | 25 (5.3%) |
| $7,500 to $9,999 | 0 (0.0%) | 35 (7.5%) |
| $10,000 to $12,499 | 0 (0.0%) | 28 (6.0%) |
| $12,500 to $14,999 | 0 (0.0%) | 11 (2.4%) |
| $15,000 to $17,499 | 10 (1.3%) | 0 (0.0%) |
| $17,500 to $19,999 | 0 (0.0%) | 0 (0.0%) |
| $20,000 to $22,499 | 18 (2.3%) | 0 (0.0%) |
| $22,500 to $24,999 | 22 (2.8%) | 15 (3.2%) |
| $25,000 to $29,999 | 17 (2.2%) | 15 (3.2%) |
| $30,000 to $34,999 | 37 (4.8%) | 38 (8.1%) |
| $35,000 to $39,999 | 17 (2.2%) | 18 (3.8%) |
| $40,000 to $44,999 | 25 (3.2%) | 29 (6.2%) |
| $45,000 to $49,999 | 100 (12.9%) | 52 (11.1%) |
| $50,000 to $54,999 | 63 (8.1%) | 29 (6.2%) |
| $55,000 to $64,999 | 104 (13.4%) | 88 (18.8%) |
| $65,000 to $74,999 | 66 (8.5%) | 49 (10.4%) |
| $75,000 to $99,999 | 60 (7.7%) | 21 (4.5%) |
| $100,000+ | 204 (26.2%) | 16 (3.4%) |
| Total | 778 (100.0%) | 469 (100.0%) |
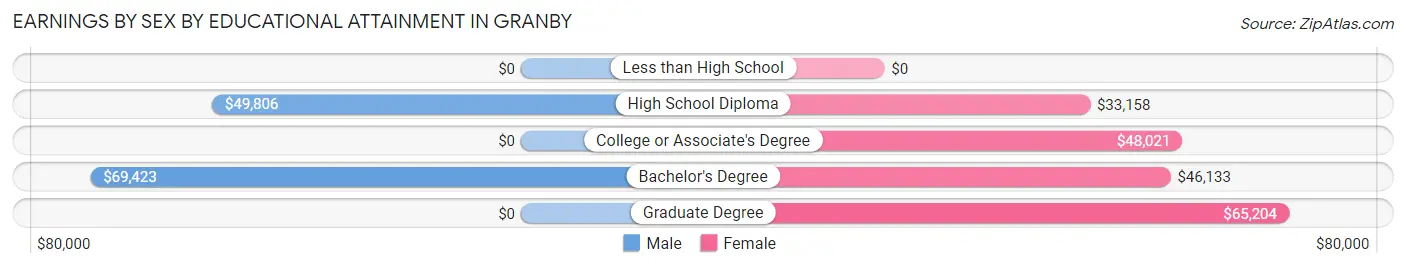
Earnings by Sex by Educational Attainment in Granby
Average earnings in Granby are $57,057 for men and $48,500 for women, a difference of 15.0%. Men with an educational attainment of bachelor's degree enjoy the highest average annual earnings of $69,423, while those with high school diploma education earn the least with $49,806. Women with an educational attainment of graduate degree earn the most with the average annual earnings of $65,204, while those with high school diploma education have the smallest earnings of $33,158.
| Educational Attainment | Male Income | Female Income |
| Less than High School | - | - |
| High School Diploma | $49,806 | $33,158 |
| College or Associate's Degree | - | - |
| Bachelor's Degree | $69,423 | $46,133 |
| Graduate Degree | - | - |
| Total | $57,057 | $48,500 |
Family Income in Granby
Family Income Brackets in Granby
According to the Granby family income data, there are 210 families falling into the $100,000 to $149,999 income range, which is the most common income bracket and makes up 38.7% of all families.
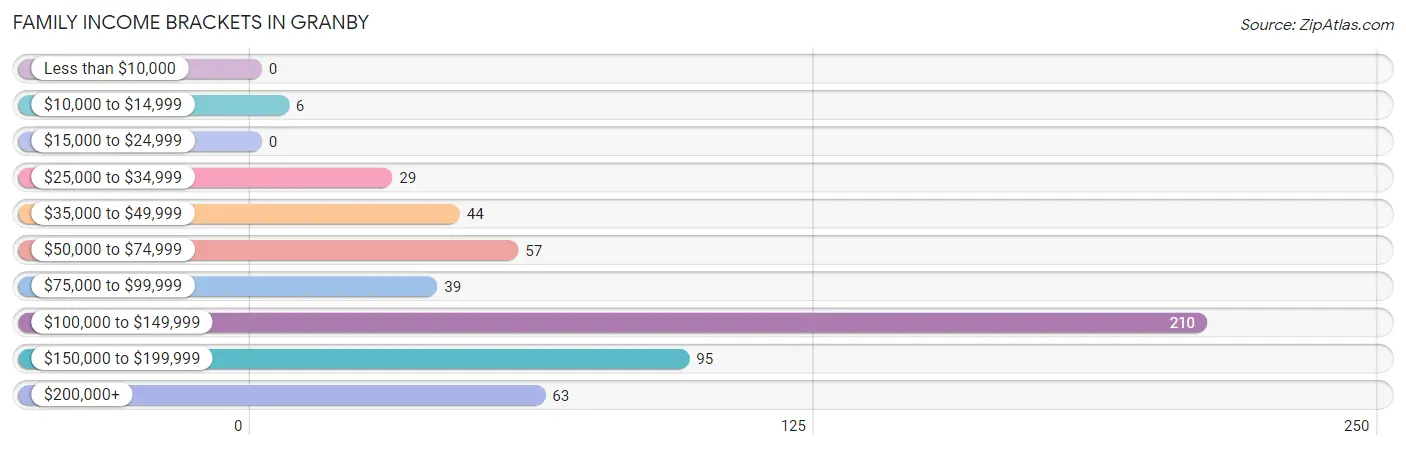
| Income Bracket | # Families | % Families |
| Less than $10,000 | 0 | 0.0% |
| $10,000 to $14,999 | 6 | 1.1% |
| $15,000 to $24,999 | 0 | 0.0% |
| $25,000 to $34,999 | 29 | 5.3% |
| $35,000 to $49,999 | 44 | 8.1% |
| $50,000 to $74,999 | 57 | 10.5% |
| $75,000 to $99,999 | 39 | 7.2% |
| $100,000 to $149,999 | 210 | 38.7% |
| $150,000 to $199,999 | 95 | 17.5% |
| $200,000+ | 63 | 11.6% |
Family Income by Famaliy Size in Granby
4-person families (102 | 18.8%) account for the highest median family income in Granby with $124,286 per family, while 2-person families (341 | 62.8%) have the highest median income of $53,660 per family member.
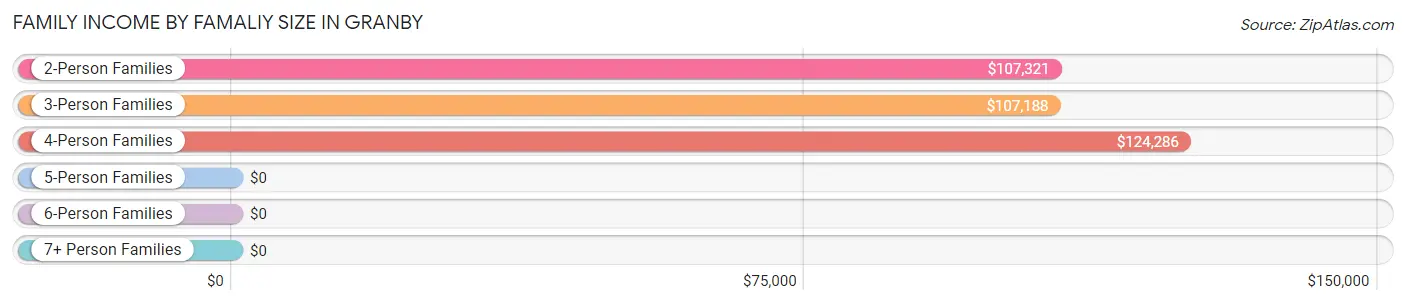
| Income Bracket | # Families | Median Income |
| 2-Person Families | 341 (62.8%) | $107,321 |
| 3-Person Families | 74 (13.6%) | $107,188 |
| 4-Person Families | 102 (18.8%) | $124,286 |
| 5-Person Families | 26 (4.8%) | $0 |
| 6-Person Families | 0 (0.0%) | $0 |
| 7+ Person Families | 0 (0.0%) | $0 |
| Total | 543 (100.0%) | $112,022 |
Family Income by Number of Earners in Granby
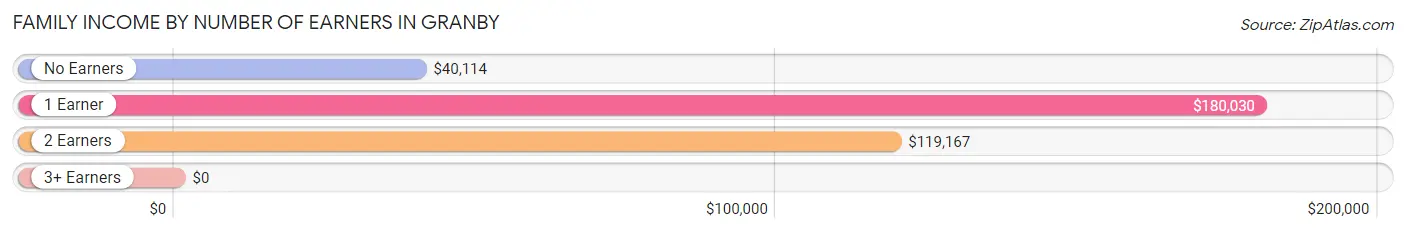
| Number of Earners | # Families | Median Income |
| No Earners | 72 (13.3%) | $40,114 |
| 1 Earner | 101 (18.6%) | $180,030 |
| 2 Earners | 360 (66.3%) | $119,167 |
| 3+ Earners | 10 (1.8%) | $0 |
| Total | 543 (100.0%) | $112,022 |
Household Income in Granby
Household Income Brackets in Granby
With 256 households falling in the category, the $100,000 to $149,999 income range is the most frequent in Granby, accounting for 26.9% of all households. In contrast, only 14 households (1.5%) fall into the $15,000 to $24,999 income bracket, making it the least populous group.
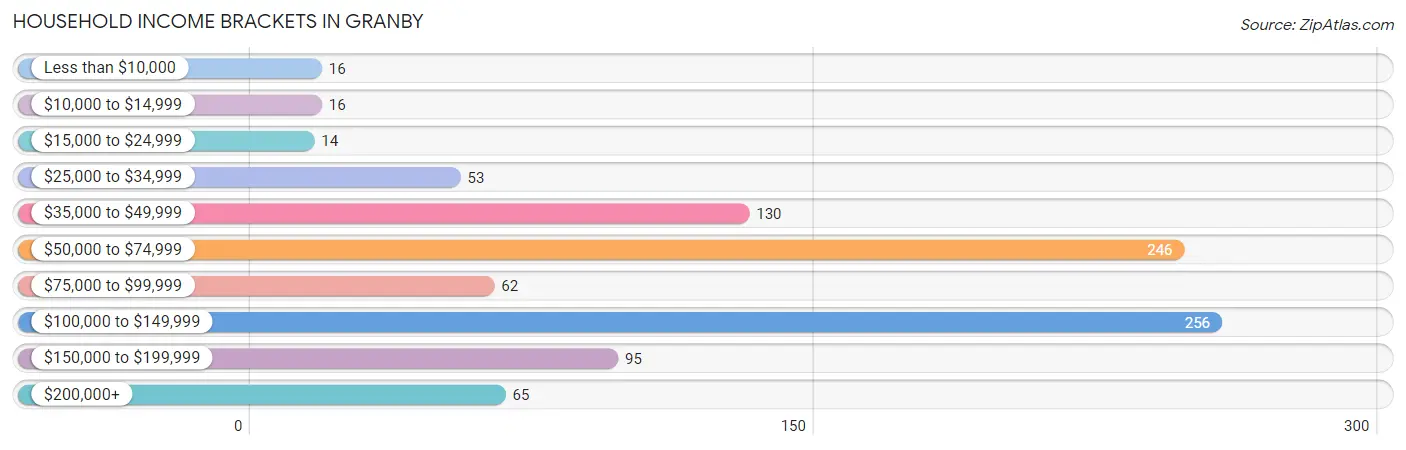
| Income Bracket | # Households | % Households |
| Less than $10,000 | 16 | 1.7% |
| $10,000 to $14,999 | 16 | 1.7% |
| $15,000 to $24,999 | 14 | 1.5% |
| $25,000 to $34,999 | 53 | 5.6% |
| $35,000 to $49,999 | 130 | 13.6% |
| $50,000 to $74,999 | 246 | 25.8% |
| $75,000 to $99,999 | 62 | 6.5% |
| $100,000 to $149,999 | 256 | 26.9% |
| $150,000 to $199,999 | 95 | 10.0% |
| $200,000+ | 65 | 6.8% |
Household Income by Householder Age in Granby
The median household income in Granby is $77,679, with the highest median household income of $104,883 found in the 25 to 44 years age bracket for the primary householder. A total of 311 households (32.6%) fall into this category. Meanwhile, the 15 to 24 years age bracket for the primary householder has the lowest median household income of $0, with 24 households (2.5%) in this group.
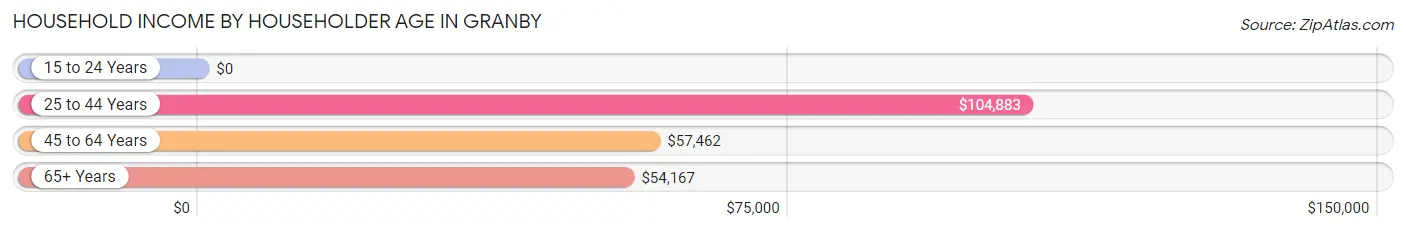
| Income Bracket | # Households | Median Income |
| 15 to 24 Years | 24 (2.5%) | $0 |
| 25 to 44 Years | 311 (32.6%) | $104,883 |
| 45 to 64 Years | 382 (40.1%) | $57,462 |
| 65+ Years | 236 (24.8%) | $54,167 |
| Total | 953 (100.0%) | $77,679 |
Poverty in Granby
Income Below Poverty by Sex and Age in Granby
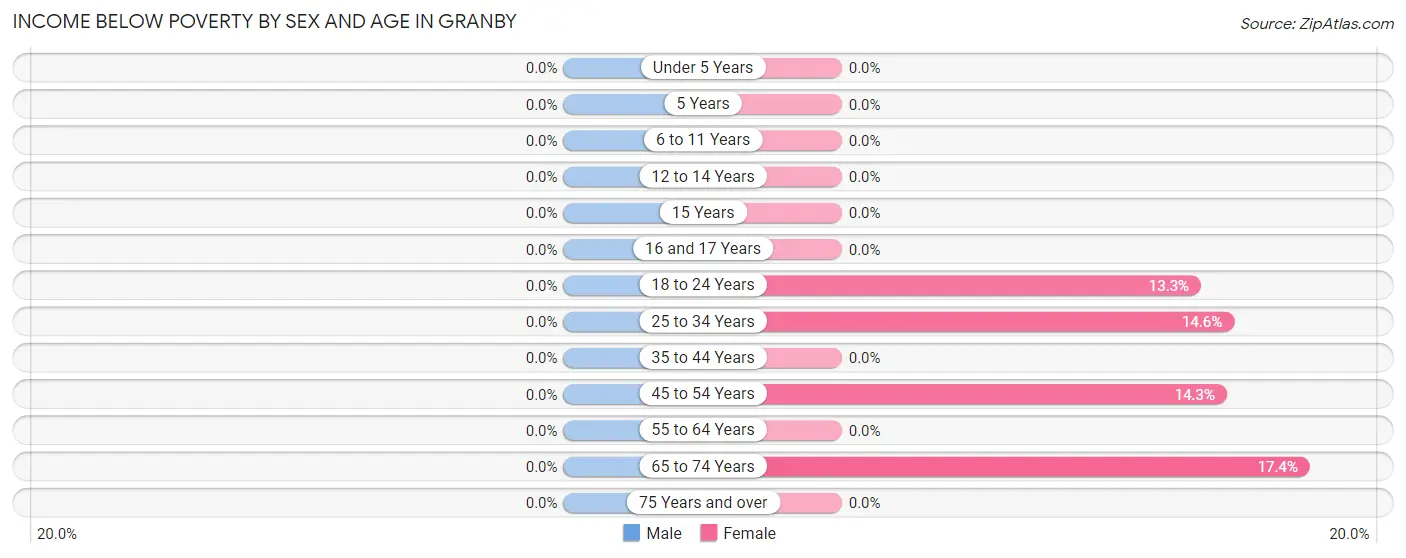
| Age Bracket | Male | Female |
| Under 5 Years | 0 (0.0%) | 0 (0.0%) |
| 5 Years | 0 (0.0%) | 0 (0.0%) |
| 6 to 11 Years | 0 (0.0%) | 0 (0.0%) |
| 12 to 14 Years | 0 (0.0%) | 0 (0.0%) |
| 15 Years | 0 (0.0%) | 0 (0.0%) |
| 16 and 17 Years | 0 (0.0%) | 0 (0.0%) |
| 18 to 24 Years | 0 (0.0%) | 6 (13.3%) |
| 25 to 34 Years | 0 (0.0%) | 15 (14.6%) |
| 35 to 44 Years | 0 (0.0%) | 0 (0.0%) |
| 45 to 54 Years | 0 (0.0%) | 16 (14.3%) |
| 55 to 64 Years | 0 (0.0%) | 0 (0.0%) |
| 65 to 74 Years | 0 (0.0%) | 37 (17.4%) |
| 75 Years and over | 0 (0.0%) | 0 (0.0%) |
| Total | 0 (0.0%) | 74 (7.9%) |
Income Above Poverty by Sex and Age in Granby
According to the poverty statistics in Granby, males aged under 5 years and females aged under 5 years are the age groups that are most secure financially, with 100.0% of males and 100.0% of females in these age groups living above the poverty line.
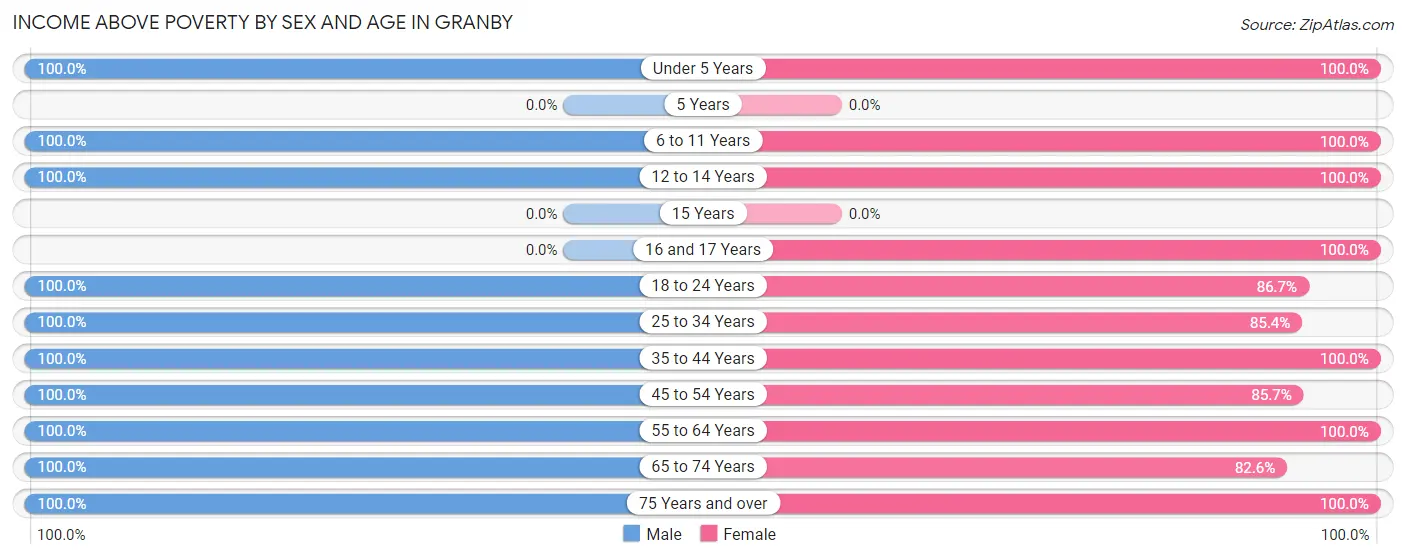
| Age Bracket | Male | Female |
| Under 5 Years | 81 (100.0%) | 75 (100.0%) |
| 5 Years | 0 (0.0%) | 0 (0.0%) |
| 6 to 11 Years | 88 (100.0%) | 37 (100.0%) |
| 12 to 14 Years | 10 (100.0%) | 24 (100.0%) |
| 15 Years | 0 (0.0%) | 0 (0.0%) |
| 16 and 17 Years | 0 (0.0%) | 15 (100.0%) |
| 18 to 24 Years | 87 (100.0%) | 39 (86.7%) |
| 25 to 34 Years | 159 (100.0%) | 88 (85.4%) |
| 35 to 44 Years | 202 (100.0%) | 148 (100.0%) |
| 45 to 54 Years | 122 (100.0%) | 96 (85.7%) |
| 55 to 64 Years | 198 (100.0%) | 65 (100.0%) |
| 65 to 74 Years | 130 (100.0%) | 176 (82.6%) |
| 75 Years and over | 60 (100.0%) | 100 (100.0%) |
| Total | 1,137 (100.0%) | 863 (92.1%) |
Income Below Poverty Among Married-Couple Families in Granby
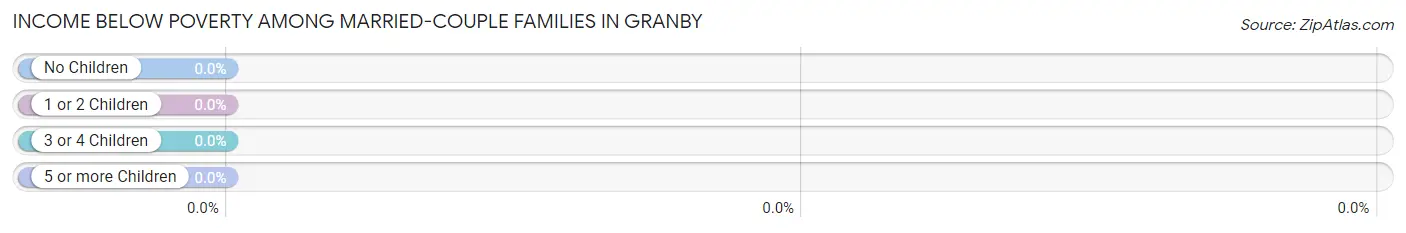
| Children | Above Poverty | Below Poverty |
| No Children | 337 (100.0%) | 0 (0.0%) |
| 1 or 2 Children | 146 (100.0%) | 0 (0.0%) |
| 3 or 4 Children | 26 (100.0%) | 0 (0.0%) |
| 5 or more Children | 0 (0.0%) | 0 (0.0%) |
| Total | 509 (100.0%) | 0 (0.0%) |
Income Below Poverty Among Single-Parent Households in Granby
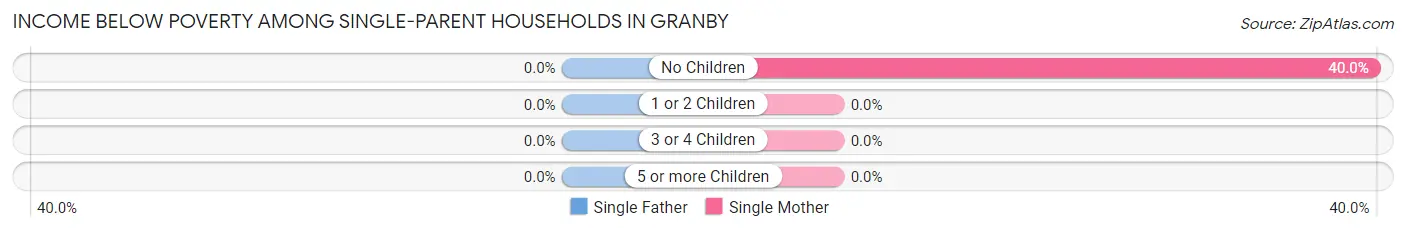
| Children | Single Father | Single Mother |
| No Children | 0 (0.0%) | 6 (40.0%) |
| 1 or 2 Children | 0 (0.0%) | 0 (0.0%) |
| 3 or 4 Children | 0 (0.0%) | 0 (0.0%) |
| 5 or more Children | 0 (0.0%) | 0 (0.0%) |
| Total | 0 (0.0%) | 6 (40.0%) |
Income Below Poverty Among Married-Couple vs Single-Parent Households in Granby
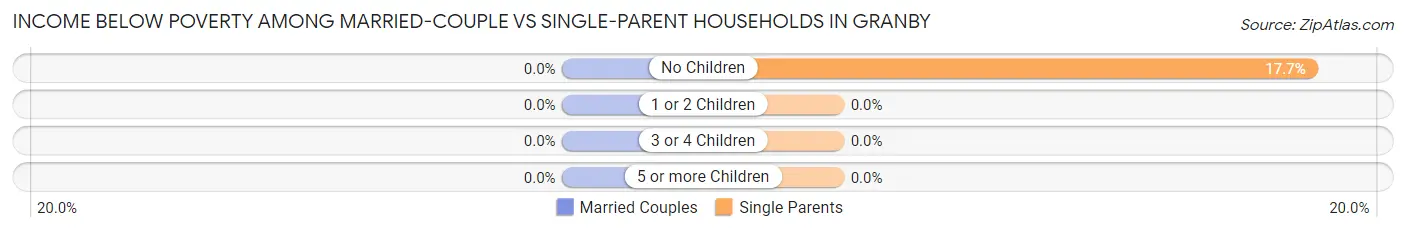
| Children | Married-Couple Families | Single-Parent Households |
| No Children | 0 (0.0%) | 6 (17.6%) |
| 1 or 2 Children | 0 (0.0%) | 0 (0.0%) |
| 3 or 4 Children | 0 (0.0%) | 0 (0.0%) |
| 5 or more Children | 0 (0.0%) | 0 (0.0%) |
| Total | 0 (0.0%) | 6 (17.6%) |
Race in Granby
The most populous races in Granby are White / Caucasian (1,851 | 89.2%), Two or more Races (190 | 9.2%), and Hispanic or Latino (63 | 3.0%).
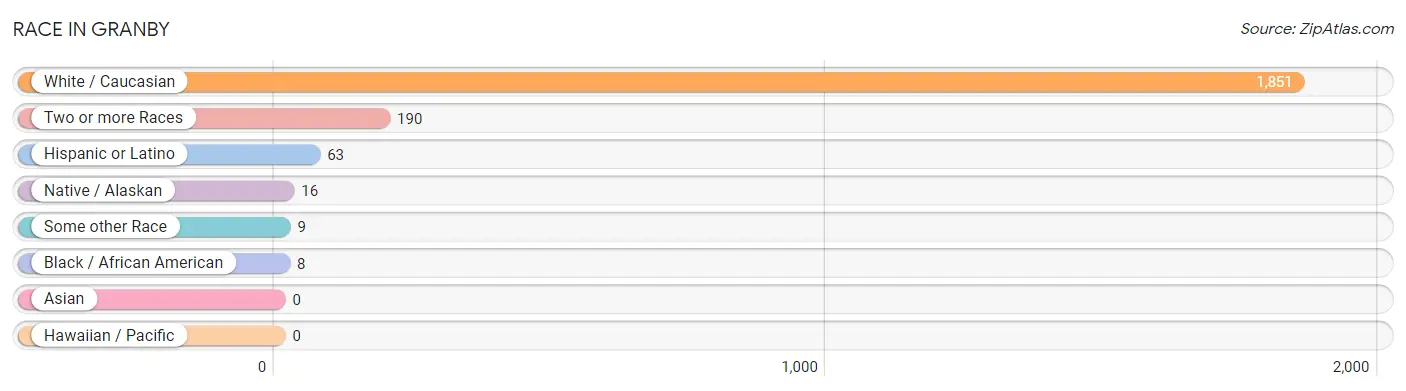
| Race | # Population | % Population |
| Asian | 0 | 0.0% |
| Black / African American | 8 | 0.4% |
| Hawaiian / Pacific | 0 | 0.0% |
| Hispanic or Latino | 63 | 3.0% |
| Native / Alaskan | 16 | 0.8% |
| White / Caucasian | 1,851 | 89.2% |
| Two or more Races | 190 | 9.2% |
| Some other Race | 9 | 0.4% |
| Total | 2,074 | 100.0% |
Ancestry in Granby
The most populous ancestries reported in Granby are German (489 | 23.6%), English (247 | 11.9%), Irish (232 | 11.2%), Norwegian (229 | 11.0%), and Scottish (148 | 7.1%), together accounting for 64.9% of all Granby residents.
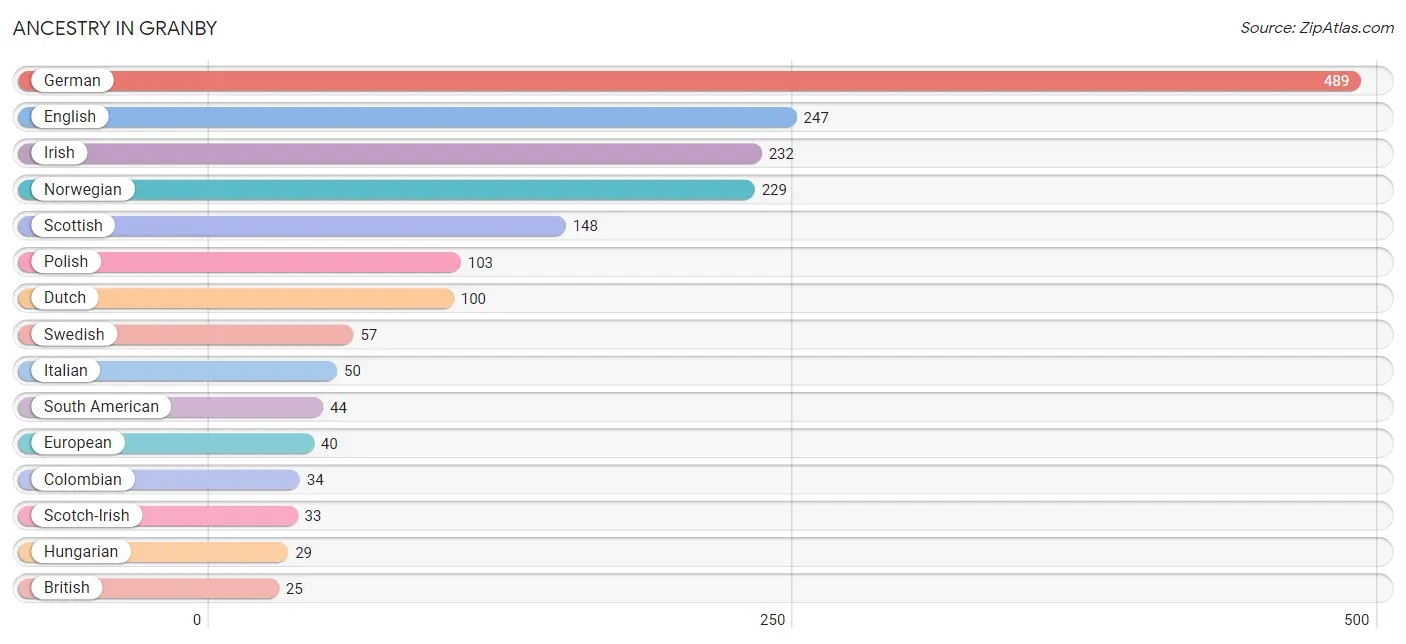
| Ancestry | # Population | % Population |
| Austrian | 6 | 0.3% |
| Belgian | 10 | 0.5% |
| British | 25 | 1.2% |
| Canadian | 3 | 0.1% |
| Choctaw | 16 | 0.8% |
| Colombian | 34 | 1.6% |
| Danish | 11 | 0.5% |
| Dutch | 100 | 4.8% |
| English | 247 | 11.9% |
| European | 40 | 1.9% |
| French | 21 | 1.0% |
| German | 489 | 23.6% |
| Hungarian | 29 | 1.4% |
| Irish | 232 | 11.2% |
| Italian | 50 | 2.4% |
| Mexican | 5 | 0.2% |
| Norwegian | 229 | 11.0% |
| Polish | 103 | 5.0% |
| Scotch-Irish | 33 | 1.6% |
| Scottish | 148 | 7.1% |
| Slovak | 4 | 0.2% |
| South American | 44 | 2.1% |
| Spaniard | 5 | 0.2% |
| Spanish | 7 | 0.3% |
| Swedish | 57 | 2.8% |
| Uruguayan | 10 | 0.5% |
| Welsh | 9 | 0.4% | View All 27 Rows |
Immigrants in Granby
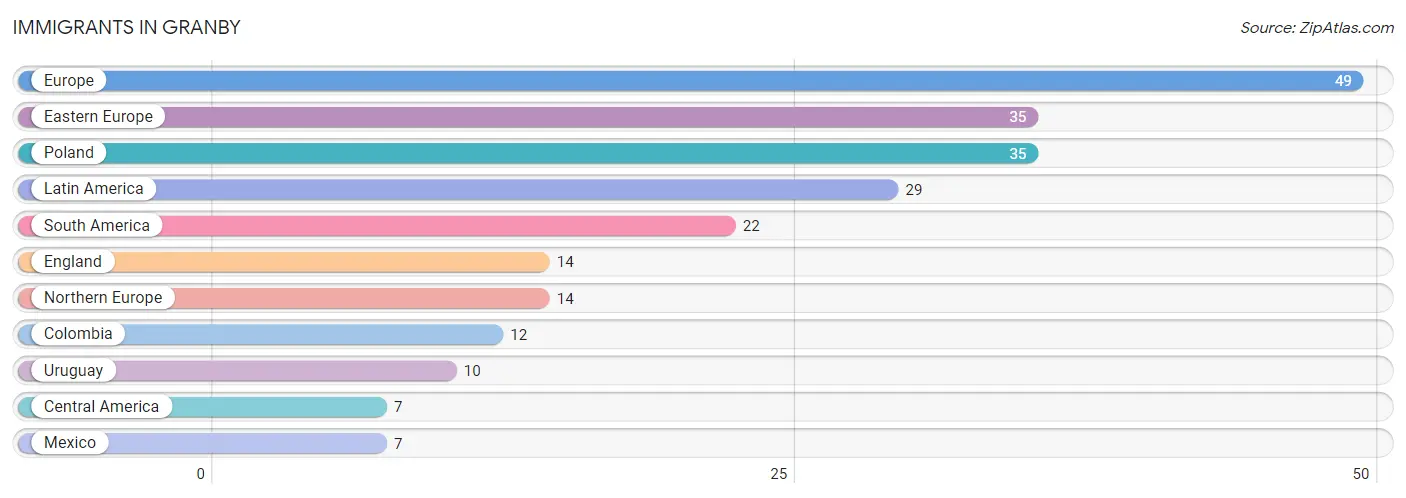
The most numerous immigrant groups reported in Granby came from Europe (49 | 2.4%), Eastern Europe (35 | 1.7%), Poland (35 | 1.7%), Latin America (29 | 1.4%), and South America (22 | 1.1%), together accounting for 8.2% of all Granby residents.
| Immigration Origin | # Population | % Population |
| Central America | 7 | 0.3% |
| Colombia | 12 | 0.6% |
| Eastern Europe | 35 | 1.7% |
| England | 14 | 0.7% |
| Europe | 49 | 2.4% |
| Latin America | 29 | 1.4% |
| Mexico | 7 | 0.3% |
| Northern Europe | 14 | 0.7% |
| Poland | 35 | 1.7% |
| South America | 22 | 1.1% |
| Uruguay | 10 | 0.5% | View All 11 Rows |
Sex and Age in Granby
Sex and Age in Granby
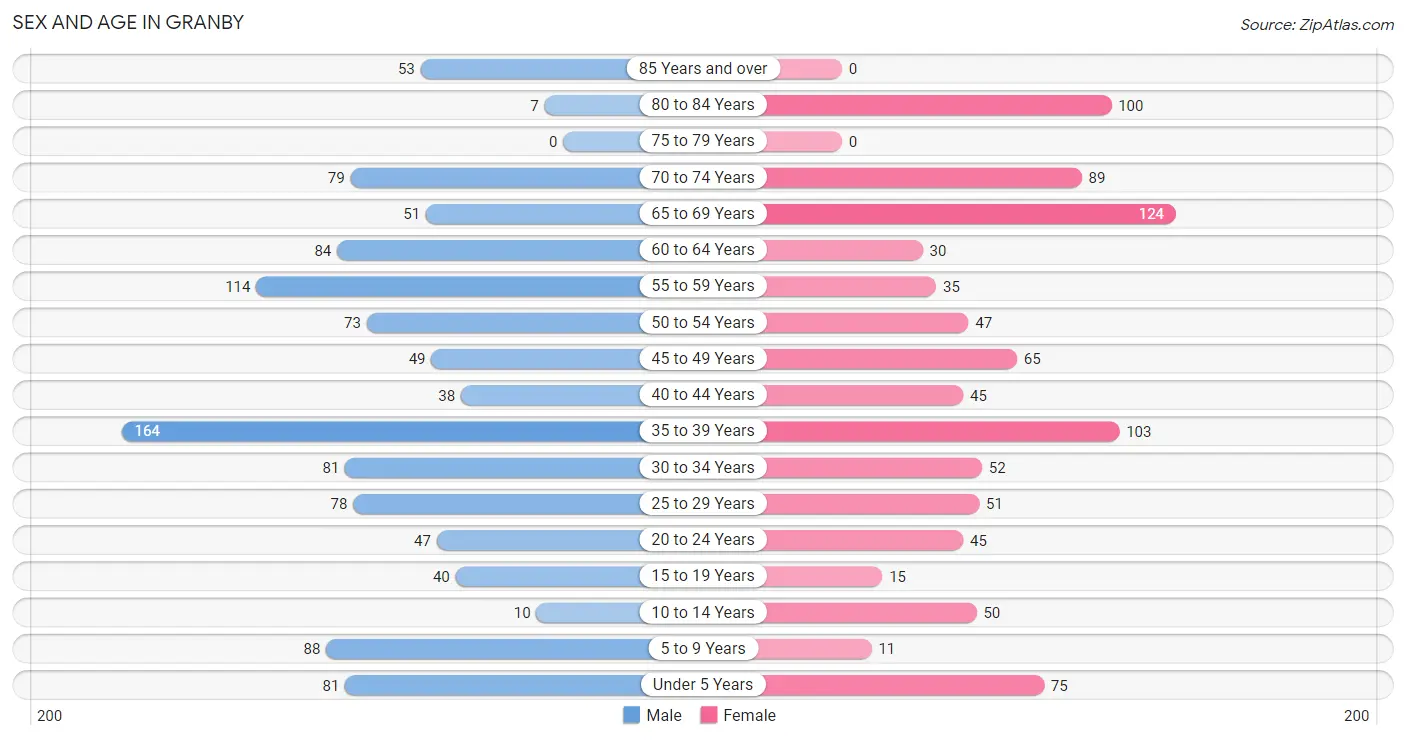
The most populous age groups in Granby are 35 to 39 Years (164 | 14.4%) for men and 65 to 69 Years (124 | 13.2%) for women.
| Age Bracket | Male | Female |
| Under 5 Years | 81 (7.1%) | 75 (8.0%) |
| 5 to 9 Years | 88 (7.7%) | 11 (1.2%) |
| 10 to 14 Years | 10 (0.9%) | 50 (5.3%) |
| 15 to 19 Years | 40 (3.5%) | 15 (1.6%) |
| 20 to 24 Years | 47 (4.1%) | 45 (4.8%) |
| 25 to 29 Years | 78 (6.9%) | 51 (5.4%) |
| 30 to 34 Years | 81 (7.1%) | 52 (5.6%) |
| 35 to 39 Years | 164 (14.4%) | 103 (11.0%) |
| 40 to 44 Years | 38 (3.3%) | 45 (4.8%) |
| 45 to 49 Years | 49 (4.3%) | 65 (6.9%) |
| 50 to 54 Years | 73 (6.4%) | 47 (5.0%) |
| 55 to 59 Years | 114 (10.0%) | 35 (3.7%) |
| 60 to 64 Years | 84 (7.4%) | 30 (3.2%) |
| 65 to 69 Years | 51 (4.5%) | 124 (13.2%) |
| 70 to 74 Years | 79 (7.0%) | 89 (9.5%) |
| 75 to 79 Years | 0 (0.0%) | 0 (0.0%) |
| 80 to 84 Years | 7 (0.6%) | 100 (10.7%) |
| 85 Years and over | 53 (4.7%) | 0 (0.0%) |
| Total | 1,137 (100.0%) | 937 (100.0%) |
Families and Households in Granby
Median Family Size in Granby
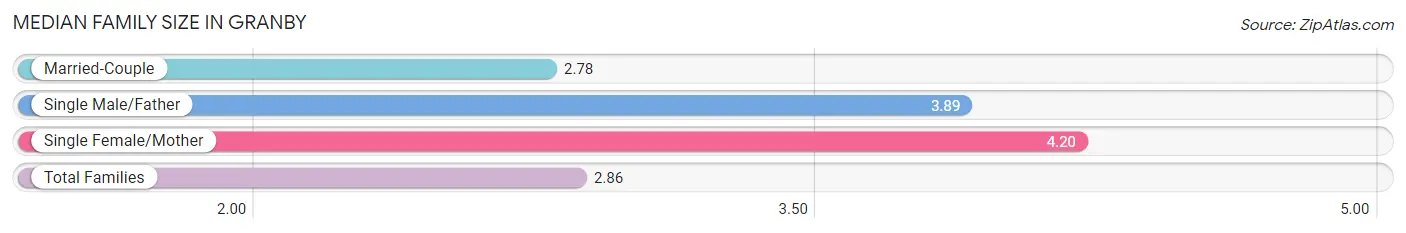
The median family size in Granby is 2.86 persons per family, with single female/mother families (15 | 2.8%) accounting for the largest median family size of 4.2 persons per family. On the other hand, married-couple families (509 | 93.7%) represent the smallest median family size with 2.78 persons per family.
| Family Type | # Families | Family Size |
| Married-Couple | 509 (93.7%) | 2.78 |
| Single Male/Father | 19 (3.5%) | 3.89 |
| Single Female/Mother | 15 (2.8%) | 4.20 |
| Total Families | 543 (100.0%) | 2.86 |
Median Household Size in Granby
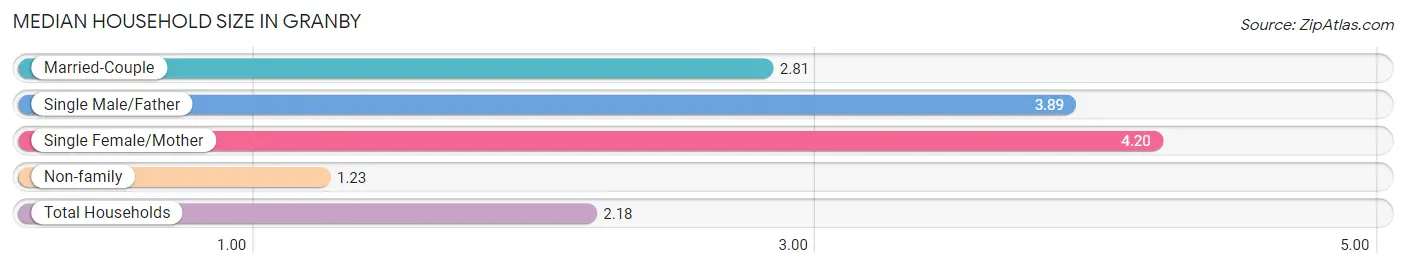
The median household size in Granby is 2.18 persons per household, with single female/mother households (15 | 1.6%) accounting for the largest median household size of 4.2 persons per household. non-family households (410 | 43.0%) represent the smallest median household size with 1.23 persons per household.
| Household Type | # Households | Household Size |
| Married-Couple | 509 (53.4%) | 2.81 |
| Single Male/Father | 19 (2.0%) | 3.89 |
| Single Female/Mother | 15 (1.6%) | 4.20 |
| Non-family | 410 (43.0%) | 1.23 |
| Total Households | 953 (100.0%) | 2.18 |
Household Size by Marriage Status in Granby
Out of a total of 953 households in Granby, 543 (57.0%) are family households, while 410 (43.0%) are nonfamily households. The most numerous type of family households are 2-person households, comprising 341, and the most common type of nonfamily households are 1-person households, comprising 368.
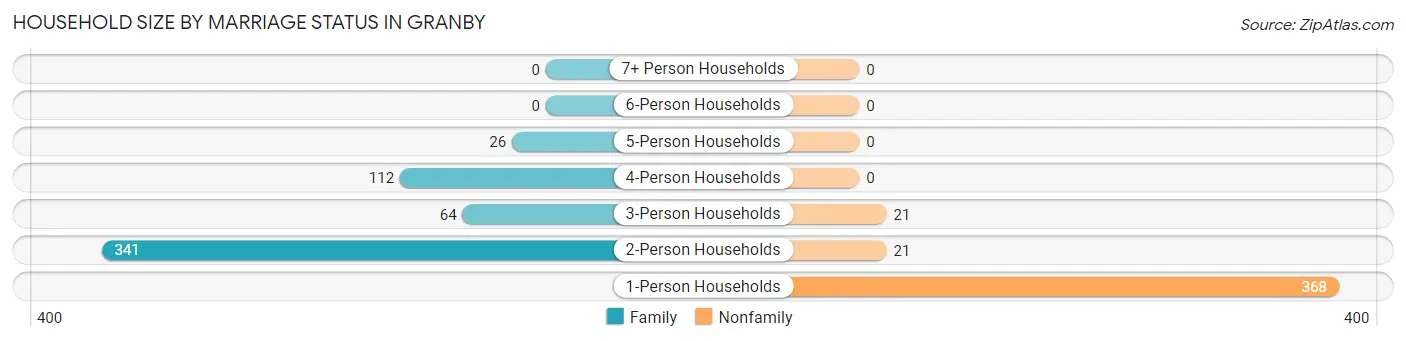
| Household Size | Family Households | Nonfamily Households |
| 1-Person Households | - | 368 (38.6%) |
| 2-Person Households | 341 (35.8%) | 21 (2.2%) |
| 3-Person Households | 64 (6.7%) | 21 (2.2%) |
| 4-Person Households | 112 (11.7%) | 0 (0.0%) |
| 5-Person Households | 26 (2.7%) | 0 (0.0%) |
| 6-Person Households | 0 (0.0%) | 0 (0.0%) |
| 7+ Person Households | 0 (0.0%) | 0 (0.0%) |
| Total | 543 (57.0%) | 410 (43.0%) |
Female Fertility in Granby
Fertility by Age in Granby
| Age Bracket | Women with Births | Births / 1,000 Women |
| 15 to 19 years | 0 (0.0%) | 0.0 |
| 20 to 34 years | 0 (0.0%) | 0.0 |
| 35 to 50 years | 0 (0.0%) | 0.0 |
| Total | 0 (0.0%) | 0.0 |
Fertility by Age by Marriage Status in Granby
| Age Bracket | Married | Unmarried |
| 15 to 19 years | 0 (0.0%) | 0 (0.0%) |
| 20 to 34 years | 0 (0.0%) | 0 (0.0%) |
| 35 to 50 years | 0 (0.0%) | 0 (0.0%) |
| Total | 0 (0.0%) | 0 (0.0%) |
Fertility by Education in Granby
| Educational Attainment | Women with Births | Births / 1,000 Women |
| Less than High School | 0 (0.0%) | 0.0 |
| High School Diploma | 0 (0.0%) | 0.0 |
| College or Associate's Degree | 0 (0.0%) | 0.0 |
| Bachelor's Degree | 0 (0.0%) | 0.0 |
| Graduate Degree | 0 (0.0%) | 0.0 |
| Total | 0 (0.0%) | 0.0 |
Fertility by Education by Marriage Status in Granby
| Educational Attainment | Married | Unmarried |
| Less than High School | 0 (0.0%) | 0 (0.0%) |
| High School Diploma | 0 (0.0%) | 0 (0.0%) |
| College or Associate's Degree | 0 (0.0%) | 0 (0.0%) |
| Bachelor's Degree | 0 (0.0%) | 0 (0.0%) |
| Graduate Degree | 0 (0.0%) | 0 (0.0%) |
| Total | 0 (0.0%) | 0 (0.0%) |
Employment Characteristics in Granby
Employment by Class of Employer in Granby
Among the 1,221 employed individuals in Granby, private company employees (926 | 75.8%), local government employees (128 | 10.5%), and not-for-profit organizations (85 | 7.0%) make up the most common classes of employment.
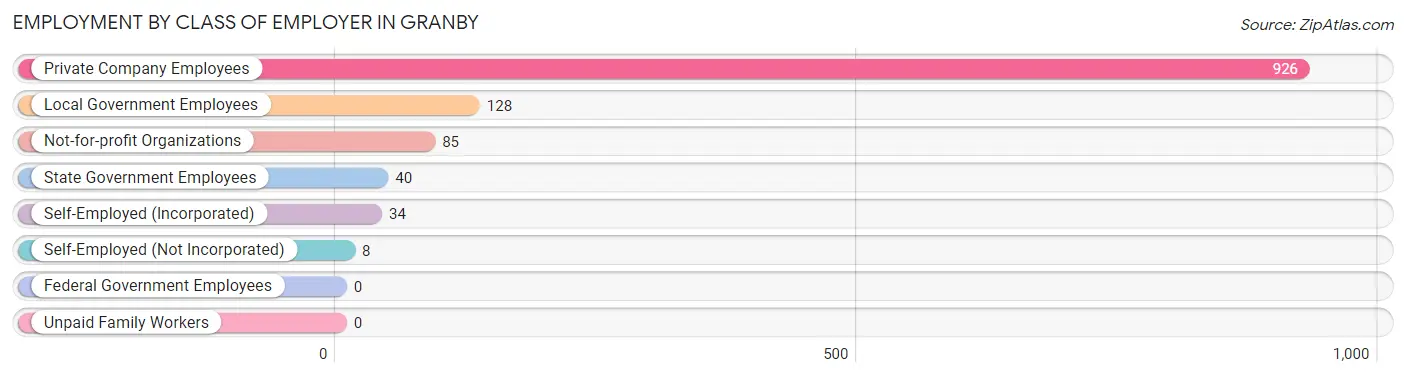
| Employer Class | # Employees | % Employees |
| Private Company Employees | 926 | 75.8% |
| Self-Employed (Incorporated) | 34 | 2.8% |
| Self-Employed (Not Incorporated) | 8 | 0.7% |
| Not-for-profit Organizations | 85 | 7.0% |
| Local Government Employees | 128 | 10.5% |
| State Government Employees | 40 | 3.3% |
| Federal Government Employees | 0 | 0.0% |
| Unpaid Family Workers | 0 | 0.0% |
| Total | 1,221 | 100.0% |
Employment Status by Age in Granby
According to the labor force statistics for Granby, out of the total population over 16 years of age (1,759), 69.5% or 1,223 individuals are in the labor force, with 0.2% or 2 of them unemployed. The age group with the highest labor force participation rate is 55 to 59 years, with 100.0% or 149 individuals in the labor force. Within the labor force, the 60 to 64 years age range has the highest percentage of unemployed individuals, with 2.2% or 2 of them being unemployed.
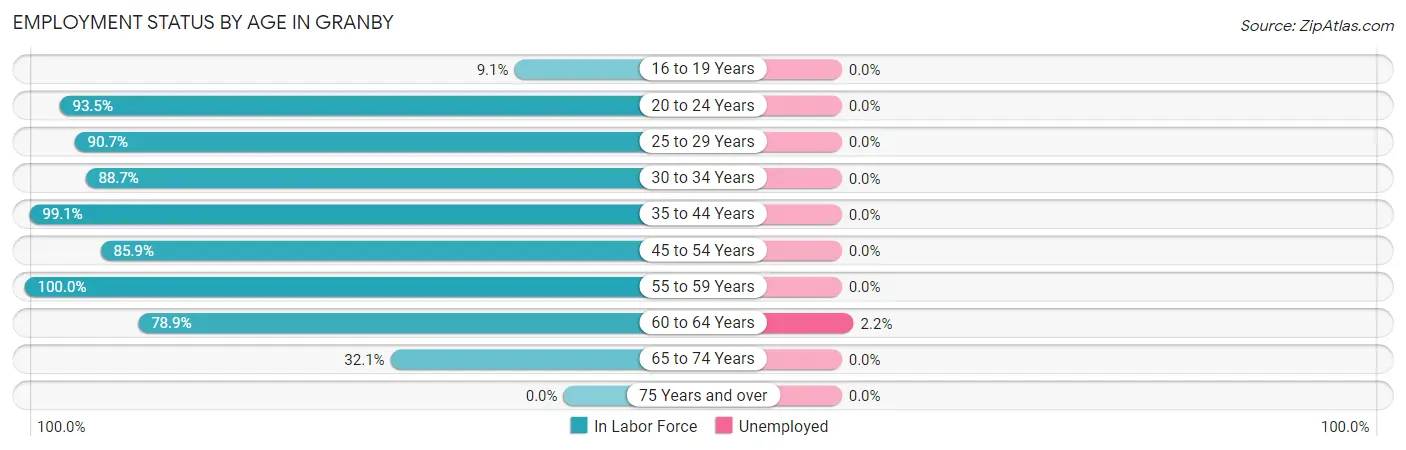
| Age Bracket | In Labor Force | Unemployed |
| 16 to 19 Years | 5 (9.1%) | 0 (0.0%) |
| 20 to 24 Years | 86 (93.5%) | 0 (0.0%) |
| 25 to 29 Years | 117 (90.7%) | 0 (0.0%) |
| 30 to 34 Years | 118 (88.7%) | 0 (0.0%) |
| 35 to 44 Years | 347 (99.1%) | 0 (0.0%) |
| 45 to 54 Years | 201 (85.9%) | 0 (0.0%) |
| 55 to 59 Years | 149 (100.0%) | 0 (0.0%) |
| 60 to 64 Years | 90 (78.9%) | 2 (2.2%) |
| 65 to 74 Years | 110 (32.1%) | 0 (0.0%) |
| 75 Years and over | 0 (0.0%) | 0 (0.0%) |
| Total | 1,223 (69.5%) | 2 (0.2%) |
Employment Status by Educational Attainment in Granby
According to labor force statistics for Granby, 92.2% of individuals (1,022) out of the total population between 25 and 64 years of age (1,109) are in the labor force, with 0.2% or 2 of them being unemployed. The group with the highest labor force participation rate are those with the educational attainment of less than high school, with 100.0% or 35 individuals in the labor force. Within the labor force, individuals with bachelor's degree or higher education have the highest percentage of unemployment, with 0.4% or 2 of them being unemployed.
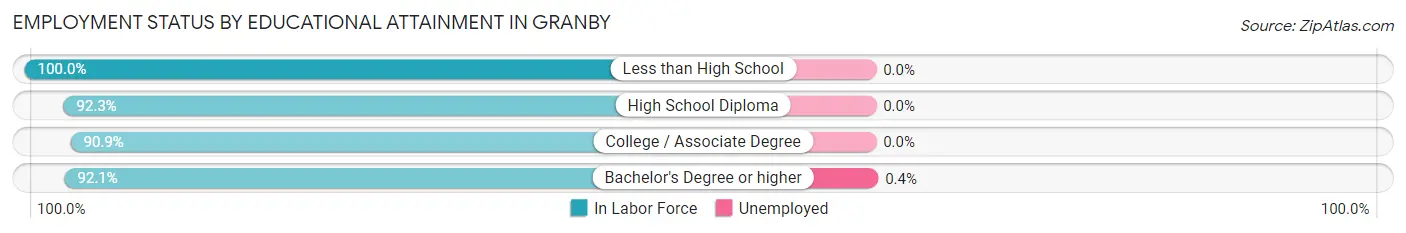
| Educational Attainment | In Labor Force | Unemployed |
| Less than High School | 35 (100.0%) | 0 (0.0%) |
| High School Diploma | 289 (92.3%) | 0 (0.0%) |
| College / Associate Degree | 219 (90.9%) | 0 (0.0%) |
| Bachelor's Degree or higher | 479 (92.1%) | 2 (0.4%) |
| Total | 1,022 (92.2%) | 2 (0.2%) |
Employment Occupations by Sex in Granby
Management, Business, Science and Arts Occupations
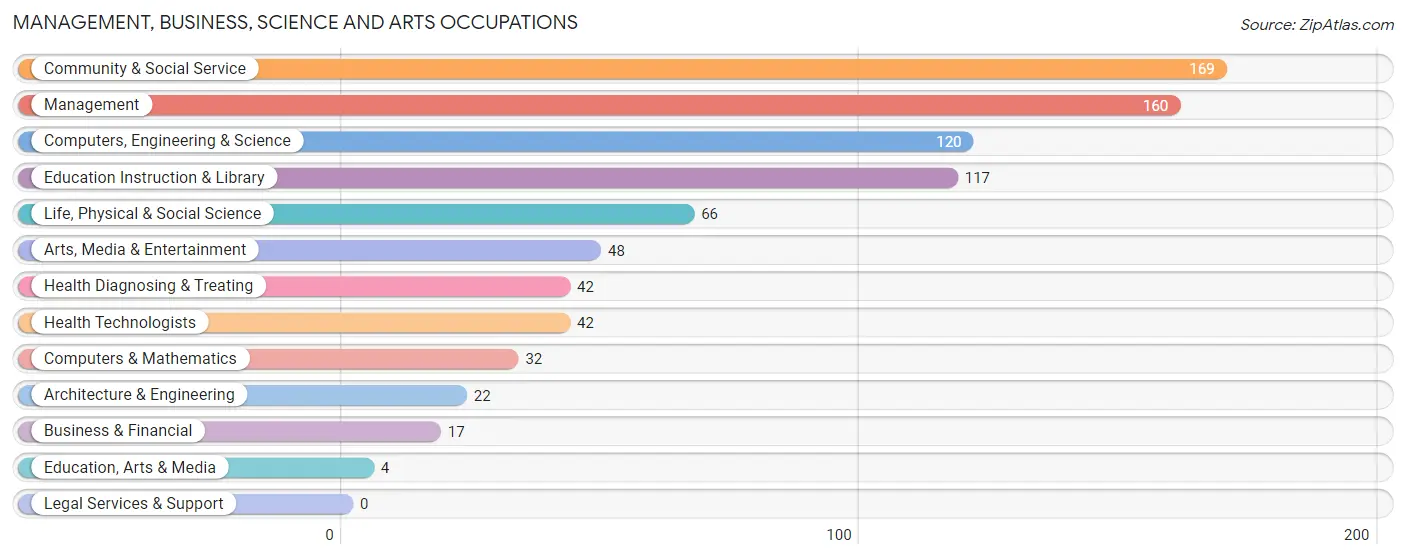
The most common Management, Business, Science and Arts occupations in Granby are Community & Social Service (169 | 13.8%), Management (160 | 13.1%), Computers, Engineering & Science (120 | 9.8%), Education Instruction & Library (117 | 9.6%), and Life, Physical & Social Science (66 | 5.4%).
Management, Business, Science and Arts Occupations by Sex
Within the Management, Business, Science and Arts occupations in Granby, the most male-oriented occupations are Architecture & Engineering (100.0%), Life, Physical & Social Science (100.0%), and Arts, Media & Entertainment (100.0%), while the most female-oriented occupations are Business & Financial (100.0%), Education, Arts & Media (100.0%), and Education Instruction & Library (93.2%).
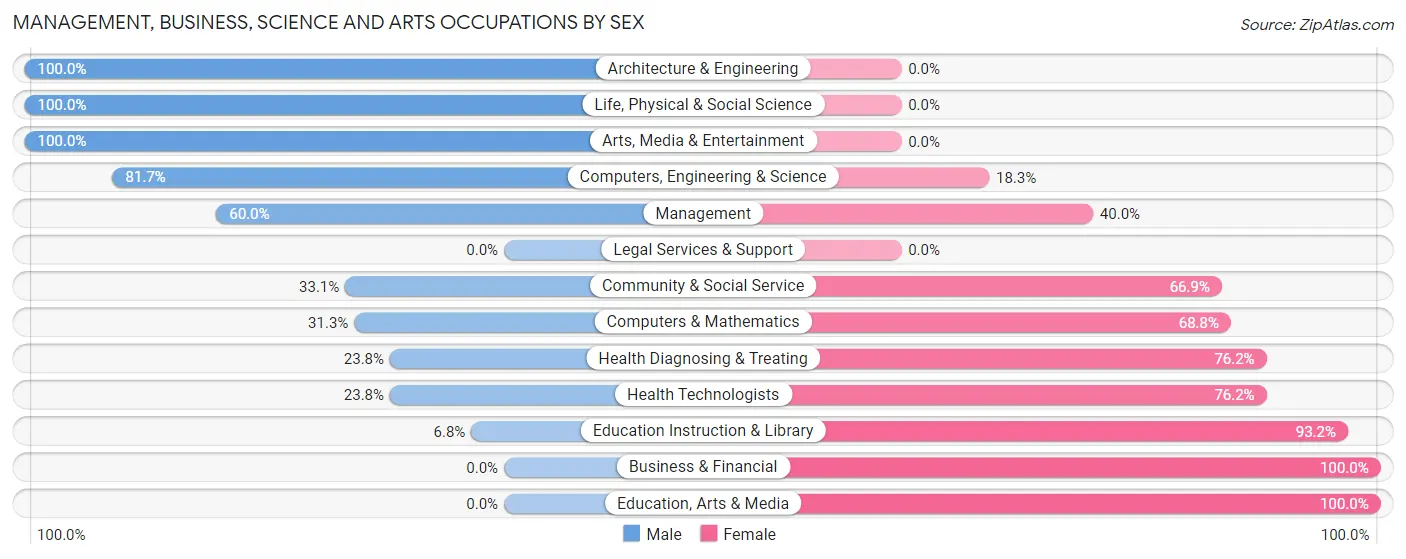
| Occupation | Male | Female |
| Management | 96 (60.0%) | 64 (40.0%) |
| Business & Financial | 0 (0.0%) | 17 (100.0%) |
| Computers, Engineering & Science | 98 (81.7%) | 22 (18.3%) |
| Computers & Mathematics | 10 (31.2%) | 22 (68.8%) |
| Architecture & Engineering | 22 (100.0%) | 0 (0.0%) |
| Life, Physical & Social Science | 66 (100.0%) | 0 (0.0%) |
| Community & Social Service | 56 (33.1%) | 113 (66.9%) |
| Education, Arts & Media | 0 (0.0%) | 4 (100.0%) |
| Legal Services & Support | 0 (0.0%) | 0 (0.0%) |
| Education Instruction & Library | 8 (6.8%) | 109 (93.2%) |
| Arts, Media & Entertainment | 48 (100.0%) | 0 (0.0%) |
| Health Diagnosing & Treating | 10 (23.8%) | 32 (76.2%) |
| Health Technologists | 10 (23.8%) | 32 (76.2%) |
| Total (Category) | 260 (51.2%) | 248 (48.8%) |
| Total (Overall) | 776 (63.5%) | 445 (36.4%) |
Services Occupations
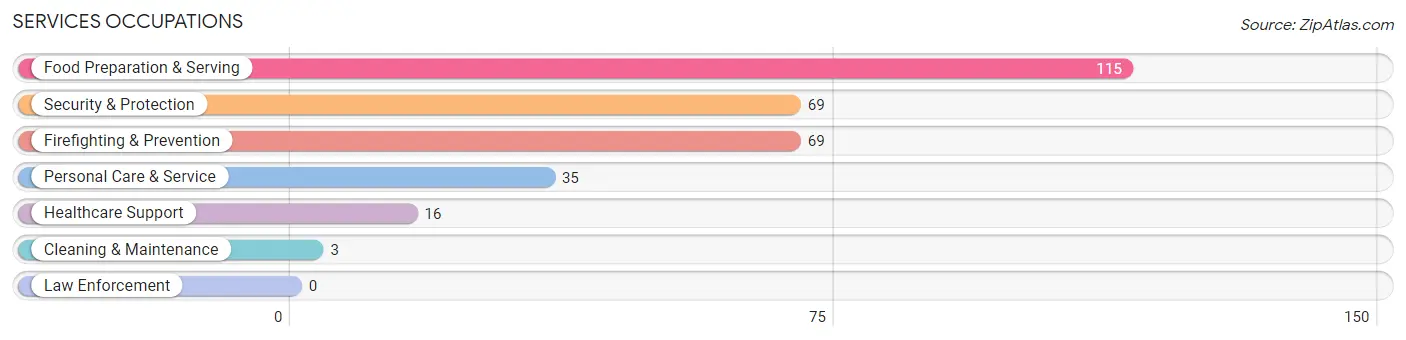
The most common Services occupations in Granby are Food Preparation & Serving (115 | 9.4%), Security & Protection (69 | 5.7%), Firefighting & Prevention (69 | 5.7%), Personal Care & Service (35 | 2.9%), and Healthcare Support (16 | 1.3%).
Services Occupations by Sex
Within the Services occupations in Granby, the most male-oriented occupations are Personal Care & Service (77.1%), Food Preparation & Serving (75.6%), and Security & Protection (58.0%), while the most female-oriented occupations are Healthcare Support (100.0%), Cleaning & Maintenance (100.0%), and Security & Protection (42.0%).
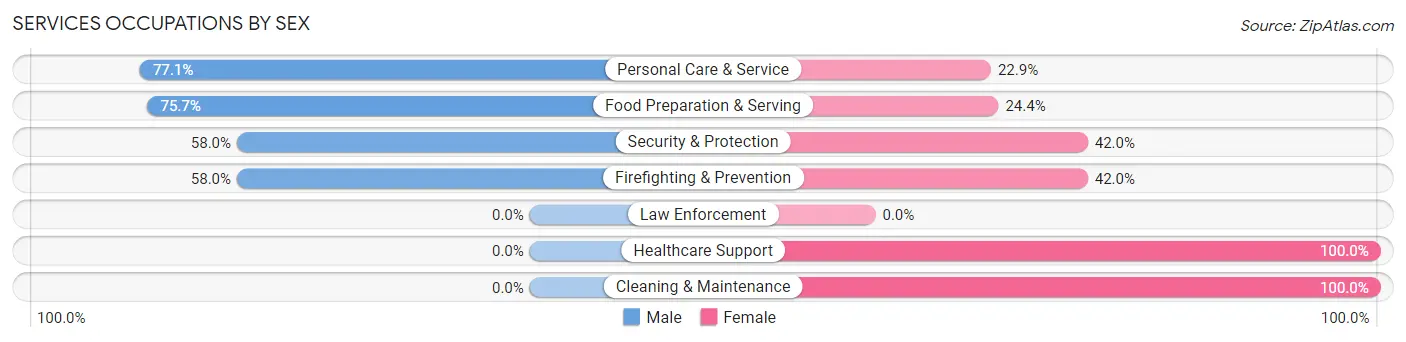
| Occupation | Male | Female |
| Healthcare Support | 0 (0.0%) | 16 (100.0%) |
| Security & Protection | 40 (58.0%) | 29 (42.0%) |
| Firefighting & Prevention | 40 (58.0%) | 29 (42.0%) |
| Law Enforcement | 0 (0.0%) | 0 (0.0%) |
| Food Preparation & Serving | 87 (75.6%) | 28 (24.3%) |
| Cleaning & Maintenance | 0 (0.0%) | 3 (100.0%) |
| Personal Care & Service | 27 (77.1%) | 8 (22.9%) |
| Total (Category) | 154 (64.7%) | 84 (35.3%) |
| Total (Overall) | 776 (63.5%) | 445 (36.4%) |
Sales and Office Occupations
The most common Sales and Office occupations in Granby are Sales & Related (122 | 10.0%), and Office & Administration (75 | 6.1%).
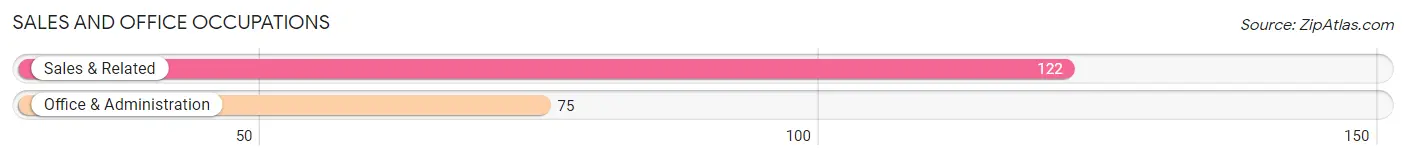
Sales and Office Occupations by Sex
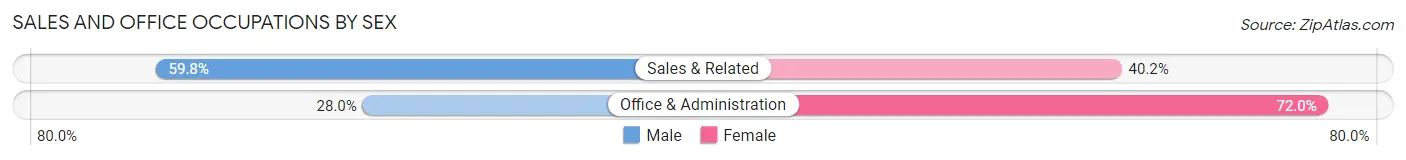
| Occupation | Male | Female |
| Sales & Related | 73 (59.8%) | 49 (40.2%) |
| Office & Administration | 21 (28.0%) | 54 (72.0%) |
| Total (Category) | 94 (47.7%) | 103 (52.3%) |
| Total (Overall) | 776 (63.5%) | 445 (36.4%) |
Natural Resources, Construction and Maintenance Occupations
The most common Natural Resources, Construction and Maintenance occupations in Granby are Construction & Extraction (129 | 10.6%), Installation, Maintenance & Repair (32 | 2.6%), and Farming, Fishing & Forestry (11 | 0.9%).
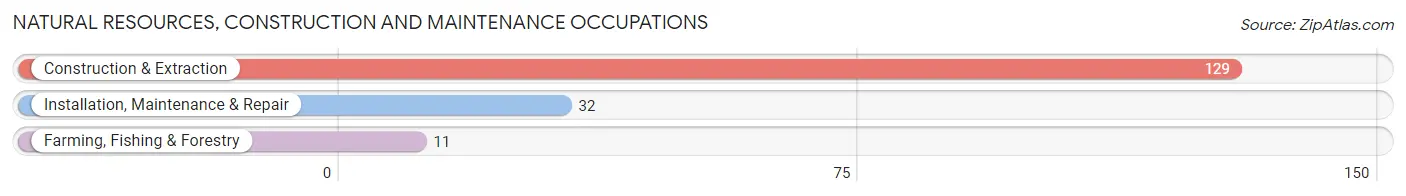
Natural Resources, Construction and Maintenance Occupations by Sex
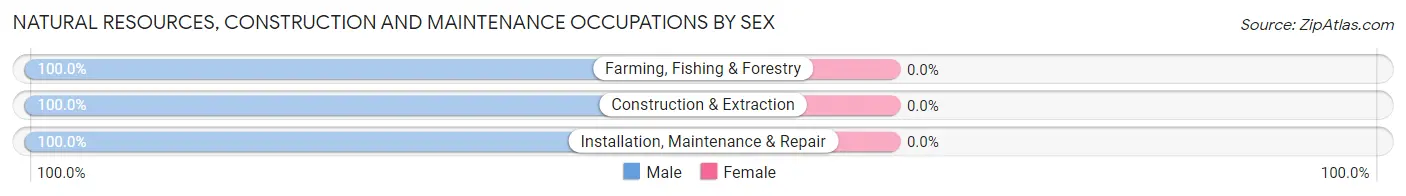
| Occupation | Male | Female |
| Farming, Fishing & Forestry | 11 (100.0%) | 0 (0.0%) |
| Construction & Extraction | 129 (100.0%) | 0 (0.0%) |
| Installation, Maintenance & Repair | 32 (100.0%) | 0 (0.0%) |
| Total (Category) | 172 (100.0%) | 0 (0.0%) |
| Total (Overall) | 776 (63.5%) | 445 (36.4%) |
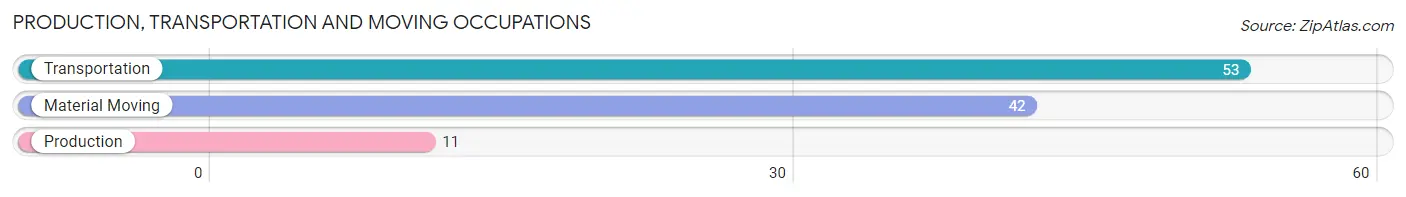
Production, Transportation and Moving Occupations
The most common Production, Transportation and Moving occupations in Granby are Transportation (53 | 4.3%), Material Moving (42 | 3.4%), and Production (11 | 0.9%).
Production, Transportation and Moving Occupations by Sex
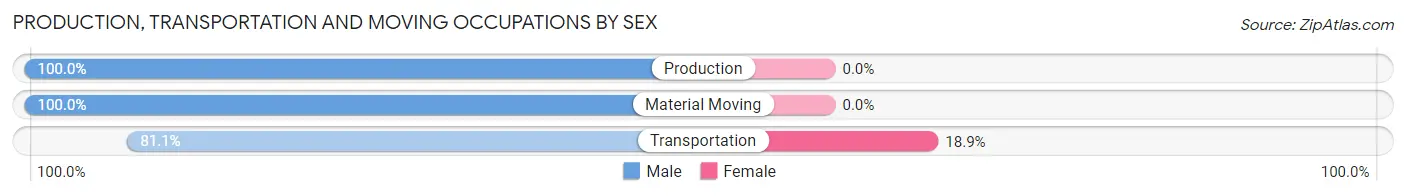
| Occupation | Male | Female |
| Production | 11 (100.0%) | 0 (0.0%) |
| Transportation | 43 (81.1%) | 10 (18.9%) |
| Material Moving | 42 (100.0%) | 0 (0.0%) |
| Total (Category) | 96 (90.6%) | 10 (9.4%) |
| Total (Overall) | 776 (63.5%) | 445 (36.4%) |
Employment Industries by Sex in Granby
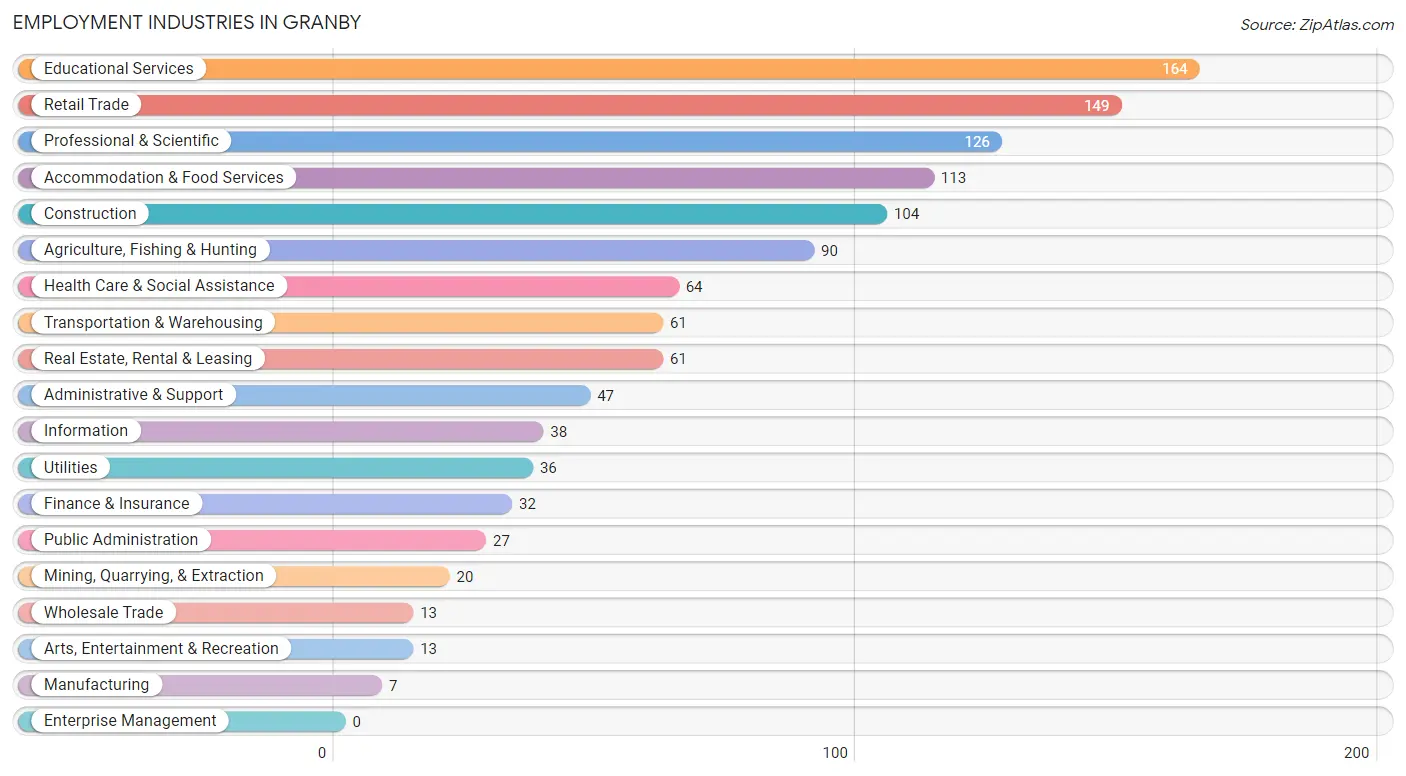
Employment Industries in Granby
The major employment industries in Granby include Educational Services (164 | 13.4%), Retail Trade (149 | 12.2%), Professional & Scientific (126 | 10.3%), Accommodation & Food Services (113 | 9.2%), and Construction (104 | 8.5%).
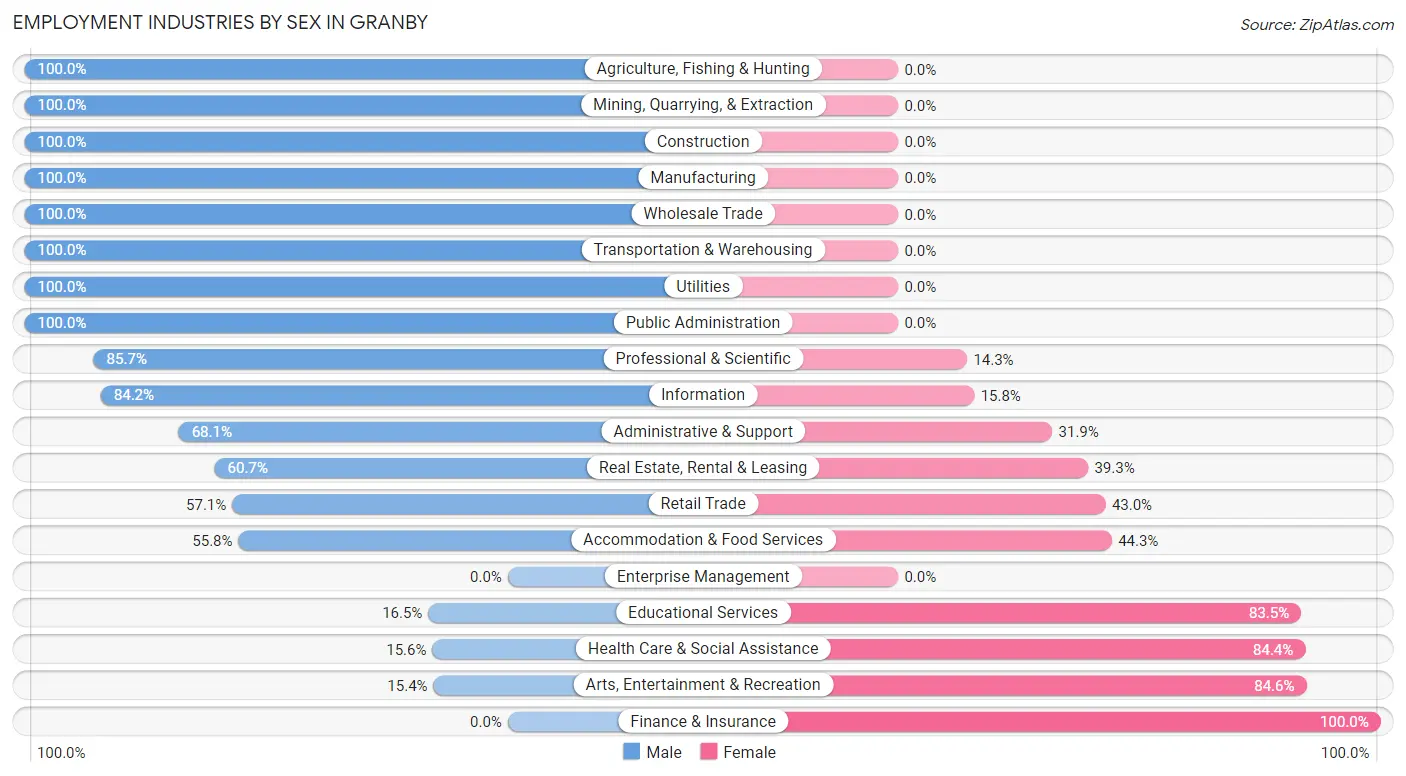
Employment Industries by Sex in Granby
The Granby industries that see more men than women are Agriculture, Fishing & Hunting (100.0%), Mining, Quarrying, & Extraction (100.0%), and Construction (100.0%), whereas the industries that tend to have a higher number of women are Finance & Insurance (100.0%), Arts, Entertainment & Recreation (84.6%), and Health Care & Social Assistance (84.4%).
| Industry | Male | Female |
| Agriculture, Fishing & Hunting | 90 (100.0%) | 0 (0.0%) |
| Mining, Quarrying, & Extraction | 20 (100.0%) | 0 (0.0%) |
| Construction | 104 (100.0%) | 0 (0.0%) |
| Manufacturing | 7 (100.0%) | 0 (0.0%) |
| Wholesale Trade | 13 (100.0%) | 0 (0.0%) |
| Retail Trade | 85 (57.1%) | 64 (42.9%) |
| Transportation & Warehousing | 61 (100.0%) | 0 (0.0%) |
| Utilities | 36 (100.0%) | 0 (0.0%) |
| Information | 32 (84.2%) | 6 (15.8%) |
| Finance & Insurance | 0 (0.0%) | 32 (100.0%) |
| Real Estate, Rental & Leasing | 37 (60.7%) | 24 (39.3%) |
| Professional & Scientific | 108 (85.7%) | 18 (14.3%) |
| Enterprise Management | 0 (0.0%) | 0 (0.0%) |
| Administrative & Support | 32 (68.1%) | 15 (31.9%) |
| Educational Services | 27 (16.5%) | 137 (83.5%) |
| Health Care & Social Assistance | 10 (15.6%) | 54 (84.4%) |
| Arts, Entertainment & Recreation | 2 (15.4%) | 11 (84.6%) |
| Accommodation & Food Services | 63 (55.7%) | 50 (44.3%) |
| Public Administration | 27 (100.0%) | 0 (0.0%) |
| Total | 776 (63.5%) | 445 (36.4%) |
Education in Granby
School Enrollment in Granby
The most common levels of schooling among the 380 students in Granby are middle school (83 | 21.8%), elementary school (76 | 20.0%), and high school (60 | 15.8%).
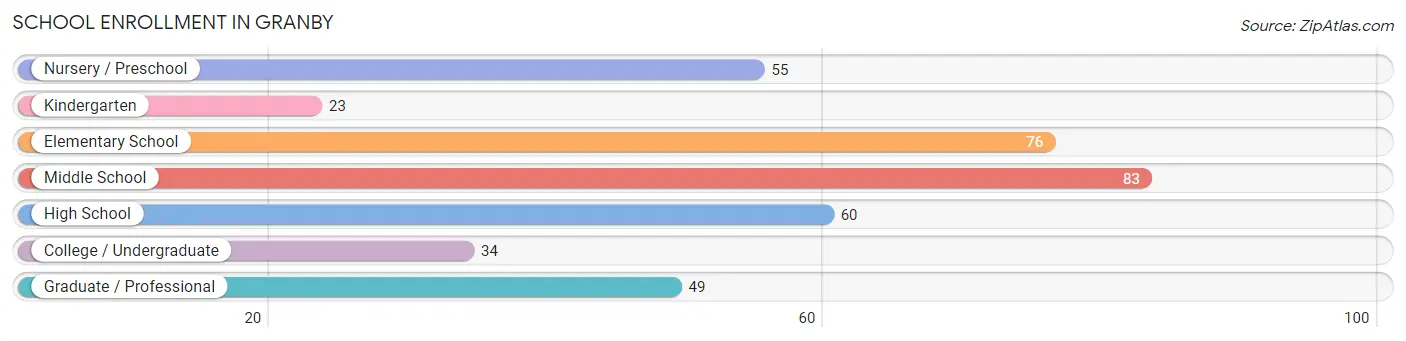
| School Level | # Students | % Students |
| Nursery / Preschool | 55 | 14.5% |
| Kindergarten | 23 | 6.0% |
| Elementary School | 76 | 20.0% |
| Middle School | 83 | 21.8% |
| High School | 60 | 15.8% |
| College / Undergraduate | 34 | 8.9% |
| Graduate / Professional | 49 | 12.9% |
| Total | 380 | 100.0% |
School Enrollment by Age by Funding Source in Granby
Out of a total of 380 students who are enrolled in schools in Granby, 106 (27.9%) attend a private institution, while the remaining 274 (72.1%) are enrolled in public schools. The age group of 25 to 34 year olds has the highest likelihood of being enrolled in private schools, with 8 (100.0% in the age bracket) enrolled. Conversely, the age group of 3 to 4 year olds has the lowest likelihood of being enrolled in a private school, with 55 (100.0% in the age bracket) attending a public institution.
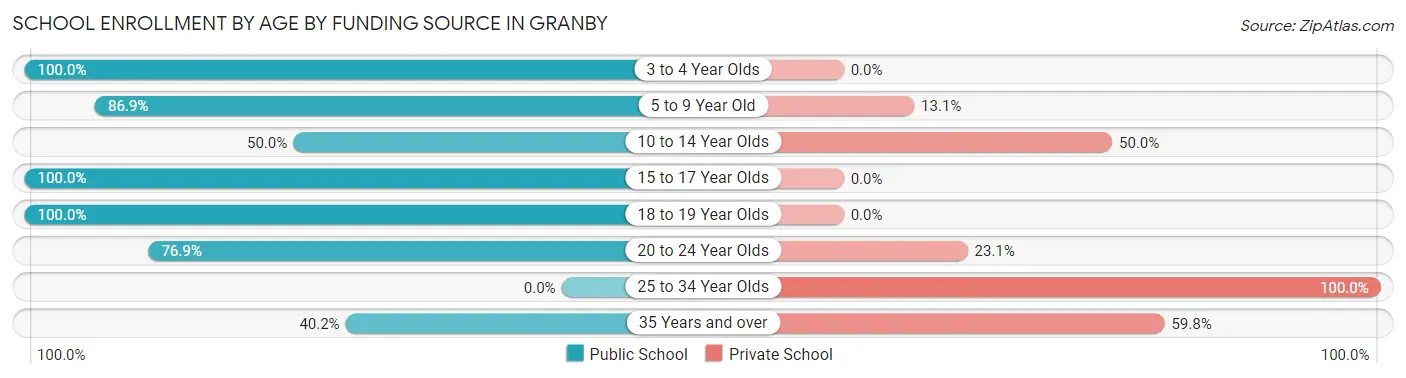
| Age Bracket | Public School | Private School |
| 3 to 4 Year Olds | 55 (100.0%) | 0 (0.0%) |
| 5 to 9 Year Old | 86 (86.9%) | 13 (13.1%) |
| 10 to 14 Year Olds | 30 (50.0%) | 30 (50.0%) |
| 15 to 17 Year Olds | 15 (100.0%) | 0 (0.0%) |
| 18 to 19 Year Olds | 35 (100.0%) | 0 (0.0%) |
| 20 to 24 Year Olds | 20 (76.9%) | 6 (23.1%) |
| 25 to 34 Year Olds | 0 (0.0%) | 8 (100.0%) |
| 35 Years and over | 33 (40.2%) | 49 (59.8%) |
| Total | 274 (72.1%) | 106 (27.9%) |
Educational Attainment by Field of Study in Granby
Education (124 | 18.5%), bio, nature & agricultural (100 | 14.9%), science & technology (86 | 12.8%), physical & health sciences (47 | 7.0%), and liberal arts & history (46 | 6.9%) are the most common fields of study among 670 individuals in Granby who have obtained a bachelor's degree or higher.
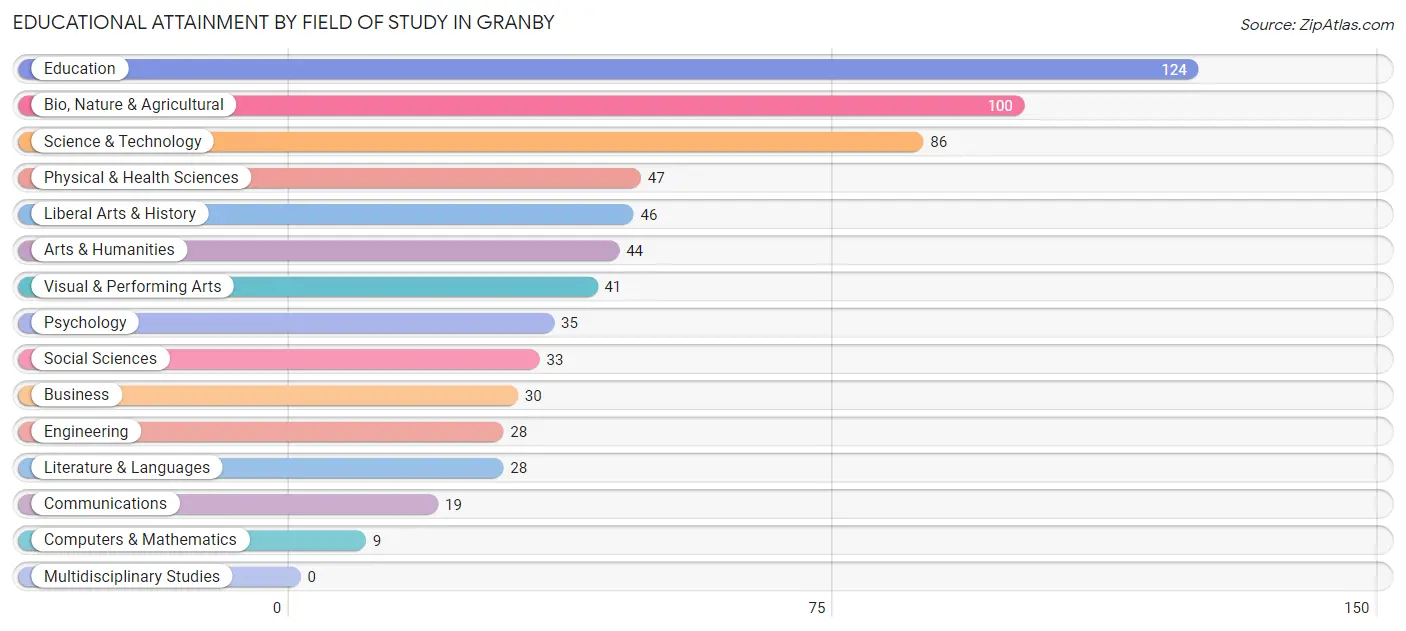
| Field of Study | # Graduates | % Graduates |
| Computers & Mathematics | 9 | 1.3% |
| Bio, Nature & Agricultural | 100 | 14.9% |
| Physical & Health Sciences | 47 | 7.0% |
| Psychology | 35 | 5.2% |
| Social Sciences | 33 | 4.9% |
| Engineering | 28 | 4.2% |
| Multidisciplinary Studies | 0 | 0.0% |
| Science & Technology | 86 | 12.8% |
| Business | 30 | 4.5% |
| Education | 124 | 18.5% |
| Literature & Languages | 28 | 4.2% |
| Liberal Arts & History | 46 | 6.9% |
| Visual & Performing Arts | 41 | 6.1% |
| Communications | 19 | 2.8% |
| Arts & Humanities | 44 | 6.6% |
| Total | 670 | 100.0% |
Transportation & Commute in Granby
Vehicle Availability by Sex in Granby
The most prevalent vehicle ownership categories in Granby are males with 2 vehicles (413, accounting for 53.2%) and females with 2 vehicles (244, making up 92.8%).
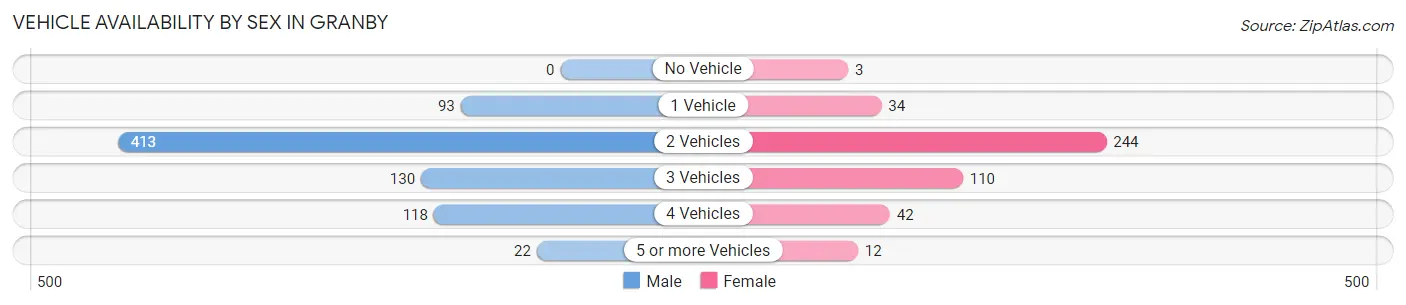
| Vehicles Available | Male | Female |
| No Vehicle | 0 (0.0%) | 3 (0.7%) |
| 1 Vehicle | 93 (12.0%) | 34 (7.6%) |
| 2 Vehicles | 413 (53.2%) | 244 (54.8%) |
| 3 Vehicles | 130 (16.8%) | 110 (24.7%) |
| 4 Vehicles | 118 (15.2%) | 42 (9.4%) |
| 5 or more Vehicles | 22 (2.8%) | 12 (2.7%) |
| Total | 776 (100.0%) | 445 (100.0%) |
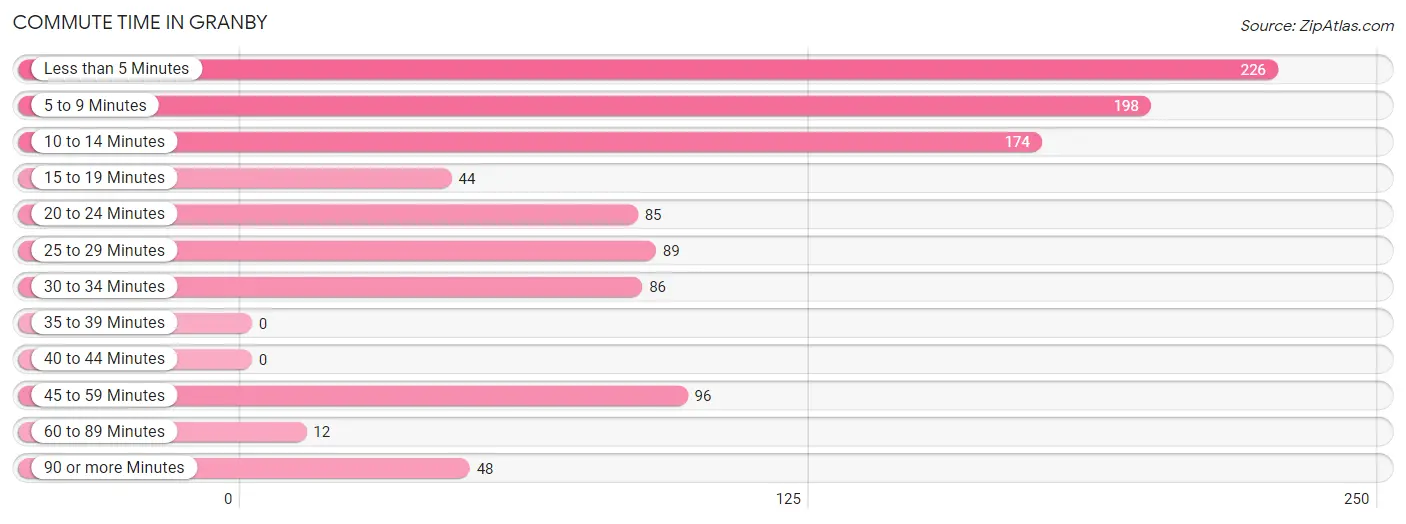
Commute Time in Granby
The most frequently occuring commute durations in Granby are less than 5 minutes (226 commuters, 21.4%), 5 to 9 minutes (198 commuters, 18.7%), and 10 to 14 minutes (174 commuters, 16.5%).
| Commute Time | # Commuters | % Commuters |
| Less than 5 Minutes | 226 | 21.4% |
| 5 to 9 Minutes | 198 | 18.7% |
| 10 to 14 Minutes | 174 | 16.5% |
| 15 to 19 Minutes | 44 | 4.2% |
| 20 to 24 Minutes | 85 | 8.0% |
| 25 to 29 Minutes | 89 | 8.4% |
| 30 to 34 Minutes | 86 | 8.1% |
| 35 to 39 Minutes | 0 | 0.0% |
| 40 to 44 Minutes | 0 | 0.0% |
| 45 to 59 Minutes | 96 | 9.1% |
| 60 to 89 Minutes | 12 | 1.1% |
| 90 or more Minutes | 48 | 4.5% |
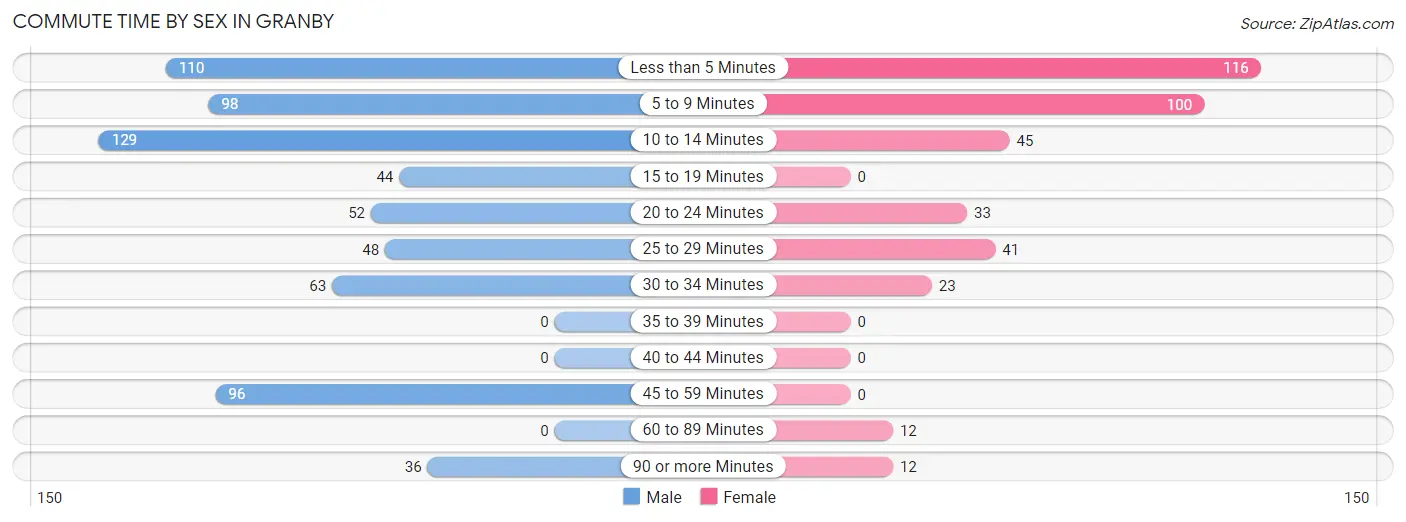
Commute Time by Sex in Granby
The most common commute times in Granby are 10 to 14 minutes (129 commuters, 19.1%) for males and less than 5 minutes (116 commuters, 30.4%) for females.
| Commute Time | Male | Female |
| Less than 5 Minutes | 110 (16.3%) | 116 (30.4%) |
| 5 to 9 Minutes | 98 (14.5%) | 100 (26.2%) |
| 10 to 14 Minutes | 129 (19.1%) | 45 (11.8%) |
| 15 to 19 Minutes | 44 (6.5%) | 0 (0.0%) |
| 20 to 24 Minutes | 52 (7.7%) | 33 (8.6%) |
| 25 to 29 Minutes | 48 (7.1%) | 41 (10.7%) |
| 30 to 34 Minutes | 63 (9.3%) | 23 (6.0%) |
| 35 to 39 Minutes | 0 (0.0%) | 0 (0.0%) |
| 40 to 44 Minutes | 0 (0.0%) | 0 (0.0%) |
| 45 to 59 Minutes | 96 (14.2%) | 0 (0.0%) |
| 60 to 89 Minutes | 0 (0.0%) | 12 (3.1%) |
| 90 or more Minutes | 36 (5.3%) | 12 (3.1%) |
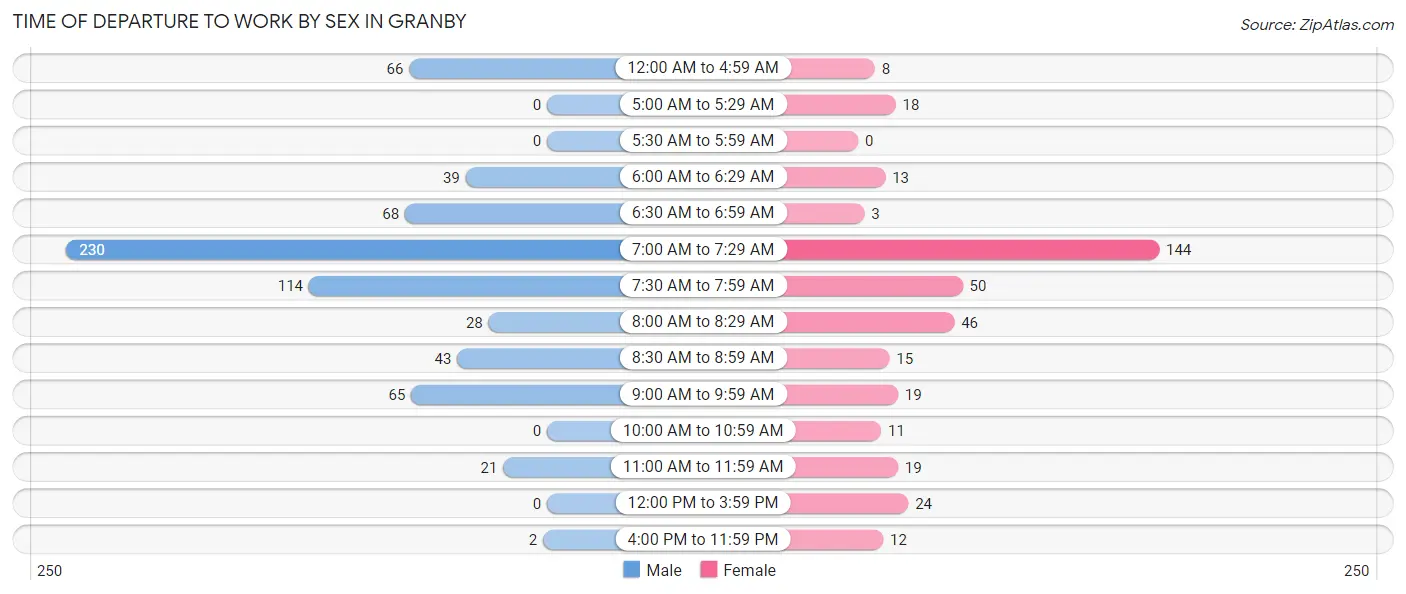
Time of Departure to Work by Sex in Granby
The most frequent times of departure to work in Granby are 7:00 AM to 7:29 AM (230, 34.0%) for males and 7:00 AM to 7:29 AM (144, 37.7%) for females.
| Time of Departure | Male | Female |
| 12:00 AM to 4:59 AM | 66 (9.8%) | 8 (2.1%) |
| 5:00 AM to 5:29 AM | 0 (0.0%) | 18 (4.7%) |
| 5:30 AM to 5:59 AM | 0 (0.0%) | 0 (0.0%) |
| 6:00 AM to 6:29 AM | 39 (5.8%) | 13 (3.4%) |
| 6:30 AM to 6:59 AM | 68 (10.1%) | 3 (0.8%) |
| 7:00 AM to 7:29 AM | 230 (34.0%) | 144 (37.7%) |
| 7:30 AM to 7:59 AM | 114 (16.9%) | 50 (13.1%) |
| 8:00 AM to 8:29 AM | 28 (4.1%) | 46 (12.0%) |
| 8:30 AM to 8:59 AM | 43 (6.4%) | 15 (3.9%) |
| 9:00 AM to 9:59 AM | 65 (9.6%) | 19 (5.0%) |
| 10:00 AM to 10:59 AM | 0 (0.0%) | 11 (2.9%) |
| 11:00 AM to 11:59 AM | 21 (3.1%) | 19 (5.0%) |
| 12:00 PM to 3:59 PM | 0 (0.0%) | 24 (6.3%) |
| 4:00 PM to 11:59 PM | 2 (0.3%) | 12 (3.1%) |
| Total | 676 (100.0%) | 382 (100.0%) |
Housing Occupancy in Granby
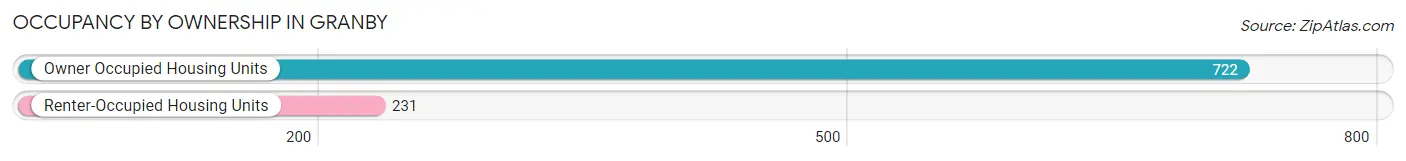
Occupancy by Ownership in Granby
Of the total 953 dwellings in Granby, owner-occupied units account for 722 (75.8%), while renter-occupied units make up 231 (24.2%).
| Occupancy | # Housing Units | % Housing Units |
| Owner Occupied Housing Units | 722 | 75.8% |
| Renter-Occupied Housing Units | 231 | 24.2% |
| Total Occupied Housing Units | 953 | 100.0% |
Occupancy by Household Size in Granby
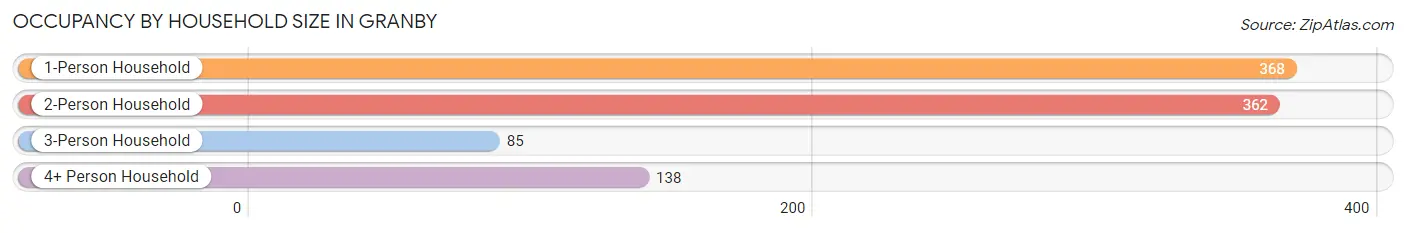
| Household Size | # Housing Units | % Housing Units |
| 1-Person Household | 368 | 38.6% |
| 2-Person Household | 362 | 38.0% |
| 3-Person Household | 85 | 8.9% |
| 4+ Person Household | 138 | 14.5% |
| Total Housing Units | 953 | 100.0% |
Occupancy by Ownership by Household Size in Granby
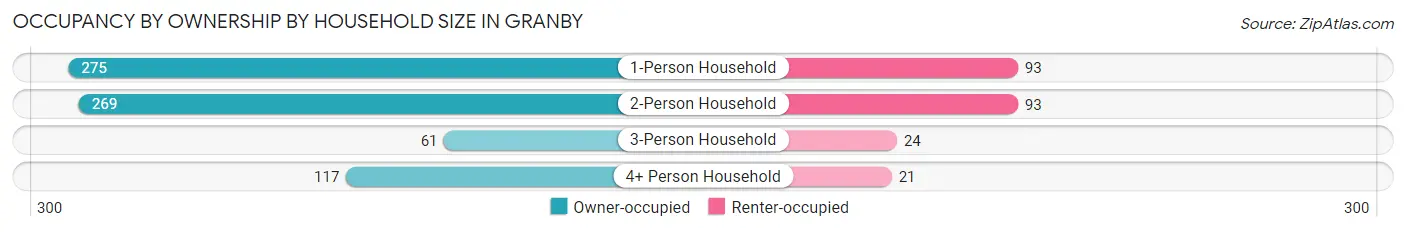
| Household Size | Owner-occupied | Renter-occupied |
| 1-Person Household | 275 (74.7%) | 93 (25.3%) |
| 2-Person Household | 269 (74.3%) | 93 (25.7%) |
| 3-Person Household | 61 (71.8%) | 24 (28.2%) |
| 4+ Person Household | 117 (84.8%) | 21 (15.2%) |
| Total Housing Units | 722 (75.8%) | 231 (24.2%) |
Occupancy by Educational Attainment in Granby
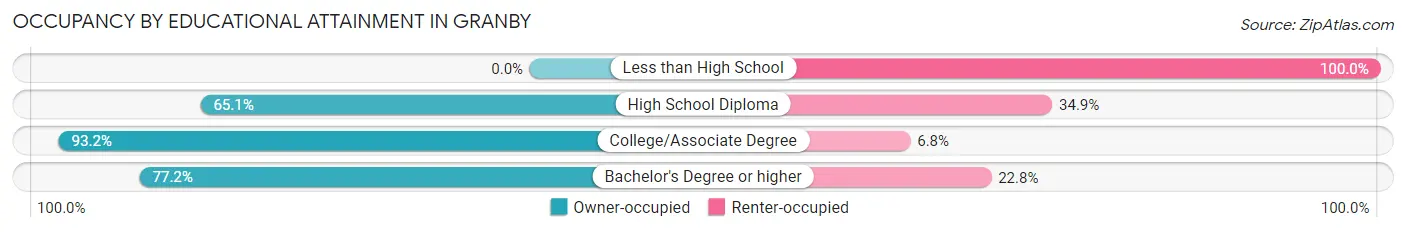
| Household Size | Owner-occupied | Renter-occupied |
| Less than High School | 0 (0.0%) | 10 (100.0%) |
| High School Diploma | 224 (65.1%) | 120 (34.9%) |
| College/Associate Degree | 207 (93.2%) | 15 (6.8%) |
| Bachelor's Degree or higher | 291 (77.2%) | 86 (22.8%) |
Occupancy by Age of Householder in Granby
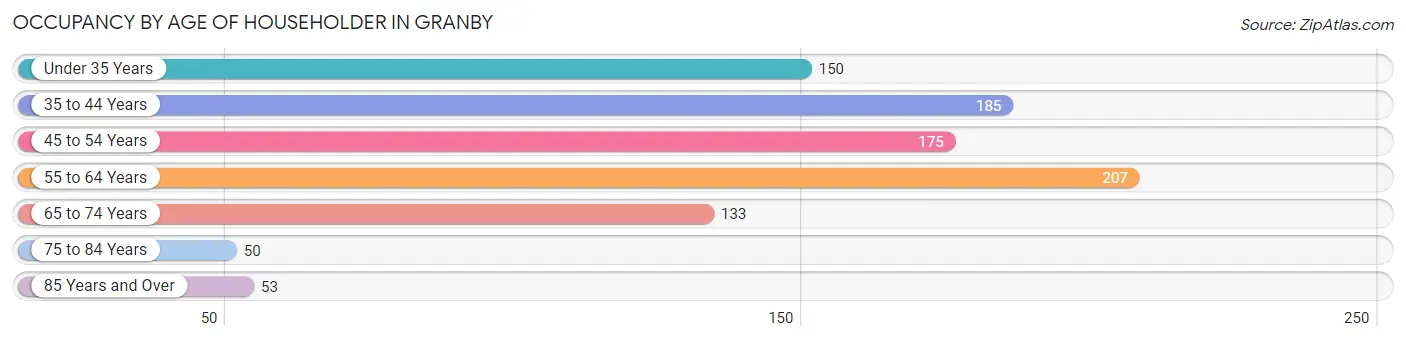
| Age Bracket | # Households | % Households |
| Under 35 Years | 150 | 15.7% |
| 35 to 44 Years | 185 | 19.4% |
| 45 to 54 Years | 175 | 18.4% |
| 55 to 64 Years | 207 | 21.7% |
| 65 to 74 Years | 133 | 14.0% |
| 75 to 84 Years | 50 | 5.2% |
| 85 Years and Over | 53 | 5.6% |
| Total | 953 | 100.0% |
Housing Finances in Granby
Median Income by Occupancy in Granby
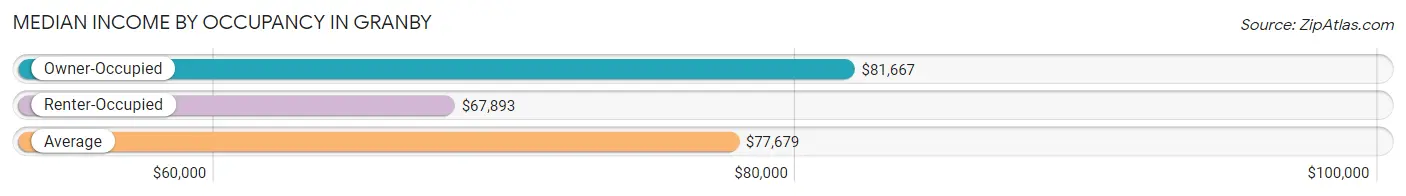
| Occupancy Type | # Households | Median Income |
| Owner-Occupied | 722 (75.8%) | $81,667 |
| Renter-Occupied | 231 (24.2%) | $67,893 |
| Average | 953 (100.0%) | $77,679 |
Occupancy by Householder Income Bracket in Granby
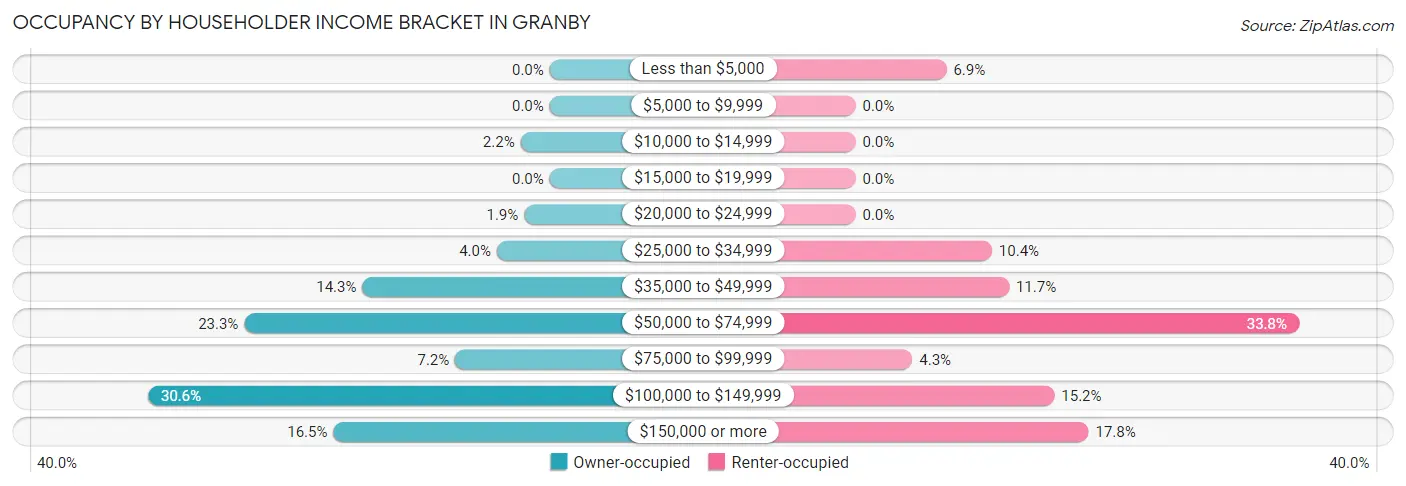
| Income Bracket | Owner-occupied | Renter-occupied |
| Less than $5,000 | 0 (0.0%) | 16 (6.9%) |
| $5,000 to $9,999 | 0 (0.0%) | 0 (0.0%) |
| $10,000 to $14,999 | 16 (2.2%) | 0 (0.0%) |
| $15,000 to $19,999 | 0 (0.0%) | 0 (0.0%) |
| $20,000 to $24,999 | 14 (1.9%) | 0 (0.0%) |
| $25,000 to $34,999 | 29 (4.0%) | 24 (10.4%) |
| $35,000 to $49,999 | 103 (14.3%) | 27 (11.7%) |
| $50,000 to $74,999 | 168 (23.3%) | 78 (33.8%) |
| $75,000 to $99,999 | 52 (7.2%) | 10 (4.3%) |
| $100,000 to $149,999 | 221 (30.6%) | 35 (15.1%) |
| $150,000 or more | 119 (16.5%) | 41 (17.7%) |
| Total | 722 (100.0%) | 231 (100.0%) |
Monthly Housing Cost Tiers in Granby
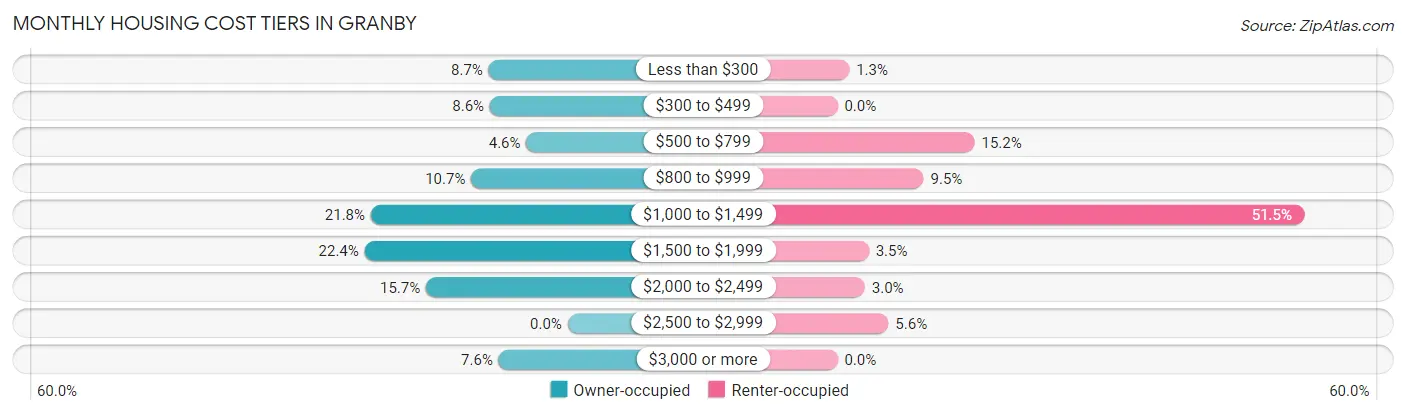
| Monthly Cost | Owner-occupied | Renter-occupied |
| Less than $300 | 63 (8.7%) | 3 (1.3%) |
| $300 to $499 | 62 (8.6%) | 0 (0.0%) |
| $500 to $799 | 33 (4.6%) | 35 (15.1%) |
| $800 to $999 | 77 (10.7%) | 22 (9.5%) |
| $1,000 to $1,499 | 157 (21.7%) | 119 (51.5%) |
| $1,500 to $1,999 | 162 (22.4%) | 8 (3.5%) |
| $2,000 to $2,499 | 113 (15.7%) | 7 (3.0%) |
| $2,500 to $2,999 | 0 (0.0%) | 13 (5.6%) |
| $3,000 or more | 55 (7.6%) | 0 (0.0%) |
| Total | 722 (100.0%) | 231 (100.0%) |
Physical Housing Characteristics in Granby
Housing Structures in Granby
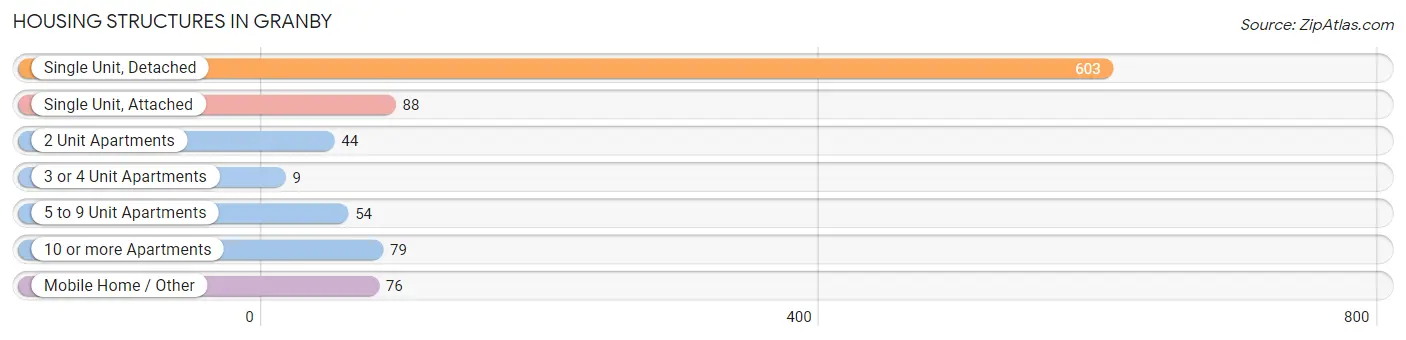
| Structure Type | # Housing Units | % Housing Units |
| Single Unit, Detached | 603 | 63.3% |
| Single Unit, Attached | 88 | 9.2% |
| 2 Unit Apartments | 44 | 4.6% |
| 3 or 4 Unit Apartments | 9 | 0.9% |
| 5 to 9 Unit Apartments | 54 | 5.7% |
| 10 or more Apartments | 79 | 8.3% |
| Mobile Home / Other | 76 | 8.0% |
| Total | 953 | 100.0% |
Housing Structures by Occupancy in Granby
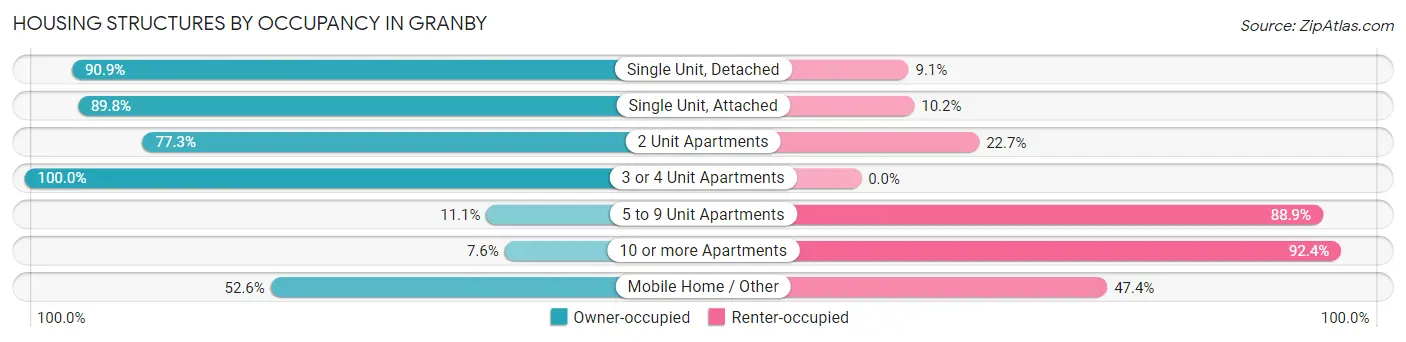
| Structure Type | Owner-occupied | Renter-occupied |
| Single Unit, Detached | 548 (90.9%) | 55 (9.1%) |
| Single Unit, Attached | 79 (89.8%) | 9 (10.2%) |
| 2 Unit Apartments | 34 (77.3%) | 10 (22.7%) |
| 3 or 4 Unit Apartments | 9 (100.0%) | 0 (0.0%) |
| 5 to 9 Unit Apartments | 6 (11.1%) | 48 (88.9%) |
| 10 or more Apartments | 6 (7.6%) | 73 (92.4%) |
| Mobile Home / Other | 40 (52.6%) | 36 (47.4%) |
| Total | 722 (75.8%) | 231 (24.2%) |
Housing Structures by Number of Rooms in Granby
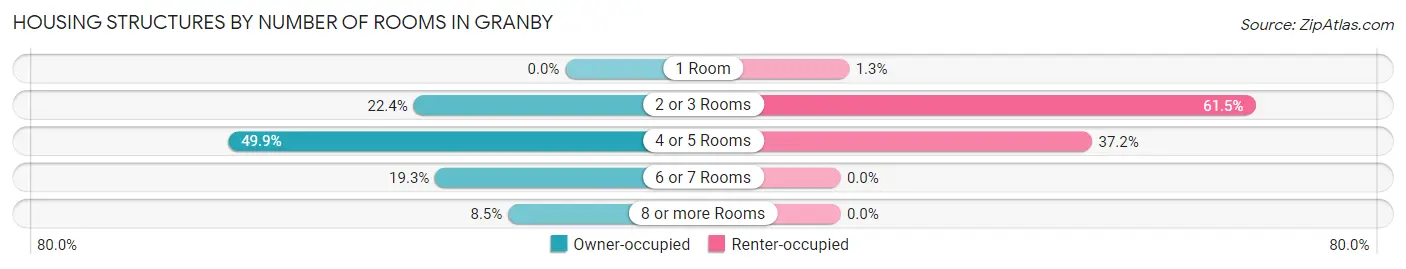
| Number of Rooms | Owner-occupied | Renter-occupied |
| 1 Room | 0 (0.0%) | 3 (1.3%) |
| 2 or 3 Rooms | 162 (22.4%) | 142 (61.5%) |
| 4 or 5 Rooms | 360 (49.9%) | 86 (37.2%) |
| 6 or 7 Rooms | 139 (19.3%) | 0 (0.0%) |
| 8 or more Rooms | 61 (8.5%) | 0 (0.0%) |
| Total | 722 (100.0%) | 231 (100.0%) |
Housing Structure by Heating Type in Granby
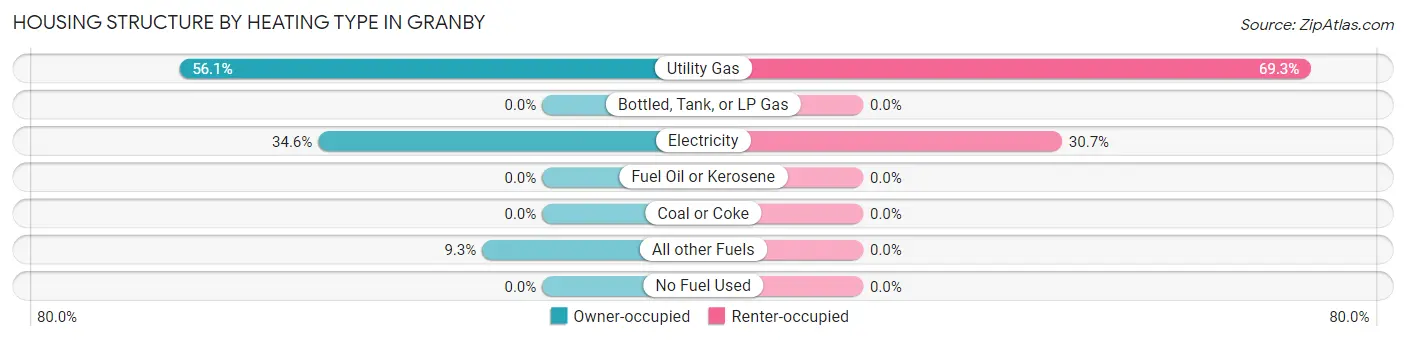
| Heating Type | Owner-occupied | Renter-occupied |
| Utility Gas | 405 (56.1%) | 160 (69.3%) |
| Bottled, Tank, or LP Gas | 0 (0.0%) | 0 (0.0%) |
| Electricity | 250 (34.6%) | 71 (30.7%) |
| Fuel Oil or Kerosene | 0 (0.0%) | 0 (0.0%) |
| Coal or Coke | 0 (0.0%) | 0 (0.0%) |
| All other Fuels | 67 (9.3%) | 0 (0.0%) |
| No Fuel Used | 0 (0.0%) | 0 (0.0%) |
| Total | 722 (100.0%) | 231 (100.0%) |
Household Vehicle Usage in Granby
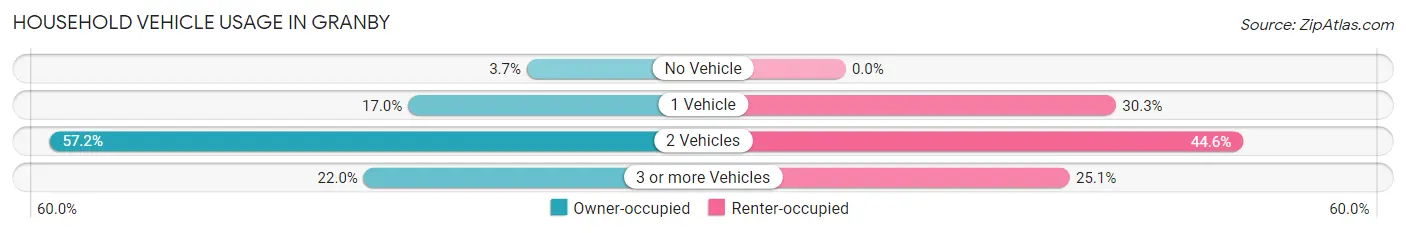
| Vehicles per Household | Owner-occupied | Renter-occupied |
| No Vehicle | 27 (3.7%) | 0 (0.0%) |
| 1 Vehicle | 123 (17.0%) | 70 (30.3%) |
| 2 Vehicles | 413 (57.2%) | 103 (44.6%) |
| 3 or more Vehicles | 159 (22.0%) | 58 (25.1%) |
| Total | 722 (100.0%) | 231 (100.0%) |
Real Estate & Mortgages in Granby
Real Estate and Mortgage Overview in Granby
| Characteristic | Without Mortgage | With Mortgage |
| Housing Units | 162 | 560 |
| Median Property Value | $286,200 | $371,600 |
| Median Household Income | $54,186 | $105 |
| Monthly Housing Costs | $329 | $55 |
| Real Estate Taxes | $1,114 | $0 |
Property Value by Mortgage Status in Granby
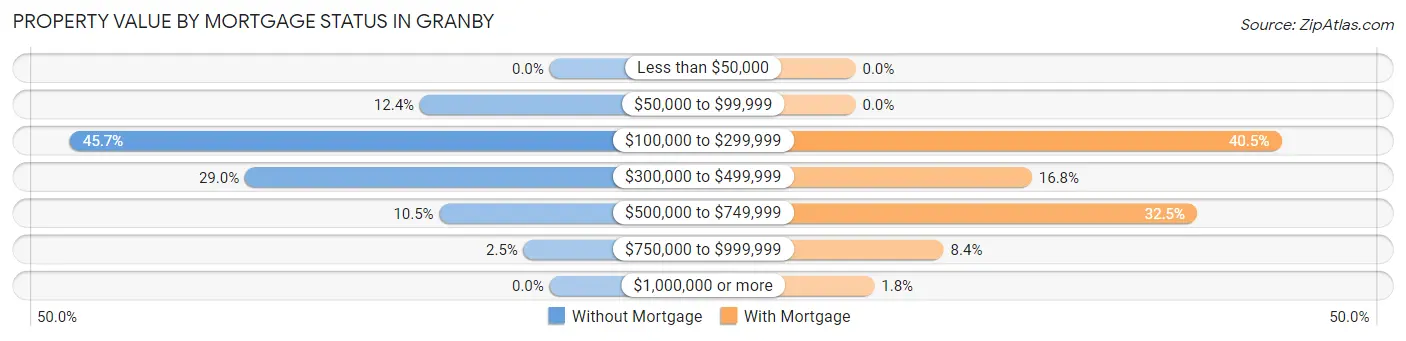
| Property Value | Without Mortgage | With Mortgage |
| Less than $50,000 | 0 (0.0%) | 0 (0.0%) |
| $50,000 to $99,999 | 20 (12.3%) | 0 (0.0%) |
| $100,000 to $299,999 | 74 (45.7%) | 227 (40.5%) |
| $300,000 to $499,999 | 47 (29.0%) | 94 (16.8%) |
| $500,000 to $749,999 | 17 (10.5%) | 182 (32.5%) |
| $750,000 to $999,999 | 4 (2.5%) | 47 (8.4%) |
| $1,000,000 or more | 0 (0.0%) | 10 (1.8%) |
| Total | 162 (100.0%) | 560 (100.0%) |
Household Income by Mortgage Status in Granby
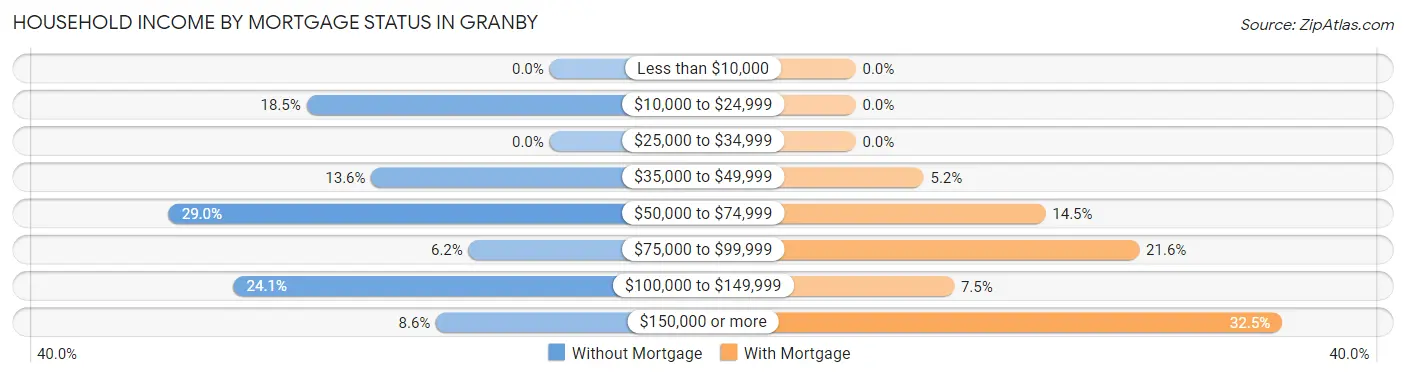
| Household Income | Without Mortgage | With Mortgage |
| Less than $10,000 | 0 (0.0%) | 0 (0.0%) |
| $10,000 to $24,999 | 30 (18.5%) | 0 (0.0%) |
| $25,000 to $34,999 | 0 (0.0%) | 0 (0.0%) |
| $35,000 to $49,999 | 22 (13.6%) | 29 (5.2%) |
| $50,000 to $74,999 | 47 (29.0%) | 81 (14.5%) |
| $75,000 to $99,999 | 10 (6.2%) | 121 (21.6%) |
| $100,000 to $149,999 | 39 (24.1%) | 42 (7.5%) |
| $150,000 or more | 14 (8.6%) | 182 (32.5%) |
| Total | 162 (100.0%) | 560 (100.0%) |
Property Value to Household Income Ratio in Granby
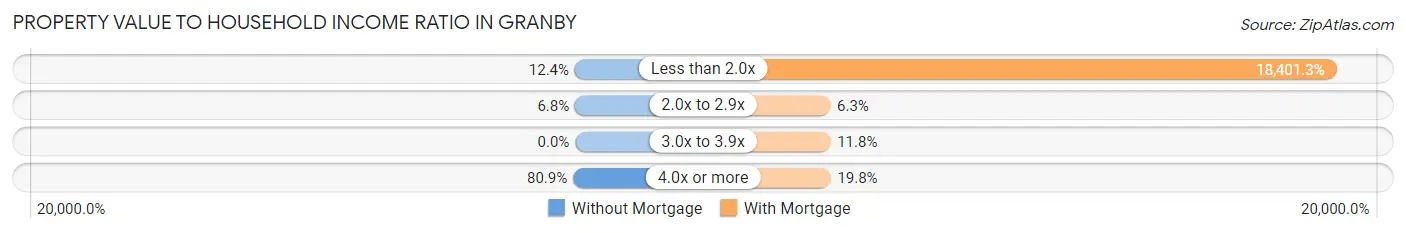
| Value-to-Income Ratio | Without Mortgage | With Mortgage |
| Less than 2.0x | 20 (12.3%) | 103,047 (18,401.2%) |
| 2.0x to 2.9x | 11 (6.8%) | 35 (6.2%) |
| 3.0x to 3.9x | 0 (0.0%) | 66 (11.8%) |
| 4.0x or more | 131 (80.9%) | 111 (19.8%) |
| Total | 162 (100.0%) | 560 (100.0%) |
Real Estate Taxes by Mortgage Status in Granby
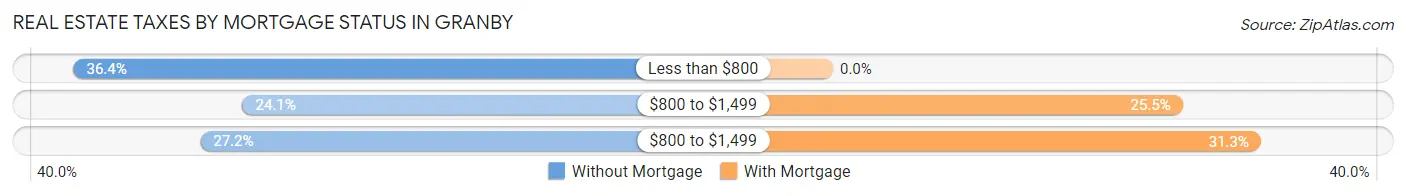
| Property Taxes | Without Mortgage | With Mortgage |
| Less than $800 | 59 (36.4%) | 0 (0.0%) |
| $800 to $1,499 | 39 (24.1%) | 143 (25.5%) |
| $800 to $1,499 | 44 (27.2%) | 175 (31.2%) |
| Total | 162 (100.0%) | 560 (100.0%) |
Health & Disability in Granby
Health Insurance Coverage by Age in Granby
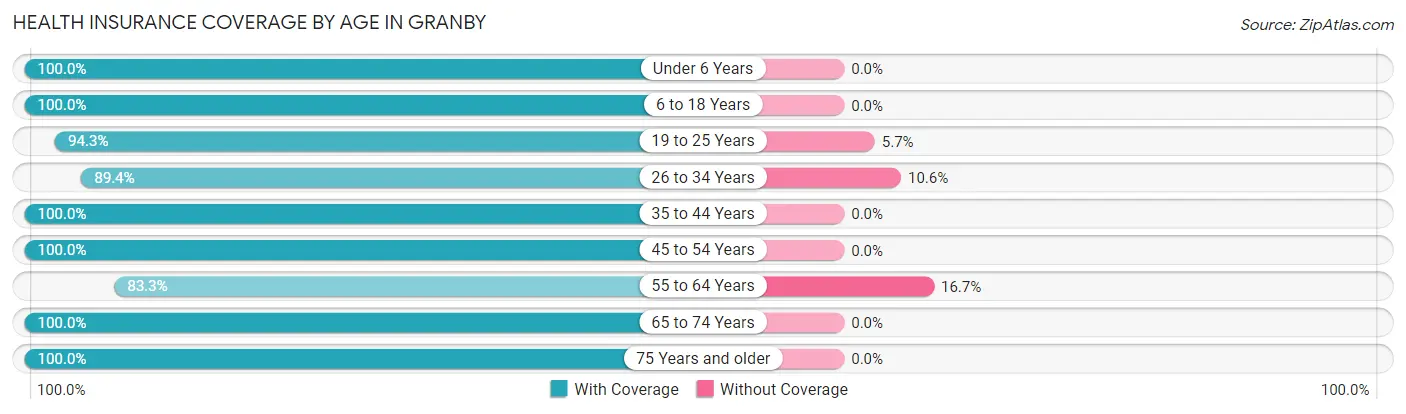
| Age Bracket | With Coverage | Without Coverage |
| Under 6 Years | 156 (100.0%) | 0 (0.0%) |
| 6 to 18 Years | 209 (100.0%) | 0 (0.0%) |
| 19 to 25 Years | 116 (94.3%) | 7 (5.7%) |
| 26 to 34 Years | 211 (89.4%) | 25 (10.6%) |
| 35 to 44 Years | 350 (100.0%) | 0 (0.0%) |
| 45 to 54 Years | 234 (100.0%) | 0 (0.0%) |
| 55 to 64 Years | 219 (83.3%) | 44 (16.7%) |
| 65 to 74 Years | 343 (100.0%) | 0 (0.0%) |
| 75 Years and older | 160 (100.0%) | 0 (0.0%) |
| Total | 1,998 (96.3%) | 76 (3.7%) |
Health Insurance Coverage by Citizenship Status in Granby
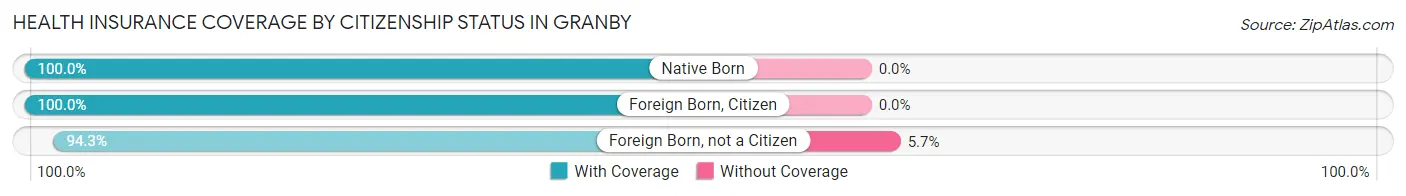
| Citizenship Status | With Coverage | Without Coverage |
| Native Born | 156 (100.0%) | 0 (0.0%) |
| Foreign Born, Citizen | 209 (100.0%) | 0 (0.0%) |
| Foreign Born, not a Citizen | 116 (94.3%) | 7 (5.7%) |
Health Insurance Coverage by Household Income in Granby
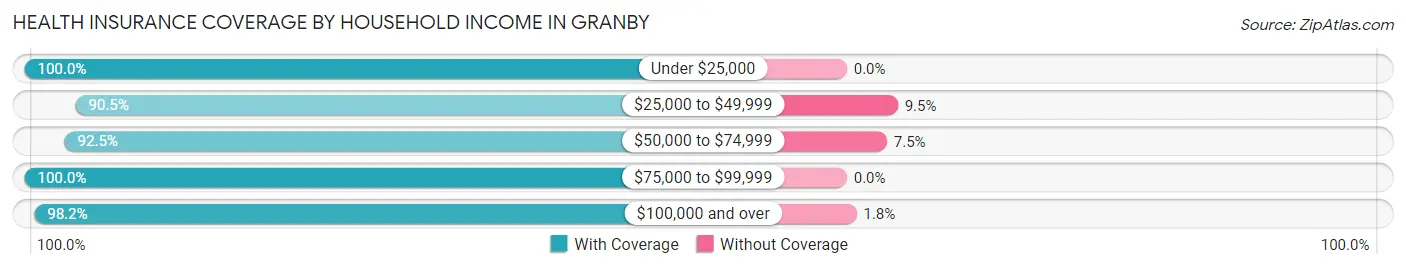
| Household Income | With Coverage | Without Coverage |
| Under $25,000 | 73 (100.0%) | 0 (0.0%) |
| $25,000 to $49,999 | 275 (90.5%) | 29 (9.5%) |
| $50,000 to $74,999 | 308 (92.5%) | 25 (7.5%) |
| $75,000 to $99,999 | 153 (100.0%) | 0 (0.0%) |
| $100,000 and over | 1,189 (98.2%) | 22 (1.8%) |
Public vs Private Health Insurance Coverage by Age in Granby
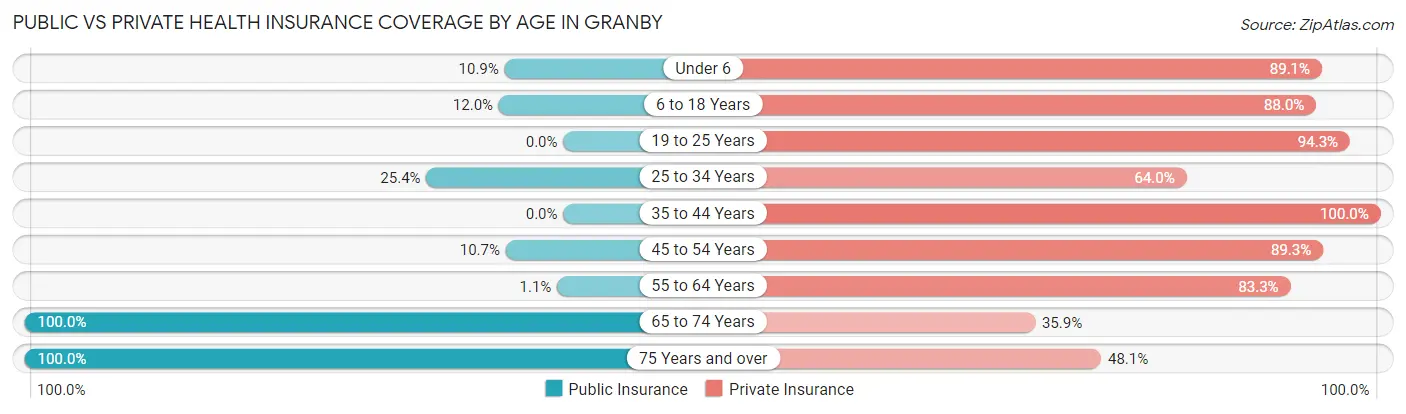
| Age Bracket | Public Insurance | Private Insurance |
| Under 6 | 17 (10.9%) | 139 (89.1%) |
| 6 to 18 Years | 25 (12.0%) | 184 (88.0%) |
| 19 to 25 Years | 0 (0.0%) | 116 (94.3%) |
| 25 to 34 Years | 60 (25.4%) | 151 (64.0%) |
| 35 to 44 Years | 0 (0.0%) | 350 (100.0%) |
| 45 to 54 Years | 25 (10.7%) | 209 (89.3%) |
| 55 to 64 Years | 3 (1.1%) | 219 (83.3%) |
| 65 to 74 Years | 343 (100.0%) | 123 (35.9%) |
| 75 Years and over | 160 (100.0%) | 77 (48.1%) |
| Total | 633 (30.5%) | 1,568 (75.6%) |
Disability Status by Sex by Age in Granby
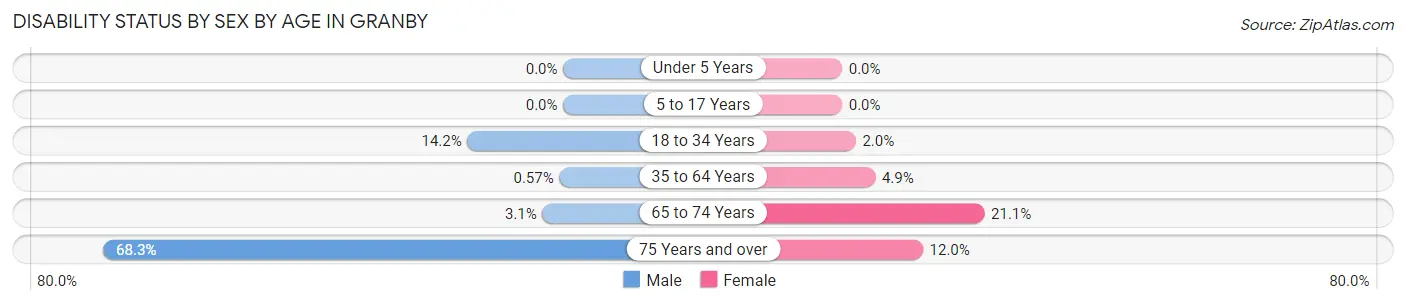
| Age Bracket | Male | Female |
| Under 5 Years | 0 (0.0%) | 0 (0.0%) |
| 5 to 17 Years | 0 (0.0%) | 0 (0.0%) |
| 18 to 34 Years | 35 (14.2%) | 3 (2.0%) |
| 35 to 64 Years | 3 (0.6%) | 16 (4.9%) |
| 65 to 74 Years | 4 (3.1%) | 45 (21.1%) |
| 75 Years and over | 41 (68.3%) | 12 (12.0%) |
Disability Class by Sex by Age in Granby
Disability Class: Hearing Difficulty
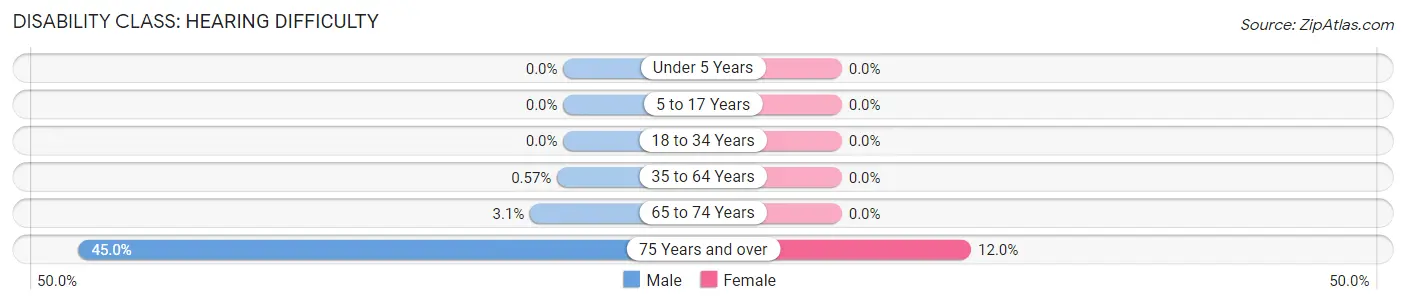
| Age Bracket | Male | Female |
| Under 5 Years | 0 (0.0%) | 0 (0.0%) |
| 5 to 17 Years | 0 (0.0%) | 0 (0.0%) |
| 18 to 34 Years | 0 (0.0%) | 0 (0.0%) |
| 35 to 64 Years | 3 (0.6%) | 0 (0.0%) |
| 65 to 74 Years | 4 (3.1%) | 0 (0.0%) |
| 75 Years and over | 27 (45.0%) | 12 (12.0%) |
Disability Class: Vision Difficulty
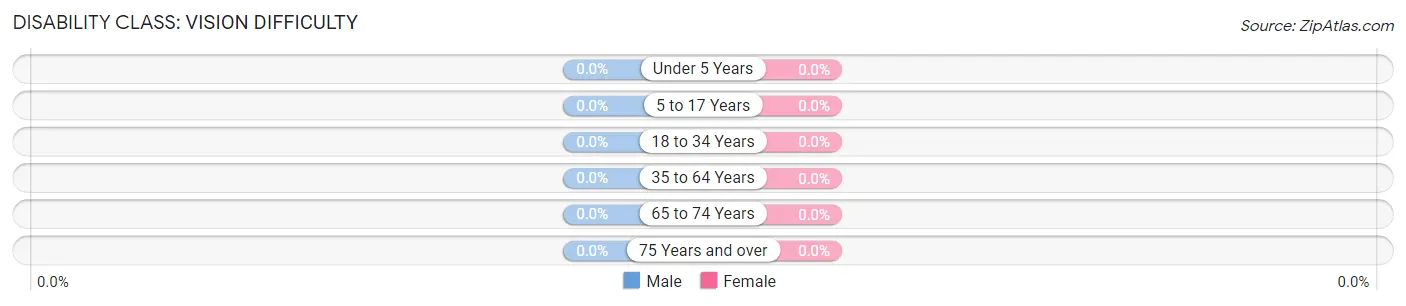
| Age Bracket | Male | Female |
| Under 5 Years | 0 (0.0%) | 0 (0.0%) |
| 5 to 17 Years | 0 (0.0%) | 0 (0.0%) |
| 18 to 34 Years | 0 (0.0%) | 0 (0.0%) |
| 35 to 64 Years | 0 (0.0%) | 0 (0.0%) |
| 65 to 74 Years | 0 (0.0%) | 0 (0.0%) |
| 75 Years and over | 0 (0.0%) | 0 (0.0%) |
Disability Class: Cognitive Difficulty
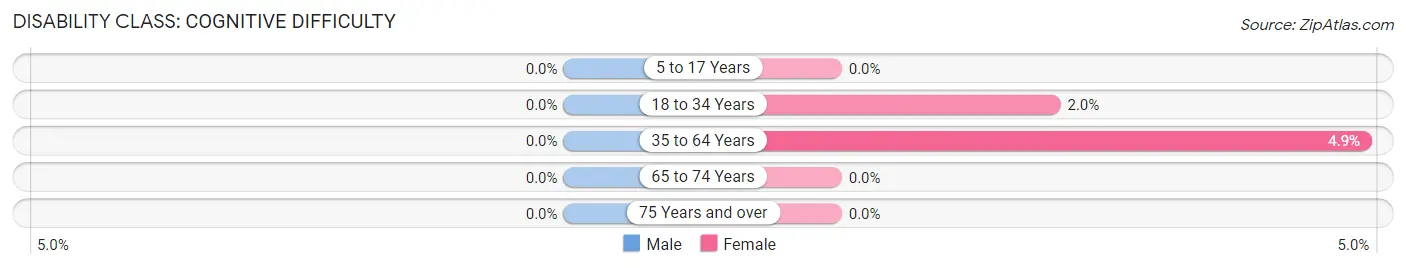
| Age Bracket | Male | Female |
| 5 to 17 Years | 0 (0.0%) | 0 (0.0%) |
| 18 to 34 Years | 0 (0.0%) | 3 (2.0%) |
| 35 to 64 Years | 0 (0.0%) | 16 (4.9%) |
| 65 to 74 Years | 0 (0.0%) | 0 (0.0%) |
| 75 Years and over | 0 (0.0%) | 0 (0.0%) |
Disability Class: Ambulatory Difficulty
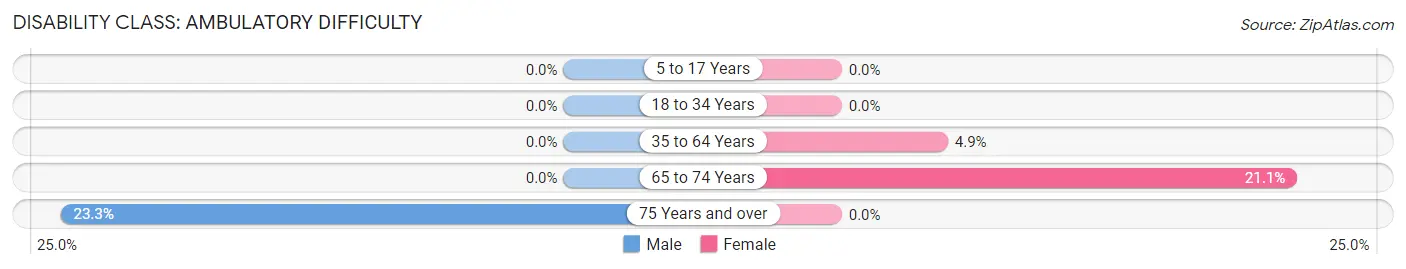
| Age Bracket | Male | Female |
| 5 to 17 Years | 0 (0.0%) | 0 (0.0%) |
| 18 to 34 Years | 0 (0.0%) | 0 (0.0%) |
| 35 to 64 Years | 0 (0.0%) | 16 (4.9%) |
| 65 to 74 Years | 0 (0.0%) | 45 (21.1%) |
| 75 Years and over | 14 (23.3%) | 0 (0.0%) |
Disability Class: Self-Care Difficulty
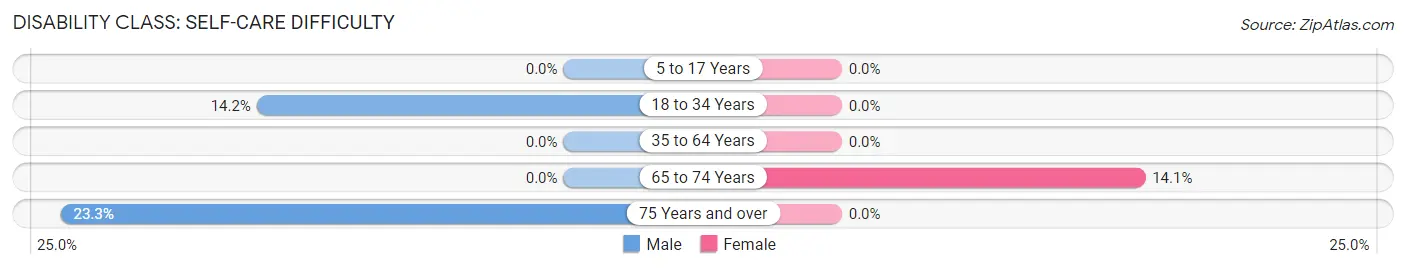
| Age Bracket | Male | Female |
| 5 to 17 Years | 0 (0.0%) | 0 (0.0%) |
| 18 to 34 Years | 35 (14.2%) | 0 (0.0%) |
| 35 to 64 Years | 0 (0.0%) | 0 (0.0%) |
| 65 to 74 Years | 0 (0.0%) | 30 (14.1%) |
| 75 Years and over | 14 (23.3%) | 0 (0.0%) |
Technology Access in Granby
Computing Device Access in Granby
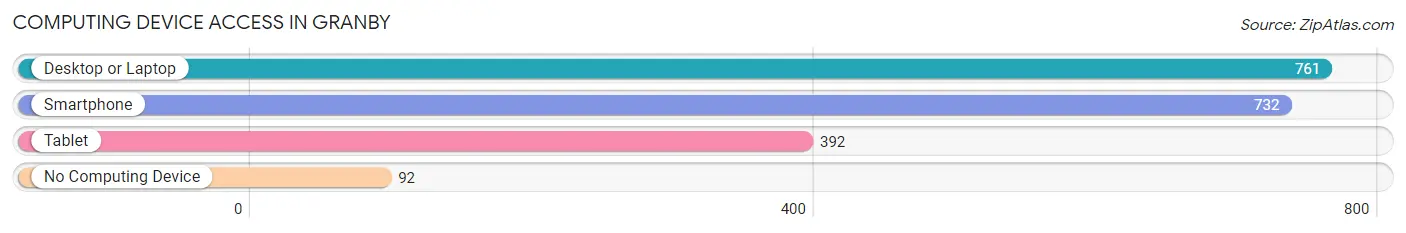
| Device Type | # Households | % Households |
| Desktop or Laptop | 761 | 79.8% |
| Smartphone | 732 | 76.8% |
| Tablet | 392 | 41.1% |
| No Computing Device | 92 | 9.7% |
| Total | 953 | 100.0% |
Internet Access in Granby
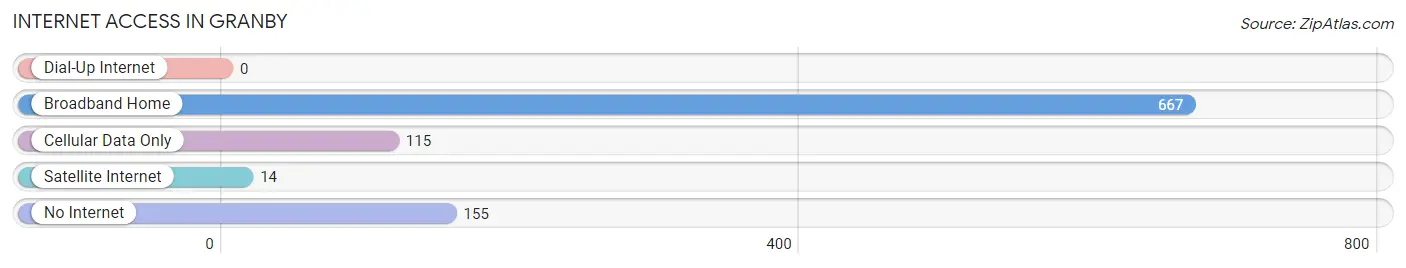
| Internet Type | # Households | % Households |
| Dial-Up Internet | 0 | 0.0% |
| Broadband Home | 667 | 70.0% |
| Cellular Data Only | 115 | 12.1% |
| Satellite Internet | 14 | 1.5% |
| No Internet | 155 | 16.3% |
| Total | 953 | 100.0% |
Granby Summary
Granby is a town located in Grand County, Colorado, United States. It is situated in the Rocky Mountains at an elevation of 8,222 feet (2,505 m). The population was 1,864 at the 2010 census. Granby is located in the headwaters of the Colorado River, near the head of the Fraser River and the Fraser Valley.
Geography
Granby is located at 40°6′17″N 105°56′45″W (40.104722, -105.945556). According to the United States Census Bureau, the town has a total area of 1.2 square miles (3.1 km2), all of it land.
Granby is located in the Fraser Valley, which is a wide, flat valley surrounded by mountains. The Fraser River runs through the valley, and the town is located at the head of the Fraser River. The valley is surrounded by the Arapaho National Forest, which is home to a variety of wildlife, including elk, deer, and moose.
History
Granby was founded in 1881 by a group of settlers from the Midwest. The town was named after Granby, Massachusetts, the hometown of one of the settlers. The settlers were attracted to the area by the abundance of natural resources, including timber, water, and minerals.
Granby quickly became a center for mining and logging. The town was also a popular destination for tourists, who came to enjoy the scenery and outdoor activities.
In the early 1900s, Granby was a popular destination for wealthy families from the East Coast. The town was home to several large resorts, including the Grand Lake Lodge, which was built in 1908.
Economy
Granby's economy is largely based on tourism and recreation. The town is home to several ski resorts, including Winter Park Resort, which is the closest ski resort to Denver. Granby is also home to several golf courses, including the Grand Elk Golf Club.
The town is also home to several businesses, including restaurants, retail stores, and lodging. Granby is also home to several manufacturing companies, including a furniture factory and a brewery.
Demographics
As of the census of 2010, there were 1,864 people, 790 households, and 486 families residing in the town. The population density was 1,541.7 people per square mile (595.2/km2). There were 890 housing units at an average density of 745.8 per square mile (288.3/km2). The racial makeup of the town was 94.2% White, 0.3% African American, 0.7% Native American, 0.7% Asian, 0.1% Pacific Islander, 2.2% from other races, and 2.0% from two or more races. Hispanic or Latino of any race were 8.2% of the population.
There were 790 households, out of which 24.3% had children under the age of 18 living with them, 48.3% were married couples living together, 8.3% had a female householder with no husband present, and 39.9% were non-families. 33.3% of all households were made up of individuals, and 11.3% had someone living alone who was 65 years of age or older. The average household size was 2.25 and the average family size was 2.86.
In the town, the population was spread out, with 21.2% under the age of 18, 6.2% from 18 to 24, 24.2% from 25 to 44, 30.2% from 45 to 64, and 18.2% who were 65 years of age or older. The median age was 43 years. For every 100 females, there were 97.2 males. For every 100 females age 18 and over, there were 95.2 males.
The median income for a household in the town was $45,000, and the median income for a family was $51,250. Males had a median income of $35,000 versus $25,000 for females. The per capita income for the town was $22,917. About 4.2% of families and 6.2% of the population were below the poverty line, including 8.2% of those under age 18 and 4.2% of those age 65 or over.
Common Questions
What is Per Capita Income in Granby?
Per Capita income in Granby is $47,175.
What is the Median Family Income in Granby?
Median Family Income in Granby is $112,022.
What is the Median Household income in Granby?
Median Household Income in Granby is $77,679.
What is Income or Wage Gap in Granby?
Income or Wage Gap in Granby is 17.4%.
Women in Granby earn 82.6 cents for every dollar earned by a man.
What is Inequality or Gini Index in Granby?
Inequality or Gini Index in Granby is 0.37.
What is the Total Population of Granby?
Total Population of Granby is 2,074.
What is the Total Male Population of Granby?
Total Male Population of Granby is 1,137.
What is the Total Female Population of Granby?
Total Female Population of Granby is 937.
What is the Ratio of Males per 100 Females in Granby?
There are 121.34 Males per 100 Females in Granby.
What is the Ratio of Females per 100 Males in Granby?
There are 82.41 Females per 100 Males in Granby.
What is the Median Population Age in Granby?
Median Population Age in Granby is 41.6 Years.
What is the Average Family Size in Granby
Average Family Size in Granby is 2.9 People.
What is the Average Household Size in Granby
Average Household Size in Granby is 2.2 People.
How Large is the Labor Force in Granby?
There are 1,223 People in the Labor Forcein in Granby.
What is the Percentage of People in the Labor Force in Granby?
69.5% of People are in the Labor Force in Granby.
What is the Unemployment Rate in Granby?
Unemployment Rate in Granby is 0.2%.