Zip Codes with the Highest Percentage of Population Employed in Farming, Fishing & Forestry in Golden, CO
RELATED REPORTS & OPTIONS
Farming, Fishing & Forestry
Golden
Compare Zip Codes
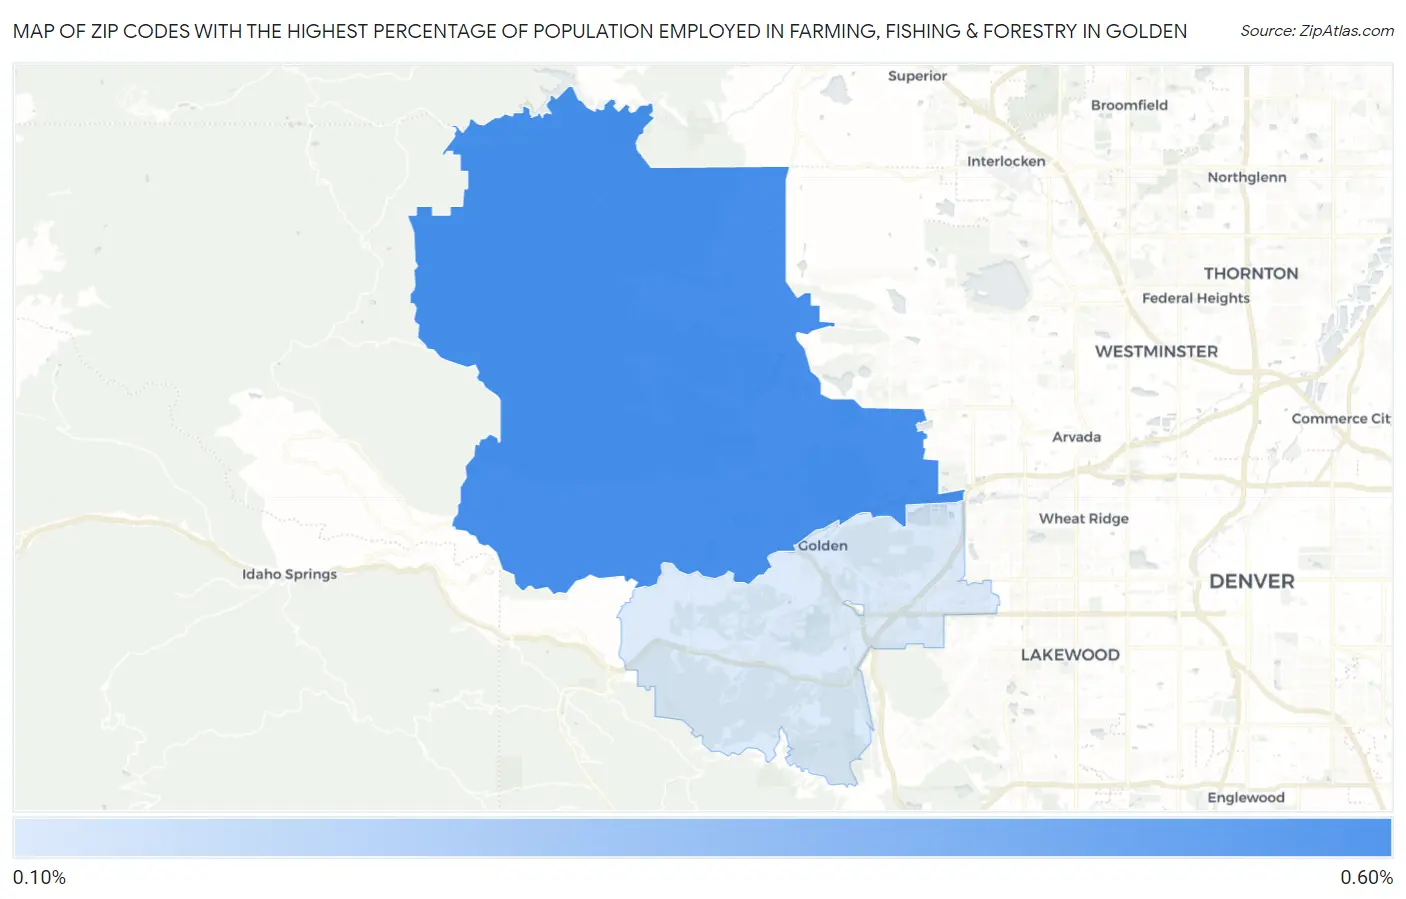
Map of Zip Codes with the Highest Percentage of Population Employed in Farming, Fishing & Forestry in Golden
0.0%
0.60%
Zip Codes with the Highest Percentage of Population Employed in Farming, Fishing & Forestry in Golden, CO
| Zip Code | % Employed | vs State | vs National | |
| 1. | 80403 | 0.53% | 0.49%(+0.043)#198 | 0.61%(-0.076)#12,604 |
| 2. | 80401 | 0.16% | 0.49%(-0.325)#278 | 0.61%(-0.443)#16,710 |
1
Common Questions
What are the Top Zip Codes with the Highest Percentage of Population Employed in Farming, Fishing & Forestry in Golden, CO?
Top Zip Codes with the Highest Percentage of Population Employed in Farming, Fishing & Forestry in Golden, CO are:
What zip code has the Highest Percentage of Population Employed in Farming, Fishing & Forestry in Golden, CO?
80403 has the Highest Percentage of Population Employed in Farming, Fishing & Forestry in Golden, CO with 0.53%.
What is the Percentage of Population Employed in Farming, Fishing & Forestry in Golden, CO?
Percentage of Population Employed in Farming, Fishing & Forestry in Golden is 0.11%.
What is the Percentage of Population Employed in Farming, Fishing & Forestry in Colorado?
Percentage of Population Employed in Farming, Fishing & Forestry in Colorado is 0.49%.
What is the Percentage of Population Employed in Farming, Fishing & Forestry in the United States?
Percentage of Population Employed in Farming, Fishing & Forestry in the United States is 0.61%.