Gilcrest, CO Map & Demographics
Gilcrest Map
Gilcrest Overview
$24,421
PER CAPITA INCOME
$70,556
AVG FAMILY INCOME
$64,583
AVG HOUSEHOLD INCOME
0.5%
WAGE / INCOME GAP [ % ]
99.5¢/ $1
WAGE / INCOME GAP [ $ ]
0.37
INEQUALITY / GINI INDEX
1,082
TOTAL POPULATION
643
MALE POPULATION
439
FEMALE POPULATION
146.47
MALES / 100 FEMALES
68.27
FEMALES / 100 MALES
29.7
MEDIAN AGE
3.6
AVG FAMILY SIZE
3.6
AVG HOUSEHOLD SIZE
575
LABOR FORCE [ PEOPLE ]
72.0%
PERCENT IN LABOR FORCE
Gilcrest Zip Codes
Income in Gilcrest
Income Overview in Gilcrest
Per Capita Income in Gilcrest is $24,421, while median incomes of families and households are $70,556 and $64,583 respectively.
| Characteristic | Number | Measure |
| Per Capita Income | 1,082 | $24,421 |
| Median Family Income | 282 | $70,556 |
| Mean Family Income | 282 | $78,762 |
| Median Household Income | 304 | $64,583 |
| Mean Household Income | 304 | $79,712 |
| Income Deficit | 282 | $0 |
| Wage / Income Gap (%) | 1,082 | 0.53% |
| Wage / Income Gap ($) | 1,082 | 99.47¢ per $1 |
| Gini / Inequality Index | 1,082 | 0.37 |
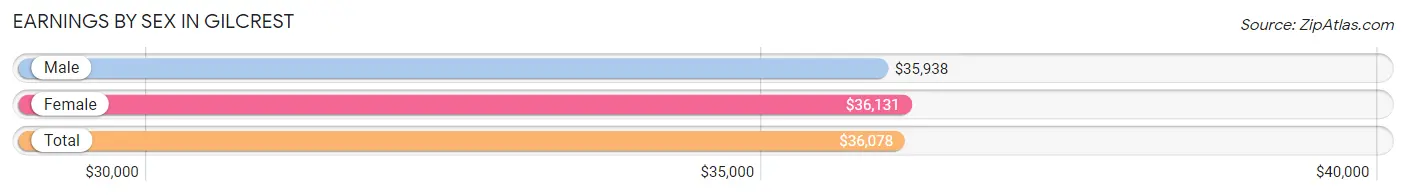
Earnings by Sex in Gilcrest
Average Earnings in Gilcrest are $36,078, $35,938 for men and $36,131 for women, a difference of 0.5%.
| Sex | Number | Average Earnings |
| Male | 390 (64.2%) | $35,938 |
| Female | 217 (35.7%) | $36,131 |
| Total | 607 (100.0%) | $36,078 |
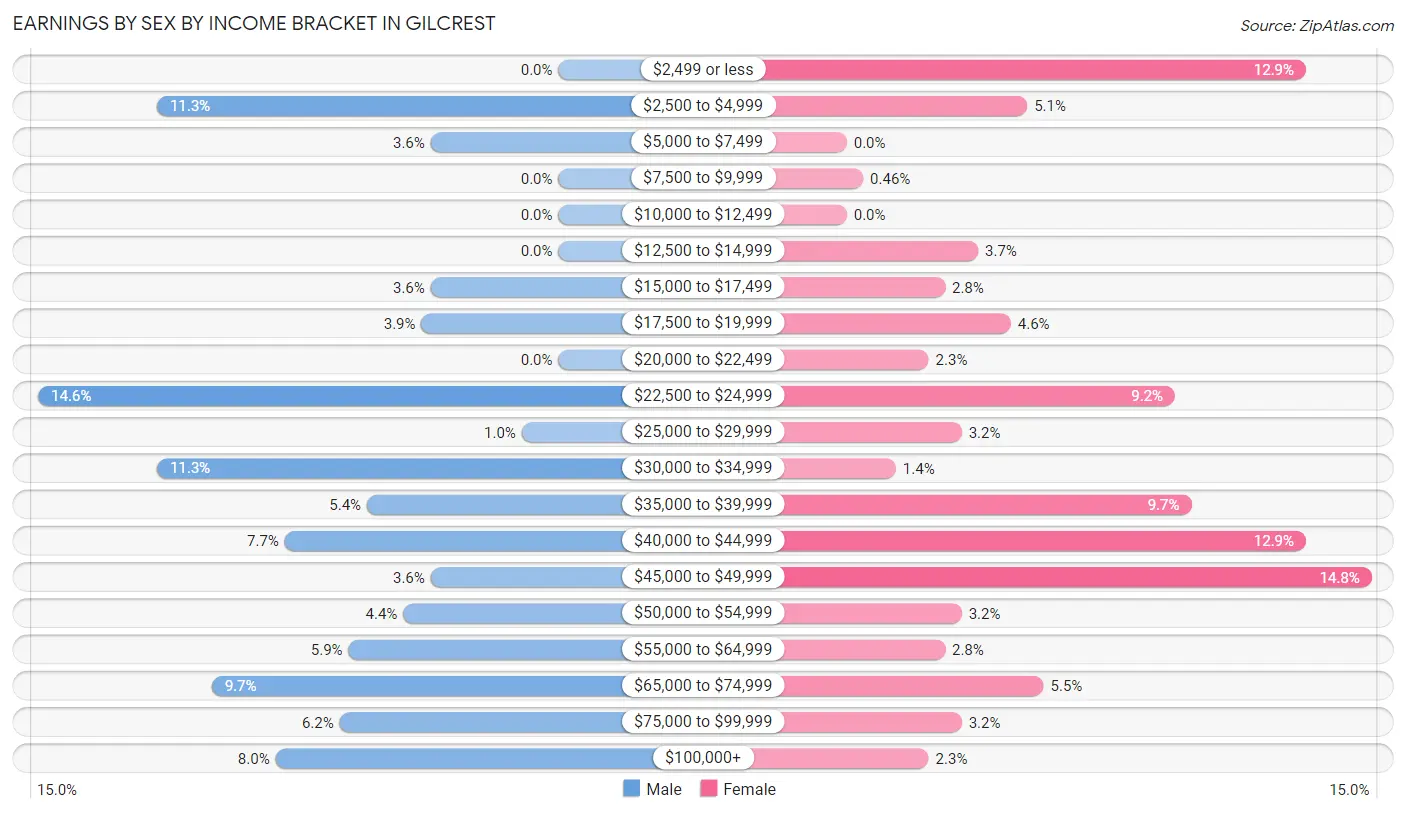
Earnings by Sex by Income Bracket in Gilcrest
The most common earnings brackets in Gilcrest are $22,500 to $24,999 for men (57 | 14.6%) and $45,000 to $49,999 for women (32 | 14.7%).
| Income | Male | Female |
| $2,499 or less | 0 (0.0%) | 28 (12.9%) |
| $2,500 to $4,999 | 44 (11.3%) | 11 (5.1%) |
| $5,000 to $7,499 | 14 (3.6%) | 0 (0.0%) |
| $7,500 to $9,999 | 0 (0.0%) | 1 (0.5%) |
| $10,000 to $12,499 | 0 (0.0%) | 0 (0.0%) |
| $12,500 to $14,999 | 0 (0.0%) | 8 (3.7%) |
| $15,000 to $17,499 | 14 (3.6%) | 6 (2.8%) |
| $17,500 to $19,999 | 15 (3.8%) | 10 (4.6%) |
| $20,000 to $22,499 | 0 (0.0%) | 5 (2.3%) |
| $22,500 to $24,999 | 57 (14.6%) | 20 (9.2%) |
| $25,000 to $29,999 | 4 (1.0%) | 7 (3.2%) |
| $30,000 to $34,999 | 44 (11.3%) | 3 (1.4%) |
| $35,000 to $39,999 | 21 (5.4%) | 21 (9.7%) |
| $40,000 to $44,999 | 30 (7.7%) | 28 (12.9%) |
| $45,000 to $49,999 | 14 (3.6%) | 32 (14.7%) |
| $50,000 to $54,999 | 17 (4.4%) | 7 (3.2%) |
| $55,000 to $64,999 | 23 (5.9%) | 6 (2.8%) |
| $65,000 to $74,999 | 38 (9.7%) | 12 (5.5%) |
| $75,000 to $99,999 | 24 (6.1%) | 7 (3.2%) |
| $100,000+ | 31 (8.0%) | 5 (2.3%) |
| Total | 390 (100.0%) | 217 (100.0%) |
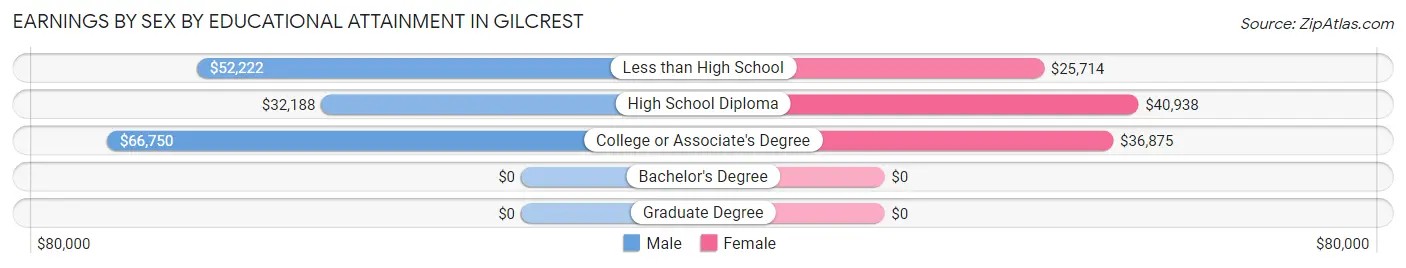
Earnings by Sex by Educational Attainment in Gilcrest
Average earnings in Gilcrest are $42,330 for men and $38,750 for women, a difference of 8.5%. Men with an educational attainment of college or associate's degree enjoy the highest average annual earnings of $66,750, while those with high school diploma education earn the least with $32,188. Women with an educational attainment of high school diploma earn the most with the average annual earnings of $40,938, while those with less than high school education have the smallest earnings of $25,714.
| Educational Attainment | Male Income | Female Income |
| Less than High School | $52,222 | $25,714 |
| High School Diploma | $32,188 | $40,938 |
| College or Associate's Degree | $66,750 | $36,875 |
| Bachelor's Degree | - | - |
| Graduate Degree | - | - |
| Total | $42,330 | $38,750 |
Family Income in Gilcrest
Family Income Brackets in Gilcrest
According to the Gilcrest family income data, there are 84 families falling into the $35,000 to $49,999 income range, which is the most common income bracket and makes up 29.8% of all families.
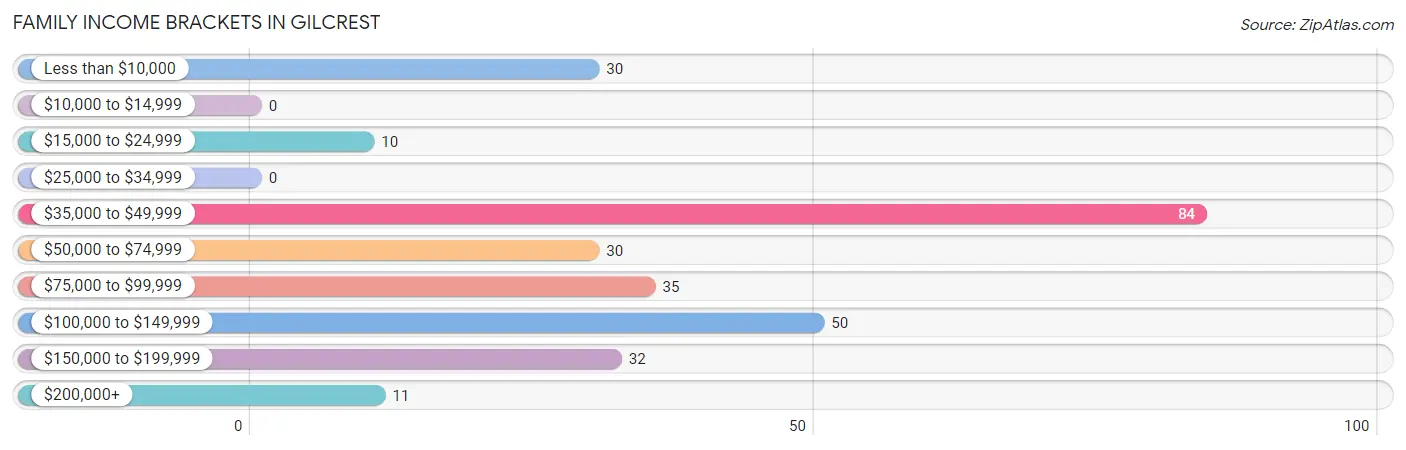
| Income Bracket | # Families | % Families |
| Less than $10,000 | 30 | 10.6% |
| $10,000 to $14,999 | 0 | 0.0% |
| $15,000 to $24,999 | 10 | 3.5% |
| $25,000 to $34,999 | 0 | 0.0% |
| $35,000 to $49,999 | 84 | 29.8% |
| $50,000 to $74,999 | 30 | 10.6% |
| $75,000 to $99,999 | 35 | 12.4% |
| $100,000 to $149,999 | 50 | 17.7% |
| $150,000 to $199,999 | 32 | 11.3% |
| $200,000+ | 11 | 3.9% |
Family Income by Famaliy Size in Gilcrest
6-person families (19 | 6.7%) account for the highest median family income in Gilcrest with $116,250 per family, while 2-person families (92 | 32.6%) have the highest median income of $36,458 per family member.
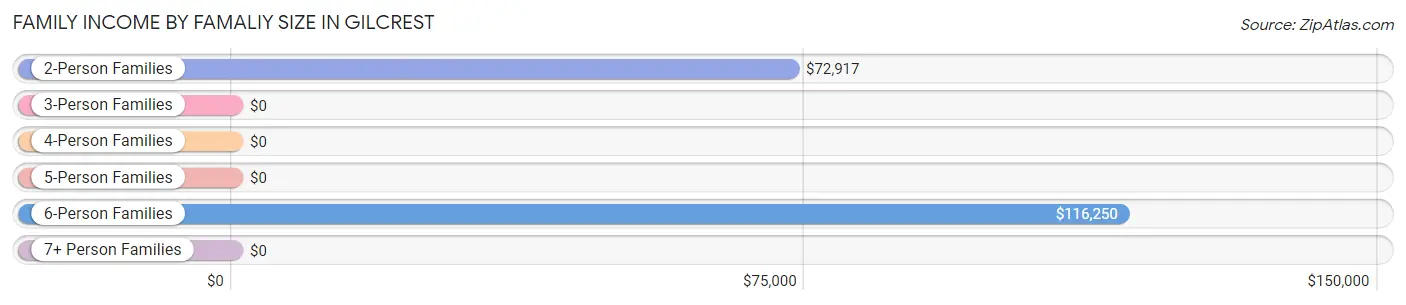
| Income Bracket | # Families | Median Income |
| 2-Person Families | 92 (32.6%) | $72,917 |
| 3-Person Families | 111 (39.4%) | $0 |
| 4-Person Families | 28 (9.9%) | $0 |
| 5-Person Families | 32 (11.4%) | $0 |
| 6-Person Families | 19 (6.7%) | $116,250 |
| 7+ Person Families | 0 (0.0%) | $0 |
| Total | 282 (100.0%) | $70,556 |
Family Income by Number of Earners in Gilcrest
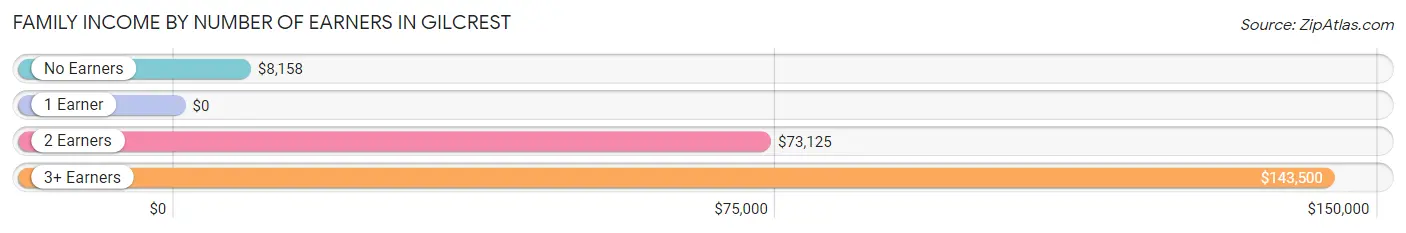
| Number of Earners | # Families | Median Income |
| No Earners | 32 (11.4%) | $8,158 |
| 1 Earner | 75 (26.6%) | $0 |
| 2 Earners | 133 (47.2%) | $73,125 |
| 3+ Earners | 42 (14.9%) | $143,500 |
| Total | 282 (100.0%) | $70,556 |
Household Income in Gilcrest
Household Income Brackets in Gilcrest
With 84 households falling in the category, the $35,000 to $49,999 income range is the most frequent in Gilcrest, accounting for 27.6% of all households.
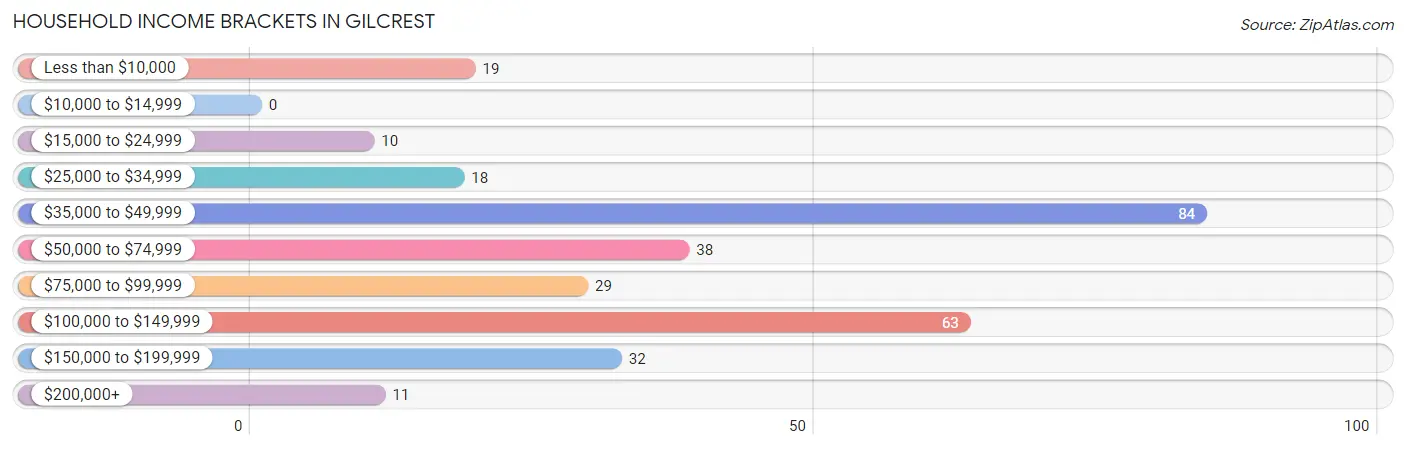
| Income Bracket | # Households | % Households |
| Less than $10,000 | 19 | 6.3% |
| $10,000 to $14,999 | 0 | 0.0% |
| $15,000 to $24,999 | 10 | 3.3% |
| $25,000 to $34,999 | 18 | 5.9% |
| $35,000 to $49,999 | 84 | 27.6% |
| $50,000 to $74,999 | 38 | 12.5% |
| $75,000 to $99,999 | 29 | 9.5% |
| $100,000 to $149,999 | 63 | 20.7% |
| $150,000 to $199,999 | 32 | 10.5% |
| $200,000+ | 11 | 3.6% |
Household Income by Householder Age in Gilcrest
The median household income in Gilcrest is $64,583, with the highest median household income of $92,321 found in the 45 to 64 years age bracket for the primary householder. A total of 147 households (48.4%) fall into this category. Meanwhile, the 15 to 24 years age bracket for the primary householder has the lowest median household income of $0, with 6 households (2.0%) in this group.
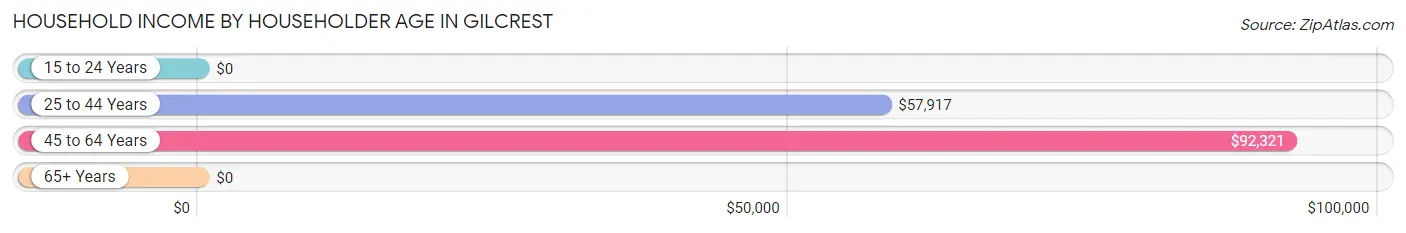
| Income Bracket | # Households | Median Income |
| 15 to 24 Years | 6 (2.0%) | $0 |
| 25 to 44 Years | 103 (33.9%) | $57,917 |
| 45 to 64 Years | 147 (48.4%) | $92,321 |
| 65+ Years | 48 (15.8%) | $0 |
| Total | 304 (100.0%) | $64,583 |
Poverty in Gilcrest
Income Below Poverty by Sex and Age in Gilcrest
With 10.5% poverty level for males and 18.0% for females among the residents of Gilcrest, 16 and 17 year old males and 12 to 14 year old females are the most vulnerable to poverty, with 13 males (65.0%) and 16 females (100.0%) in their respective age groups living below the poverty level.
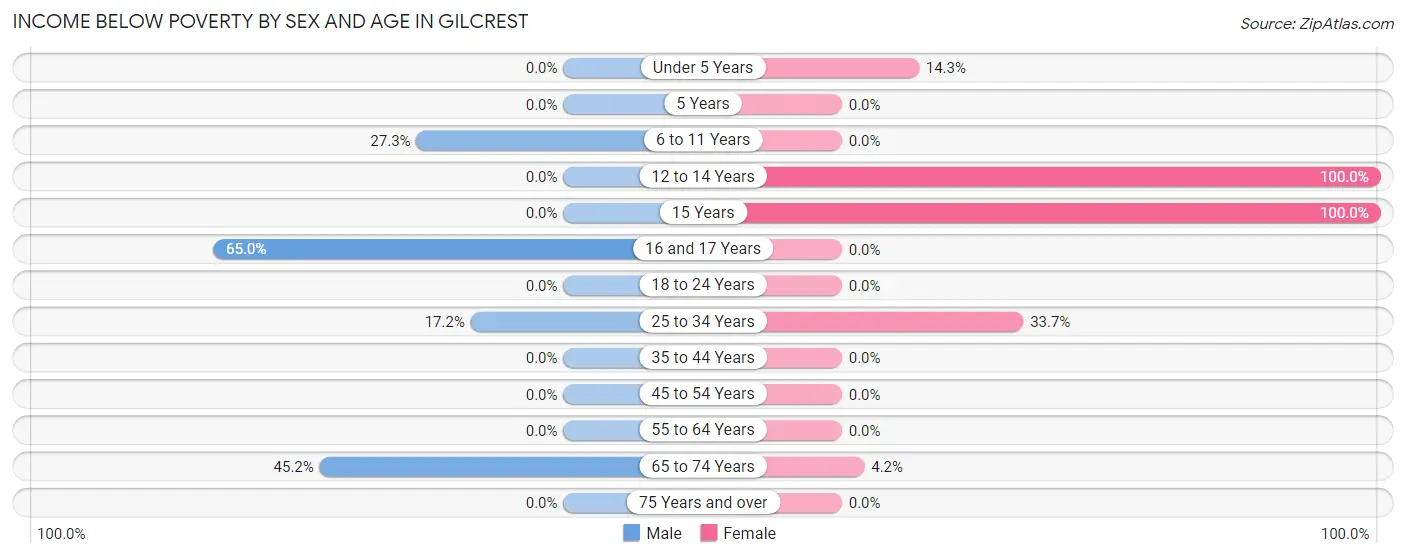
| Age Bracket | Male | Female |
| Under 5 Years | 0 (0.0%) | 10 (14.3%) |
| 5 Years | 0 (0.0%) | 0 (0.0%) |
| 6 to 11 Years | 24 (27.3%) | 0 (0.0%) |
| 12 to 14 Years | 0 (0.0%) | 16 (100.0%) |
| 15 Years | 0 (0.0%) | 17 (100.0%) |
| 16 and 17 Years | 13 (65.0%) | 0 (0.0%) |
| 18 to 24 Years | 0 (0.0%) | 0 (0.0%) |
| 25 to 34 Years | 11 (17.2%) | 33 (33.7%) |
| 35 to 44 Years | 0 (0.0%) | 0 (0.0%) |
| 45 to 54 Years | 0 (0.0%) | 0 (0.0%) |
| 55 to 64 Years | 0 (0.0%) | 0 (0.0%) |
| 65 to 74 Years | 19 (45.2%) | 1 (4.2%) |
| 75 Years and over | 0 (0.0%) | 0 (0.0%) |
| Total | 67 (10.5%) | 77 (18.0%) |
Income Above Poverty by Sex and Age in Gilcrest
According to the poverty statistics in Gilcrest, males aged under 5 years and females aged 6 to 11 years are the age groups that are most secure financially, with 100.0% of males and 100.0% of females in these age groups living above the poverty line.
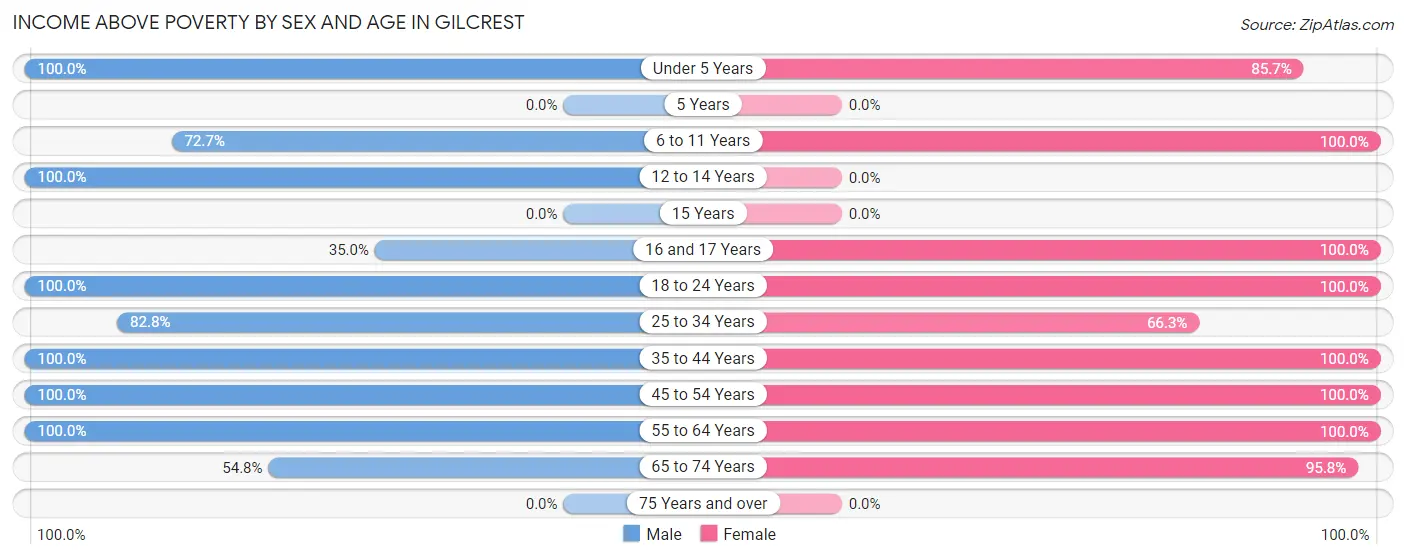
| Age Bracket | Male | Female |
| Under 5 Years | 34 (100.0%) | 60 (85.7%) |
| 5 Years | 0 (0.0%) | 0 (0.0%) |
| 6 to 11 Years | 64 (72.7%) | 13 (100.0%) |
| 12 to 14 Years | 27 (100.0%) | 0 (0.0%) |
| 15 Years | 0 (0.0%) | 0 (0.0%) |
| 16 and 17 Years | 7 (35.0%) | 30 (100.0%) |
| 18 to 24 Years | 105 (100.0%) | 8 (100.0%) |
| 25 to 34 Years | 53 (82.8%) | 65 (66.3%) |
| 35 to 44 Years | 100 (100.0%) | 41 (100.0%) |
| 45 to 54 Years | 69 (100.0%) | 59 (100.0%) |
| 55 to 64 Years | 88 (100.0%) | 51 (100.0%) |
| 65 to 74 Years | 23 (54.8%) | 23 (95.8%) |
| 75 Years and over | 0 (0.0%) | 0 (0.0%) |
| Total | 570 (89.5%) | 350 (82.0%) |
Income Below Poverty Among Married-Couple Families in Gilcrest
The poverty statistics for married-couple families in Gilcrest show that 11.5% or 19 of the total 165 families live below the poverty line. Families with no children have the highest poverty rate of 20.4%, comprising of 19 families. On the other hand, families with 1 or 2 children have the lowest poverty rate of 0.0%, which includes 0 families.
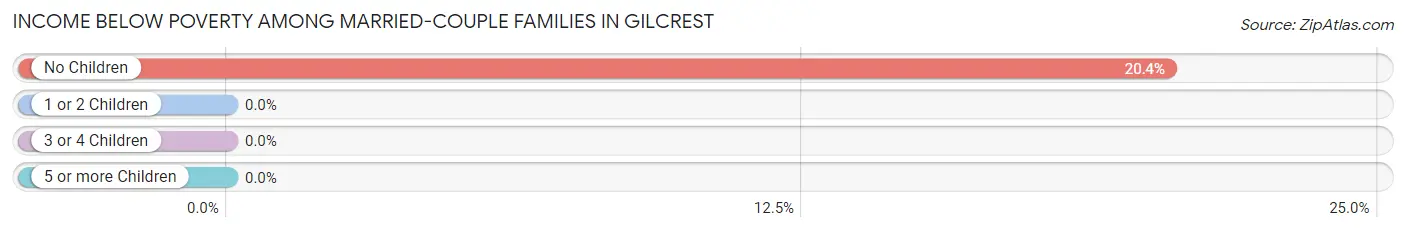
| Children | Above Poverty | Below Poverty |
| No Children | 74 (79.6%) | 19 (20.4%) |
| 1 or 2 Children | 58 (100.0%) | 0 (0.0%) |
| 3 or 4 Children | 14 (100.0%) | 0 (0.0%) |
| 5 or more Children | 0 (0.0%) | 0 (0.0%) |
| Total | 146 (88.5%) | 19 (11.5%) |
Income Below Poverty Among Single-Parent Households in Gilcrest
According to the poverty data in Gilcrest, 12.8% or 11 single-father households and 32.3% or 10 single-mother households are living below the poverty line. Among single-father households, those with 1 or 2 children have the highest poverty rate, with 11 households (39.3%) experiencing poverty. Likewise, among single-mother households, those with 3 or 4 children have the highest poverty rate, with 10 households (100.0%) falling below the poverty line.
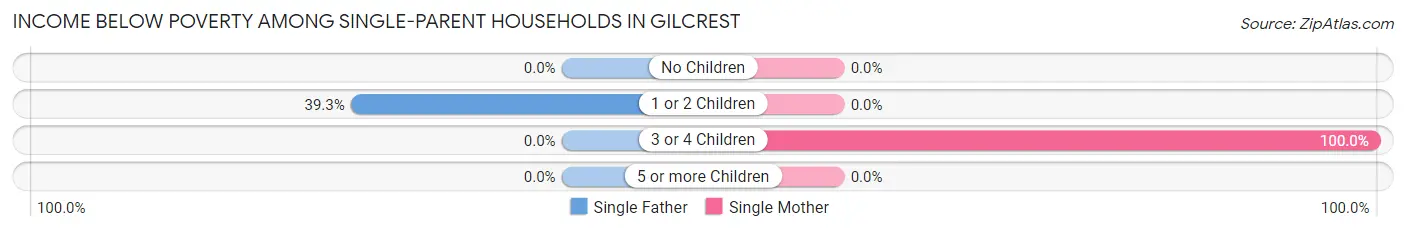
| Children | Single Father | Single Mother |
| No Children | 0 (0.0%) | 0 (0.0%) |
| 1 or 2 Children | 11 (39.3%) | 0 (0.0%) |
| 3 or 4 Children | 0 (0.0%) | 10 (100.0%) |
| 5 or more Children | 0 (0.0%) | 0 (0.0%) |
| Total | 11 (12.8%) | 10 (32.3%) |
Income Below Poverty Among Married-Couple vs Single-Parent Households in Gilcrest
The poverty data for Gilcrest shows that 19 of the married-couple family households (11.5%) and 21 of the single-parent households (17.9%) are living below the poverty level. Within the married-couple family households, those with no children have the highest poverty rate, with 19 households (20.4%) falling below the poverty line. Among the single-parent households, those with 3 or 4 children have the highest poverty rate, with 10 household (55.6%) living below poverty.
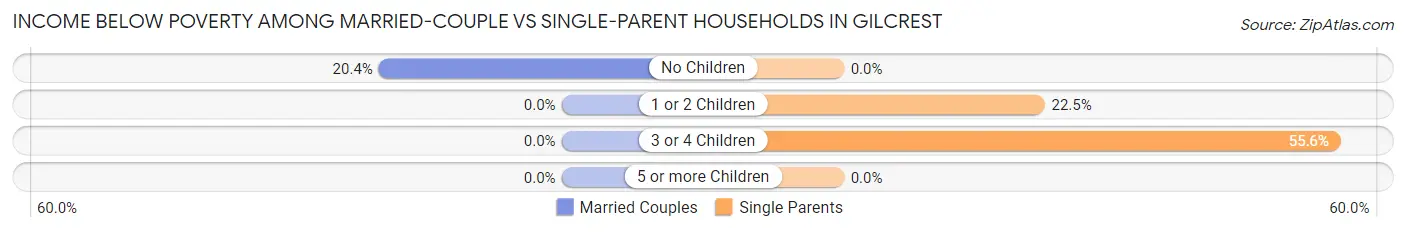
| Children | Married-Couple Families | Single-Parent Households |
| No Children | 19 (20.4%) | 0 (0.0%) |
| 1 or 2 Children | 0 (0.0%) | 11 (22.5%) |
| 3 or 4 Children | 0 (0.0%) | 10 (55.6%) |
| 5 or more Children | 0 (0.0%) | 0 (0.0%) |
| Total | 19 (11.5%) | 21 (17.9%) |
Race in Gilcrest
The most populous races in Gilcrest are White / Caucasian (823 | 76.1%), Hispanic or Latino (751 | 69.4%), and Two or more Races (212 | 19.6%).
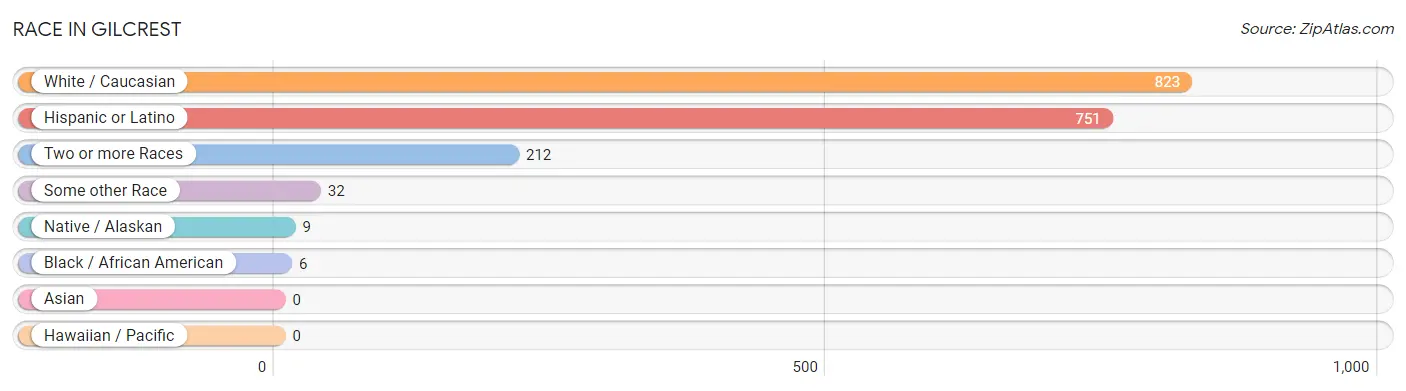
| Race | # Population | % Population |
| Asian | 0 | 0.0% |
| Black / African American | 6 | 0.5% |
| Hawaiian / Pacific | 0 | 0.0% |
| Hispanic or Latino | 751 | 69.4% |
| Native / Alaskan | 9 | 0.8% |
| White / Caucasian | 823 | 76.1% |
| Two or more Races | 212 | 19.6% |
| Some other Race | 32 | 3.0% |
| Total | 1,082 | 100.0% |
Ancestry in Gilcrest
The most populous ancestries reported in Gilcrest are Mexican (719 | 66.4%), German (93 | 8.6%), English (59 | 5.4%), Irish (57 | 5.3%), and American (29 | 2.7%), together accounting for 88.4% of all Gilcrest residents.
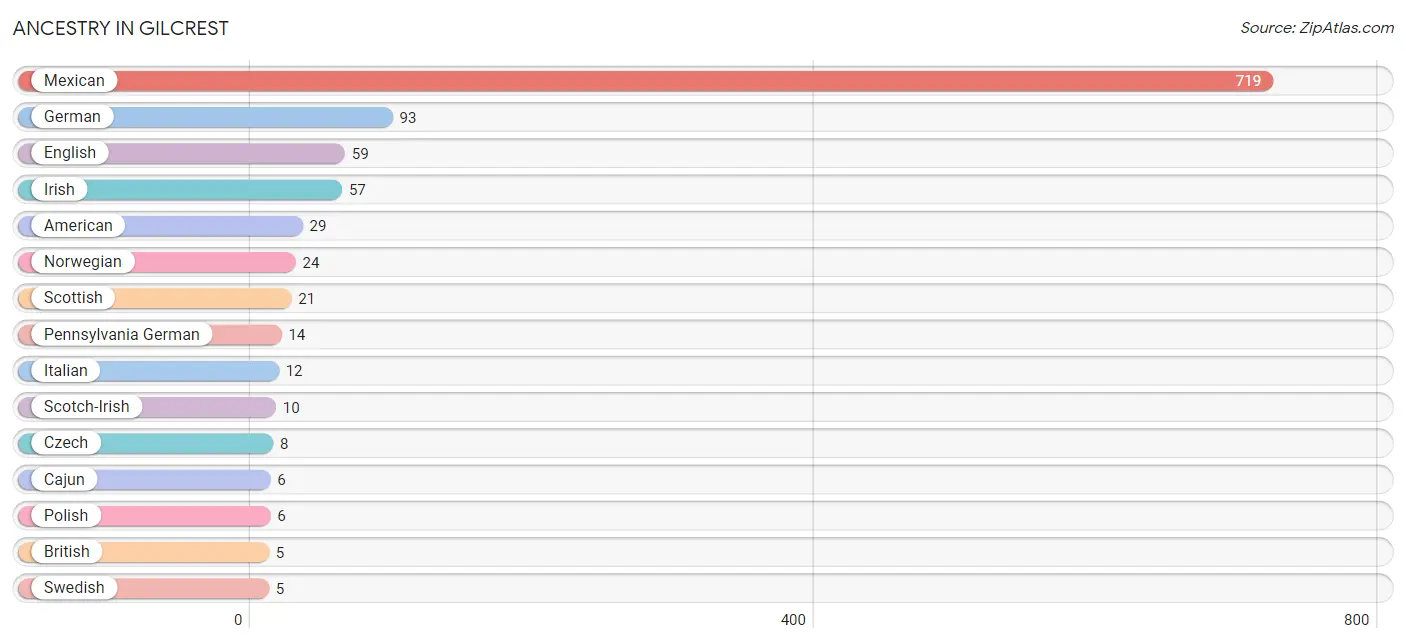
| Ancestry | # Population | % Population |
| American | 29 | 2.7% |
| British | 5 | 0.5% |
| Cajun | 6 | 0.5% |
| Canadian | 2 | 0.2% |
| Cherokee | 1 | 0.1% |
| Czech | 8 | 0.7% |
| English | 59 | 5.4% |
| German | 93 | 8.6% |
| Irish | 57 | 5.3% |
| Italian | 12 | 1.1% |
| Mexican | 719 | 66.4% |
| Norwegian | 24 | 2.2% |
| Pennsylvania German | 14 | 1.3% |
| Polish | 6 | 0.5% |
| Scotch-Irish | 10 | 0.9% |
| Scottish | 21 | 1.9% |
| Serbian | 2 | 0.2% |
| Swedish | 5 | 0.5% | View All 18 Rows |
Immigrants in Gilcrest
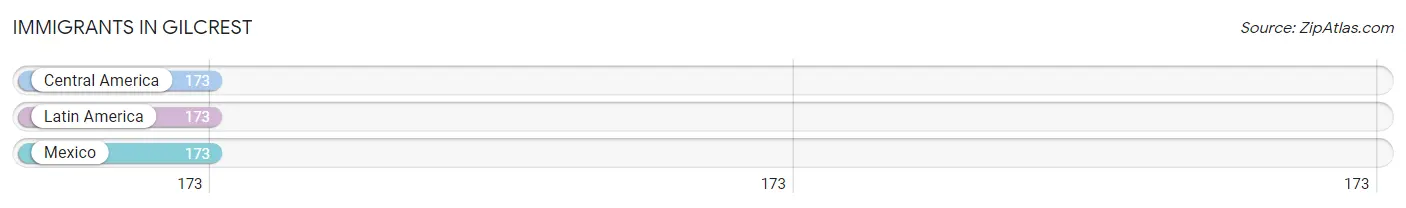
The most numerous immigrant groups reported in Gilcrest came from Central America (173 | 16.0%), Latin America (173 | 16.0%), and Mexico (173 | 16.0%), together accounting for 48.0% of all Gilcrest residents.
| Immigration Origin | # Population | % Population |
| Central America | 173 | 16.0% |
| Latin America | 173 | 16.0% |
| Mexico | 173 | 16.0% | View All 3 Rows |
Sex and Age in Gilcrest
Sex and Age in Gilcrest
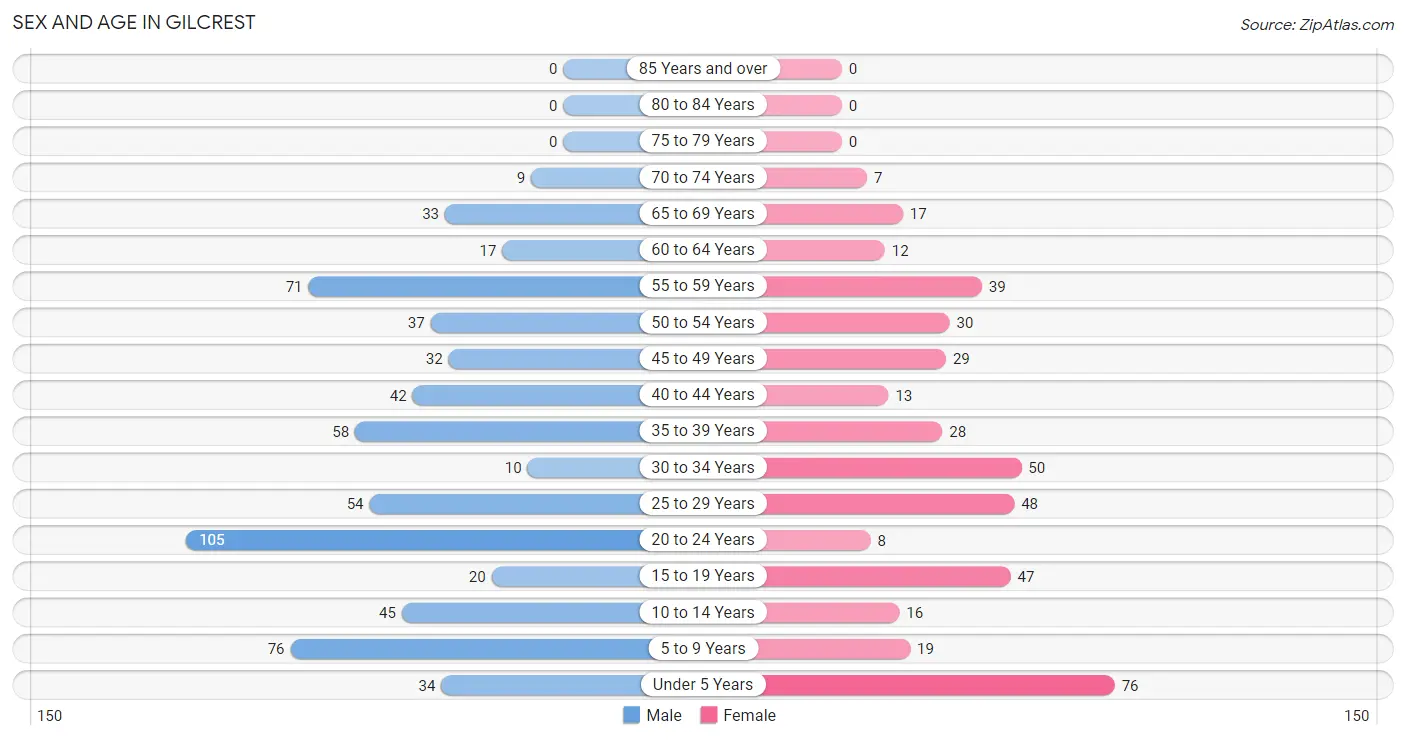
The most populous age groups in Gilcrest are 20 to 24 Years (105 | 16.3%) for men and Under 5 Years (76 | 17.3%) for women.
| Age Bracket | Male | Female |
| Under 5 Years | 34 (5.3%) | 76 (17.3%) |
| 5 to 9 Years | 76 (11.8%) | 19 (4.3%) |
| 10 to 14 Years | 45 (7.0%) | 16 (3.6%) |
| 15 to 19 Years | 20 (3.1%) | 47 (10.7%) |
| 20 to 24 Years | 105 (16.3%) | 8 (1.8%) |
| 25 to 29 Years | 54 (8.4%) | 48 (10.9%) |
| 30 to 34 Years | 10 (1.6%) | 50 (11.4%) |
| 35 to 39 Years | 58 (9.0%) | 28 (6.4%) |
| 40 to 44 Years | 42 (6.5%) | 13 (3.0%) |
| 45 to 49 Years | 32 (5.0%) | 29 (6.6%) |
| 50 to 54 Years | 37 (5.8%) | 30 (6.8%) |
| 55 to 59 Years | 71 (11.0%) | 39 (8.9%) |
| 60 to 64 Years | 17 (2.6%) | 12 (2.7%) |
| 65 to 69 Years | 33 (5.1%) | 17 (3.9%) |
| 70 to 74 Years | 9 (1.4%) | 7 (1.6%) |
| 75 to 79 Years | 0 (0.0%) | 0 (0.0%) |
| 80 to 84 Years | 0 (0.0%) | 0 (0.0%) |
| 85 Years and over | 0 (0.0%) | 0 (0.0%) |
| Total | 643 (100.0%) | 439 (100.0%) |
Families and Households in Gilcrest
Median Family Size in Gilcrest
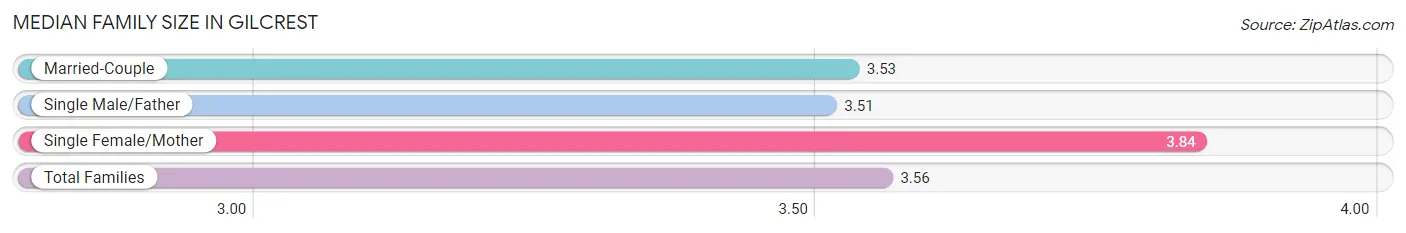
The median family size in Gilcrest is 3.56 persons per family, with single female/mother families (31 | 11.0%) accounting for the largest median family size of 3.84 persons per family. On the other hand, single male/father families (86 | 30.5%) represent the smallest median family size with 3.51 persons per family.
| Family Type | # Families | Family Size |
| Married-Couple | 165 (58.5%) | 3.53 |
| Single Male/Father | 86 (30.5%) | 3.51 |
| Single Female/Mother | 31 (11.0%) | 3.84 |
| Total Families | 282 (100.0%) | 3.56 |
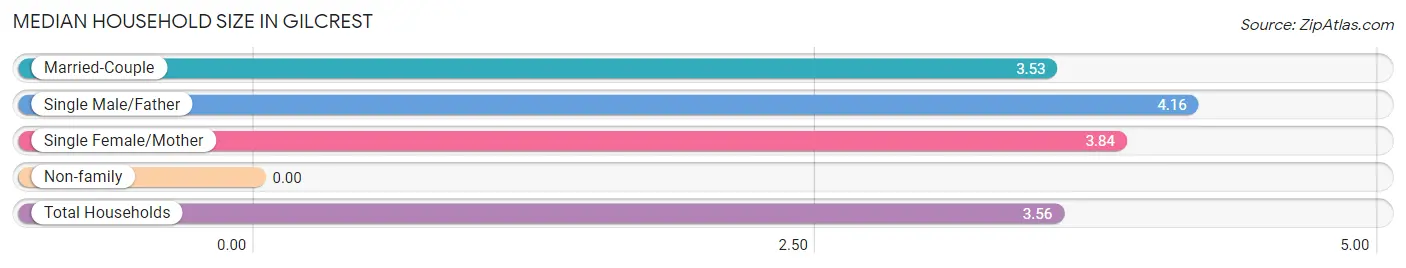
Median Household Size in Gilcrest
| Household Type | # Households | Household Size |
| Married-Couple | 165 (54.3%) | 3.53 |
| Single Male/Father | 86 (28.3%) | 4.16 |
| Single Female/Mother | 31 (10.2%) | 3.84 |
| Non-family | 22 (7.2%) | - |
| Total Households | 304 (100.0%) | 3.56 |
Household Size by Marriage Status in Gilcrest
Out of a total of 304 households in Gilcrest, 282 (92.8%) are family households, while 22 (7.2%) are nonfamily households. The most numerous type of family households are 2-person households, comprising 86, and the most common type of nonfamily households are 1-person households, comprising 22.
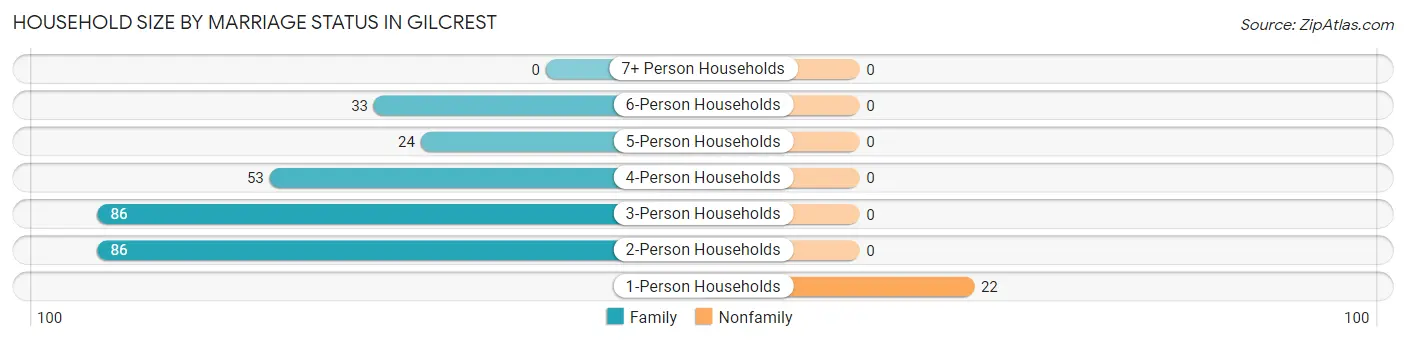
| Household Size | Family Households | Nonfamily Households |
| 1-Person Households | - | 22 (7.2%) |
| 2-Person Households | 86 (28.3%) | 0 (0.0%) |
| 3-Person Households | 86 (28.3%) | 0 (0.0%) |
| 4-Person Households | 53 (17.4%) | 0 (0.0%) |
| 5-Person Households | 24 (7.9%) | 0 (0.0%) |
| 6-Person Households | 33 (10.9%) | 0 (0.0%) |
| 7+ Person Households | 0 (0.0%) | 0 (0.0%) |
| Total | 282 (92.8%) | 22 (7.2%) |
Female Fertility in Gilcrest
Fertility by Age in Gilcrest
| Age Bracket | Women with Births | Births / 1,000 Women |
| 15 to 19 years | 0 (0.0%) | 0.0 |
| 20 to 34 years | 0 (0.0%) | 0.0 |
| 35 to 50 years | 0 (0.0%) | 0.0 |
| Total | 0 (0.0%) | 0.0 |
Fertility by Age by Marriage Status in Gilcrest
| Age Bracket | Married | Unmarried |
| 15 to 19 years | 0 (0.0%) | 0 (0.0%) |
| 20 to 34 years | 0 (0.0%) | 0 (0.0%) |
| 35 to 50 years | 0 (0.0%) | 0 (0.0%) |
| Total | 0 (0.0%) | 0 (0.0%) |
Fertility by Education in Gilcrest
| Educational Attainment | Women with Births | Births / 1,000 Women |
| Less than High School | 0 (0.0%) | 0.0 |
| High School Diploma | 0 (0.0%) | 0.0 |
| College or Associate's Degree | 0 (0.0%) | 0.0 |
| Bachelor's Degree | 0 (0.0%) | 0.0 |
| Graduate Degree | 0 (0.0%) | 0.0 |
| Total | 0 (0.0%) | 0.0 |
Fertility by Education by Marriage Status in Gilcrest
| Educational Attainment | Married | Unmarried |
| Less than High School | 0 (0.0%) | 0 (0.0%) |
| High School Diploma | 0 (0.0%) | 0 (0.0%) |
| College or Associate's Degree | 0 (0.0%) | 0 (0.0%) |
| Bachelor's Degree | 0 (0.0%) | 0 (0.0%) |
| Graduate Degree | 0 (0.0%) | 0 (0.0%) |
| Total | 0 (0.0%) | 0 (0.0%) |
Employment Characteristics in Gilcrest
Employment by Class of Employer in Gilcrest
Among the 553 employed individuals in Gilcrest, private company employees (456 | 82.5%), self-employed (incorporated) (41 | 7.4%), and not-for-profit organizations (26 | 4.7%) make up the most common classes of employment.
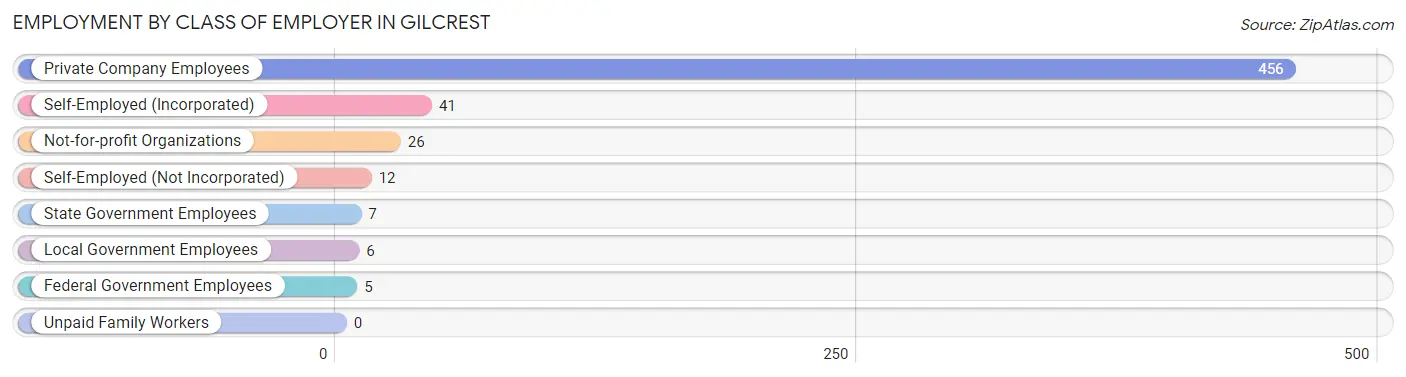
| Employer Class | # Employees | % Employees |
| Private Company Employees | 456 | 82.5% |
| Self-Employed (Incorporated) | 41 | 7.4% |
| Self-Employed (Not Incorporated) | 12 | 2.2% |
| Not-for-profit Organizations | 26 | 4.7% |
| Local Government Employees | 6 | 1.1% |
| State Government Employees | 7 | 1.3% |
| Federal Government Employees | 5 | 0.9% |
| Unpaid Family Workers | 0 | 0.0% |
| Total | 553 | 100.0% |
Employment Status by Age in Gilcrest
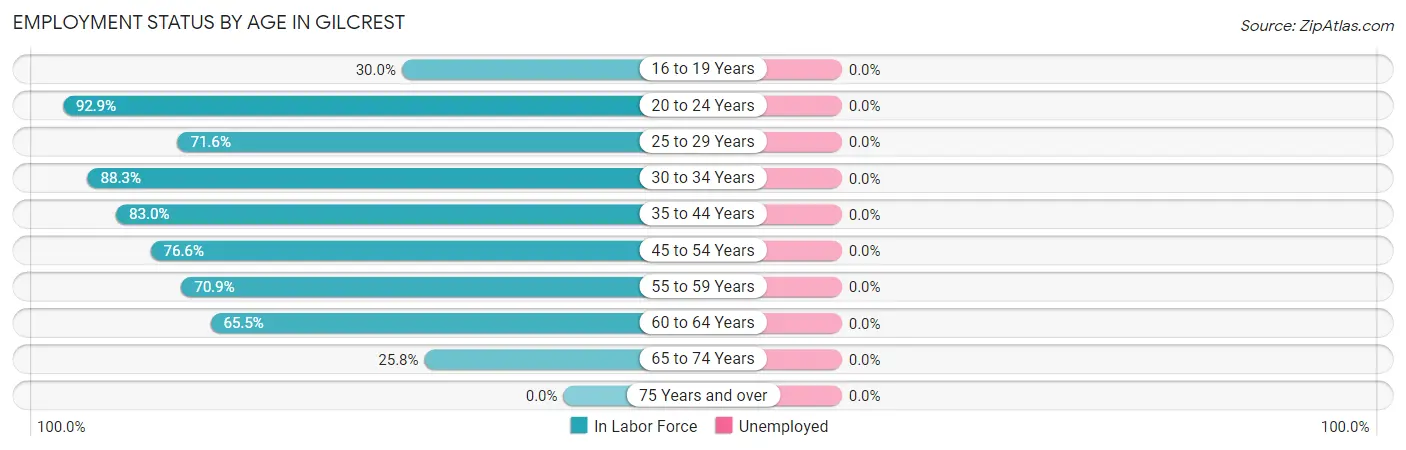
| Age Bracket | In Labor Force | Unemployed |
| 16 to 19 Years | 15 (30.0%) | 0 (0.0%) |
| 20 to 24 Years | 105 (92.9%) | 0 (0.0%) |
| 25 to 29 Years | 73 (71.6%) | 0 (0.0%) |
| 30 to 34 Years | 53 (88.3%) | 0 (0.0%) |
| 35 to 44 Years | 117 (83.0%) | 0 (0.0%) |
| 45 to 54 Years | 98 (76.6%) | 0 (0.0%) |
| 55 to 59 Years | 78 (70.9%) | 0 (0.0%) |
| 60 to 64 Years | 19 (65.5%) | 0 (0.0%) |
| 65 to 74 Years | 17 (25.8%) | 0 (0.0%) |
| 75 Years and over | 0 (0.0%) | 0 (0.0%) |
| Total | 575 (72.0%) | 0 (0.0%) |
Employment Status by Educational Attainment in Gilcrest
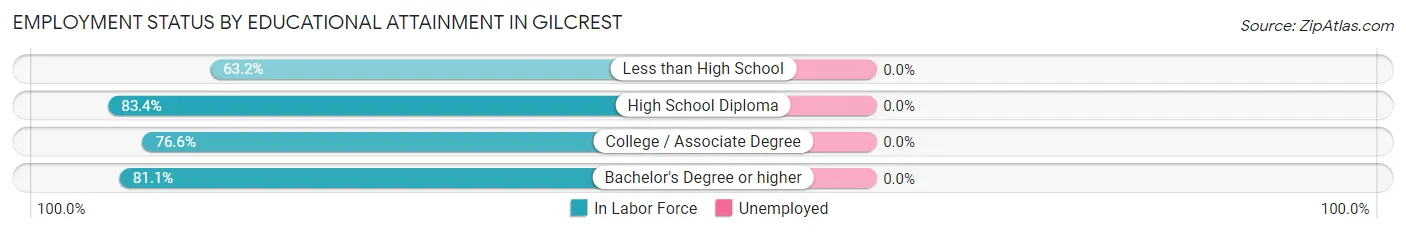
| Educational Attainment | In Labor Force | Unemployed |
| Less than High School | 84 (63.2%) | 0 (0.0%) |
| High School Diploma | 206 (83.4%) | 0 (0.0%) |
| College / Associate Degree | 105 (76.6%) | 0 (0.0%) |
| Bachelor's Degree or higher | 43 (81.1%) | 0 (0.0%) |
| Total | 438 (76.8%) | 0 (0.0%) |
Employment Occupations by Sex in Gilcrest
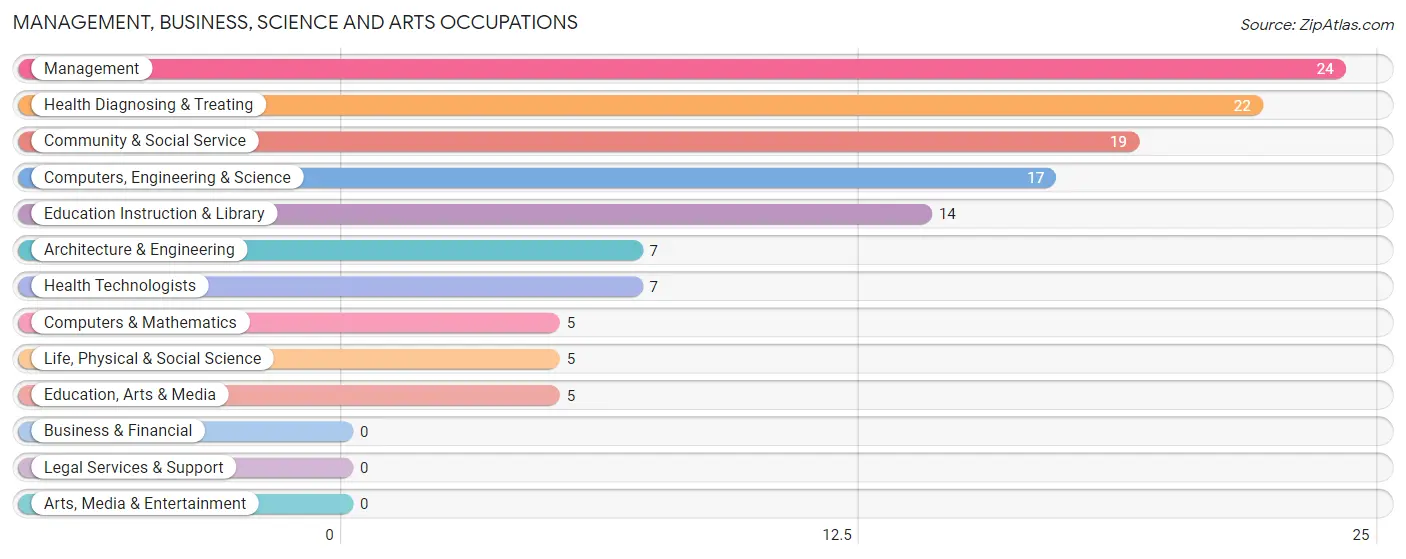
Management, Business, Science and Arts Occupations
The most common Management, Business, Science and Arts occupations in Gilcrest are Management (24 | 4.2%), Health Diagnosing & Treating (22 | 3.8%), Community & Social Service (19 | 3.3%), Computers, Engineering & Science (17 | 3.0%), and Education Instruction & Library (14 | 2.4%).
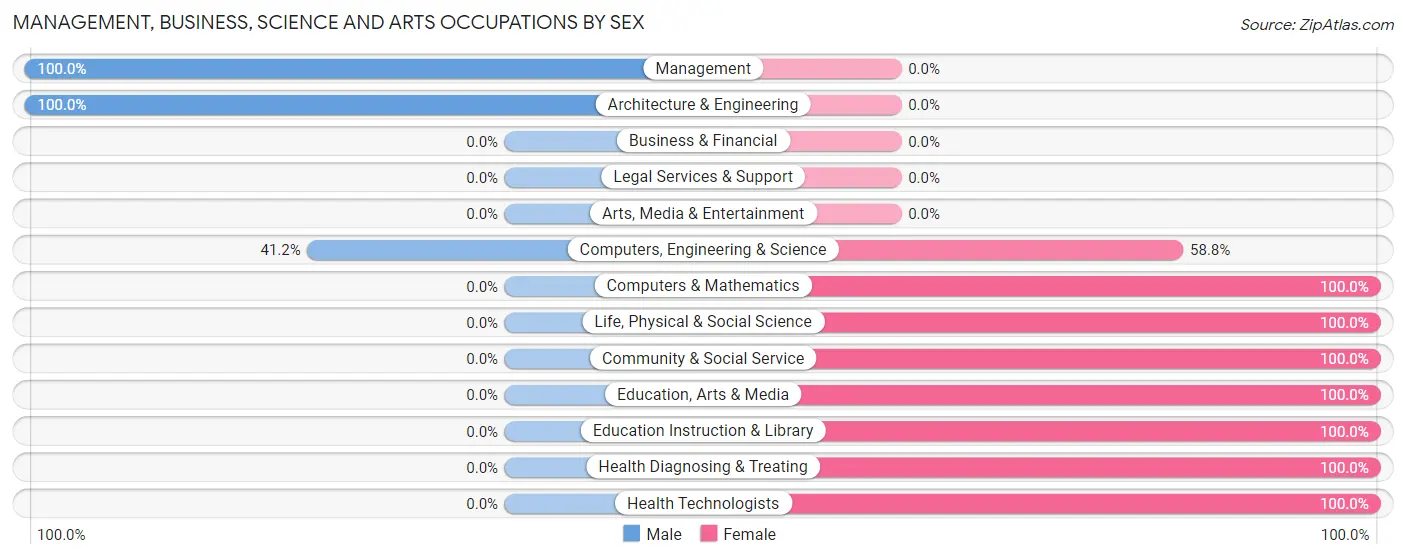
Management, Business, Science and Arts Occupations by Sex
Within the Management, Business, Science and Arts occupations in Gilcrest, the most male-oriented occupations are Management (100.0%), Architecture & Engineering (100.0%), and Computers, Engineering & Science (41.2%), while the most female-oriented occupations are Computers & Mathematics (100.0%), Life, Physical & Social Science (100.0%), and Community & Social Service (100.0%).
| Occupation | Male | Female |
| Management | 24 (100.0%) | 0 (0.0%) |
| Business & Financial | 0 (0.0%) | 0 (0.0%) |
| Computers, Engineering & Science | 7 (41.2%) | 10 (58.8%) |
| Computers & Mathematics | 0 (0.0%) | 5 (100.0%) |
| Architecture & Engineering | 7 (100.0%) | 0 (0.0%) |
| Life, Physical & Social Science | 0 (0.0%) | 5 (100.0%) |
| Community & Social Service | 0 (0.0%) | 19 (100.0%) |
| Education, Arts & Media | 0 (0.0%) | 5 (100.0%) |
| Legal Services & Support | 0 (0.0%) | 0 (0.0%) |
| Education Instruction & Library | 0 (0.0%) | 14 (100.0%) |
| Arts, Media & Entertainment | 0 (0.0%) | 0 (0.0%) |
| Health Diagnosing & Treating | 0 (0.0%) | 22 (100.0%) |
| Health Technologists | 0 (0.0%) | 7 (100.0%) |
| Total (Category) | 31 (37.8%) | 51 (62.2%) |
| Total (Overall) | 372 (64.7%) | 203 (35.3%) |
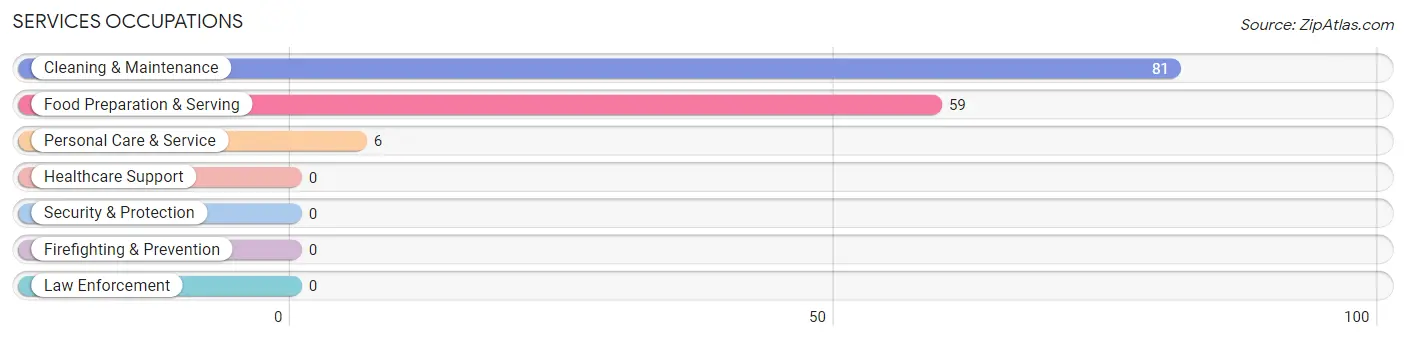
Services Occupations
The most common Services occupations in Gilcrest are Cleaning & Maintenance (81 | 14.1%), Food Preparation & Serving (59 | 10.3%), and Personal Care & Service (6 | 1.0%).
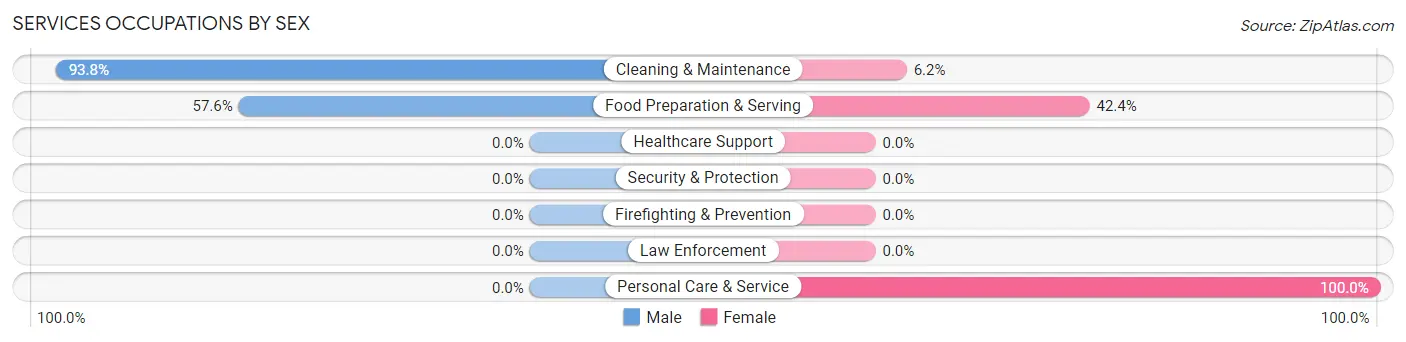
Services Occupations by Sex
Within the Services occupations in Gilcrest, the most male-oriented occupations are Cleaning & Maintenance (93.8%), and Food Preparation & Serving (57.6%), while the most female-oriented occupations are Personal Care & Service (100.0%), Food Preparation & Serving (42.4%), and Cleaning & Maintenance (6.2%).
| Occupation | Male | Female |
| Healthcare Support | 0 (0.0%) | 0 (0.0%) |
| Security & Protection | 0 (0.0%) | 0 (0.0%) |
| Firefighting & Prevention | 0 (0.0%) | 0 (0.0%) |
| Law Enforcement | 0 (0.0%) | 0 (0.0%) |
| Food Preparation & Serving | 34 (57.6%) | 25 (42.4%) |
| Cleaning & Maintenance | 76 (93.8%) | 5 (6.2%) |
| Personal Care & Service | 0 (0.0%) | 6 (100.0%) |
| Total (Category) | 110 (75.3%) | 36 (24.7%) |
| Total (Overall) | 372 (64.7%) | 203 (35.3%) |
Sales and Office Occupations
The most common Sales and Office occupations in Gilcrest are Sales & Related (53 | 9.2%), and Office & Administration (46 | 8.0%).
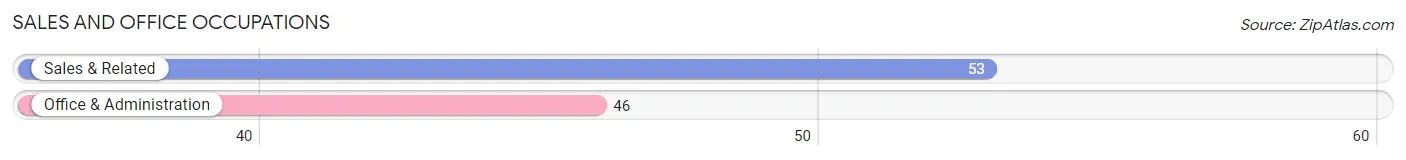
Sales and Office Occupations by Sex
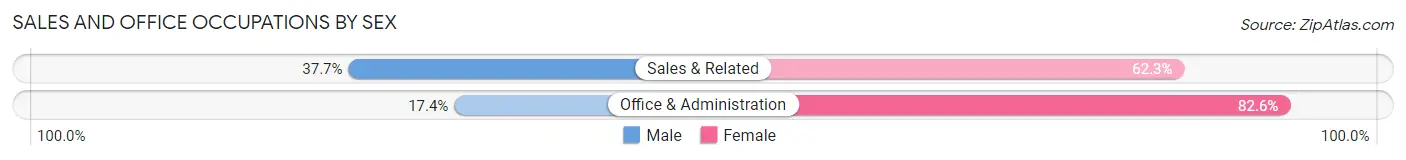
| Occupation | Male | Female |
| Sales & Related | 20 (37.7%) | 33 (62.3%) |
| Office & Administration | 8 (17.4%) | 38 (82.6%) |
| Total (Category) | 28 (28.3%) | 71 (71.7%) |
| Total (Overall) | 372 (64.7%) | 203 (35.3%) |
Natural Resources, Construction and Maintenance Occupations
The most common Natural Resources, Construction and Maintenance occupations in Gilcrest are Construction & Extraction (82 | 14.3%), Installation, Maintenance & Repair (10 | 1.7%), and Farming, Fishing & Forestry (6 | 1.0%).
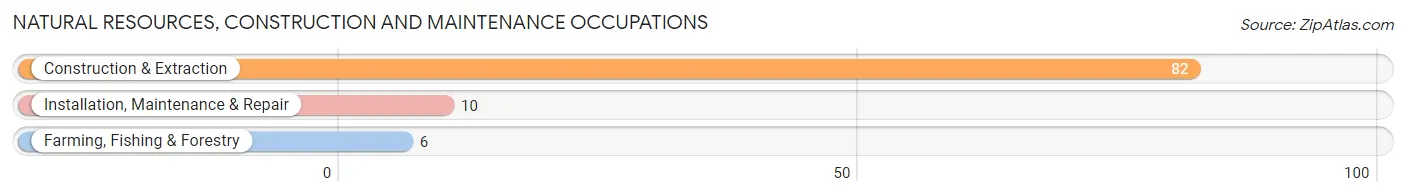
Natural Resources, Construction and Maintenance Occupations by Sex
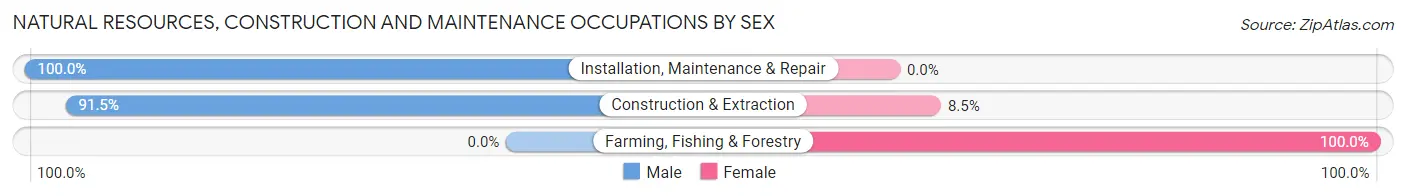
| Occupation | Male | Female |
| Farming, Fishing & Forestry | 0 (0.0%) | 6 (100.0%) |
| Construction & Extraction | 75 (91.5%) | 7 (8.5%) |
| Installation, Maintenance & Repair | 10 (100.0%) | 0 (0.0%) |
| Total (Category) | 85 (86.7%) | 13 (13.3%) |
| Total (Overall) | 372 (64.7%) | 203 (35.3%) |
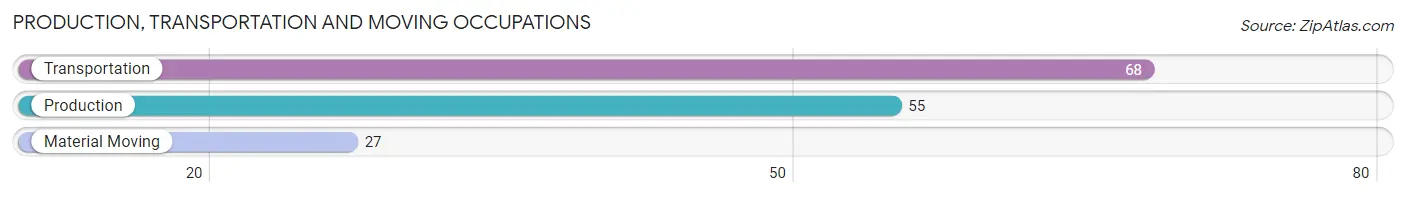
Production, Transportation and Moving Occupations
The most common Production, Transportation and Moving occupations in Gilcrest are Transportation (68 | 11.8%), Production (55 | 9.6%), and Material Moving (27 | 4.7%).
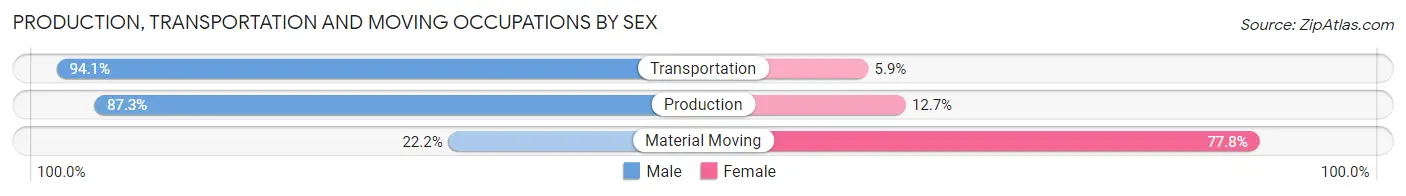
Production, Transportation and Moving Occupations by Sex
| Occupation | Male | Female |
| Production | 48 (87.3%) | 7 (12.7%) |
| Transportation | 64 (94.1%) | 4 (5.9%) |
| Material Moving | 6 (22.2%) | 21 (77.8%) |
| Total (Category) | 118 (78.7%) | 32 (21.3%) |
| Total (Overall) | 372 (64.7%) | 203 (35.3%) |
Employment Industries by Sex in Gilcrest
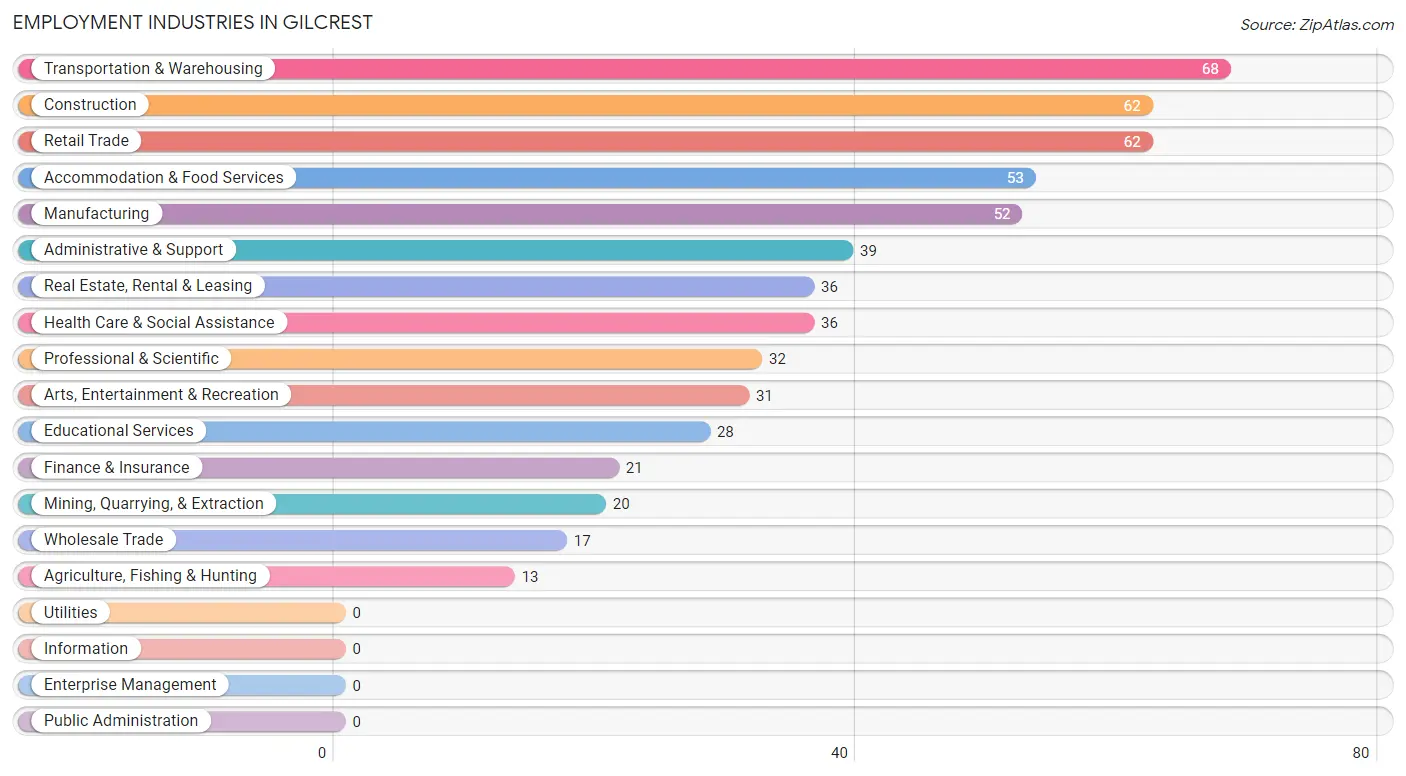
Employment Industries in Gilcrest
The major employment industries in Gilcrest include Transportation & Warehousing (68 | 11.8%), Construction (62 | 10.8%), Retail Trade (62 | 10.8%), Accommodation & Food Services (53 | 9.2%), and Manufacturing (52 | 9.0%).
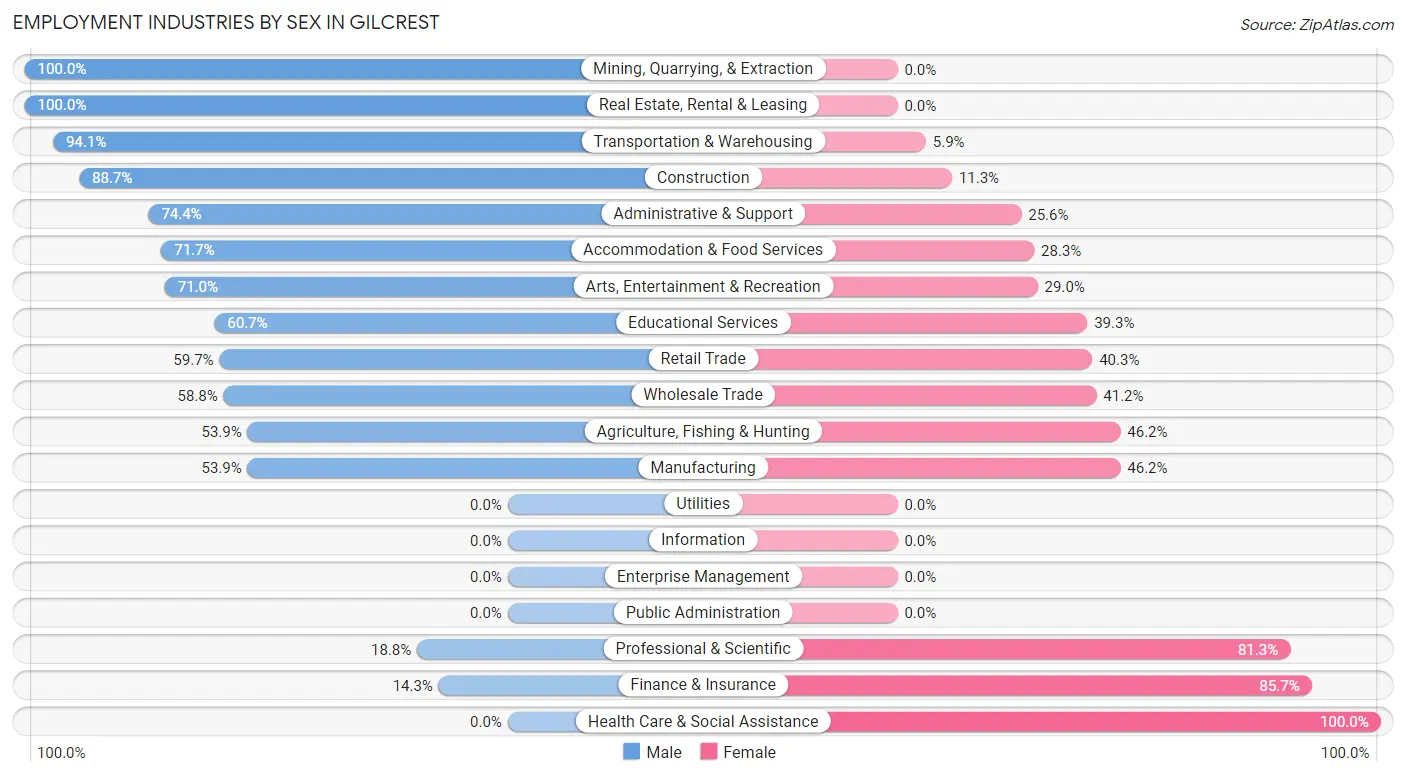
Employment Industries by Sex in Gilcrest
The Gilcrest industries that see more men than women are Mining, Quarrying, & Extraction (100.0%), Real Estate, Rental & Leasing (100.0%), and Transportation & Warehousing (94.1%), whereas the industries that tend to have a higher number of women are Health Care & Social Assistance (100.0%), Finance & Insurance (85.7%), and Professional & Scientific (81.2%).
| Industry | Male | Female |
| Agriculture, Fishing & Hunting | 7 (53.8%) | 6 (46.2%) |
| Mining, Quarrying, & Extraction | 20 (100.0%) | 0 (0.0%) |
| Construction | 55 (88.7%) | 7 (11.3%) |
| Manufacturing | 28 (53.8%) | 24 (46.2%) |
| Wholesale Trade | 10 (58.8%) | 7 (41.2%) |
| Retail Trade | 37 (59.7%) | 25 (40.3%) |
| Transportation & Warehousing | 64 (94.1%) | 4 (5.9%) |
| Utilities | 0 (0.0%) | 0 (0.0%) |
| Information | 0 (0.0%) | 0 (0.0%) |
| Finance & Insurance | 3 (14.3%) | 18 (85.7%) |
| Real Estate, Rental & Leasing | 36 (100.0%) | 0 (0.0%) |
| Professional & Scientific | 6 (18.8%) | 26 (81.2%) |
| Enterprise Management | 0 (0.0%) | 0 (0.0%) |
| Administrative & Support | 29 (74.4%) | 10 (25.6%) |
| Educational Services | 17 (60.7%) | 11 (39.3%) |
| Health Care & Social Assistance | 0 (0.0%) | 36 (100.0%) |
| Arts, Entertainment & Recreation | 22 (71.0%) | 9 (29.0%) |
| Accommodation & Food Services | 38 (71.7%) | 15 (28.3%) |
| Public Administration | 0 (0.0%) | 0 (0.0%) |
| Total | 372 (64.7%) | 203 (35.3%) |
Education in Gilcrest
School Enrollment in Gilcrest
The most common levels of schooling among the 274 students in Gilcrest are high school (74 | 27.0%), elementary school (68 | 24.8%), and middle school (61 | 22.3%).
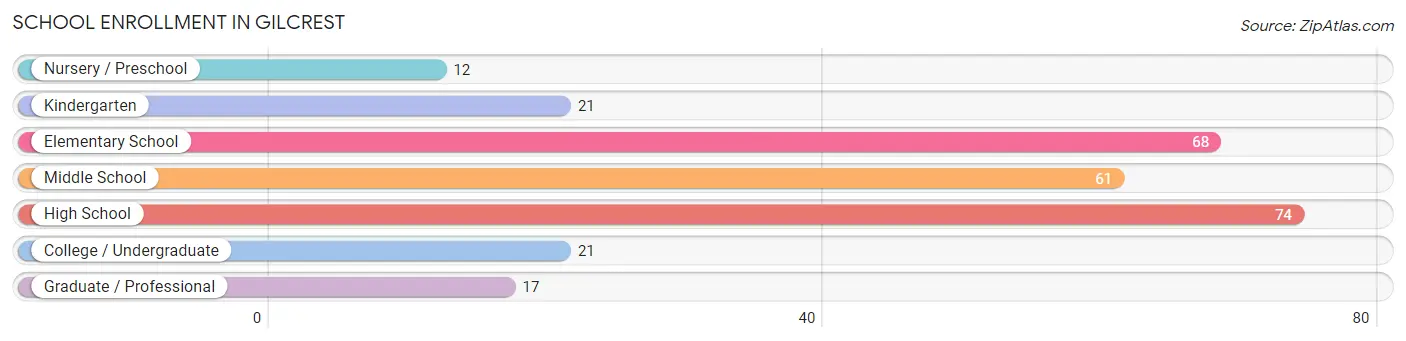
| School Level | # Students | % Students |
| Nursery / Preschool | 12 | 4.4% |
| Kindergarten | 21 | 7.7% |
| Elementary School | 68 | 24.8% |
| Middle School | 61 | 22.3% |
| High School | 74 | 27.0% |
| College / Undergraduate | 21 | 7.7% |
| Graduate / Professional | 17 | 6.2% |
| Total | 274 | 100.0% |
School Enrollment by Age by Funding Source in Gilcrest
Out of a total of 274 students who are enrolled in schools in Gilcrest, 6 (2.2%) attend a private institution, while the remaining 268 (97.8%) are enrolled in public schools. The age group of 35 years and over has the highest likelihood of being enrolled in private schools, with 6 (26.1% in the age bracket) enrolled. Conversely, the age group of 3 to 4 year olds has the lowest likelihood of being enrolled in a private school, with 6 (100.0% in the age bracket) attending a public institution.
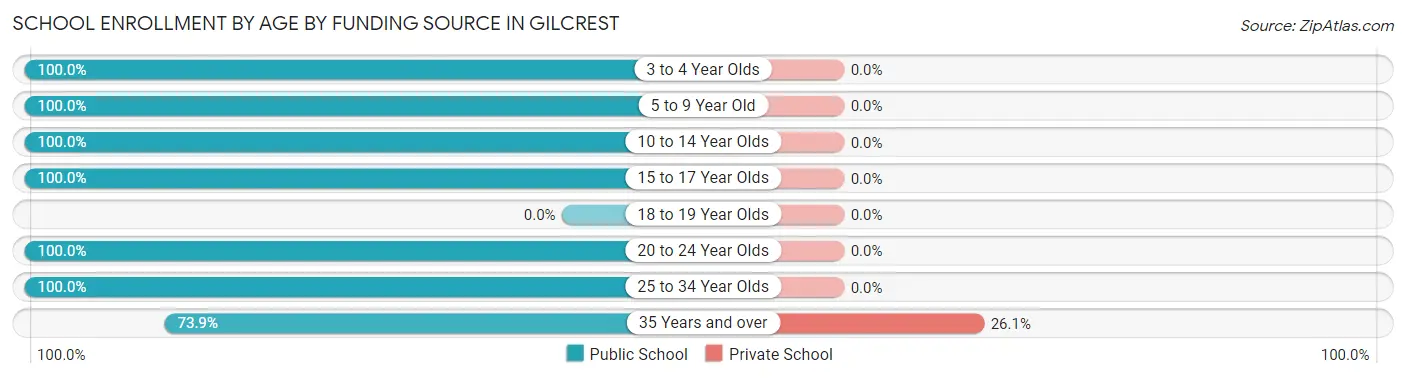
| Age Bracket | Public School | Private School |
| 3 to 4 Year Olds | 6 (100.0%) | 0 (0.0%) |
| 5 to 9 Year Old | 95 (100.0%) | 0 (0.0%) |
| 10 to 14 Year Olds | 61 (100.0%) | 0 (0.0%) |
| 15 to 17 Year Olds | 67 (100.0%) | 0 (0.0%) |
| 18 to 19 Year Olds | 0 (0.0%) | 0 (0.0%) |
| 20 to 24 Year Olds | 8 (100.0%) | 0 (0.0%) |
| 25 to 34 Year Olds | 14 (100.0%) | 0 (0.0%) |
| 35 Years and over | 17 (73.9%) | 6 (26.1%) |
| Total | 268 (97.8%) | 6 (2.2%) |
Educational Attainment by Field of Study in Gilcrest
Business (28 | 48.3%), science & technology (14 | 24.1%), physical & health sciences (8 | 13.8%), education (5 | 8.6%), and bio, nature & agricultural (3 | 5.2%) are the most common fields of study among 58 individuals in Gilcrest who have obtained a bachelor's degree or higher.
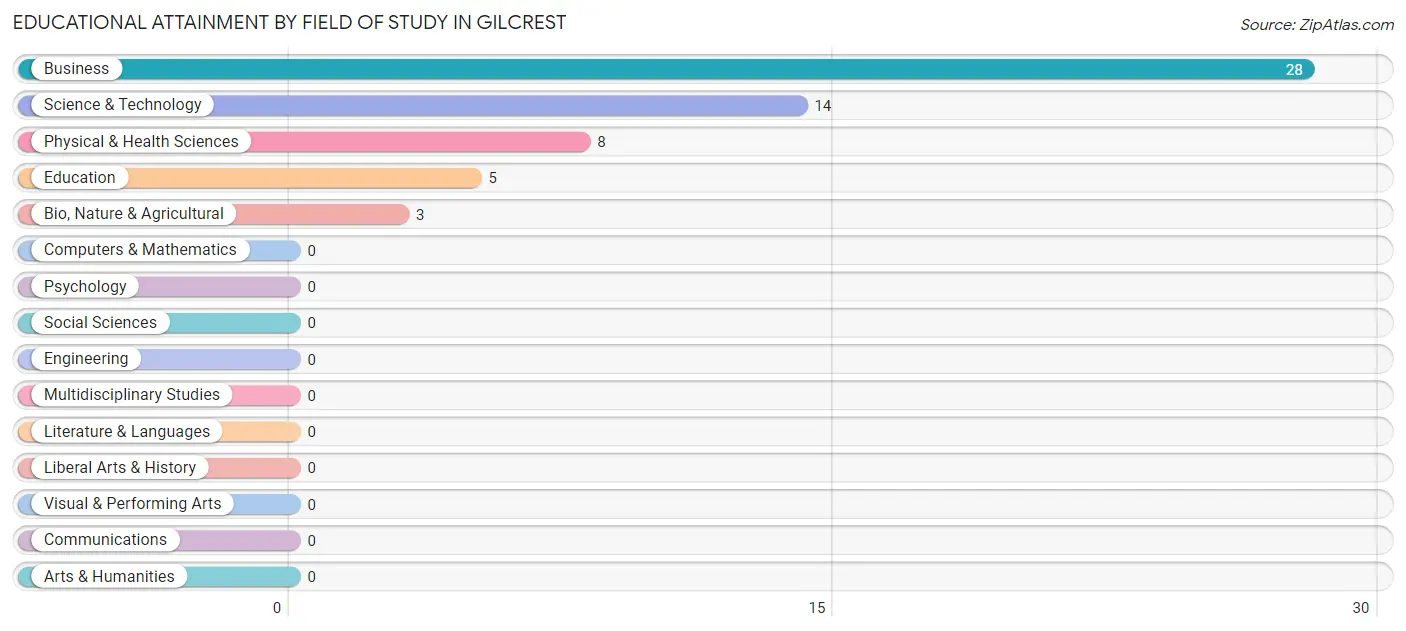
| Field of Study | # Graduates | % Graduates |
| Computers & Mathematics | 0 | 0.0% |
| Bio, Nature & Agricultural | 3 | 5.2% |
| Physical & Health Sciences | 8 | 13.8% |
| Psychology | 0 | 0.0% |
| Social Sciences | 0 | 0.0% |
| Engineering | 0 | 0.0% |
| Multidisciplinary Studies | 0 | 0.0% |
| Science & Technology | 14 | 24.1% |
| Business | 28 | 48.3% |
| Education | 5 | 8.6% |
| Literature & Languages | 0 | 0.0% |
| Liberal Arts & History | 0 | 0.0% |
| Visual & Performing Arts | 0 | 0.0% |
| Communications | 0 | 0.0% |
| Arts & Humanities | 0 | 0.0% |
| Total | 58 | 100.0% |
Transportation & Commute in Gilcrest
Vehicle Availability by Sex in Gilcrest
The most prevalent vehicle ownership categories in Gilcrest are males with 3 vehicles (153, accounting for 43.0%) and females with 3 vehicles (53, making up 77.7%).
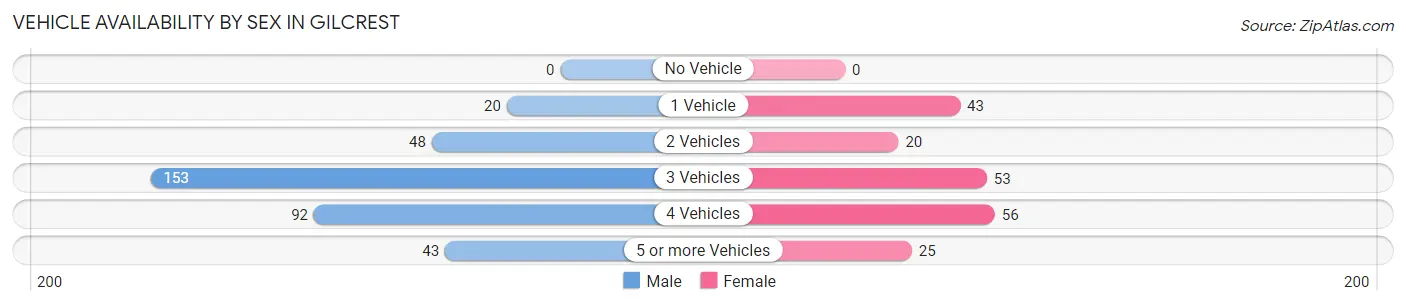
| Vehicles Available | Male | Female |
| No Vehicle | 0 (0.0%) | 0 (0.0%) |
| 1 Vehicle | 20 (5.6%) | 43 (21.8%) |
| 2 Vehicles | 48 (13.5%) | 20 (10.2%) |
| 3 Vehicles | 153 (43.0%) | 53 (26.9%) |
| 4 Vehicles | 92 (25.8%) | 56 (28.4%) |
| 5 or more Vehicles | 43 (12.1%) | 25 (12.7%) |
| Total | 356 (100.0%) | 197 (100.0%) |
Commute Time in Gilcrest
The most frequently occuring commute durations in Gilcrest are 30 to 34 minutes (139 commuters, 25.4%), 20 to 24 minutes (123 commuters, 22.5%), and 90 or more minutes (58 commuters, 10.6%).
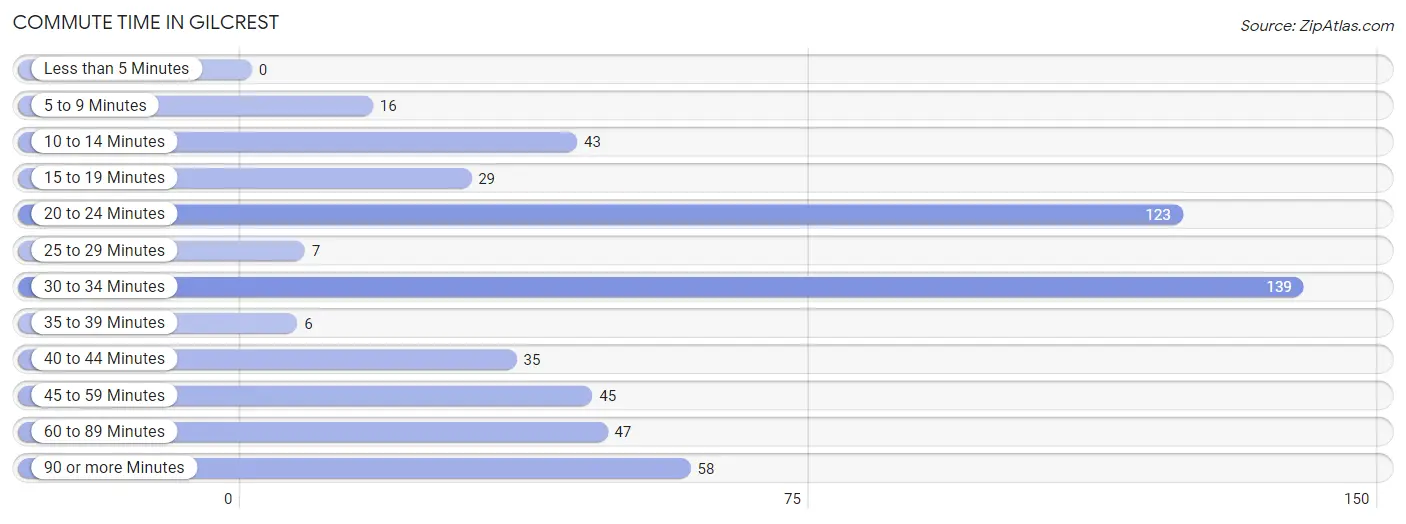
| Commute Time | # Commuters | % Commuters |
| Less than 5 Minutes | 0 | 0.0% |
| 5 to 9 Minutes | 16 | 2.9% |
| 10 to 14 Minutes | 43 | 7.9% |
| 15 to 19 Minutes | 29 | 5.3% |
| 20 to 24 Minutes | 123 | 22.5% |
| 25 to 29 Minutes | 7 | 1.3% |
| 30 to 34 Minutes | 139 | 25.4% |
| 35 to 39 Minutes | 6 | 1.1% |
| 40 to 44 Minutes | 35 | 6.4% |
| 45 to 59 Minutes | 45 | 8.2% |
| 60 to 89 Minutes | 47 | 8.6% |
| 90 or more Minutes | 58 | 10.6% |
Commute Time by Sex in Gilcrest
The most common commute times in Gilcrest are 30 to 34 minutes (96 commuters, 27.0%) for males and 20 to 24 minutes (68 commuters, 35.4%) for females.
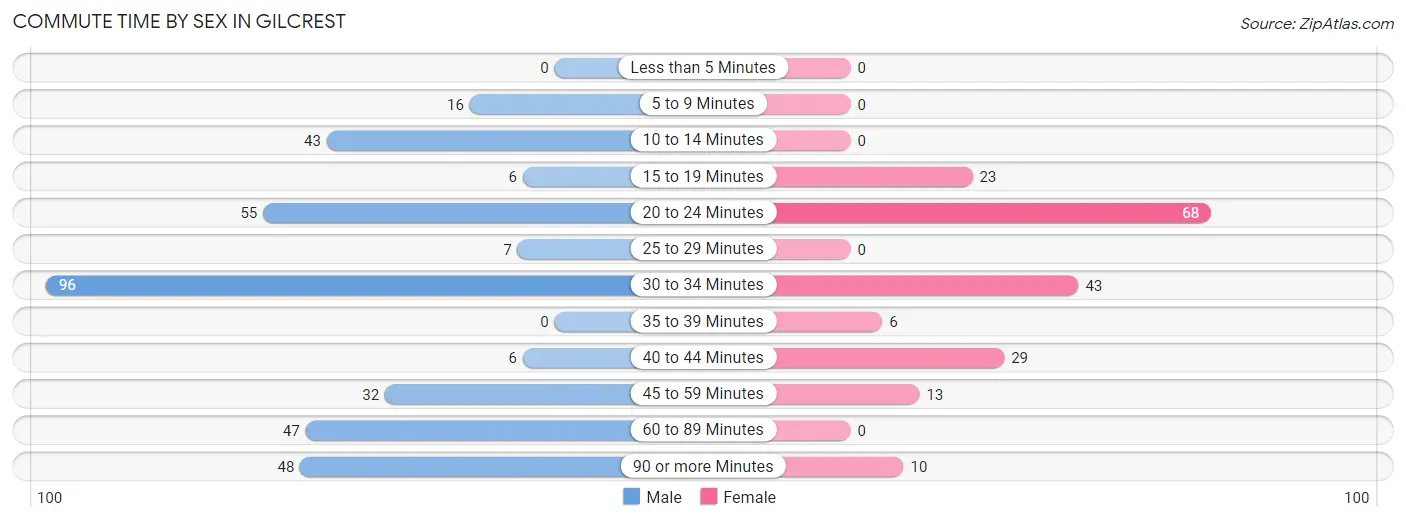
| Commute Time | Male | Female |
| Less than 5 Minutes | 0 (0.0%) | 0 (0.0%) |
| 5 to 9 Minutes | 16 (4.5%) | 0 (0.0%) |
| 10 to 14 Minutes | 43 (12.1%) | 0 (0.0%) |
| 15 to 19 Minutes | 6 (1.7%) | 23 (12.0%) |
| 20 to 24 Minutes | 55 (15.4%) | 68 (35.4%) |
| 25 to 29 Minutes | 7 (2.0%) | 0 (0.0%) |
| 30 to 34 Minutes | 96 (27.0%) | 43 (22.4%) |
| 35 to 39 Minutes | 0 (0.0%) | 6 (3.1%) |
| 40 to 44 Minutes | 6 (1.7%) | 29 (15.1%) |
| 45 to 59 Minutes | 32 (9.0%) | 13 (6.8%) |
| 60 to 89 Minutes | 47 (13.2%) | 0 (0.0%) |
| 90 or more Minutes | 48 (13.5%) | 10 (5.2%) |
Time of Departure to Work by Sex in Gilcrest
The most frequent times of departure to work in Gilcrest are 5:00 AM to 5:29 AM (63, 17.7%) for males and 4:00 PM to 11:59 PM (44, 22.9%) for females.
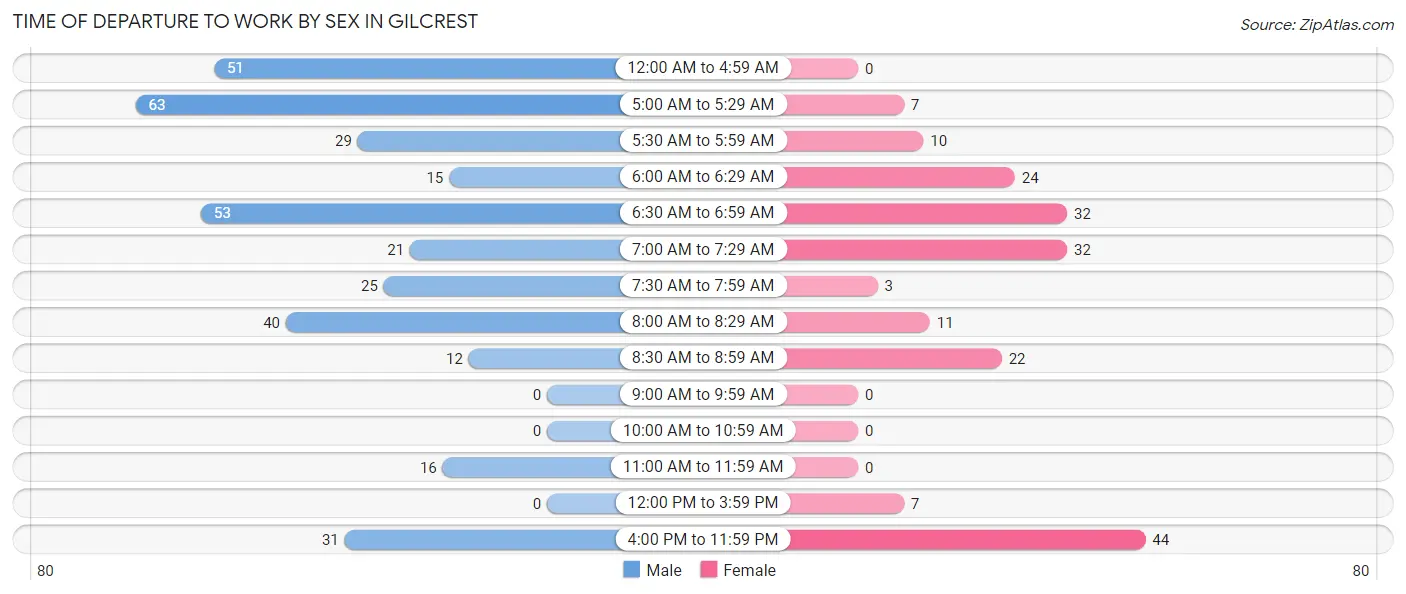
| Time of Departure | Male | Female |
| 12:00 AM to 4:59 AM | 51 (14.3%) | 0 (0.0%) |
| 5:00 AM to 5:29 AM | 63 (17.7%) | 7 (3.6%) |
| 5:30 AM to 5:59 AM | 29 (8.2%) | 10 (5.2%) |
| 6:00 AM to 6:29 AM | 15 (4.2%) | 24 (12.5%) |
| 6:30 AM to 6:59 AM | 53 (14.9%) | 32 (16.7%) |
| 7:00 AM to 7:29 AM | 21 (5.9%) | 32 (16.7%) |
| 7:30 AM to 7:59 AM | 25 (7.0%) | 3 (1.6%) |
| 8:00 AM to 8:29 AM | 40 (11.2%) | 11 (5.7%) |
| 8:30 AM to 8:59 AM | 12 (3.4%) | 22 (11.5%) |
| 9:00 AM to 9:59 AM | 0 (0.0%) | 0 (0.0%) |
| 10:00 AM to 10:59 AM | 0 (0.0%) | 0 (0.0%) |
| 11:00 AM to 11:59 AM | 16 (4.5%) | 0 (0.0%) |
| 12:00 PM to 3:59 PM | 0 (0.0%) | 7 (3.6%) |
| 4:00 PM to 11:59 PM | 31 (8.7%) | 44 (22.9%) |
| Total | 356 (100.0%) | 192 (100.0%) |
Housing Occupancy in Gilcrest
Occupancy by Ownership in Gilcrest
Of the total 304 dwellings in Gilcrest, owner-occupied units account for 261 (85.9%), while renter-occupied units make up 43 (14.1%).
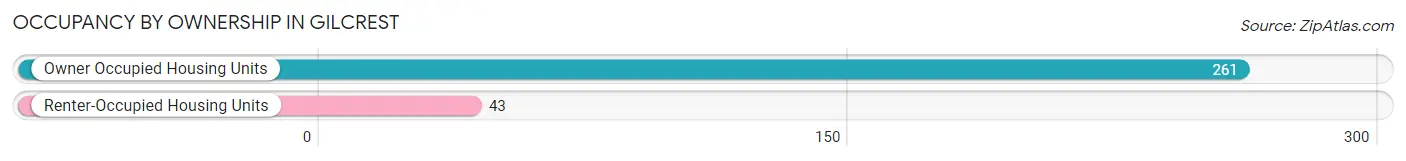
| Occupancy | # Housing Units | % Housing Units |
| Owner Occupied Housing Units | 261 | 85.9% |
| Renter-Occupied Housing Units | 43 | 14.1% |
| Total Occupied Housing Units | 304 | 100.0% |
Occupancy by Household Size in Gilcrest
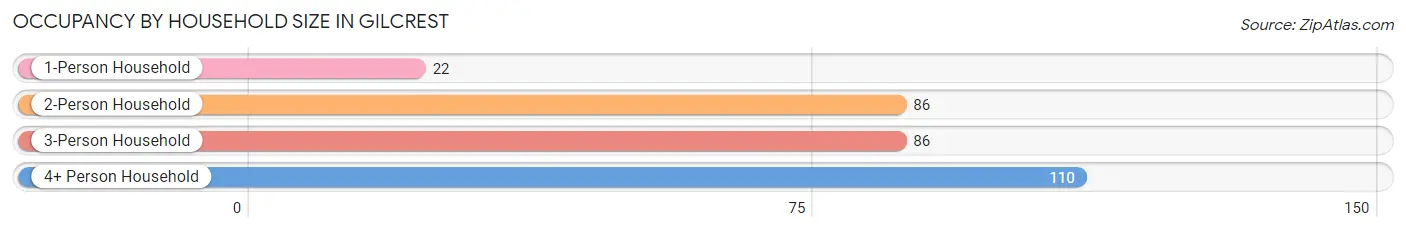
| Household Size | # Housing Units | % Housing Units |
| 1-Person Household | 22 | 7.2% |
| 2-Person Household | 86 | 28.3% |
| 3-Person Household | 86 | 28.3% |
| 4+ Person Household | 110 | 36.2% |
| Total Housing Units | 304 | 100.0% |
Occupancy by Ownership by Household Size in Gilcrest
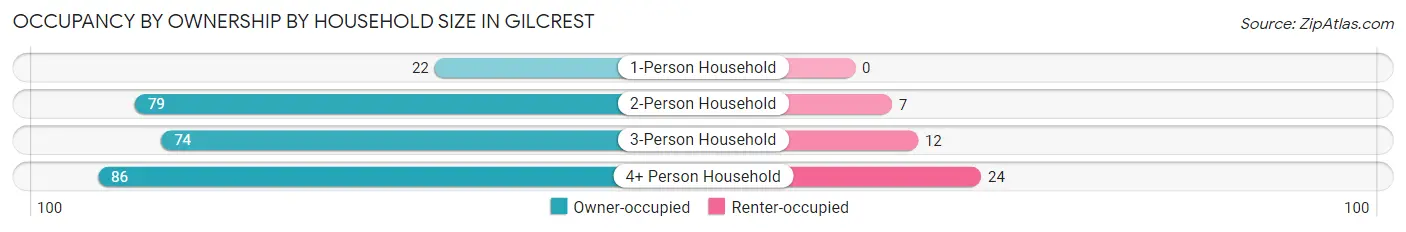
| Household Size | Owner-occupied | Renter-occupied |
| 1-Person Household | 22 (100.0%) | 0 (0.0%) |
| 2-Person Household | 79 (91.9%) | 7 (8.1%) |
| 3-Person Household | 74 (86.1%) | 12 (14.0%) |
| 4+ Person Household | 86 (78.2%) | 24 (21.8%) |
| Total Housing Units | 261 (85.9%) | 43 (14.1%) |
Occupancy by Educational Attainment in Gilcrest
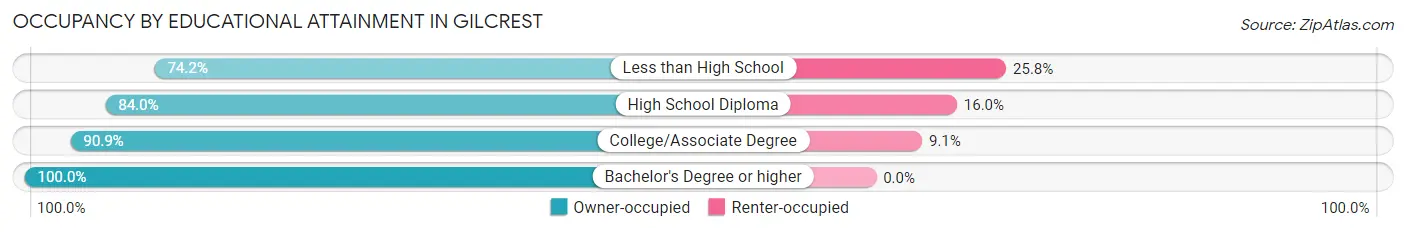
| Household Size | Owner-occupied | Renter-occupied |
| Less than High School | 49 (74.2%) | 17 (25.8%) |
| High School Diploma | 84 (84.0%) | 16 (16.0%) |
| College/Associate Degree | 100 (90.9%) | 10 (9.1%) |
| Bachelor's Degree or higher | 28 (100.0%) | 0 (0.0%) |
Occupancy by Age of Householder in Gilcrest
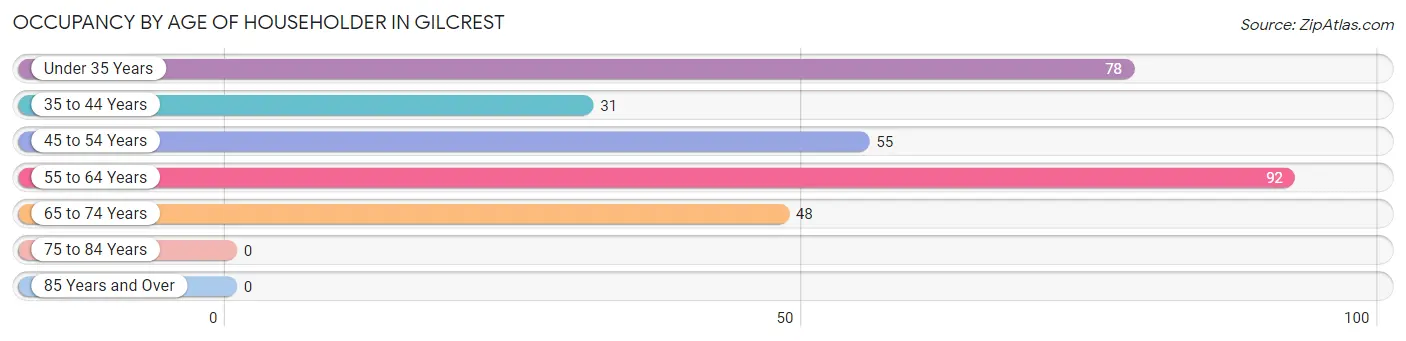
| Age Bracket | # Households | % Households |
| Under 35 Years | 78 | 25.7% |
| 35 to 44 Years | 31 | 10.2% |
| 45 to 54 Years | 55 | 18.1% |
| 55 to 64 Years | 92 | 30.3% |
| 65 to 74 Years | 48 | 15.8% |
| 75 to 84 Years | 0 | 0.0% |
| 85 Years and Over | 0 | 0.0% |
| Total | 304 | 100.0% |
Housing Finances in Gilcrest
Median Income by Occupancy in Gilcrest
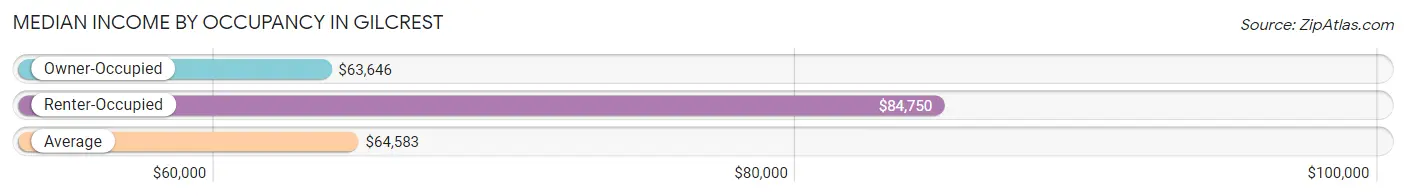
| Occupancy Type | # Households | Median Income |
| Owner-Occupied | 261 (85.9%) | $63,646 |
| Renter-Occupied | 43 (14.1%) | $84,750 |
| Average | 304 (100.0%) | $64,583 |
Occupancy by Householder Income Bracket in Gilcrest
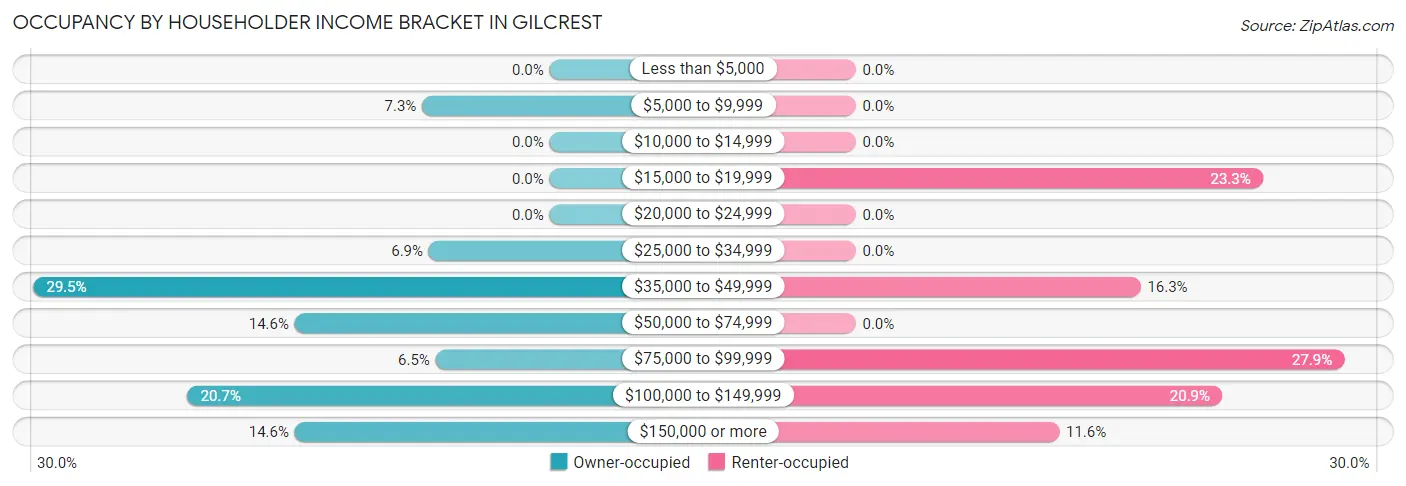
| Income Bracket | Owner-occupied | Renter-occupied |
| Less than $5,000 | 0 (0.0%) | 0 (0.0%) |
| $5,000 to $9,999 | 19 (7.3%) | 0 (0.0%) |
| $10,000 to $14,999 | 0 (0.0%) | 0 (0.0%) |
| $15,000 to $19,999 | 0 (0.0%) | 10 (23.3%) |
| $20,000 to $24,999 | 0 (0.0%) | 0 (0.0%) |
| $25,000 to $34,999 | 18 (6.9%) | 0 (0.0%) |
| $35,000 to $49,999 | 77 (29.5%) | 7 (16.3%) |
| $50,000 to $74,999 | 38 (14.6%) | 0 (0.0%) |
| $75,000 to $99,999 | 17 (6.5%) | 12 (27.9%) |
| $100,000 to $149,999 | 54 (20.7%) | 9 (20.9%) |
| $150,000 or more | 38 (14.6%) | 5 (11.6%) |
| Total | 261 (100.0%) | 43 (100.0%) |
Monthly Housing Cost Tiers in Gilcrest
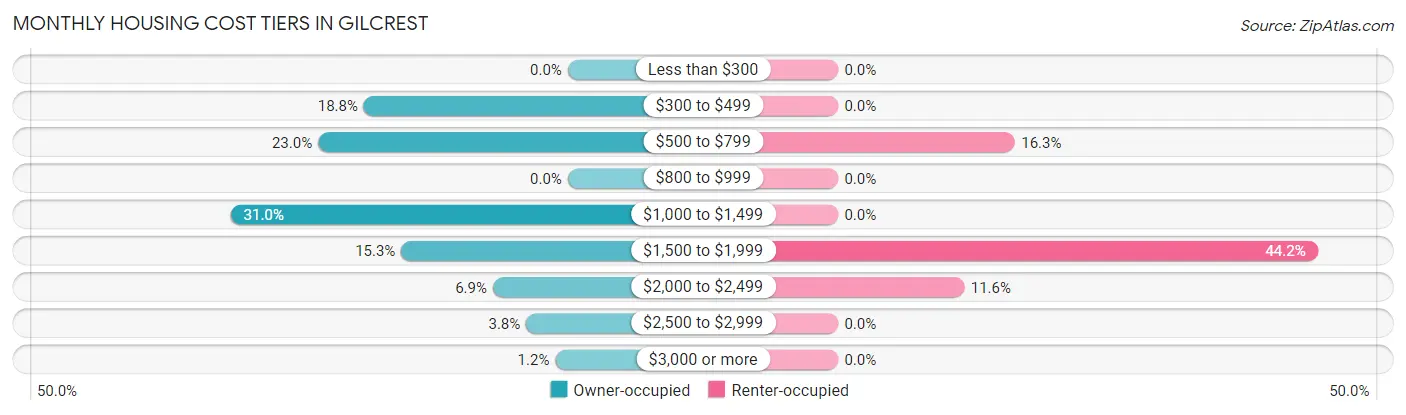
| Monthly Cost | Owner-occupied | Renter-occupied |
| Less than $300 | 0 (0.0%) | 0 (0.0%) |
| $300 to $499 | 49 (18.8%) | 0 (0.0%) |
| $500 to $799 | 60 (23.0%) | 7 (16.3%) |
| $800 to $999 | 0 (0.0%) | 0 (0.0%) |
| $1,000 to $1,499 | 81 (31.0%) | 0 (0.0%) |
| $1,500 to $1,999 | 40 (15.3%) | 19 (44.2%) |
| $2,000 to $2,499 | 18 (6.9%) | 5 (11.6%) |
| $2,500 to $2,999 | 10 (3.8%) | 0 (0.0%) |
| $3,000 or more | 3 (1.1%) | 0 (0.0%) |
| Total | 261 (100.0%) | 43 (100.0%) |
Physical Housing Characteristics in Gilcrest
Housing Structures in Gilcrest
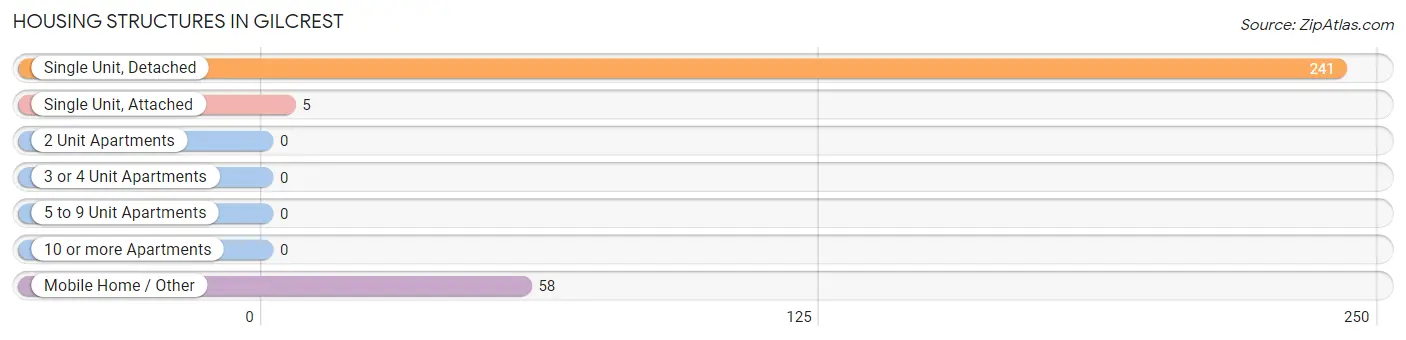
| Structure Type | # Housing Units | % Housing Units |
| Single Unit, Detached | 241 | 79.3% |
| Single Unit, Attached | 5 | 1.6% |
| 2 Unit Apartments | 0 | 0.0% |
| 3 or 4 Unit Apartments | 0 | 0.0% |
| 5 to 9 Unit Apartments | 0 | 0.0% |
| 10 or more Apartments | 0 | 0.0% |
| Mobile Home / Other | 58 | 19.1% |
| Total | 304 | 100.0% |
Housing Structures by Occupancy in Gilcrest
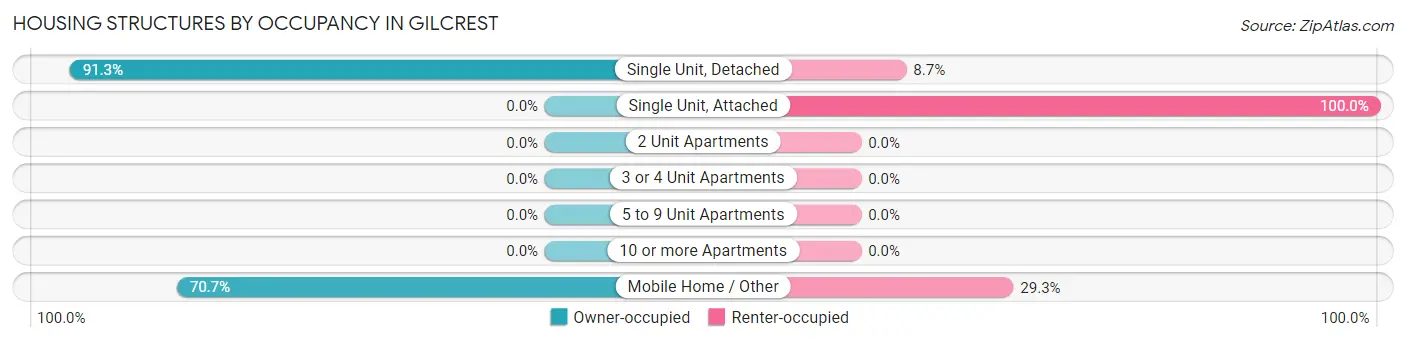
| Structure Type | Owner-occupied | Renter-occupied |
| Single Unit, Detached | 220 (91.3%) | 21 (8.7%) |
| Single Unit, Attached | 0 (0.0%) | 5 (100.0%) |
| 2 Unit Apartments | 0 (0.0%) | 0 (0.0%) |
| 3 or 4 Unit Apartments | 0 (0.0%) | 0 (0.0%) |
| 5 to 9 Unit Apartments | 0 (0.0%) | 0 (0.0%) |
| 10 or more Apartments | 0 (0.0%) | 0 (0.0%) |
| Mobile Home / Other | 41 (70.7%) | 17 (29.3%) |
| Total | 261 (85.9%) | 43 (14.1%) |
Housing Structures by Number of Rooms in Gilcrest
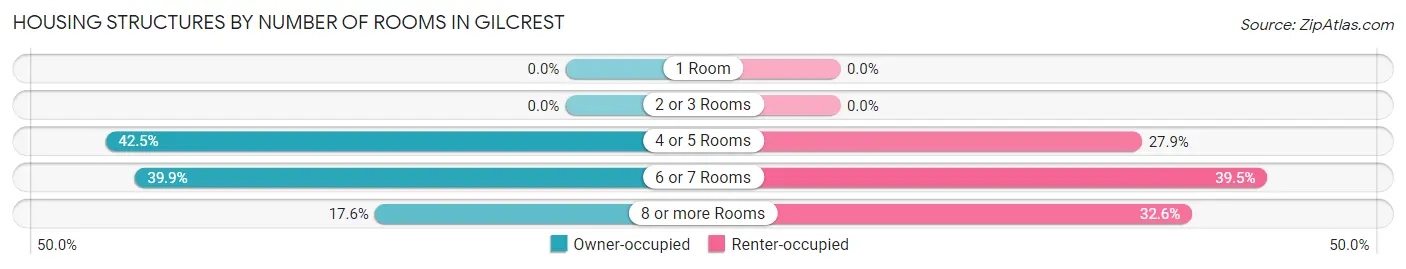
| Number of Rooms | Owner-occupied | Renter-occupied |
| 1 Room | 0 (0.0%) | 0 (0.0%) |
| 2 or 3 Rooms | 0 (0.0%) | 0 (0.0%) |
| 4 or 5 Rooms | 111 (42.5%) | 12 (27.9%) |
| 6 or 7 Rooms | 104 (39.9%) | 17 (39.5%) |
| 8 or more Rooms | 46 (17.6%) | 14 (32.6%) |
| Total | 261 (100.0%) | 43 (100.0%) |
Housing Structure by Heating Type in Gilcrest
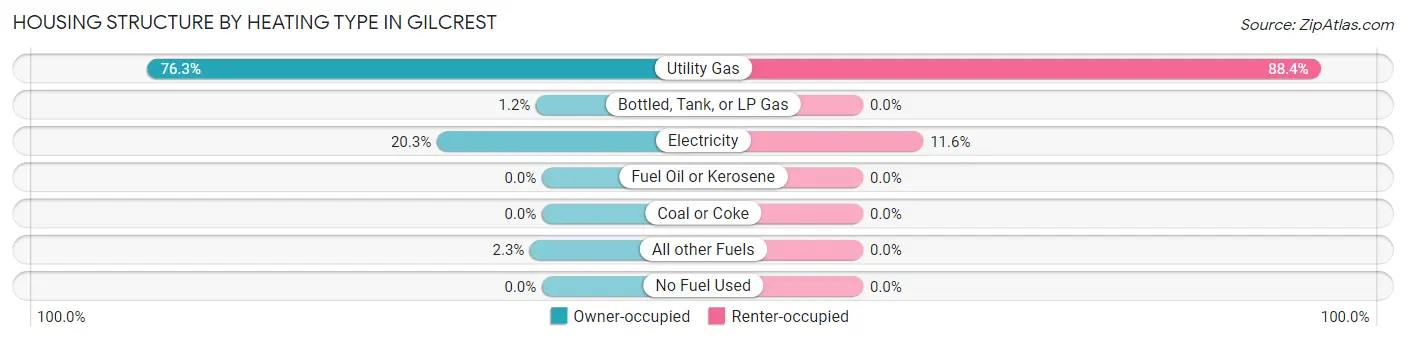
| Heating Type | Owner-occupied | Renter-occupied |
| Utility Gas | 199 (76.2%) | 38 (88.4%) |
| Bottled, Tank, or LP Gas | 3 (1.1%) | 0 (0.0%) |
| Electricity | 53 (20.3%) | 5 (11.6%) |
| Fuel Oil or Kerosene | 0 (0.0%) | 0 (0.0%) |
| Coal or Coke | 0 (0.0%) | 0 (0.0%) |
| All other Fuels | 6 (2.3%) | 0 (0.0%) |
| No Fuel Used | 0 (0.0%) | 0 (0.0%) |
| Total | 261 (100.0%) | 43 (100.0%) |
Household Vehicle Usage in Gilcrest
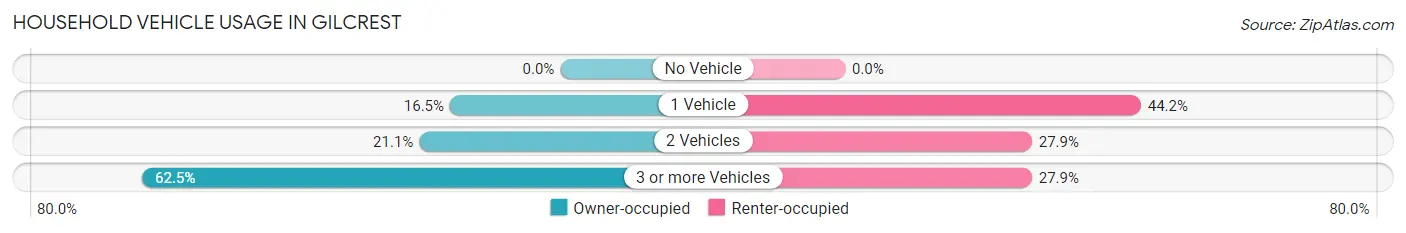
| Vehicles per Household | Owner-occupied | Renter-occupied |
| No Vehicle | 0 (0.0%) | 0 (0.0%) |
| 1 Vehicle | 43 (16.5%) | 19 (44.2%) |
| 2 Vehicles | 55 (21.1%) | 12 (27.9%) |
| 3 or more Vehicles | 163 (62.5%) | 12 (27.9%) |
| Total | 261 (100.0%) | 43 (100.0%) |
Real Estate & Mortgages in Gilcrest
Real Estate and Mortgage Overview in Gilcrest
| Characteristic | Without Mortgage | With Mortgage |
| Housing Units | 90 | 171 |
| Median Property Value | - | - |
| Median Household Income | $63,542 | $33 |
| Monthly Housing Costs | $594 | $3 |
| Real Estate Taxes | - | - |
Property Value by Mortgage Status in Gilcrest
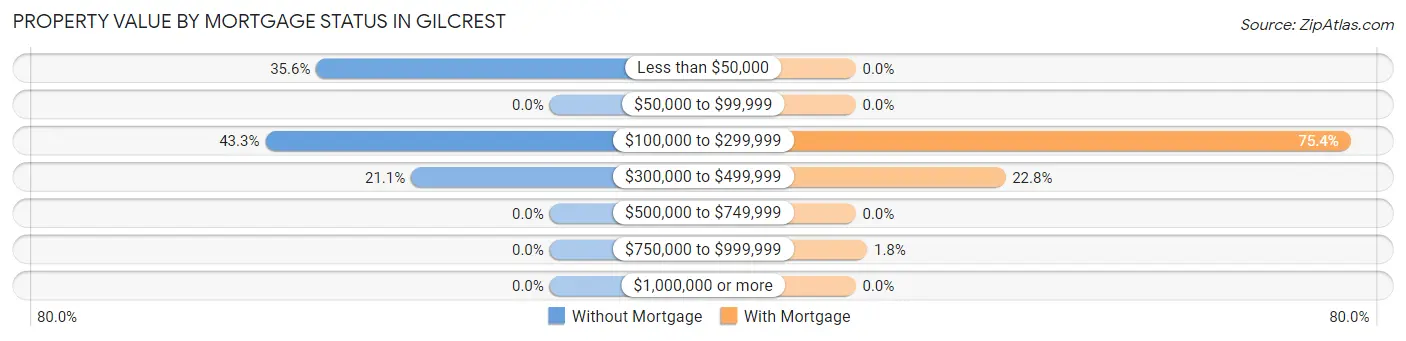
| Property Value | Without Mortgage | With Mortgage |
| Less than $50,000 | 32 (35.6%) | 0 (0.0%) |
| $50,000 to $99,999 | 0 (0.0%) | 0 (0.0%) |
| $100,000 to $299,999 | 39 (43.3%) | 129 (75.4%) |
| $300,000 to $499,999 | 19 (21.1%) | 39 (22.8%) |
| $500,000 to $749,999 | 0 (0.0%) | 0 (0.0%) |
| $750,000 to $999,999 | 0 (0.0%) | 3 (1.8%) |
| $1,000,000 or more | 0 (0.0%) | 0 (0.0%) |
| Total | 90 (100.0%) | 171 (100.0%) |
Household Income by Mortgage Status in Gilcrest
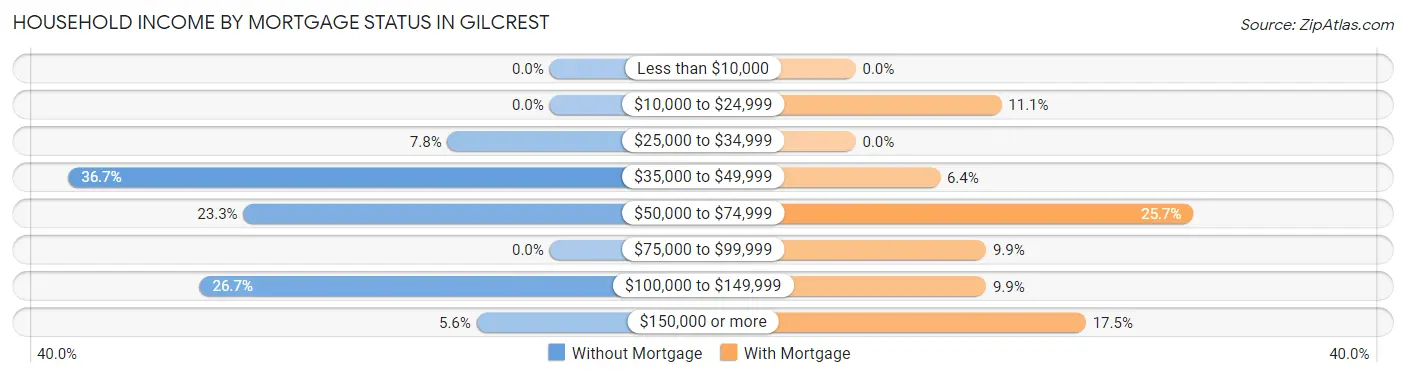
| Household Income | Without Mortgage | With Mortgage |
| Less than $10,000 | 0 (0.0%) | 0 (0.0%) |
| $10,000 to $24,999 | 0 (0.0%) | 19 (11.1%) |
| $25,000 to $34,999 | 7 (7.8%) | 0 (0.0%) |
| $35,000 to $49,999 | 33 (36.7%) | 11 (6.4%) |
| $50,000 to $74,999 | 21 (23.3%) | 44 (25.7%) |
| $75,000 to $99,999 | 0 (0.0%) | 17 (9.9%) |
| $100,000 to $149,999 | 24 (26.7%) | 17 (9.9%) |
| $150,000 or more | 5 (5.6%) | 30 (17.5%) |
| Total | 90 (100.0%) | 171 (100.0%) |
Property Value to Household Income Ratio in Gilcrest
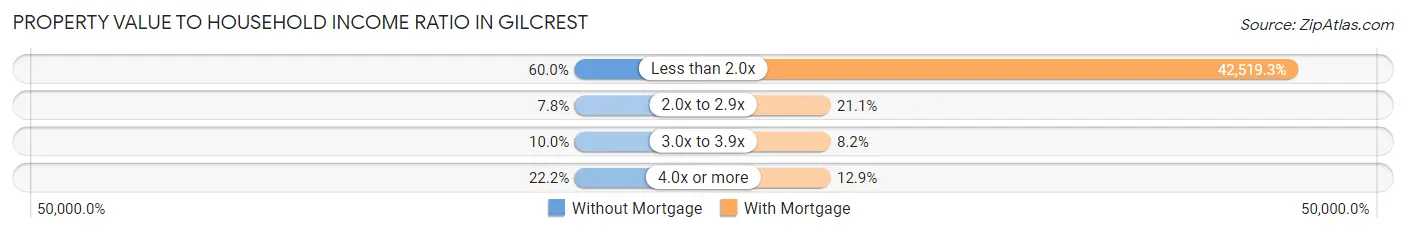
| Value-to-Income Ratio | Without Mortgage | With Mortgage |
| Less than 2.0x | 54 (60.0%) | 72,708 (42,519.3%) |
| 2.0x to 2.9x | 7 (7.8%) | 36 (21.0%) |
| 3.0x to 3.9x | 9 (10.0%) | 14 (8.2%) |
| 4.0x or more | 20 (22.2%) | 22 (12.9%) |
| Total | 90 (100.0%) | 171 (100.0%) |
Real Estate Taxes by Mortgage Status in Gilcrest
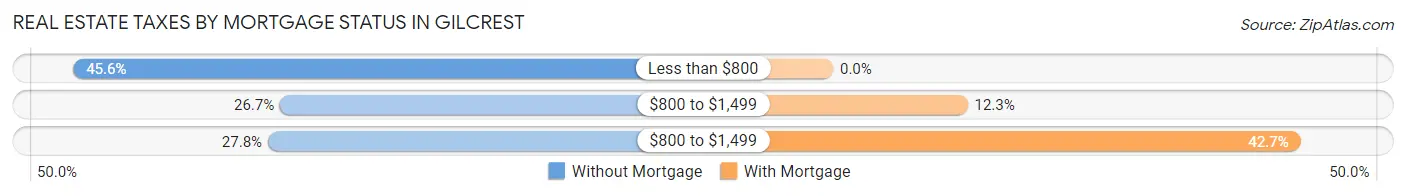
| Property Taxes | Without Mortgage | With Mortgage |
| Less than $800 | 41 (45.6%) | 0 (0.0%) |
| $800 to $1,499 | 24 (26.7%) | 21 (12.3%) |
| $800 to $1,499 | 25 (27.8%) | 73 (42.7%) |
| Total | 90 (100.0%) | 171 (100.0%) |
Health & Disability in Gilcrest
Health Insurance Coverage by Age in Gilcrest
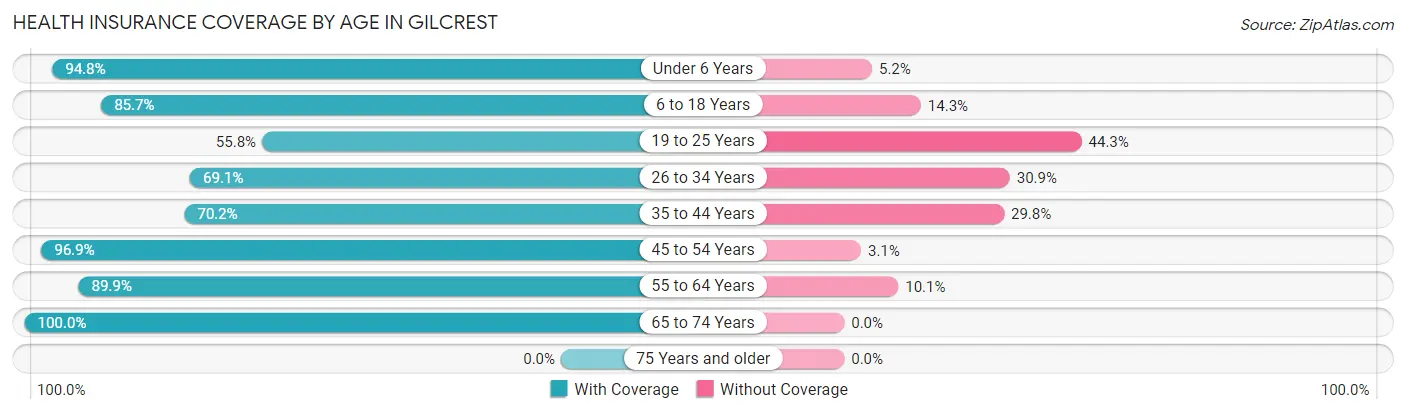
| Age Bracket | With Coverage | Without Coverage |
| Under 6 Years | 110 (94.8%) | 6 (5.2%) |
| 6 to 18 Years | 186 (85.7%) | 31 (14.3%) |
| 19 to 25 Years | 63 (55.7%) | 50 (44.3%) |
| 26 to 34 Years | 112 (69.1%) | 50 (30.9%) |
| 35 to 44 Years | 99 (70.2%) | 42 (29.8%) |
| 45 to 54 Years | 124 (96.9%) | 4 (3.1%) |
| 55 to 64 Years | 125 (89.9%) | 14 (10.1%) |
| 65 to 74 Years | 66 (100.0%) | 0 (0.0%) |
| 75 Years and older | 0 (0.0%) | 0 (0.0%) |
| Total | 885 (81.8%) | 197 (18.2%) |
Health Insurance Coverage by Citizenship Status in Gilcrest
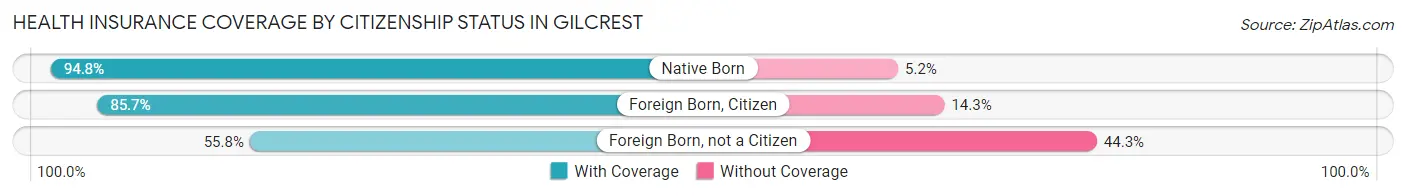
| Citizenship Status | With Coverage | Without Coverage |
| Native Born | 110 (94.8%) | 6 (5.2%) |
| Foreign Born, Citizen | 186 (85.7%) | 31 (14.3%) |
| Foreign Born, not a Citizen | 63 (55.7%) | 50 (44.3%) |
Health Insurance Coverage by Household Income in Gilcrest
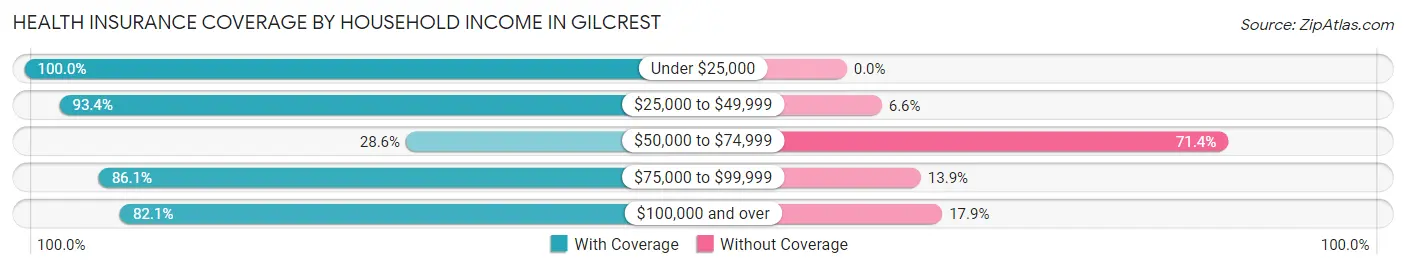
| Household Income | With Coverage | Without Coverage |
| Under $25,000 | 89 (100.0%) | 0 (0.0%) |
| $25,000 to $49,999 | 299 (93.4%) | 21 (6.6%) |
| $50,000 to $74,999 | 32 (28.6%) | 80 (71.4%) |
| $75,000 to $99,999 | 93 (86.1%) | 15 (13.9%) |
| $100,000 and over | 372 (82.1%) | 81 (17.9%) |
Public vs Private Health Insurance Coverage by Age in Gilcrest
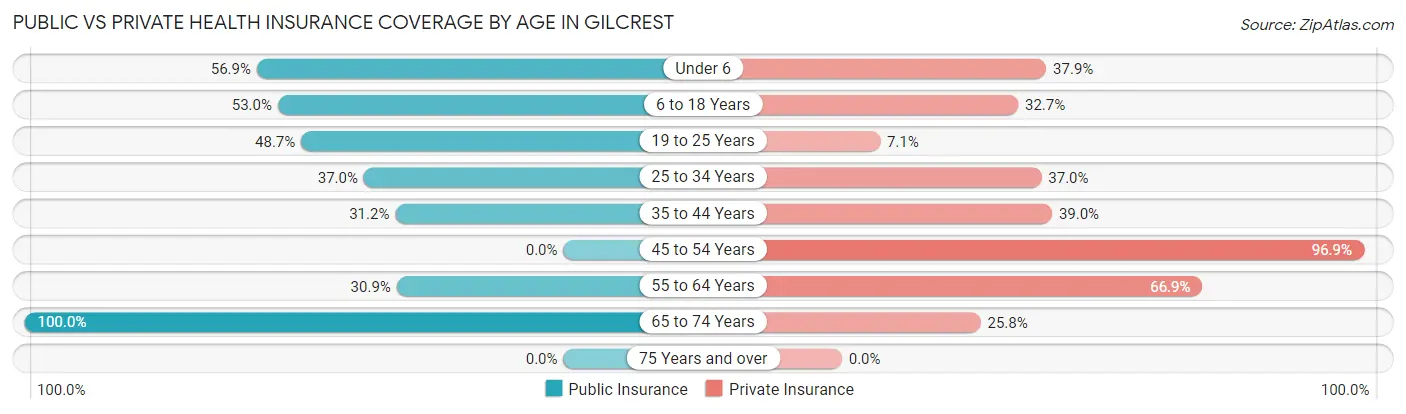
| Age Bracket | Public Insurance | Private Insurance |
| Under 6 | 66 (56.9%) | 44 (37.9%) |
| 6 to 18 Years | 115 (53.0%) | 71 (32.7%) |
| 19 to 25 Years | 55 (48.7%) | 8 (7.1%) |
| 25 to 34 Years | 60 (37.0%) | 60 (37.0%) |
| 35 to 44 Years | 44 (31.2%) | 55 (39.0%) |
| 45 to 54 Years | 0 (0.0%) | 124 (96.9%) |
| 55 to 64 Years | 43 (30.9%) | 93 (66.9%) |
| 65 to 74 Years | 66 (100.0%) | 17 (25.8%) |
| 75 Years and over | 0 (0.0%) | 0 (0.0%) |
| Total | 449 (41.5%) | 472 (43.6%) |
Disability Status by Sex by Age in Gilcrest
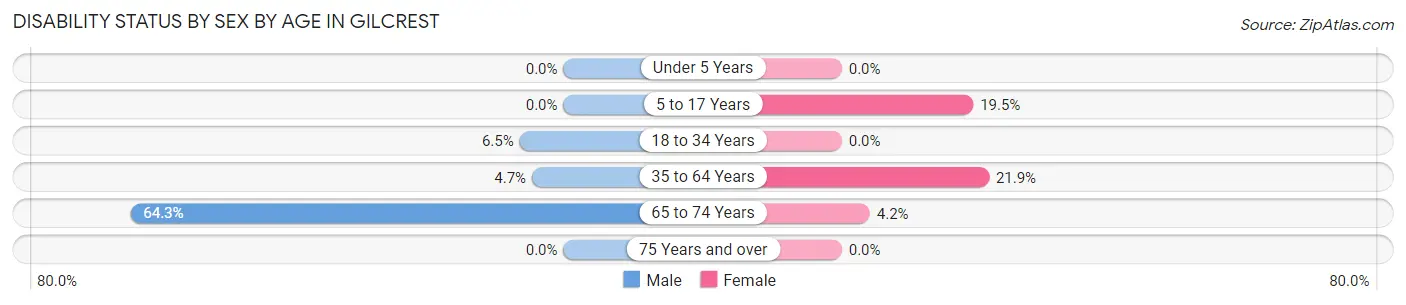
| Age Bracket | Male | Female |
| Under 5 Years | 0 (0.0%) | 0 (0.0%) |
| 5 to 17 Years | 0 (0.0%) | 16 (19.5%) |
| 18 to 34 Years | 11 (6.5%) | 0 (0.0%) |
| 35 to 64 Years | 12 (4.7%) | 33 (21.8%) |
| 65 to 74 Years | 27 (64.3%) | 1 (4.2%) |
| 75 Years and over | 0 (0.0%) | 0 (0.0%) |
Disability Class by Sex by Age in Gilcrest
Disability Class: Hearing Difficulty
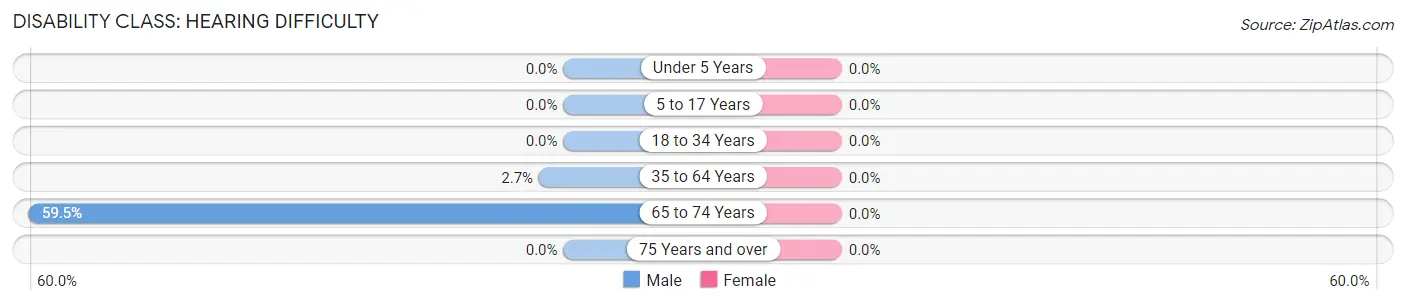
| Age Bracket | Male | Female |
| Under 5 Years | 0 (0.0%) | 0 (0.0%) |
| 5 to 17 Years | 0 (0.0%) | 0 (0.0%) |
| 18 to 34 Years | 0 (0.0%) | 0 (0.0%) |
| 35 to 64 Years | 7 (2.7%) | 0 (0.0%) |
| 65 to 74 Years | 25 (59.5%) | 0 (0.0%) |
| 75 Years and over | 0 (0.0%) | 0 (0.0%) |
Disability Class: Vision Difficulty
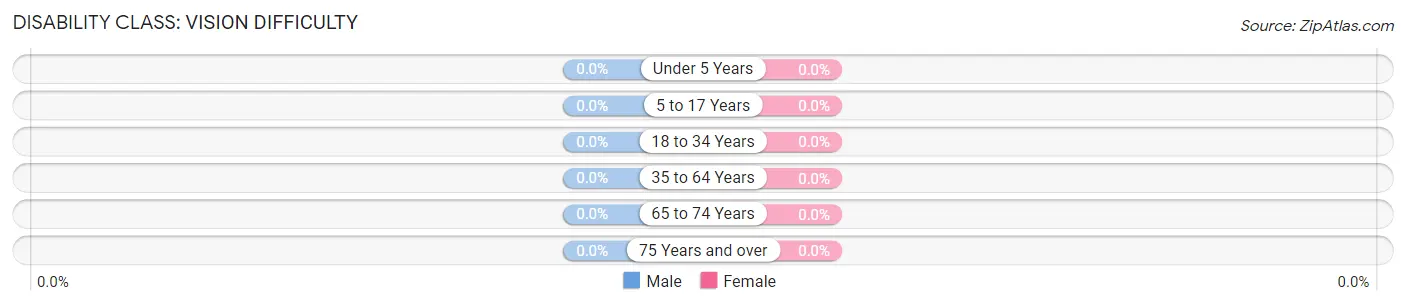
| Age Bracket | Male | Female |
| Under 5 Years | 0 (0.0%) | 0 (0.0%) |
| 5 to 17 Years | 0 (0.0%) | 0 (0.0%) |
| 18 to 34 Years | 0 (0.0%) | 0 (0.0%) |
| 35 to 64 Years | 0 (0.0%) | 0 (0.0%) |
| 65 to 74 Years | 0 (0.0%) | 0 (0.0%) |
| 75 Years and over | 0 (0.0%) | 0 (0.0%) |
Disability Class: Cognitive Difficulty
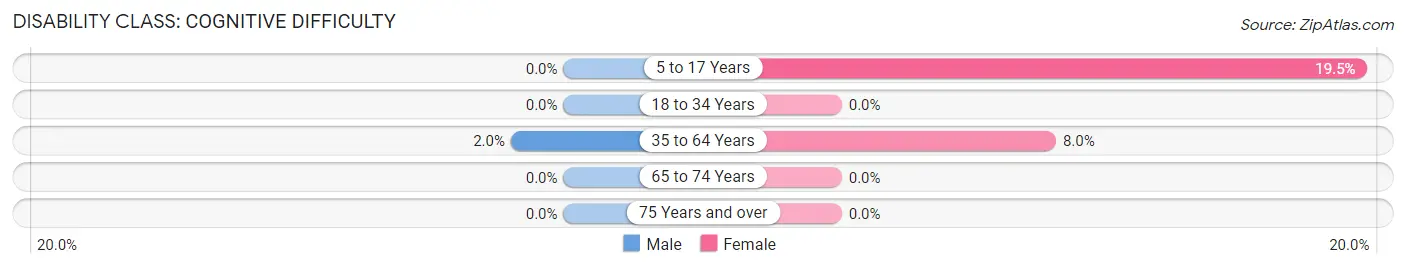
| Age Bracket | Male | Female |
| 5 to 17 Years | 0 (0.0%) | 16 (19.5%) |
| 18 to 34 Years | 0 (0.0%) | 0 (0.0%) |
| 35 to 64 Years | 5 (1.9%) | 12 (8.0%) |
| 65 to 74 Years | 0 (0.0%) | 0 (0.0%) |
| 75 Years and over | 0 (0.0%) | 0 (0.0%) |
Disability Class: Ambulatory Difficulty
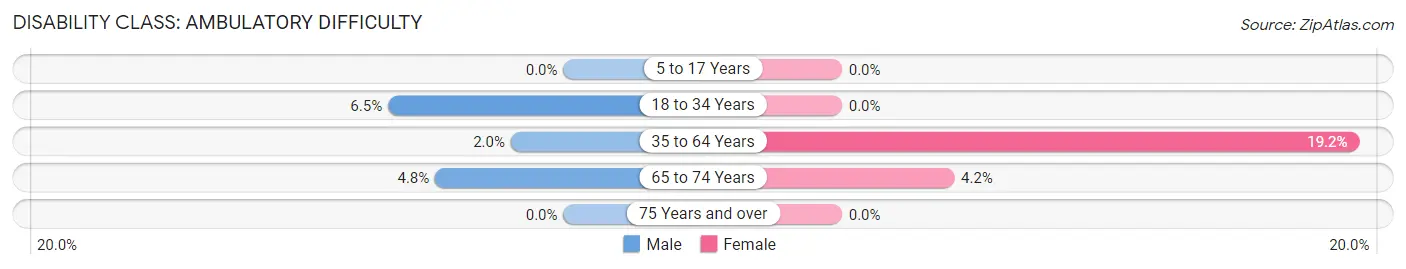
| Age Bracket | Male | Female |
| 5 to 17 Years | 0 (0.0%) | 0 (0.0%) |
| 18 to 34 Years | 11 (6.5%) | 0 (0.0%) |
| 35 to 64 Years | 5 (1.9%) | 29 (19.2%) |
| 65 to 74 Years | 2 (4.8%) | 1 (4.2%) |
| 75 Years and over | 0 (0.0%) | 0 (0.0%) |
Disability Class: Self-Care Difficulty
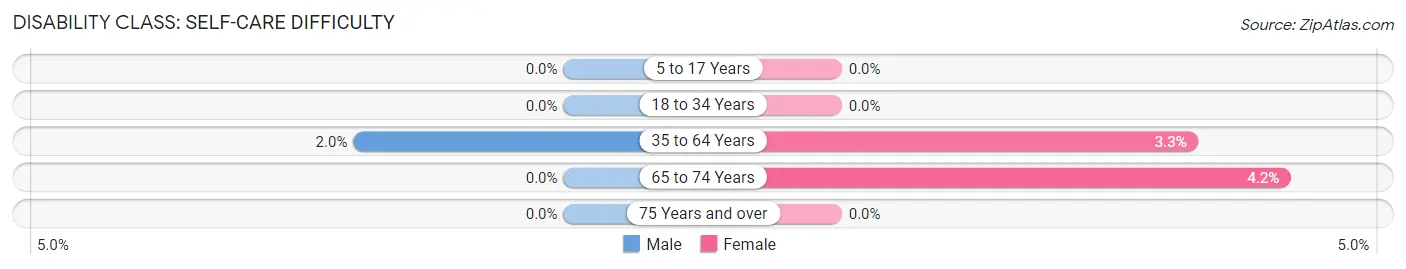
| Age Bracket | Male | Female |
| 5 to 17 Years | 0 (0.0%) | 0 (0.0%) |
| 18 to 34 Years | 0 (0.0%) | 0 (0.0%) |
| 35 to 64 Years | 5 (1.9%) | 5 (3.3%) |
| 65 to 74 Years | 0 (0.0%) | 1 (4.2%) |
| 75 Years and over | 0 (0.0%) | 0 (0.0%) |
Technology Access in Gilcrest
Computing Device Access in Gilcrest
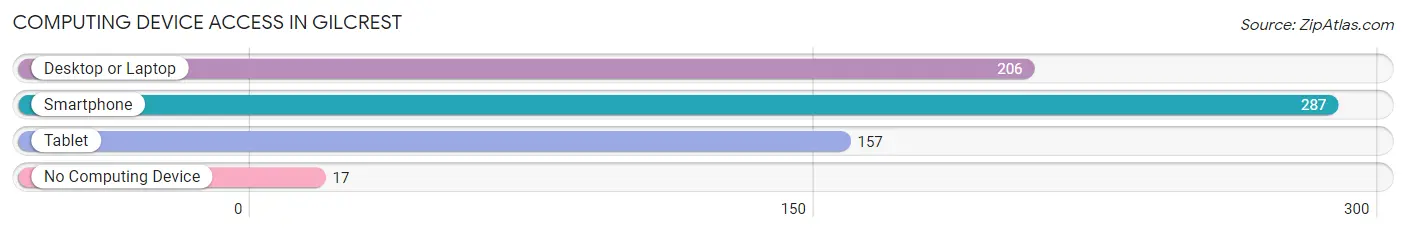
| Device Type | # Households | % Households |
| Desktop or Laptop | 206 | 67.8% |
| Smartphone | 287 | 94.4% |
| Tablet | 157 | 51.6% |
| No Computing Device | 17 | 5.6% |
| Total | 304 | 100.0% |
Internet Access in Gilcrest
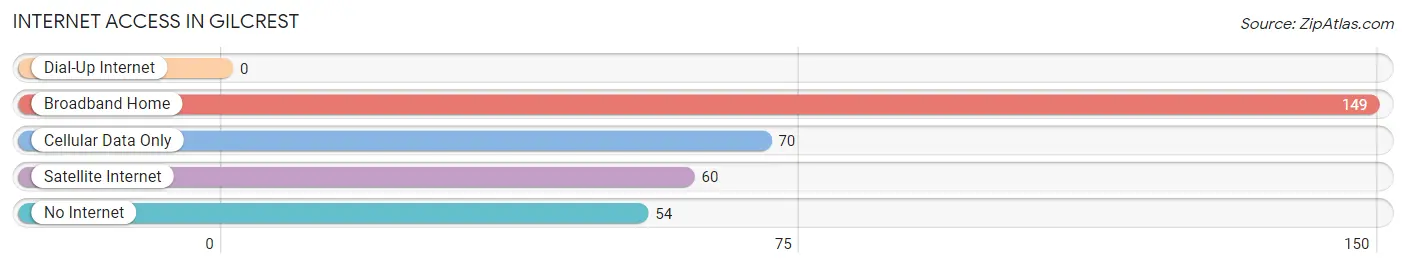
| Internet Type | # Households | % Households |
| Dial-Up Internet | 0 | 0.0% |
| Broadband Home | 149 | 49.0% |
| Cellular Data Only | 70 | 23.0% |
| Satellite Internet | 60 | 19.7% |
| No Internet | 54 | 17.8% |
| Total | 304 | 100.0% |
Gilcrest Summary
Gilcrest is a small town located in Weld County, Colorado. It is situated in the northern part of the state, about 25 miles east of Greeley and about 50 miles northeast of Denver. The town was founded in 1887 and has a population of approximately 1,500 people.
History
Gilcrest was founded in 1887 by William Gilcrest, a rancher from Nebraska. He purchased the land from the Union Pacific Railroad and began to develop the area. The town was originally called Gilcrestville, but the name was changed to Gilcrest in 1895.
The town grew slowly but steadily over the years, and by the early 1900s it had become a thriving agricultural community. The town was home to several businesses, including a general store, a blacksmith shop, a hotel, and a post office.
In the 1920s, the town began to experience a period of growth and prosperity. The Great Western Sugar Company opened a sugar beet processing plant in Gilcrest, and the town became a major center for sugar beet production. The plant provided jobs for many of the town’s residents, and the town’s population grew to over 1,000 people.
The town continued to grow and prosper until the Great Depression hit in the 1930s. The sugar beet plant closed, and many of the town’s residents were forced to leave in search of work. The population of Gilcrest declined to just over 500 people by 1940.
The town slowly began to recover after World War II, and by the 1950s it had regained its former population. The sugar beet plant reopened, and the town’s economy began to diversify. The town’s population has remained relatively stable since then, and it currently stands at around 1,500 people.
Geography
Gilcrest is located in northern Colorado, about 25 miles east of Greeley and about 50 miles northeast of Denver. The town is situated in the South Platte River Valley, and it is surrounded by rolling hills and farmland.
The town is located at an elevation of 4,890 feet above sea level. The climate is semi-arid, with hot summers and cold winters. The average annual precipitation is 16.5 inches, and the average annual temperature is 54 degrees Fahrenheit.
Economy
The economy of Gilcrest is largely based on agriculture. The town is home to several farms, and the surrounding area is used for growing sugar beets, corn, wheat, and other crops. The Great Western Sugar Company operates a sugar beet processing plant in Gilcrest, and this is a major source of employment for the town’s residents.
The town is also home to several small businesses, including a general store, a hardware store, and a few restaurants. There are also several small manufacturing companies located in the area.
Demographics
As of the 2010 census, the population of Gilcrest was 1,500 people. The racial makeup of the town was 94.7% White, 0.7% African American, 0.7% Native American, 0.7% Asian, 0.7% from other races, and 2.7% from two or more races. Hispanic or Latino of any race were 4.7% of the population.
The median household income in Gilcrest was $45,000, and the median family income was $50,000. The per capita income was $20,000. About 10.7% of the population was below the poverty line.
The town is served by the Gilcrest-Weld County School District, which includes one elementary school, one middle school, and one high school. The town also has a public library and a community center.
Common Questions
What is Per Capita Income in Gilcrest?
Per Capita income in Gilcrest is $24,421.
What is the Median Family Income in Gilcrest?
Median Family Income in Gilcrest is $70,556.
What is the Median Household income in Gilcrest?
Median Household Income in Gilcrest is $64,583.
What is Income or Wage Gap in Gilcrest?
Income or Wage Gap in Gilcrest is 0.5%.
Women in Gilcrest earn 99.5 cents for every dollar earned by a man.
What is Inequality or Gini Index in Gilcrest?
Inequality or Gini Index in Gilcrest is 0.37.
What is the Total Population of Gilcrest?
Total Population of Gilcrest is 1,082.
What is the Total Male Population of Gilcrest?
Total Male Population of Gilcrest is 643.
What is the Total Female Population of Gilcrest?
Total Female Population of Gilcrest is 439.
What is the Ratio of Males per 100 Females in Gilcrest?
There are 146.47 Males per 100 Females in Gilcrest.
What is the Ratio of Females per 100 Males in Gilcrest?
There are 68.27 Females per 100 Males in Gilcrest.
What is the Median Population Age in Gilcrest?
Median Population Age in Gilcrest is 29.7 Years.
What is the Average Family Size in Gilcrest
Average Family Size in Gilcrest is 3.6 People.
What is the Average Household Size in Gilcrest
Average Household Size in Gilcrest is 3.6 People.
How Large is the Labor Force in Gilcrest?
There are 575 People in the Labor Forcein in Gilcrest.
What is the Percentage of People in the Labor Force in Gilcrest?
72.0% of People are in the Labor Force in Gilcrest.