Fruitvale, CO Map & Demographics
Fruitvale Map
Fruitvale Overview
$36,024
PER CAPITA INCOME
$87,399
AVG FAMILY INCOME
$71,747
AVG HOUSEHOLD INCOME
24.0%
WAGE / INCOME GAP [ % ]
76.0¢/ $1
WAGE / INCOME GAP [ $ ]
$5,042
FAMILY INCOME DEFICIT
0.39
INEQUALITY / GINI INDEX
8,022
TOTAL POPULATION
3,942
MALE POPULATION
4,080
FEMALE POPULATION
96.62
MALES / 100 FEMALES
103.50
FEMALES / 100 MALES
40.4
MEDIAN AGE
2.9
AVG FAMILY SIZE
2.5
AVG HOUSEHOLD SIZE
4,039
LABOR FORCE [ PEOPLE ]
63.2%
PERCENT IN LABOR FORCE
4.5%
UNEMPLOYMENT RATE
Fruitvale Area Codes
Income in Fruitvale
Income Overview in Fruitvale
Per Capita Income in Fruitvale is $36,024, while median incomes of families and households are $87,399 and $71,747 respectively.
| Characteristic | Number | Measure |
| Per Capita Income | 8,022 | $36,024 |
| Median Family Income | 2,235 | $87,399 |
| Mean Family Income | 2,235 | $103,026 |
| Median Household Income | 3,237 | $71,747 |
| Mean Household Income | 3,237 | $88,361 |
| Income Deficit | 2,235 | $5,042 |
| Wage / Income Gap (%) | 8,022 | 23.96% |
| Wage / Income Gap ($) | 8,022 | 76.04¢ per $1 |
| Gini / Inequality Index | 8,022 | 0.39 |
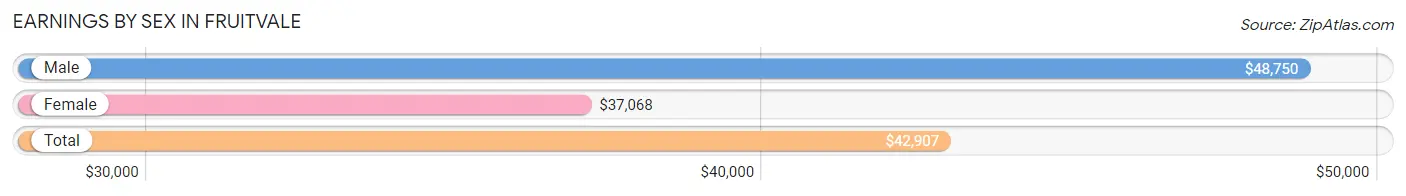
Earnings by Sex in Fruitvale
Average Earnings in Fruitvale are $42,907, $48,750 for men and $37,068 for women, a difference of 24.0%.
| Sex | Number | Average Earnings |
| Male | 2,297 (54.6%) | $48,750 |
| Female | 1,907 (45.4%) | $37,068 |
| Total | 4,204 (100.0%) | $42,907 |
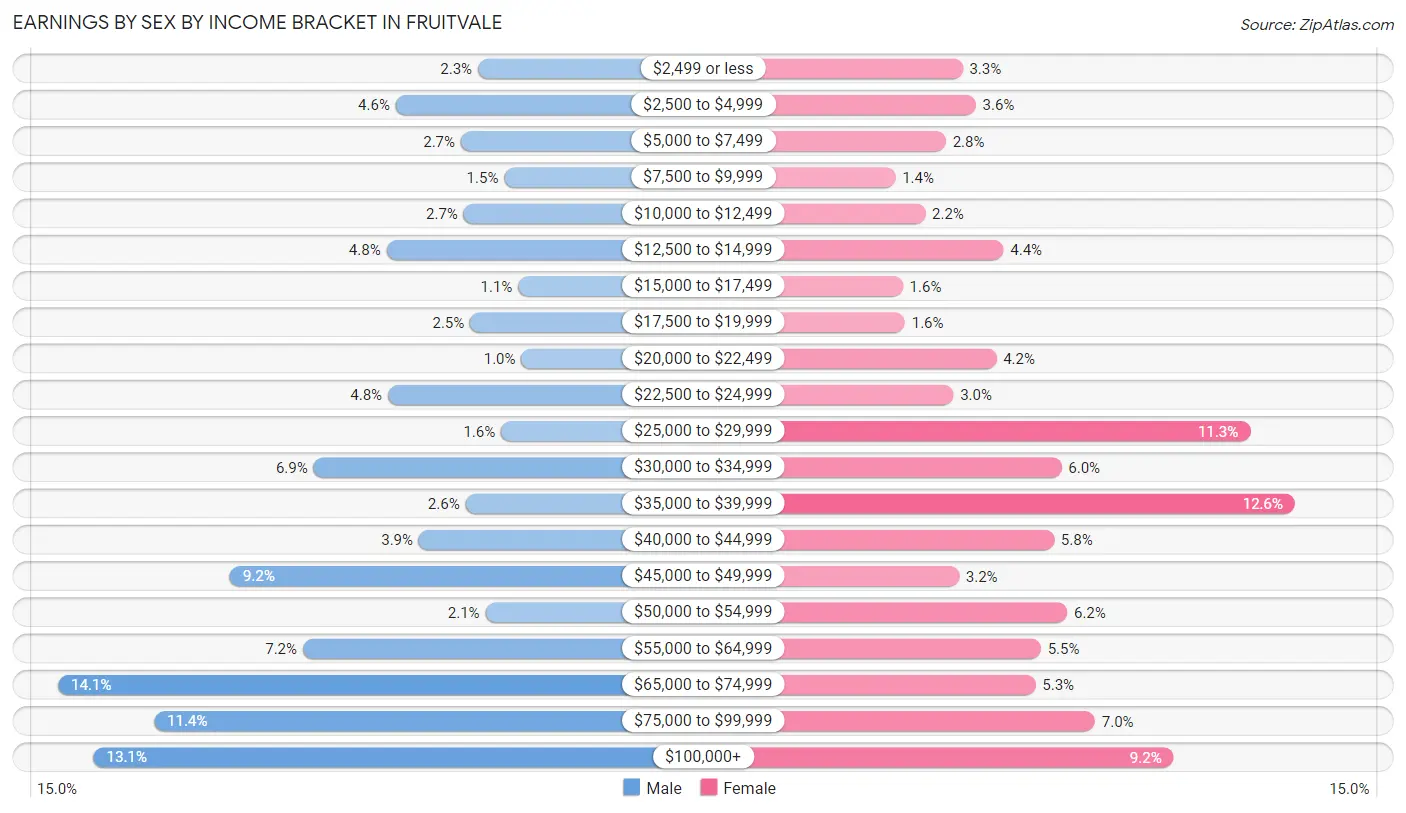
Earnings by Sex by Income Bracket in Fruitvale
The most common earnings brackets in Fruitvale are $65,000 to $74,999 for men (323 | 14.1%) and $35,000 to $39,999 for women (240 | 12.6%).
| Income | Male | Female |
| $2,499 or less | 52 (2.3%) | 62 (3.3%) |
| $2,500 to $4,999 | 105 (4.6%) | 69 (3.6%) |
| $5,000 to $7,499 | 63 (2.7%) | 53 (2.8%) |
| $7,500 to $9,999 | 35 (1.5%) | 26 (1.4%) |
| $10,000 to $12,499 | 61 (2.7%) | 42 (2.2%) |
| $12,500 to $14,999 | 111 (4.8%) | 84 (4.4%) |
| $15,000 to $17,499 | 26 (1.1%) | 30 (1.6%) |
| $17,500 to $19,999 | 57 (2.5%) | 31 (1.6%) |
| $20,000 to $22,499 | 24 (1.0%) | 80 (4.2%) |
| $22,500 to $24,999 | 110 (4.8%) | 57 (3.0%) |
| $25,000 to $29,999 | 37 (1.6%) | 216 (11.3%) |
| $30,000 to $34,999 | 158 (6.9%) | 115 (6.0%) |
| $35,000 to $39,999 | 60 (2.6%) | 240 (12.6%) |
| $40,000 to $44,999 | 90 (3.9%) | 111 (5.8%) |
| $45,000 to $49,999 | 212 (9.2%) | 60 (3.2%) |
| $50,000 to $54,999 | 47 (2.1%) | 118 (6.2%) |
| $55,000 to $64,999 | 165 (7.2%) | 104 (5.4%) |
| $65,000 to $74,999 | 323 (14.1%) | 101 (5.3%) |
| $75,000 to $99,999 | 261 (11.4%) | 133 (7.0%) |
| $100,000+ | 300 (13.1%) | 175 (9.2%) |
| Total | 2,297 (100.0%) | 1,907 (100.0%) |
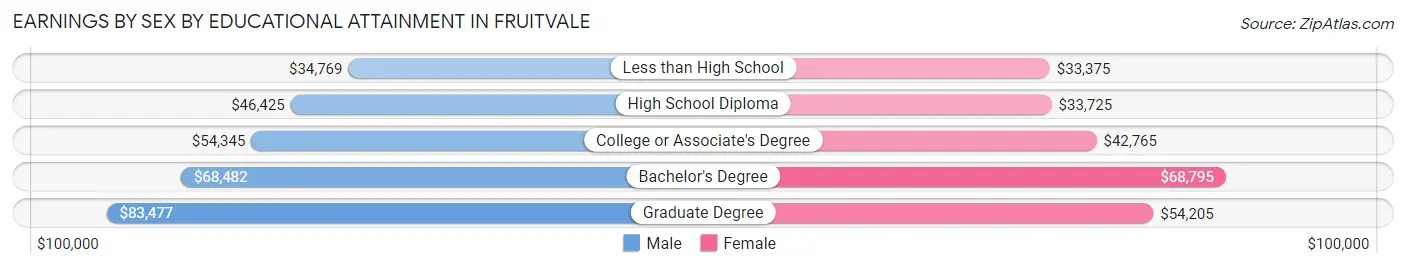
Earnings by Sex by Educational Attainment in Fruitvale
Average earnings in Fruitvale are $59,032 for men and $38,571 for women, a difference of 34.7%. Men with an educational attainment of graduate degree enjoy the highest average annual earnings of $83,477, while those with less than high school education earn the least with $34,769. Women with an educational attainment of bachelor's degree earn the most with the average annual earnings of $68,795, while those with less than high school education have the smallest earnings of $33,375.
| Educational Attainment | Male Income | Female Income |
| Less than High School | $34,769 | $33,375 |
| High School Diploma | $46,425 | $33,725 |
| College or Associate's Degree | $54,345 | $42,765 |
| Bachelor's Degree | $68,482 | $68,795 |
| Graduate Degree | $83,477 | $54,205 |
| Total | $59,032 | $38,571 |
Family Income in Fruitvale
Family Income Brackets in Fruitvale
According to the Fruitvale family income data, there are 465 families falling into the $100,000 to $149,999 income range, which is the most common income bracket and makes up 20.8% of all families. Conversely, the less than $10,000 income bracket is the least frequent group with only 4 families (0.2%) belonging to this category.
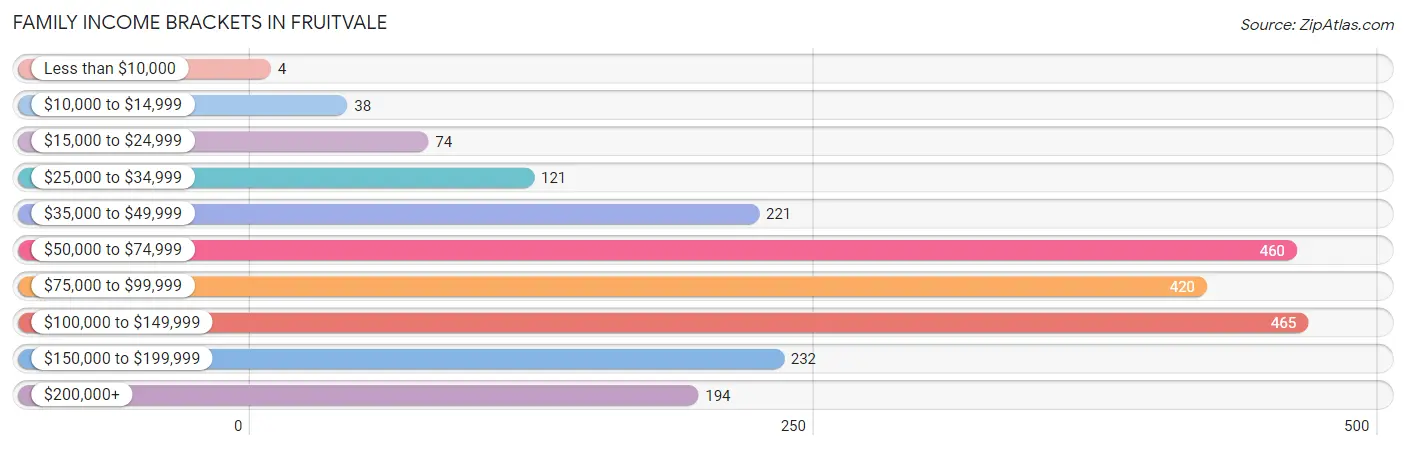
| Income Bracket | # Families | % Families |
| Less than $10,000 | 4 | 0.2% |
| $10,000 to $14,999 | 38 | 1.7% |
| $15,000 to $24,999 | 74 | 3.3% |
| $25,000 to $34,999 | 121 | 5.4% |
| $35,000 to $49,999 | 221 | 9.9% |
| $50,000 to $74,999 | 460 | 20.6% |
| $75,000 to $99,999 | 420 | 18.8% |
| $100,000 to $149,999 | 465 | 20.8% |
| $150,000 to $199,999 | 232 | 10.4% |
| $200,000+ | 194 | 8.7% |
Family Income by Famaliy Size in Fruitvale
4-person families (272 | 12.2%) account for the highest median family income in Fruitvale with $103,500 per family, while 2-person families (1,281 | 57.3%) have the highest median income of $40,078 per family member.
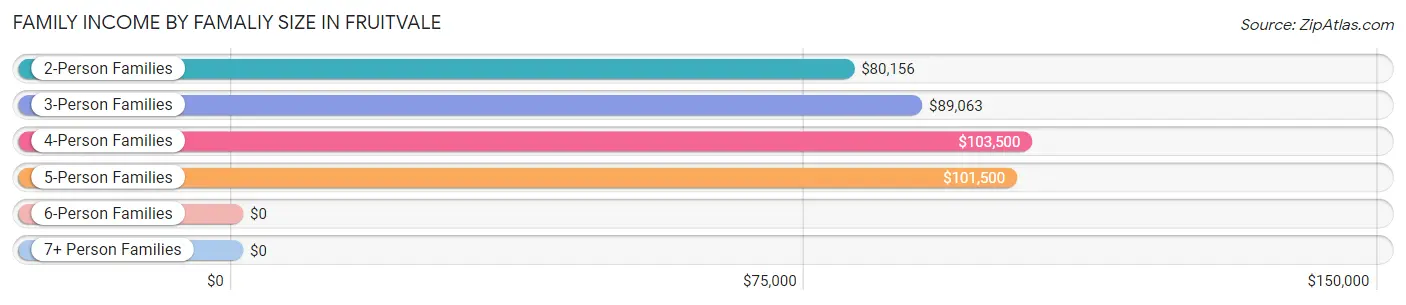
| Income Bracket | # Families | Median Income |
| 2-Person Families | 1,281 (57.3%) | $80,156 |
| 3-Person Families | 356 (15.9%) | $89,063 |
| 4-Person Families | 272 (12.2%) | $103,500 |
| 5-Person Families | 194 (8.7%) | $101,500 |
| 6-Person Families | 95 (4.3%) | $0 |
| 7+ Person Families | 37 (1.7%) | $0 |
| Total | 2,235 (100.0%) | $87,399 |
Family Income by Number of Earners in Fruitvale
The median family income in Fruitvale is $87,399, with families comprising 3+ earners (178) having the highest median family income of $141,441, while families with no earners (334) have the lowest median family income of $50,875, accounting for 8.0% and 14.9% of families, respectively.
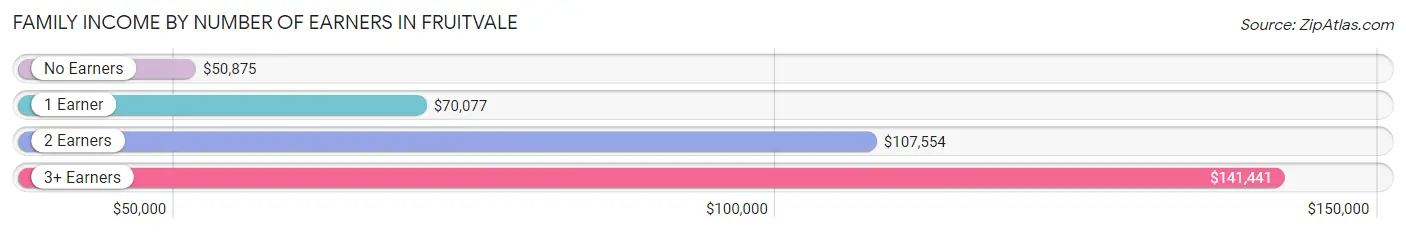
| Number of Earners | # Families | Median Income |
| No Earners | 334 (14.9%) | $50,875 |
| 1 Earner | 688 (30.8%) | $70,077 |
| 2 Earners | 1,035 (46.3%) | $107,554 |
| 3+ Earners | 178 (8.0%) | $141,441 |
| Total | 2,235 (100.0%) | $87,399 |
Household Income in Fruitvale
Household Income Brackets in Fruitvale
With 670 households falling in the category, the $50,000 to $74,999 income range is the most frequent in Fruitvale, accounting for 20.7% of all households. In contrast, only 104 households (3.2%) fall into the $10,000 to $14,999 income bracket, making it the least populous group.
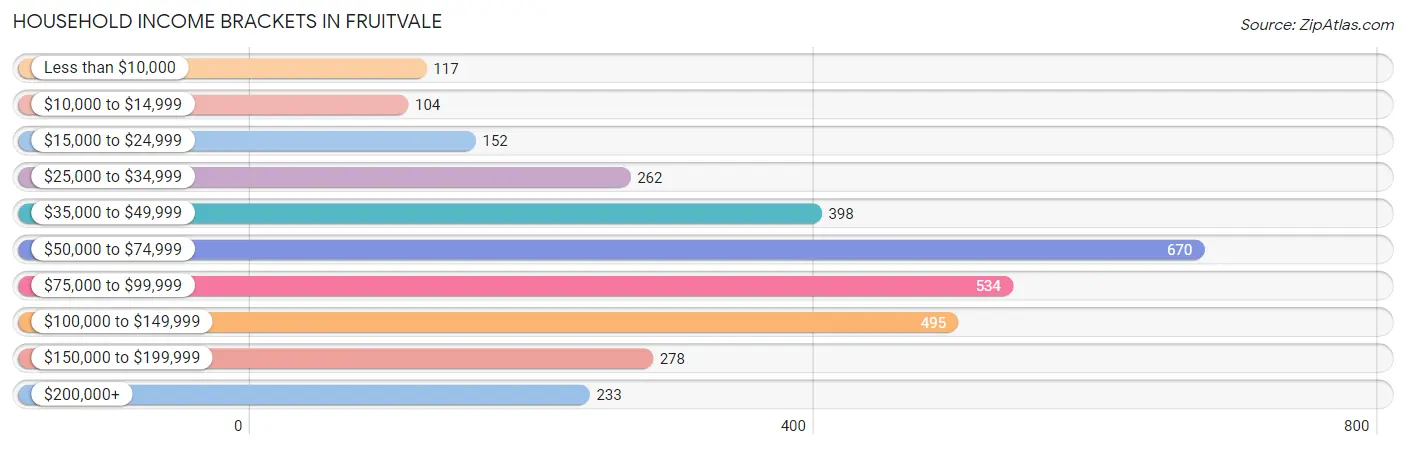
| Income Bracket | # Households | % Households |
| Less than $10,000 | 117 | 3.6% |
| $10,000 to $14,999 | 104 | 3.2% |
| $15,000 to $24,999 | 152 | 4.7% |
| $25,000 to $34,999 | 262 | 8.1% |
| $35,000 to $49,999 | 398 | 12.3% |
| $50,000 to $74,999 | 670 | 20.7% |
| $75,000 to $99,999 | 534 | 16.5% |
| $100,000 to $149,999 | 495 | 15.3% |
| $150,000 to $199,999 | 278 | 8.6% |
| $200,000+ | 233 | 7.2% |
Household Income by Householder Age in Fruitvale
The median household income in Fruitvale is $71,747, with the highest median household income of $98,576 found in the 25 to 44 years age bracket for the primary householder. A total of 970 households (30.0%) fall into this category. Meanwhile, the 65+ years age bracket for the primary householder has the lowest median household income of $47,661, with 1,224 households (37.8%) in this group.
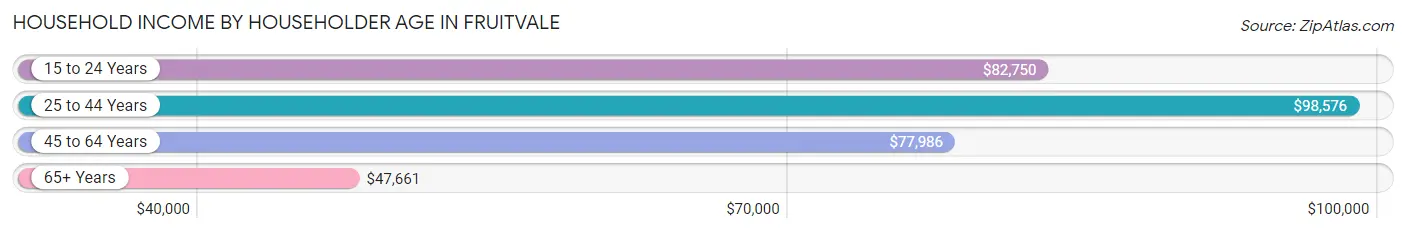
| Income Bracket | # Households | Median Income |
| 15 to 24 Years | 54 (1.7%) | $82,750 |
| 25 to 44 Years | 970 (30.0%) | $98,576 |
| 45 to 64 Years | 989 (30.5%) | $77,986 |
| 65+ Years | 1,224 (37.8%) | $47,661 |
| Total | 3,237 (100.0%) | $71,747 |
Poverty in Fruitvale
Income Below Poverty by Sex and Age in Fruitvale
With 6.6% poverty level for males and 10.2% for females among the residents of Fruitvale, 5 year old males and under 5 year old females are the most vulnerable to poverty, with 35 males (100.0%) and 45 females (21.6%) in their respective age groups living below the poverty level.
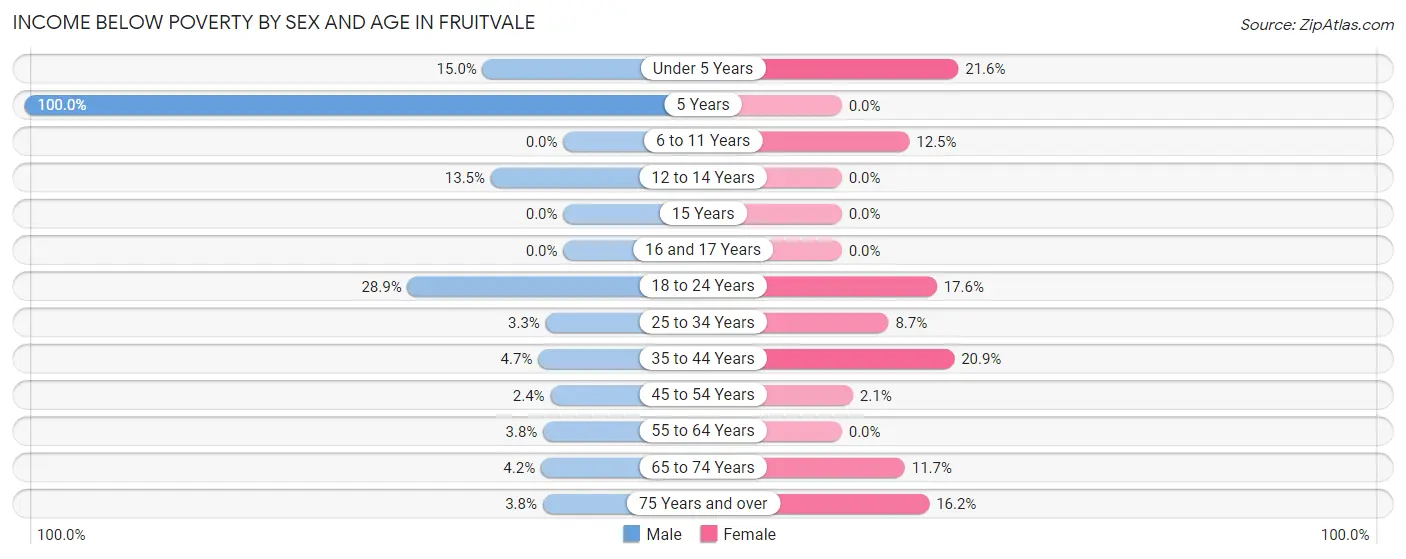
| Age Bracket | Male | Female |
| Under 5 Years | 34 (15.0%) | 45 (21.6%) |
| 5 Years | 35 (100.0%) | 0 (0.0%) |
| 6 to 11 Years | 0 (0.0%) | 39 (12.5%) |
| 12 to 14 Years | 28 (13.5%) | 0 (0.0%) |
| 15 Years | 0 (0.0%) | 0 (0.0%) |
| 16 and 17 Years | 0 (0.0%) | 0 (0.0%) |
| 18 to 24 Years | 57 (28.9%) | 40 (17.6%) |
| 25 to 34 Years | 20 (3.3%) | 36 (8.7%) |
| 35 to 44 Years | 27 (4.7%) | 117 (20.9%) |
| 45 to 54 Years | 8 (2.4%) | 9 (2.1%) |
| 55 to 64 Years | 19 (3.7%) | 0 (0.0%) |
| 65 to 74 Years | 18 (4.2%) | 65 (11.7%) |
| 75 Years and over | 15 (3.8%) | 67 (16.2%) |
| Total | 261 (6.6%) | 418 (10.2%) |
Income Above Poverty by Sex and Age in Fruitvale
According to the poverty statistics in Fruitvale, males aged 6 to 11 years and females aged 5 years are the age groups that are most secure financially, with 100.0% of males and 100.0% of females in these age groups living above the poverty line.
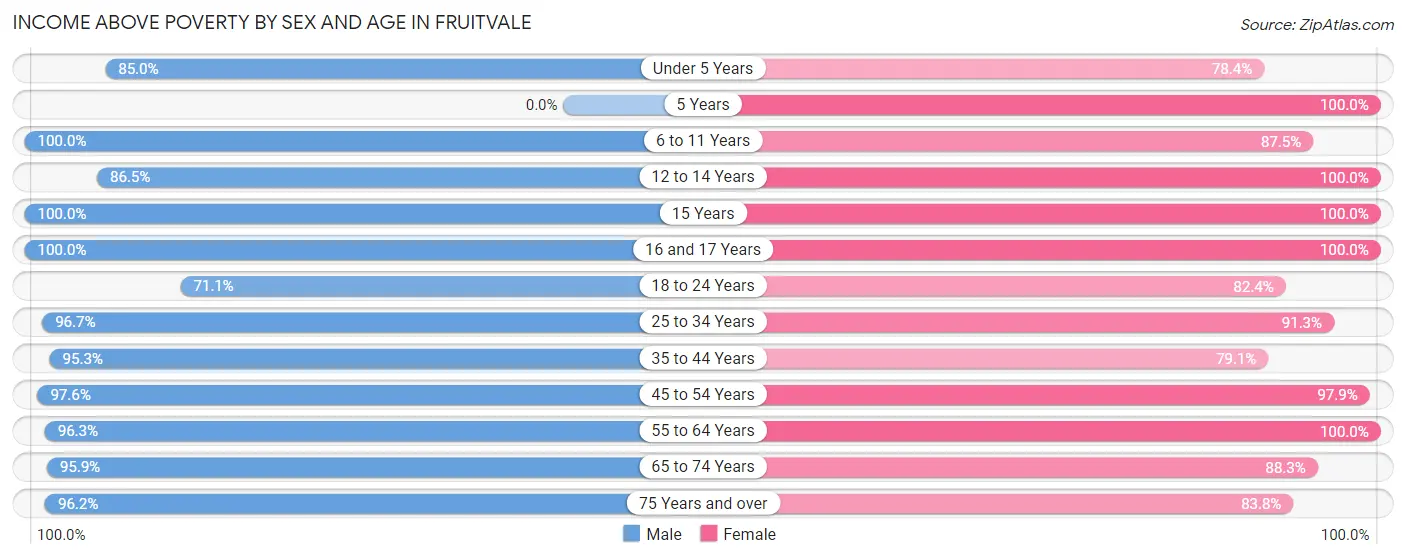
| Age Bracket | Male | Female |
| Under 5 Years | 193 (85.0%) | 163 (78.4%) |
| 5 Years | 0 (0.0%) | 77 (100.0%) |
| 6 to 11 Years | 274 (100.0%) | 272 (87.5%) |
| 12 to 14 Years | 180 (86.5%) | 227 (100.0%) |
| 15 Years | 54 (100.0%) | 10 (100.0%) |
| 16 and 17 Years | 90 (100.0%) | 94 (100.0%) |
| 18 to 24 Years | 140 (71.1%) | 187 (82.4%) |
| 25 to 34 Years | 589 (96.7%) | 379 (91.3%) |
| 35 to 44 Years | 553 (95.3%) | 444 (79.1%) |
| 45 to 54 Years | 325 (97.6%) | 428 (97.9%) |
| 55 to 64 Years | 488 (96.3%) | 544 (100.0%) |
| 65 to 74 Years | 416 (95.9%) | 491 (88.3%) |
| 75 Years and over | 379 (96.2%) | 346 (83.8%) |
| Total | 3,681 (93.4%) | 3,662 (89.7%) |
Income Below Poverty Among Married-Couple Families in Fruitvale
The poverty statistics for married-couple families in Fruitvale show that 2.2% or 41 of the total 1,839 families live below the poverty line. Families with 3 or 4 children have the highest poverty rate of 11.2%, comprising of 28 families. On the other hand, families with 1 or 2 children have the lowest poverty rate of 0.0%, which includes 0 families.
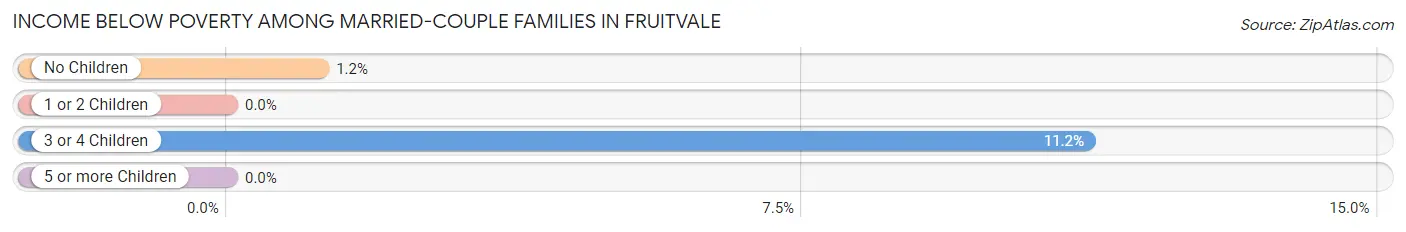
| Children | Above Poverty | Below Poverty |
| No Children | 1,083 (98.8%) | 13 (1.2%) |
| 1 or 2 Children | 456 (100.0%) | 0 (0.0%) |
| 3 or 4 Children | 222 (88.8%) | 28 (11.2%) |
| 5 or more Children | 37 (100.0%) | 0 (0.0%) |
| Total | 1,798 (97.8%) | 41 (2.2%) |
Income Below Poverty Among Single-Parent Households in Fruitvale
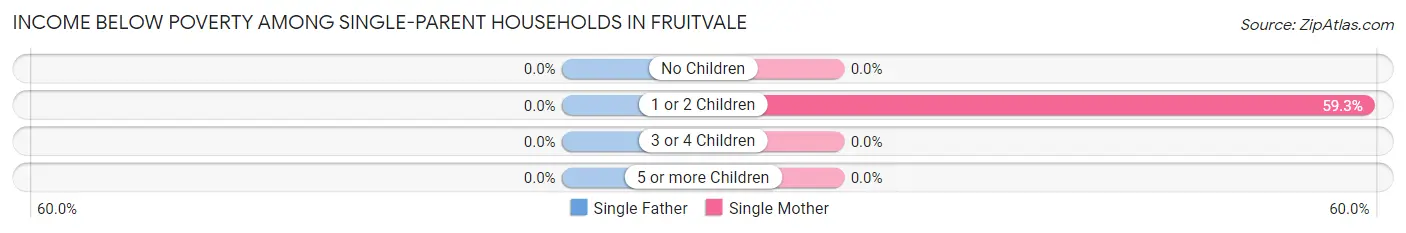
| Children | Single Father | Single Mother |
| No Children | 0 (0.0%) | 0 (0.0%) |
| 1 or 2 Children | 0 (0.0%) | 70 (59.3%) |
| 3 or 4 Children | 0 (0.0%) | 0 (0.0%) |
| 5 or more Children | 0 (0.0%) | 0 (0.0%) |
| Total | 0 (0.0%) | 70 (25.1%) |
Income Below Poverty Among Married-Couple vs Single-Parent Households in Fruitvale
The poverty data for Fruitvale shows that 41 of the married-couple family households (2.2%) and 70 of the single-parent households (17.7%) are living below the poverty level. Within the married-couple family households, those with 3 or 4 children have the highest poverty rate, with 28 households (11.2%) falling below the poverty line. Among the single-parent households, those with 1 or 2 children have the highest poverty rate, with 70 household (40.0%) living below poverty.
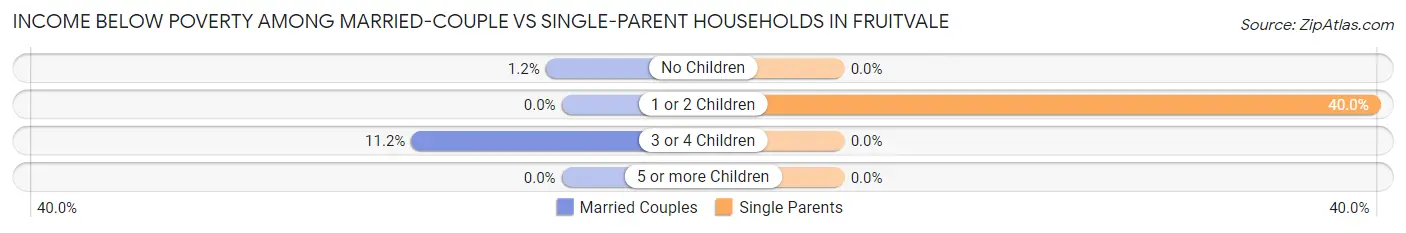
| Children | Married-Couple Families | Single-Parent Households |
| No Children | 13 (1.2%) | 0 (0.0%) |
| 1 or 2 Children | 0 (0.0%) | 70 (40.0%) |
| 3 or 4 Children | 28 (11.2%) | 0 (0.0%) |
| 5 or more Children | 0 (0.0%) | 0 (0.0%) |
| Total | 41 (2.2%) | 70 (17.7%) |
Race in Fruitvale
The most populous races in Fruitvale are White / Caucasian (6,956 | 86.7%), Two or more Races (899 | 11.2%), and Hispanic or Latino (884 | 11.0%).
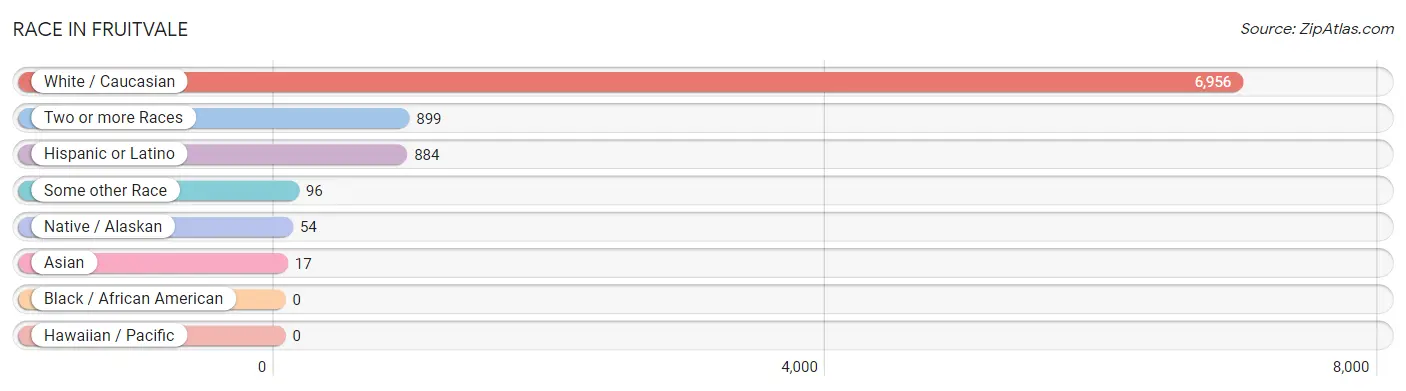
| Race | # Population | % Population |
| Asian | 17 | 0.2% |
| Black / African American | 0 | 0.0% |
| Hawaiian / Pacific | 0 | 0.0% |
| Hispanic or Latino | 884 | 11.0% |
| Native / Alaskan | 54 | 0.7% |
| White / Caucasian | 6,956 | 86.7% |
| Two or more Races | 899 | 11.2% |
| Some other Race | 96 | 1.2% |
| Total | 8,022 | 100.0% |
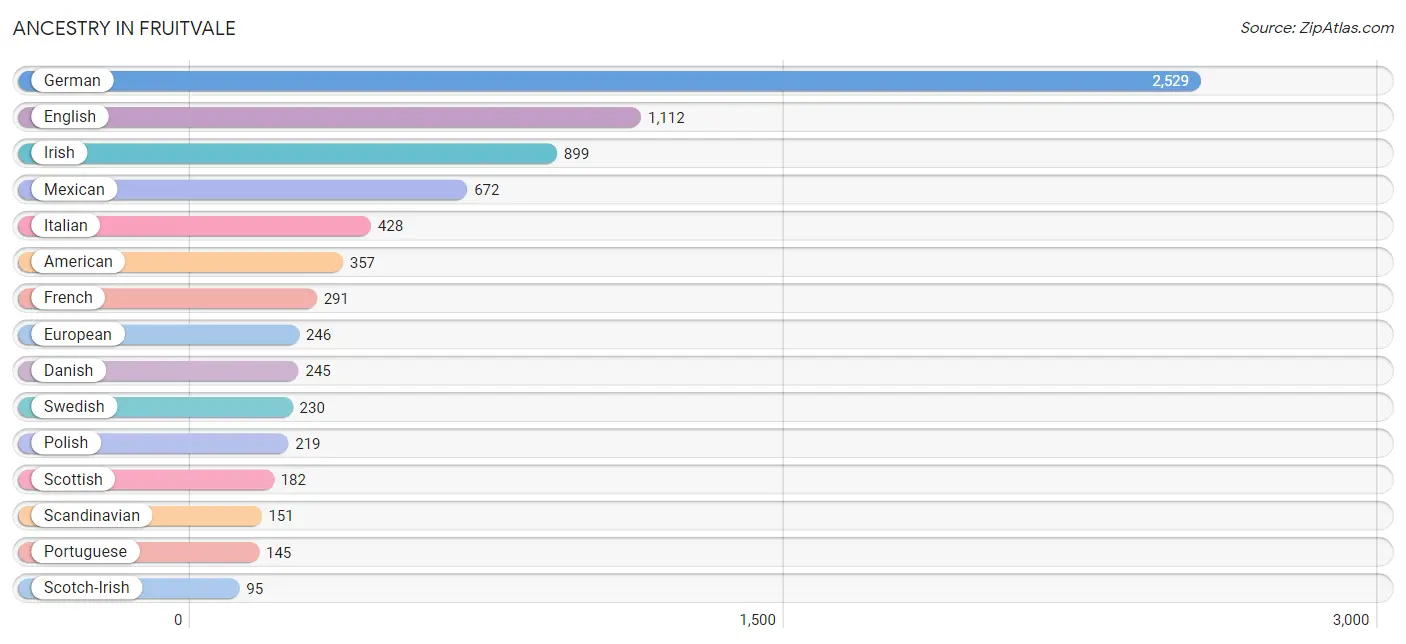
Ancestry in Fruitvale
The most populous ancestries reported in Fruitvale are German (2,529 | 31.5%), English (1,112 | 13.9%), Irish (899 | 11.2%), Mexican (672 | 8.4%), and Italian (428 | 5.3%), together accounting for 70.3% of all Fruitvale residents.
| Ancestry | # Population | % Population |
| American | 357 | 4.4% |
| Apache | 25 | 0.3% |
| Austrian | 6 | 0.1% |
| Bhutanese | 7 | 0.1% |
| British | 24 | 0.3% |
| Burmese | 9 | 0.1% |
| Central American | 36 | 0.4% |
| Cherokee | 51 | 0.6% |
| Colombian | 8 | 0.1% |
| Cree | 19 | 0.2% |
| Czech | 74 | 0.9% |
| Czechoslovakian | 36 | 0.4% |
| Danish | 245 | 3.0% |
| Dutch | 70 | 0.9% |
| English | 1,112 | 13.9% |
| European | 246 | 3.1% |
| Finnish | 14 | 0.2% |
| French | 291 | 3.6% |
| French Canadian | 26 | 0.3% |
| German | 2,529 | 31.5% |
| Greek | 17 | 0.2% |
| Guyanese | 23 | 0.3% |
| Honduran | 36 | 0.4% |
| Hungarian | 8 | 0.1% |
| Irish | 899 | 11.2% |
| Italian | 428 | 5.3% |
| Korean | 67 | 0.8% |
| Luxembourger | 8 | 0.1% |
| Mexican | 672 | 8.4% |
| Northern European | 13 | 0.2% |
| Norwegian | 86 | 1.1% |
| Pennsylvania German | 8 | 0.1% |
| Peruvian | 10 | 0.1% |
| Polish | 219 | 2.7% |
| Portuguese | 145 | 1.8% |
| Pueblo | 7 | 0.1% |
| Russian | 56 | 0.7% |
| Scandinavian | 151 | 1.9% |
| Scotch-Irish | 95 | 1.2% |
| Scottish | 182 | 2.3% |
| Sioux | 77 | 1.0% |
| Slavic | 7 | 0.1% |
| Slovene | 22 | 0.3% |
| South American | 18 | 0.2% |
| Spaniard | 26 | 0.3% |
| Spanish | 89 | 1.1% |
| Swedish | 230 | 2.9% |
| Swiss | 12 | 0.2% |
| Ukrainian | 18 | 0.2% |
| Welsh | 12 | 0.2% | View All 50 Rows |
Immigrants in Fruitvale
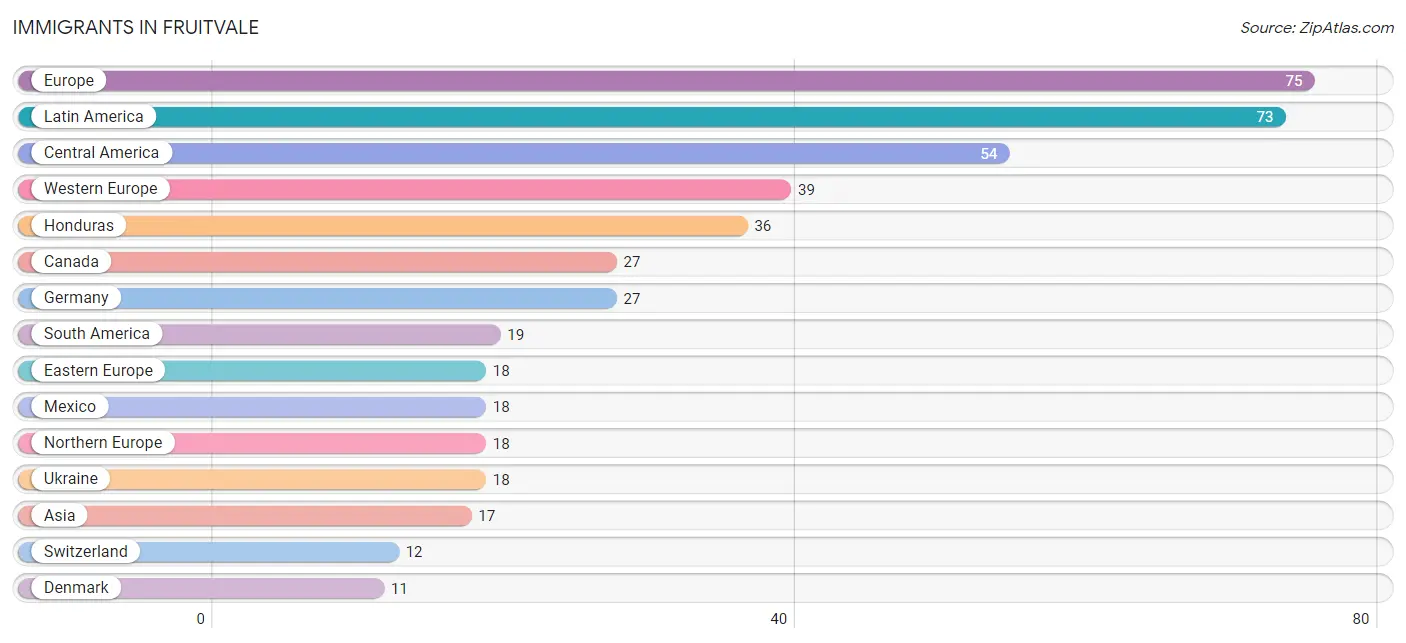
The most numerous immigrant groups reported in Fruitvale came from Europe (75 | 0.9%), Latin America (73 | 0.9%), Central America (54 | 0.7%), Western Europe (39 | 0.5%), and Honduras (36 | 0.4%), together accounting for 3.4% of all Fruitvale residents.
| Immigration Origin | # Population | % Population |
| Asia | 17 | 0.2% |
| Australia | 7 | 0.1% |
| Canada | 27 | 0.3% |
| Central America | 54 | 0.7% |
| Colombia | 8 | 0.1% |
| Denmark | 11 | 0.1% |
| Eastern Asia | 9 | 0.1% |
| Eastern Europe | 18 | 0.2% |
| England | 7 | 0.1% |
| Europe | 75 | 0.9% |
| Germany | 27 | 0.3% |
| Guyana | 11 | 0.1% |
| Honduras | 36 | 0.4% |
| Korea | 9 | 0.1% |
| Latin America | 73 | 0.9% |
| Mexico | 18 | 0.2% |
| Northern Europe | 18 | 0.2% |
| Oceania | 7 | 0.1% |
| Philippines | 8 | 0.1% |
| South America | 19 | 0.2% |
| South Eastern Asia | 8 | 0.1% |
| Switzerland | 12 | 0.2% |
| Ukraine | 18 | 0.2% |
| Western Europe | 39 | 0.5% | View All 24 Rows |
Sex and Age in Fruitvale
Sex and Age in Fruitvale
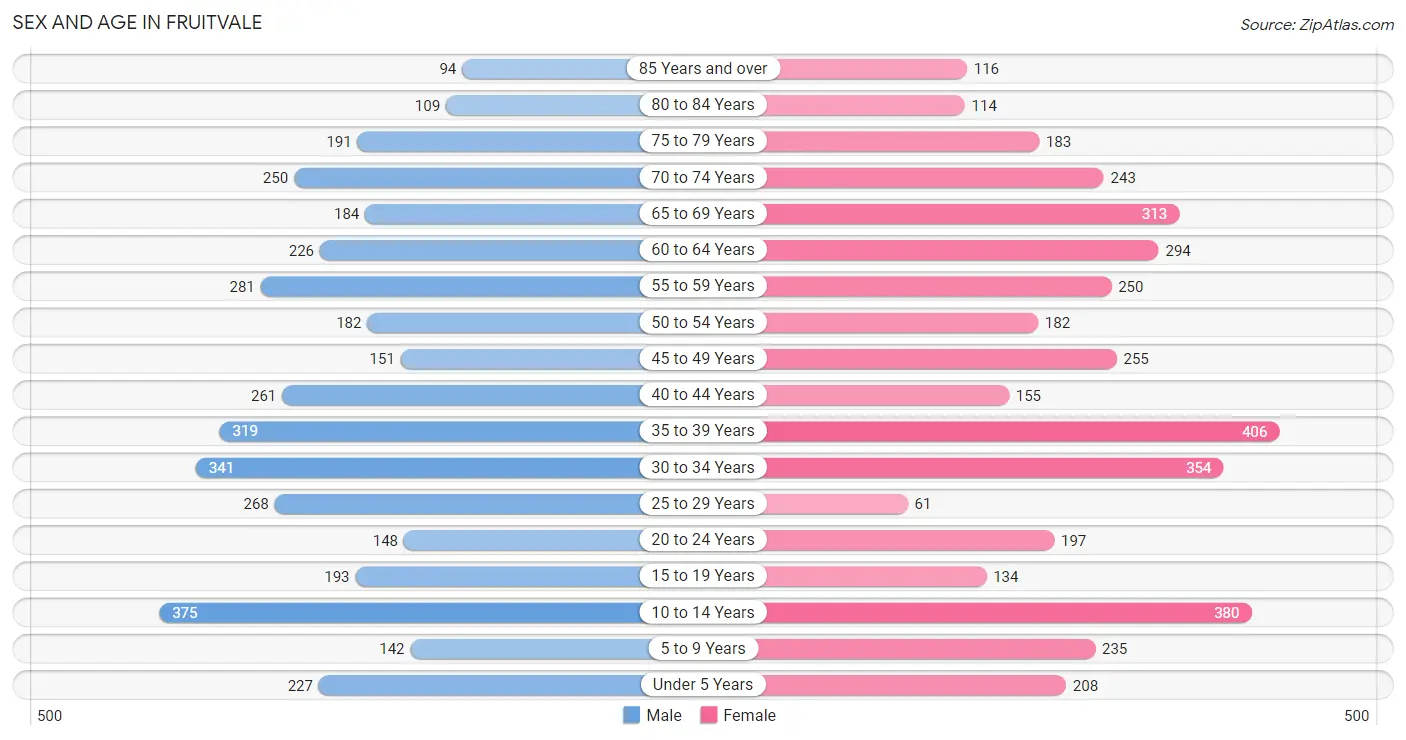
The most populous age groups in Fruitvale are 10 to 14 Years (375 | 9.5%) for men and 35 to 39 Years (406 | 10.0%) for women.
| Age Bracket | Male | Female |
| Under 5 Years | 227 (5.8%) | 208 (5.1%) |
| 5 to 9 Years | 142 (3.6%) | 235 (5.8%) |
| 10 to 14 Years | 375 (9.5%) | 380 (9.3%) |
| 15 to 19 Years | 193 (4.9%) | 134 (3.3%) |
| 20 to 24 Years | 148 (3.7%) | 197 (4.8%) |
| 25 to 29 Years | 268 (6.8%) | 61 (1.5%) |
| 30 to 34 Years | 341 (8.6%) | 354 (8.7%) |
| 35 to 39 Years | 319 (8.1%) | 406 (10.0%) |
| 40 to 44 Years | 261 (6.6%) | 155 (3.8%) |
| 45 to 49 Years | 151 (3.8%) | 255 (6.2%) |
| 50 to 54 Years | 182 (4.6%) | 182 (4.5%) |
| 55 to 59 Years | 281 (7.1%) | 250 (6.1%) |
| 60 to 64 Years | 226 (5.7%) | 294 (7.2%) |
| 65 to 69 Years | 184 (4.7%) | 313 (7.7%) |
| 70 to 74 Years | 250 (6.3%) | 243 (6.0%) |
| 75 to 79 Years | 191 (4.9%) | 183 (4.5%) |
| 80 to 84 Years | 109 (2.8%) | 114 (2.8%) |
| 85 Years and over | 94 (2.4%) | 116 (2.8%) |
| Total | 3,942 (100.0%) | 4,080 (100.0%) |
Families and Households in Fruitvale
Median Family Size in Fruitvale
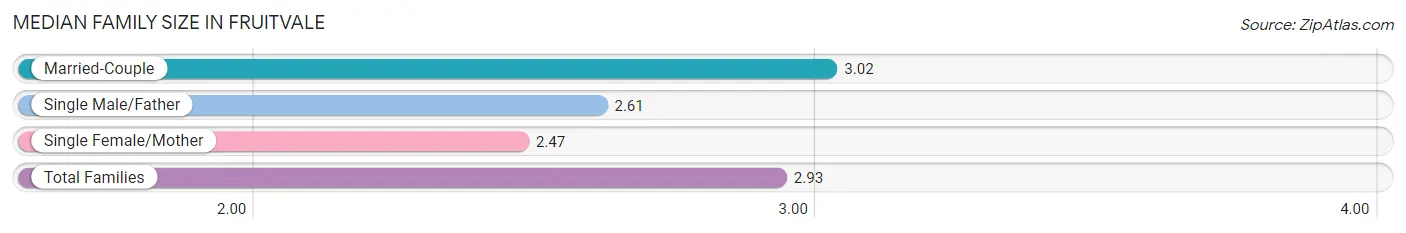
The median family size in Fruitvale is 2.93 persons per family, with married-couple families (1,839 | 82.3%) accounting for the largest median family size of 3.02 persons per family. On the other hand, single female/mother families (279 | 12.5%) represent the smallest median family size with 2.47 persons per family.
| Family Type | # Families | Family Size |
| Married-Couple | 1,839 (82.3%) | 3.02 |
| Single Male/Father | 117 (5.2%) | 2.61 |
| Single Female/Mother | 279 (12.5%) | 2.47 |
| Total Families | 2,235 (100.0%) | 2.93 |
Median Household Size in Fruitvale
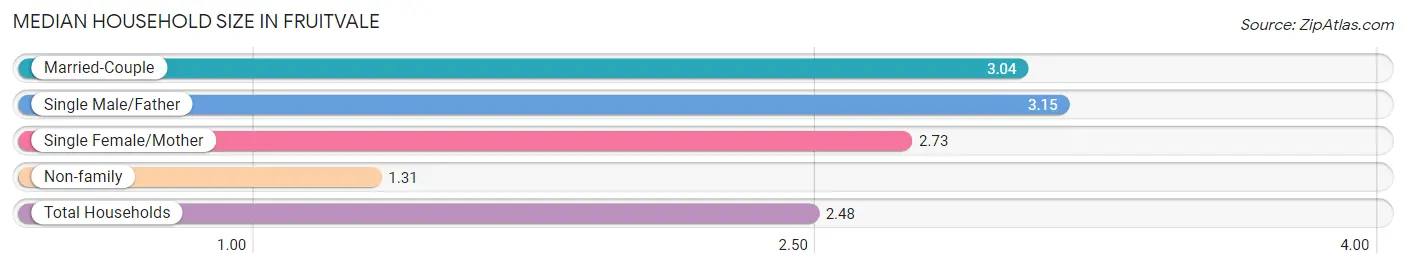
The median household size in Fruitvale is 2.48 persons per household, with single male/father households (117 | 3.6%) accounting for the largest median household size of 3.15 persons per household. non-family households (1,002 | 30.9%) represent the smallest median household size with 1.31 persons per household.
| Household Type | # Households | Household Size |
| Married-Couple | 1,839 (56.8%) | 3.04 |
| Single Male/Father | 117 (3.6%) | 3.15 |
| Single Female/Mother | 279 (8.6%) | 2.73 |
| Non-family | 1,002 (30.9%) | 1.31 |
| Total Households | 3,237 (100.0%) | 2.48 |
Household Size by Marriage Status in Fruitvale
Out of a total of 3,237 households in Fruitvale, 2,235 (69.1%) are family households, while 1,002 (30.9%) are nonfamily households. The most numerous type of family households are 2-person households, comprising 1,197, and the most common type of nonfamily households are 1-person households, comprising 878.
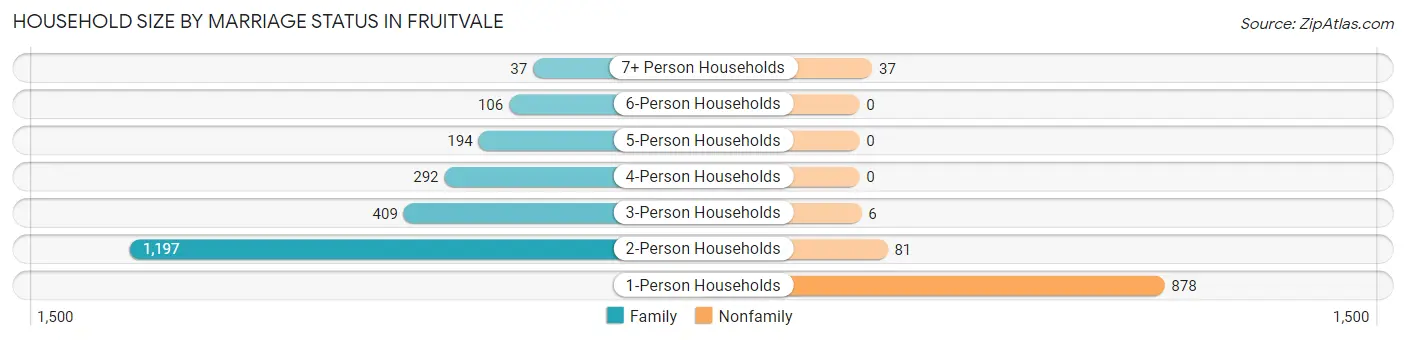
| Household Size | Family Households | Nonfamily Households |
| 1-Person Households | - | 878 (27.1%) |
| 2-Person Households | 1,197 (37.0%) | 81 (2.5%) |
| 3-Person Households | 409 (12.6%) | 6 (0.2%) |
| 4-Person Households | 292 (9.0%) | 0 (0.0%) |
| 5-Person Households | 194 (6.0%) | 0 (0.0%) |
| 6-Person Households | 106 (3.3%) | 0 (0.0%) |
| 7+ Person Households | 37 (1.1%) | 37 (1.1%) |
| Total | 2,235 (69.1%) | 1,002 (30.9%) |
Female Fertility in Fruitvale
Fertility by Age in Fruitvale
Average fertility rate in Fruitvale is 18.0 births per 1,000 women. Women in the age bracket of 35 to 50 years have the highest fertility rate with 33.0 births per 1,000 women. Women in the age bracket of 35 to 50 years acount for 100.0% of all women with births.
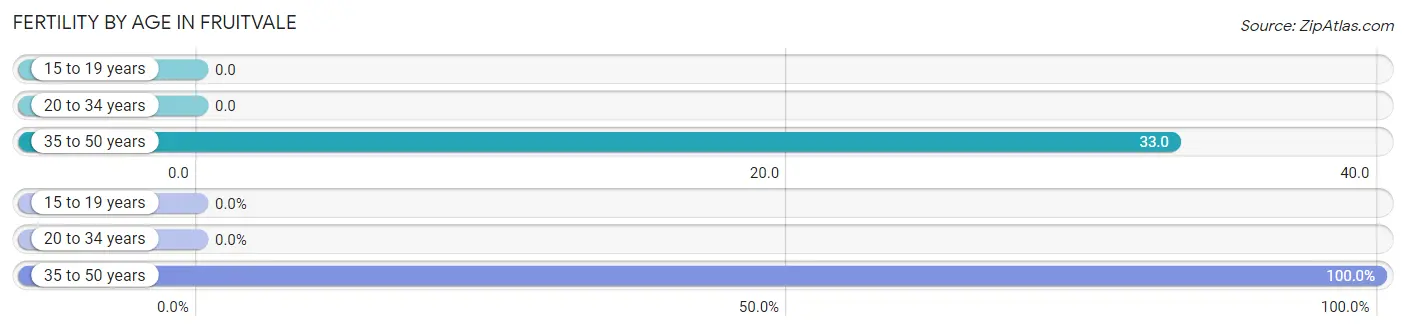
| Age Bracket | Women with Births | Births / 1,000 Women |
| 15 to 19 years | 0 (0.0%) | 0.0 |
| 20 to 34 years | 0 (0.0%) | 0.0 |
| 35 to 50 years | 29 (100.0%) | 33.0 |
| Total | 29 (100.0%) | 18.0 |
Fertility by Age by Marriage Status in Fruitvale
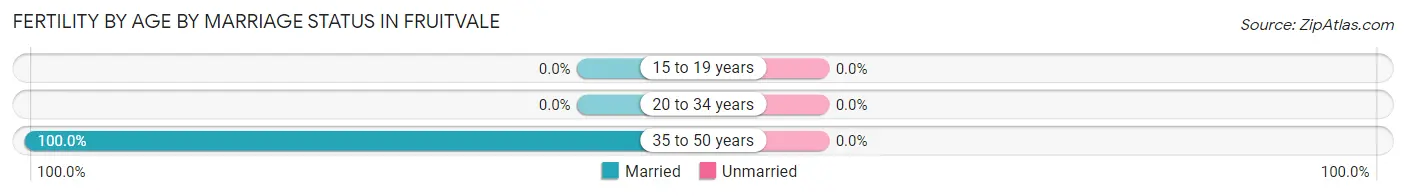
| Age Bracket | Married | Unmarried |
| 15 to 19 years | 0 (0.0%) | 0 (0.0%) |
| 20 to 34 years | 0 (0.0%) | 0 (0.0%) |
| 35 to 50 years | 29 (100.0%) | 0 (0.0%) |
| Total | 29 (100.0%) | 0 (0.0%) |
Fertility by Education in Fruitvale
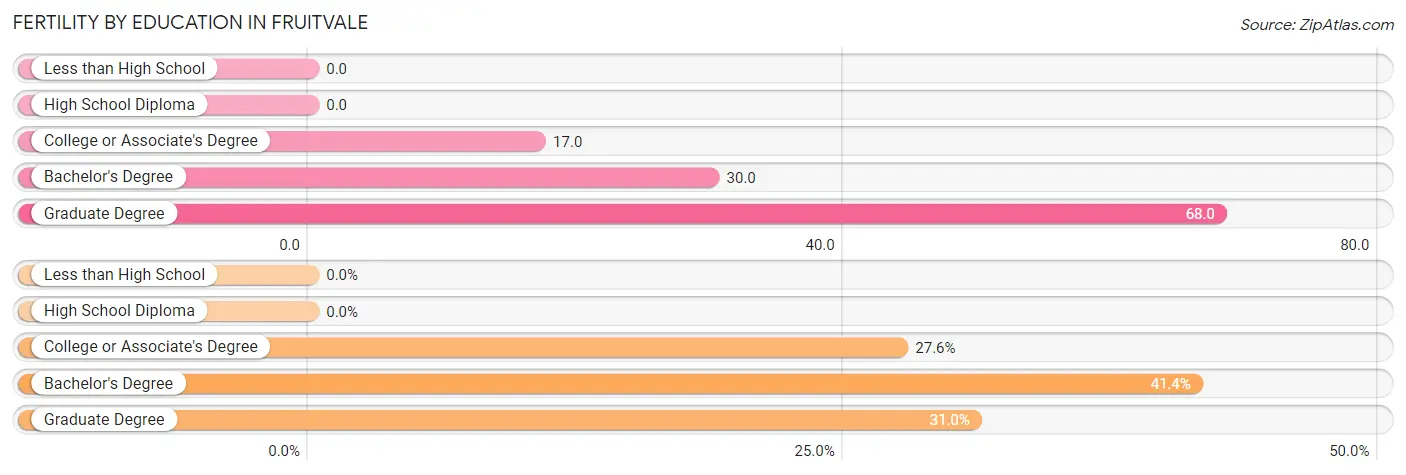
| Educational Attainment | Women with Births | Births / 1,000 Women |
| Less than High School | 0 (0.0%) | 0.0 |
| High School Diploma | 0 (0.0%) | 0.0 |
| College or Associate's Degree | 8 (27.6%) | 17.0 |
| Bachelor's Degree | 12 (41.4%) | 30.0 |
| Graduate Degree | 9 (31.0%) | 68.0 |
| Total | 29 (100.0%) | 18.0 |
Fertility by Education by Marriage Status in Fruitvale
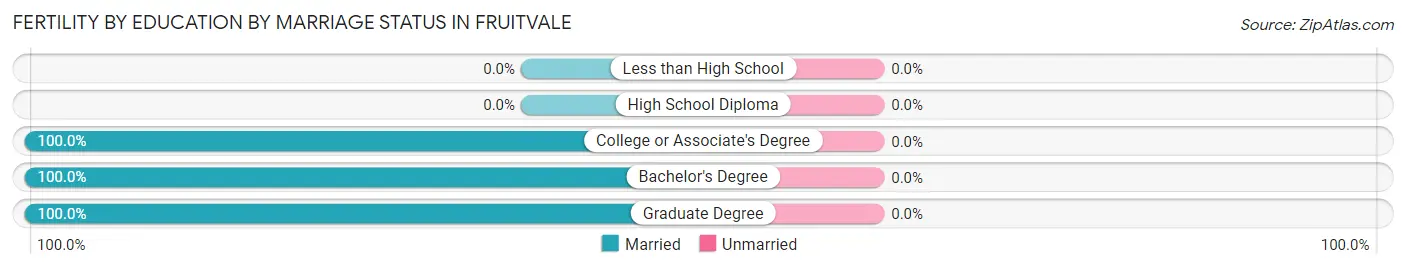
| Educational Attainment | Married | Unmarried |
| Less than High School | 0 (0.0%) | 0 (0.0%) |
| High School Diploma | 0 (0.0%) | 0 (0.0%) |
| College or Associate's Degree | 8 (100.0%) | 0 (0.0%) |
| Bachelor's Degree | 12 (100.0%) | 0 (0.0%) |
| Graduate Degree | 9 (100.0%) | 0 (0.0%) |
| Total | 29 (100.0%) | 0 (0.0%) |
Employment Characteristics in Fruitvale
Employment by Class of Employer in Fruitvale
Among the 3,820 employed individuals in Fruitvale, private company employees (2,583 | 67.6%), not-for-profit organizations (345 | 9.0%), and local government employees (254 | 6.7%) make up the most common classes of employment.
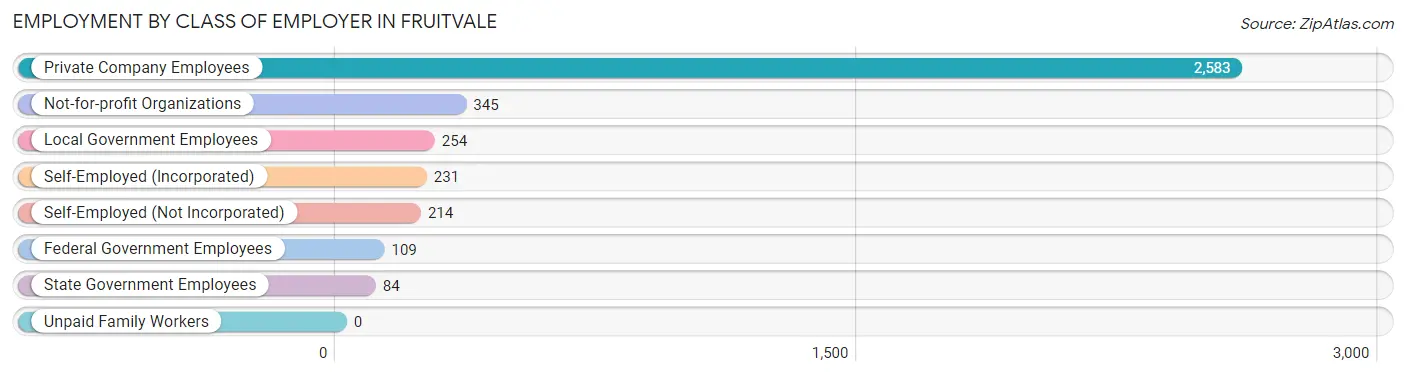
| Employer Class | # Employees | % Employees |
| Private Company Employees | 2,583 | 67.6% |
| Self-Employed (Incorporated) | 231 | 6.0% |
| Self-Employed (Not Incorporated) | 214 | 5.6% |
| Not-for-profit Organizations | 345 | 9.0% |
| Local Government Employees | 254 | 6.7% |
| State Government Employees | 84 | 2.2% |
| Federal Government Employees | 109 | 2.9% |
| Unpaid Family Workers | 0 | 0.0% |
| Total | 3,820 | 100.0% |
Employment Status by Age in Fruitvale
According to the labor force statistics for Fruitvale, out of the total population over 16 years of age (6,391), 63.2% or 4,039 individuals are in the labor force, with 4.5% or 182 of them unemployed. The age group with the highest labor force participation rate is 25 to 29 years, with 90.6% or 298 individuals in the labor force. Within the labor force, the 20 to 24 years age range has the highest percentage of unemployed individuals, with 18.5% or 51 of them being unemployed.
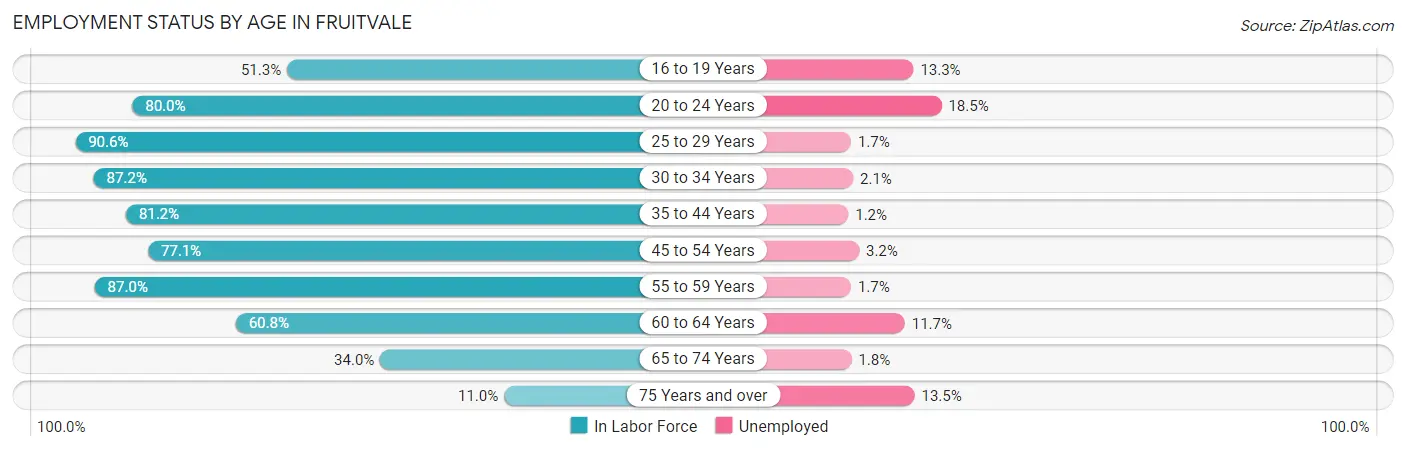
| Age Bracket | In Labor Force | Unemployed |
| 16 to 19 Years | 135 (51.3%) | 18 (13.3%) |
| 20 to 24 Years | 276 (80.0%) | 51 (18.5%) |
| 25 to 29 Years | 298 (90.6%) | 5 (1.7%) |
| 30 to 34 Years | 606 (87.2%) | 13 (2.1%) |
| 35 to 44 Years | 926 (81.2%) | 11 (1.2%) |
| 45 to 54 Years | 594 (77.1%) | 19 (3.2%) |
| 55 to 59 Years | 462 (87.0%) | 8 (1.7%) |
| 60 to 64 Years | 316 (60.8%) | 37 (11.7%) |
| 65 to 74 Years | 337 (34.0%) | 6 (1.8%) |
| 75 Years and over | 89 (11.0%) | 12 (13.5%) |
| Total | 4,039 (63.2%) | 182 (4.5%) |
Employment Status by Educational Attainment in Fruitvale
According to labor force statistics for Fruitvale, 80.3% of individuals (3,201) out of the total population between 25 and 64 years of age (3,986) are in the labor force, with 2.9% or 93 of them being unemployed. The group with the highest labor force participation rate are those with the educational attainment of high school diploma, with 85.7% or 1,126 individuals in the labor force. Within the labor force, individuals with high school diploma education have the highest percentage of unemployment, with 6.0% or 68 of them being unemployed.
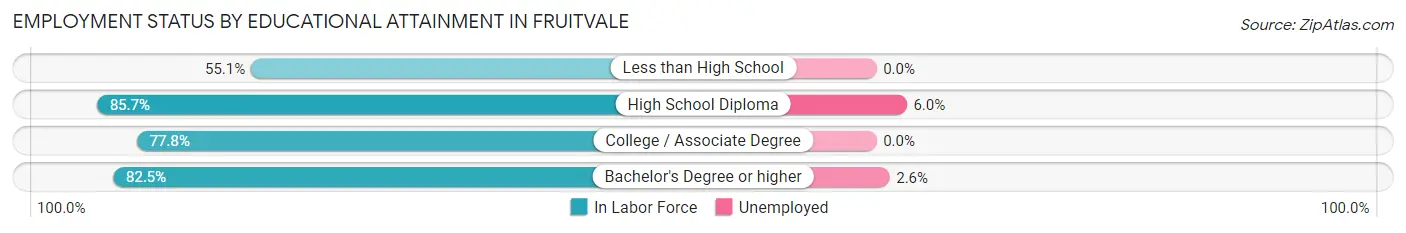
| Educational Attainment | In Labor Force | Unemployed |
| Less than High School | 136 (55.1%) | 0 (0.0%) |
| High School Diploma | 1,126 (85.7%) | 79 (6.0%) |
| College / Associate Degree | 991 (77.8%) | 0 (0.0%) |
| Bachelor's Degree or higher | 950 (82.5%) | 30 (2.6%) |
| Total | 3,201 (80.3%) | 116 (2.9%) |
Employment Occupations by Sex in Fruitvale
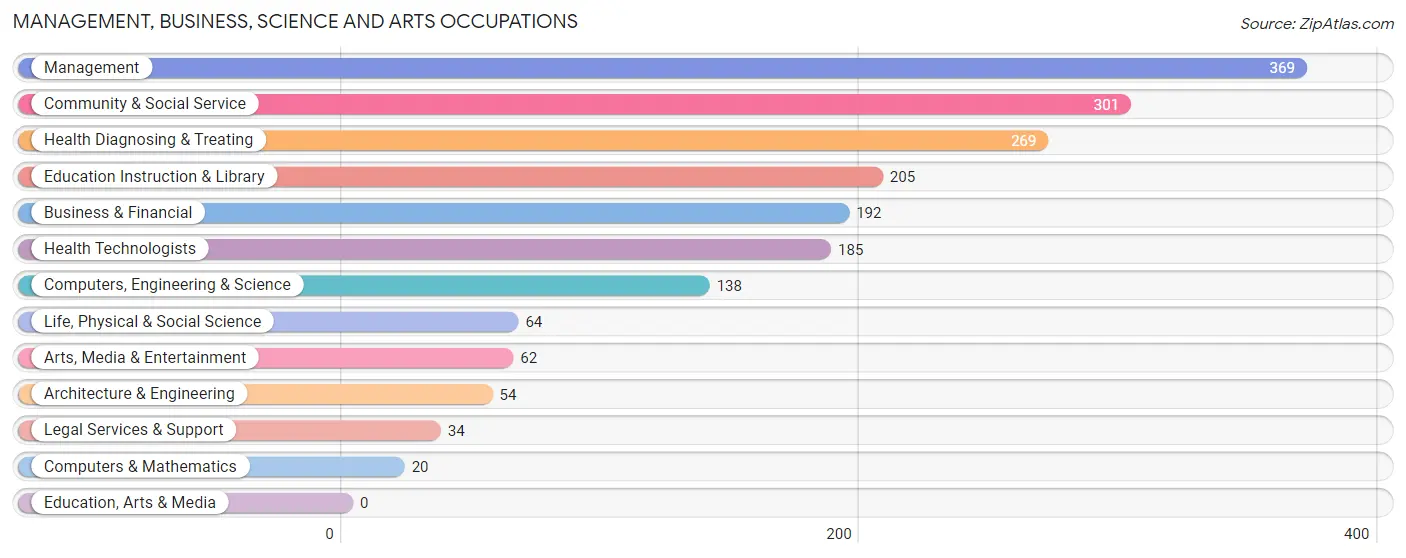
Management, Business, Science and Arts Occupations
The most common Management, Business, Science and Arts occupations in Fruitvale are Management (369 | 9.6%), Community & Social Service (301 | 7.8%), Health Diagnosing & Treating (269 | 7.0%), Education Instruction & Library (205 | 5.3%), and Business & Financial (192 | 5.0%).
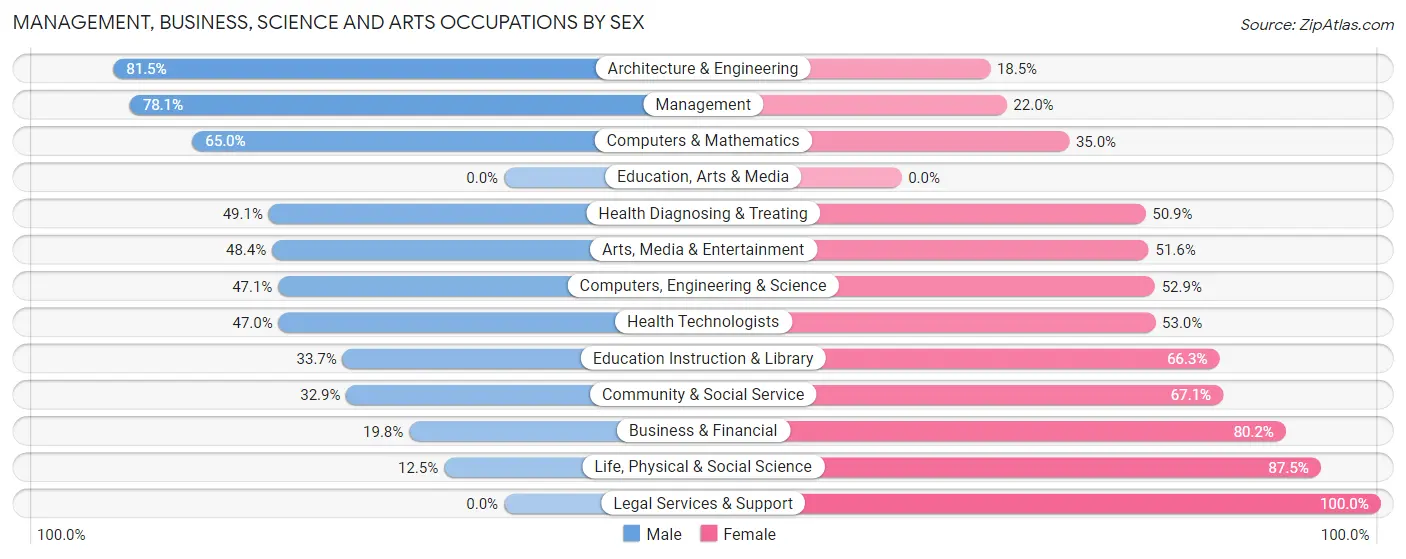
Management, Business, Science and Arts Occupations by Sex
Within the Management, Business, Science and Arts occupations in Fruitvale, the most male-oriented occupations are Architecture & Engineering (81.5%), Management (78.0%), and Computers & Mathematics (65.0%), while the most female-oriented occupations are Legal Services & Support (100.0%), Life, Physical & Social Science (87.5%), and Business & Financial (80.2%).
| Occupation | Male | Female |
| Management | 288 (78.0%) | 81 (22.0%) |
| Business & Financial | 38 (19.8%) | 154 (80.2%) |
| Computers, Engineering & Science | 65 (47.1%) | 73 (52.9%) |
| Computers & Mathematics | 13 (65.0%) | 7 (35.0%) |
| Architecture & Engineering | 44 (81.5%) | 10 (18.5%) |
| Life, Physical & Social Science | 8 (12.5%) | 56 (87.5%) |
| Community & Social Service | 99 (32.9%) | 202 (67.1%) |
| Education, Arts & Media | 0 (0.0%) | 0 (0.0%) |
| Legal Services & Support | 0 (0.0%) | 34 (100.0%) |
| Education Instruction & Library | 69 (33.7%) | 136 (66.3%) |
| Arts, Media & Entertainment | 30 (48.4%) | 32 (51.6%) |
| Health Diagnosing & Treating | 132 (49.1%) | 137 (50.9%) |
| Health Technologists | 87 (47.0%) | 98 (53.0%) |
| Total (Category) | 622 (49.0%) | 647 (51.0%) |
| Total (Overall) | 2,134 (55.3%) | 1,725 (44.7%) |
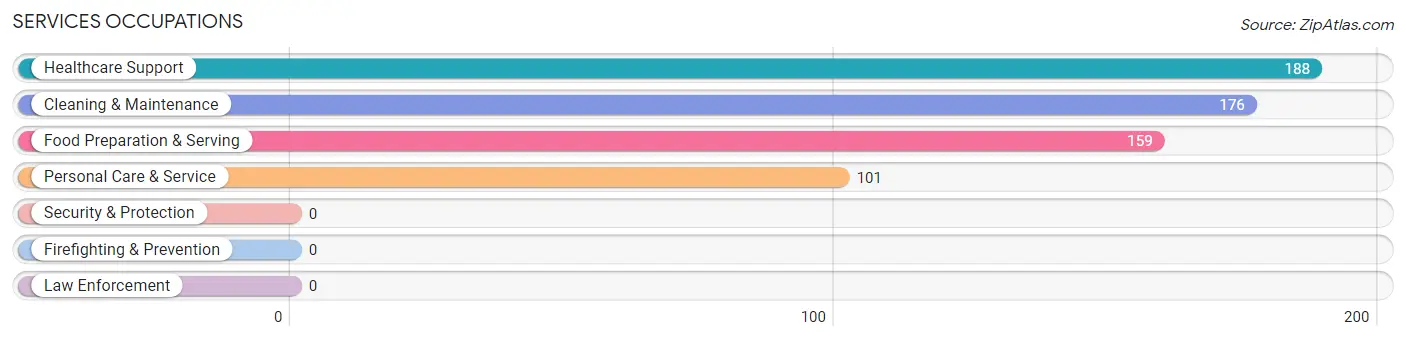
Services Occupations
The most common Services occupations in Fruitvale are Healthcare Support (188 | 4.9%), Cleaning & Maintenance (176 | 4.6%), Food Preparation & Serving (159 | 4.1%), and Personal Care & Service (101 | 2.6%).
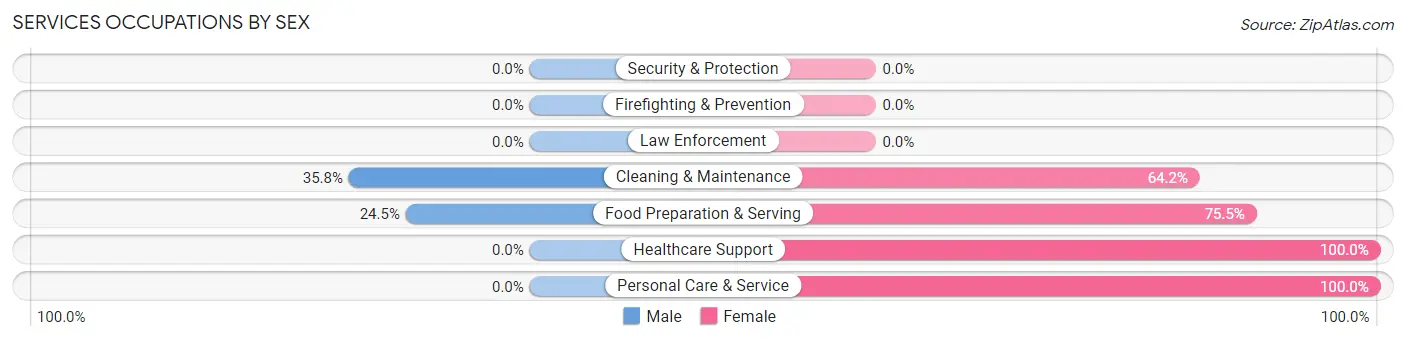
Services Occupations by Sex
Within the Services occupations in Fruitvale, the most male-oriented occupations are Cleaning & Maintenance (35.8%), and Food Preparation & Serving (24.5%), while the most female-oriented occupations are Healthcare Support (100.0%), Personal Care & Service (100.0%), and Food Preparation & Serving (75.5%).
| Occupation | Male | Female |
| Healthcare Support | 0 (0.0%) | 188 (100.0%) |
| Security & Protection | 0 (0.0%) | 0 (0.0%) |
| Firefighting & Prevention | 0 (0.0%) | 0 (0.0%) |
| Law Enforcement | 0 (0.0%) | 0 (0.0%) |
| Food Preparation & Serving | 39 (24.5%) | 120 (75.5%) |
| Cleaning & Maintenance | 63 (35.8%) | 113 (64.2%) |
| Personal Care & Service | 0 (0.0%) | 101 (100.0%) |
| Total (Category) | 102 (16.4%) | 522 (83.7%) |
| Total (Overall) | 2,134 (55.3%) | 1,725 (44.7%) |
Sales and Office Occupations
The most common Sales and Office occupations in Fruitvale are Sales & Related (466 | 12.1%), and Office & Administration (464 | 12.0%).

Sales and Office Occupations by Sex
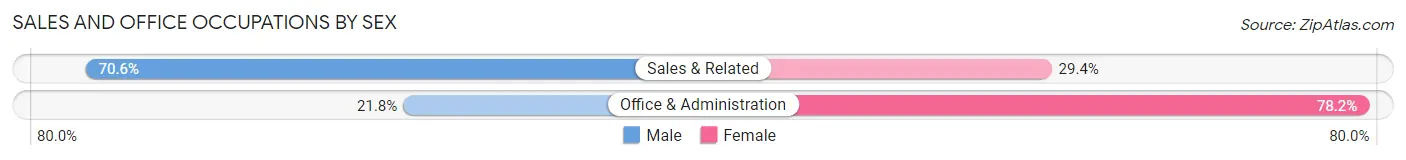
| Occupation | Male | Female |
| Sales & Related | 329 (70.6%) | 137 (29.4%) |
| Office & Administration | 101 (21.8%) | 363 (78.2%) |
| Total (Category) | 430 (46.2%) | 500 (53.8%) |
| Total (Overall) | 2,134 (55.3%) | 1,725 (44.7%) |
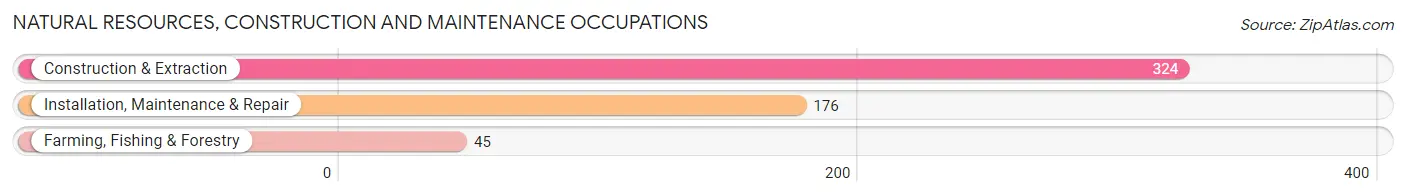
Natural Resources, Construction and Maintenance Occupations
The most common Natural Resources, Construction and Maintenance occupations in Fruitvale are Construction & Extraction (324 | 8.4%), Installation, Maintenance & Repair (176 | 4.6%), and Farming, Fishing & Forestry (45 | 1.2%).
Natural Resources, Construction and Maintenance Occupations by Sex
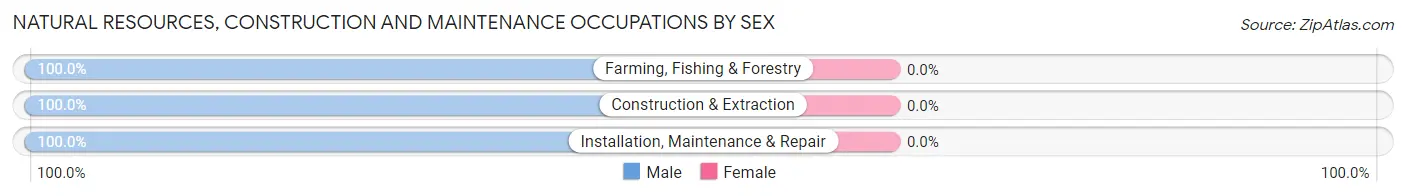
| Occupation | Male | Female |
| Farming, Fishing & Forestry | 45 (100.0%) | 0 (0.0%) |
| Construction & Extraction | 324 (100.0%) | 0 (0.0%) |
| Installation, Maintenance & Repair | 176 (100.0%) | 0 (0.0%) |
| Total (Category) | 545 (100.0%) | 0 (0.0%) |
| Total (Overall) | 2,134 (55.3%) | 1,725 (44.7%) |
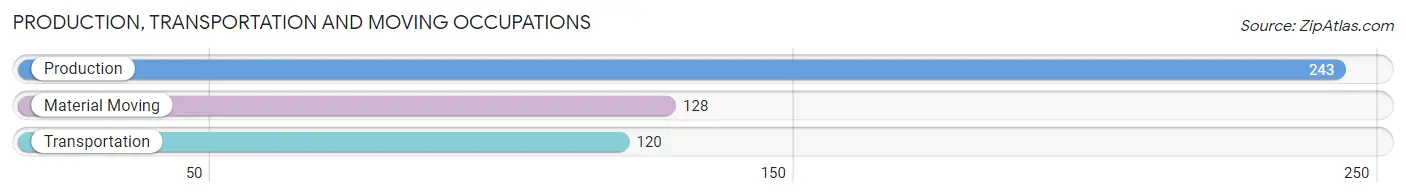
Production, Transportation and Moving Occupations
The most common Production, Transportation and Moving occupations in Fruitvale are Production (243 | 6.3%), Material Moving (128 | 3.3%), and Transportation (120 | 3.1%).
Production, Transportation and Moving Occupations by Sex
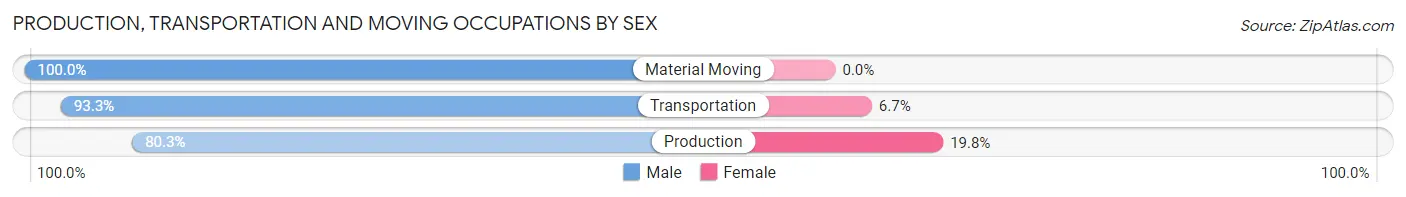
| Occupation | Male | Female |
| Production | 195 (80.2%) | 48 (19.8%) |
| Transportation | 112 (93.3%) | 8 (6.7%) |
| Material Moving | 128 (100.0%) | 0 (0.0%) |
| Total (Category) | 435 (88.6%) | 56 (11.4%) |
| Total (Overall) | 2,134 (55.3%) | 1,725 (44.7%) |
Employment Industries by Sex in Fruitvale
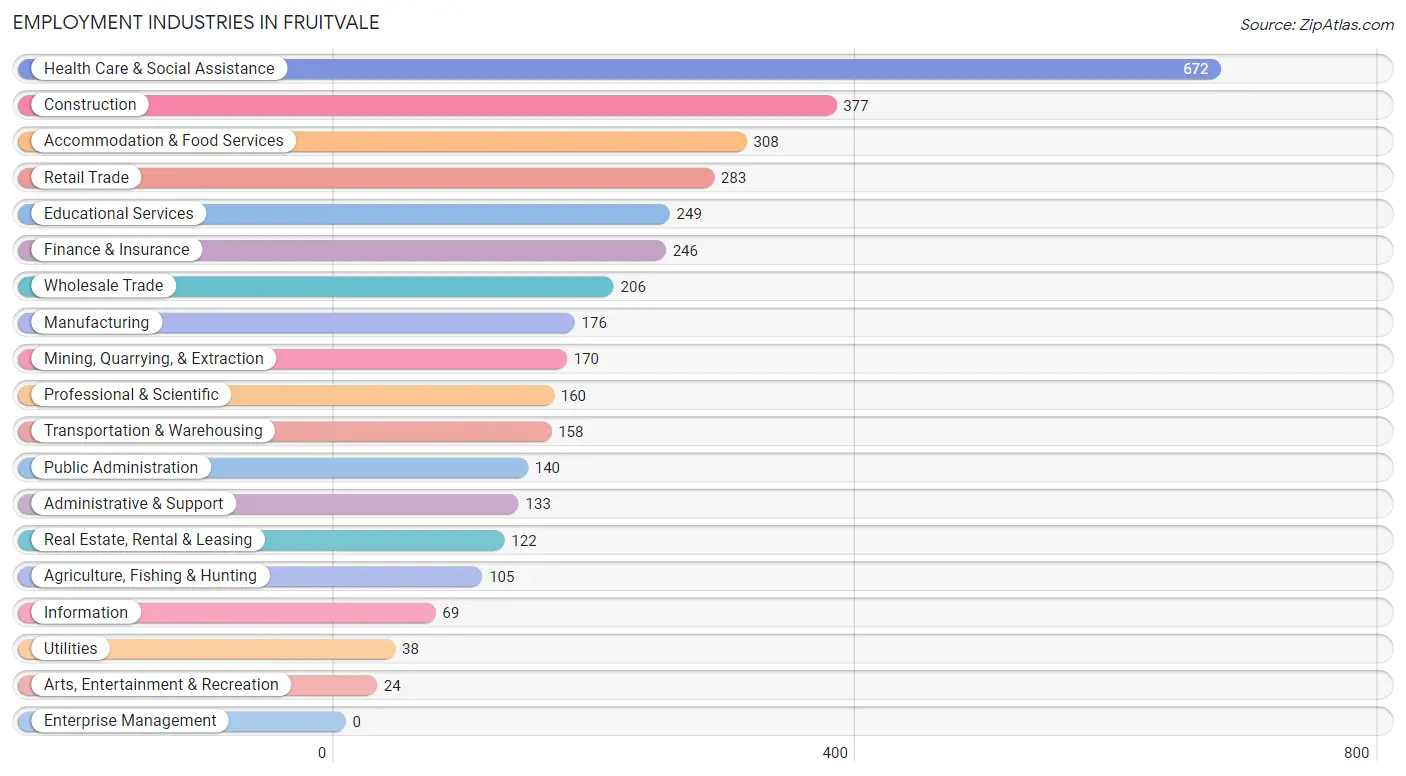
Employment Industries in Fruitvale
The major employment industries in Fruitvale include Health Care & Social Assistance (672 | 17.4%), Construction (377 | 9.8%), Accommodation & Food Services (308 | 8.0%), Retail Trade (283 | 7.3%), and Educational Services (249 | 6.5%).
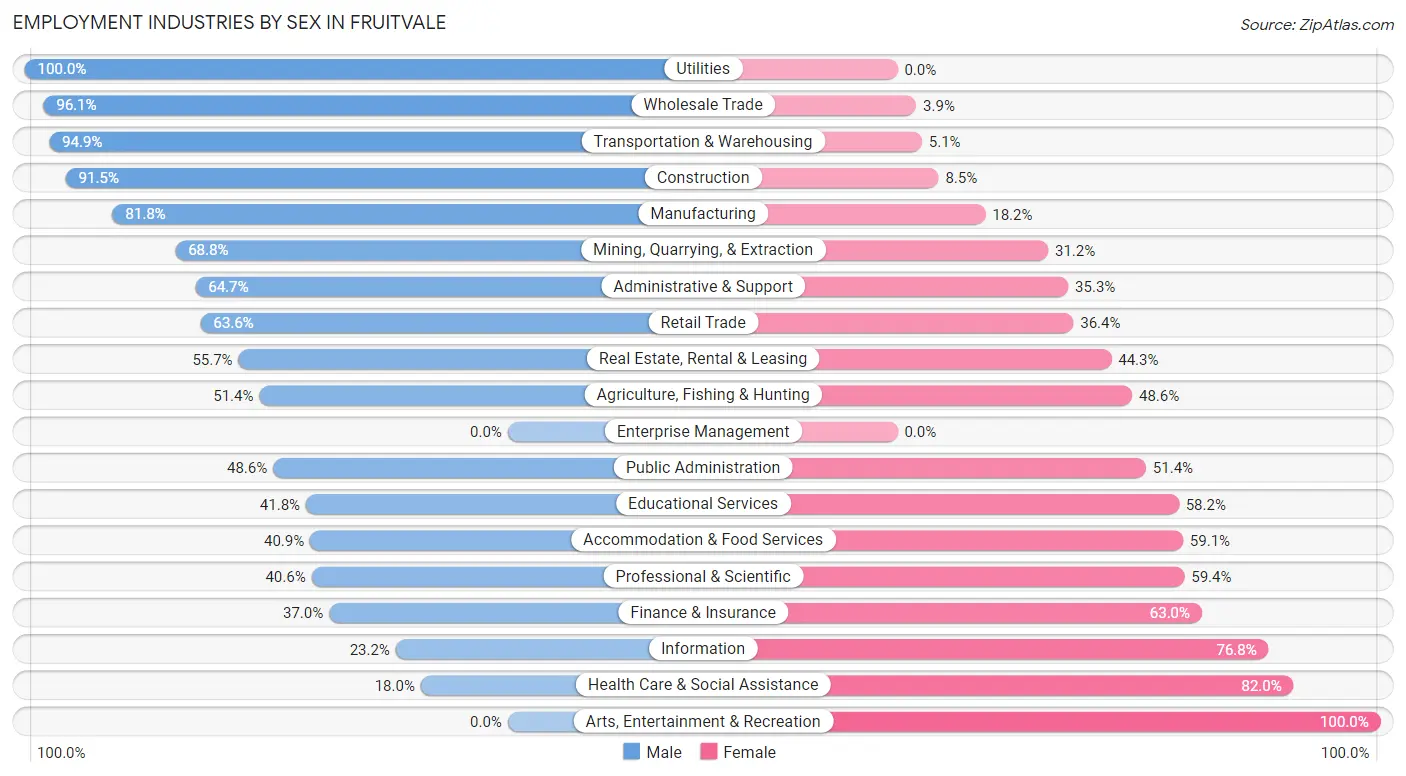
Employment Industries by Sex in Fruitvale
The Fruitvale industries that see more men than women are Utilities (100.0%), Wholesale Trade (96.1%), and Transportation & Warehousing (94.9%), whereas the industries that tend to have a higher number of women are Arts, Entertainment & Recreation (100.0%), Health Care & Social Assistance (82.0%), and Information (76.8%).
| Industry | Male | Female |
| Agriculture, Fishing & Hunting | 54 (51.4%) | 51 (48.6%) |
| Mining, Quarrying, & Extraction | 117 (68.8%) | 53 (31.2%) |
| Construction | 345 (91.5%) | 32 (8.5%) |
| Manufacturing | 144 (81.8%) | 32 (18.2%) |
| Wholesale Trade | 198 (96.1%) | 8 (3.9%) |
| Retail Trade | 180 (63.6%) | 103 (36.4%) |
| Transportation & Warehousing | 150 (94.9%) | 8 (5.1%) |
| Utilities | 38 (100.0%) | 0 (0.0%) |
| Information | 16 (23.2%) | 53 (76.8%) |
| Finance & Insurance | 91 (37.0%) | 155 (63.0%) |
| Real Estate, Rental & Leasing | 68 (55.7%) | 54 (44.3%) |
| Professional & Scientific | 65 (40.6%) | 95 (59.4%) |
| Enterprise Management | 0 (0.0%) | 0 (0.0%) |
| Administrative & Support | 86 (64.7%) | 47 (35.3%) |
| Educational Services | 104 (41.8%) | 145 (58.2%) |
| Health Care & Social Assistance | 121 (18.0%) | 551 (82.0%) |
| Arts, Entertainment & Recreation | 0 (0.0%) | 24 (100.0%) |
| Accommodation & Food Services | 126 (40.9%) | 182 (59.1%) |
| Public Administration | 68 (48.6%) | 72 (51.4%) |
| Total | 2,134 (55.3%) | 1,725 (44.7%) |
Education in Fruitvale
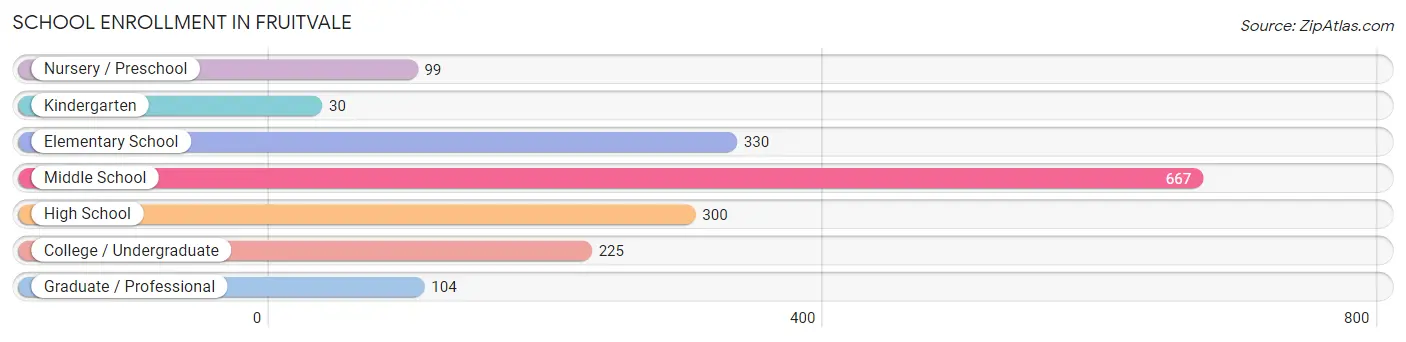
School Enrollment in Fruitvale
The most common levels of schooling among the 1,755 students in Fruitvale are middle school (667 | 38.0%), elementary school (330 | 18.8%), and high school (300 | 17.1%).
| School Level | # Students | % Students |
| Nursery / Preschool | 99 | 5.6% |
| Kindergarten | 30 | 1.7% |
| Elementary School | 330 | 18.8% |
| Middle School | 667 | 38.0% |
| High School | 300 | 17.1% |
| College / Undergraduate | 225 | 12.8% |
| Graduate / Professional | 104 | 5.9% |
| Total | 1,755 | 100.0% |
School Enrollment by Age by Funding Source in Fruitvale
Out of a total of 1,755 students who are enrolled in schools in Fruitvale, 311 (17.7%) attend a private institution, while the remaining 1,444 (82.3%) are enrolled in public schools. The age group of 3 to 4 year olds has the highest likelihood of being enrolled in private schools, with 53 (100.0% in the age bracket) enrolled. Conversely, the age group of 18 to 19 year olds has the lowest likelihood of being enrolled in a private school, with 54 (100.0% in the age bracket) attending a public institution.
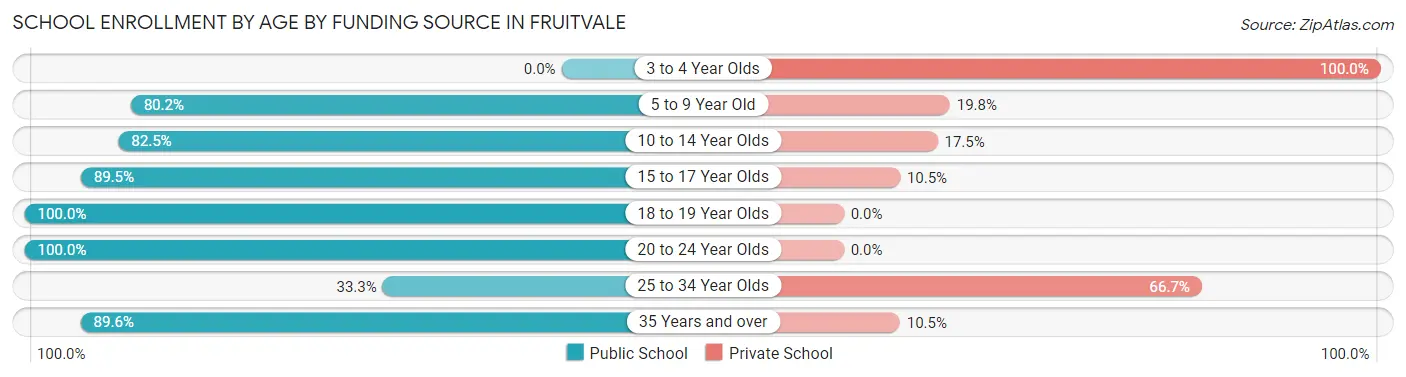
| Age Bracket | Public School | Private School |
| 3 to 4 Year Olds | 0 (0.0%) | 53 (100.0%) |
| 5 to 9 Year Old | 280 (80.2%) | 69 (19.8%) |
| 10 to 14 Year Olds | 623 (82.5%) | 132 (17.5%) |
| 15 to 17 Year Olds | 222 (89.5%) | 26 (10.5%) |
| 18 to 19 Year Olds | 54 (100.0%) | 0 (0.0%) |
| 20 to 24 Year Olds | 80 (100.0%) | 0 (0.0%) |
| 25 to 34 Year Olds | 5 (33.3%) | 10 (66.7%) |
| 35 Years and over | 180 (89.5%) | 21 (10.4%) |
| Total | 1,444 (82.3%) | 311 (17.7%) |
Educational Attainment by Field of Study in Fruitvale
Business (348 | 22.1%), education (225 | 14.3%), psychology (174 | 11.1%), science & technology (164 | 10.4%), and arts & humanities (161 | 10.2%) are the most common fields of study among 1,573 individuals in Fruitvale who have obtained a bachelor's degree or higher.
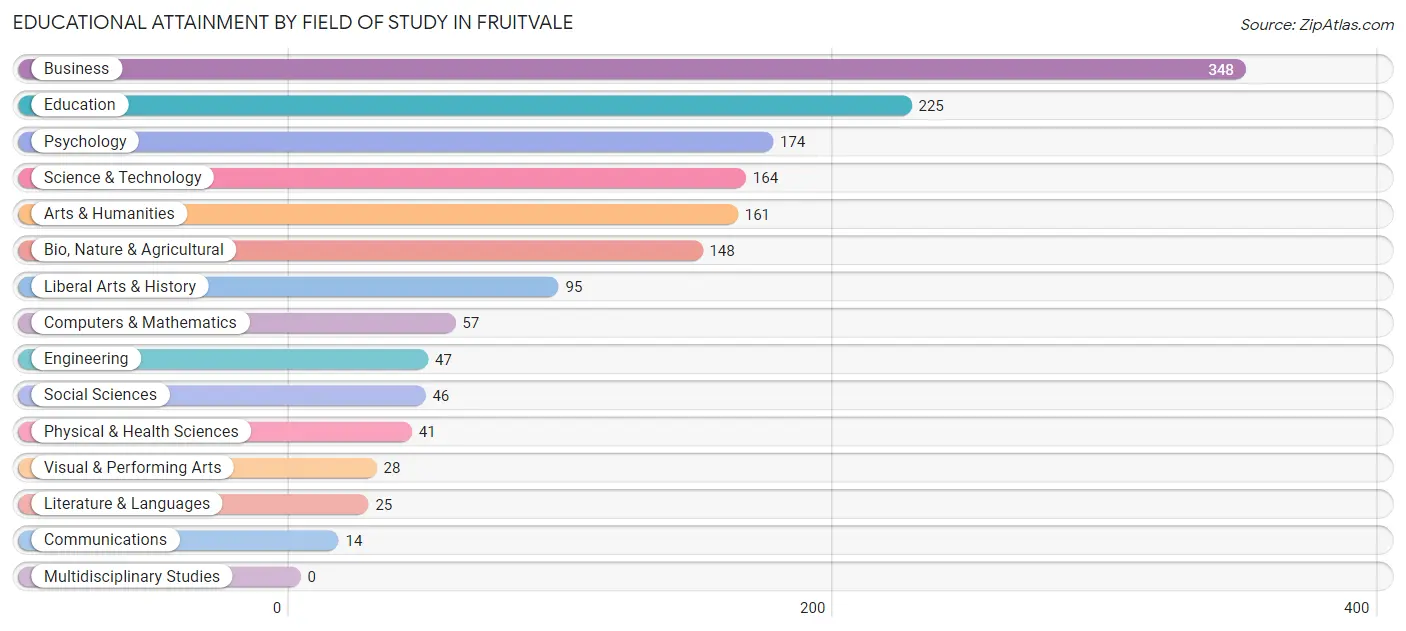
| Field of Study | # Graduates | % Graduates |
| Computers & Mathematics | 57 | 3.6% |
| Bio, Nature & Agricultural | 148 | 9.4% |
| Physical & Health Sciences | 41 | 2.6% |
| Psychology | 174 | 11.1% |
| Social Sciences | 46 | 2.9% |
| Engineering | 47 | 3.0% |
| Multidisciplinary Studies | 0 | 0.0% |
| Science & Technology | 164 | 10.4% |
| Business | 348 | 22.1% |
| Education | 225 | 14.3% |
| Literature & Languages | 25 | 1.6% |
| Liberal Arts & History | 95 | 6.0% |
| Visual & Performing Arts | 28 | 1.8% |
| Communications | 14 | 0.9% |
| Arts & Humanities | 161 | 10.2% |
| Total | 1,573 | 100.0% |
Transportation & Commute in Fruitvale
Vehicle Availability by Sex in Fruitvale
The most prevalent vehicle ownership categories in Fruitvale are males with 2 vehicles (1,028, accounting for 48.6%) and females with 2 vehicles (817, making up 60.2%).
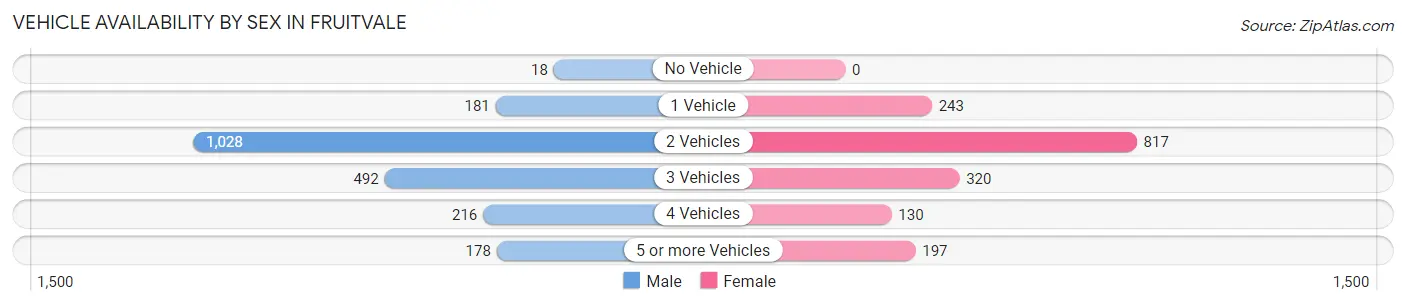
| Vehicles Available | Male | Female |
| No Vehicle | 18 (0.9%) | 0 (0.0%) |
| 1 Vehicle | 181 (8.6%) | 243 (14.2%) |
| 2 Vehicles | 1,028 (48.6%) | 817 (47.9%) |
| 3 Vehicles | 492 (23.3%) | 320 (18.8%) |
| 4 Vehicles | 216 (10.2%) | 130 (7.6%) |
| 5 or more Vehicles | 178 (8.4%) | 197 (11.5%) |
| Total | 2,113 (100.0%) | 1,707 (100.0%) |
Commute Time in Fruitvale
The most frequently occuring commute durations in Fruitvale are 15 to 19 minutes (1,106 commuters, 33.6%), 20 to 24 minutes (668 commuters, 20.3%), and 10 to 14 minutes (654 commuters, 19.9%).
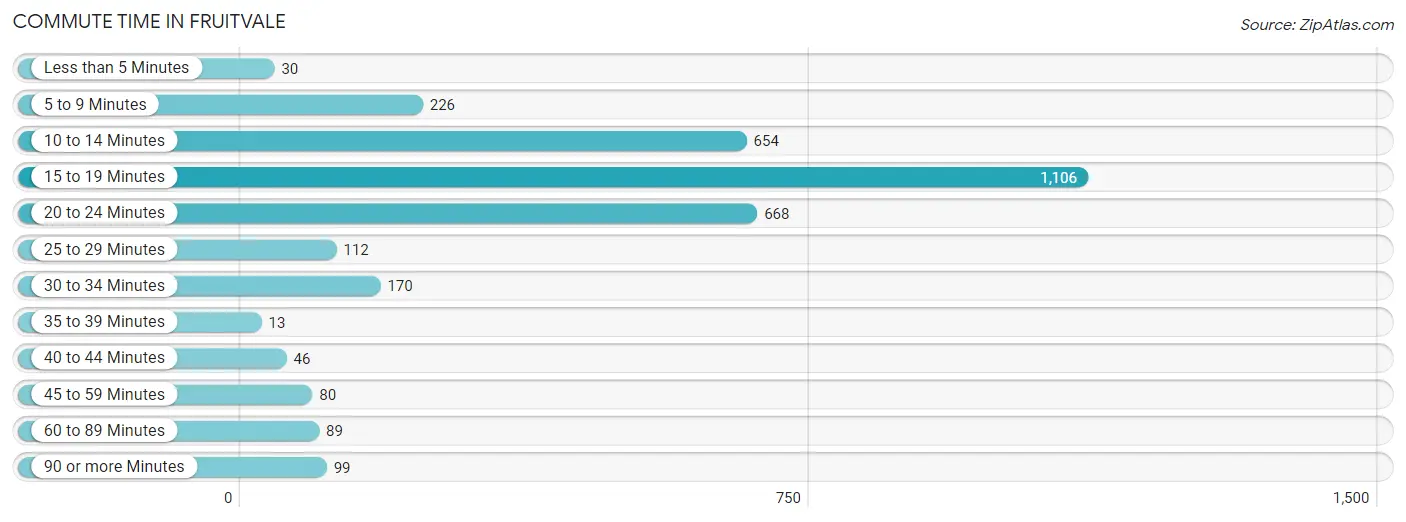
| Commute Time | # Commuters | % Commuters |
| Less than 5 Minutes | 30 | 0.9% |
| 5 to 9 Minutes | 226 | 6.9% |
| 10 to 14 Minutes | 654 | 19.9% |
| 15 to 19 Minutes | 1,106 | 33.6% |
| 20 to 24 Minutes | 668 | 20.3% |
| 25 to 29 Minutes | 112 | 3.4% |
| 30 to 34 Minutes | 170 | 5.2% |
| 35 to 39 Minutes | 13 | 0.4% |
| 40 to 44 Minutes | 46 | 1.4% |
| 45 to 59 Minutes | 80 | 2.4% |
| 60 to 89 Minutes | 89 | 2.7% |
| 90 or more Minutes | 99 | 3.0% |
Commute Time by Sex in Fruitvale
The most common commute times in Fruitvale are 15 to 19 minutes (571 commuters, 30.2%) for males and 15 to 19 minutes (535 commuters, 38.1%) for females.
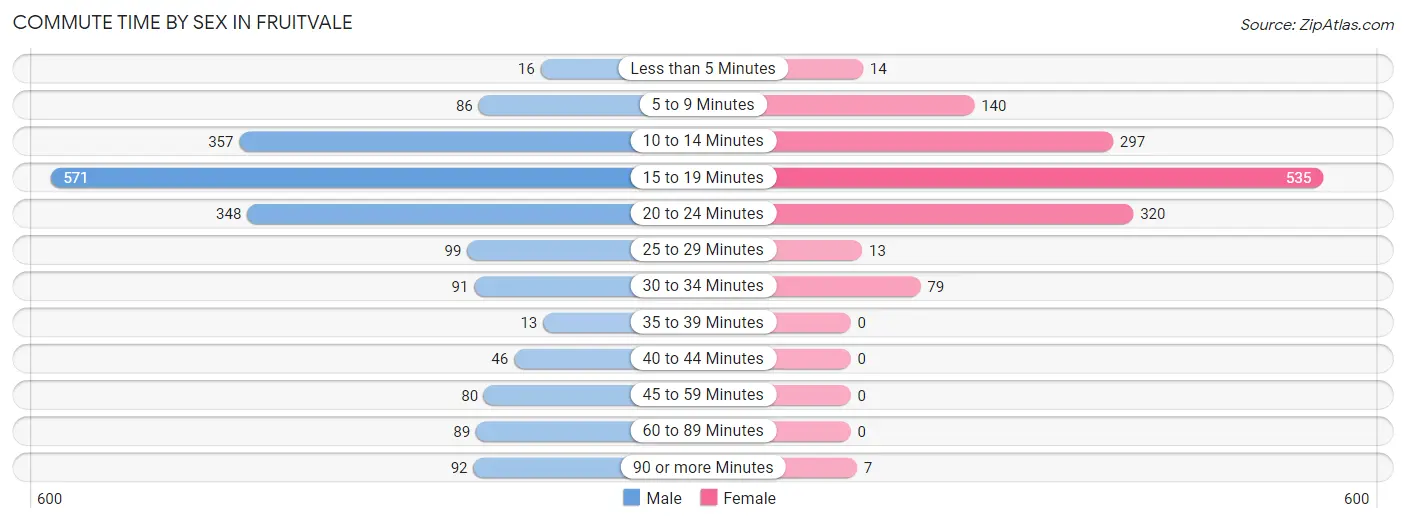
| Commute Time | Male | Female |
| Less than 5 Minutes | 16 (0.9%) | 14 (1.0%) |
| 5 to 9 Minutes | 86 (4.6%) | 140 (10.0%) |
| 10 to 14 Minutes | 357 (18.9%) | 297 (21.1%) |
| 15 to 19 Minutes | 571 (30.2%) | 535 (38.1%) |
| 20 to 24 Minutes | 348 (18.4%) | 320 (22.8%) |
| 25 to 29 Minutes | 99 (5.2%) | 13 (0.9%) |
| 30 to 34 Minutes | 91 (4.8%) | 79 (5.6%) |
| 35 to 39 Minutes | 13 (0.7%) | 0 (0.0%) |
| 40 to 44 Minutes | 46 (2.4%) | 0 (0.0%) |
| 45 to 59 Minutes | 80 (4.2%) | 0 (0.0%) |
| 60 to 89 Minutes | 89 (4.7%) | 0 (0.0%) |
| 90 or more Minutes | 92 (4.9%) | 7 (0.5%) |
Time of Departure to Work by Sex in Fruitvale
The most frequent times of departure to work in Fruitvale are 6:30 AM to 6:59 AM (375, 19.9%) for males and 7:30 AM to 7:59 AM (291, 20.7%) for females.
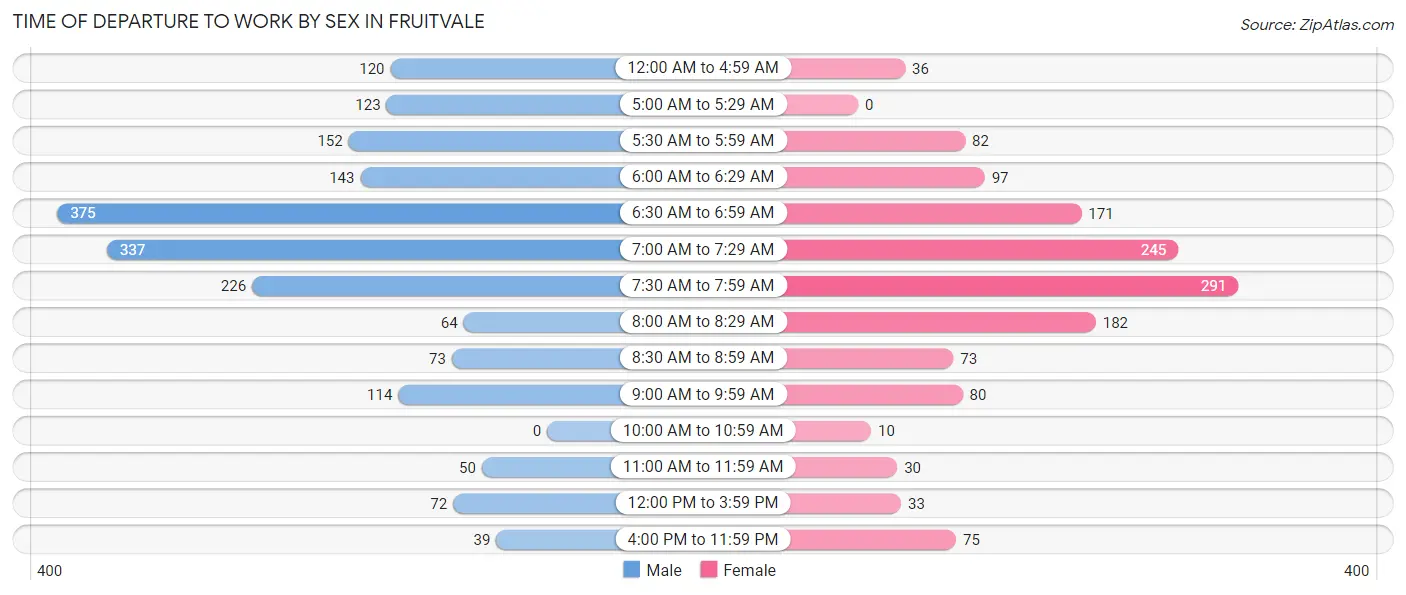
| Time of Departure | Male | Female |
| 12:00 AM to 4:59 AM | 120 (6.4%) | 36 (2.6%) |
| 5:00 AM to 5:29 AM | 123 (6.5%) | 0 (0.0%) |
| 5:30 AM to 5:59 AM | 152 (8.1%) | 82 (5.8%) |
| 6:00 AM to 6:29 AM | 143 (7.6%) | 97 (6.9%) |
| 6:30 AM to 6:59 AM | 375 (19.9%) | 171 (12.2%) |
| 7:00 AM to 7:29 AM | 337 (17.8%) | 245 (17.4%) |
| 7:30 AM to 7:59 AM | 226 (12.0%) | 291 (20.7%) |
| 8:00 AM to 8:29 AM | 64 (3.4%) | 182 (13.0%) |
| 8:30 AM to 8:59 AM | 73 (3.9%) | 73 (5.2%) |
| 9:00 AM to 9:59 AM | 114 (6.0%) | 80 (5.7%) |
| 10:00 AM to 10:59 AM | 0 (0.0%) | 10 (0.7%) |
| 11:00 AM to 11:59 AM | 50 (2.6%) | 30 (2.1%) |
| 12:00 PM to 3:59 PM | 72 (3.8%) | 33 (2.4%) |
| 4:00 PM to 11:59 PM | 39 (2.1%) | 75 (5.3%) |
| Total | 1,888 (100.0%) | 1,405 (100.0%) |
Housing Occupancy in Fruitvale
Occupancy by Ownership in Fruitvale
Of the total 3,237 dwellings in Fruitvale, owner-occupied units account for 3,043 (94.0%), while renter-occupied units make up 194 (6.0%).
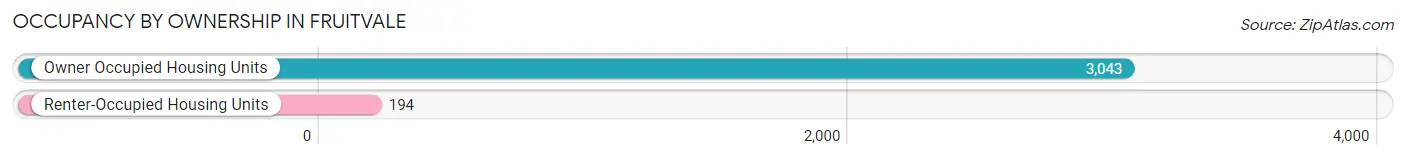
| Occupancy | # Housing Units | % Housing Units |
| Owner Occupied Housing Units | 3,043 | 94.0% |
| Renter-Occupied Housing Units | 194 | 6.0% |
| Total Occupied Housing Units | 3,237 | 100.0% |
Occupancy by Household Size in Fruitvale
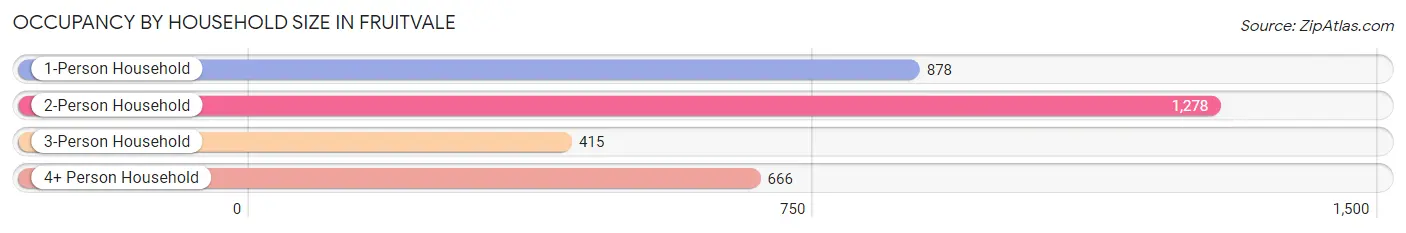
| Household Size | # Housing Units | % Housing Units |
| 1-Person Household | 878 | 27.1% |
| 2-Person Household | 1,278 | 39.5% |
| 3-Person Household | 415 | 12.8% |
| 4+ Person Household | 666 | 20.6% |
| Total Housing Units | 3,237 | 100.0% |
Occupancy by Ownership by Household Size in Fruitvale
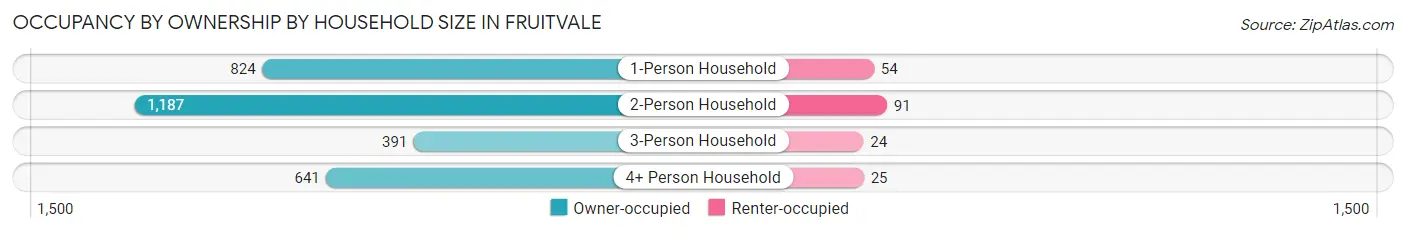
| Household Size | Owner-occupied | Renter-occupied |
| 1-Person Household | 824 (93.9%) | 54 (6.1%) |
| 2-Person Household | 1,187 (92.9%) | 91 (7.1%) |
| 3-Person Household | 391 (94.2%) | 24 (5.8%) |
| 4+ Person Household | 641 (96.3%) | 25 (3.7%) |
| Total Housing Units | 3,043 (94.0%) | 194 (6.0%) |
Occupancy by Educational Attainment in Fruitvale
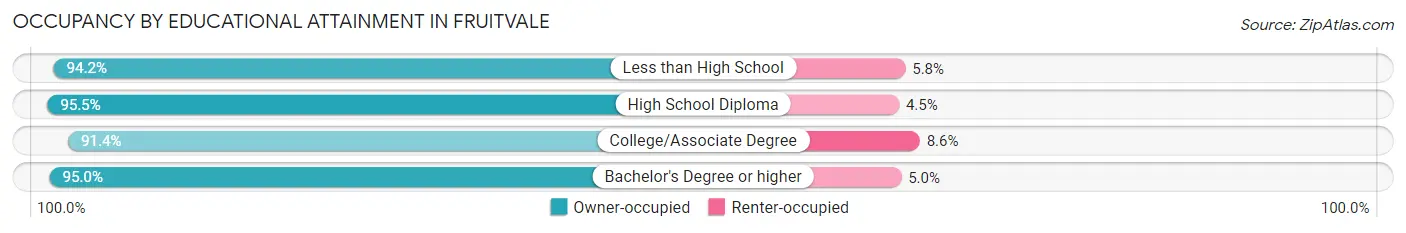
| Household Size | Owner-occupied | Renter-occupied |
| Less than High School | 147 (94.2%) | 9 (5.8%) |
| High School Diploma | 1,161 (95.5%) | 55 (4.5%) |
| College/Associate Degree | 931 (91.4%) | 88 (8.6%) |
| Bachelor's Degree or higher | 804 (95.0%) | 42 (5.0%) |
Occupancy by Age of Householder in Fruitvale
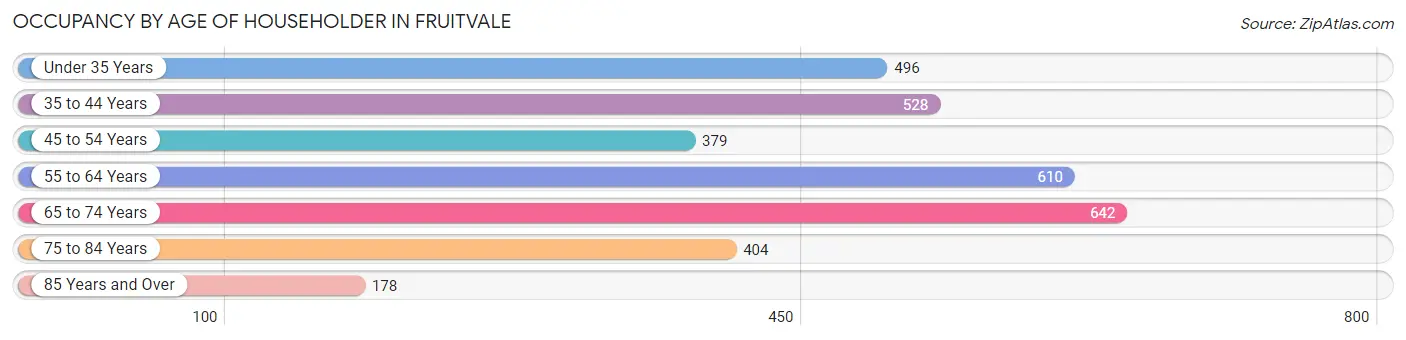
| Age Bracket | # Households | % Households |
| Under 35 Years | 496 | 15.3% |
| 35 to 44 Years | 528 | 16.3% |
| 45 to 54 Years | 379 | 11.7% |
| 55 to 64 Years | 610 | 18.8% |
| 65 to 74 Years | 642 | 19.8% |
| 75 to 84 Years | 404 | 12.5% |
| 85 Years and Over | 178 | 5.5% |
| Total | 3,237 | 100.0% |
Housing Finances in Fruitvale
Median Income by Occupancy in Fruitvale
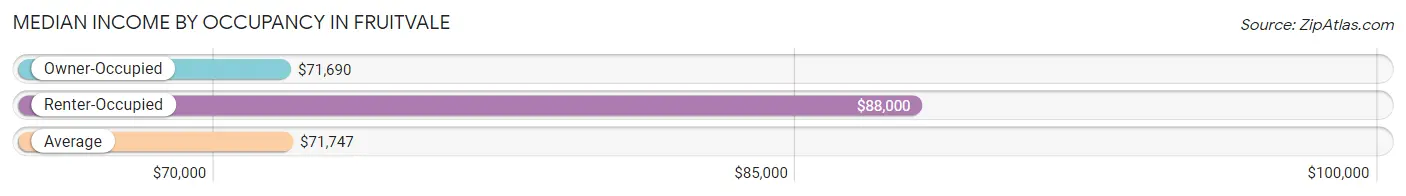
| Occupancy Type | # Households | Median Income |
| Owner-Occupied | 3,043 (94.0%) | $71,690 |
| Renter-Occupied | 194 (6.0%) | $88,000 |
| Average | 3,237 (100.0%) | $71,747 |
Occupancy by Householder Income Bracket in Fruitvale
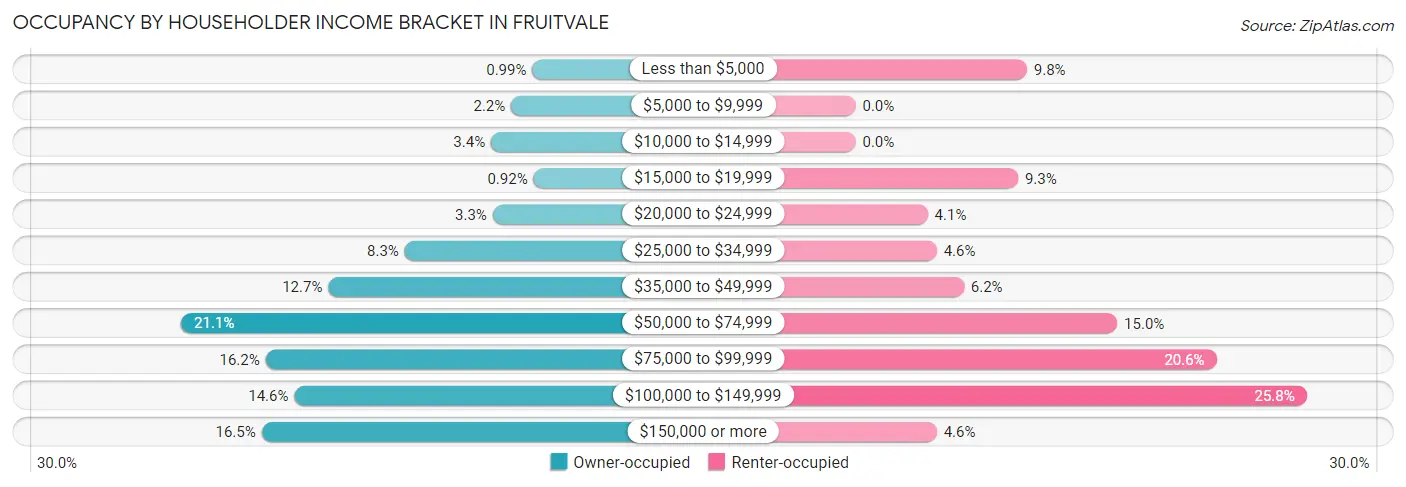
| Income Bracket | Owner-occupied | Renter-occupied |
| Less than $5,000 | 30 (1.0%) | 19 (9.8%) |
| $5,000 to $9,999 | 67 (2.2%) | 0 (0.0%) |
| $10,000 to $14,999 | 102 (3.4%) | 0 (0.0%) |
| $15,000 to $19,999 | 28 (0.9%) | 18 (9.3%) |
| $20,000 to $24,999 | 99 (3.3%) | 8 (4.1%) |
| $25,000 to $34,999 | 252 (8.3%) | 9 (4.6%) |
| $35,000 to $49,999 | 385 (12.7%) | 12 (6.2%) |
| $50,000 to $74,999 | 641 (21.1%) | 29 (14.9%) |
| $75,000 to $99,999 | 494 (16.2%) | 40 (20.6%) |
| $100,000 to $149,999 | 444 (14.6%) | 50 (25.8%) |
| $150,000 or more | 501 (16.5%) | 9 (4.6%) |
| Total | 3,043 (100.0%) | 194 (100.0%) |
Monthly Housing Cost Tiers in Fruitvale
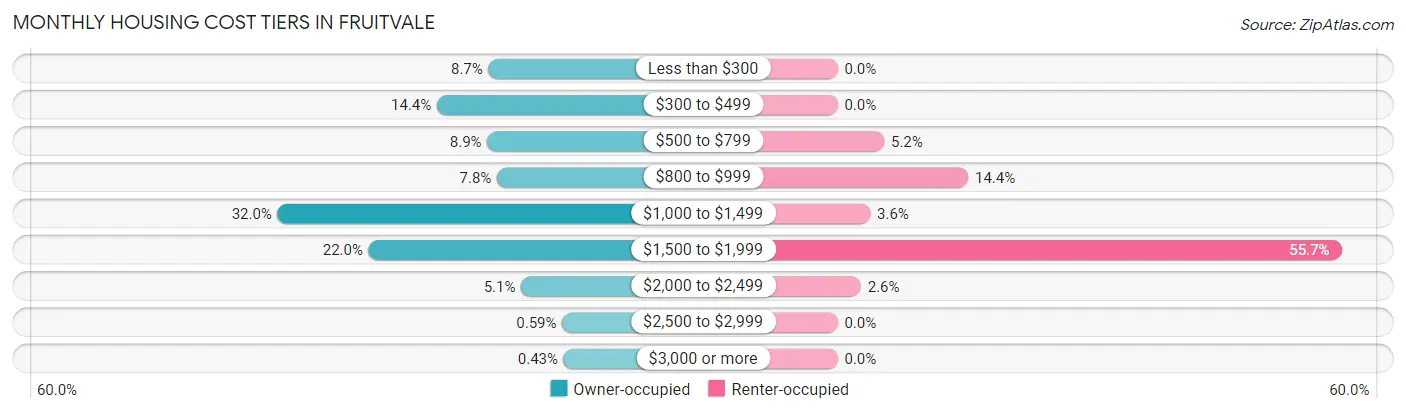
| Monthly Cost | Owner-occupied | Renter-occupied |
| Less than $300 | 266 (8.7%) | 0 (0.0%) |
| $300 to $499 | 439 (14.4%) | 0 (0.0%) |
| $500 to $799 | 270 (8.9%) | 10 (5.1%) |
| $800 to $999 | 237 (7.8%) | 28 (14.4%) |
| $1,000 to $1,499 | 975 (32.0%) | 7 (3.6%) |
| $1,500 to $1,999 | 669 (22.0%) | 108 (55.7%) |
| $2,000 to $2,499 | 156 (5.1%) | 5 (2.6%) |
| $2,500 to $2,999 | 18 (0.6%) | 0 (0.0%) |
| $3,000 or more | 13 (0.4%) | 0 (0.0%) |
| Total | 3,043 (100.0%) | 194 (100.0%) |
Physical Housing Characteristics in Fruitvale
Housing Structures in Fruitvale
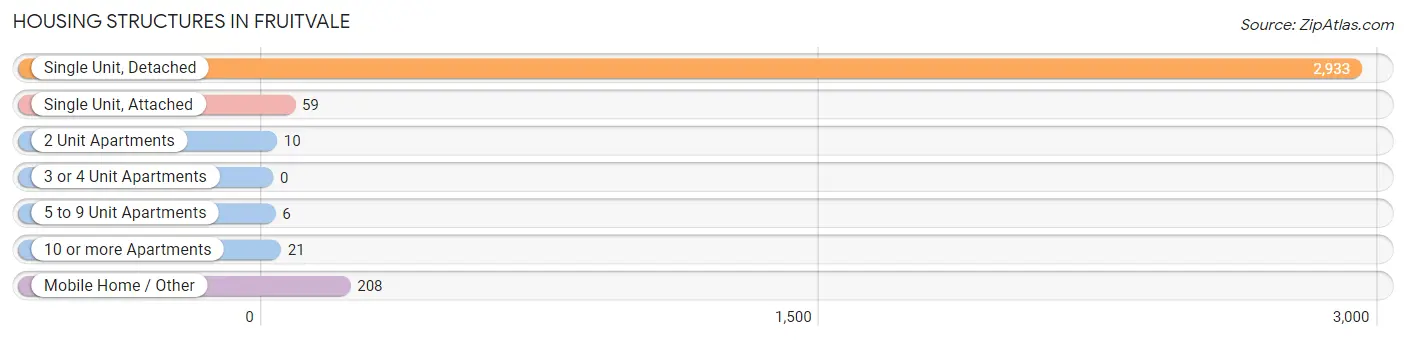
| Structure Type | # Housing Units | % Housing Units |
| Single Unit, Detached | 2,933 | 90.6% |
| Single Unit, Attached | 59 | 1.8% |
| 2 Unit Apartments | 10 | 0.3% |
| 3 or 4 Unit Apartments | 0 | 0.0% |
| 5 to 9 Unit Apartments | 6 | 0.2% |
| 10 or more Apartments | 21 | 0.6% |
| Mobile Home / Other | 208 | 6.4% |
| Total | 3,237 | 100.0% |
Housing Structures by Occupancy in Fruitvale
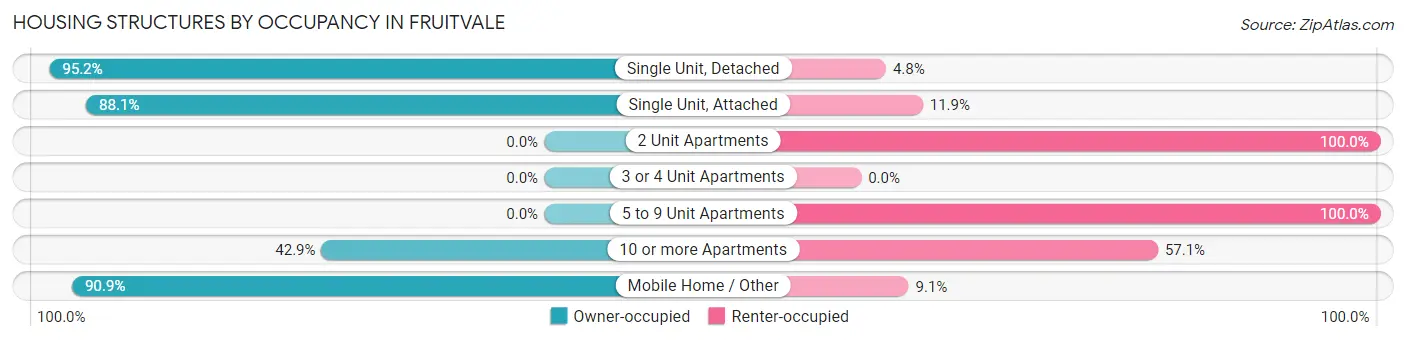
| Structure Type | Owner-occupied | Renter-occupied |
| Single Unit, Detached | 2,793 (95.2%) | 140 (4.8%) |
| Single Unit, Attached | 52 (88.1%) | 7 (11.9%) |
| 2 Unit Apartments | 0 (0.0%) | 10 (100.0%) |
| 3 or 4 Unit Apartments | 0 (0.0%) | 0 (0.0%) |
| 5 to 9 Unit Apartments | 0 (0.0%) | 6 (100.0%) |
| 10 or more Apartments | 9 (42.9%) | 12 (57.1%) |
| Mobile Home / Other | 189 (90.9%) | 19 (9.1%) |
| Total | 3,043 (94.0%) | 194 (6.0%) |
Housing Structures by Number of Rooms in Fruitvale
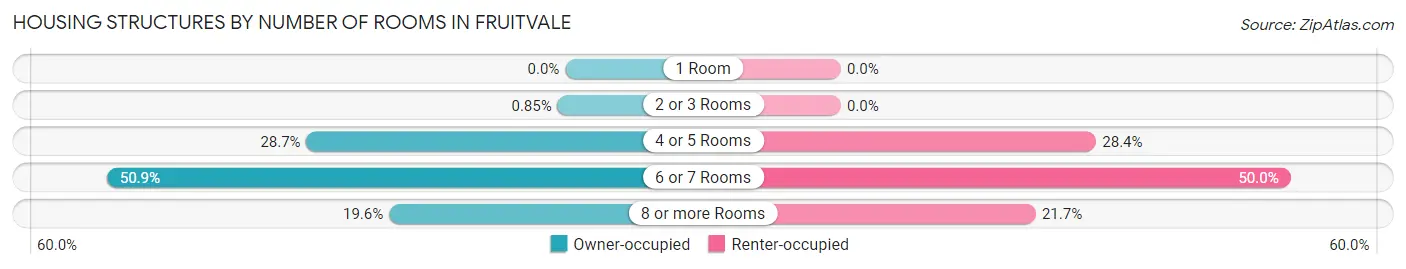
| Number of Rooms | Owner-occupied | Renter-occupied |
| 1 Room | 0 (0.0%) | 0 (0.0%) |
| 2 or 3 Rooms | 26 (0.9%) | 0 (0.0%) |
| 4 or 5 Rooms | 874 (28.7%) | 55 (28.3%) |
| 6 or 7 Rooms | 1,548 (50.9%) | 97 (50.0%) |
| 8 or more Rooms | 595 (19.6%) | 42 (21.6%) |
| Total | 3,043 (100.0%) | 194 (100.0%) |
Housing Structure by Heating Type in Fruitvale
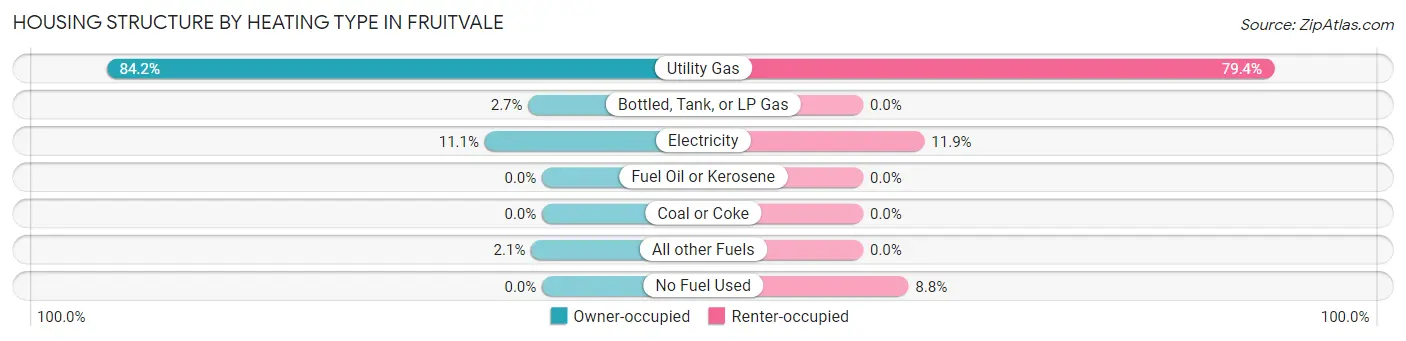
| Heating Type | Owner-occupied | Renter-occupied |
| Utility Gas | 2,561 (84.2%) | 154 (79.4%) |
| Bottled, Tank, or LP Gas | 81 (2.7%) | 0 (0.0%) |
| Electricity | 337 (11.1%) | 23 (11.9%) |
| Fuel Oil or Kerosene | 0 (0.0%) | 0 (0.0%) |
| Coal or Coke | 0 (0.0%) | 0 (0.0%) |
| All other Fuels | 64 (2.1%) | 0 (0.0%) |
| No Fuel Used | 0 (0.0%) | 17 (8.8%) |
| Total | 3,043 (100.0%) | 194 (100.0%) |
Household Vehicle Usage in Fruitvale
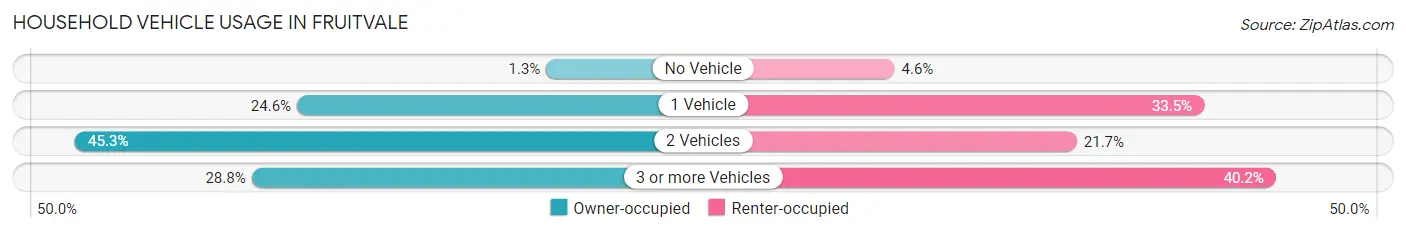
| Vehicles per Household | Owner-occupied | Renter-occupied |
| No Vehicle | 40 (1.3%) | 9 (4.6%) |
| 1 Vehicle | 748 (24.6%) | 65 (33.5%) |
| 2 Vehicles | 1,378 (45.3%) | 42 (21.6%) |
| 3 or more Vehicles | 877 (28.8%) | 78 (40.2%) |
| Total | 3,043 (100.0%) | 194 (100.0%) |
Real Estate & Mortgages in Fruitvale
Real Estate and Mortgage Overview in Fruitvale
| Characteristic | Without Mortgage | With Mortgage |
| Housing Units | 798 | 2,245 |
| Median Property Value | $240,900 | $277,300 |
| Median Household Income | $54,688 | $434 |
| Monthly Housing Costs | $340 | $6 |
| Real Estate Taxes | $1,018 | $47 |
Property Value by Mortgage Status in Fruitvale
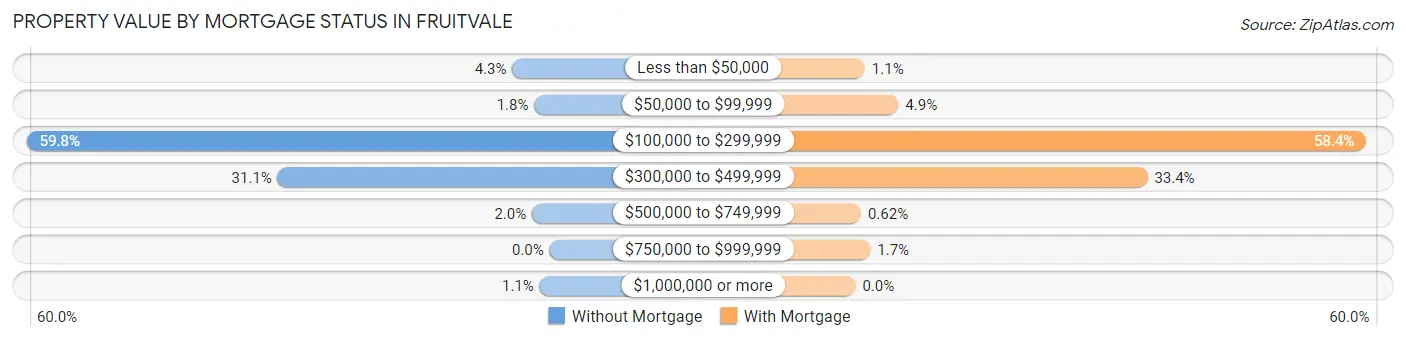
| Property Value | Without Mortgage | With Mortgage |
| Less than $50,000 | 34 (4.3%) | 24 (1.1%) |
| $50,000 to $99,999 | 14 (1.8%) | 110 (4.9%) |
| $100,000 to $299,999 | 477 (59.8%) | 1,310 (58.4%) |
| $300,000 to $499,999 | 248 (31.1%) | 749 (33.4%) |
| $500,000 to $749,999 | 16 (2.0%) | 14 (0.6%) |
| $750,000 to $999,999 | 0 (0.0%) | 38 (1.7%) |
| $1,000,000 or more | 9 (1.1%) | 0 (0.0%) |
| Total | 798 (100.0%) | 2,245 (100.0%) |
Household Income by Mortgage Status in Fruitvale
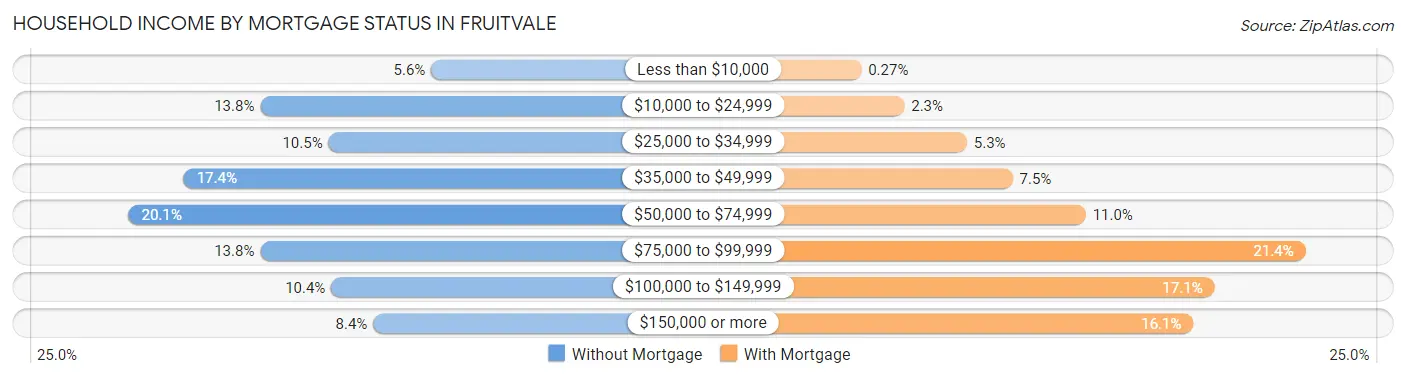
| Household Income | Without Mortgage | With Mortgage |
| Less than $10,000 | 45 (5.6%) | 6 (0.3%) |
| $10,000 to $24,999 | 110 (13.8%) | 52 (2.3%) |
| $25,000 to $34,999 | 84 (10.5%) | 119 (5.3%) |
| $35,000 to $49,999 | 139 (17.4%) | 168 (7.5%) |
| $50,000 to $74,999 | 160 (20.1%) | 246 (11.0%) |
| $75,000 to $99,999 | 110 (13.8%) | 481 (21.4%) |
| $100,000 to $149,999 | 83 (10.4%) | 384 (17.1%) |
| $150,000 or more | 67 (8.4%) | 361 (16.1%) |
| Total | 798 (100.0%) | 2,245 (100.0%) |
Property Value to Household Income Ratio in Fruitvale
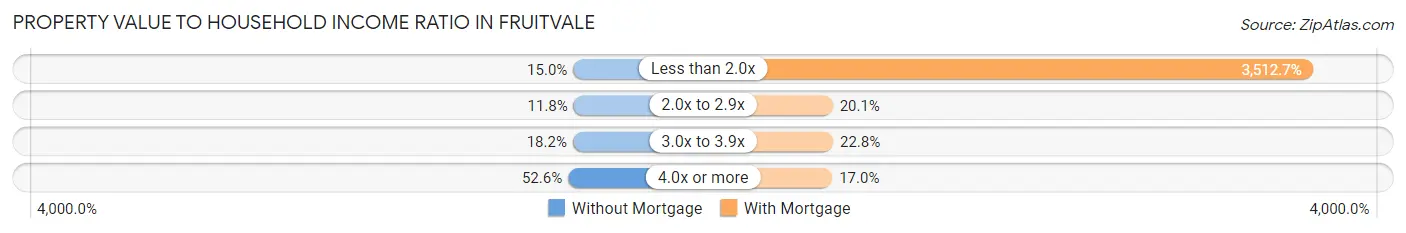
| Value-to-Income Ratio | Without Mortgage | With Mortgage |
| Less than 2.0x | 120 (15.0%) | 78,860 (3,512.7%) |
| 2.0x to 2.9x | 94 (11.8%) | 451 (20.1%) |
| 3.0x to 3.9x | 145 (18.2%) | 512 (22.8%) |
| 4.0x or more | 420 (52.6%) | 382 (17.0%) |
| Total | 798 (100.0%) | 2,245 (100.0%) |
Real Estate Taxes by Mortgage Status in Fruitvale
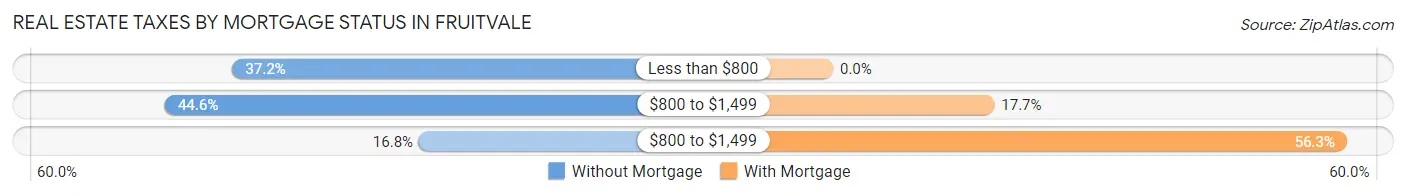
| Property Taxes | Without Mortgage | With Mortgage |
| Less than $800 | 297 (37.2%) | 0 (0.0%) |
| $800 to $1,499 | 356 (44.6%) | 397 (17.7%) |
| $800 to $1,499 | 134 (16.8%) | 1,264 (56.3%) |
| Total | 798 (100.0%) | 2,245 (100.0%) |
Health & Disability in Fruitvale
Health Insurance Coverage by Age in Fruitvale
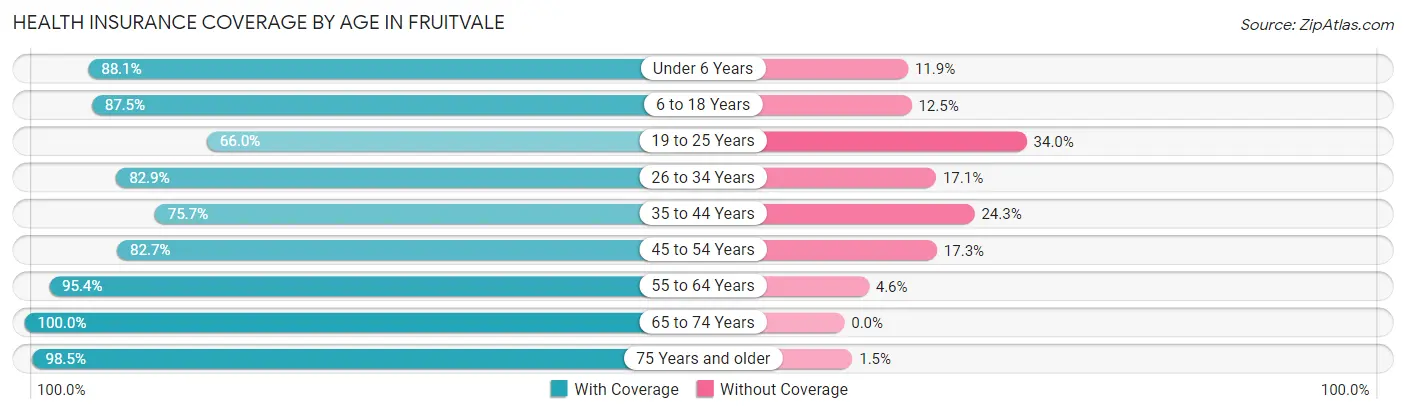
| Age Bracket | With Coverage | Without Coverage |
| Under 6 Years | 482 (88.1%) | 65 (11.9%) |
| 6 to 18 Years | 1,138 (87.5%) | 163 (12.5%) |
| 19 to 25 Years | 297 (66.0%) | 153 (34.0%) |
| 26 to 34 Years | 800 (82.9%) | 165 (17.1%) |
| 35 to 44 Years | 864 (75.7%) | 277 (24.3%) |
| 45 to 54 Years | 637 (82.7%) | 133 (17.3%) |
| 55 to 64 Years | 1,003 (95.4%) | 48 (4.6%) |
| 65 to 74 Years | 990 (100.0%) | 0 (0.0%) |
| 75 Years and older | 795 (98.5%) | 12 (1.5%) |
| Total | 7,006 (87.3%) | 1,016 (12.7%) |
Health Insurance Coverage by Citizenship Status in Fruitvale
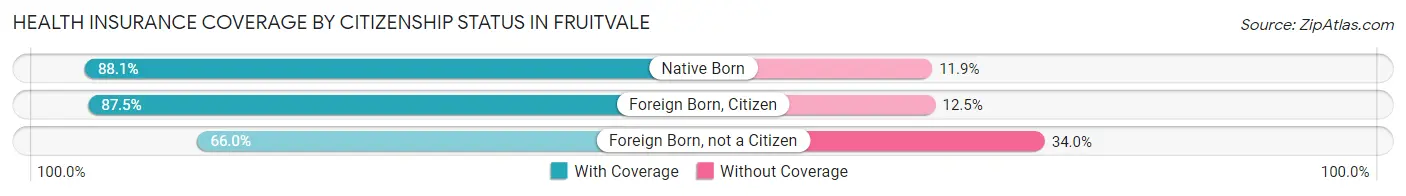
| Citizenship Status | With Coverage | Without Coverage |
| Native Born | 482 (88.1%) | 65 (11.9%) |
| Foreign Born, Citizen | 1,138 (87.5%) | 163 (12.5%) |
| Foreign Born, not a Citizen | 297 (66.0%) | 153 (34.0%) |
Health Insurance Coverage by Household Income in Fruitvale
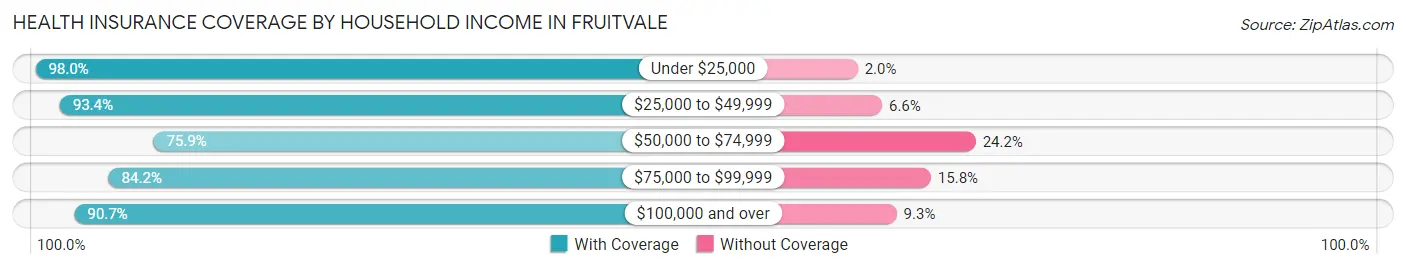
| Household Income | With Coverage | Without Coverage |
| Under $25,000 | 480 (98.0%) | 10 (2.0%) |
| $25,000 to $49,999 | 1,118 (93.4%) | 79 (6.6%) |
| $50,000 to $74,999 | 1,250 (75.8%) | 398 (24.1%) |
| $75,000 to $99,999 | 1,197 (84.2%) | 224 (15.8%) |
| $100,000 and over | 2,961 (90.7%) | 305 (9.3%) |
Public vs Private Health Insurance Coverage by Age in Fruitvale
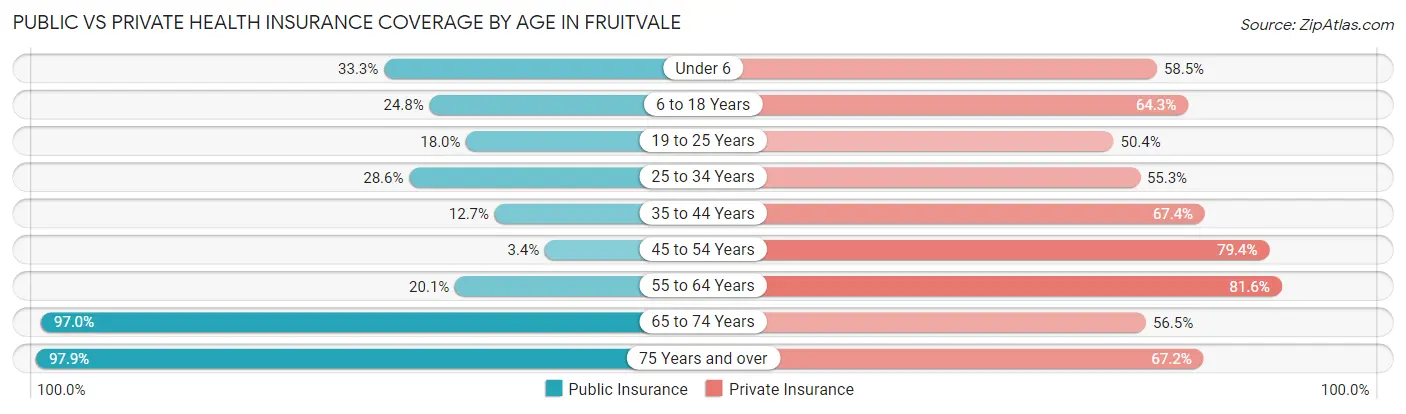
| Age Bracket | Public Insurance | Private Insurance |
| Under 6 | 182 (33.3%) | 320 (58.5%) |
| 6 to 18 Years | 323 (24.8%) | 836 (64.3%) |
| 19 to 25 Years | 81 (18.0%) | 227 (50.4%) |
| 25 to 34 Years | 276 (28.6%) | 534 (55.3%) |
| 35 to 44 Years | 145 (12.7%) | 769 (67.4%) |
| 45 to 54 Years | 26 (3.4%) | 611 (79.3%) |
| 55 to 64 Years | 211 (20.1%) | 858 (81.6%) |
| 65 to 74 Years | 960 (97.0%) | 559 (56.5%) |
| 75 Years and over | 790 (97.9%) | 542 (67.2%) |
| Total | 2,994 (37.3%) | 5,256 (65.5%) |
Disability Status by Sex by Age in Fruitvale
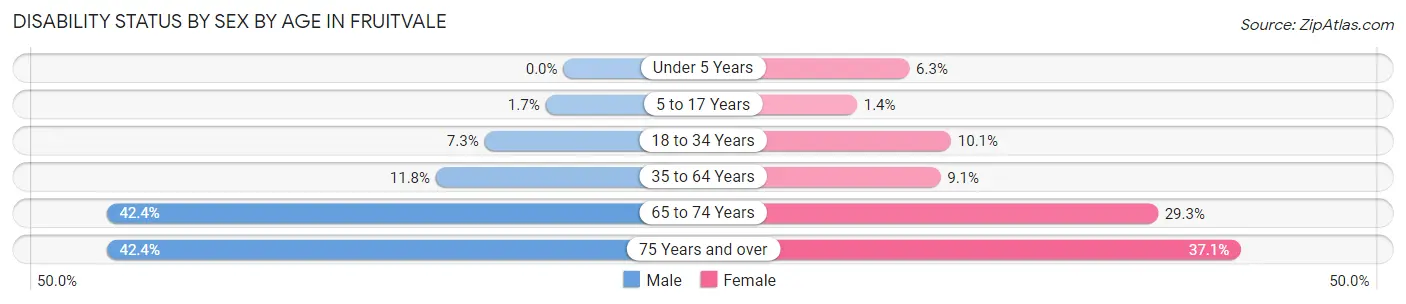
| Age Bracket | Male | Female |
| Under 5 Years | 0 (0.0%) | 13 (6.2%) |
| 5 to 17 Years | 11 (1.7%) | 10 (1.4%) |
| 18 to 34 Years | 59 (7.3%) | 65 (10.1%) |
| 35 to 64 Years | 168 (11.8%) | 141 (9.1%) |
| 65 to 74 Years | 184 (42.4%) | 163 (29.3%) |
| 75 Years and over | 167 (42.4%) | 153 (37.0%) |
Disability Class by Sex by Age in Fruitvale
Disability Class: Hearing Difficulty
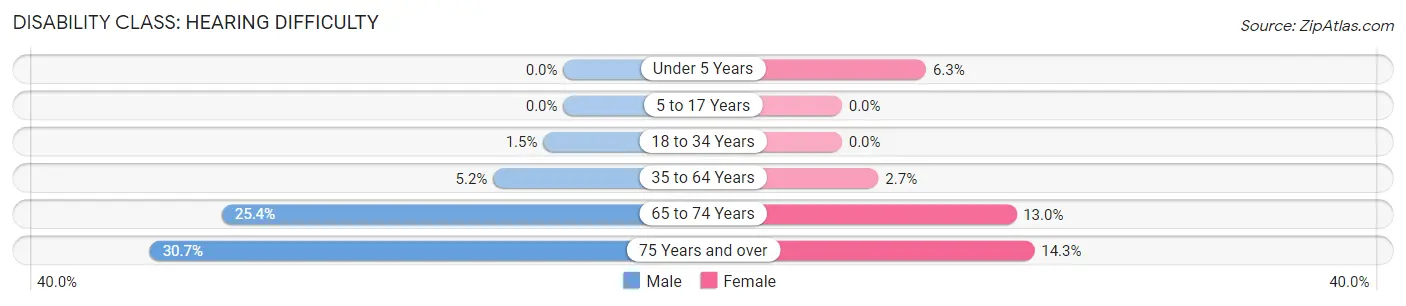
| Age Bracket | Male | Female |
| Under 5 Years | 0 (0.0%) | 13 (6.2%) |
| 5 to 17 Years | 0 (0.0%) | 0 (0.0%) |
| 18 to 34 Years | 12 (1.5%) | 0 (0.0%) |
| 35 to 64 Years | 74 (5.2%) | 42 (2.7%) |
| 65 to 74 Years | 110 (25.4%) | 72 (13.0%) |
| 75 Years and over | 121 (30.7%) | 59 (14.3%) |
Disability Class: Vision Difficulty
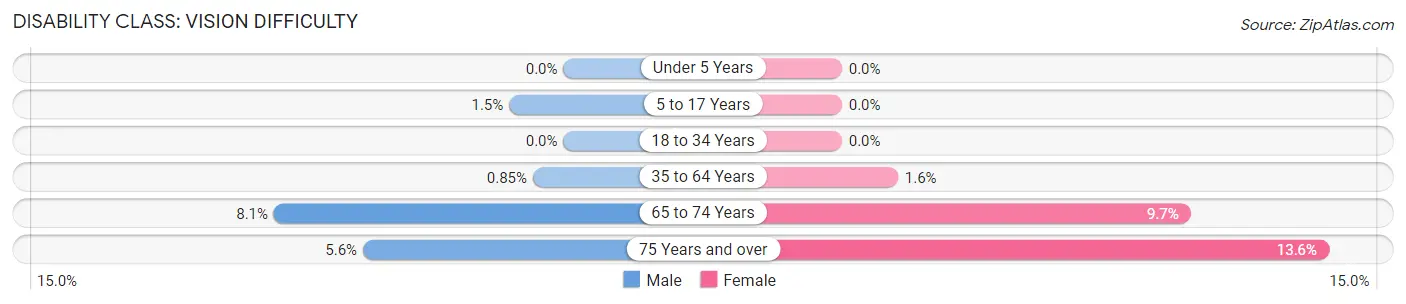
| Age Bracket | Male | Female |
| Under 5 Years | 0 (0.0%) | 0 (0.0%) |
| 5 to 17 Years | 10 (1.5%) | 0 (0.0%) |
| 18 to 34 Years | 0 (0.0%) | 0 (0.0%) |
| 35 to 64 Years | 12 (0.9%) | 24 (1.6%) |
| 65 to 74 Years | 35 (8.1%) | 54 (9.7%) |
| 75 Years and over | 22 (5.6%) | 56 (13.6%) |
Disability Class: Cognitive Difficulty
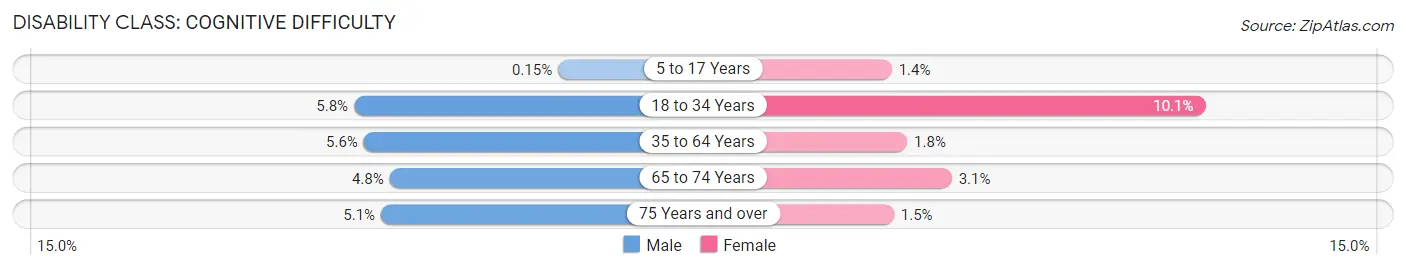
| Age Bracket | Male | Female |
| 5 to 17 Years | 1 (0.2%) | 10 (1.4%) |
| 18 to 34 Years | 47 (5.8%) | 65 (10.1%) |
| 35 to 64 Years | 79 (5.6%) | 28 (1.8%) |
| 65 to 74 Years | 21 (4.8%) | 17 (3.1%) |
| 75 Years and over | 20 (5.1%) | 6 (1.5%) |
Disability Class: Ambulatory Difficulty
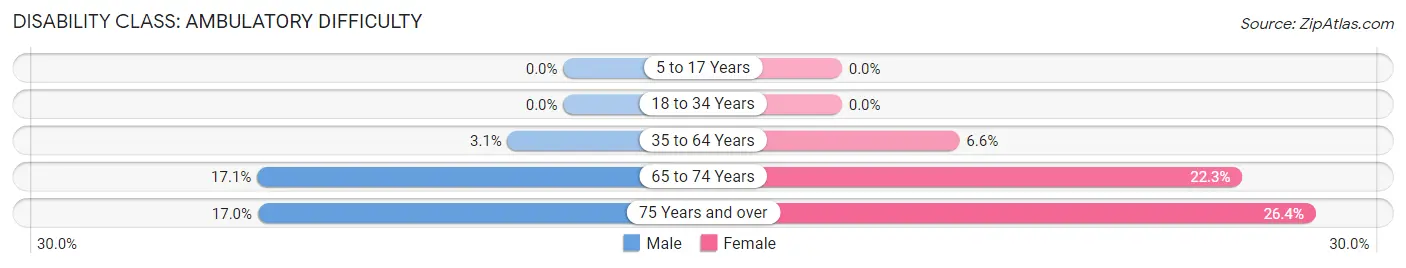
| Age Bracket | Male | Female |
| 5 to 17 Years | 0 (0.0%) | 0 (0.0%) |
| 18 to 34 Years | 0 (0.0%) | 0 (0.0%) |
| 35 to 64 Years | 44 (3.1%) | 101 (6.6%) |
| 65 to 74 Years | 74 (17.1%) | 124 (22.3%) |
| 75 Years and over | 67 (17.0%) | 109 (26.4%) |
Disability Class: Self-Care Difficulty
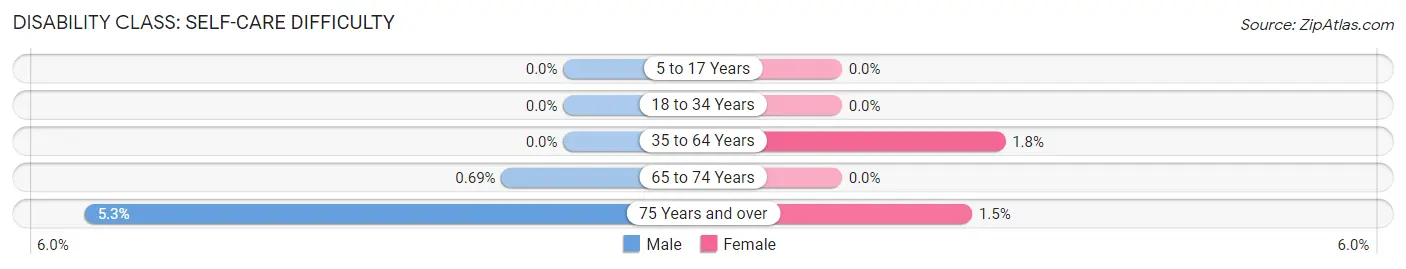
| Age Bracket | Male | Female |
| 5 to 17 Years | 0 (0.0%) | 0 (0.0%) |
| 18 to 34 Years | 0 (0.0%) | 0 (0.0%) |
| 35 to 64 Years | 0 (0.0%) | 28 (1.8%) |
| 65 to 74 Years | 3 (0.7%) | 0 (0.0%) |
| 75 Years and over | 21 (5.3%) | 6 (1.5%) |
Technology Access in Fruitvale
Computing Device Access in Fruitvale
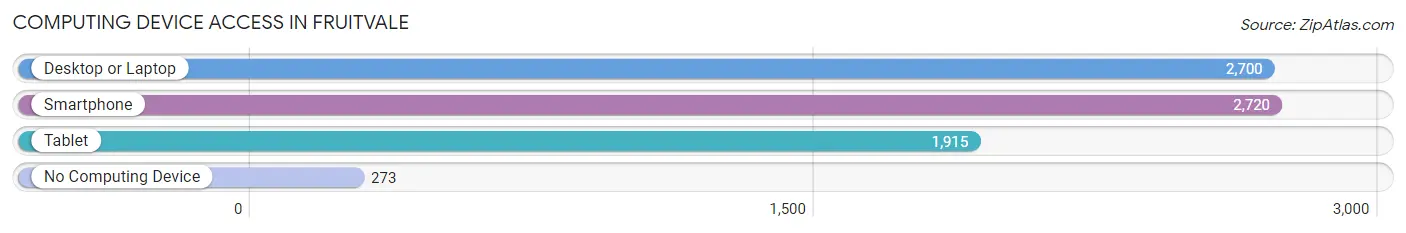
| Device Type | # Households | % Households |
| Desktop or Laptop | 2,700 | 83.4% |
| Smartphone | 2,720 | 84.0% |
| Tablet | 1,915 | 59.2% |
| No Computing Device | 273 | 8.4% |
| Total | 3,237 | 100.0% |
Internet Access in Fruitvale
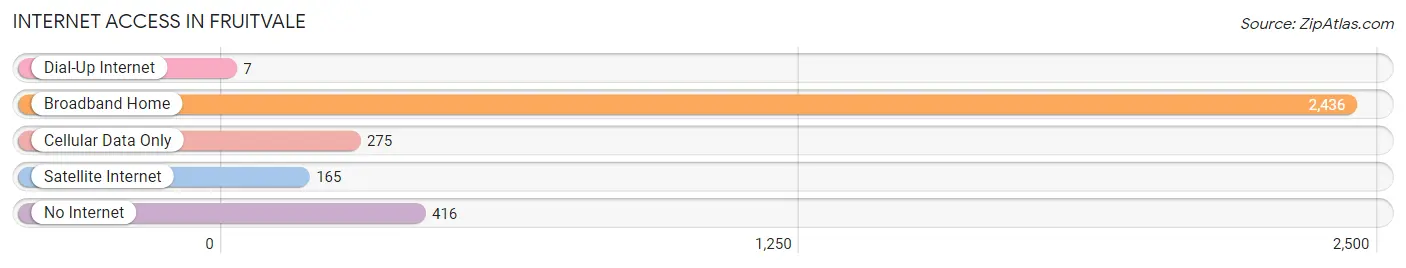
| Internet Type | # Households | % Households |
| Dial-Up Internet | 7 | 0.2% |
| Broadband Home | 2,436 | 75.2% |
| Cellular Data Only | 275 | 8.5% |
| Satellite Internet | 165 | 5.1% |
| No Internet | 416 | 12.9% |
| Total | 3,237 | 100.0% |
Fruitvale Summary
Fruitvale is a small town located in Mesa County, Colorado, United States. It is situated in the Grand Valley, along the Colorado River, and is part of the Grand Junction Metropolitan Statistical Area. The town has a population of approximately 1,500 people and is known for its agricultural heritage and rural lifestyle.
Geography
Fruitvale is located in the Grand Valley of western Colorado, at an elevation of 4,890 feet (1,490 m). The town is situated along the Colorado River, which flows through the valley. The town is surrounded by rolling hills and is located near the Book Cliffs, a mountain range that runs along the western edge of the valley. The climate in Fruitvale is semi-arid, with hot summers and mild winters.
Economy
Fruitvale’s economy is largely based on agriculture. The town is home to several farms and ranches, which produce a variety of crops, including corn, wheat, alfalfa, and hay. Fruitvale is also home to several wineries, which produce a variety of wines from local grapes. The town is also home to several small businesses, including restaurants, shops, and services.
Demographics
As of the 2010 census, Fruitvale had a population of 1,500 people. The racial makeup of the town was 94.2% White, 0.7% African American, 0.7% Native American, 0.7% Asian, 0.7% from other races, and 2.7% from two or more races. Hispanic or Latino of any race were 4.7% of the population.
The median income for a household in Fruitvale was $37,500, and the median income for a family was $41,250. Males had a median income of $30,000 versus $21,250 for females. The per capita income for the town was $17,500. About 8.3% of families and 10.7% of the population were below the poverty line, including 14.3% of those under age 18 and none of those age 65 or over.
History
Fruitvale was founded in 1882 by a group of settlers from the Midwest. The town was named after the abundance of fruit trees in the area. The settlers quickly established a thriving agricultural community, growing a variety of crops, including corn, wheat, alfalfa, and hay. The town also became known for its wineries, which produced a variety of wines from local grapes.
In the early 20th century, Fruitvale experienced a period of growth and prosperity. The town was home to several businesses, including restaurants, shops, and services. The town also had a school, a post office, and a library.
In the late 20th century, Fruitvale began to decline. Many of the businesses closed, and the population began to decline. Today, Fruitvale is a small, rural town with a population of approximately 1,500 people. The town is still known for its agricultural heritage and rural lifestyle.
Common Questions
What is Per Capita Income in Fruitvale?
Per Capita income in Fruitvale is $36,024.
What is the Median Family Income in Fruitvale?
Median Family Income in Fruitvale is $87,399.
What is the Median Household income in Fruitvale?
Median Household Income in Fruitvale is $71,747.
What is Income or Wage Gap in Fruitvale?
Income or Wage Gap in Fruitvale is 24.0%.
Women in Fruitvale earn 76.0 cents for every dollar earned by a man.
What is Family Income Deficit in Fruitvale?
Family Income Deficit in Fruitvale is $5,042.
Families that are below poverty line in Fruitvale earn $5,042 less on average than the poverty threshold level.
What is Inequality or Gini Index in Fruitvale?
Inequality or Gini Index in Fruitvale is 0.39.
What is the Total Population of Fruitvale?
Total Population of Fruitvale is 8,022.
What is the Total Male Population of Fruitvale?
Total Male Population of Fruitvale is 3,942.
What is the Total Female Population of Fruitvale?
Total Female Population of Fruitvale is 4,080.
What is the Ratio of Males per 100 Females in Fruitvale?
There are 96.62 Males per 100 Females in Fruitvale.
What is the Ratio of Females per 100 Males in Fruitvale?
There are 103.50 Females per 100 Males in Fruitvale.
What is the Median Population Age in Fruitvale?
Median Population Age in Fruitvale is 40.4 Years.
What is the Average Family Size in Fruitvale
Average Family Size in Fruitvale is 2.9 People.
What is the Average Household Size in Fruitvale
Average Household Size in Fruitvale is 2.5 People.
How Large is the Labor Force in Fruitvale?
There are 4,039 People in the Labor Forcein in Fruitvale.
What is the Percentage of People in the Labor Force in Fruitvale?
63.2% of People are in the Labor Force in Fruitvale.
What is the Unemployment Rate in Fruitvale?
Unemployment Rate in Fruitvale is 4.5%.