Fruita, CO Map & Demographics
Fruita Map
Fruita Overview
$33,897
PER CAPITA INCOME
$82,281
AVG FAMILY INCOME
$71,550
AVG HOUSEHOLD INCOME
39.6%
WAGE / INCOME GAP [ % ]
60.4¢/ $1
WAGE / INCOME GAP [ $ ]
$12,262
FAMILY INCOME DEFICIT
0.40
INEQUALITY / GINI INDEX
13,462
TOTAL POPULATION
6,307
MALE POPULATION
7,155
FEMALE POPULATION
88.15
MALES / 100 FEMALES
113.45
FEMALES / 100 MALES
40.4
MEDIAN AGE
3.2
AVG FAMILY SIZE
2.7
AVG HOUSEHOLD SIZE
6,544
LABOR FORCE [ PEOPLE ]
63.4%
PERCENT IN LABOR FORCE
3.5%
UNEMPLOYMENT RATE
Fruita Zip Codes
Fruita Area Codes
Income in Fruita
Income Overview in Fruita
Per Capita Income in Fruita is $33,897, while median incomes of families and households are $82,281 and $71,550 respectively.
| Characteristic | Number | Measure |
| Per Capita Income | 13,462 | $33,897 |
| Median Family Income | 3,595 | $82,281 |
| Mean Family Income | 3,595 | $102,958 |
| Median Household Income | 5,018 | $71,550 |
| Mean Household Income | 5,018 | $87,098 |
| Income Deficit | 3,595 | $12,262 |
| Wage / Income Gap (%) | 13,462 | 39.59% |
| Wage / Income Gap ($) | 13,462 | 60.41¢ per $1 |
| Gini / Inequality Index | 13,462 | 0.40 |
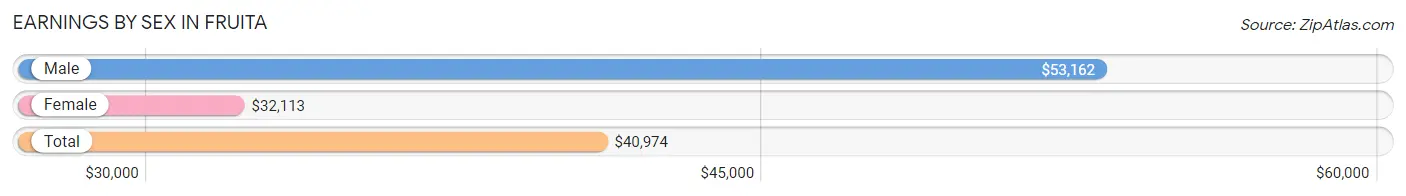
Earnings by Sex in Fruita
Average Earnings in Fruita are $40,974, $53,162 for men and $32,113 for women, a difference of 39.6%.
| Sex | Number | Average Earnings |
| Male | 3,422 (50.3%) | $53,162 |
| Female | 3,383 (49.7%) | $32,113 |
| Total | 6,805 (100.0%) | $40,974 |
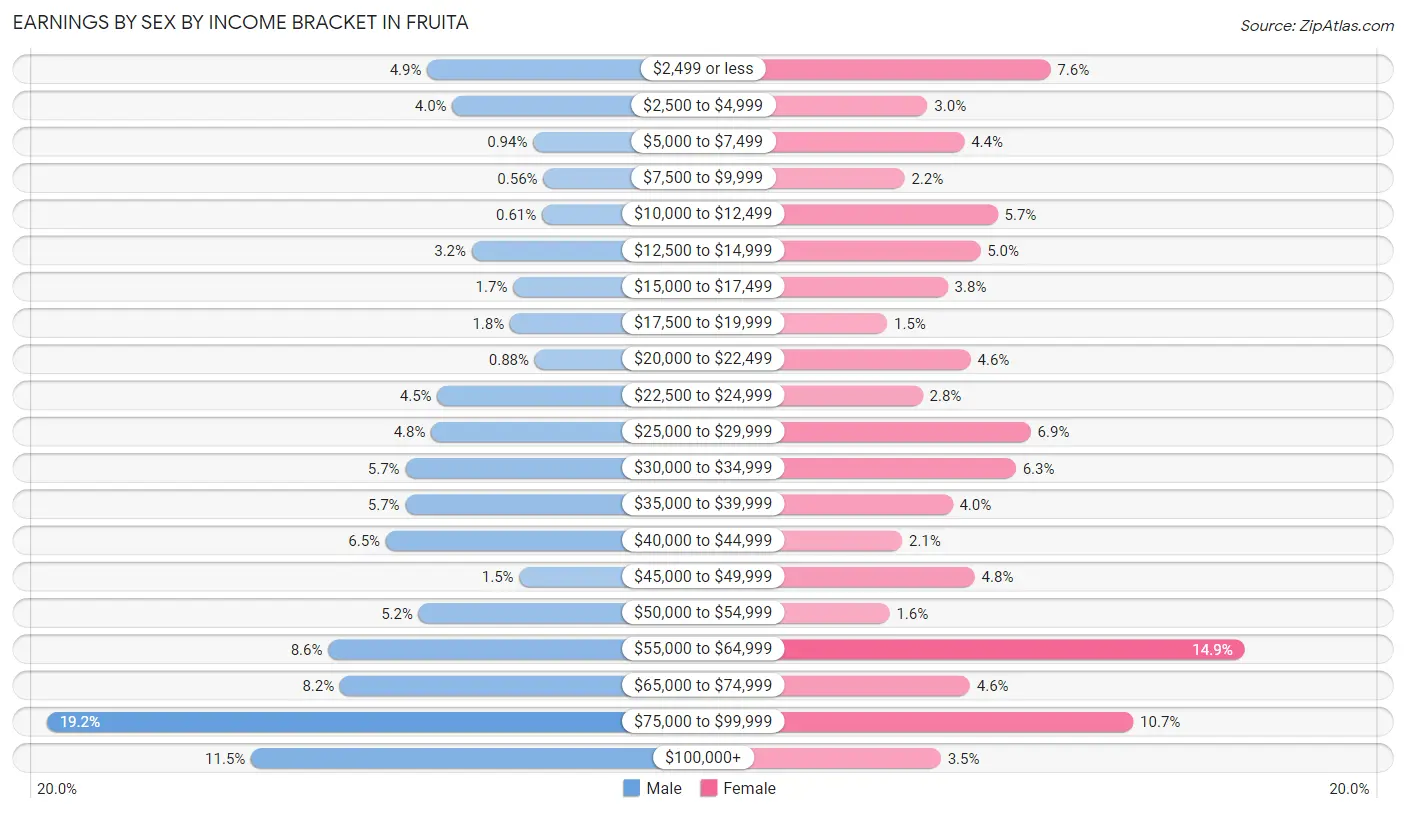
Earnings by Sex by Income Bracket in Fruita
The most common earnings brackets in Fruita are $75,000 to $99,999 for men (656 | 19.2%) and $55,000 to $64,999 for women (504 | 14.9%).
| Income | Male | Female |
| $2,499 or less | 168 (4.9%) | 258 (7.6%) |
| $2,500 to $4,999 | 136 (4.0%) | 102 (3.0%) |
| $5,000 to $7,499 | 32 (0.9%) | 149 (4.4%) |
| $7,500 to $9,999 | 19 (0.6%) | 73 (2.2%) |
| $10,000 to $12,499 | 21 (0.6%) | 191 (5.7%) |
| $12,500 to $14,999 | 111 (3.2%) | 169 (5.0%) |
| $15,000 to $17,499 | 58 (1.7%) | 128 (3.8%) |
| $17,500 to $19,999 | 62 (1.8%) | 51 (1.5%) |
| $20,000 to $22,499 | 30 (0.9%) | 157 (4.6%) |
| $22,500 to $24,999 | 155 (4.5%) | 96 (2.8%) |
| $25,000 to $29,999 | 163 (4.8%) | 233 (6.9%) |
| $30,000 to $34,999 | 196 (5.7%) | 214 (6.3%) |
| $35,000 to $39,999 | 196 (5.7%) | 134 (4.0%) |
| $40,000 to $44,999 | 221 (6.5%) | 70 (2.1%) |
| $45,000 to $49,999 | 50 (1.5%) | 162 (4.8%) |
| $50,000 to $54,999 | 179 (5.2%) | 54 (1.6%) |
| $55,000 to $64,999 | 295 (8.6%) | 504 (14.9%) |
| $65,000 to $74,999 | 280 (8.2%) | 156 (4.6%) |
| $75,000 to $99,999 | 656 (19.2%) | 363 (10.7%) |
| $100,000+ | 394 (11.5%) | 119 (3.5%) |
| Total | 3,422 (100.0%) | 3,383 (100.0%) |
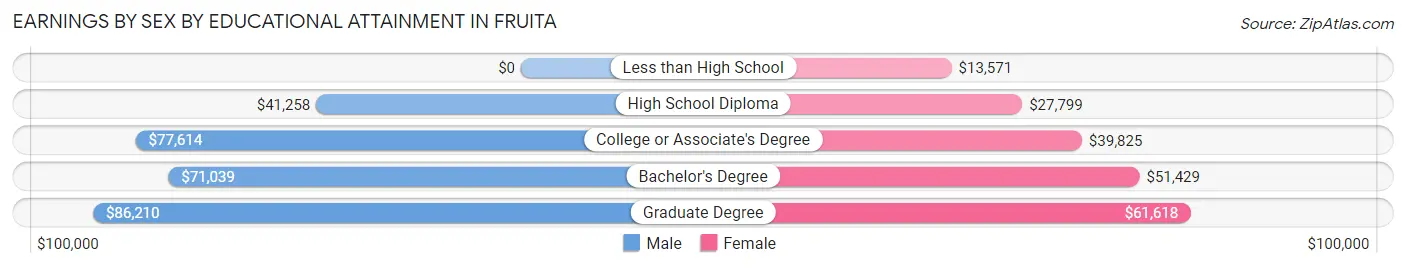
Earnings by Sex by Educational Attainment in Fruita
Average earnings in Fruita are $58,775 for men and $40,000 for women, a difference of 31.9%. Men with an educational attainment of graduate degree enjoy the highest average annual earnings of $86,210, while those with high school diploma education earn the least with $41,258. Women with an educational attainment of graduate degree earn the most with the average annual earnings of $61,618, while those with less than high school education have the smallest earnings of $13,571.
| Educational Attainment | Male Income | Female Income |
| Less than High School | - | - |
| High School Diploma | $41,258 | $27,799 |
| College or Associate's Degree | $77,614 | $39,825 |
| Bachelor's Degree | $71,039 | $51,429 |
| Graduate Degree | $86,210 | $61,618 |
| Total | $58,775 | $40,000 |
Family Income in Fruita
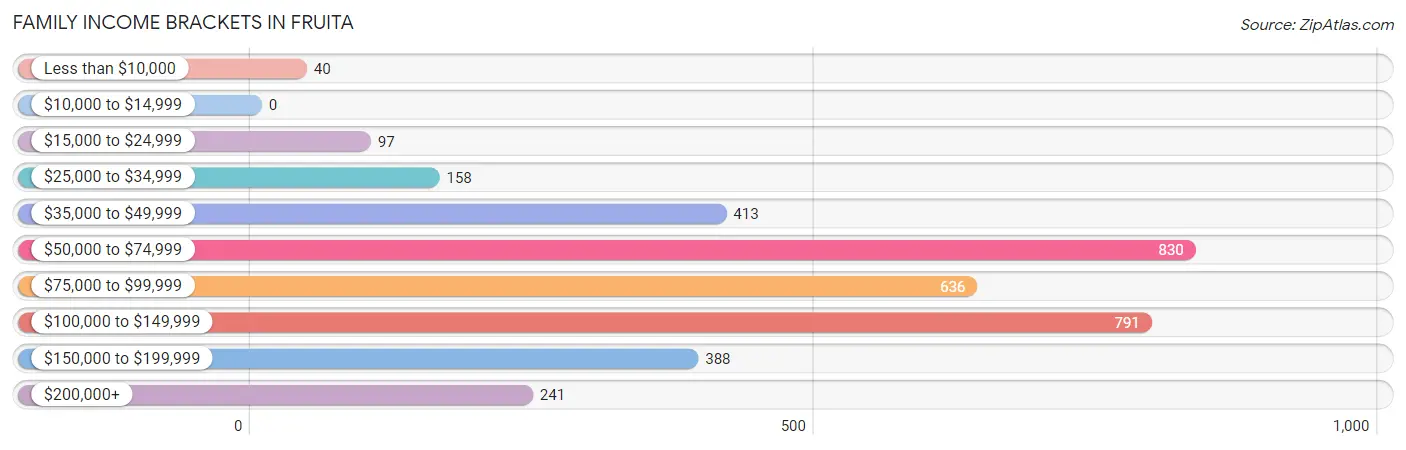
Family Income Brackets in Fruita
According to the Fruita family income data, there are 830 families falling into the $50,000 to $74,999 income range, which is the most common income bracket and makes up 23.1% of all families.
| Income Bracket | # Families | % Families |
| Less than $10,000 | 40 | 1.1% |
| $10,000 to $14,999 | 0 | 0.0% |
| $15,000 to $24,999 | 97 | 2.7% |
| $25,000 to $34,999 | 158 | 4.4% |
| $35,000 to $49,999 | 413 | 11.5% |
| $50,000 to $74,999 | 830 | 23.1% |
| $75,000 to $99,999 | 636 | 17.7% |
| $100,000 to $149,999 | 791 | 22.0% |
| $150,000 to $199,999 | 388 | 10.8% |
| $200,000+ | 241 | 6.7% |
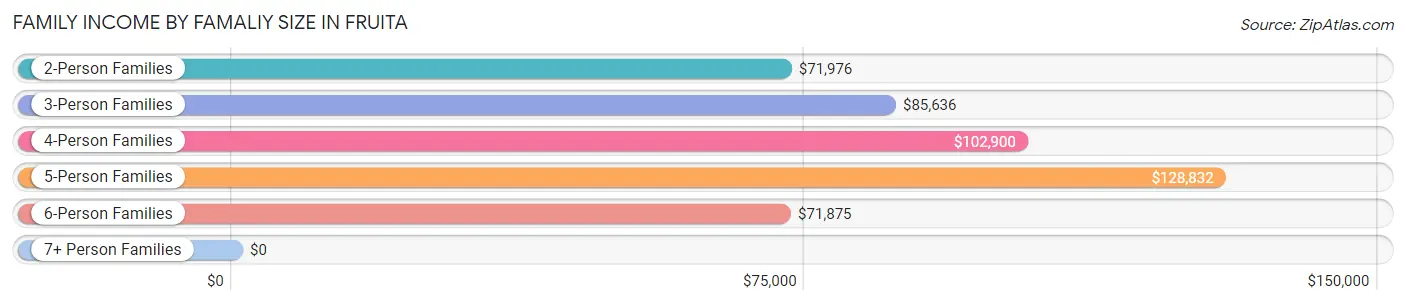
Family Income by Famaliy Size in Fruita
5-person families (365 | 10.2%) account for the highest median family income in Fruita with $128,832 per family, while 2-person families (1,449 | 40.3%) have the highest median income of $35,988 per family member.
| Income Bracket | # Families | Median Income |
| 2-Person Families | 1,449 (40.3%) | $71,976 |
| 3-Person Families | 807 (22.5%) | $85,636 |
| 4-Person Families | 930 (25.9%) | $102,900 |
| 5-Person Families | 365 (10.2%) | $128,832 |
| 6-Person Families | 44 (1.2%) | $71,875 |
| 7+ Person Families | 0 (0.0%) | $0 |
| Total | 3,595 (100.0%) | $82,281 |
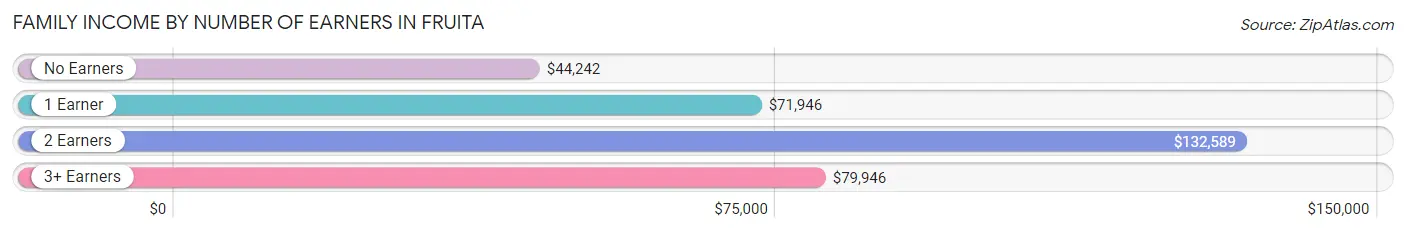
Family Income by Number of Earners in Fruita
The median family income in Fruita is $82,281, with families comprising 2 earners (1,365) having the highest median family income of $132,589, while families with no earners (504) have the lowest median family income of $44,242, accounting for 38.0% and 14.0% of families, respectively.
| Number of Earners | # Families | Median Income |
| No Earners | 504 (14.0%) | $44,242 |
| 1 Earner | 1,199 (33.4%) | $71,946 |
| 2 Earners | 1,365 (38.0%) | $132,589 |
| 3+ Earners | 527 (14.7%) | $79,946 |
| Total | 3,595 (100.0%) | $82,281 |
Household Income in Fruita
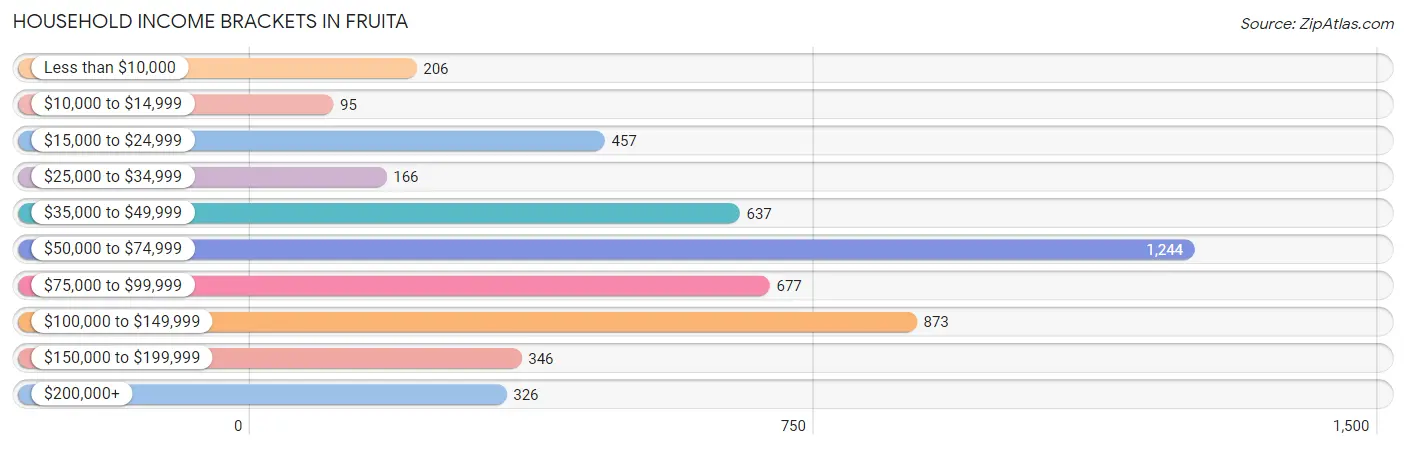
Household Income Brackets in Fruita
With 1,244 households falling in the category, the $50,000 to $74,999 income range is the most frequent in Fruita, accounting for 24.8% of all households. In contrast, only 95 households (1.9%) fall into the $10,000 to $14,999 income bracket, making it the least populous group.
| Income Bracket | # Households | % Households |
| Less than $10,000 | 206 | 4.1% |
| $10,000 to $14,999 | 95 | 1.9% |
| $15,000 to $24,999 | 457 | 9.1% |
| $25,000 to $34,999 | 166 | 3.3% |
| $35,000 to $49,999 | 637 | 12.7% |
| $50,000 to $74,999 | 1,244 | 24.8% |
| $75,000 to $99,999 | 677 | 13.5% |
| $100,000 to $149,999 | 873 | 17.4% |
| $150,000 to $199,999 | 346 | 6.9% |
| $200,000+ | 326 | 6.5% |
Household Income by Householder Age in Fruita
The median household income in Fruita is $71,550, with the highest median household income of $100,821 found in the 45 to 64 years age bracket for the primary householder. A total of 1,657 households (33.0%) fall into this category. Meanwhile, the 15 to 24 years age bracket for the primary householder has the lowest median household income of $0, with 114 households (2.3%) in this group.
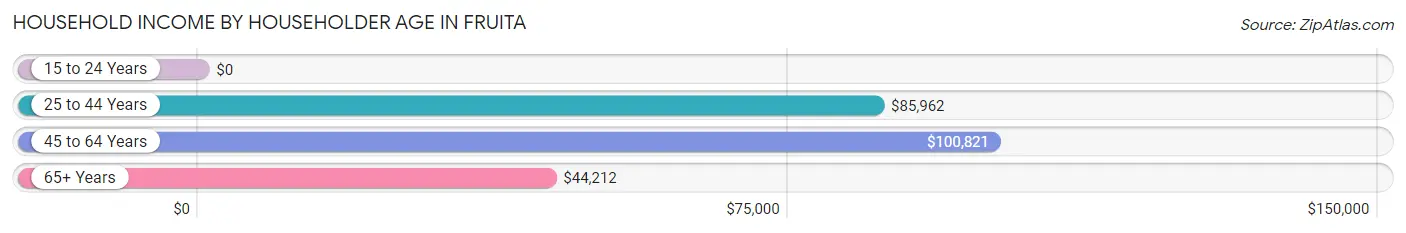
| Income Bracket | # Households | Median Income |
| 15 to 24 Years | 114 (2.3%) | $0 |
| 25 to 44 Years | 1,490 (29.7%) | $85,962 |
| 45 to 64 Years | 1,657 (33.0%) | $100,821 |
| 65+ Years | 1,757 (35.0%) | $44,212 |
| Total | 5,018 (100.0%) | $71,550 |
Poverty in Fruita
Income Below Poverty by Sex and Age in Fruita
With 6.2% poverty level for males and 6.2% for females among the residents of Fruita, 18 to 24 year old males and 18 to 24 year old females are the most vulnerable to poverty, with 136 males (29.3%) and 64 females (19.3%) in their respective age groups living below the poverty level.
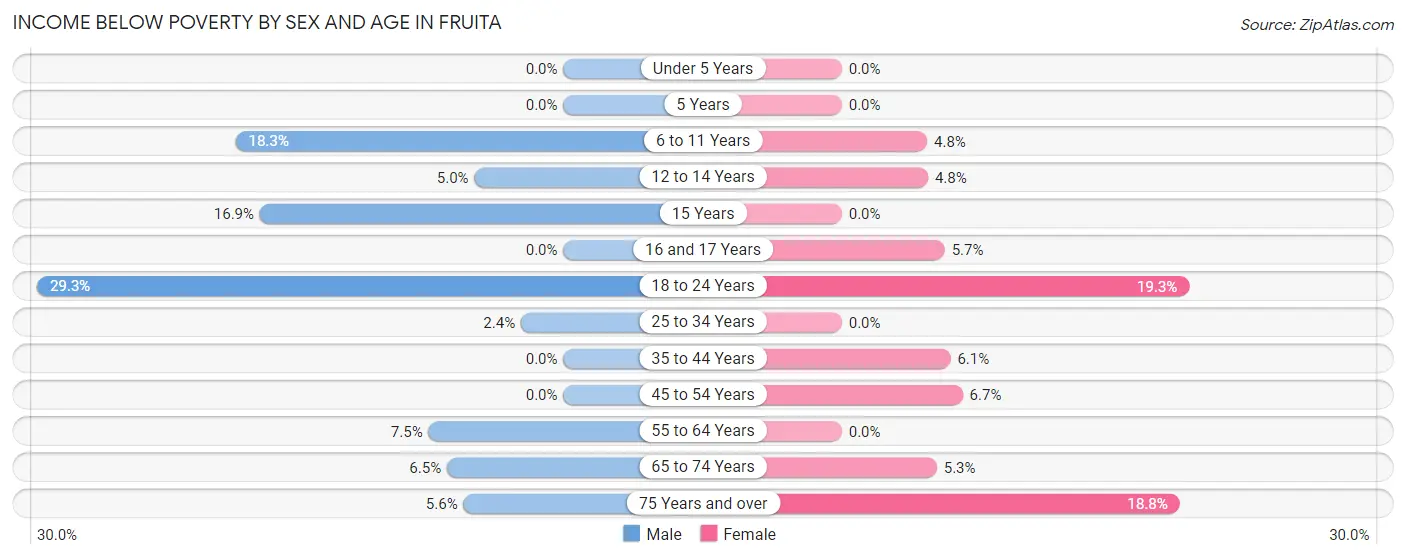
| Age Bracket | Male | Female |
| Under 5 Years | 0 (0.0%) | 0 (0.0%) |
| 5 Years | 0 (0.0%) | 0 (0.0%) |
| 6 to 11 Years | 77 (18.2%) | 28 (4.8%) |
| 12 to 14 Years | 19 (5.0%) | 27 (4.8%) |
| 15 Years | 36 (16.9%) | 0 (0.0%) |
| 16 and 17 Years | 0 (0.0%) | 22 (5.7%) |
| 18 to 24 Years | 136 (29.3%) | 64 (19.3%) |
| 25 to 34 Years | 19 (2.4%) | 0 (0.0%) |
| 35 to 44 Years | 0 (0.0%) | 59 (6.0%) |
| 45 to 54 Years | 0 (0.0%) | 52 (6.7%) |
| 55 to 64 Years | 37 (7.5%) | 0 (0.0%) |
| 65 to 74 Years | 33 (6.5%) | 33 (5.3%) |
| 75 Years and over | 32 (5.6%) | 155 (18.8%) |
| Total | 389 (6.2%) | 440 (6.2%) |
Income Above Poverty by Sex and Age in Fruita
According to the poverty statistics in Fruita, males aged under 5 years and females aged under 5 years are the age groups that are most secure financially, with 100.0% of males and 100.0% of females in these age groups living above the poverty line.
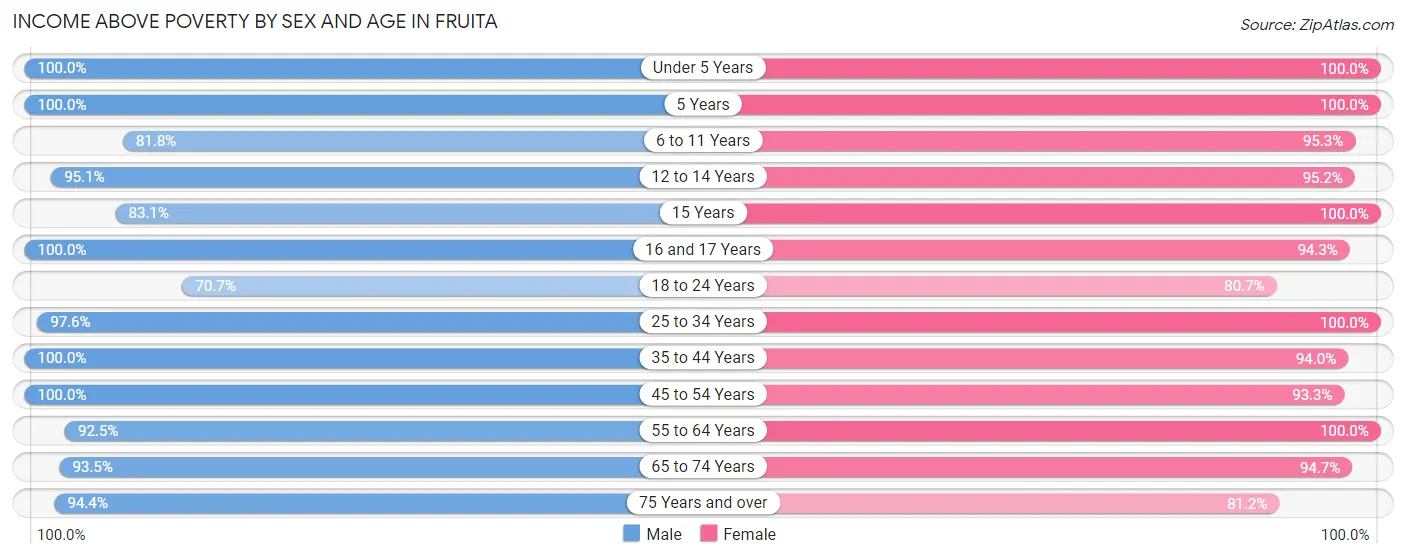
| Age Bracket | Male | Female |
| Under 5 Years | 312 (100.0%) | 378 (100.0%) |
| 5 Years | 71 (100.0%) | 68 (100.0%) |
| 6 to 11 Years | 345 (81.8%) | 562 (95.3%) |
| 12 to 14 Years | 365 (95.1%) | 535 (95.2%) |
| 15 Years | 177 (83.1%) | 140 (100.0%) |
| 16 and 17 Years | 242 (100.0%) | 362 (94.3%) |
| 18 to 24 Years | 328 (70.7%) | 267 (80.7%) |
| 25 to 34 Years | 786 (97.6%) | 693 (100.0%) |
| 35 to 44 Years | 750 (100.0%) | 916 (94.0%) |
| 45 to 54 Years | 1,033 (100.0%) | 721 (93.3%) |
| 55 to 64 Years | 456 (92.5%) | 753 (100.0%) |
| 65 to 74 Years | 476 (93.5%) | 591 (94.7%) |
| 75 Years and over | 544 (94.4%) | 669 (81.2%) |
| Total | 5,885 (93.8%) | 6,655 (93.8%) |
Income Below Poverty Among Married-Couple Families in Fruita
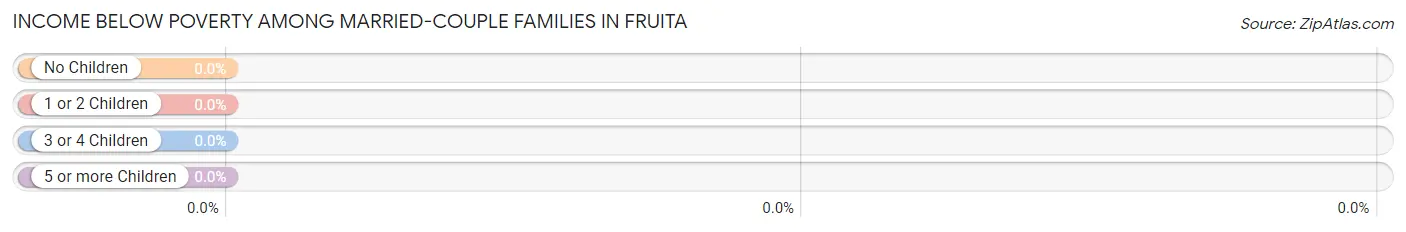
| Children | Above Poverty | Below Poverty |
| No Children | 1,395 (100.0%) | 0 (0.0%) |
| 1 or 2 Children | 1,103 (100.0%) | 0 (0.0%) |
| 3 or 4 Children | 215 (100.0%) | 0 (0.0%) |
| 5 or more Children | 0 (0.0%) | 0 (0.0%) |
| Total | 2,713 (100.0%) | 0 (0.0%) |
Income Below Poverty Among Single-Parent Households in Fruita
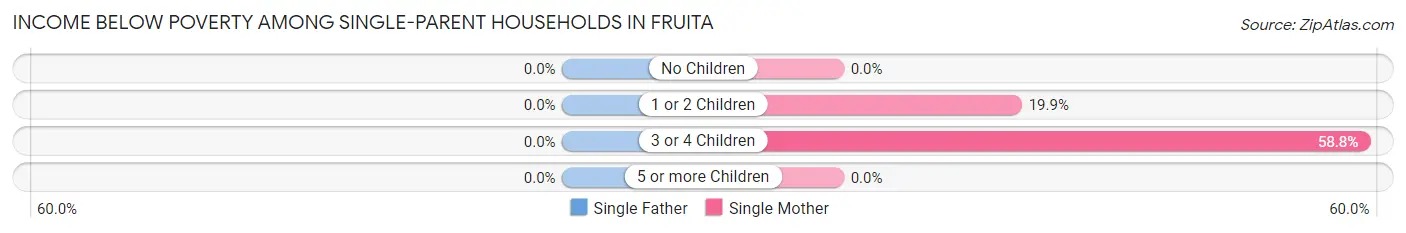
| Children | Single Father | Single Mother |
| No Children | 0 (0.0%) | 0 (0.0%) |
| 1 or 2 Children | 0 (0.0%) | 41 (19.9%) |
| 3 or 4 Children | 0 (0.0%) | 70 (58.8%) |
| 5 or more Children | 0 (0.0%) | 0 (0.0%) |
| Total | 0 (0.0%) | 111 (20.1%) |
Income Below Poverty Among Married-Couple vs Single-Parent Households in Fruita
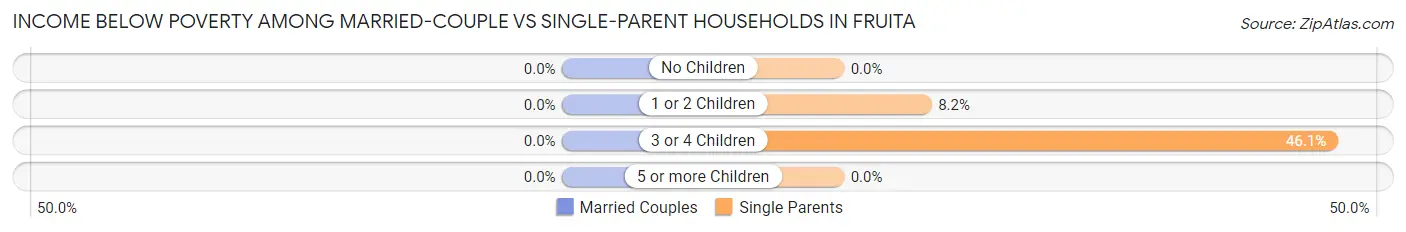
| Children | Married-Couple Families | Single-Parent Households |
| No Children | 0 (0.0%) | 0 (0.0%) |
| 1 or 2 Children | 0 (0.0%) | 41 (8.2%) |
| 3 or 4 Children | 0 (0.0%) | 70 (46.1%) |
| 5 or more Children | 0 (0.0%) | 0 (0.0%) |
| Total | 0 (0.0%) | 111 (12.6%) |
Race in Fruita
The most populous races in Fruita are White / Caucasian (11,388 | 84.6%), Hispanic or Latino (1,597 | 11.9%), and Two or more Races (1,402 | 10.4%).
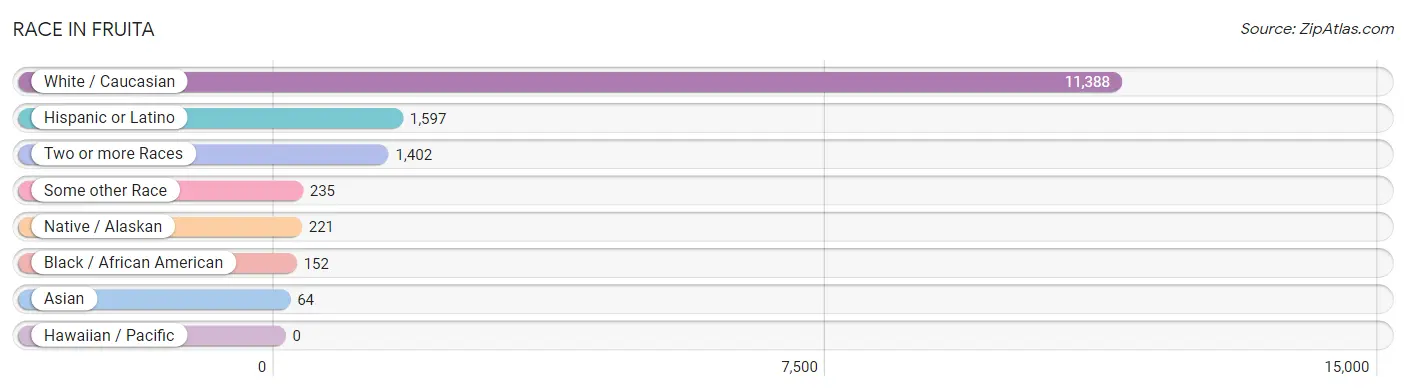
| Race | # Population | % Population |
| Asian | 64 | 0.5% |
| Black / African American | 152 | 1.1% |
| Hawaiian / Pacific | 0 | 0.0% |
| Hispanic or Latino | 1,597 | 11.9% |
| Native / Alaskan | 221 | 1.6% |
| White / Caucasian | 11,388 | 84.6% |
| Two or more Races | 1,402 | 10.4% |
| Some other Race | 235 | 1.8% |
| Total | 13,462 | 100.0% |
Ancestry in Fruita
The most populous ancestries reported in Fruita are German (3,349 | 24.9%), English (2,028 | 15.1%), Irish (1,671 | 12.4%), Italian (1,144 | 8.5%), and Mexican (1,102 | 8.2%), together accounting for 69.0% of all Fruita residents.
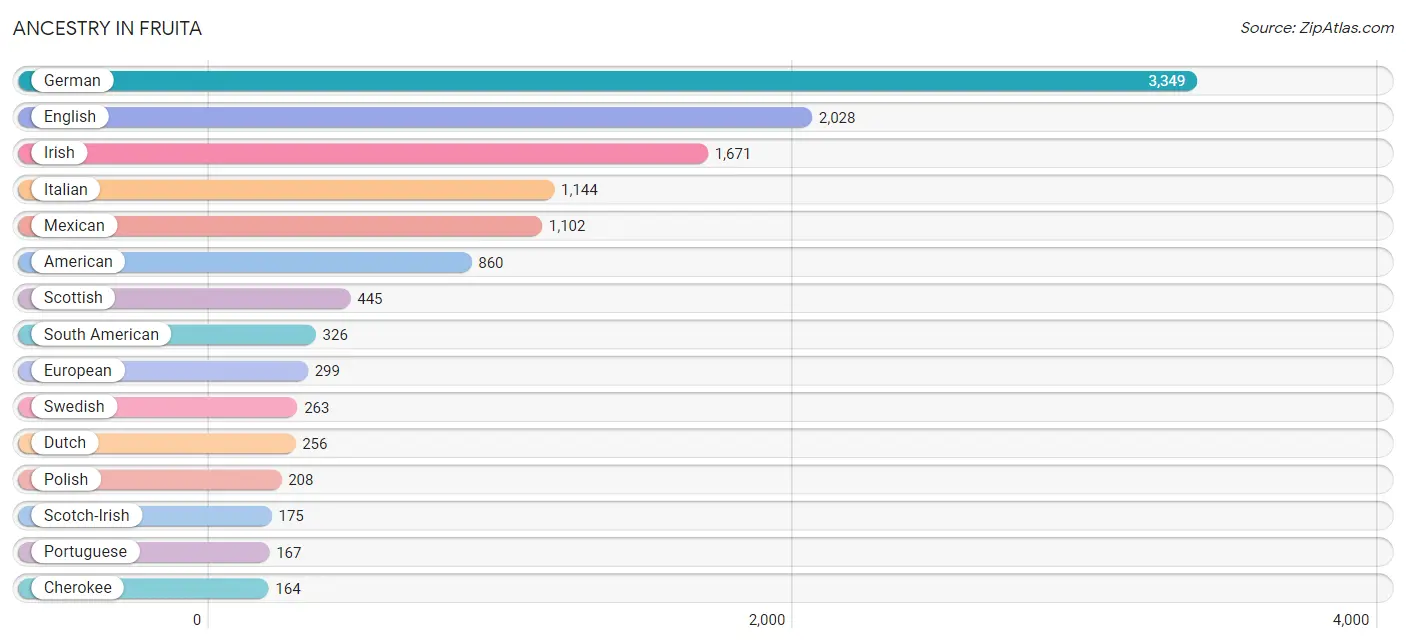
| Ancestry | # Population | % Population |
| American | 860 | 6.4% |
| Austrian | 19 | 0.1% |
| Bhutanese | 93 | 0.7% |
| British | 125 | 0.9% |
| Celtic | 7 | 0.1% |
| Cherokee | 164 | 1.2% |
| Czech | 117 | 0.9% |
| Danish | 108 | 0.8% |
| Dutch | 256 | 1.9% |
| English | 2,028 | 15.1% |
| European | 299 | 2.2% |
| French | 130 | 1.0% |
| German | 3,349 | 24.9% |
| Greek | 64 | 0.5% |
| Hungarian | 25 | 0.2% |
| Irish | 1,671 | 12.4% |
| Italian | 1,144 | 8.5% |
| Mexican | 1,102 | 8.2% |
| Navajo | 28 | 0.2% |
| Norwegian | 111 | 0.8% |
| Polish | 208 | 1.5% |
| Portuguese | 167 | 1.2% |
| Russian | 30 | 0.2% |
| Scandinavian | 29 | 0.2% |
| Scotch-Irish | 175 | 1.3% |
| Scottish | 445 | 3.3% |
| Sioux | 10 | 0.1% |
| South American | 326 | 2.4% |
| Spaniard | 100 | 0.7% |
| Swedish | 263 | 1.9% |
| Swiss | 136 | 1.0% |
| Thai | 64 | 0.5% |
| Welsh | 36 | 0.3% | View All 33 Rows |
Immigrants in Fruita
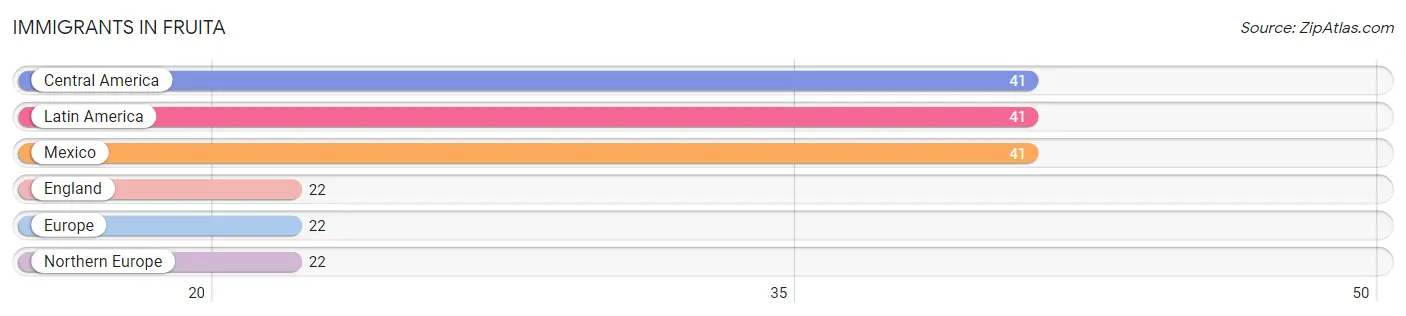
The most numerous immigrant groups reported in Fruita came from Central America (41 | 0.3%), Latin America (41 | 0.3%), Mexico (41 | 0.3%), England (22 | 0.2%), and Europe (22 | 0.2%), together accounting for 1.2% of all Fruita residents.
| Immigration Origin | # Population | % Population |
| Central America | 41 | 0.3% |
| England | 22 | 0.2% |
| Europe | 22 | 0.2% |
| Latin America | 41 | 0.3% |
| Mexico | 41 | 0.3% |
| Northern Europe | 22 | 0.2% | View All 6 Rows |
Sex and Age in Fruita
Sex and Age in Fruita
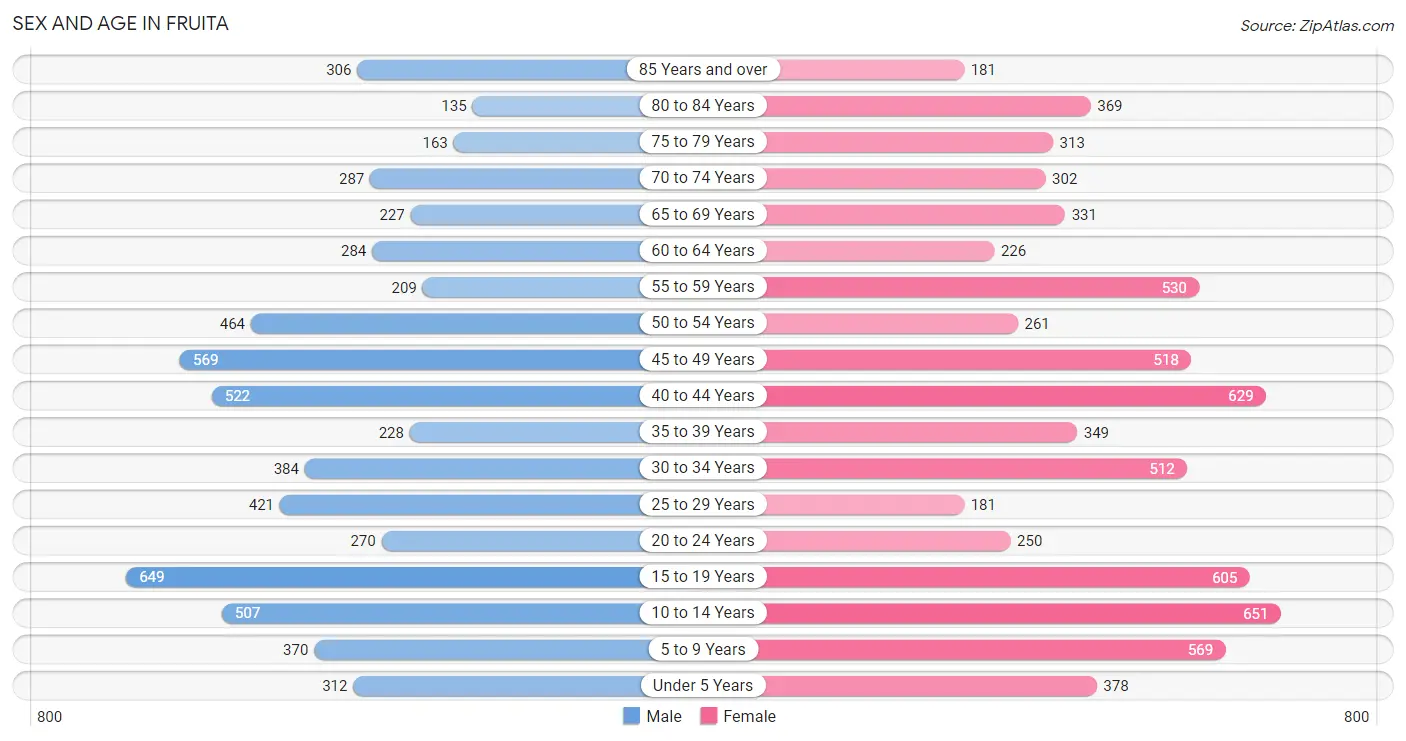
The most populous age groups in Fruita are 15 to 19 Years (649 | 10.3%) for men and 10 to 14 Years (651 | 9.1%) for women.
| Age Bracket | Male | Female |
| Under 5 Years | 312 (5.0%) | 378 (5.3%) |
| 5 to 9 Years | 370 (5.9%) | 569 (8.0%) |
| 10 to 14 Years | 507 (8.0%) | 651 (9.1%) |
| 15 to 19 Years | 649 (10.3%) | 605 (8.5%) |
| 20 to 24 Years | 270 (4.3%) | 250 (3.5%) |
| 25 to 29 Years | 421 (6.7%) | 181 (2.5%) |
| 30 to 34 Years | 384 (6.1%) | 512 (7.2%) |
| 35 to 39 Years | 228 (3.6%) | 349 (4.9%) |
| 40 to 44 Years | 522 (8.3%) | 629 (8.8%) |
| 45 to 49 Years | 569 (9.0%) | 518 (7.2%) |
| 50 to 54 Years | 464 (7.4%) | 261 (3.6%) |
| 55 to 59 Years | 209 (3.3%) | 530 (7.4%) |
| 60 to 64 Years | 284 (4.5%) | 226 (3.2%) |
| 65 to 69 Years | 227 (3.6%) | 331 (4.6%) |
| 70 to 74 Years | 287 (4.5%) | 302 (4.2%) |
| 75 to 79 Years | 163 (2.6%) | 313 (4.4%) |
| 80 to 84 Years | 135 (2.1%) | 369 (5.2%) |
| 85 Years and over | 306 (4.9%) | 181 (2.5%) |
| Total | 6,307 (100.0%) | 7,155 (100.0%) |
Families and Households in Fruita
Median Family Size in Fruita
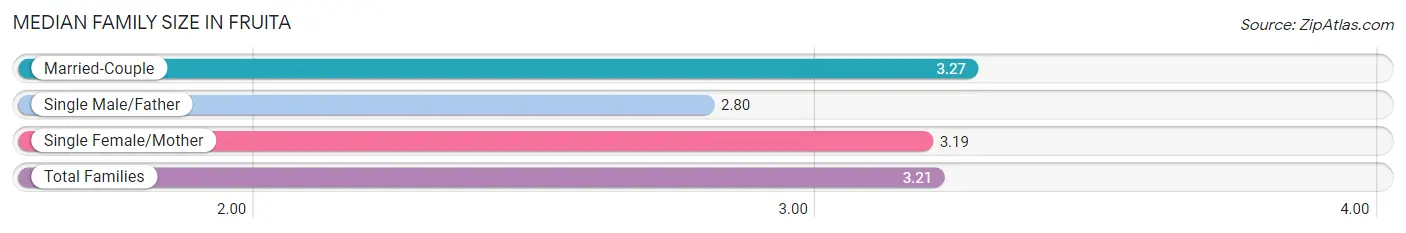
The median family size in Fruita is 3.21 persons per family, with married-couple families (2,713 | 75.5%) accounting for the largest median family size of 3.27 persons per family. On the other hand, single male/father families (330 | 9.2%) represent the smallest median family size with 2.80 persons per family.
| Family Type | # Families | Family Size |
| Married-Couple | 2,713 (75.5%) | 3.27 |
| Single Male/Father | 330 (9.2%) | 2.80 |
| Single Female/Mother | 552 (15.3%) | 3.19 |
| Total Families | 3,595 (100.0%) | 3.21 |
Median Household Size in Fruita
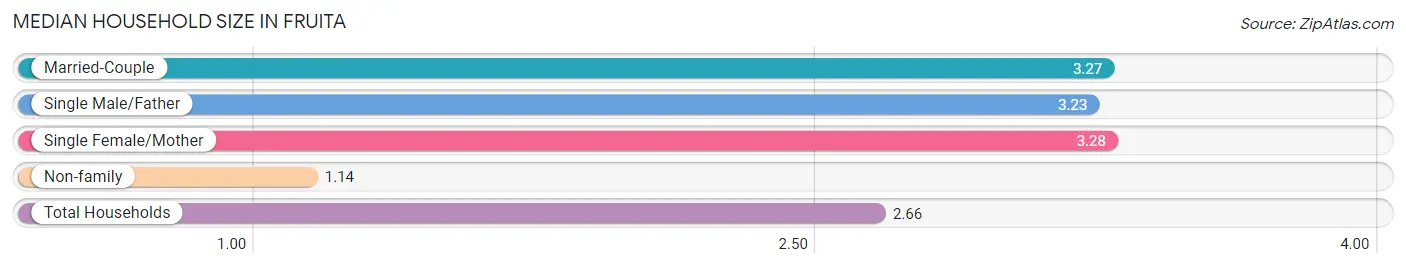
The median household size in Fruita is 2.66 persons per household, with single female/mother households (552 | 11.0%) accounting for the largest median household size of 3.28 persons per household. non-family households (1,423 | 28.4%) represent the smallest median household size with 1.14 persons per household.
| Household Type | # Households | Household Size |
| Married-Couple | 2,713 (54.1%) | 3.27 |
| Single Male/Father | 330 (6.6%) | 3.23 |
| Single Female/Mother | 552 (11.0%) | 3.28 |
| Non-family | 1,423 (28.4%) | 1.14 |
| Total Households | 5,018 (100.0%) | 2.66 |
Household Size by Marriage Status in Fruita
Out of a total of 5,018 households in Fruita, 3,595 (71.6%) are family households, while 1,423 (28.4%) are nonfamily households. The most numerous type of family households are 2-person households, comprising 1,432, and the most common type of nonfamily households are 1-person households, comprising 1,240.
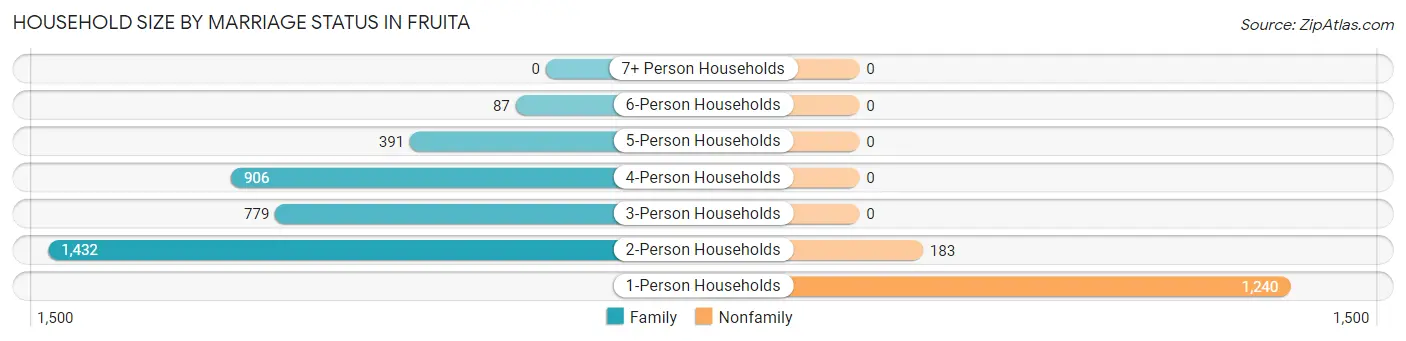
| Household Size | Family Households | Nonfamily Households |
| 1-Person Households | - | 1,240 (24.7%) |
| 2-Person Households | 1,432 (28.5%) | 183 (3.6%) |
| 3-Person Households | 779 (15.5%) | 0 (0.0%) |
| 4-Person Households | 906 (18.1%) | 0 (0.0%) |
| 5-Person Households | 391 (7.8%) | 0 (0.0%) |
| 6-Person Households | 87 (1.7%) | 0 (0.0%) |
| 7+ Person Households | 0 (0.0%) | 0 (0.0%) |
| Total | 3,595 (71.6%) | 1,423 (28.4%) |
Female Fertility in Fruita
Fertility by Age in Fruita
Average fertility rate in Fruita is 21.0 births per 1,000 women. Women in the age bracket of 20 to 34 years have the highest fertility rate with 67.0 births per 1,000 women. Women in the age bracket of 20 to 34 years acount for 100.0% of all women with births.
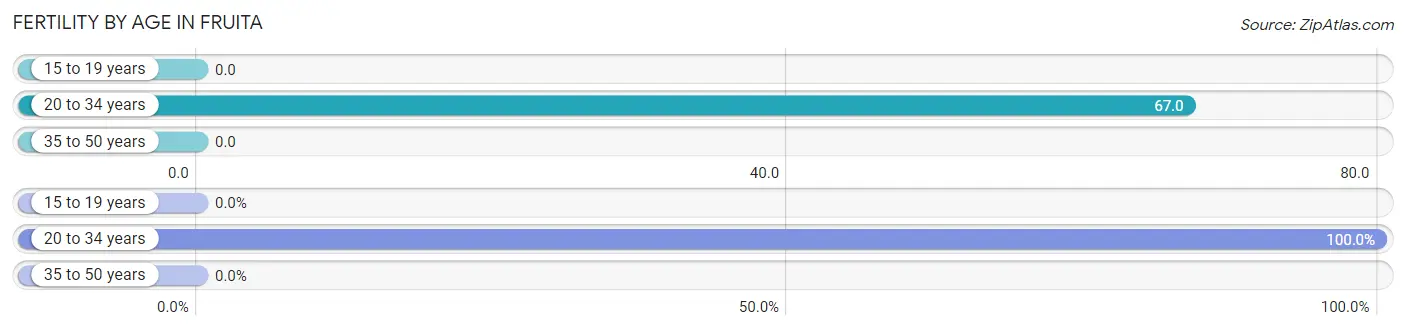
| Age Bracket | Women with Births | Births / 1,000 Women |
| 15 to 19 years | 0 (0.0%) | 0.0 |
| 20 to 34 years | 63 (100.0%) | 67.0 |
| 35 to 50 years | 0 (0.0%) | 0.0 |
| Total | 63 (100.0%) | 21.0 |
Fertility by Age by Marriage Status in Fruita
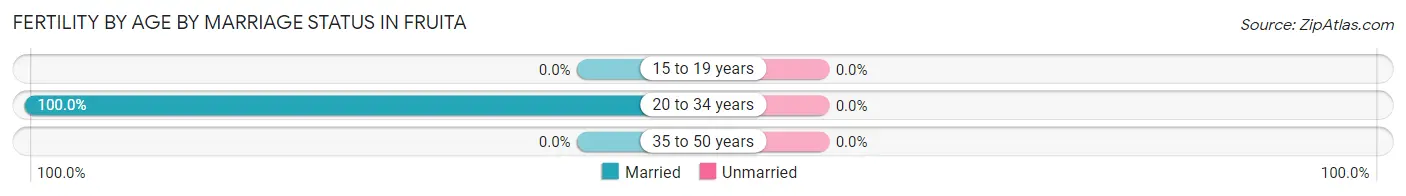
| Age Bracket | Married | Unmarried |
| 15 to 19 years | 0 (0.0%) | 0 (0.0%) |
| 20 to 34 years | 63 (100.0%) | 0 (0.0%) |
| 35 to 50 years | 0 (0.0%) | 0 (0.0%) |
| Total | 63 (100.0%) | 0 (0.0%) |
Fertility by Education in Fruita
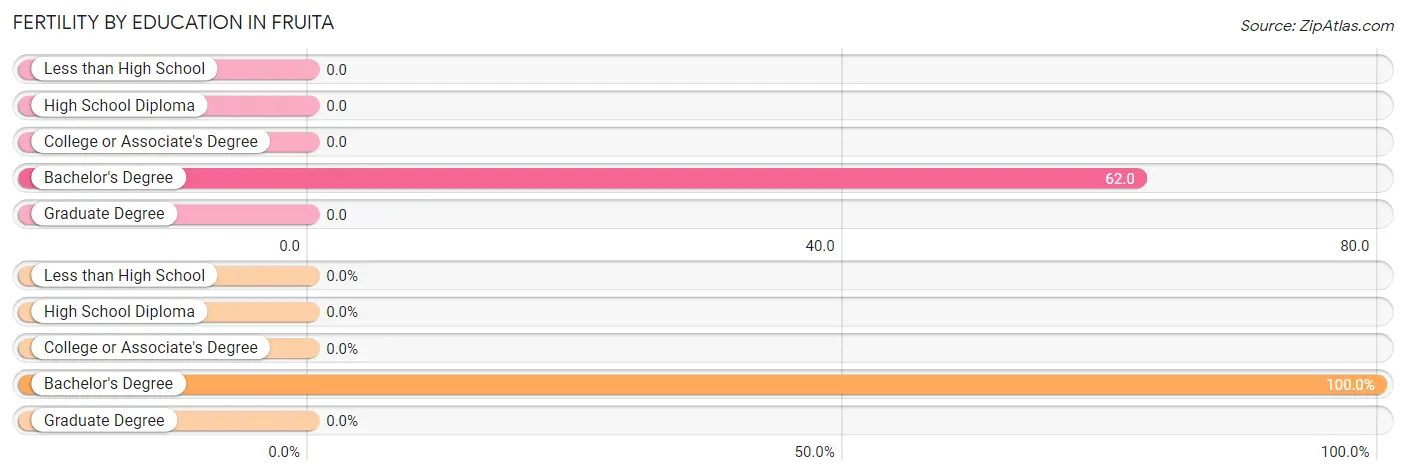
| Educational Attainment | Women with Births | Births / 1,000 Women |
| Less than High School | 0 (0.0%) | 0.0 |
| High School Diploma | 0 (0.0%) | 0.0 |
| College or Associate's Degree | 0 (0.0%) | 0.0 |
| Bachelor's Degree | 63 (100.0%) | 62.0 |
| Graduate Degree | 0 (0.0%) | 0.0 |
| Total | 63 (100.0%) | 21.0 |
Fertility by Education by Marriage Status in Fruita
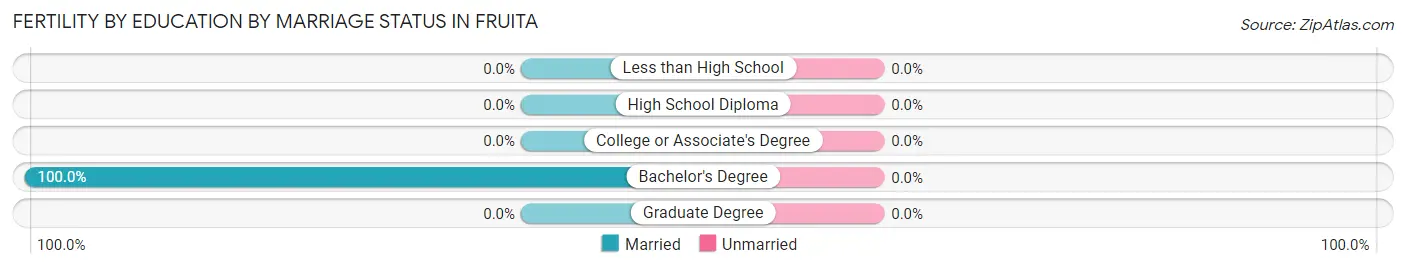
| Educational Attainment | Married | Unmarried |
| Less than High School | 0 (0.0%) | 0 (0.0%) |
| High School Diploma | 0 (0.0%) | 0 (0.0%) |
| College or Associate's Degree | 0 (0.0%) | 0 (0.0%) |
| Bachelor's Degree | 63 (100.0%) | 0 (0.0%) |
| Graduate Degree | 0 (0.0%) | 0 (0.0%) |
| Total | 63 (100.0%) | 0 (0.0%) |
Employment Characteristics in Fruita
Employment by Class of Employer in Fruita
Among the 6,086 employed individuals in Fruita, private company employees (4,199 | 69.0%), local government employees (700 | 11.5%), and self-employed (not incorporated) (403 | 6.6%) make up the most common classes of employment.
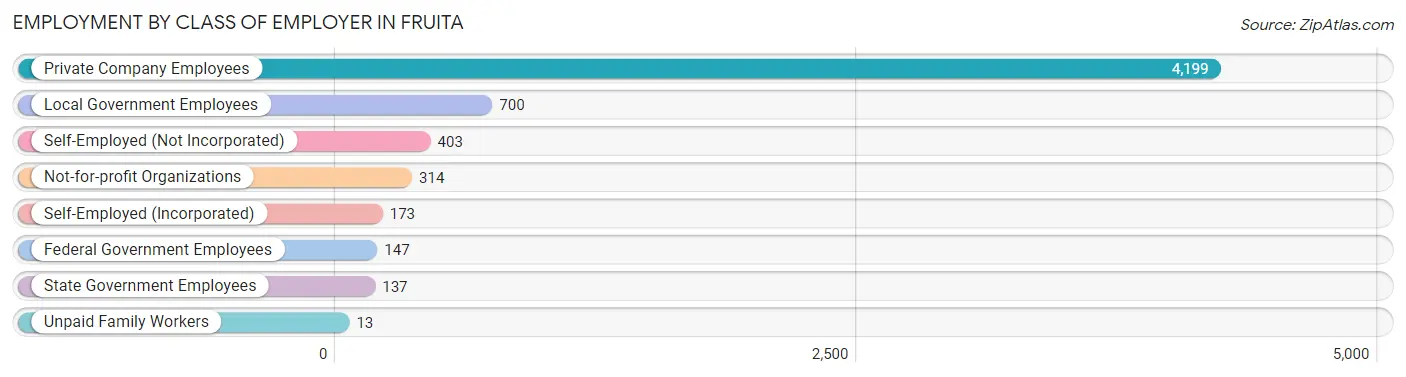
| Employer Class | # Employees | % Employees |
| Private Company Employees | 4,199 | 69.0% |
| Self-Employed (Incorporated) | 173 | 2.8% |
| Self-Employed (Not Incorporated) | 403 | 6.6% |
| Not-for-profit Organizations | 314 | 5.2% |
| Local Government Employees | 700 | 11.5% |
| State Government Employees | 137 | 2.2% |
| Federal Government Employees | 147 | 2.4% |
| Unpaid Family Workers | 13 | 0.2% |
| Total | 6,086 | 100.0% |
Employment Status by Age in Fruita
According to the labor force statistics for Fruita, out of the total population over 16 years of age (10,322), 63.4% or 6,544 individuals are in the labor force, with 3.5% or 229 of them unemployed. The age group with the highest labor force participation rate is 25 to 29 years, with 97.2% or 585 individuals in the labor force. Within the labor force, the 20 to 24 years age range has the highest percentage of unemployed individuals, with 13.6% or 67 of them being unemployed.
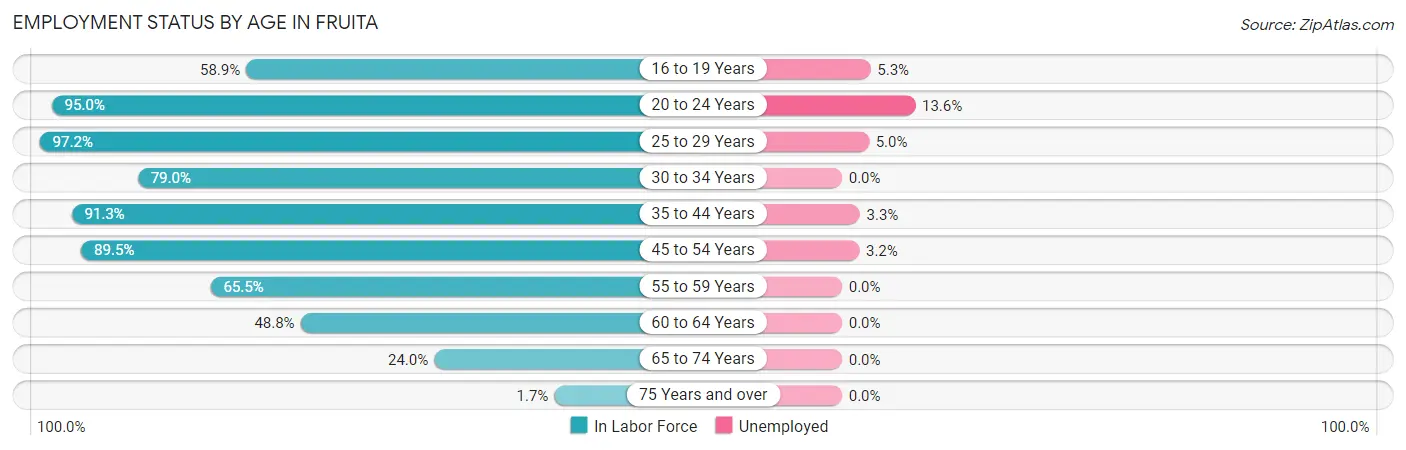
| Age Bracket | In Labor Force | Unemployed |
| 16 to 19 Years | 531 (58.9%) | 28 (5.3%) |
| 20 to 24 Years | 494 (95.0%) | 67 (13.6%) |
| 25 to 29 Years | 585 (97.2%) | 29 (5.0%) |
| 30 to 34 Years | 708 (79.0%) | 0 (0.0%) |
| 35 to 44 Years | 1,578 (91.3%) | 52 (3.3%) |
| 45 to 54 Years | 1,622 (89.5%) | 52 (3.2%) |
| 55 to 59 Years | 484 (65.5%) | 0 (0.0%) |
| 60 to 64 Years | 249 (48.8%) | 0 (0.0%) |
| 65 to 74 Years | 275 (24.0%) | 0 (0.0%) |
| 75 Years and over | 25 (1.7%) | 0 (0.0%) |
| Total | 6,544 (63.4%) | 229 (3.5%) |
Employment Status by Educational Attainment in Fruita
According to labor force statistics for Fruita, 83.1% of individuals (5,224) out of the total population between 25 and 64 years of age (6,287) are in the labor force, with 2.5% or 131 of them being unemployed. The group with the highest labor force participation rate are those with the educational attainment of bachelor's degree or higher, with 84.5% or 1,993 individuals in the labor force. Within the labor force, individuals with less than high school education have the highest percentage of unemployment, with 11.7% or 29 of them being unemployed.
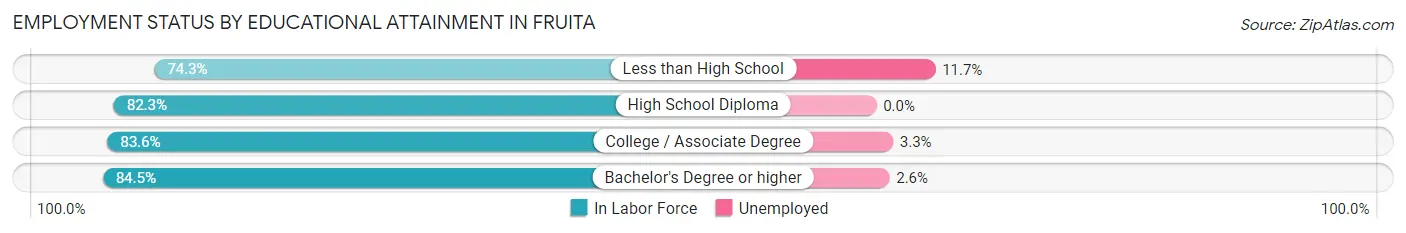
| Educational Attainment | In Labor Force | Unemployed |
| Less than High School | 248 (74.3%) | 39 (11.7%) |
| High School Diploma | 1,422 (82.3%) | 0 (0.0%) |
| College / Associate Degree | 1,561 (83.6%) | 62 (3.3%) |
| Bachelor's Degree or higher | 1,993 (84.5%) | 61 (2.6%) |
| Total | 5,224 (83.1%) | 157 (2.5%) |
Employment Occupations by Sex in Fruita
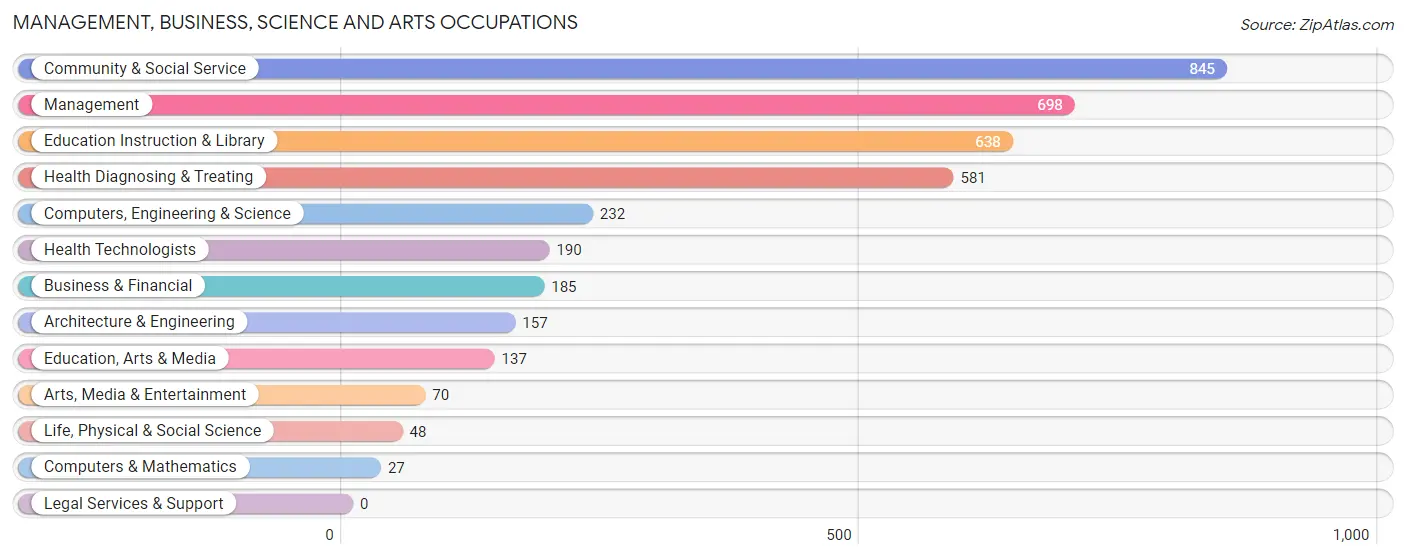
Management, Business, Science and Arts Occupations
The most common Management, Business, Science and Arts occupations in Fruita are Community & Social Service (845 | 13.4%), Management (698 | 11.0%), Education Instruction & Library (638 | 10.1%), Health Diagnosing & Treating (581 | 9.2%), and Computers, Engineering & Science (232 | 3.7%).
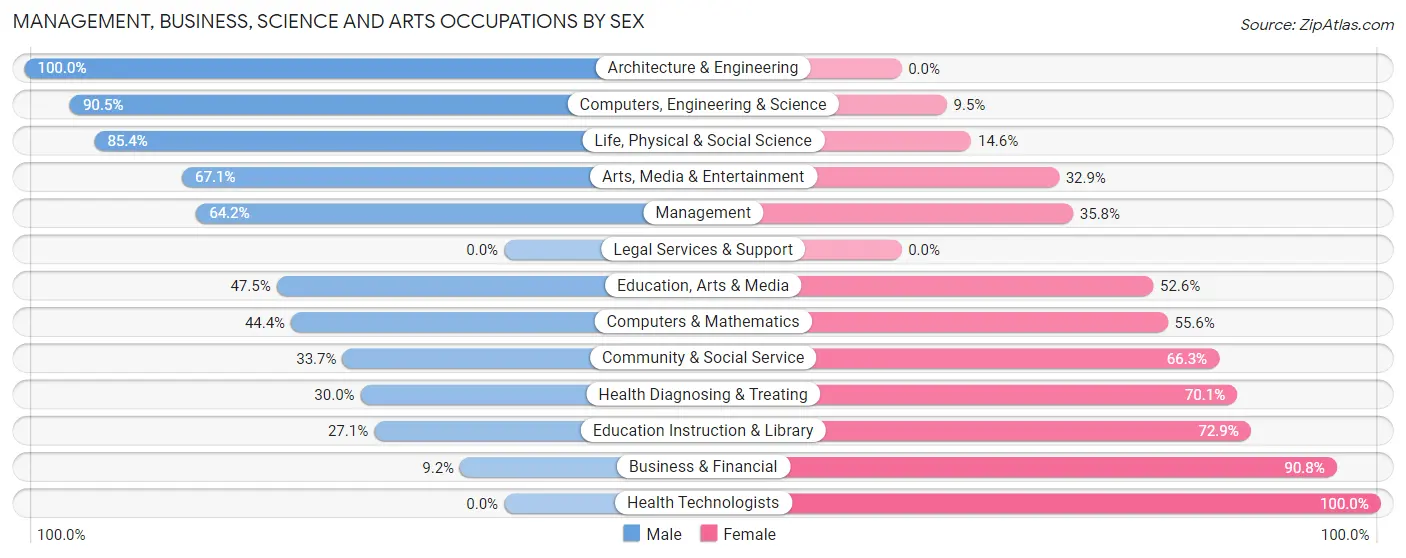
Management, Business, Science and Arts Occupations by Sex
Within the Management, Business, Science and Arts occupations in Fruita, the most male-oriented occupations are Architecture & Engineering (100.0%), Computers, Engineering & Science (90.5%), and Life, Physical & Social Science (85.4%), while the most female-oriented occupations are Health Technologists (100.0%), Business & Financial (90.8%), and Education Instruction & Library (72.9%).
| Occupation | Male | Female |
| Management | 448 (64.2%) | 250 (35.8%) |
| Business & Financial | 17 (9.2%) | 168 (90.8%) |
| Computers, Engineering & Science | 210 (90.5%) | 22 (9.5%) |
| Computers & Mathematics | 12 (44.4%) | 15 (55.6%) |
| Architecture & Engineering | 157 (100.0%) | 0 (0.0%) |
| Life, Physical & Social Science | 41 (85.4%) | 7 (14.6%) |
| Community & Social Service | 285 (33.7%) | 560 (66.3%) |
| Education, Arts & Media | 65 (47.4%) | 72 (52.5%) |
| Legal Services & Support | 0 (0.0%) | 0 (0.0%) |
| Education Instruction & Library | 173 (27.1%) | 465 (72.9%) |
| Arts, Media & Entertainment | 47 (67.1%) | 23 (32.9%) |
| Health Diagnosing & Treating | 174 (29.9%) | 407 (70.1%) |
| Health Technologists | 0 (0.0%) | 190 (100.0%) |
| Total (Category) | 1,134 (44.6%) | 1,407 (55.4%) |
| Total (Overall) | 3,238 (51.2%) | 3,083 (48.8%) |
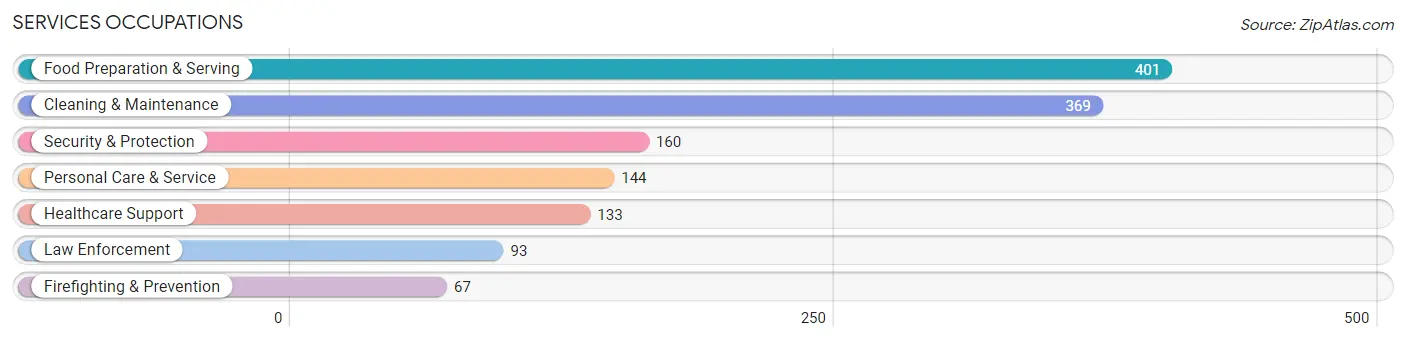
Services Occupations
The most common Services occupations in Fruita are Food Preparation & Serving (401 | 6.3%), Cleaning & Maintenance (369 | 5.8%), Security & Protection (160 | 2.5%), Personal Care & Service (144 | 2.3%), and Healthcare Support (133 | 2.1%).
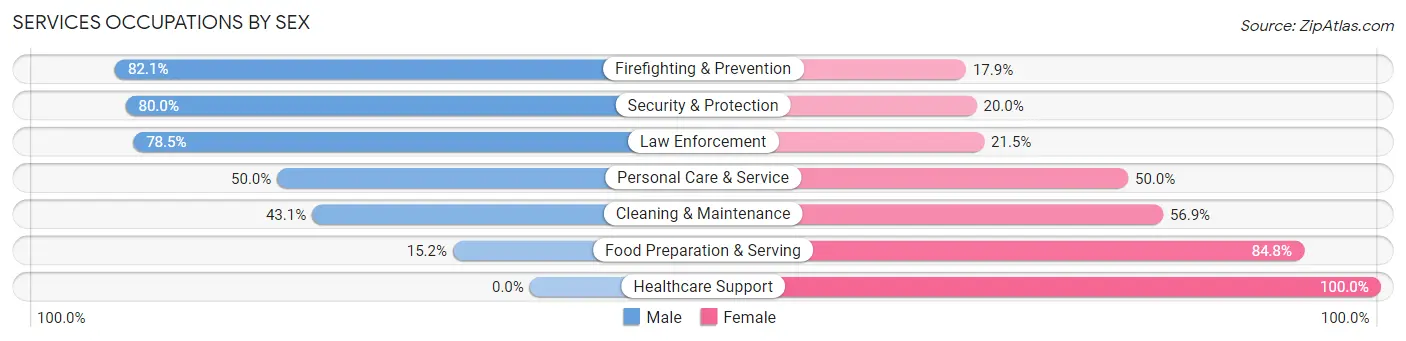
Services Occupations by Sex
Within the Services occupations in Fruita, the most male-oriented occupations are Firefighting & Prevention (82.1%), Security & Protection (80.0%), and Law Enforcement (78.5%), while the most female-oriented occupations are Healthcare Support (100.0%), Food Preparation & Serving (84.8%), and Cleaning & Maintenance (56.9%).
| Occupation | Male | Female |
| Healthcare Support | 0 (0.0%) | 133 (100.0%) |
| Security & Protection | 128 (80.0%) | 32 (20.0%) |
| Firefighting & Prevention | 55 (82.1%) | 12 (17.9%) |
| Law Enforcement | 73 (78.5%) | 20 (21.5%) |
| Food Preparation & Serving | 61 (15.2%) | 340 (84.8%) |
| Cleaning & Maintenance | 159 (43.1%) | 210 (56.9%) |
| Personal Care & Service | 72 (50.0%) | 72 (50.0%) |
| Total (Category) | 420 (34.8%) | 787 (65.2%) |
| Total (Overall) | 3,238 (51.2%) | 3,083 (48.8%) |
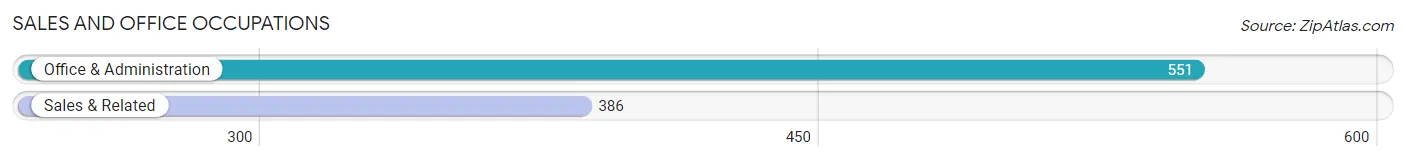
Sales and Office Occupations
The most common Sales and Office occupations in Fruita are Office & Administration (551 | 8.7%), and Sales & Related (386 | 6.1%).
Sales and Office Occupations by Sex
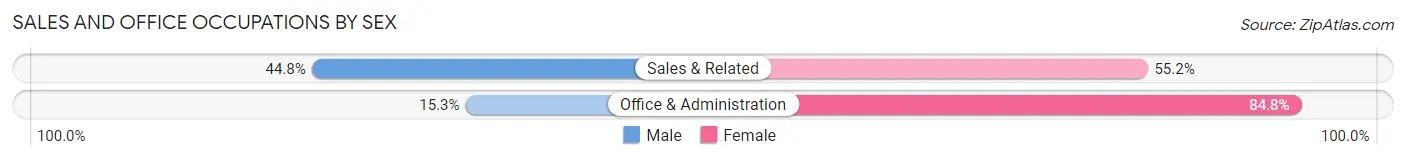
| Occupation | Male | Female |
| Sales & Related | 173 (44.8%) | 213 (55.2%) |
| Office & Administration | 84 (15.2%) | 467 (84.8%) |
| Total (Category) | 257 (27.4%) | 680 (72.6%) |
| Total (Overall) | 3,238 (51.2%) | 3,083 (48.8%) |
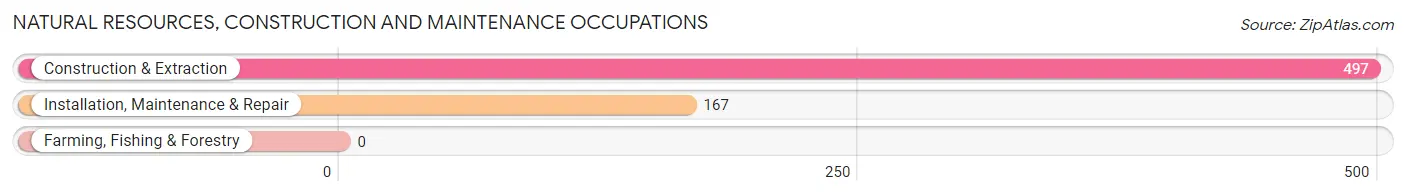
Natural Resources, Construction and Maintenance Occupations
The most common Natural Resources, Construction and Maintenance occupations in Fruita are Construction & Extraction (497 | 7.9%), and Installation, Maintenance & Repair (167 | 2.6%).
Natural Resources, Construction and Maintenance Occupations by Sex
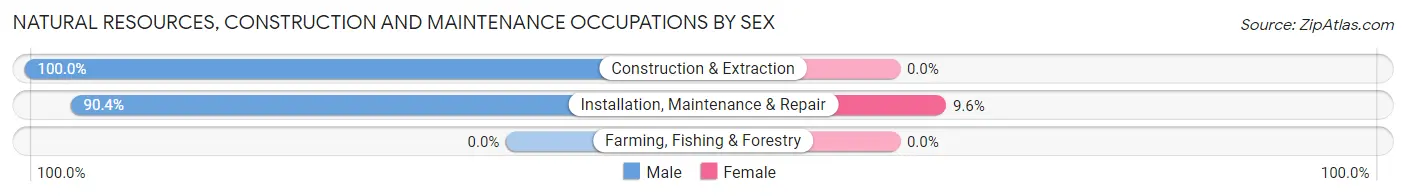
| Occupation | Male | Female |
| Farming, Fishing & Forestry | 0 (0.0%) | 0 (0.0%) |
| Construction & Extraction | 497 (100.0%) | 0 (0.0%) |
| Installation, Maintenance & Repair | 151 (90.4%) | 16 (9.6%) |
| Total (Category) | 648 (97.6%) | 16 (2.4%) |
| Total (Overall) | 3,238 (51.2%) | 3,083 (48.8%) |
Production, Transportation and Moving Occupations
The most common Production, Transportation and Moving occupations in Fruita are Transportation (504 | 8.0%), Production (319 | 5.1%), and Material Moving (149 | 2.4%).
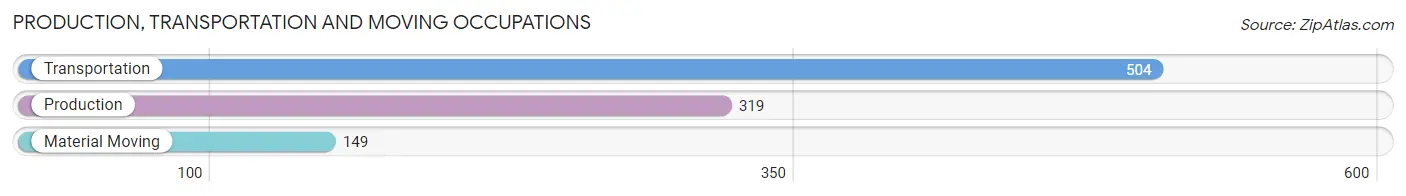
Production, Transportation and Moving Occupations by Sex
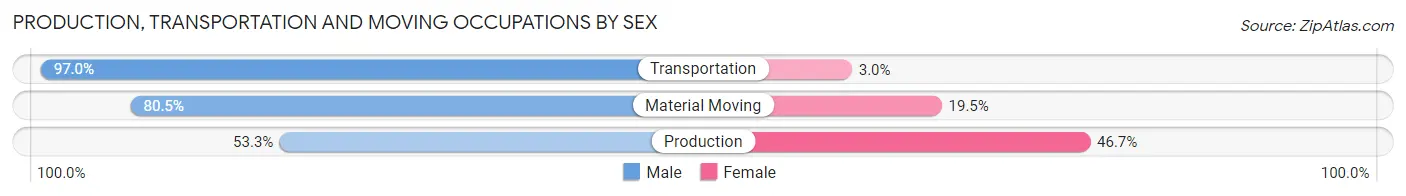
| Occupation | Male | Female |
| Production | 170 (53.3%) | 149 (46.7%) |
| Transportation | 489 (97.0%) | 15 (3.0%) |
| Material Moving | 120 (80.5%) | 29 (19.5%) |
| Total (Category) | 779 (80.1%) | 193 (19.9%) |
| Total (Overall) | 3,238 (51.2%) | 3,083 (48.8%) |
Employment Industries by Sex in Fruita
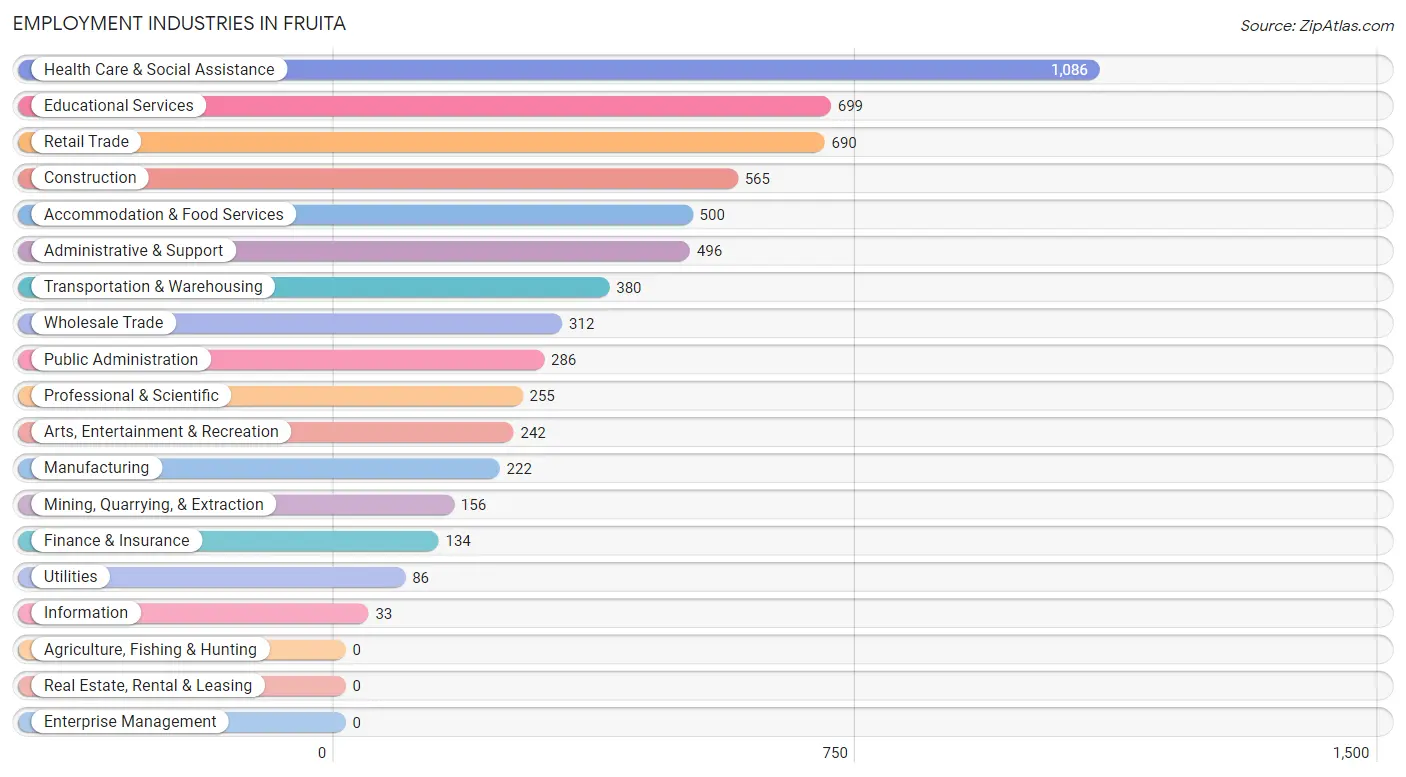
Employment Industries in Fruita
The major employment industries in Fruita include Health Care & Social Assistance (1,086 | 17.2%), Educational Services (699 | 11.1%), Retail Trade (690 | 10.9%), Construction (565 | 8.9%), and Accommodation & Food Services (500 | 7.9%).
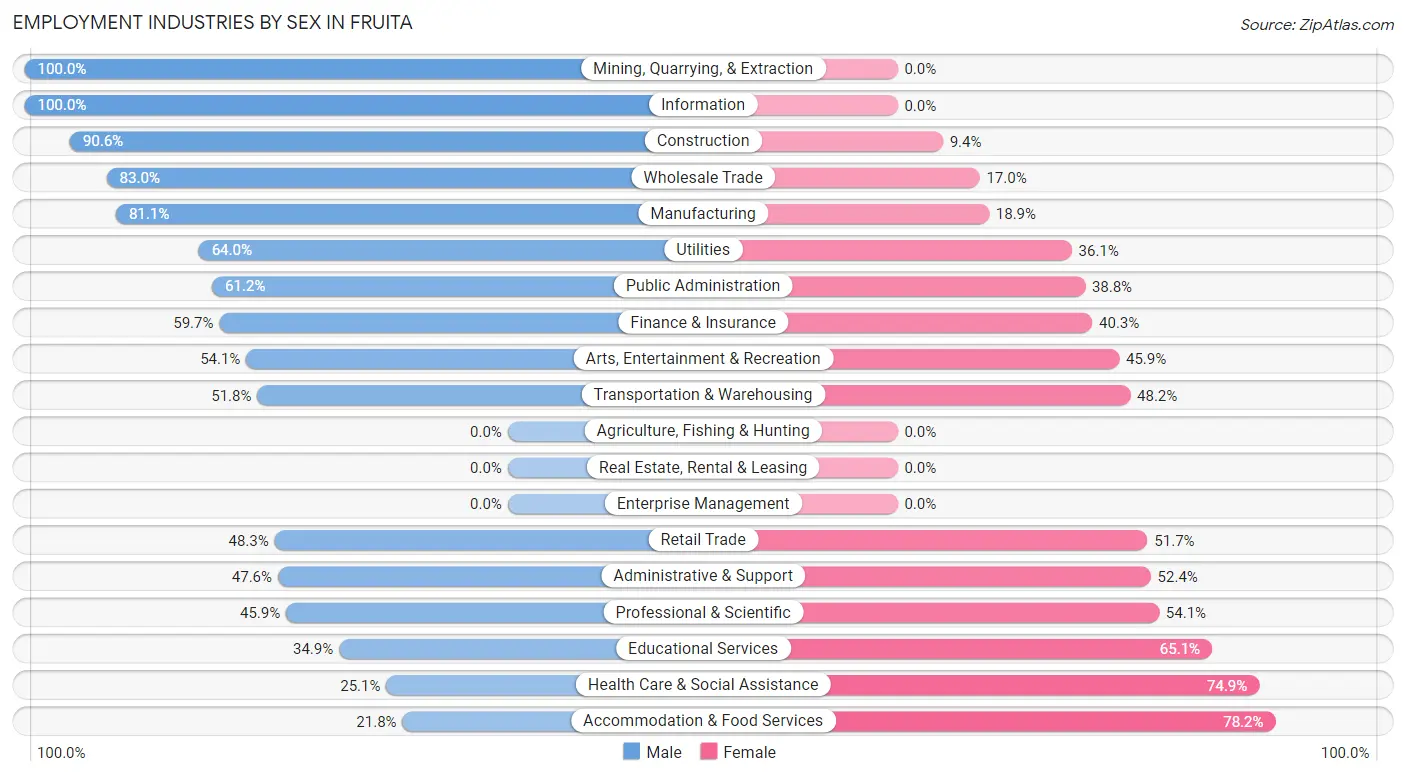
Employment Industries by Sex in Fruita
The Fruita industries that see more men than women are Mining, Quarrying, & Extraction (100.0%), Information (100.0%), and Construction (90.6%), whereas the industries that tend to have a higher number of women are Accommodation & Food Services (78.2%), Health Care & Social Assistance (74.9%), and Educational Services (65.1%).
| Industry | Male | Female |
| Agriculture, Fishing & Hunting | 0 (0.0%) | 0 (0.0%) |
| Mining, Quarrying, & Extraction | 156 (100.0%) | 0 (0.0%) |
| Construction | 512 (90.6%) | 53 (9.4%) |
| Manufacturing | 180 (81.1%) | 42 (18.9%) |
| Wholesale Trade | 259 (83.0%) | 53 (17.0%) |
| Retail Trade | 333 (48.3%) | 357 (51.7%) |
| Transportation & Warehousing | 197 (51.8%) | 183 (48.2%) |
| Utilities | 55 (63.9%) | 31 (36.0%) |
| Information | 33 (100.0%) | 0 (0.0%) |
| Finance & Insurance | 80 (59.7%) | 54 (40.3%) |
| Real Estate, Rental & Leasing | 0 (0.0%) | 0 (0.0%) |
| Professional & Scientific | 117 (45.9%) | 138 (54.1%) |
| Enterprise Management | 0 (0.0%) | 0 (0.0%) |
| Administrative & Support | 236 (47.6%) | 260 (52.4%) |
| Educational Services | 244 (34.9%) | 455 (65.1%) |
| Health Care & Social Assistance | 273 (25.1%) | 813 (74.9%) |
| Arts, Entertainment & Recreation | 131 (54.1%) | 111 (45.9%) |
| Accommodation & Food Services | 109 (21.8%) | 391 (78.2%) |
| Public Administration | 175 (61.2%) | 111 (38.8%) |
| Total | 3,238 (51.2%) | 3,083 (48.8%) |
Education in Fruita
School Enrollment in Fruita
The most common levels of schooling among the 3,825 students in Fruita are high school (1,512 | 39.5%), elementary school (787 | 20.6%), and middle school (660 | 17.2%).
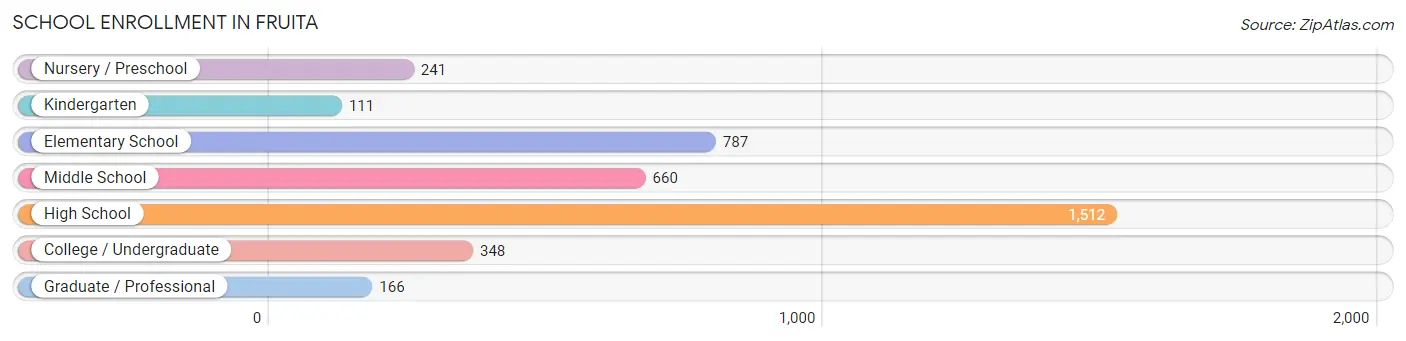
| School Level | # Students | % Students |
| Nursery / Preschool | 241 | 6.3% |
| Kindergarten | 111 | 2.9% |
| Elementary School | 787 | 20.6% |
| Middle School | 660 | 17.2% |
| High School | 1,512 | 39.5% |
| College / Undergraduate | 348 | 9.1% |
| Graduate / Professional | 166 | 4.3% |
| Total | 3,825 | 100.0% |
School Enrollment by Age by Funding Source in Fruita
Out of a total of 3,825 students who are enrolled in schools in Fruita, 291 (7.6%) attend a private institution, while the remaining 3,534 (92.4%) are enrolled in public schools. The age group of 20 to 24 year olds has the highest likelihood of being enrolled in private schools, with 81 (55.5% in the age bracket) enrolled. Conversely, the age group of 10 to 14 year olds has the lowest likelihood of being enrolled in a private school, with 1,158 (100.0% in the age bracket) attending a public institution.
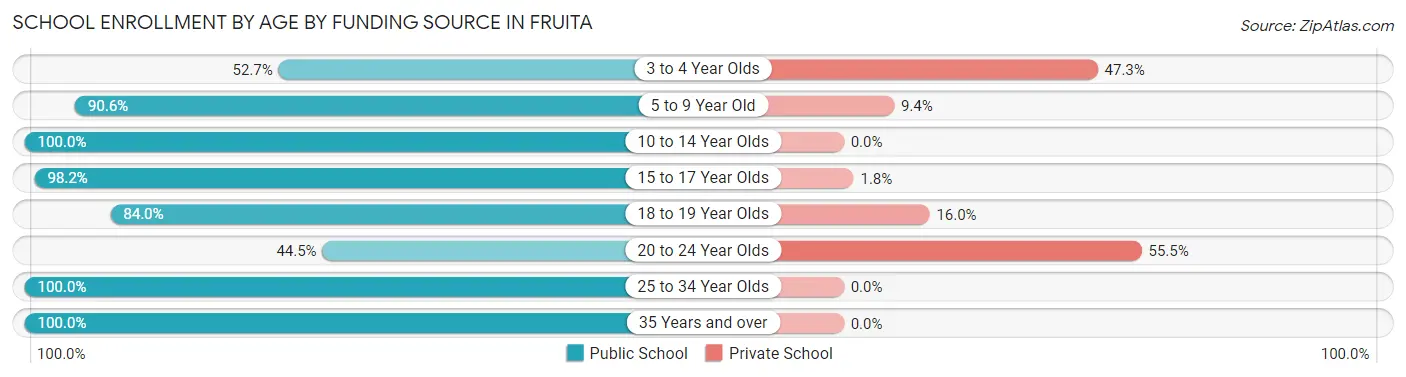
| Age Bracket | Public School | Private School |
| 3 to 4 Year Olds | 78 (52.7%) | 70 (47.3%) |
| 5 to 9 Year Old | 792 (90.6%) | 82 (9.4%) |
| 10 to 14 Year Olds | 1,158 (100.0%) | 0 (0.0%) |
| 15 to 17 Year Olds | 961 (98.2%) | 18 (1.8%) |
| 18 to 19 Year Olds | 205 (84.0%) | 39 (16.0%) |
| 20 to 24 Year Olds | 65 (44.5%) | 81 (55.5%) |
| 25 to 34 Year Olds | 94 (100.0%) | 0 (0.0%) |
| 35 Years and over | 182 (100.0%) | 0 (0.0%) |
| Total | 3,534 (92.4%) | 291 (7.6%) |
Educational Attainment by Field of Study in Fruita
Business (617 | 20.8%), education (471 | 15.9%), science & technology (418 | 14.1%), bio, nature & agricultural (305 | 10.3%), and visual & performing arts (216 | 7.3%) are the most common fields of study among 2,968 individuals in Fruita who have obtained a bachelor's degree or higher.
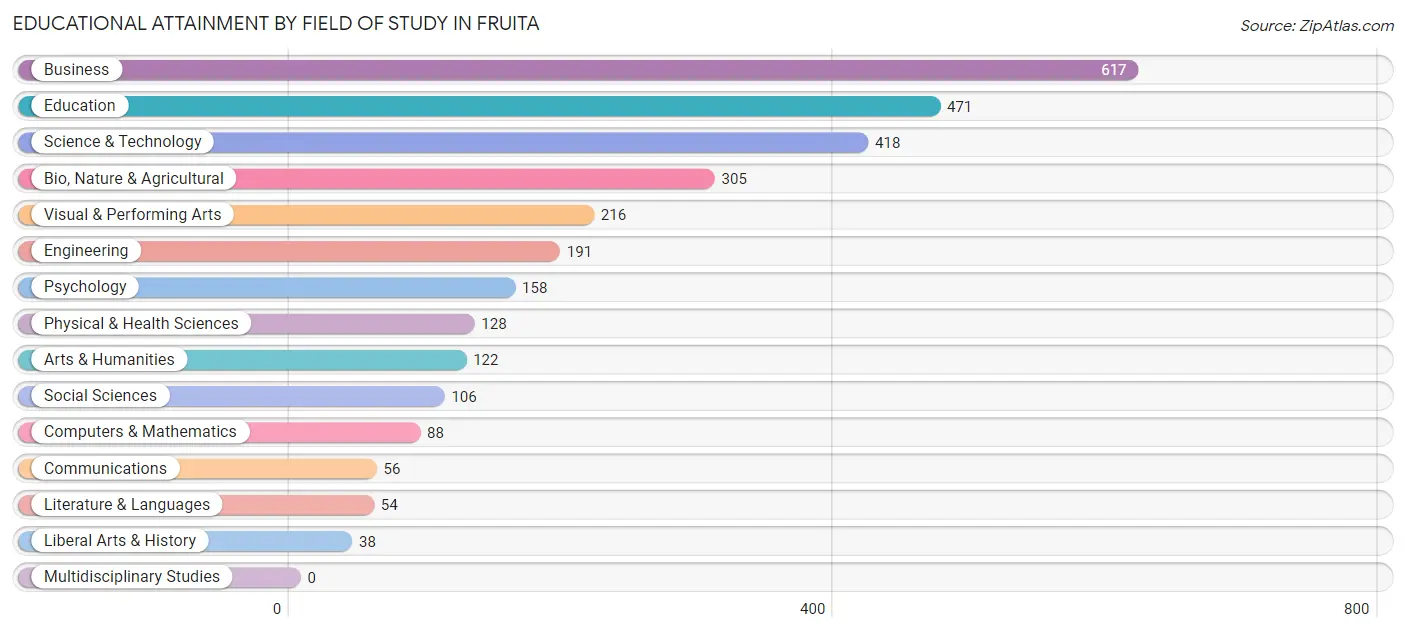
| Field of Study | # Graduates | % Graduates |
| Computers & Mathematics | 88 | 3.0% |
| Bio, Nature & Agricultural | 305 | 10.3% |
| Physical & Health Sciences | 128 | 4.3% |
| Psychology | 158 | 5.3% |
| Social Sciences | 106 | 3.6% |
| Engineering | 191 | 6.4% |
| Multidisciplinary Studies | 0 | 0.0% |
| Science & Technology | 418 | 14.1% |
| Business | 617 | 20.8% |
| Education | 471 | 15.9% |
| Literature & Languages | 54 | 1.8% |
| Liberal Arts & History | 38 | 1.3% |
| Visual & Performing Arts | 216 | 7.3% |
| Communications | 56 | 1.9% |
| Arts & Humanities | 122 | 4.1% |
| Total | 2,968 | 100.0% |
Transportation & Commute in Fruita
Vehicle Availability by Sex in Fruita
The most prevalent vehicle ownership categories in Fruita are males with 2 vehicles (1,271, accounting for 41.2%) and females with 2 vehicles (1,091, making up 42.3%).
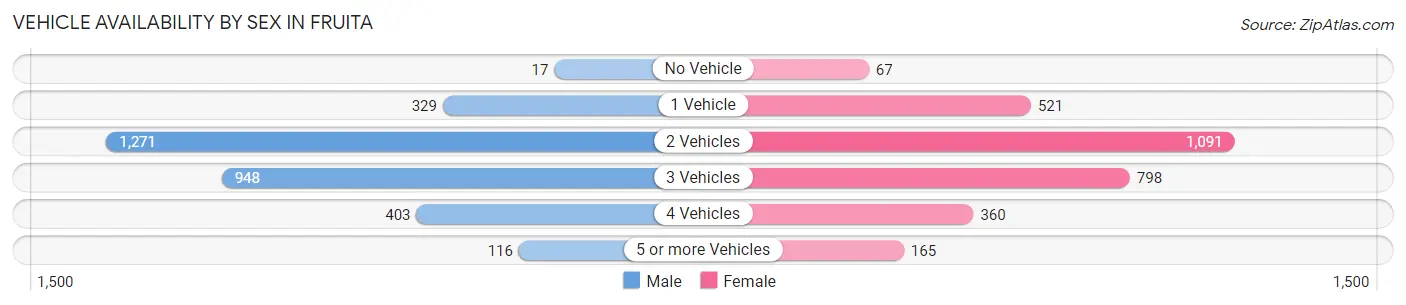
| Vehicles Available | Male | Female |
| No Vehicle | 17 (0.5%) | 67 (2.2%) |
| 1 Vehicle | 329 (10.7%) | 521 (17.4%) |
| 2 Vehicles | 1,271 (41.2%) | 1,091 (36.3%) |
| 3 Vehicles | 948 (30.7%) | 798 (26.6%) |
| 4 Vehicles | 403 (13.1%) | 360 (12.0%) |
| 5 or more Vehicles | 116 (3.8%) | 165 (5.5%) |
| Total | 3,084 (100.0%) | 3,002 (100.0%) |
Commute Time in Fruita
The most frequently occuring commute durations in Fruita are 20 to 24 minutes (1,867 commuters, 33.1%), 15 to 19 minutes (925 commuters, 16.4%), and 5 to 9 minutes (856 commuters, 15.2%).
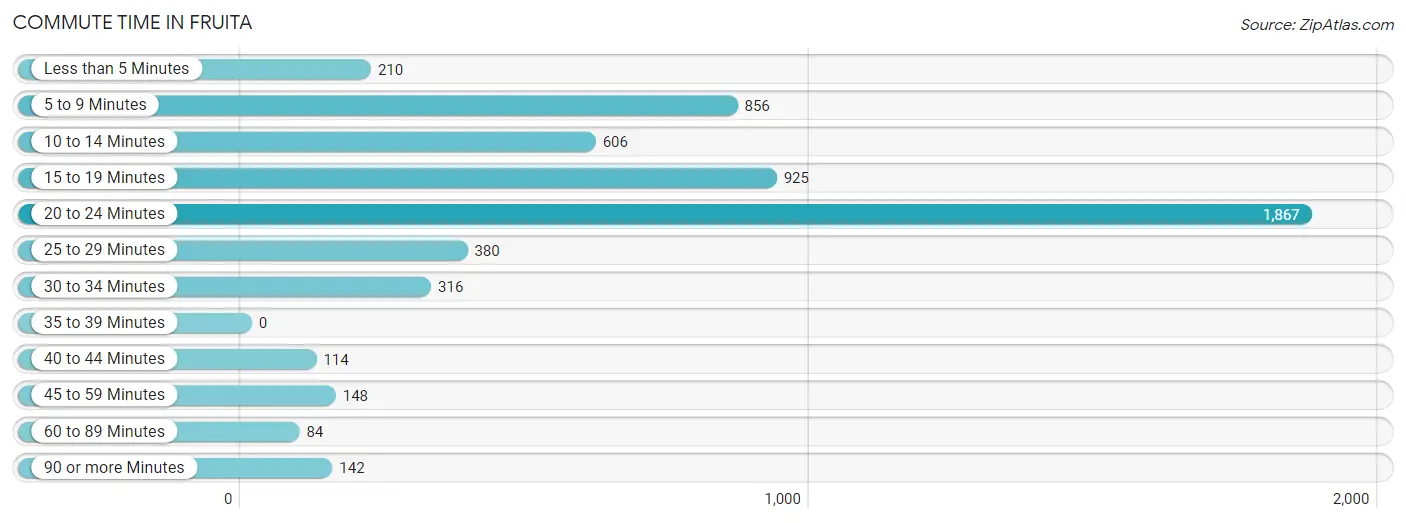
| Commute Time | # Commuters | % Commuters |
| Less than 5 Minutes | 210 | 3.7% |
| 5 to 9 Minutes | 856 | 15.2% |
| 10 to 14 Minutes | 606 | 10.7% |
| 15 to 19 Minutes | 925 | 16.4% |
| 20 to 24 Minutes | 1,867 | 33.1% |
| 25 to 29 Minutes | 380 | 6.7% |
| 30 to 34 Minutes | 316 | 5.6% |
| 35 to 39 Minutes | 0 | 0.0% |
| 40 to 44 Minutes | 114 | 2.0% |
| 45 to 59 Minutes | 148 | 2.6% |
| 60 to 89 Minutes | 84 | 1.5% |
| 90 or more Minutes | 142 | 2.5% |
Commute Time by Sex in Fruita
The most common commute times in Fruita are 20 to 24 minutes (970 commuters, 33.6%) for males and 20 to 24 minutes (897 commuters, 32.5%) for females.
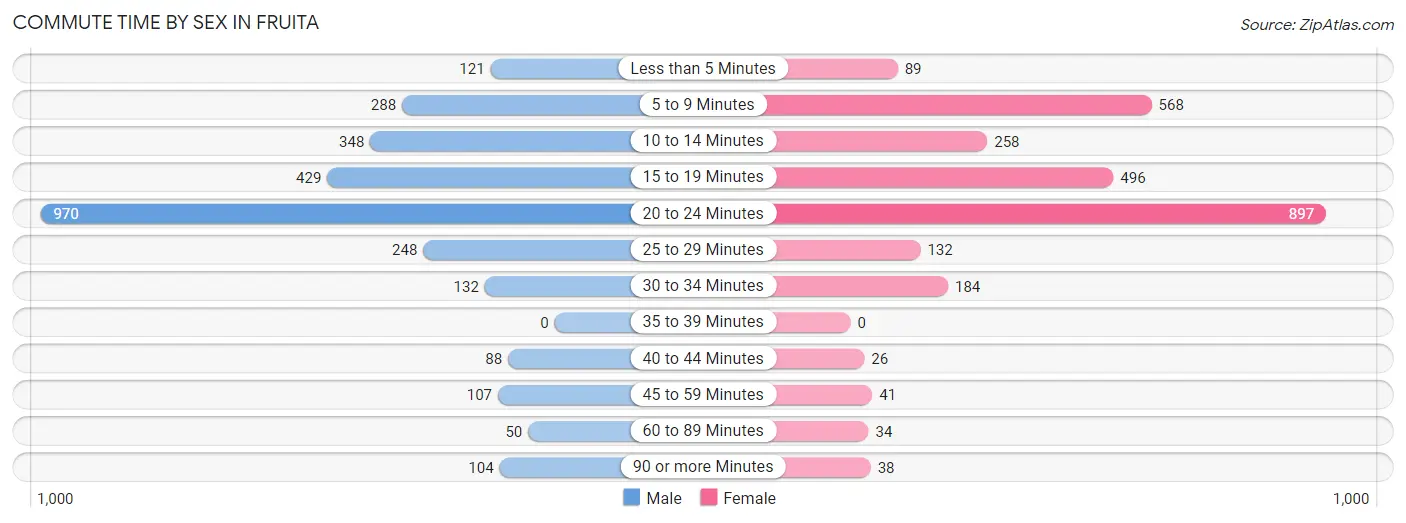
| Commute Time | Male | Female |
| Less than 5 Minutes | 121 (4.2%) | 89 (3.2%) |
| 5 to 9 Minutes | 288 (10.0%) | 568 (20.6%) |
| 10 to 14 Minutes | 348 (12.1%) | 258 (9.3%) |
| 15 to 19 Minutes | 429 (14.9%) | 496 (17.9%) |
| 20 to 24 Minutes | 970 (33.6%) | 897 (32.5%) |
| 25 to 29 Minutes | 248 (8.6%) | 132 (4.8%) |
| 30 to 34 Minutes | 132 (4.6%) | 184 (6.7%) |
| 35 to 39 Minutes | 0 (0.0%) | 0 (0.0%) |
| 40 to 44 Minutes | 88 (3.0%) | 26 (0.9%) |
| 45 to 59 Minutes | 107 (3.7%) | 41 (1.5%) |
| 60 to 89 Minutes | 50 (1.7%) | 34 (1.2%) |
| 90 or more Minutes | 104 (3.6%) | 38 (1.4%) |
Time of Departure to Work by Sex in Fruita
The most frequent times of departure to work in Fruita are 7:00 AM to 7:29 AM (709, 24.6%) for males and 7:30 AM to 7:59 AM (608, 22.0%) for females.
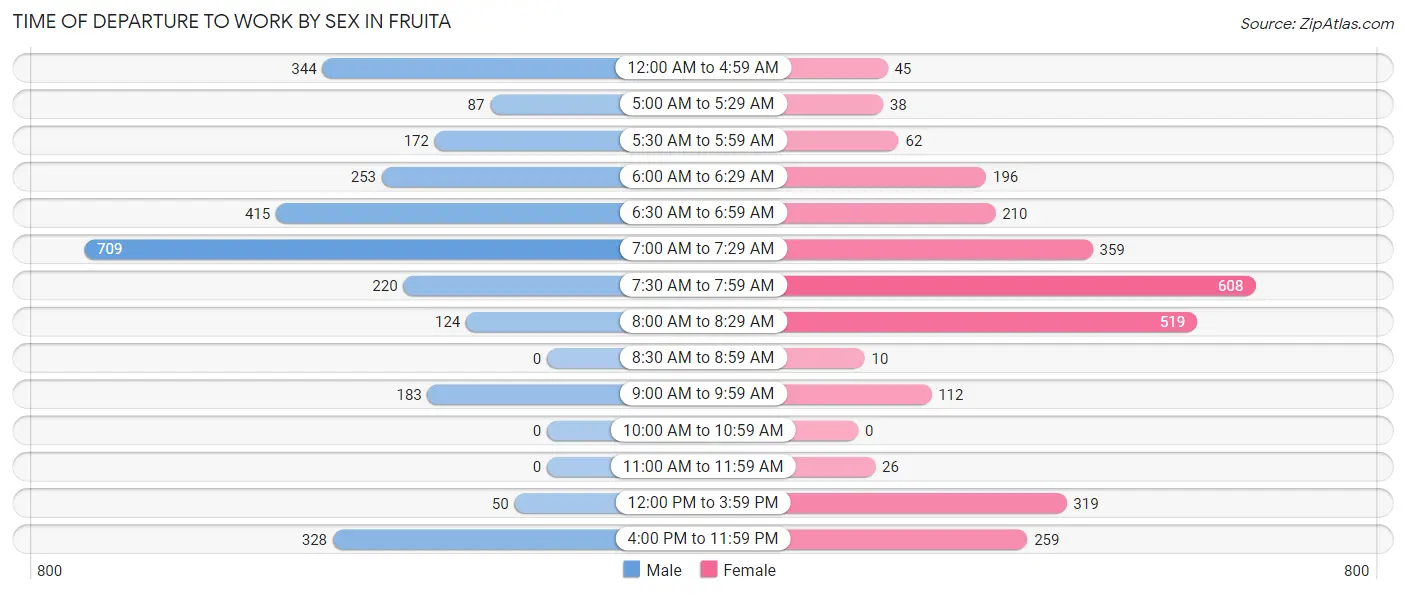
| Time of Departure | Male | Female |
| 12:00 AM to 4:59 AM | 344 (11.9%) | 45 (1.6%) |
| 5:00 AM to 5:29 AM | 87 (3.0%) | 38 (1.4%) |
| 5:30 AM to 5:59 AM | 172 (6.0%) | 62 (2.2%) |
| 6:00 AM to 6:29 AM | 253 (8.8%) | 196 (7.1%) |
| 6:30 AM to 6:59 AM | 415 (14.4%) | 210 (7.6%) |
| 7:00 AM to 7:29 AM | 709 (24.6%) | 359 (13.0%) |
| 7:30 AM to 7:59 AM | 220 (7.6%) | 608 (22.0%) |
| 8:00 AM to 8:29 AM | 124 (4.3%) | 519 (18.8%) |
| 8:30 AM to 8:59 AM | 0 (0.0%) | 10 (0.4%) |
| 9:00 AM to 9:59 AM | 183 (6.3%) | 112 (4.1%) |
| 10:00 AM to 10:59 AM | 0 (0.0%) | 0 (0.0%) |
| 11:00 AM to 11:59 AM | 0 (0.0%) | 26 (0.9%) |
| 12:00 PM to 3:59 PM | 50 (1.7%) | 319 (11.6%) |
| 4:00 PM to 11:59 PM | 328 (11.4%) | 259 (9.4%) |
| Total | 2,885 (100.0%) | 2,763 (100.0%) |
Housing Occupancy in Fruita
Occupancy by Ownership in Fruita
Of the total 5,018 dwellings in Fruita, owner-occupied units account for 3,924 (78.2%), while renter-occupied units make up 1,094 (21.8%).
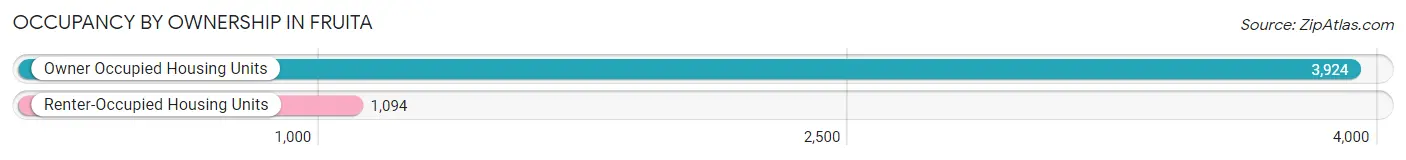
| Occupancy | # Housing Units | % Housing Units |
| Owner Occupied Housing Units | 3,924 | 78.2% |
| Renter-Occupied Housing Units | 1,094 | 21.8% |
| Total Occupied Housing Units | 5,018 | 100.0% |
Occupancy by Household Size in Fruita
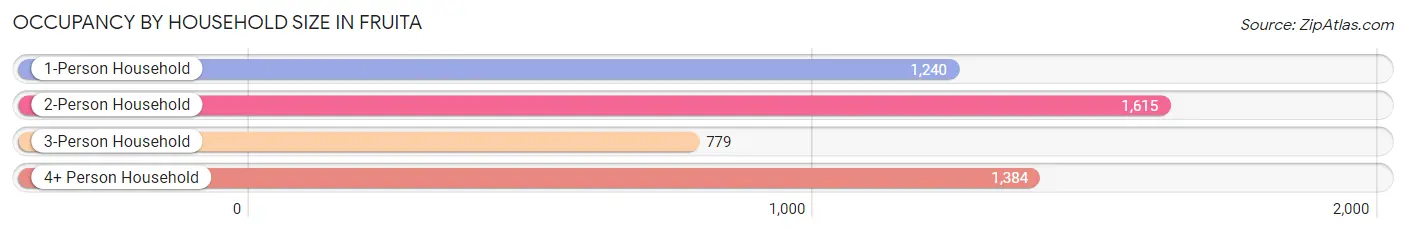
| Household Size | # Housing Units | % Housing Units |
| 1-Person Household | 1,240 | 24.7% |
| 2-Person Household | 1,615 | 32.2% |
| 3-Person Household | 779 | 15.5% |
| 4+ Person Household | 1,384 | 27.6% |
| Total Housing Units | 5,018 | 100.0% |
Occupancy by Ownership by Household Size in Fruita
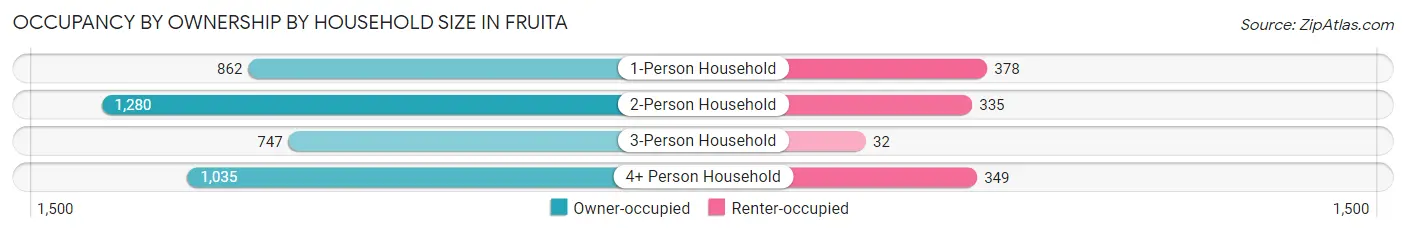
| Household Size | Owner-occupied | Renter-occupied |
| 1-Person Household | 862 (69.5%) | 378 (30.5%) |
| 2-Person Household | 1,280 (79.3%) | 335 (20.7%) |
| 3-Person Household | 747 (95.9%) | 32 (4.1%) |
| 4+ Person Household | 1,035 (74.8%) | 349 (25.2%) |
| Total Housing Units | 3,924 (78.2%) | 1,094 (21.8%) |
Occupancy by Educational Attainment in Fruita
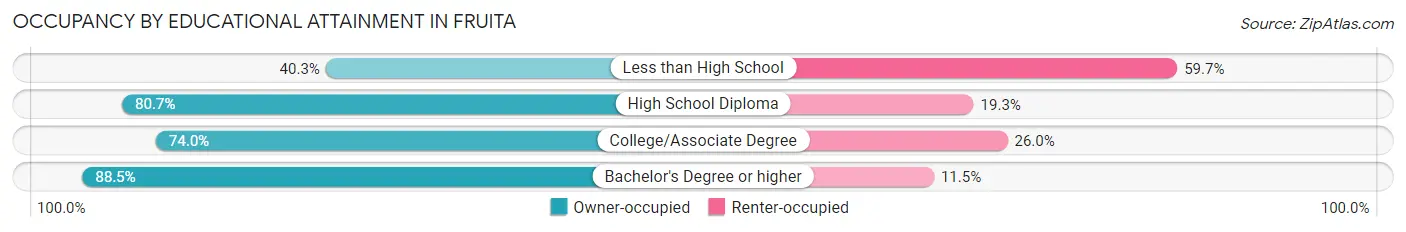
| Household Size | Owner-occupied | Renter-occupied |
| Less than High School | 156 (40.3%) | 231 (59.7%) |
| High School Diploma | 1,110 (80.7%) | 266 (19.3%) |
| College/Associate Degree | 1,136 (74.0%) | 400 (26.0%) |
| Bachelor's Degree or higher | 1,522 (88.5%) | 197 (11.5%) |
Occupancy by Age of Householder in Fruita
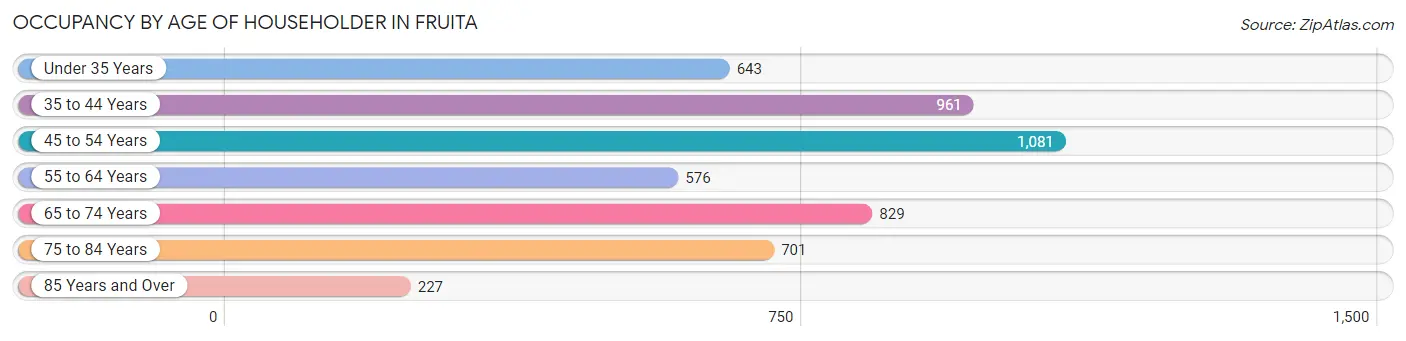
| Age Bracket | # Households | % Households |
| Under 35 Years | 643 | 12.8% |
| 35 to 44 Years | 961 | 19.2% |
| 45 to 54 Years | 1,081 | 21.5% |
| 55 to 64 Years | 576 | 11.5% |
| 65 to 74 Years | 829 | 16.5% |
| 75 to 84 Years | 701 | 14.0% |
| 85 Years and Over | 227 | 4.5% |
| Total | 5,018 | 100.0% |
Housing Finances in Fruita
Median Income by Occupancy in Fruita
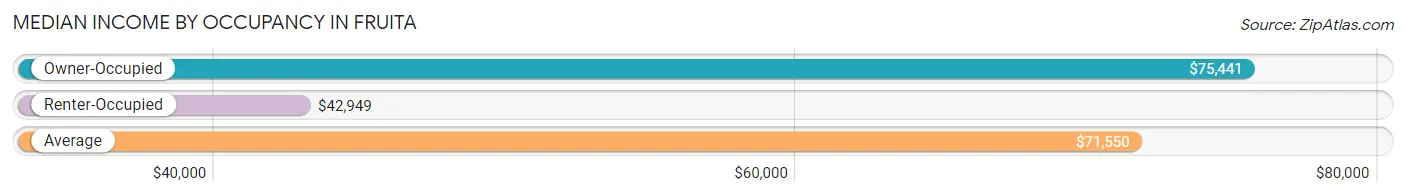
| Occupancy Type | # Households | Median Income |
| Owner-Occupied | 3,924 (78.2%) | $75,441 |
| Renter-Occupied | 1,094 (21.8%) | $42,949 |
| Average | 5,018 (100.0%) | $71,550 |
Occupancy by Householder Income Bracket in Fruita
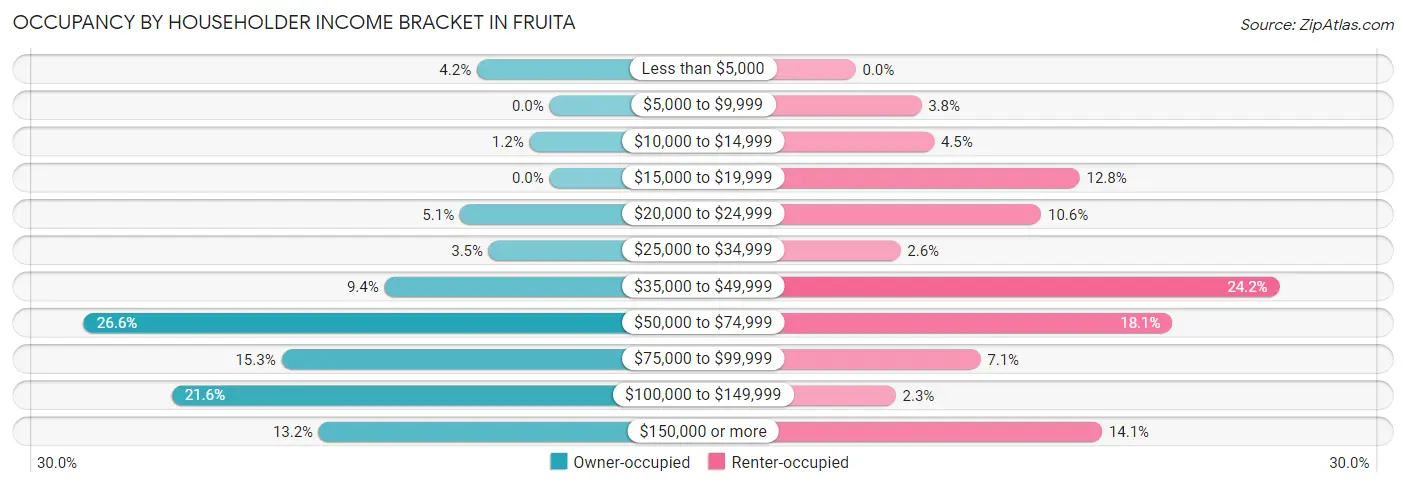
| Income Bracket | Owner-occupied | Renter-occupied |
| Less than $5,000 | 163 (4.2%) | 0 (0.0%) |
| $5,000 to $9,999 | 0 (0.0%) | 41 (3.7%) |
| $10,000 to $14,999 | 45 (1.1%) | 49 (4.5%) |
| $15,000 to $19,999 | 0 (0.0%) | 140 (12.8%) |
| $20,000 to $24,999 | 201 (5.1%) | 116 (10.6%) |
| $25,000 to $34,999 | 136 (3.5%) | 28 (2.6%) |
| $35,000 to $49,999 | 370 (9.4%) | 265 (24.2%) |
| $50,000 to $74,999 | 1,044 (26.6%) | 198 (18.1%) |
| $75,000 to $99,999 | 601 (15.3%) | 78 (7.1%) |
| $100,000 to $149,999 | 847 (21.6%) | 25 (2.3%) |
| $150,000 or more | 517 (13.2%) | 154 (14.1%) |
| Total | 3,924 (100.0%) | 1,094 (100.0%) |
Monthly Housing Cost Tiers in Fruita
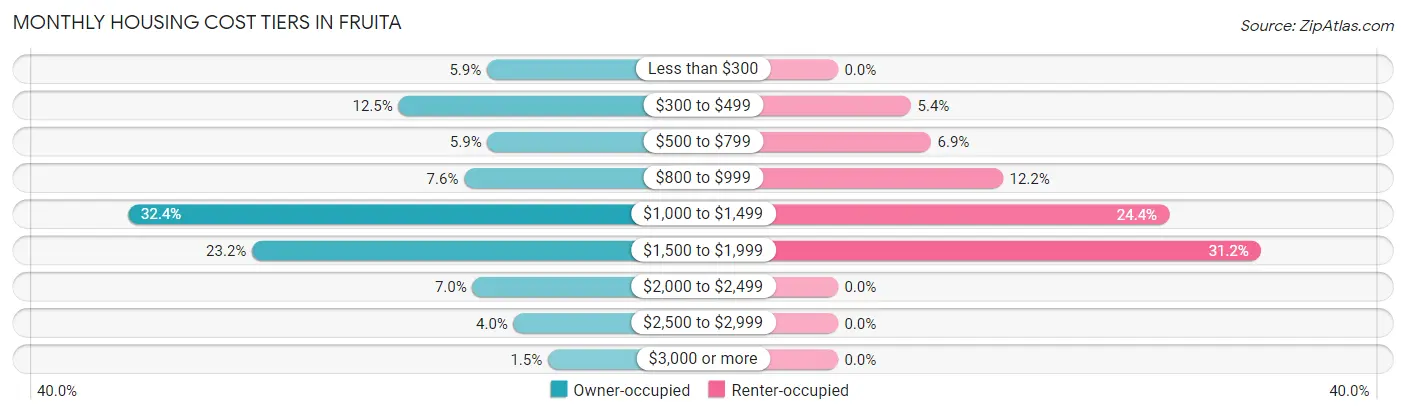
| Monthly Cost | Owner-occupied | Renter-occupied |
| Less than $300 | 233 (5.9%) | 0 (0.0%) |
| $300 to $499 | 489 (12.5%) | 59 (5.4%) |
| $500 to $799 | 232 (5.9%) | 75 (6.9%) |
| $800 to $999 | 299 (7.6%) | 133 (12.2%) |
| $1,000 to $1,499 | 1,271 (32.4%) | 267 (24.4%) |
| $1,500 to $1,999 | 912 (23.2%) | 341 (31.2%) |
| $2,000 to $2,499 | 275 (7.0%) | 0 (0.0%) |
| $2,500 to $2,999 | 156 (4.0%) | 0 (0.0%) |
| $3,000 or more | 57 (1.5%) | 0 (0.0%) |
| Total | 3,924 (100.0%) | 1,094 (100.0%) |
Physical Housing Characteristics in Fruita
Housing Structures in Fruita
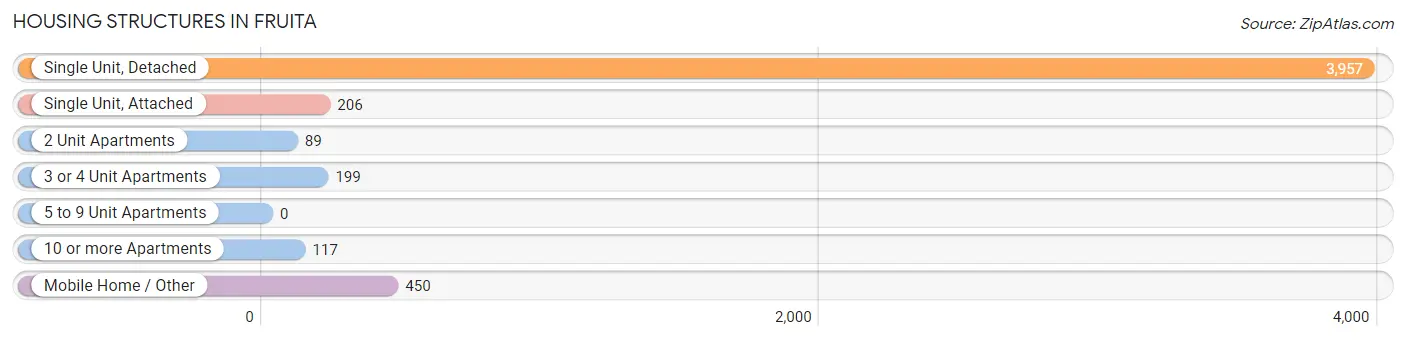
| Structure Type | # Housing Units | % Housing Units |
| Single Unit, Detached | 3,957 | 78.9% |
| Single Unit, Attached | 206 | 4.1% |
| 2 Unit Apartments | 89 | 1.8% |
| 3 or 4 Unit Apartments | 199 | 4.0% |
| 5 to 9 Unit Apartments | 0 | 0.0% |
| 10 or more Apartments | 117 | 2.3% |
| Mobile Home / Other | 450 | 9.0% |
| Total | 5,018 | 100.0% |
Housing Structures by Occupancy in Fruita
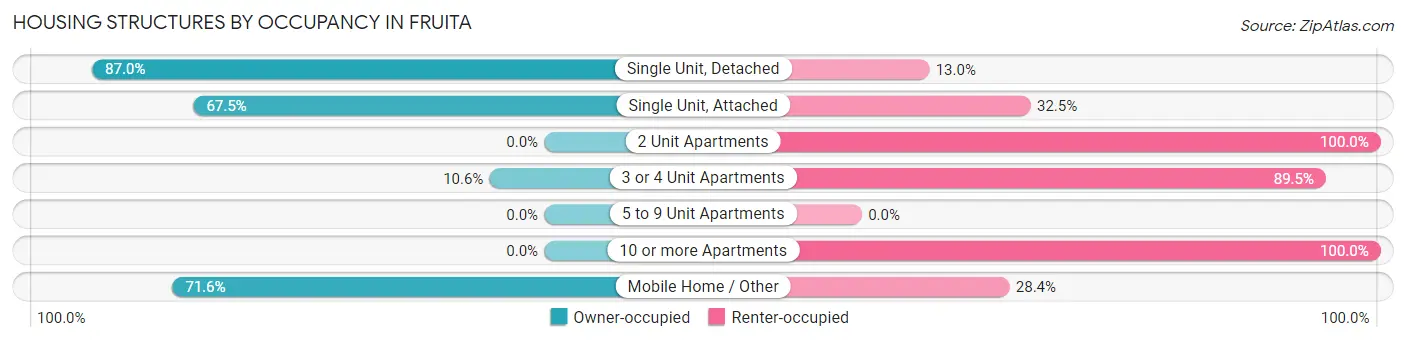
| Structure Type | Owner-occupied | Renter-occupied |
| Single Unit, Detached | 3,442 (87.0%) | 515 (13.0%) |
| Single Unit, Attached | 139 (67.5%) | 67 (32.5%) |
| 2 Unit Apartments | 0 (0.0%) | 89 (100.0%) |
| 3 or 4 Unit Apartments | 21 (10.5%) | 178 (89.4%) |
| 5 to 9 Unit Apartments | 0 (0.0%) | 0 (0.0%) |
| 10 or more Apartments | 0 (0.0%) | 117 (100.0%) |
| Mobile Home / Other | 322 (71.6%) | 128 (28.4%) |
| Total | 3,924 (78.2%) | 1,094 (21.8%) |
Housing Structures by Number of Rooms in Fruita
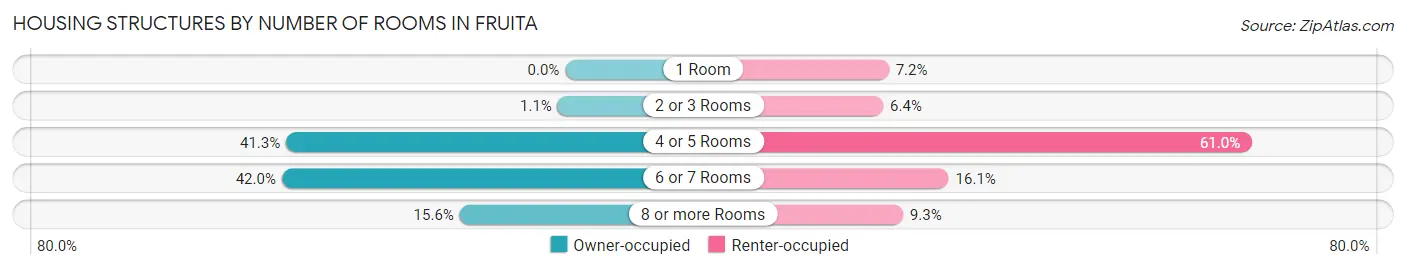
| Number of Rooms | Owner-occupied | Renter-occupied |
| 1 Room | 0 (0.0%) | 79 (7.2%) |
| 2 or 3 Rooms | 44 (1.1%) | 70 (6.4%) |
| 4 or 5 Rooms | 1,621 (41.3%) | 667 (61.0%) |
| 6 or 7 Rooms | 1,646 (41.9%) | 176 (16.1%) |
| 8 or more Rooms | 613 (15.6%) | 102 (9.3%) |
| Total | 3,924 (100.0%) | 1,094 (100.0%) |
Housing Structure by Heating Type in Fruita
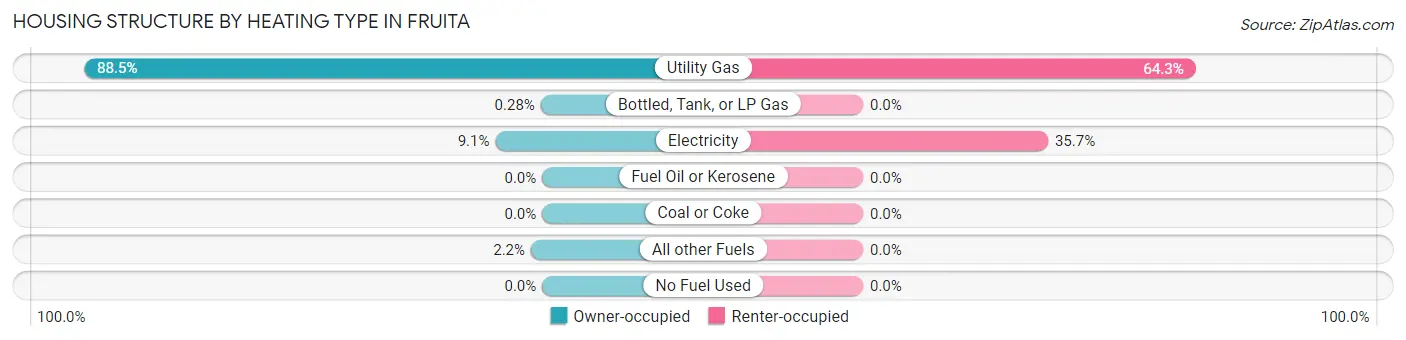
| Heating Type | Owner-occupied | Renter-occupied |
| Utility Gas | 3,473 (88.5%) | 703 (64.3%) |
| Bottled, Tank, or LP Gas | 11 (0.3%) | 0 (0.0%) |
| Electricity | 355 (9.0%) | 391 (35.7%) |
| Fuel Oil or Kerosene | 0 (0.0%) | 0 (0.0%) |
| Coal or Coke | 0 (0.0%) | 0 (0.0%) |
| All other Fuels | 85 (2.2%) | 0 (0.0%) |
| No Fuel Used | 0 (0.0%) | 0 (0.0%) |
| Total | 3,924 (100.0%) | 1,094 (100.0%) |
Household Vehicle Usage in Fruita
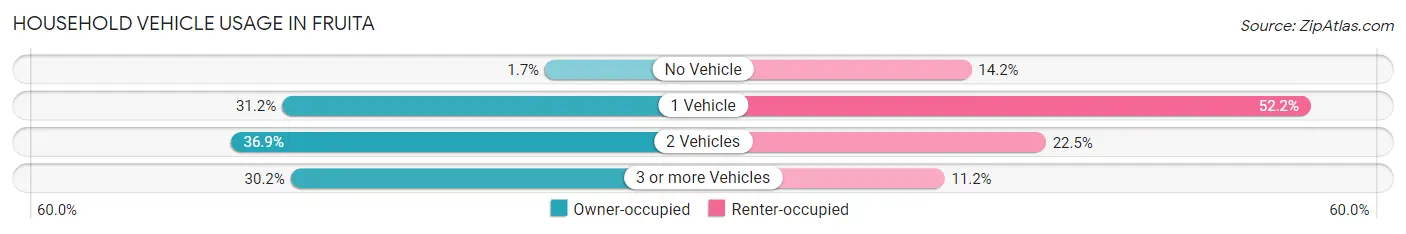
| Vehicles per Household | Owner-occupied | Renter-occupied |
| No Vehicle | 67 (1.7%) | 155 (14.2%) |
| 1 Vehicle | 1,223 (31.2%) | 571 (52.2%) |
| 2 Vehicles | 1,449 (36.9%) | 246 (22.5%) |
| 3 or more Vehicles | 1,185 (30.2%) | 122 (11.2%) |
| Total | 3,924 (100.0%) | 1,094 (100.0%) |
Real Estate & Mortgages in Fruita
Real Estate and Mortgage Overview in Fruita
| Characteristic | Without Mortgage | With Mortgage |
| Housing Units | 884 | 3,040 |
| Median Property Value | $305,700 | $338,500 |
| Median Household Income | $53,269 | $462 |
| Monthly Housing Costs | $360 | $41 |
| Real Estate Taxes | $1,182 | $102 |
Property Value by Mortgage Status in Fruita
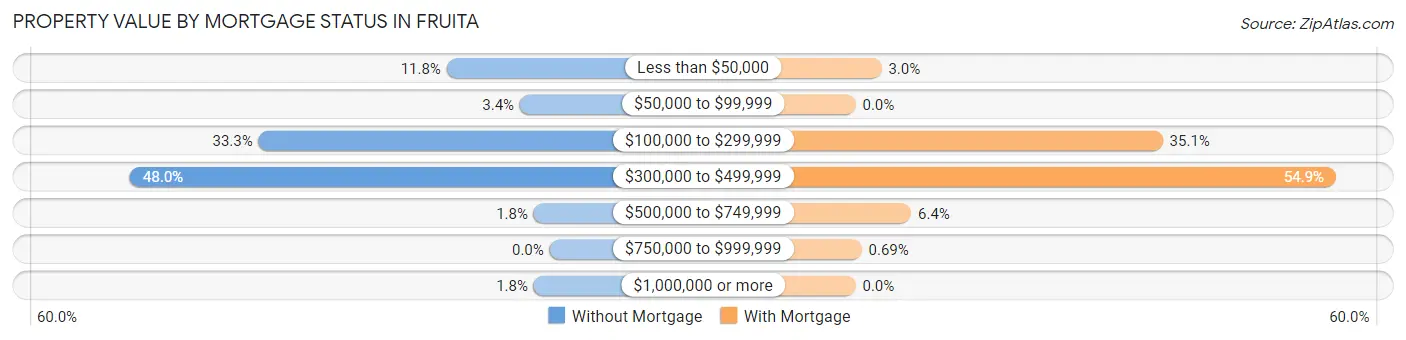
| Property Value | Without Mortgage | With Mortgage |
| Less than $50,000 | 104 (11.8%) | 90 (3.0%) |
| $50,000 to $99,999 | 30 (3.4%) | 0 (0.0%) |
| $100,000 to $299,999 | 294 (33.3%) | 1,067 (35.1%) |
| $300,000 to $499,999 | 424 (48.0%) | 1,669 (54.9%) |
| $500,000 to $749,999 | 16 (1.8%) | 193 (6.4%) |
| $750,000 to $999,999 | 0 (0.0%) | 21 (0.7%) |
| $1,000,000 or more | 16 (1.8%) | 0 (0.0%) |
| Total | 884 (100.0%) | 3,040 (100.0%) |
Household Income by Mortgage Status in Fruita
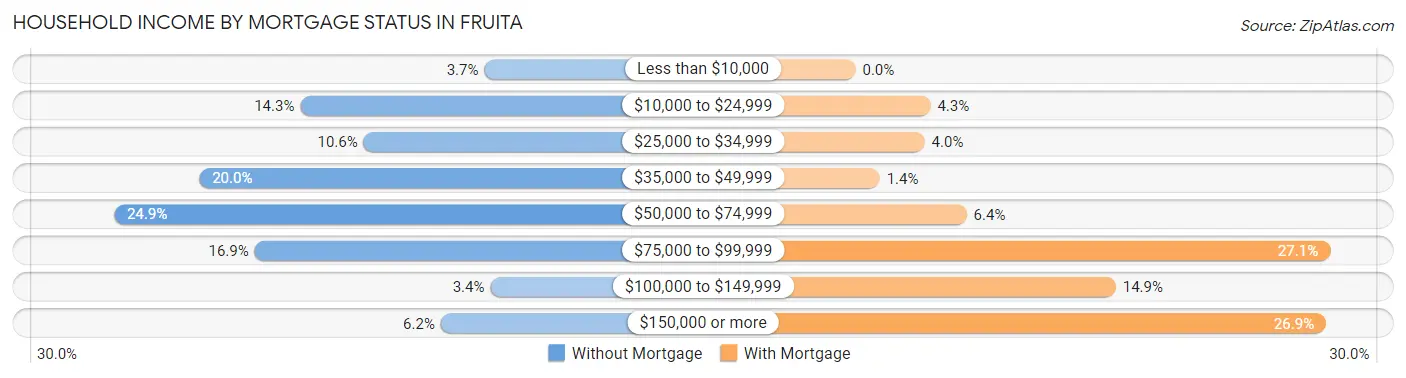
| Household Income | Without Mortgage | With Mortgage |
| Less than $10,000 | 33 (3.7%) | 0 (0.0%) |
| $10,000 to $24,999 | 126 (14.2%) | 130 (4.3%) |
| $25,000 to $34,999 | 94 (10.6%) | 120 (4.0%) |
| $35,000 to $49,999 | 177 (20.0%) | 42 (1.4%) |
| $50,000 to $74,999 | 220 (24.9%) | 193 (6.4%) |
| $75,000 to $99,999 | 149 (16.9%) | 824 (27.1%) |
| $100,000 to $149,999 | 30 (3.4%) | 452 (14.9%) |
| $150,000 or more | 55 (6.2%) | 817 (26.9%) |
| Total | 884 (100.0%) | 3,040 (100.0%) |
Property Value to Household Income Ratio in Fruita
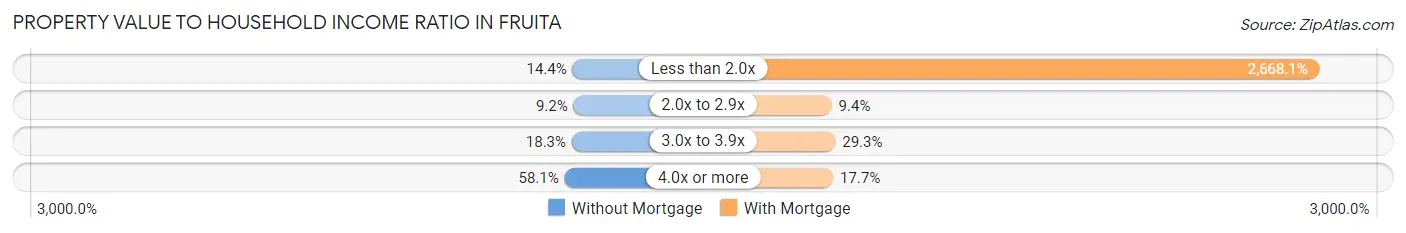
| Value-to-Income Ratio | Without Mortgage | With Mortgage |
| Less than 2.0x | 127 (14.4%) | 81,111 (2,668.1%) |
| 2.0x to 2.9x | 81 (9.2%) | 286 (9.4%) |
| 3.0x to 3.9x | 162 (18.3%) | 890 (29.3%) |
| 4.0x or more | 514 (58.1%) | 539 (17.7%) |
| Total | 884 (100.0%) | 3,040 (100.0%) |
Real Estate Taxes by Mortgage Status in Fruita
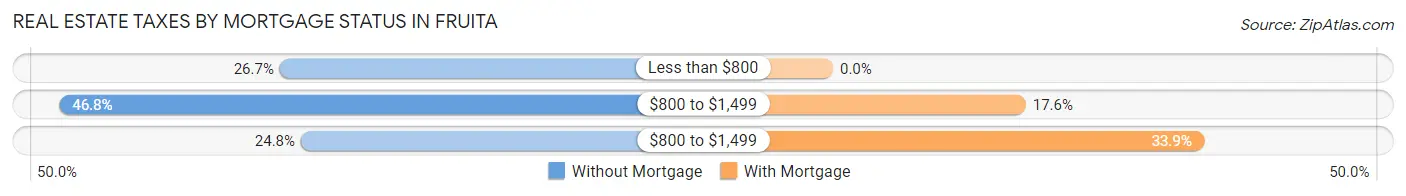
| Property Taxes | Without Mortgage | With Mortgage |
| Less than $800 | 236 (26.7%) | 0 (0.0%) |
| $800 to $1,499 | 414 (46.8%) | 535 (17.6%) |
| $800 to $1,499 | 219 (24.8%) | 1,029 (33.9%) |
| Total | 884 (100.0%) | 3,040 (100.0%) |
Health & Disability in Fruita
Health Insurance Coverage by Age in Fruita
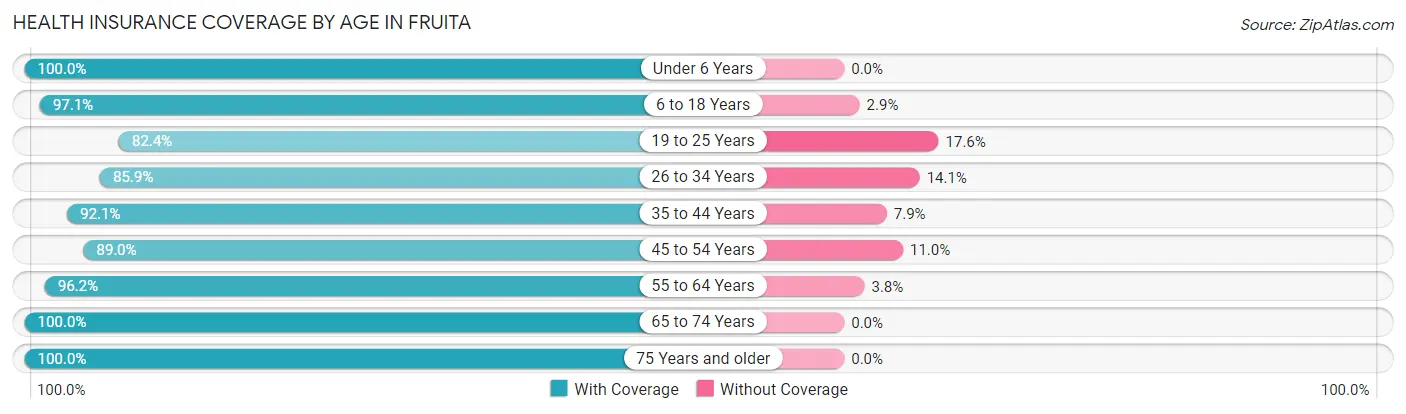
| Age Bracket | With Coverage | Without Coverage |
| Under 6 Years | 829 (100.0%) | 0 (0.0%) |
| 6 to 18 Years | 3,090 (97.1%) | 91 (2.9%) |
| 19 to 25 Years | 628 (82.4%) | 134 (17.6%) |
| 26 to 34 Years | 1,106 (85.9%) | 181 (14.1%) |
| 35 to 44 Years | 1,588 (92.1%) | 137 (7.9%) |
| 45 to 54 Years | 1,608 (89.0%) | 198 (11.0%) |
| 55 to 64 Years | 1,199 (96.2%) | 47 (3.8%) |
| 65 to 74 Years | 1,133 (100.0%) | 0 (0.0%) |
| 75 Years and older | 1,400 (100.0%) | 0 (0.0%) |
| Total | 12,581 (94.1%) | 788 (5.9%) |
Health Insurance Coverage by Citizenship Status in Fruita
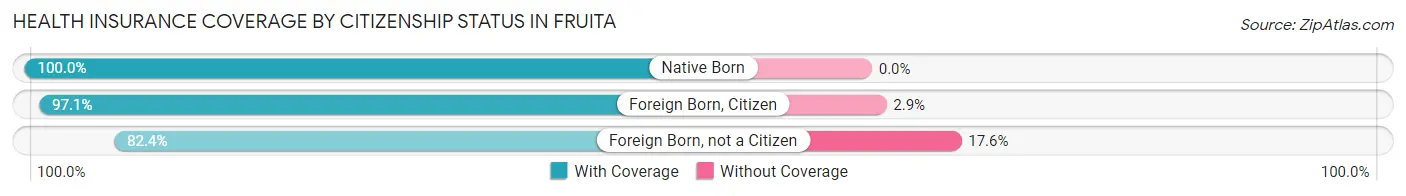
| Citizenship Status | With Coverage | Without Coverage |
| Native Born | 829 (100.0%) | 0 (0.0%) |
| Foreign Born, Citizen | 3,090 (97.1%) | 91 (2.9%) |
| Foreign Born, not a Citizen | 628 (82.4%) | 134 (17.6%) |
Health Insurance Coverage by Household Income in Fruita
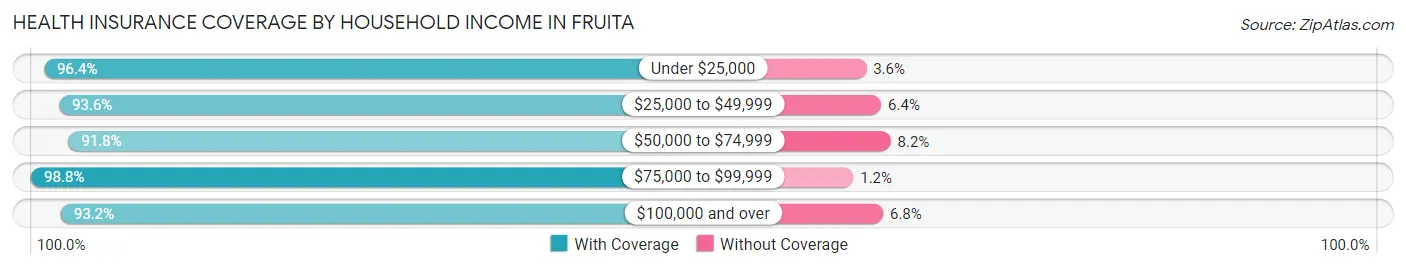
| Household Income | With Coverage | Without Coverage |
| Under $25,000 | 1,085 (96.4%) | 41 (3.6%) |
| $25,000 to $49,999 | 1,555 (93.6%) | 107 (6.4%) |
| $50,000 to $74,999 | 2,604 (91.8%) | 233 (8.2%) |
| $75,000 to $99,999 | 2,107 (98.8%) | 26 (1.2%) |
| $100,000 and over | 5,230 (93.2%) | 381 (6.8%) |
Public vs Private Health Insurance Coverage by Age in Fruita
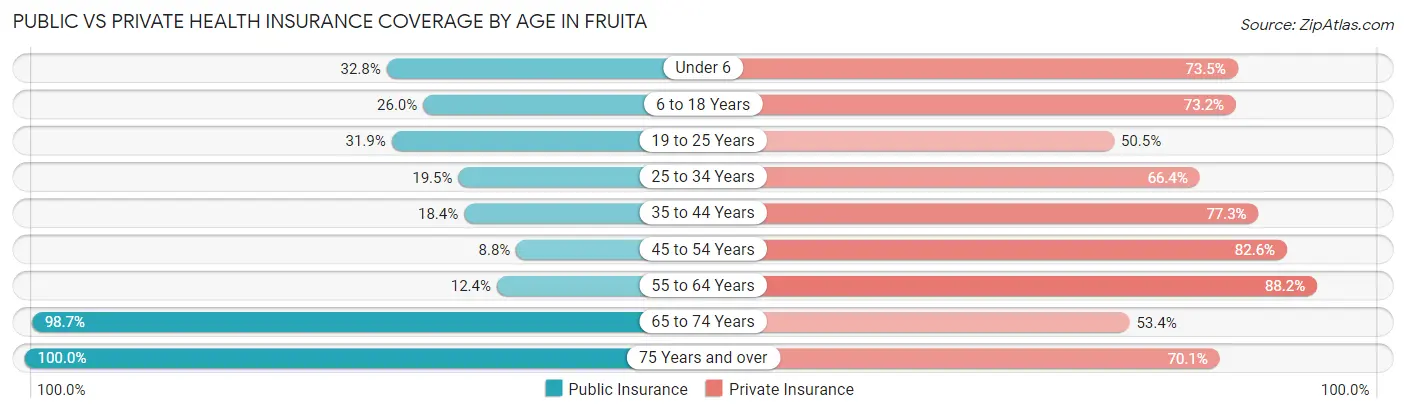
| Age Bracket | Public Insurance | Private Insurance |
| Under 6 | 272 (32.8%) | 609 (73.5%) |
| 6 to 18 Years | 828 (26.0%) | 2,327 (73.2%) |
| 19 to 25 Years | 243 (31.9%) | 385 (50.5%) |
| 25 to 34 Years | 251 (19.5%) | 855 (66.4%) |
| 35 to 44 Years | 318 (18.4%) | 1,334 (77.3%) |
| 45 to 54 Years | 158 (8.7%) | 1,492 (82.6%) |
| 55 to 64 Years | 154 (12.4%) | 1,099 (88.2%) |
| 65 to 74 Years | 1,118 (98.7%) | 605 (53.4%) |
| 75 Years and over | 1,400 (100.0%) | 982 (70.1%) |
| Total | 4,742 (35.5%) | 9,688 (72.5%) |
Disability Status by Sex by Age in Fruita
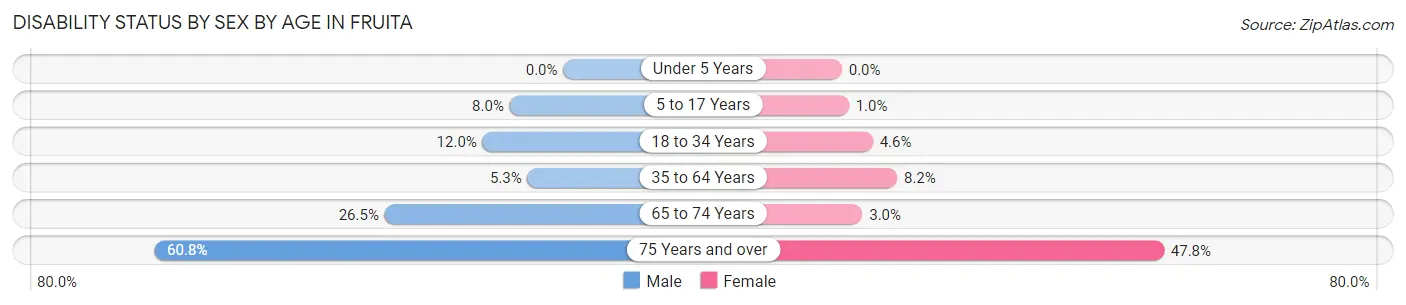
| Age Bracket | Male | Female |
| Under 5 Years | 0 (0.0%) | 0 (0.0%) |
| 5 to 17 Years | 106 (8.0%) | 18 (1.0%) |
| 18 to 34 Years | 152 (12.0%) | 47 (4.6%) |
| 35 to 64 Years | 121 (5.3%) | 205 (8.2%) |
| 65 to 74 Years | 135 (26.5%) | 19 (3.0%) |
| 75 Years and over | 350 (60.8%) | 394 (47.8%) |
Disability Class by Sex by Age in Fruita
Disability Class: Hearing Difficulty
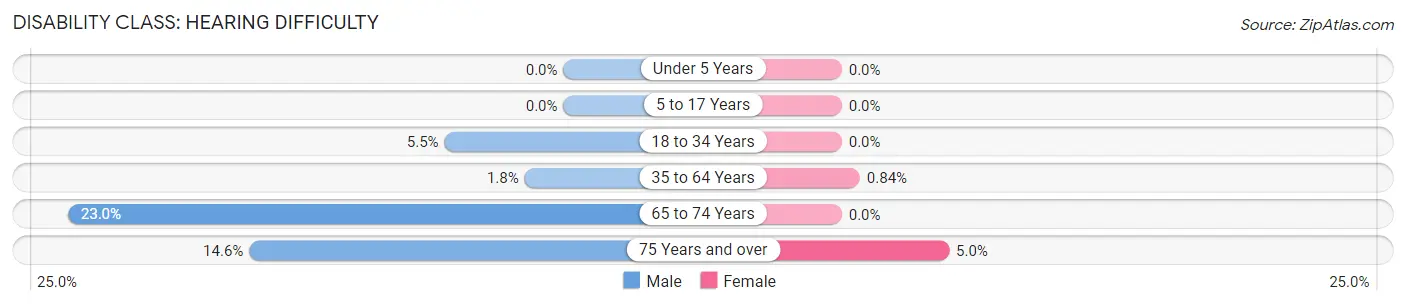
| Age Bracket | Male | Female |
| Under 5 Years | 0 (0.0%) | 0 (0.0%) |
| 5 to 17 Years | 0 (0.0%) | 0 (0.0%) |
| 18 to 34 Years | 70 (5.5%) | 0 (0.0%) |
| 35 to 64 Years | 41 (1.8%) | 21 (0.8%) |
| 65 to 74 Years | 117 (23.0%) | 0 (0.0%) |
| 75 Years and over | 84 (14.6%) | 41 (5.0%) |
Disability Class: Vision Difficulty
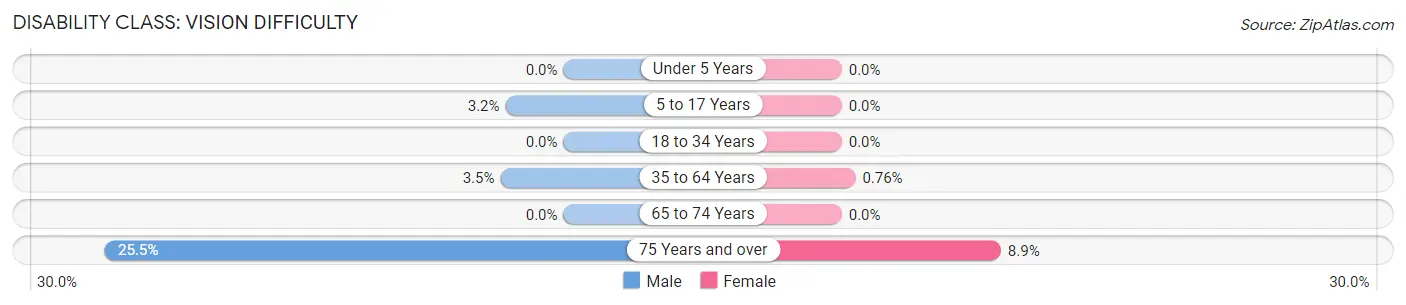
| Age Bracket | Male | Female |
| Under 5 Years | 0 (0.0%) | 0 (0.0%) |
| 5 to 17 Years | 43 (3.2%) | 0 (0.0%) |
| 18 to 34 Years | 0 (0.0%) | 0 (0.0%) |
| 35 to 64 Years | 80 (3.5%) | 19 (0.8%) |
| 65 to 74 Years | 0 (0.0%) | 0 (0.0%) |
| 75 Years and over | 147 (25.5%) | 73 (8.9%) |
Disability Class: Cognitive Difficulty
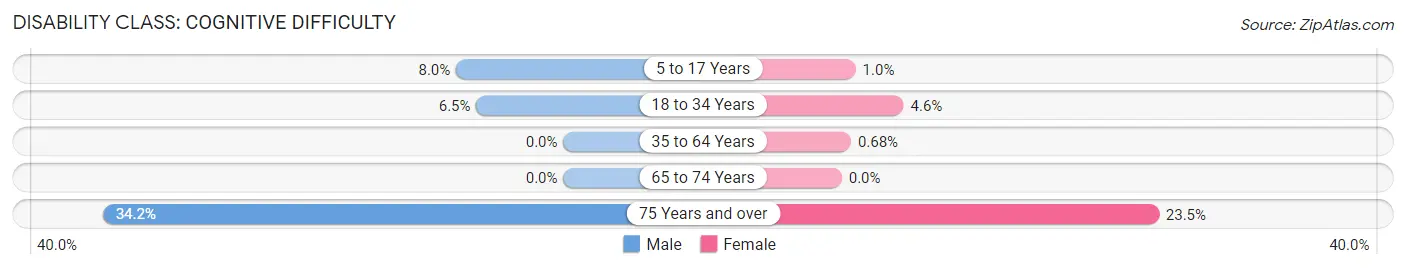
| Age Bracket | Male | Female |
| 5 to 17 Years | 106 (8.0%) | 18 (1.0%) |
| 18 to 34 Years | 82 (6.5%) | 47 (4.6%) |
| 35 to 64 Years | 0 (0.0%) | 17 (0.7%) |
| 65 to 74 Years | 0 (0.0%) | 0 (0.0%) |
| 75 Years and over | 197 (34.2%) | 194 (23.5%) |
Disability Class: Ambulatory Difficulty
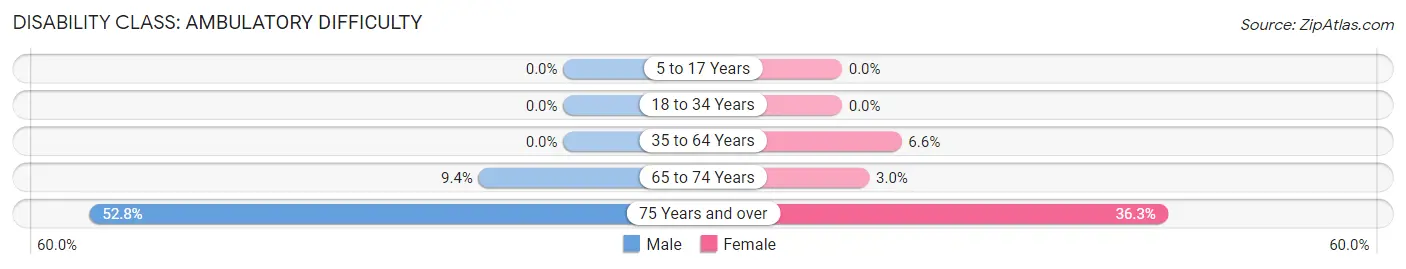
| Age Bracket | Male | Female |
| 5 to 17 Years | 0 (0.0%) | 0 (0.0%) |
| 18 to 34 Years | 0 (0.0%) | 0 (0.0%) |
| 35 to 64 Years | 0 (0.0%) | 166 (6.6%) |
| 65 to 74 Years | 48 (9.4%) | 19 (3.0%) |
| 75 Years and over | 304 (52.8%) | 299 (36.3%) |
Disability Class: Self-Care Difficulty
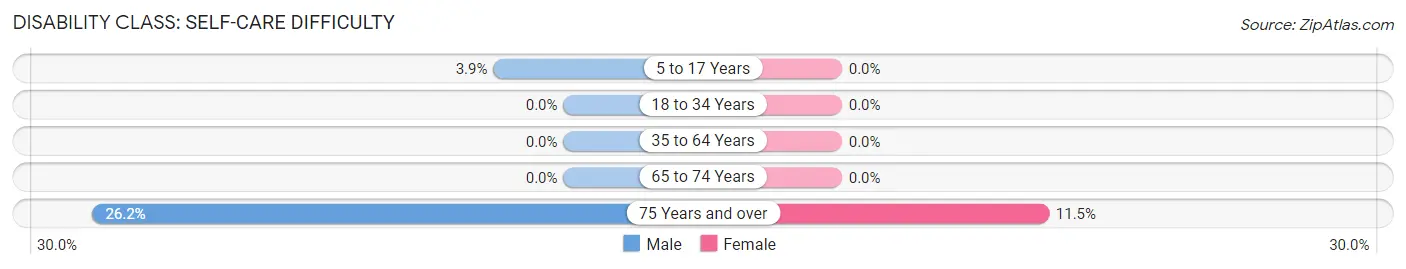
| Age Bracket | Male | Female |
| 5 to 17 Years | 52 (3.9%) | 0 (0.0%) |
| 18 to 34 Years | 0 (0.0%) | 0 (0.0%) |
| 35 to 64 Years | 0 (0.0%) | 0 (0.0%) |
| 65 to 74 Years | 0 (0.0%) | 0 (0.0%) |
| 75 Years and over | 151 (26.2%) | 95 (11.5%) |
Technology Access in Fruita
Computing Device Access in Fruita
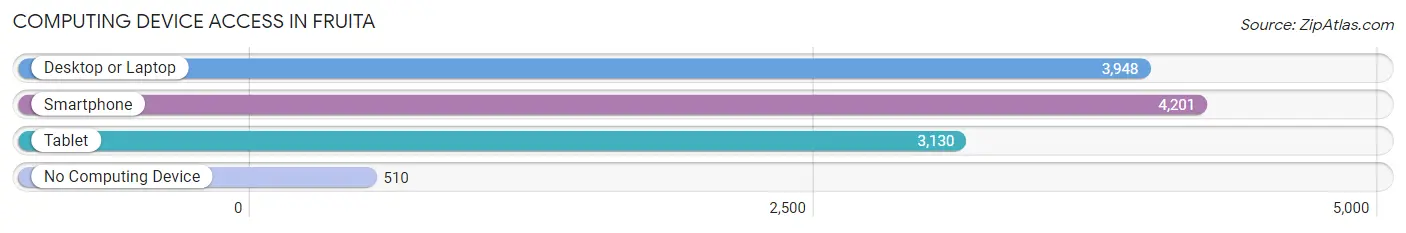
| Device Type | # Households | % Households |
| Desktop or Laptop | 3,948 | 78.7% |
| Smartphone | 4,201 | 83.7% |
| Tablet | 3,130 | 62.4% |
| No Computing Device | 510 | 10.2% |
| Total | 5,018 | 100.0% |
Internet Access in Fruita
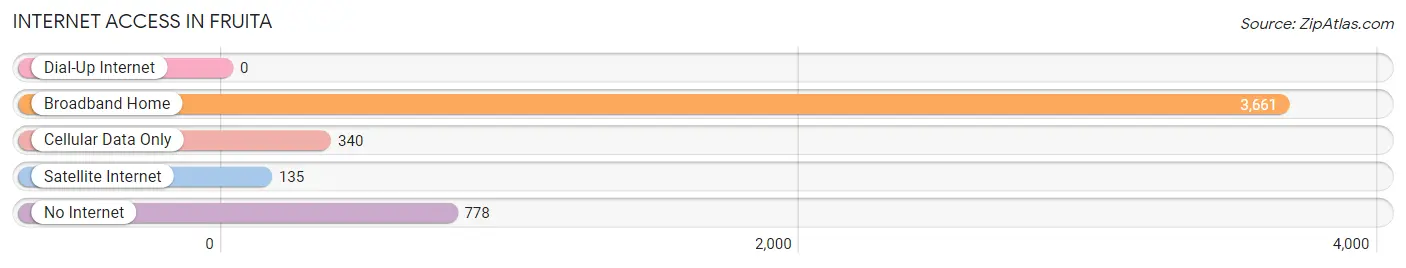
| Internet Type | # Households | % Households |
| Dial-Up Internet | 0 | 0.0% |
| Broadband Home | 3,661 | 73.0% |
| Cellular Data Only | 340 | 6.8% |
| Satellite Internet | 135 | 2.7% |
| No Internet | 778 | 15.5% |
| Total | 5,018 | 100.0% |
Fruita Summary
Fruita, Colorado is a small town located in the western part of the state, in Mesa County. It is situated at the confluence of the Colorado and Gunnison Rivers, and is surrounded by the Grand Mesa, the Book Cliffs, and the Colorado National Monument. The town has a population of about 12,000 people, and is known for its outdoor recreation opportunities, its agricultural heritage, and its vibrant downtown.
Geography
Fruita is located in the western part of Colorado, in Mesa County. It is situated at the confluence of the Colorado and Gunnison Rivers, and is surrounded by the Grand Mesa, the Book Cliffs, and the Colorado National Monument. The town is located at an elevation of 4,890 feet, and has a total area of 8.2 square miles. The climate in Fruita is semi-arid, with hot summers and cold winters.
Economy
Fruita’s economy is largely based on agriculture and outdoor recreation. The town is home to several large farms, including the Fruita Fruit Farm, which grows apples, peaches, and other fruits. The town is also home to several wineries, breweries, and distilleries, as well as a number of restaurants and retail stores. Outdoor recreation is a major part of the local economy, with the Colorado National Monument, the Grand Mesa, and the Book Cliffs providing a variety of activities for visitors.
Demographics
As of the 2010 census, Fruita had a population of 12,646 people. The racial makeup of the town was 90.2% White, 0.7% African American, 0.7% Native American, 0.7% Asian, 0.2% Pacific Islander, 5.2% from other races, and 2.2% from two or more races. Hispanic or Latino of any race were 11.3% of the population. The median household income in Fruita was $45,845, and the median family income was $51,919.
History
Fruita was founded in 1884 by William Pabor, a rancher and farmer from Illinois. Pabor named the town after the abundance of fruit trees he found growing in the area. The town quickly grew, and by the early 1900s, it had become a popular destination for tourists and outdoor enthusiasts. In 1911, the Colorado National Monument was established, and the town became a popular base for exploring the monument. In the 1950s, the town began to experience a decline in population, as many of its residents moved away in search of better economic opportunities. However, in the late 1980s, the town began to experience a resurgence, as new businesses and residents moved to the area. Today, Fruita is a vibrant community, with a strong agricultural heritage and a thriving outdoor recreation industry.
Common Questions
What is Per Capita Income in Fruita?
Per Capita income in Fruita is $33,897.
What is the Median Family Income in Fruita?
Median Family Income in Fruita is $82,281.
What is the Median Household income in Fruita?
Median Household Income in Fruita is $71,550.
What is Income or Wage Gap in Fruita?
Income or Wage Gap in Fruita is 39.6%.
Women in Fruita earn 60.4 cents for every dollar earned by a man.
What is Family Income Deficit in Fruita?
Family Income Deficit in Fruita is $12,262.
Families that are below poverty line in Fruita earn $12,262 less on average than the poverty threshold level.
What is Inequality or Gini Index in Fruita?
Inequality or Gini Index in Fruita is 0.40.
What is the Total Population of Fruita?
Total Population of Fruita is 13,462.
What is the Total Male Population of Fruita?
Total Male Population of Fruita is 6,307.
What is the Total Female Population of Fruita?
Total Female Population of Fruita is 7,155.
What is the Ratio of Males per 100 Females in Fruita?
There are 88.15 Males per 100 Females in Fruita.
What is the Ratio of Females per 100 Males in Fruita?
There are 113.45 Females per 100 Males in Fruita.
What is the Median Population Age in Fruita?
Median Population Age in Fruita is 40.4 Years.
What is the Average Family Size in Fruita
Average Family Size in Fruita is 3.2 People.
What is the Average Household Size in Fruita
Average Household Size in Fruita is 2.7 People.
How Large is the Labor Force in Fruita?
There are 6,544 People in the Labor Forcein in Fruita.
What is the Percentage of People in the Labor Force in Fruita?
63.4% of People are in the Labor Force in Fruita.
What is the Unemployment Rate in Fruita?
Unemployment Rate in Fruita is 3.5%.