Zip Codes with the Highest Percentage of Population Employed in Agriculture, Fishing & Hunting in Englewood, CO
RELATED REPORTS & OPTIONS
Agriculture, Fishing & Hunting
Englewood
Compare Zip Codes
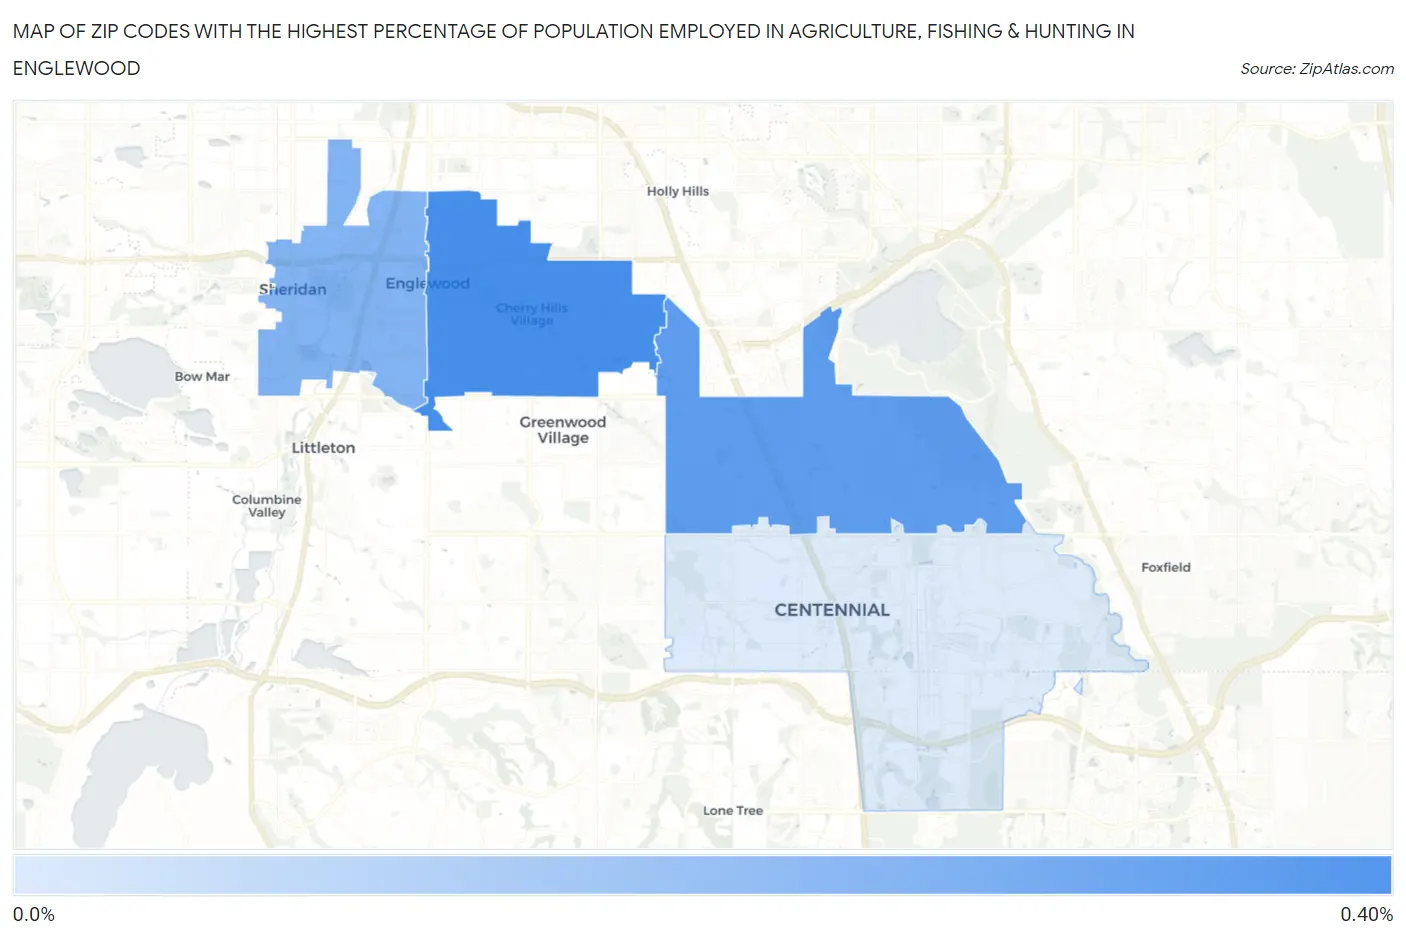
Map of Zip Codes with the Highest Percentage of Population Employed in Agriculture, Fishing & Hunting in Englewood
0.096%
0.37%
Zip Codes with the Highest Percentage of Population Employed in Agriculture, Fishing & Hunting in Englewood, CO
| Zip Code | % Employed | vs State | vs National | |
| 1. | 80113 | 0.37% | 1.1%(-0.782)#358 | 1.2%(-0.834)#20,488 |
| 2. | 80111 | 0.32% | 1.1%(-0.823)#369 | 1.2%(-0.875)#20,897 |
| 3. | 80110 | 0.26% | 1.1%(-0.887)#392 | 1.2%(-0.939)#21,649 |
| 4. | 80112 | 0.096% | 1.1%(-1.05)#417 | 1.2%(-1.10)#23,733 |
1
Common Questions
What are the Top 3 Zip Codes with the Highest Percentage of Population Employed in Agriculture, Fishing & Hunting in Englewood, CO?
Top 3 Zip Codes with the Highest Percentage of Population Employed in Agriculture, Fishing & Hunting in Englewood, CO are:
What zip code has the Highest Percentage of Population Employed in Agriculture, Fishing & Hunting in Englewood, CO?
80113 has the Highest Percentage of Population Employed in Agriculture, Fishing & Hunting in Englewood, CO with 0.37%.
What is the Percentage of Population Employed in Agriculture, Fishing & Hunting in Englewood, CO?
Percentage of Population Employed in Agriculture, Fishing & Hunting in Englewood is 0.40%.
What is the Percentage of Population Employed in Agriculture, Fishing & Hunting in Colorado?
Percentage of Population Employed in Agriculture, Fishing & Hunting in Colorado is 1.1%.
What is the Percentage of Population Employed in Agriculture, Fishing & Hunting in the United States?
Percentage of Population Employed in Agriculture, Fishing & Hunting in the United States is 1.2%.