Zip Codes with the Highest Percentage of Population Employed in Arts, Media & Entertainment in Englewood, CO
RELATED REPORTS & OPTIONS
Arts, Media & Entertainment
Englewood
Compare Zip Codes
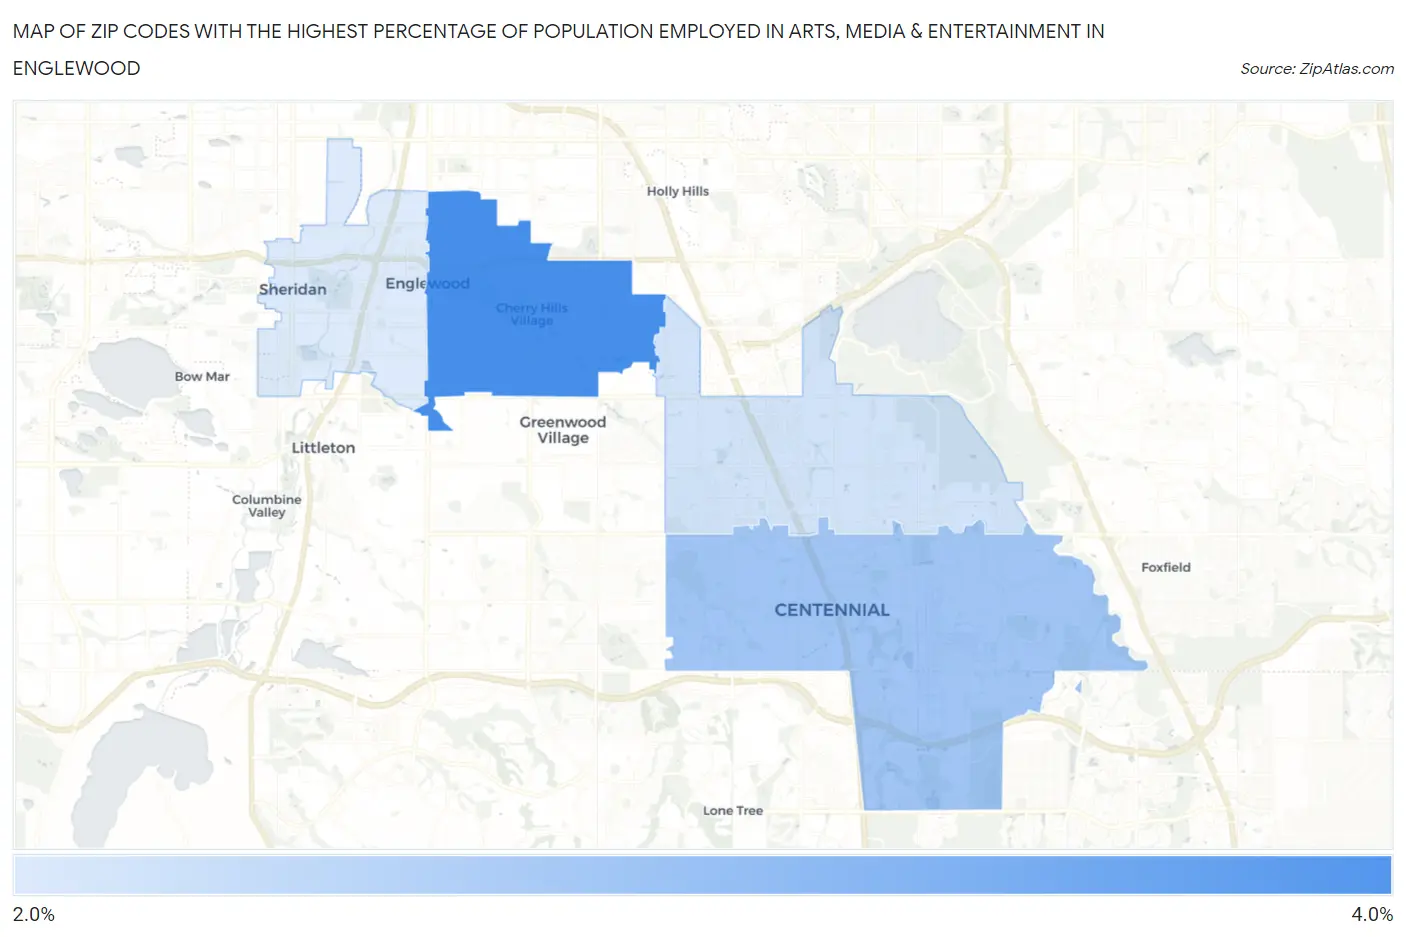
Map of Zip Codes with the Highest Percentage of Population Employed in Arts, Media & Entertainment in Englewood
2.5%
3.1%
Zip Codes with the Highest Percentage of Population Employed in Arts, Media & Entertainment in Englewood, CO
| Zip Code | % Employed | vs State | vs National | |
| 1. | 80113 | 3.1% | 2.4%(+0.665)#96 | 2.1%(+1.05)#3,821 |
| 2. | 80112 | 2.7% | 2.4%(+0.271)#127 | 2.1%(+0.656)#4,861 |
| 3. | 80111 | 2.5% | 2.4%(+0.064)#140 | 2.1%(+0.449)#5,522 |
| 4. | 80110 | 2.5% | 2.4%(+0.015)#147 | 2.1%(+0.400)#5,681 |
1
Common Questions
What are the Top 3 Zip Codes with the Highest Percentage of Population Employed in Arts, Media & Entertainment in Englewood, CO?
Top 3 Zip Codes with the Highest Percentage of Population Employed in Arts, Media & Entertainment in Englewood, CO are:
What zip code has the Highest Percentage of Population Employed in Arts, Media & Entertainment in Englewood, CO?
80113 has the Highest Percentage of Population Employed in Arts, Media & Entertainment in Englewood, CO with 3.1%.
What is the Percentage of Population Employed in Arts, Media & Entertainment in Englewood, CO?
Percentage of Population Employed in Arts, Media & Entertainment in Englewood is 3.4%.
What is the Percentage of Population Employed in Arts, Media & Entertainment in Colorado?
Percentage of Population Employed in Arts, Media & Entertainment in Colorado is 2.4%.
What is the Percentage of Population Employed in Arts, Media & Entertainment in the United States?
Percentage of Population Employed in Arts, Media & Entertainment in the United States is 2.1%.