Empire, CO Map & Demographics
Empire Map
Empire Overview
$44,117
PER CAPITA INCOME
$60,877
AVG HOUSEHOLD INCOME
7.5%
WAGE / INCOME GAP [ % ]
92.5¢/ $1
WAGE / INCOME GAP [ $ ]
0.40
INEQUALITY / GINI INDEX
447
TOTAL POPULATION
246
MALE POPULATION
201
FEMALE POPULATION
122.39
MALES / 100 FEMALES
81.71
FEMALES / 100 MALES
44.8
MEDIAN AGE
1.9
AVG FAMILY SIZE
1.6
AVG HOUSEHOLD SIZE
290
LABOR FORCE [ PEOPLE ]
70.0%
PERCENT IN LABOR FORCE
2.4%
UNEMPLOYMENT RATE
Empire Zip Codes
Empire Area Codes
Income in Empire
Income Overview in Empire
| Characteristic | Number | Measure |
| Per Capita Income | 447 | $44,117 |
| Median Family Income | 182 | $0 |
| Mean Family Income | 182 | $85,044 |
| Median Household Income | 274 | $60,877 |
| Mean Household Income | 274 | $74,758 |
| Income Deficit | 182 | $0 |
| Wage / Income Gap (%) | 447 | 7.46% |
| Wage / Income Gap ($) | 447 | 92.54¢ per $1 |
| Gini / Inequality Index | 447 | 0.40 |
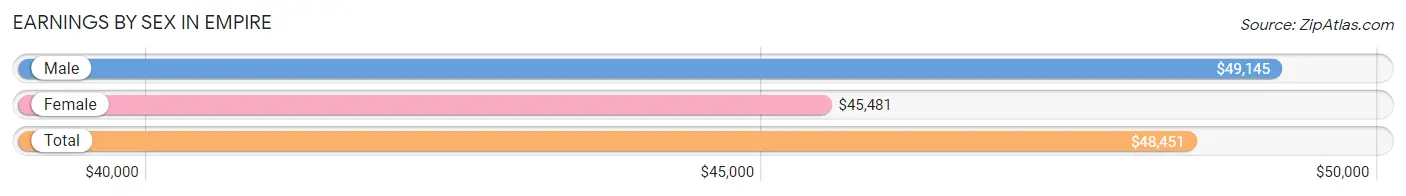
Earnings by Sex in Empire
Average Earnings in Empire are $48,451, $49,145 for men and $45,481 for women, a difference of 7.5%.
| Sex | Number | Average Earnings |
| Male | 169 (57.1%) | $49,145 |
| Female | 127 (42.9%) | $45,481 |
| Total | 296 (100.0%) | $48,451 |
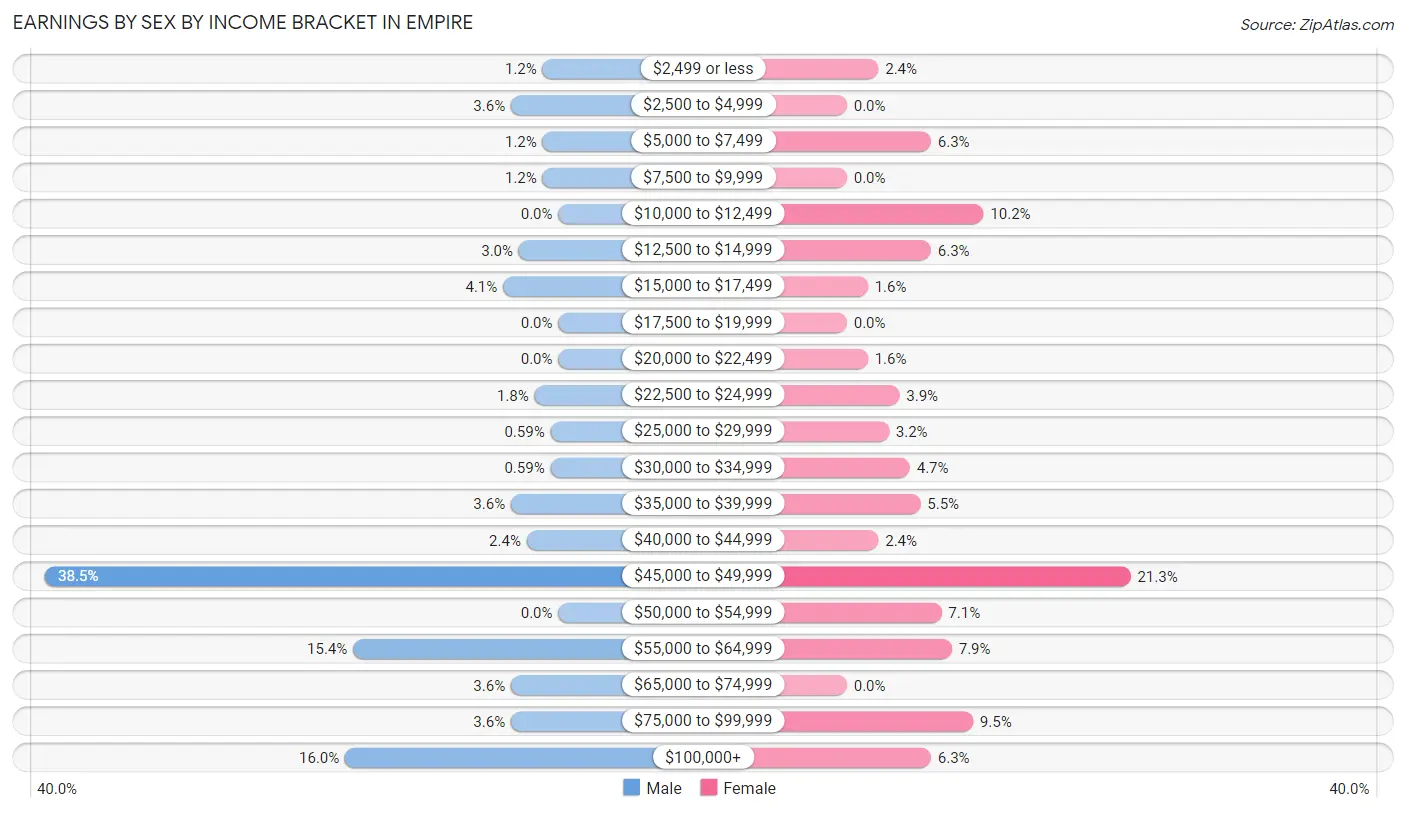
Earnings by Sex by Income Bracket in Empire
The most common earnings brackets in Empire are $45,000 to $49,999 for men (65 | 38.5%) and $45,000 to $49,999 for women (27 | 21.3%).
| Income | Male | Female |
| $2,499 or less | 2 (1.2%) | 3 (2.4%) |
| $2,500 to $4,999 | 6 (3.5%) | 0 (0.0%) |
| $5,000 to $7,499 | 2 (1.2%) | 8 (6.3%) |
| $7,500 to $9,999 | 2 (1.2%) | 0 (0.0%) |
| $10,000 to $12,499 | 0 (0.0%) | 13 (10.2%) |
| $12,500 to $14,999 | 5 (3.0%) | 8 (6.3%) |
| $15,000 to $17,499 | 7 (4.1%) | 2 (1.6%) |
| $17,500 to $19,999 | 0 (0.0%) | 0 (0.0%) |
| $20,000 to $22,499 | 0 (0.0%) | 2 (1.6%) |
| $22,500 to $24,999 | 3 (1.8%) | 5 (3.9%) |
| $25,000 to $29,999 | 1 (0.6%) | 4 (3.2%) |
| $30,000 to $34,999 | 1 (0.6%) | 6 (4.7%) |
| $35,000 to $39,999 | 6 (3.5%) | 7 (5.5%) |
| $40,000 to $44,999 | 4 (2.4%) | 3 (2.4%) |
| $45,000 to $49,999 | 65 (38.5%) | 27 (21.3%) |
| $50,000 to $54,999 | 0 (0.0%) | 9 (7.1%) |
| $55,000 to $64,999 | 26 (15.4%) | 10 (7.9%) |
| $65,000 to $74,999 | 6 (3.5%) | 0 (0.0%) |
| $75,000 to $99,999 | 6 (3.5%) | 12 (9.5%) |
| $100,000+ | 27 (16.0%) | 8 (6.3%) |
| Total | 169 (100.0%) | 127 (100.0%) |
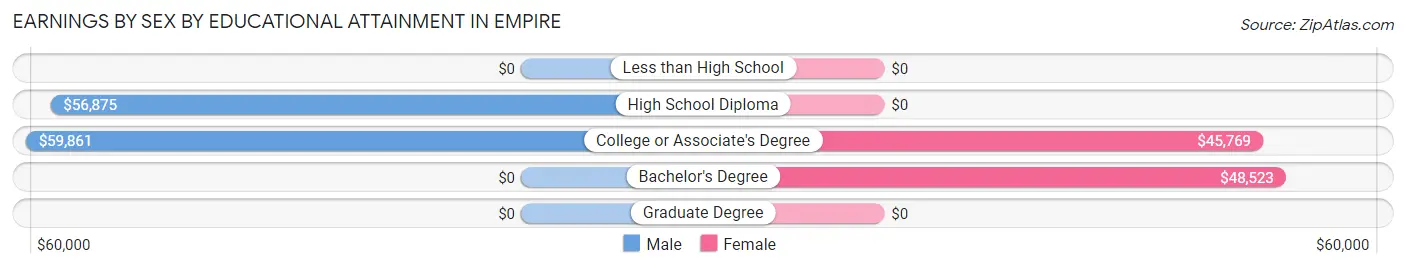
Earnings by Sex by Educational Attainment in Empire
Average earnings in Empire are $49,189 for men and $46,058 for women, a difference of 6.4%. Men with an educational attainment of college or associate's degree enjoy the highest average annual earnings of $59,861, while those with high school diploma education earn the least with $56,875. Women with an educational attainment of bachelor's degree earn the most with the average annual earnings of $48,523, while those with college or associate's degree education have the smallest earnings of $45,769.
| Educational Attainment | Male Income | Female Income |
| Less than High School | - | - |
| High School Diploma | $56,875 | $0 |
| College or Associate's Degree | $59,861 | $45,769 |
| Bachelor's Degree | - | - |
| Graduate Degree | - | - |
| Total | $49,189 | $46,058 |
Family Income in Empire
Family Income Brackets in Empire
According to the Empire family income data, there are 68 families falling into the $35,000 to $49,999 income range, which is the most common income bracket and makes up 37.4% of all families. Conversely, the $15,000 to $24,999 income bracket is the least frequent group with only 2 families (1.1%) belonging to this category.
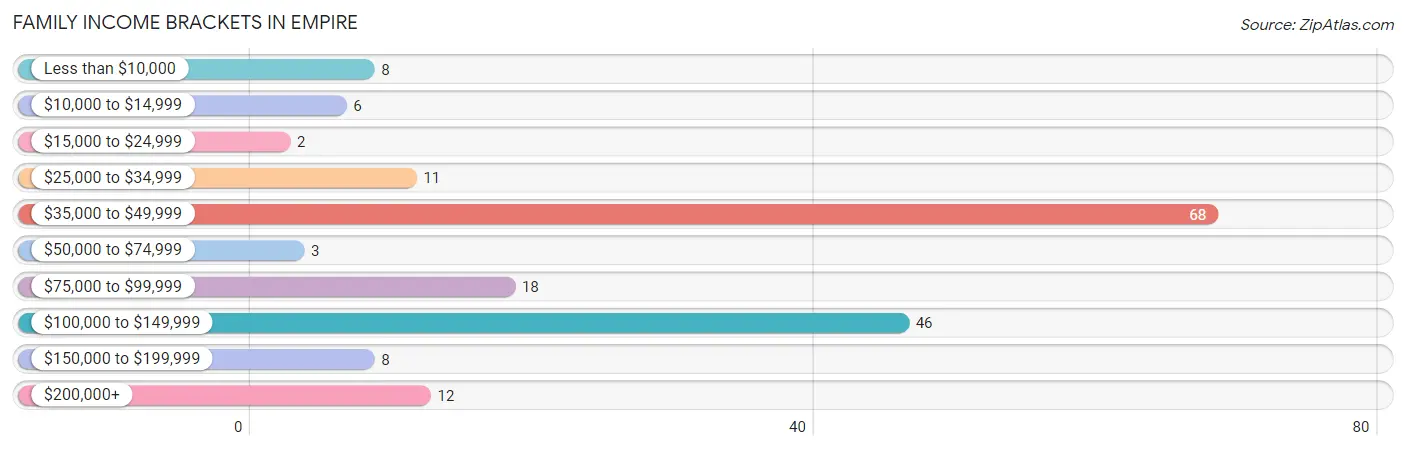
| Income Bracket | # Families | % Families |
| Less than $10,000 | 8 | 4.4% |
| $10,000 to $14,999 | 6 | 3.3% |
| $15,000 to $24,999 | 2 | 1.1% |
| $25,000 to $34,999 | 11 | 6.0% |
| $35,000 to $49,999 | 68 | 37.4% |
| $50,000 to $74,999 | 3 | 1.6% |
| $75,000 to $99,999 | 18 | 9.9% |
| $100,000 to $149,999 | 46 | 25.3% |
| $150,000 to $199,999 | 8 | 4.4% |
| $200,000+ | 12 | 6.6% |
Family Income by Famaliy Size in Empire
3-person families (7 | 3.8%) account for the highest median family income in Empire with $250,001 per family, while 3-person families (7 | 3.8%) have the highest median income of $83,334 per family member.
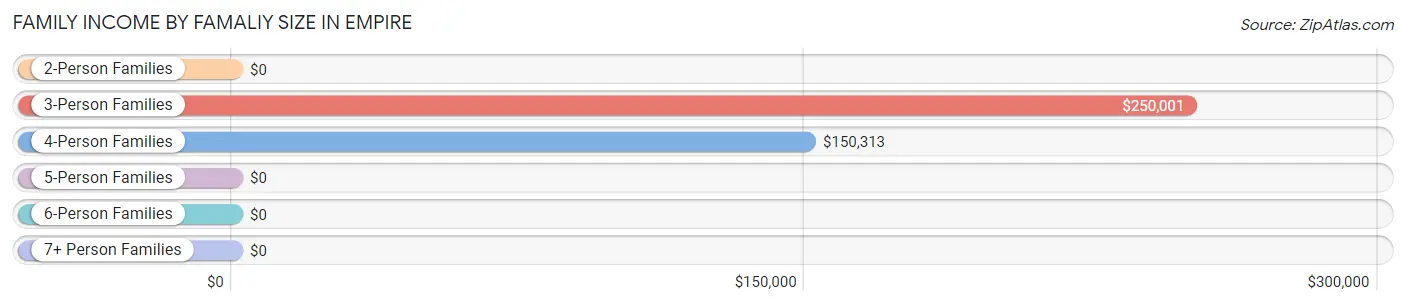
| Income Bracket | # Families | Median Income |
| 2-Person Families | 160 (87.9%) | $0 |
| 3-Person Families | 7 (3.8%) | $250,001 |
| 4-Person Families | 7 (3.8%) | $150,313 |
| 5-Person Families | 8 (4.4%) | $0 |
| 6-Person Families | 0 (0.0%) | $0 |
| 7+ Person Families | 0 (0.0%) | $0 |
| Total | 182 (100.0%) | $0 |
Family Income by Number of Earners in Empire
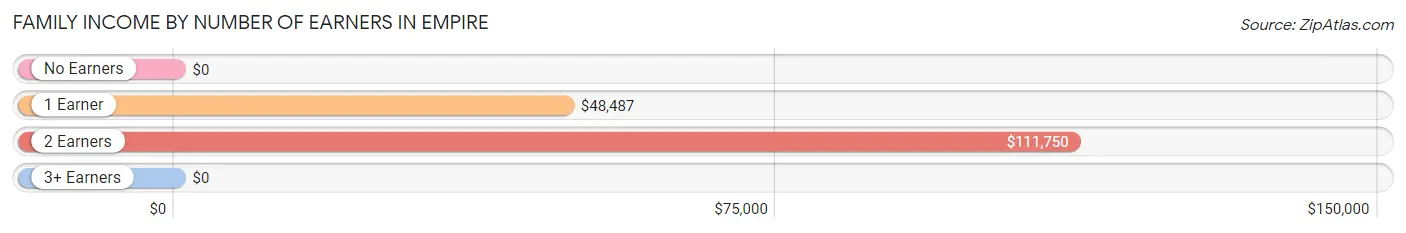
| Number of Earners | # Families | Median Income |
| No Earners | 28 (15.4%) | $0 |
| 1 Earner | 81 (44.5%) | $48,487 |
| 2 Earners | 73 (40.1%) | $111,750 |
| 3+ Earners | 0 (0.0%) | $0 |
| Total | 182 (100.0%) | $0 |
Household Income in Empire
Household Income Brackets in Empire
With 76 households falling in the category, the $50,000 to $74,999 income range is the most frequent in Empire, accounting for 27.7% of all households. In contrast, only 11 households (4.0%) fall into the $15,000 to $24,999 income bracket, making it the least populous group.
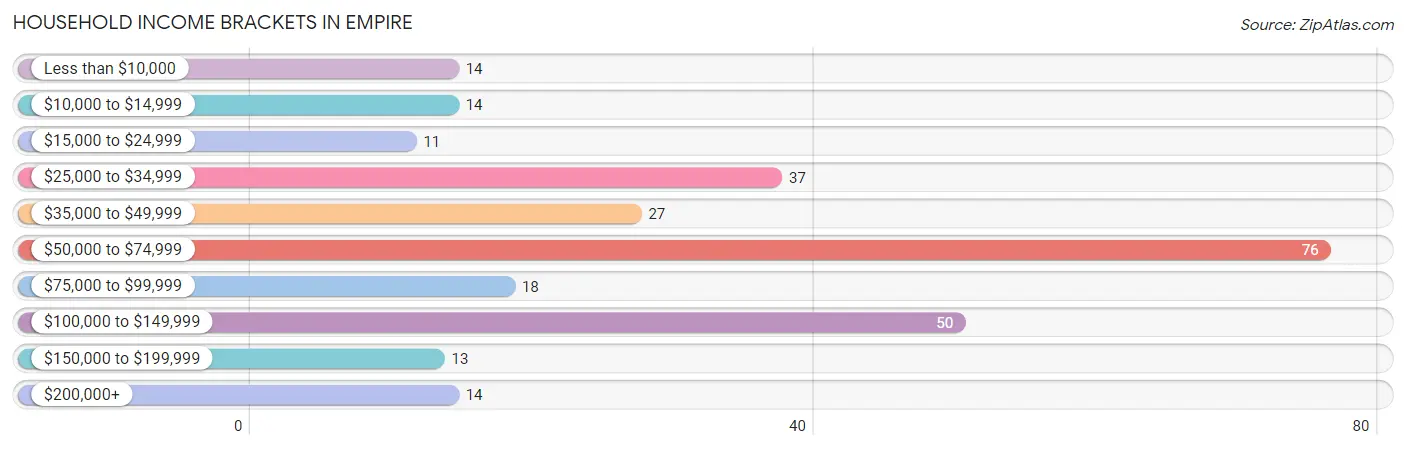
| Income Bracket | # Households | % Households |
| Less than $10,000 | 14 | 5.1% |
| $10,000 to $14,999 | 14 | 5.1% |
| $15,000 to $24,999 | 11 | 4.0% |
| $25,000 to $34,999 | 37 | 13.5% |
| $35,000 to $49,999 | 27 | 9.9% |
| $50,000 to $74,999 | 76 | 27.7% |
| $75,000 to $99,999 | 18 | 6.6% |
| $100,000 to $149,999 | 50 | 18.2% |
| $150,000 to $199,999 | 13 | 4.7% |
| $200,000+ | 14 | 5.1% |
Household Income by Householder Age in Empire
The median household income in Empire is $60,877, with the highest median household income of $61,930 found in the 25 to 44 years age bracket for the primary householder. A total of 120 households (43.8%) fall into this category. Meanwhile, the 15 to 24 years age bracket for the primary householder has the lowest median household income of $0, with 2 households (0.7%) in this group.
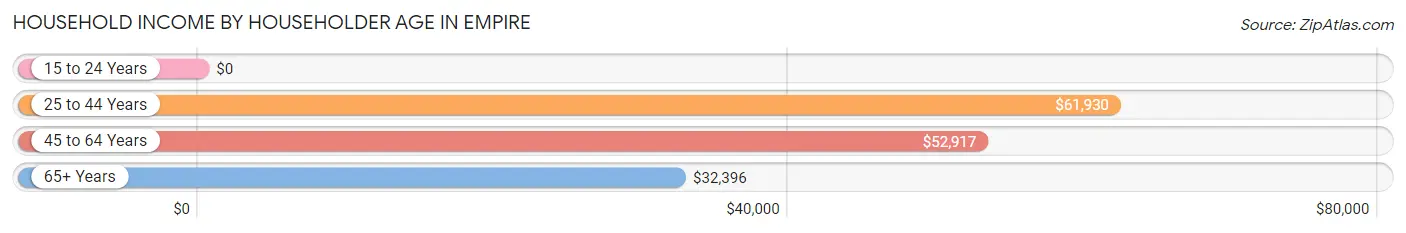
| Income Bracket | # Households | Median Income |
| 15 to 24 Years | 2 (0.7%) | $0 |
| 25 to 44 Years | 120 (43.8%) | $61,930 |
| 45 to 64 Years | 77 (28.1%) | $52,917 |
| 65+ Years | 75 (27.4%) | $32,396 |
| Total | 274 (100.0%) | $60,877 |
Poverty in Empire
Income Below Poverty by Sex and Age in Empire
With 12.6% poverty level for males and 13.9% for females among the residents of Empire, under 5 year old males and 35 to 44 year old females are the most vulnerable to poverty, with 5 males (62.5%) and 7 females (25.9%) in their respective age groups living below the poverty level.
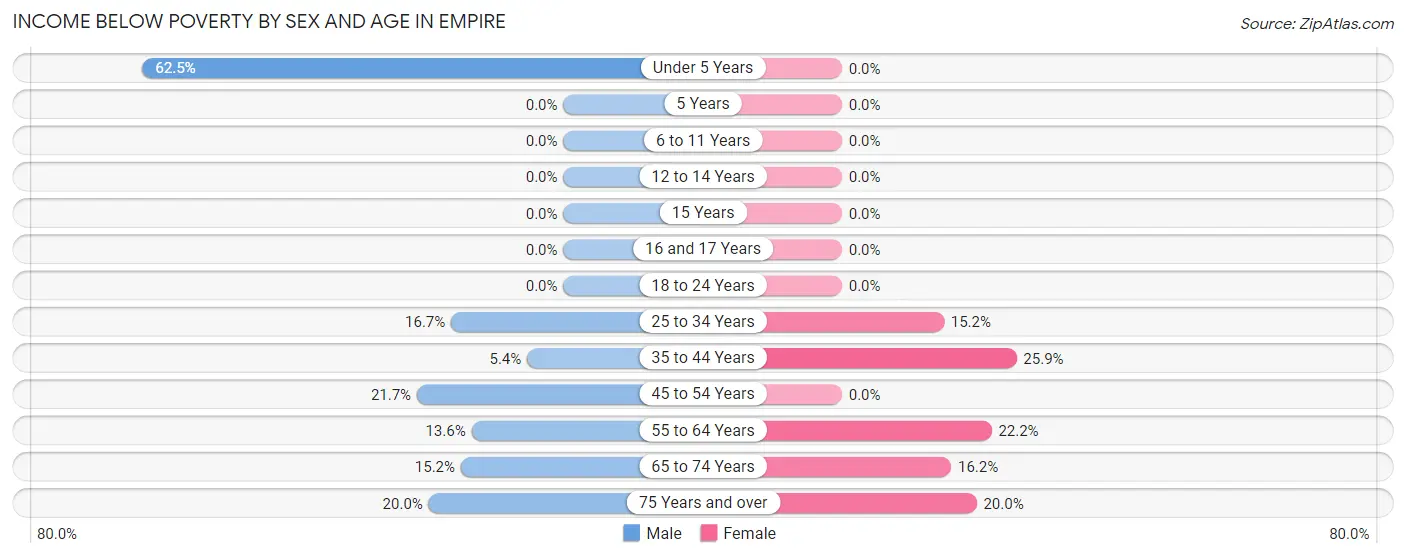
| Age Bracket | Male | Female |
| Under 5 Years | 5 (62.5%) | 0 (0.0%) |
| 5 Years | 0 (0.0%) | 0 (0.0%) |
| 6 to 11 Years | 0 (0.0%) | 0 (0.0%) |
| 12 to 14 Years | 0 (0.0%) | 0 (0.0%) |
| 15 Years | 0 (0.0%) | 0 (0.0%) |
| 16 and 17 Years | 0 (0.0%) | 0 (0.0%) |
| 18 to 24 Years | 0 (0.0%) | 0 (0.0%) |
| 25 to 34 Years | 5 (16.7%) | 5 (15.1%) |
| 35 to 44 Years | 5 (5.4%) | 7 (25.9%) |
| 45 to 54 Years | 5 (21.7%) | 0 (0.0%) |
| 55 to 64 Years | 3 (13.6%) | 8 (22.2%) |
| 65 to 74 Years | 7 (15.2%) | 6 (16.2%) |
| 75 Years and over | 1 (20.0%) | 2 (20.0%) |
| Total | 31 (12.6%) | 28 (13.9%) |
Income Above Poverty by Sex and Age in Empire
According to the poverty statistics in Empire, males aged 6 to 11 years and females aged 6 to 11 years are the age groups that are most secure financially, with 100.0% of males and 100.0% of females in these age groups living above the poverty line.
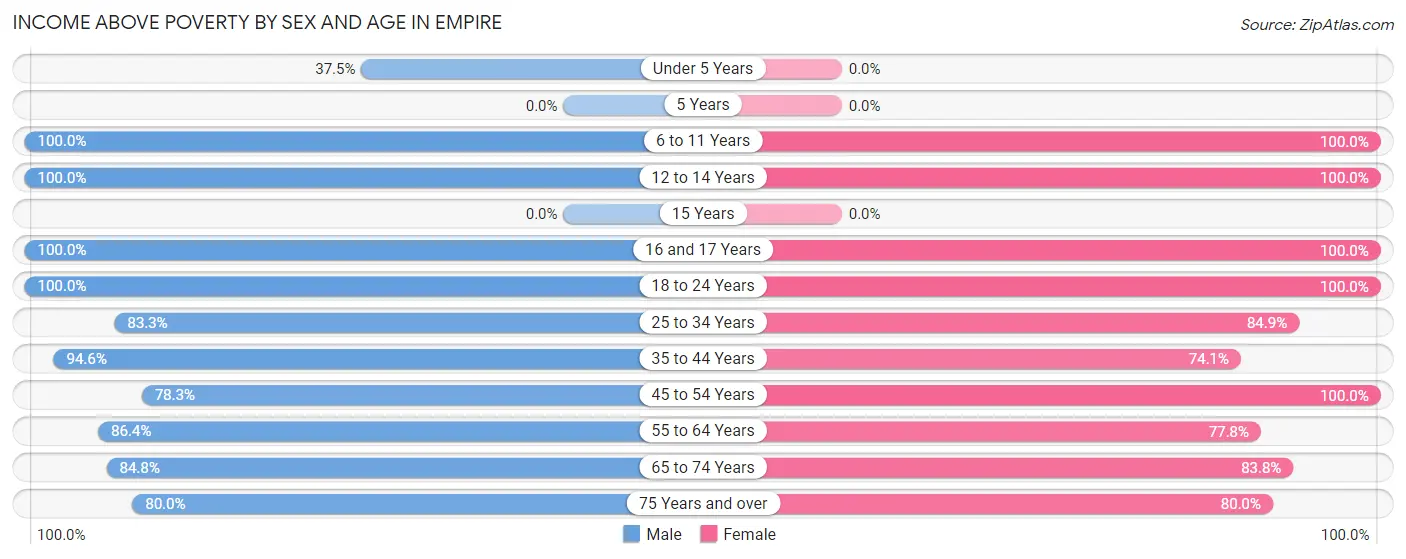
| Age Bracket | Male | Female |
| Under 5 Years | 3 (37.5%) | 0 (0.0%) |
| 5 Years | 0 (0.0%) | 0 (0.0%) |
| 6 to 11 Years | 9 (100.0%) | 7 (100.0%) |
| 12 to 14 Years | 4 (100.0%) | 5 (100.0%) |
| 15 Years | 0 (0.0%) | 0 (0.0%) |
| 16 and 17 Years | 4 (100.0%) | 6 (100.0%) |
| 18 to 24 Years | 2 (100.0%) | 6 (100.0%) |
| 25 to 34 Years | 25 (83.3%) | 28 (84.9%) |
| 35 to 44 Years | 88 (94.6%) | 20 (74.1%) |
| 45 to 54 Years | 18 (78.3%) | 34 (100.0%) |
| 55 to 64 Years | 19 (86.4%) | 28 (77.8%) |
| 65 to 74 Years | 39 (84.8%) | 31 (83.8%) |
| 75 Years and over | 4 (80.0%) | 8 (80.0%) |
| Total | 215 (87.4%) | 173 (86.1%) |
Income Below Poverty Among Married-Couple Families in Empire
The poverty statistics for married-couple families in Empire show that 2.1% or 2 of the total 93 families live below the poverty line. Families with no children have the highest poverty rate of 2.7%, comprising of 2 families. On the other hand, families with 1 or 2 children have the lowest poverty rate of 0.0%, which includes 0 families.
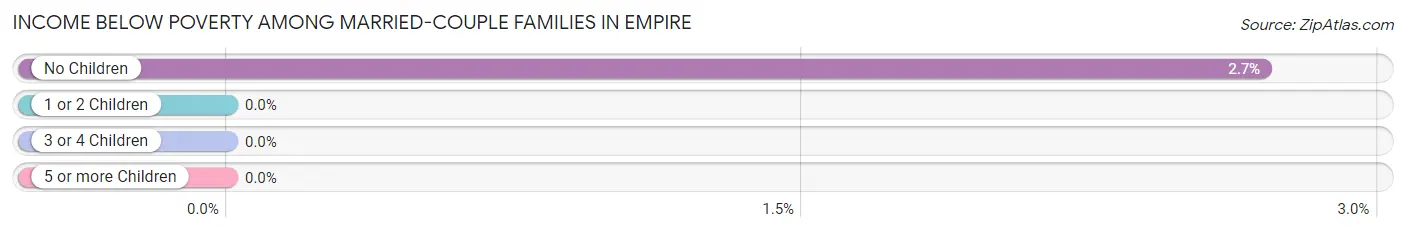
| Children | Above Poverty | Below Poverty |
| No Children | 72 (97.3%) | 2 (2.7%) |
| 1 or 2 Children | 11 (100.0%) | 0 (0.0%) |
| 3 or 4 Children | 8 (100.0%) | 0 (0.0%) |
| 5 or more Children | 0 (0.0%) | 0 (0.0%) |
| Total | 91 (97.9%) | 2 (2.1%) |
Income Below Poverty Among Single-Parent Households in Empire
According to the poverty data in Empire, 6.1% or 4 single-father households and 43.5% or 10 single-mother households are living below the poverty line. Among single-father households, those with no children have the highest poverty rate, with 4 households (44.4%) experiencing poverty. Likewise, among single-mother households, those with 1 or 2 children have the highest poverty rate, with 5 households (50.0%) falling below the poverty line.
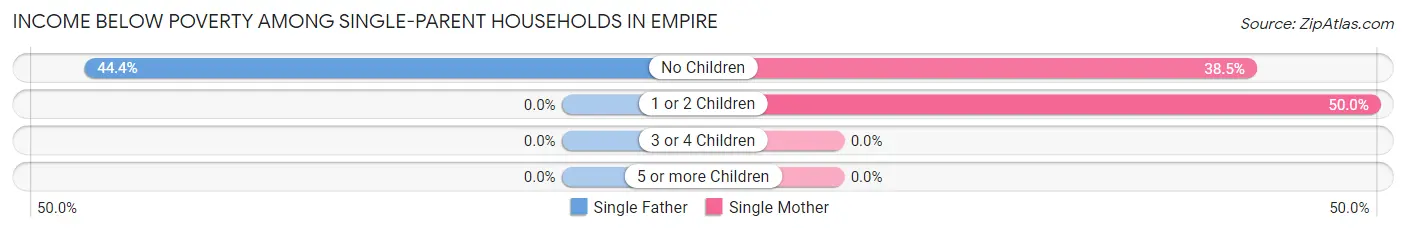
| Children | Single Father | Single Mother |
| No Children | 4 (44.4%) | 5 (38.5%) |
| 1 or 2 Children | 0 (0.0%) | 5 (50.0%) |
| 3 or 4 Children | 0 (0.0%) | 0 (0.0%) |
| 5 or more Children | 0 (0.0%) | 0 (0.0%) |
| Total | 4 (6.1%) | 10 (43.5%) |
Income Below Poverty Among Married-Couple vs Single-Parent Households in Empire
The poverty data for Empire shows that 2 of the married-couple family households (2.1%) and 14 of the single-parent households (15.7%) are living below the poverty level. Within the married-couple family households, those with no children have the highest poverty rate, with 2 households (2.7%) falling below the poverty line. Among the single-parent households, those with no children have the highest poverty rate, with 9 household (40.9%) living below poverty.
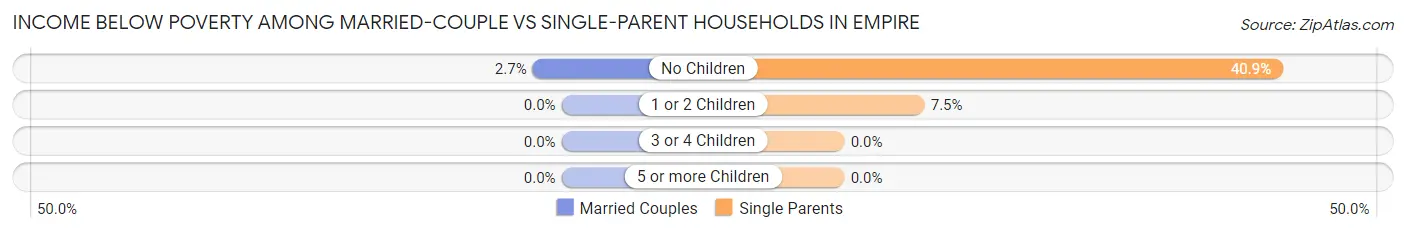
| Children | Married-Couple Families | Single-Parent Households |
| No Children | 2 (2.7%) | 9 (40.9%) |
| 1 or 2 Children | 0 (0.0%) | 5 (7.5%) |
| 3 or 4 Children | 0 (0.0%) | 0 (0.0%) |
| 5 or more Children | 0 (0.0%) | 0 (0.0%) |
| Total | 2 (2.1%) | 14 (15.7%) |
Race in Empire
The most populous races in Empire are White / Caucasian (398 | 89.0%), Two or more Races (33 | 7.4%), and Hispanic or Latino (21 | 4.7%).
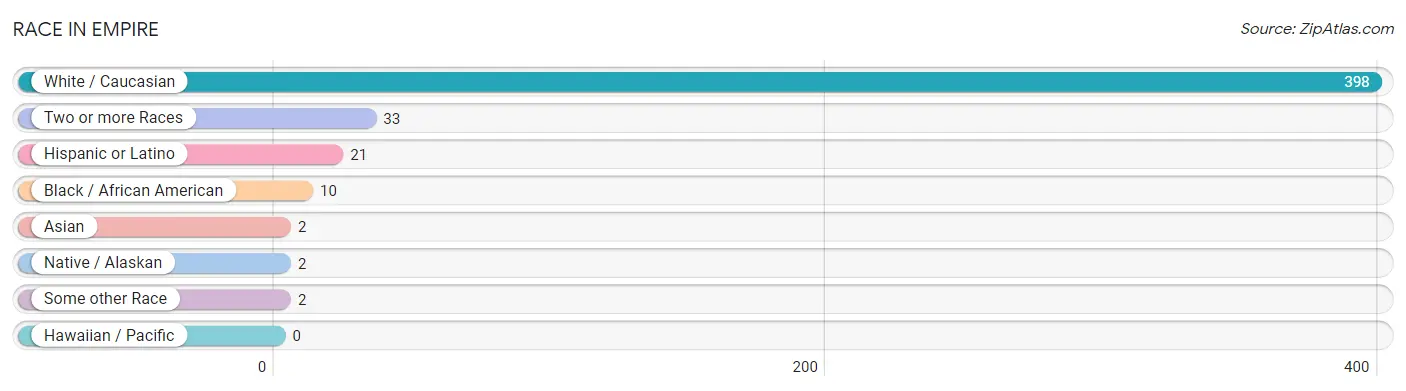
| Race | # Population | % Population |
| Asian | 2 | 0.4% |
| Black / African American | 10 | 2.2% |
| Hawaiian / Pacific | 0 | 0.0% |
| Hispanic or Latino | 21 | 4.7% |
| Native / Alaskan | 2 | 0.4% |
| White / Caucasian | 398 | 89.0% |
| Two or more Races | 33 | 7.4% |
| Some other Race | 2 | 0.4% |
| Total | 447 | 100.0% |
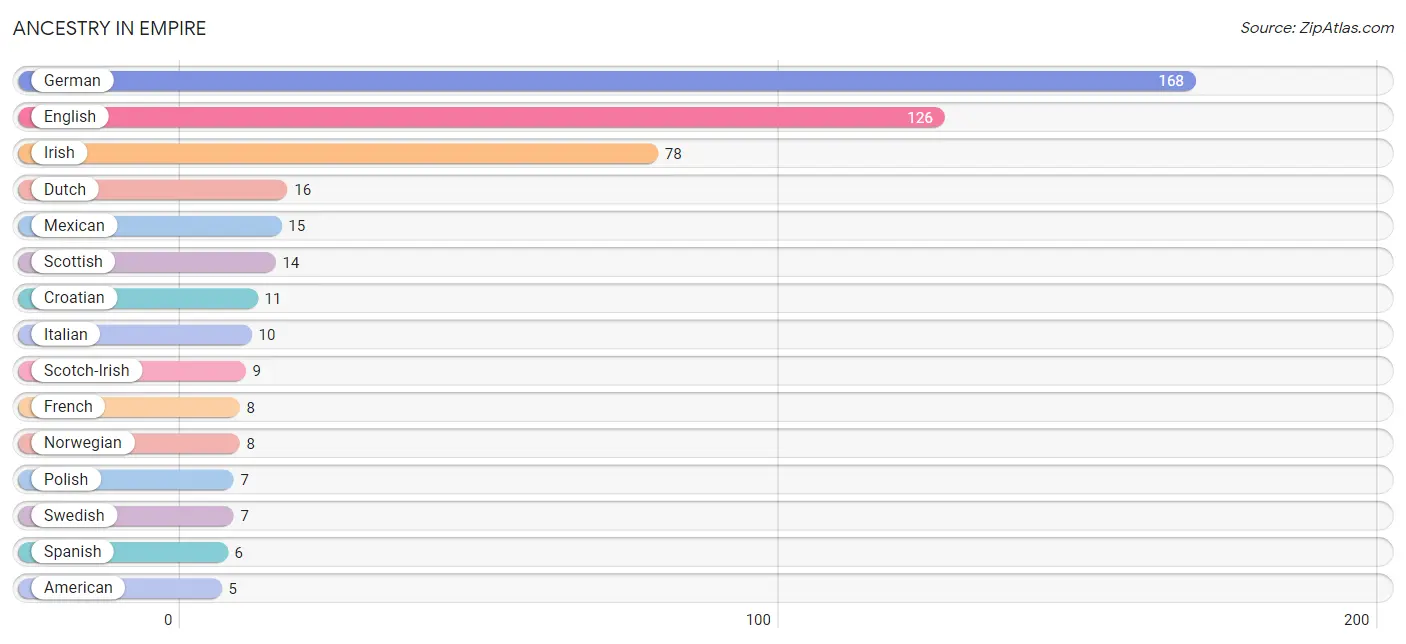
Ancestry in Empire
The most populous ancestries reported in Empire are German (168 | 37.6%), English (126 | 28.2%), Irish (78 | 17.4%), Dutch (16 | 3.6%), and Mexican (15 | 3.4%), together accounting for 90.2% of all Empire residents.
| Ancestry | # Population | % Population |
| American | 5 | 1.1% |
| Blackfeet | 1 | 0.2% |
| British | 1 | 0.2% |
| Chippewa | 1 | 0.2% |
| Croatian | 11 | 2.5% |
| Dutch | 16 | 3.6% |
| Eastern European | 3 | 0.7% |
| English | 126 | 28.2% |
| European | 2 | 0.4% |
| French | 8 | 1.8% |
| French Canadian | 2 | 0.4% |
| German | 168 | 37.6% |
| Greek | 1 | 0.2% |
| Hungarian | 5 | 1.1% |
| Irish | 78 | 17.4% |
| Italian | 10 | 2.2% |
| Korean | 3 | 0.7% |
| Mexican | 15 | 3.4% |
| Northern European | 2 | 0.4% |
| Norwegian | 8 | 1.8% |
| Polish | 7 | 1.6% |
| Scotch-Irish | 9 | 2.0% |
| Scottish | 14 | 3.1% |
| Spanish | 6 | 1.3% |
| Sri Lankan | 2 | 0.4% |
| Swedish | 7 | 1.6% |
| Swiss | 4 | 0.9% |
| Welsh | 3 | 0.7% | View All 28 Rows |
Immigrants in Empire
The most numerous immigrant groups reported in Empire came from Europe (4 | 0.9%), Central America (2 | 0.4%), France (2 | 0.4%), Italy (2 | 0.4%), and Latin America (2 | 0.4%), together accounting for 2.7% of all Empire residents.
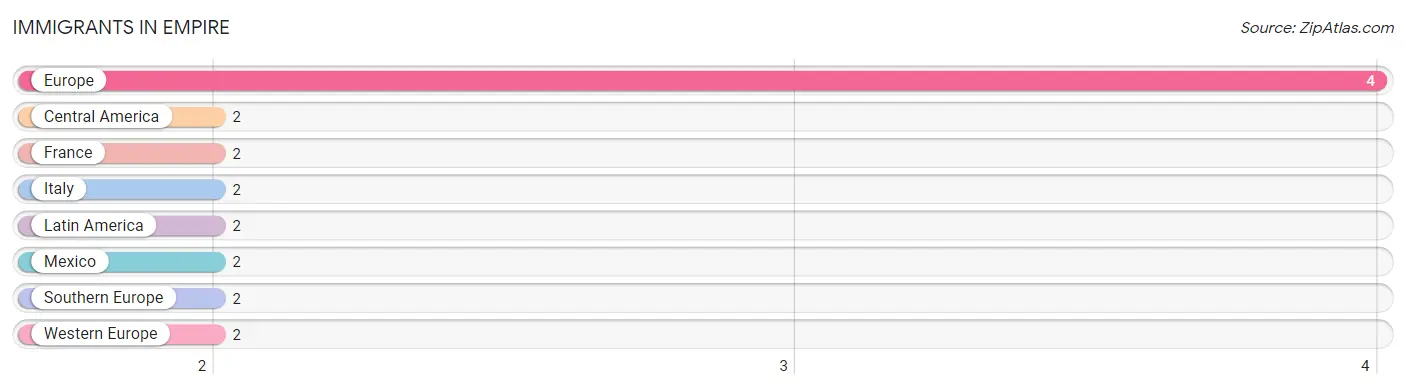
| Immigration Origin | # Population | % Population |
| Central America | 2 | 0.4% |
| Europe | 4 | 0.9% |
| France | 2 | 0.4% |
| Italy | 2 | 0.4% |
| Latin America | 2 | 0.4% |
| Mexico | 2 | 0.4% |
| Southern Europe | 2 | 0.4% |
| Western Europe | 2 | 0.4% | View All 8 Rows |
Sex and Age in Empire
Sex and Age in Empire
The most populous age groups in Empire are 40 to 44 Years (73 | 29.7%) for men and 45 to 49 Years (32 | 15.9%) for women.
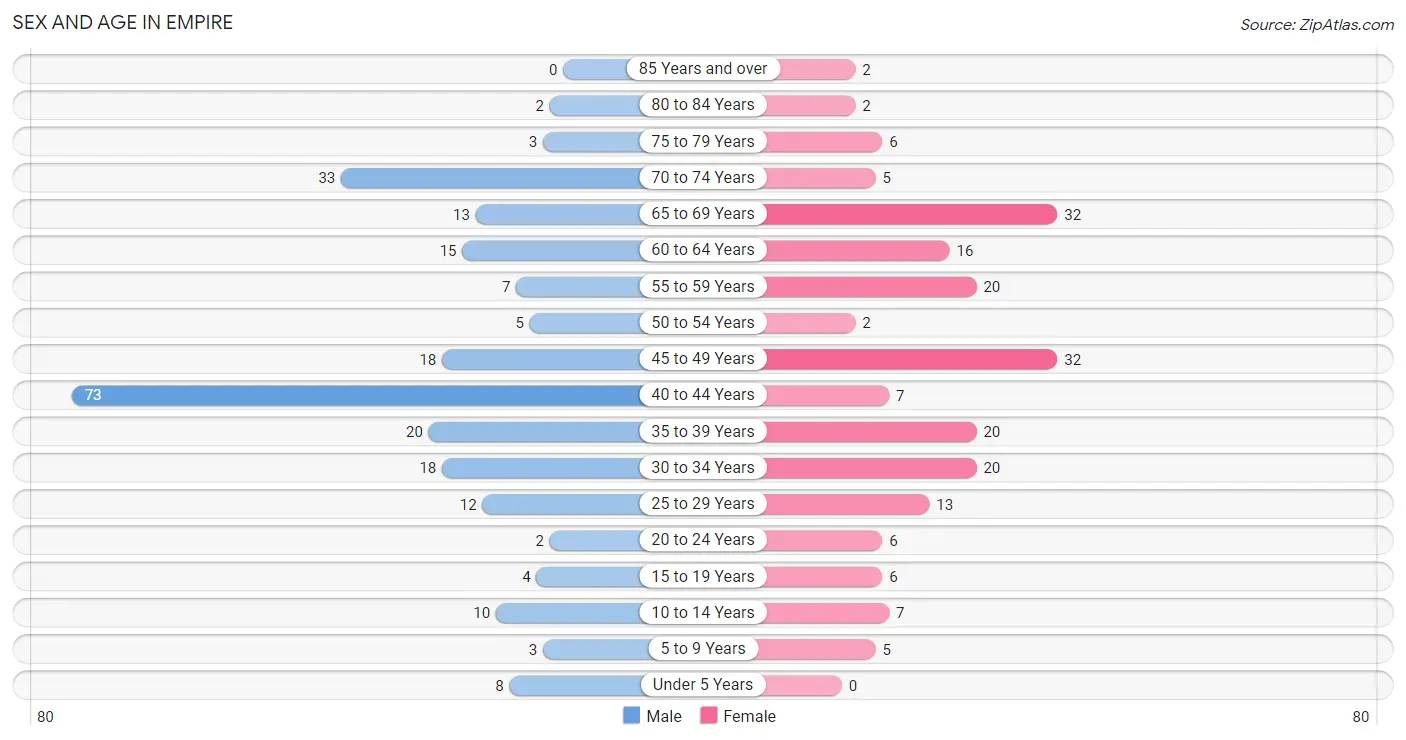
| Age Bracket | Male | Female |
| Under 5 Years | 8 (3.3%) | 0 (0.0%) |
| 5 to 9 Years | 3 (1.2%) | 5 (2.5%) |
| 10 to 14 Years | 10 (4.1%) | 7 (3.5%) |
| 15 to 19 Years | 4 (1.6%) | 6 (3.0%) |
| 20 to 24 Years | 2 (0.8%) | 6 (3.0%) |
| 25 to 29 Years | 12 (4.9%) | 13 (6.5%) |
| 30 to 34 Years | 18 (7.3%) | 20 (10.0%) |
| 35 to 39 Years | 20 (8.1%) | 20 (10.0%) |
| 40 to 44 Years | 73 (29.7%) | 7 (3.5%) |
| 45 to 49 Years | 18 (7.3%) | 32 (15.9%) |
| 50 to 54 Years | 5 (2.0%) | 2 (1.0%) |
| 55 to 59 Years | 7 (2.9%) | 20 (10.0%) |
| 60 to 64 Years | 15 (6.1%) | 16 (8.0%) |
| 65 to 69 Years | 13 (5.3%) | 32 (15.9%) |
| 70 to 74 Years | 33 (13.4%) | 5 (2.5%) |
| 75 to 79 Years | 3 (1.2%) | 6 (3.0%) |
| 80 to 84 Years | 2 (0.8%) | 2 (1.0%) |
| 85 Years and over | 0 (0.0%) | 2 (1.0%) |
| Total | 246 (100.0%) | 201 (100.0%) |
Families and Households in Empire
Median Family Size in Empire
The median family size in Empire is 1.87 persons per family, with married-couple families (93 | 51.1%) accounting for the largest median family size of 2.37 persons per family. On the other hand, single male/father families (66 | 36.3%) represent the smallest median family size with 1.12 persons per family.
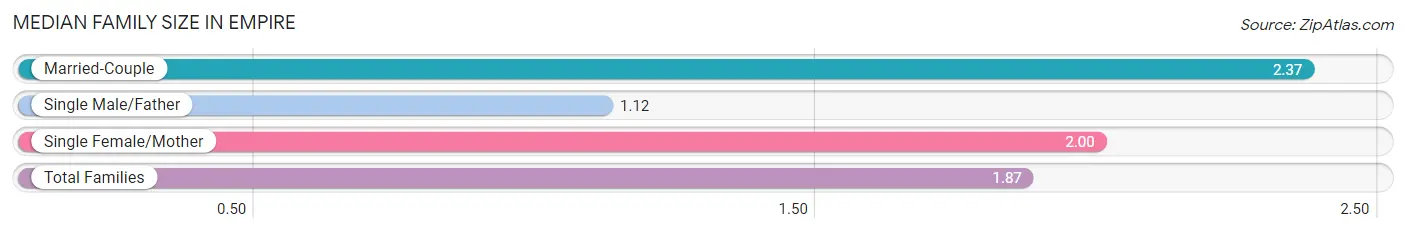
| Family Type | # Families | Family Size |
| Married-Couple | 93 (51.1%) | 2.37 |
| Single Male/Father | 66 (36.3%) | 1.12 |
| Single Female/Mother | 23 (12.6%) | 2.00 |
| Total Families | 182 (100.0%) | 1.87 |
Median Household Size in Empire
The median household size in Empire is 1.63 persons per household, with married-couple households (93 | 33.9%) accounting for the largest median household size of 2.37 persons per household. non-family households (92 | 33.6%) represent the smallest median household size with 1.08 persons per household.
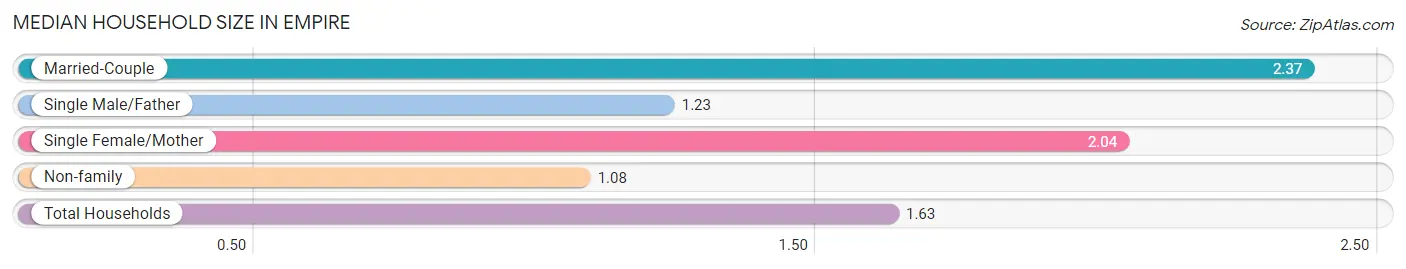
| Household Type | # Households | Household Size |
| Married-Couple | 93 (33.9%) | 2.37 |
| Single Male/Father | 66 (24.1%) | 1.23 |
| Single Female/Mother | 23 (8.4%) | 2.04 |
| Non-family | 92 (33.6%) | 1.08 |
| Total Households | 274 (100.0%) | 1.63 |
Household Size by Marriage Status in Empire
Out of a total of 274 households in Empire, 182 (66.4%) are family households, while 92 (33.6%) are nonfamily households. The most numerous type of family households are 2-person households, comprising 102, and the most common type of nonfamily households are 1-person households, comprising 87.
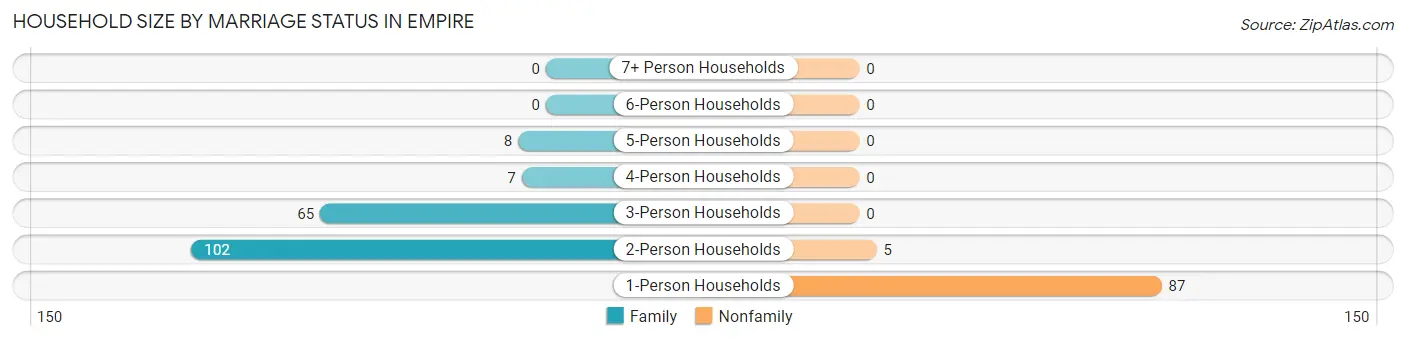
| Household Size | Family Households | Nonfamily Households |
| 1-Person Households | - | 87 (31.8%) |
| 2-Person Households | 102 (37.2%) | 5 (1.8%) |
| 3-Person Households | 65 (23.7%) | 0 (0.0%) |
| 4-Person Households | 7 (2.5%) | 0 (0.0%) |
| 5-Person Households | 8 (2.9%) | 0 (0.0%) |
| 6-Person Households | 0 (0.0%) | 0 (0.0%) |
| 7+ Person Households | 0 (0.0%) | 0 (0.0%) |
| Total | 182 (66.4%) | 92 (33.6%) |
Female Fertility in Empire
Fertility by Age in Empire
Average fertility rate in Empire is 19.0 births per 1,000 women. Women in the age bracket of 20 to 34 years have the highest fertility rate with 51.0 births per 1,000 women. Women in the age bracket of 20 to 34 years acount for 100.0% of all women with births.
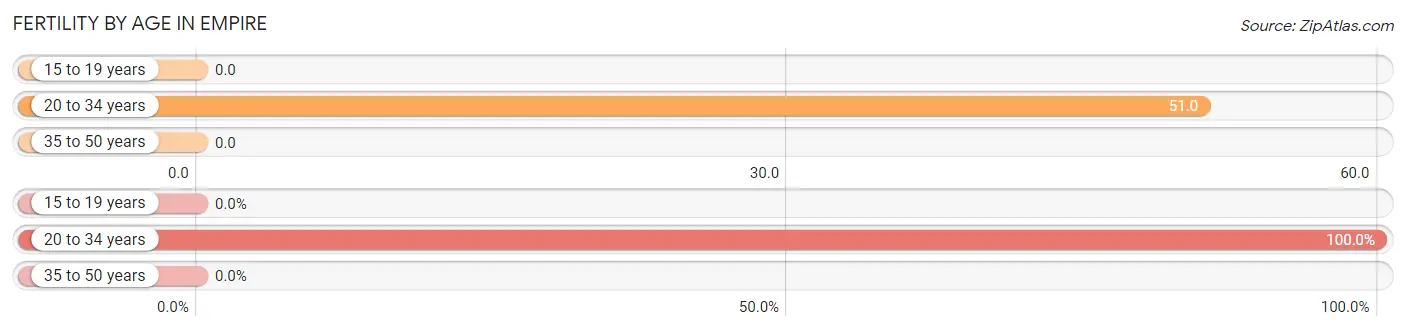
| Age Bracket | Women with Births | Births / 1,000 Women |
| 15 to 19 years | 0 (0.0%) | 0.0 |
| 20 to 34 years | 2 (100.0%) | 51.0 |
| 35 to 50 years | 0 (0.0%) | 0.0 |
| Total | 2 (100.0%) | 19.0 |
Fertility by Age by Marriage Status in Empire
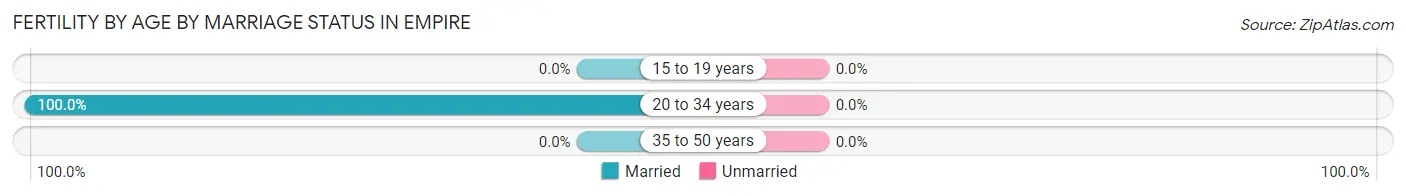
| Age Bracket | Married | Unmarried |
| 15 to 19 years | 0 (0.0%) | 0 (0.0%) |
| 20 to 34 years | 2 (100.0%) | 0 (0.0%) |
| 35 to 50 years | 0 (0.0%) | 0 (0.0%) |
| Total | 2 (100.0%) | 0 (0.0%) |
Fertility by Education in Empire
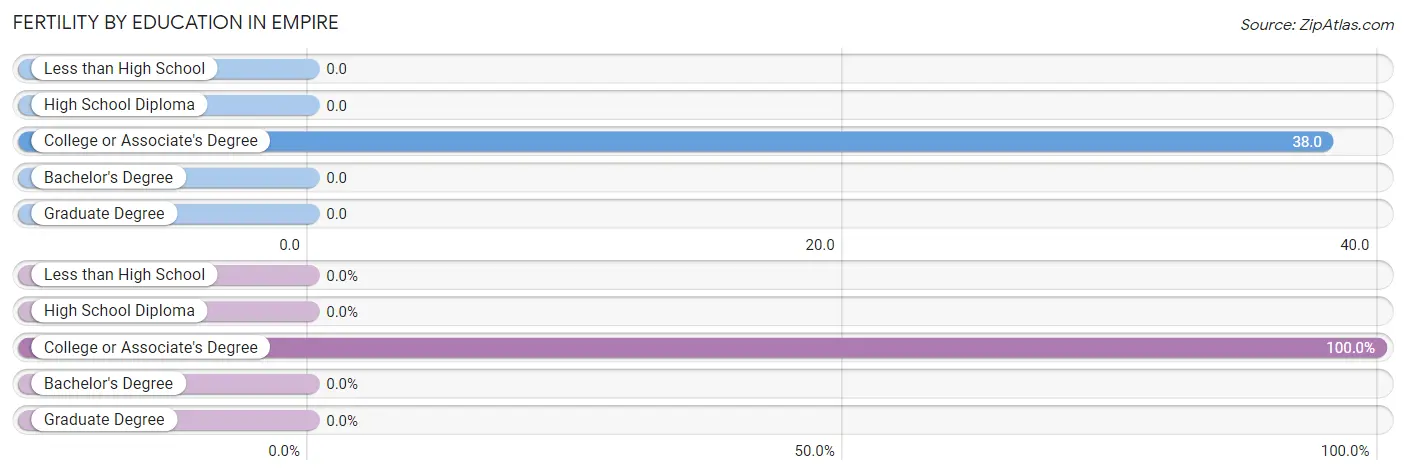
| Educational Attainment | Women with Births | Births / 1,000 Women |
| Less than High School | 0 (0.0%) | 0.0 |
| High School Diploma | 0 (0.0%) | 0.0 |
| College or Associate's Degree | 2 (100.0%) | 38.0 |
| Bachelor's Degree | 0 (0.0%) | 0.0 |
| Graduate Degree | 0 (0.0%) | 0.0 |
| Total | 2 (100.0%) | 19.0 |
Fertility by Education by Marriage Status in Empire
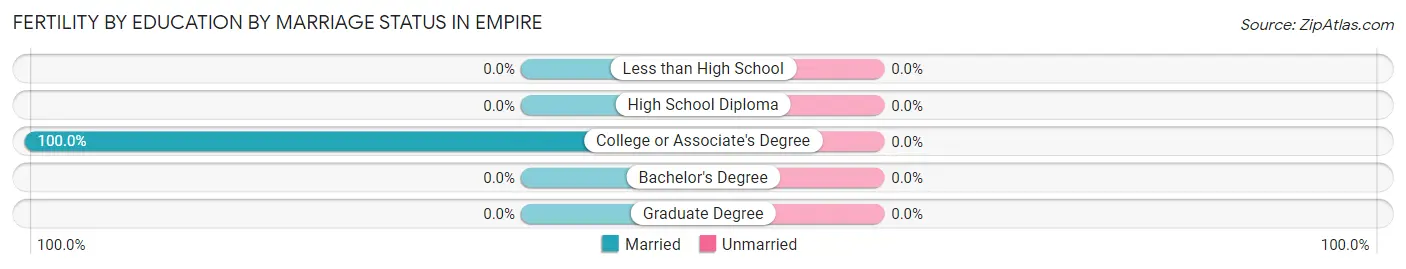
| Educational Attainment | Married | Unmarried |
| Less than High School | 0 (0.0%) | 0 (0.0%) |
| High School Diploma | 0 (0.0%) | 0 (0.0%) |
| College or Associate's Degree | 2 (100.0%) | 0 (0.0%) |
| Bachelor's Degree | 0 (0.0%) | 0 (0.0%) |
| Graduate Degree | 0 (0.0%) | 0 (0.0%) |
| Total | 2 (100.0%) | 0 (0.0%) |
Employment Characteristics in Empire
Employment by Class of Employer in Empire
Among the 278 employed individuals in Empire, private company employees (203 | 73.0%), local government employees (33 | 11.9%), and self-employed (not incorporated) (13 | 4.7%) make up the most common classes of employment.
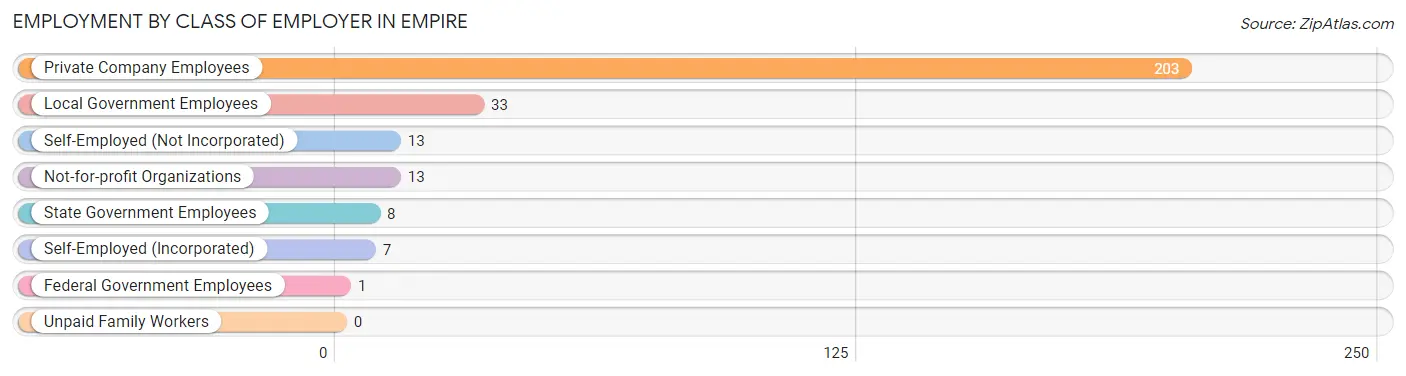
| Employer Class | # Employees | % Employees |
| Private Company Employees | 203 | 73.0% |
| Self-Employed (Incorporated) | 7 | 2.5% |
| Self-Employed (Not Incorporated) | 13 | 4.7% |
| Not-for-profit Organizations | 13 | 4.7% |
| Local Government Employees | 33 | 11.9% |
| State Government Employees | 8 | 2.9% |
| Federal Government Employees | 1 | 0.4% |
| Unpaid Family Workers | 0 | 0.0% |
| Total | 278 | 100.0% |
Employment Status by Age in Empire
According to the labor force statistics for Empire, out of the total population over 16 years of age (414), 70.0% or 290 individuals are in the labor force, with 2.4% or 7 of them unemployed. The age group with the highest labor force participation rate is 20 to 24 years, with 100.0% or 8 individuals in the labor force. Within the labor force, the 30 to 34 years age range has the highest percentage of unemployed individuals, with 5.3% or 2 of them being unemployed.
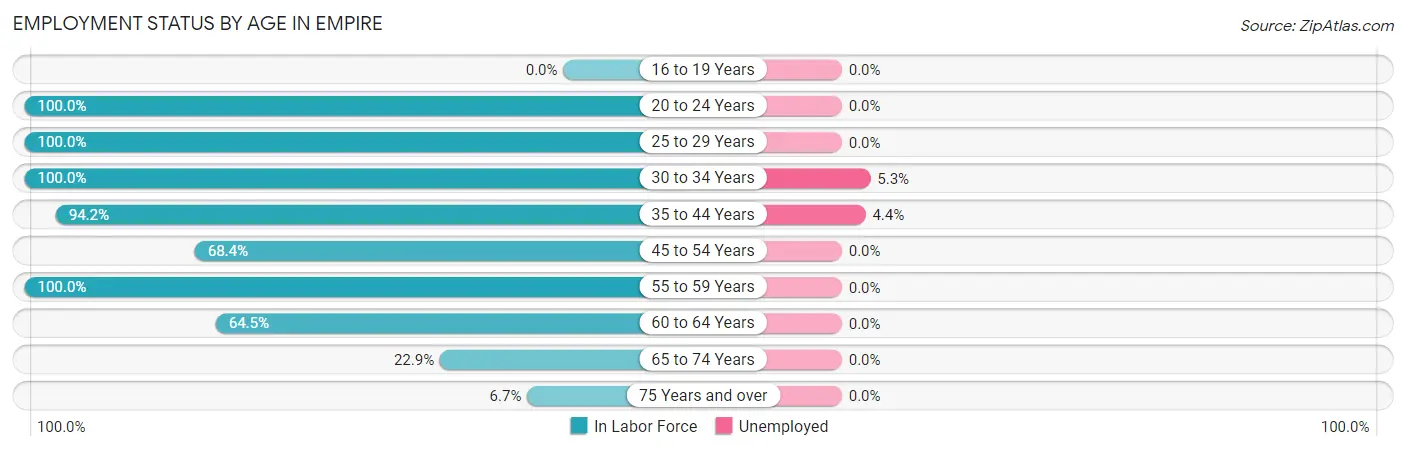
| Age Bracket | In Labor Force | Unemployed |
| 16 to 19 Years | 0 (0.0%) | 0 (0.0%) |
| 20 to 24 Years | 8 (100.0%) | 0 (0.0%) |
| 25 to 29 Years | 25 (100.0%) | 0 (0.0%) |
| 30 to 34 Years | 38 (100.0%) | 2 (5.3%) |
| 35 to 44 Years | 113 (94.2%) | 5 (4.4%) |
| 45 to 54 Years | 39 (68.4%) | 0 (0.0%) |
| 55 to 59 Years | 27 (100.0%) | 0 (0.0%) |
| 60 to 64 Years | 20 (64.5%) | 0 (0.0%) |
| 65 to 74 Years | 19 (22.9%) | 0 (0.0%) |
| 75 Years and over | 1 (6.7%) | 0 (0.0%) |
| Total | 290 (70.0%) | 7 (2.4%) |
Employment Status by Educational Attainment in Empire
According to labor force statistics for Empire, 87.9% of individuals (262) out of the total population between 25 and 64 years of age (298) are in the labor force, with 2.7% or 7 of them being unemployed. The group with the highest labor force participation rate are those with the educational attainment of bachelor's degree or higher, with 97.4% or 37 individuals in the labor force. Within the labor force, individuals with high school diploma education have the highest percentage of unemployment, with 8.6% or 5 of them being unemployed.
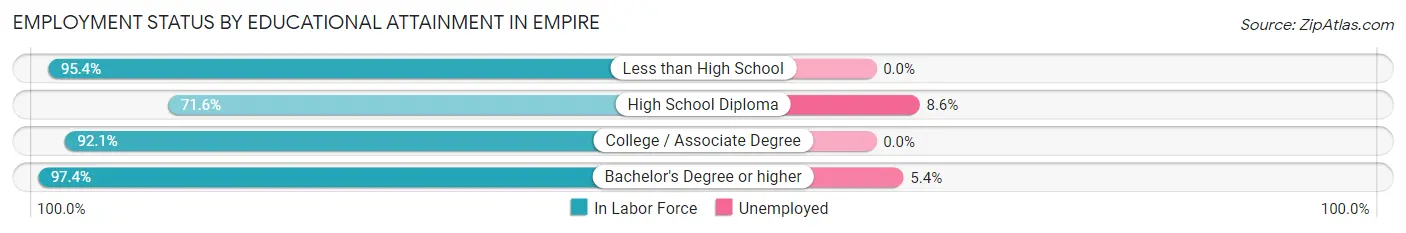
| Educational Attainment | In Labor Force | Unemployed |
| Less than High School | 62 (95.4%) | 0 (0.0%) |
| High School Diploma | 58 (71.6%) | 7 (8.6%) |
| College / Associate Degree | 105 (92.1%) | 0 (0.0%) |
| Bachelor's Degree or higher | 37 (97.4%) | 2 (5.4%) |
| Total | 262 (87.9%) | 8 (2.7%) |
Employment Occupations by Sex in Empire
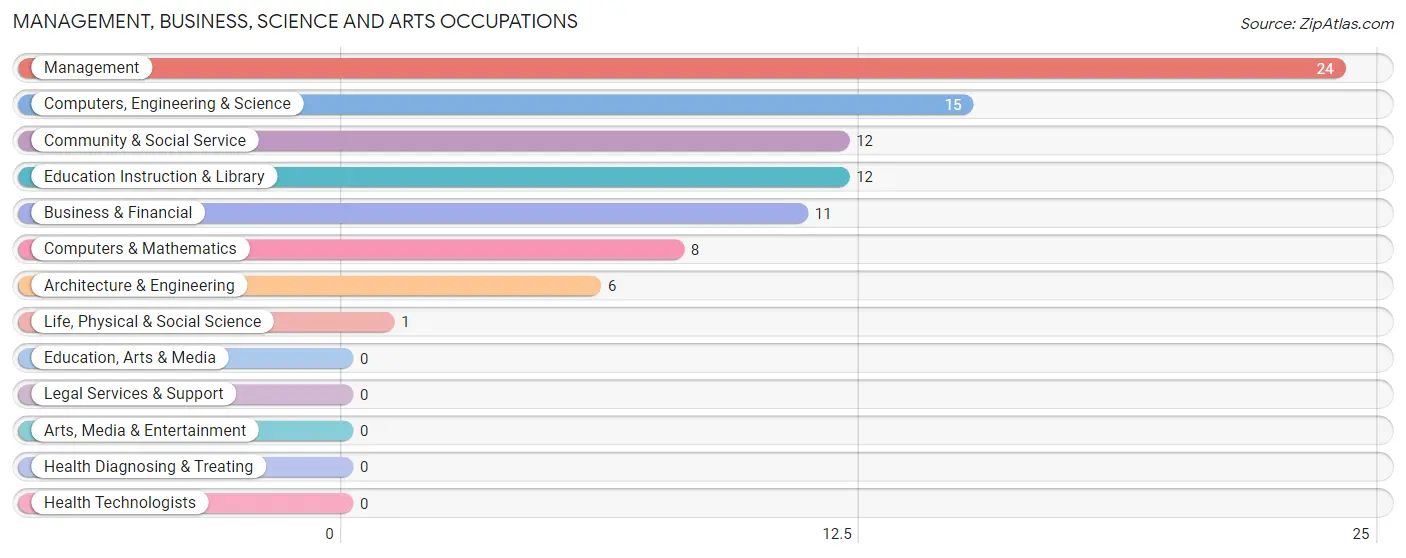
Management, Business, Science and Arts Occupations
The most common Management, Business, Science and Arts occupations in Empire are Management (24 | 8.5%), Computers, Engineering & Science (15 | 5.3%), Community & Social Service (12 | 4.2%), Education Instruction & Library (12 | 4.2%), and Business & Financial (11 | 3.9%).
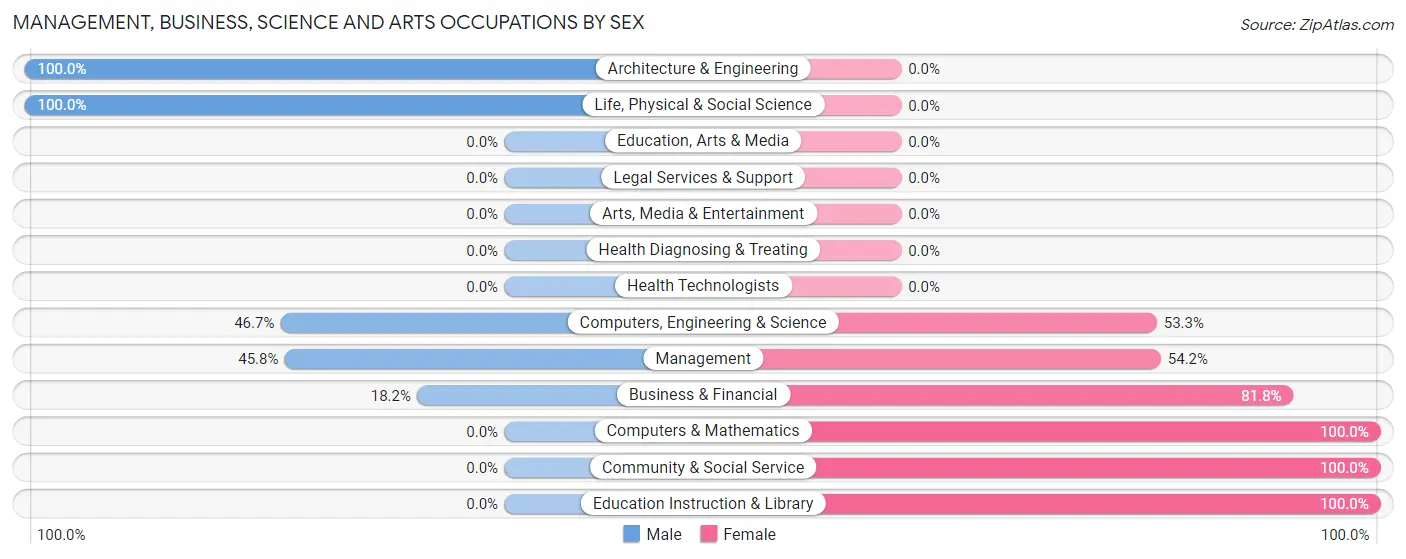
Management, Business, Science and Arts Occupations by Sex
Within the Management, Business, Science and Arts occupations in Empire, the most male-oriented occupations are Architecture & Engineering (100.0%), Life, Physical & Social Science (100.0%), and Computers, Engineering & Science (46.7%), while the most female-oriented occupations are Computers & Mathematics (100.0%), Community & Social Service (100.0%), and Education Instruction & Library (100.0%).
| Occupation | Male | Female |
| Management | 11 (45.8%) | 13 (54.2%) |
| Business & Financial | 2 (18.2%) | 9 (81.8%) |
| Computers, Engineering & Science | 7 (46.7%) | 8 (53.3%) |
| Computers & Mathematics | 0 (0.0%) | 8 (100.0%) |
| Architecture & Engineering | 6 (100.0%) | 0 (0.0%) |
| Life, Physical & Social Science | 1 (100.0%) | 0 (0.0%) |
| Community & Social Service | 0 (0.0%) | 12 (100.0%) |
| Education, Arts & Media | 0 (0.0%) | 0 (0.0%) |
| Legal Services & Support | 0 (0.0%) | 0 (0.0%) |
| Education Instruction & Library | 0 (0.0%) | 12 (100.0%) |
| Arts, Media & Entertainment | 0 (0.0%) | 0 (0.0%) |
| Health Diagnosing & Treating | 0 (0.0%) | 0 (0.0%) |
| Health Technologists | 0 (0.0%) | 0 (0.0%) |
| Total (Category) | 20 (32.3%) | 42 (67.7%) |
| Total (Overall) | 159 (56.2%) | 124 (43.8%) |
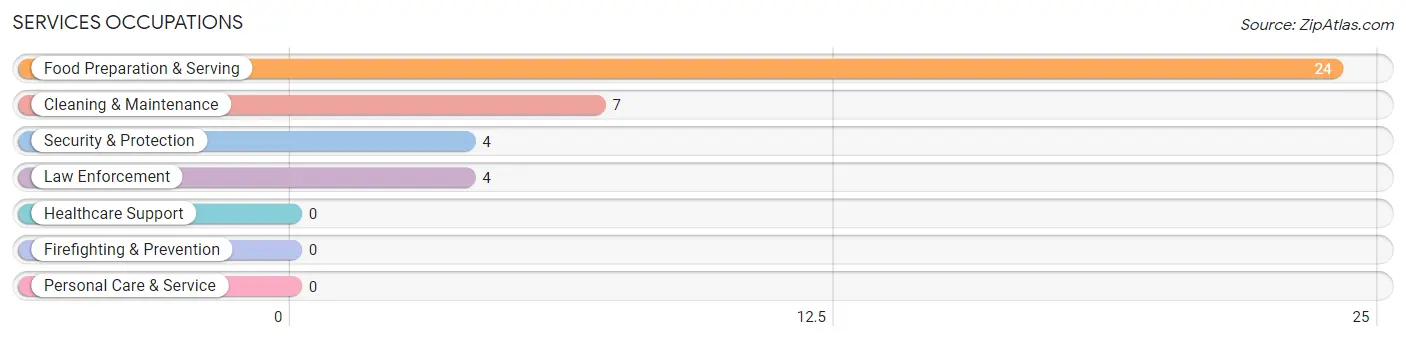
Services Occupations
The most common Services occupations in Empire are Food Preparation & Serving (24 | 8.5%), Cleaning & Maintenance (7 | 2.5%), Security & Protection (4 | 1.4%), and Law Enforcement (4 | 1.4%).
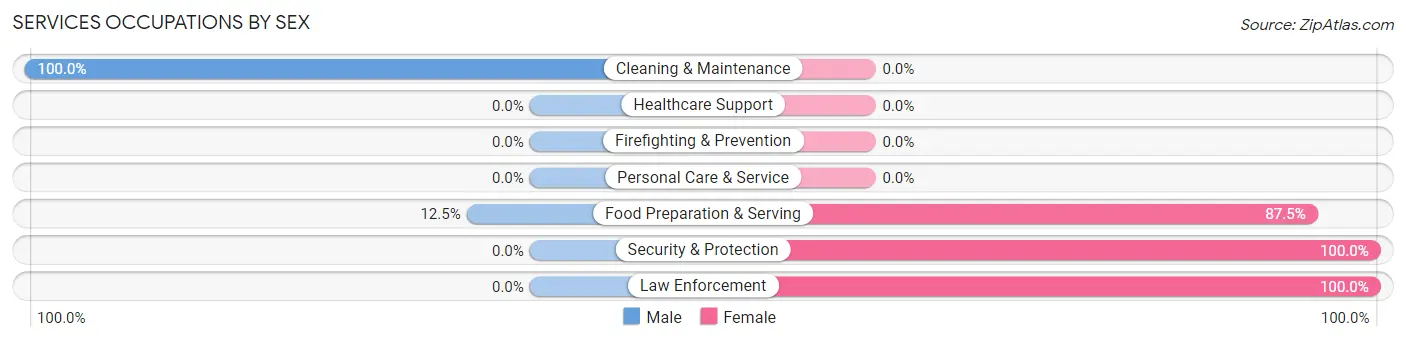
Services Occupations by Sex
Within the Services occupations in Empire, the most male-oriented occupations are Cleaning & Maintenance (100.0%), and Food Preparation & Serving (12.5%), while the most female-oriented occupations are Security & Protection (100.0%), Law Enforcement (100.0%), and Food Preparation & Serving (87.5%).
| Occupation | Male | Female |
| Healthcare Support | 0 (0.0%) | 0 (0.0%) |
| Security & Protection | 0 (0.0%) | 4 (100.0%) |
| Firefighting & Prevention | 0 (0.0%) | 0 (0.0%) |
| Law Enforcement | 0 (0.0%) | 4 (100.0%) |
| Food Preparation & Serving | 3 (12.5%) | 21 (87.5%) |
| Cleaning & Maintenance | 7 (100.0%) | 0 (0.0%) |
| Personal Care & Service | 0 (0.0%) | 0 (0.0%) |
| Total (Category) | 10 (28.6%) | 25 (71.4%) |
| Total (Overall) | 159 (56.2%) | 124 (43.8%) |
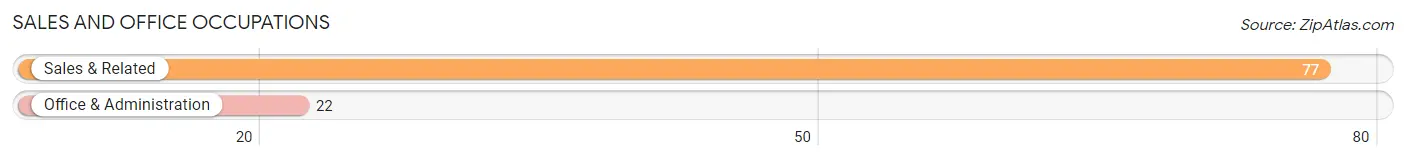
Sales and Office Occupations
The most common Sales and Office occupations in Empire are Sales & Related (77 | 27.2%), and Office & Administration (22 | 7.8%).
Sales and Office Occupations by Sex
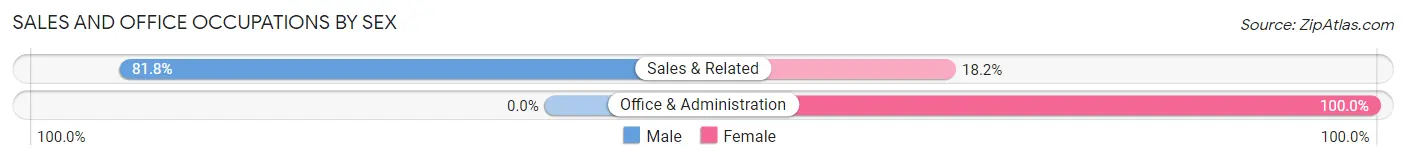
| Occupation | Male | Female |
| Sales & Related | 63 (81.8%) | 14 (18.2%) |
| Office & Administration | 0 (0.0%) | 22 (100.0%) |
| Total (Category) | 63 (63.6%) | 36 (36.4%) |
| Total (Overall) | 159 (56.2%) | 124 (43.8%) |
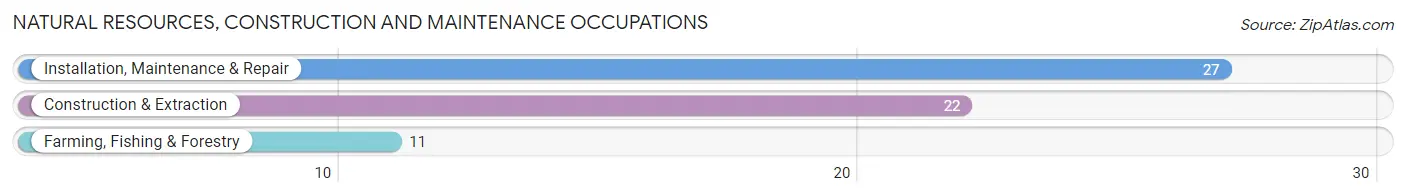
Natural Resources, Construction and Maintenance Occupations
The most common Natural Resources, Construction and Maintenance occupations in Empire are Installation, Maintenance & Repair (27 | 9.5%), Construction & Extraction (22 | 7.8%), and Farming, Fishing & Forestry (11 | 3.9%).
Natural Resources, Construction and Maintenance Occupations by Sex
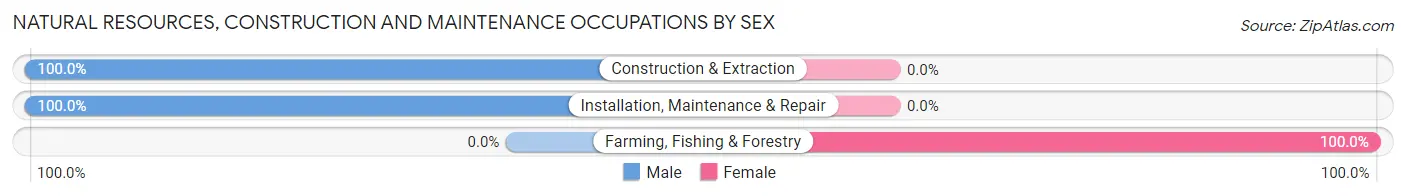
| Occupation | Male | Female |
| Farming, Fishing & Forestry | 0 (0.0%) | 11 (100.0%) |
| Construction & Extraction | 22 (100.0%) | 0 (0.0%) |
| Installation, Maintenance & Repair | 27 (100.0%) | 0 (0.0%) |
| Total (Category) | 49 (81.7%) | 11 (18.3%) |
| Total (Overall) | 159 (56.2%) | 124 (43.8%) |
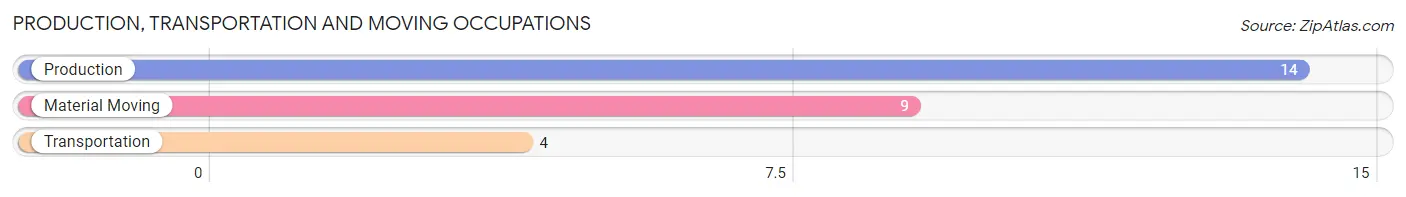
Production, Transportation and Moving Occupations
The most common Production, Transportation and Moving occupations in Empire are Production (14 | 5.0%), Material Moving (9 | 3.2%), and Transportation (4 | 1.4%).
Production, Transportation and Moving Occupations by Sex
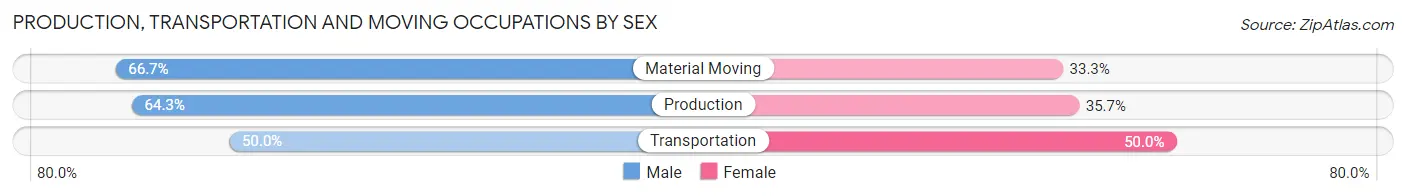
| Occupation | Male | Female |
| Production | 9 (64.3%) | 5 (35.7%) |
| Transportation | 2 (50.0%) | 2 (50.0%) |
| Material Moving | 6 (66.7%) | 3 (33.3%) |
| Total (Category) | 17 (63.0%) | 10 (37.0%) |
| Total (Overall) | 159 (56.2%) | 124 (43.8%) |
Employment Industries by Sex in Empire
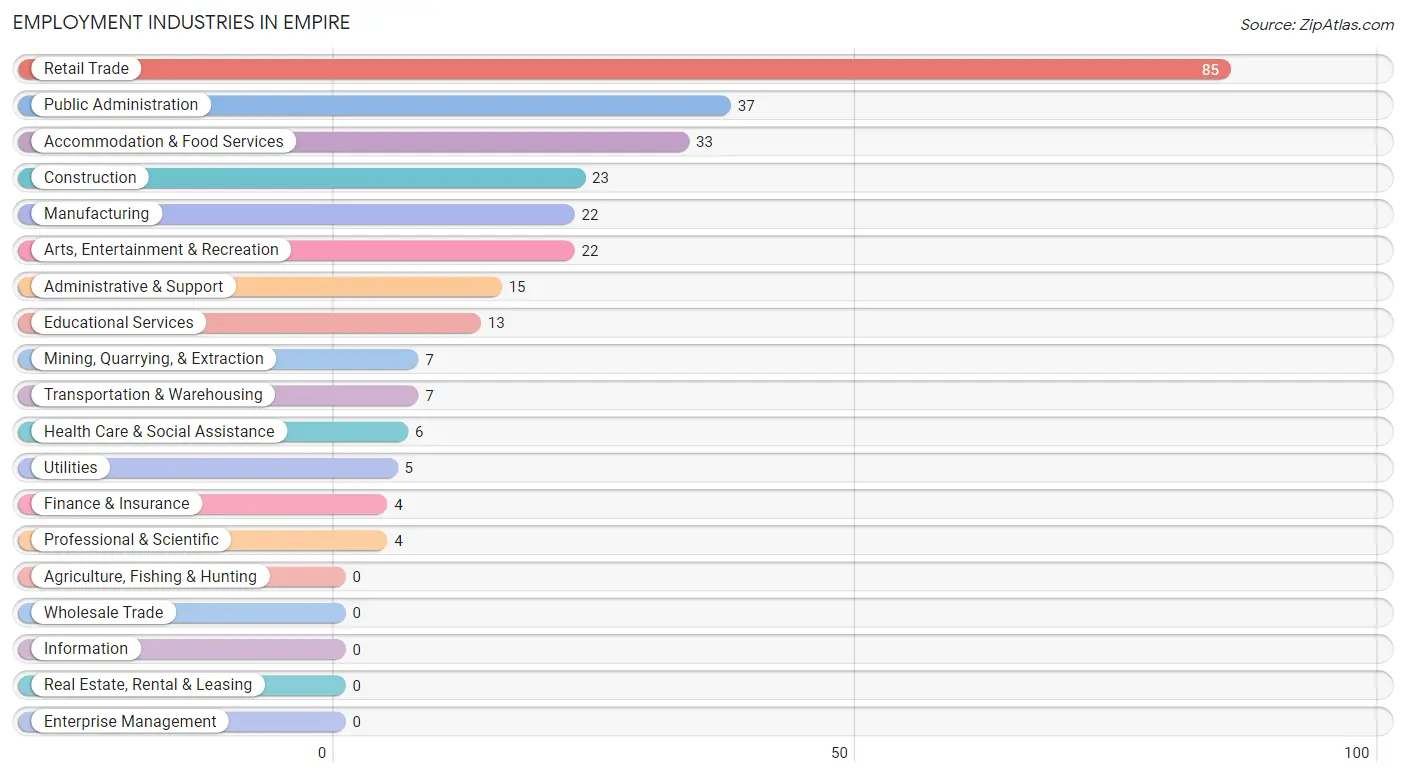
Employment Industries in Empire
The major employment industries in Empire include Retail Trade (85 | 30.0%), Public Administration (37 | 13.1%), Accommodation & Food Services (33 | 11.7%), Construction (23 | 8.1%), and Manufacturing (22 | 7.8%).
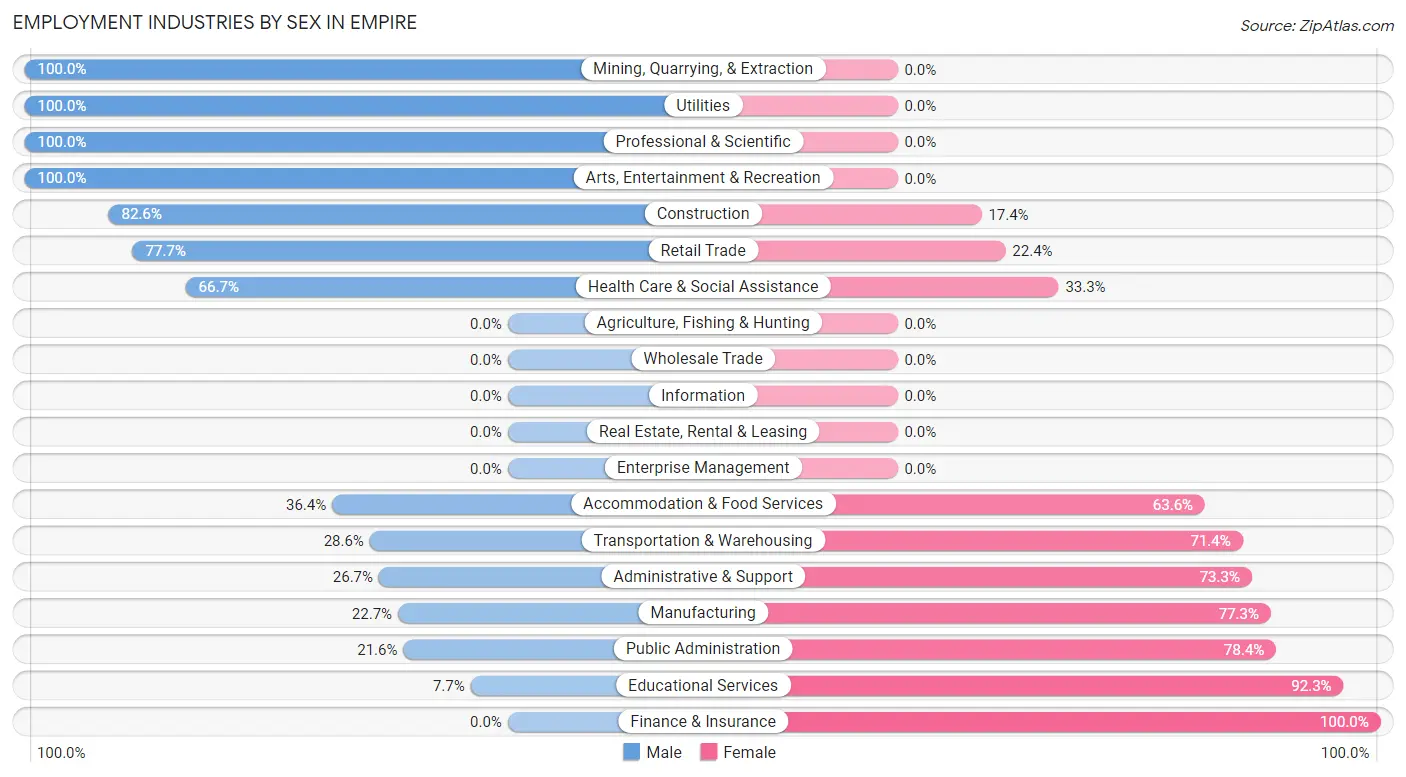
Employment Industries by Sex in Empire
The Empire industries that see more men than women are Mining, Quarrying, & Extraction (100.0%), Utilities (100.0%), and Professional & Scientific (100.0%), whereas the industries that tend to have a higher number of women are Finance & Insurance (100.0%), Educational Services (92.3%), and Public Administration (78.4%).
| Industry | Male | Female |
| Agriculture, Fishing & Hunting | 0 (0.0%) | 0 (0.0%) |
| Mining, Quarrying, & Extraction | 7 (100.0%) | 0 (0.0%) |
| Construction | 19 (82.6%) | 4 (17.4%) |
| Manufacturing | 5 (22.7%) | 17 (77.3%) |
| Wholesale Trade | 0 (0.0%) | 0 (0.0%) |
| Retail Trade | 66 (77.6%) | 19 (22.4%) |
| Transportation & Warehousing | 2 (28.6%) | 5 (71.4%) |
| Utilities | 5 (100.0%) | 0 (0.0%) |
| Information | 0 (0.0%) | 0 (0.0%) |
| Finance & Insurance | 0 (0.0%) | 4 (100.0%) |
| Real Estate, Rental & Leasing | 0 (0.0%) | 0 (0.0%) |
| Professional & Scientific | 4 (100.0%) | 0 (0.0%) |
| Enterprise Management | 0 (0.0%) | 0 (0.0%) |
| Administrative & Support | 4 (26.7%) | 11 (73.3%) |
| Educational Services | 1 (7.7%) | 12 (92.3%) |
| Health Care & Social Assistance | 4 (66.7%) | 2 (33.3%) |
| Arts, Entertainment & Recreation | 22 (100.0%) | 0 (0.0%) |
| Accommodation & Food Services | 12 (36.4%) | 21 (63.6%) |
| Public Administration | 8 (21.6%) | 29 (78.4%) |
| Total | 159 (56.2%) | 124 (43.8%) |
Education in Empire
School Enrollment in Empire
The most common levels of schooling among the 45 students in Empire are high school (14 | 31.1%), middle school (13 | 28.9%), and elementary school (8 | 17.8%).
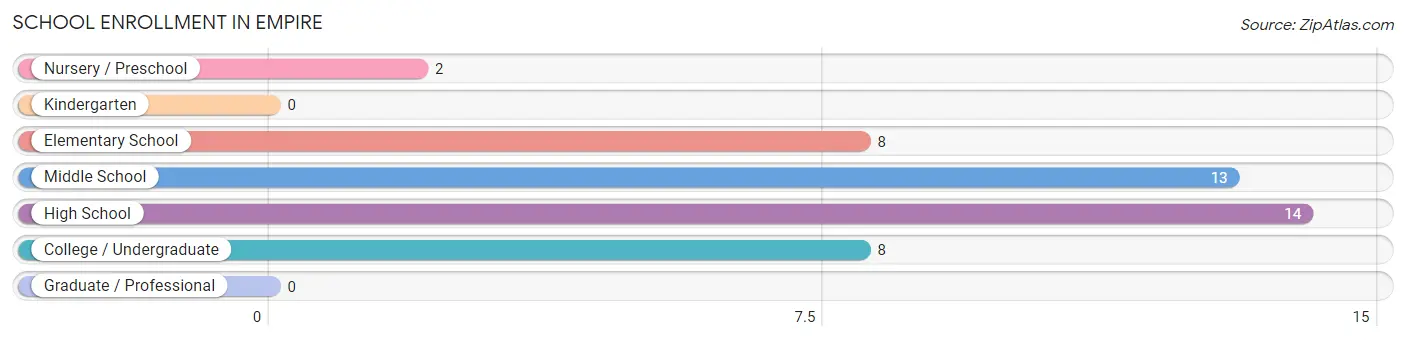
| School Level | # Students | % Students |
| Nursery / Preschool | 2 | 4.4% |
| Kindergarten | 0 | 0.0% |
| Elementary School | 8 | 17.8% |
| Middle School | 13 | 28.9% |
| High School | 14 | 31.1% |
| College / Undergraduate | 8 | 17.8% |
| Graduate / Professional | 0 | 0.0% |
| Total | 45 | 100.0% |
School Enrollment by Age by Funding Source in Empire
Out of a total of 45 students who are enrolled in schools in Empire, 5 (11.1%) attend a private institution, while the remaining 40 (88.9%) are enrolled in public schools. The age group of 25 to 34 year olds has the highest likelihood of being enrolled in private schools, with 5 (71.4% in the age bracket) enrolled. Conversely, the age group of 3 to 4 year olds has the lowest likelihood of being enrolled in a private school, with 2 (100.0% in the age bracket) attending a public institution.
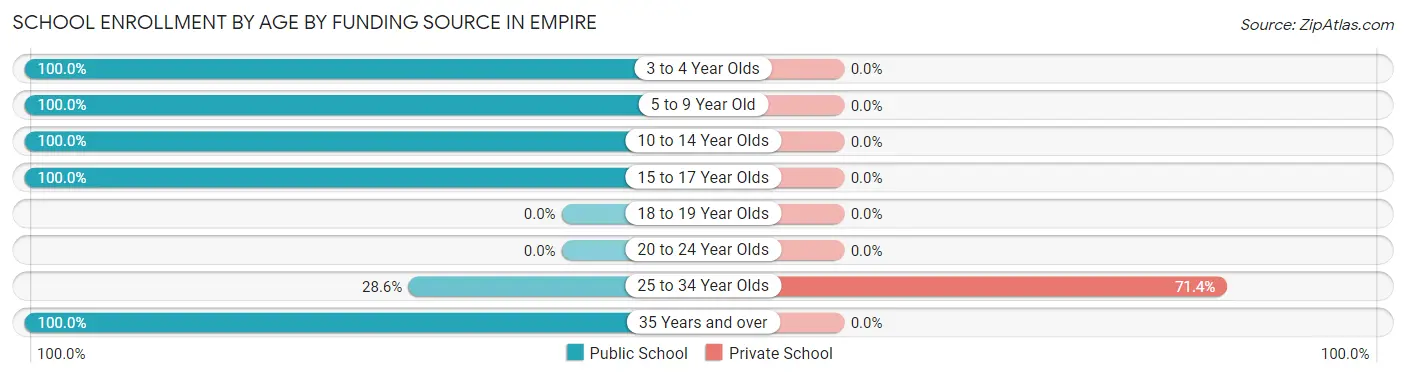
| Age Bracket | Public School | Private School |
| 3 to 4 Year Olds | 2 (100.0%) | 0 (0.0%) |
| 5 to 9 Year Old | 8 (100.0%) | 0 (0.0%) |
| 10 to 14 Year Olds | 17 (100.0%) | 0 (0.0%) |
| 15 to 17 Year Olds | 10 (100.0%) | 0 (0.0%) |
| 18 to 19 Year Olds | 0 (0.0%) | 0 (0.0%) |
| 20 to 24 Year Olds | 0 (0.0%) | 0 (0.0%) |
| 25 to 34 Year Olds | 2 (28.6%) | 5 (71.4%) |
| 35 Years and over | 1 (100.0%) | 0 (0.0%) |
| Total | 40 (88.9%) | 5 (11.1%) |
Educational Attainment by Field of Study in Empire
Social sciences (15 | 16.5%), bio, nature & agricultural (13 | 14.3%), psychology (10 | 11.0%), science & technology (10 | 11.0%), and literature & languages (10 | 11.0%) are the most common fields of study among 91 individuals in Empire who have obtained a bachelor's degree or higher.
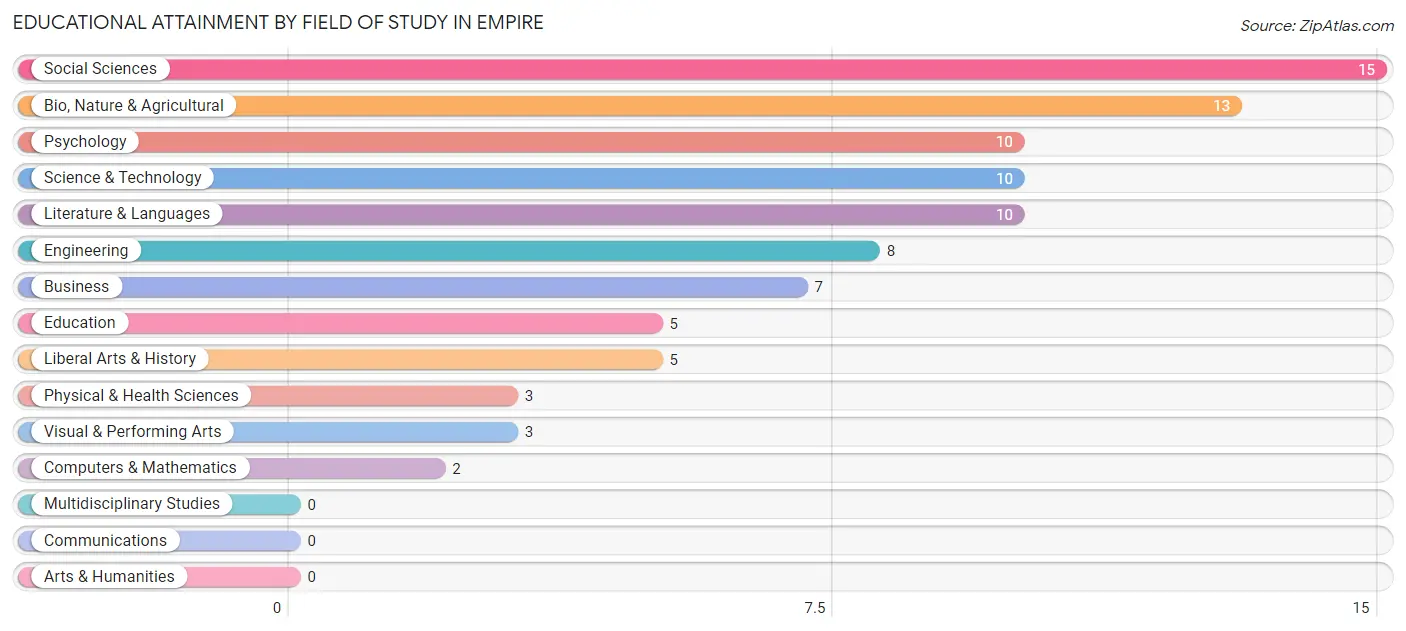
| Field of Study | # Graduates | % Graduates |
| Computers & Mathematics | 2 | 2.2% |
| Bio, Nature & Agricultural | 13 | 14.3% |
| Physical & Health Sciences | 3 | 3.3% |
| Psychology | 10 | 11.0% |
| Social Sciences | 15 | 16.5% |
| Engineering | 8 | 8.8% |
| Multidisciplinary Studies | 0 | 0.0% |
| Science & Technology | 10 | 11.0% |
| Business | 7 | 7.7% |
| Education | 5 | 5.5% |
| Literature & Languages | 10 | 11.0% |
| Liberal Arts & History | 5 | 5.5% |
| Visual & Performing Arts | 3 | 3.3% |
| Communications | 0 | 0.0% |
| Arts & Humanities | 0 | 0.0% |
| Total | 91 | 100.0% |
Transportation & Commute in Empire
Vehicle Availability by Sex in Empire
The most prevalent vehicle ownership categories in Empire are males with 2 vehicles (88, accounting for 55.3%) and females with 2 vehicles (40, making up 74.0%).
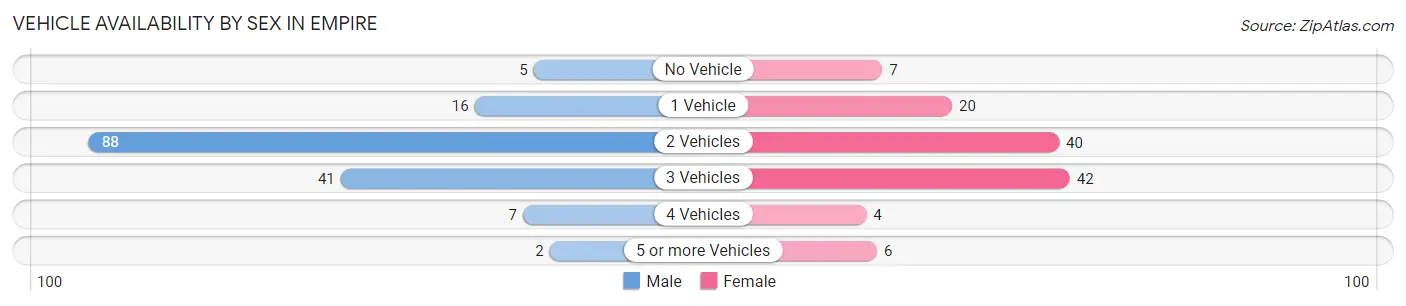
| Vehicles Available | Male | Female |
| No Vehicle | 5 (3.1%) | 7 (5.9%) |
| 1 Vehicle | 16 (10.1%) | 20 (16.8%) |
| 2 Vehicles | 88 (55.3%) | 40 (33.6%) |
| 3 Vehicles | 41 (25.8%) | 42 (35.3%) |
| 4 Vehicles | 7 (4.4%) | 4 (3.4%) |
| 5 or more Vehicles | 2 (1.3%) | 6 (5.0%) |
| Total | 159 (100.0%) | 119 (100.0%) |
Commute Time in Empire
The most frequently occuring commute durations in Empire are 5 to 9 minutes (71 commuters, 25.8%), 10 to 14 minutes (48 commuters, 17.4%), and 40 to 44 minutes (30 commuters, 10.9%).
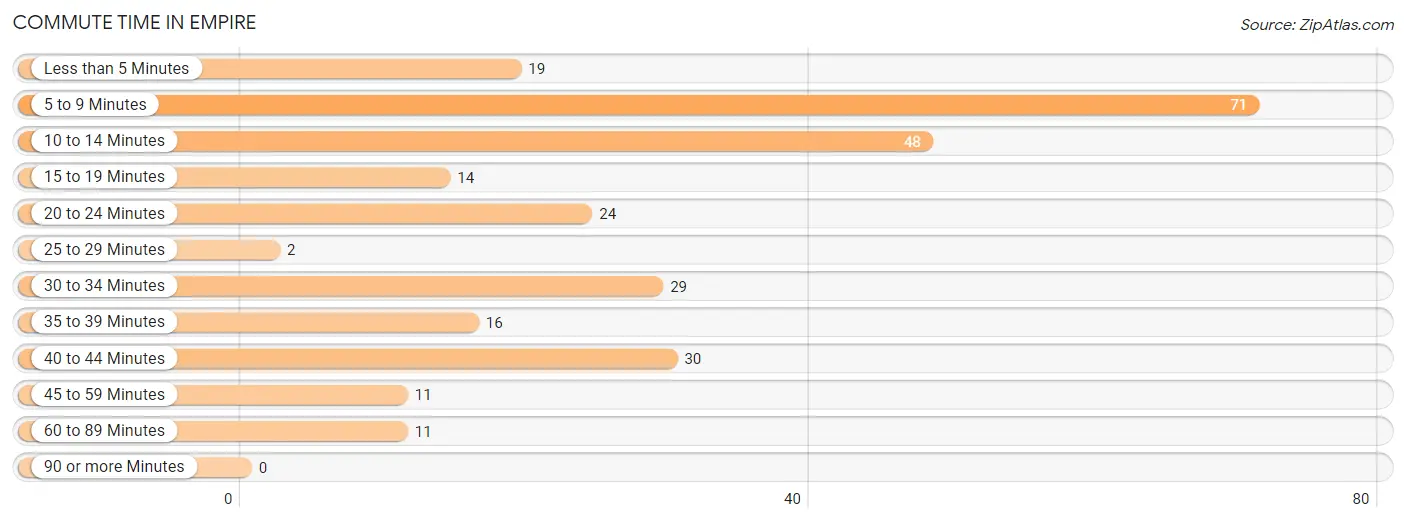
| Commute Time | # Commuters | % Commuters |
| Less than 5 Minutes | 19 | 6.9% |
| 5 to 9 Minutes | 71 | 25.8% |
| 10 to 14 Minutes | 48 | 17.4% |
| 15 to 19 Minutes | 14 | 5.1% |
| 20 to 24 Minutes | 24 | 8.7% |
| 25 to 29 Minutes | 2 | 0.7% |
| 30 to 34 Minutes | 29 | 10.5% |
| 35 to 39 Minutes | 16 | 5.8% |
| 40 to 44 Minutes | 30 | 10.9% |
| 45 to 59 Minutes | 11 | 4.0% |
| 60 to 89 Minutes | 11 | 4.0% |
| 90 or more Minutes | 0 | 0.0% |
Commute Time by Sex in Empire
The most common commute times in Empire are 5 to 9 minutes (59 commuters, 37.8%) for males and 10 to 14 minutes (38 commuters, 31.9%) for females.
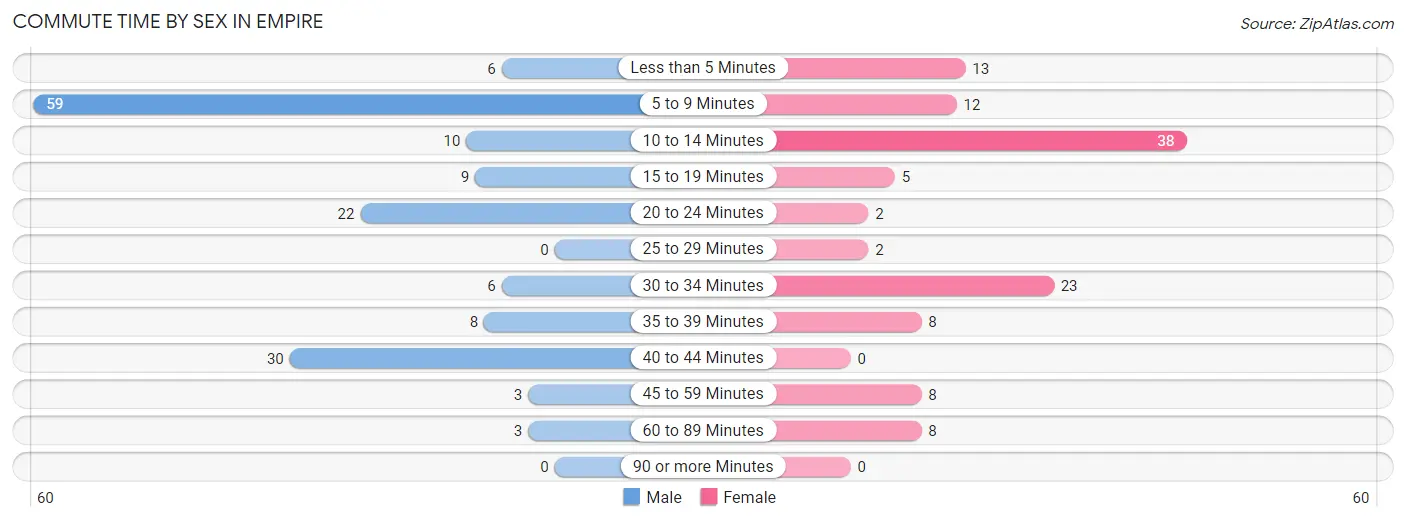
| Commute Time | Male | Female |
| Less than 5 Minutes | 6 (3.8%) | 13 (10.9%) |
| 5 to 9 Minutes | 59 (37.8%) | 12 (10.1%) |
| 10 to 14 Minutes | 10 (6.4%) | 38 (31.9%) |
| 15 to 19 Minutes | 9 (5.8%) | 5 (4.2%) |
| 20 to 24 Minutes | 22 (14.1%) | 2 (1.7%) |
| 25 to 29 Minutes | 0 (0.0%) | 2 (1.7%) |
| 30 to 34 Minutes | 6 (3.8%) | 23 (19.3%) |
| 35 to 39 Minutes | 8 (5.1%) | 8 (6.7%) |
| 40 to 44 Minutes | 30 (19.2%) | 0 (0.0%) |
| 45 to 59 Minutes | 3 (1.9%) | 8 (6.7%) |
| 60 to 89 Minutes | 3 (1.9%) | 8 (6.7%) |
| 90 or more Minutes | 0 (0.0%) | 0 (0.0%) |
Time of Departure to Work by Sex in Empire
The most frequent times of departure to work in Empire are 12:00 PM to 3:59 PM (62, 39.7%) for males and 5:30 AM to 5:59 AM (26, 21.8%) for females.
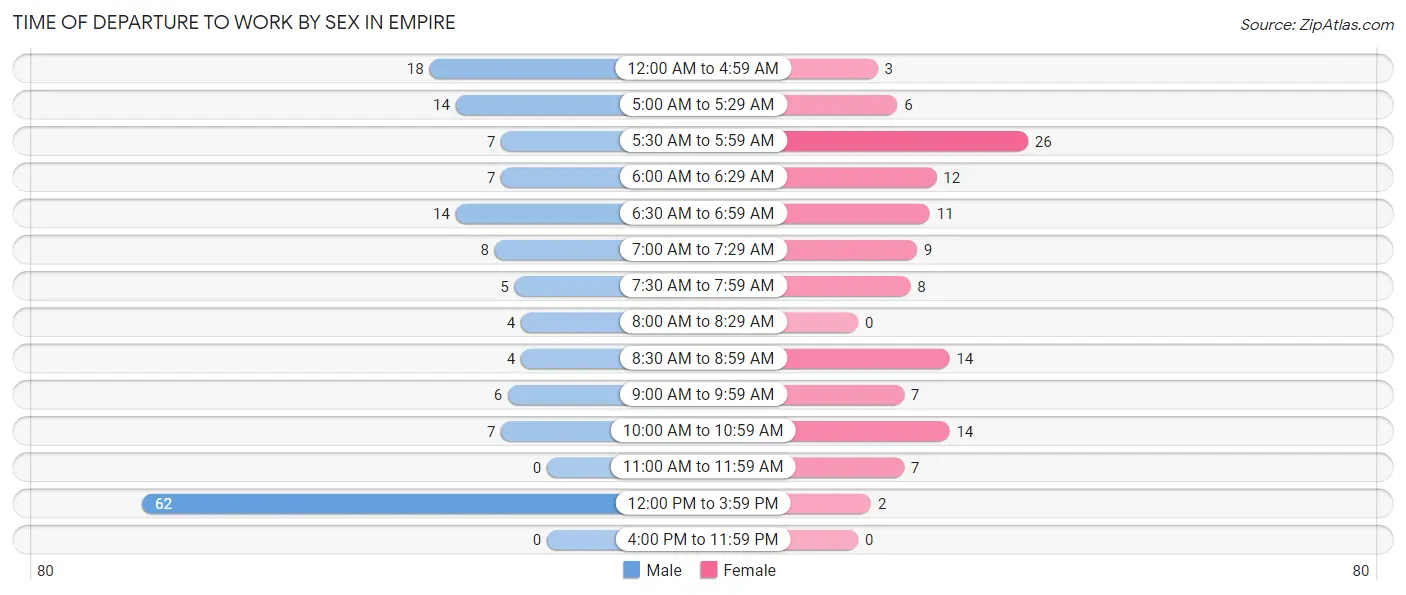
| Time of Departure | Male | Female |
| 12:00 AM to 4:59 AM | 18 (11.5%) | 3 (2.5%) |
| 5:00 AM to 5:29 AM | 14 (9.0%) | 6 (5.0%) |
| 5:30 AM to 5:59 AM | 7 (4.5%) | 26 (21.8%) |
| 6:00 AM to 6:29 AM | 7 (4.5%) | 12 (10.1%) |
| 6:30 AM to 6:59 AM | 14 (9.0%) | 11 (9.2%) |
| 7:00 AM to 7:29 AM | 8 (5.1%) | 9 (7.6%) |
| 7:30 AM to 7:59 AM | 5 (3.2%) | 8 (6.7%) |
| 8:00 AM to 8:29 AM | 4 (2.6%) | 0 (0.0%) |
| 8:30 AM to 8:59 AM | 4 (2.6%) | 14 (11.8%) |
| 9:00 AM to 9:59 AM | 6 (3.8%) | 7 (5.9%) |
| 10:00 AM to 10:59 AM | 7 (4.5%) | 14 (11.8%) |
| 11:00 AM to 11:59 AM | 0 (0.0%) | 7 (5.9%) |
| 12:00 PM to 3:59 PM | 62 (39.7%) | 2 (1.7%) |
| 4:00 PM to 11:59 PM | 0 (0.0%) | 0 (0.0%) |
| Total | 156 (100.0%) | 119 (100.0%) |
Housing Occupancy in Empire
Occupancy by Ownership in Empire
Of the total 274 dwellings in Empire, owner-occupied units account for 156 (56.9%), while renter-occupied units make up 118 (43.1%).
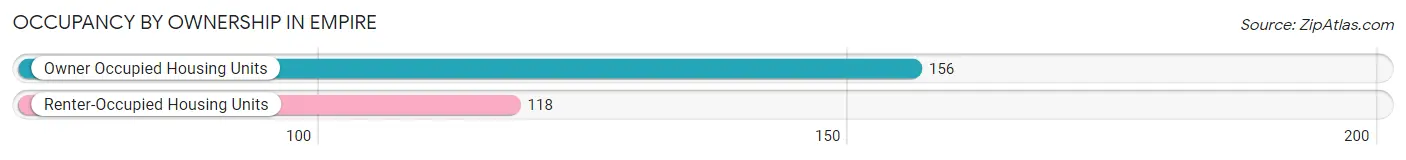
| Occupancy | # Housing Units | % Housing Units |
| Owner Occupied Housing Units | 156 | 56.9% |
| Renter-Occupied Housing Units | 118 | 43.1% |
| Total Occupied Housing Units | 274 | 100.0% |
Occupancy by Household Size in Empire
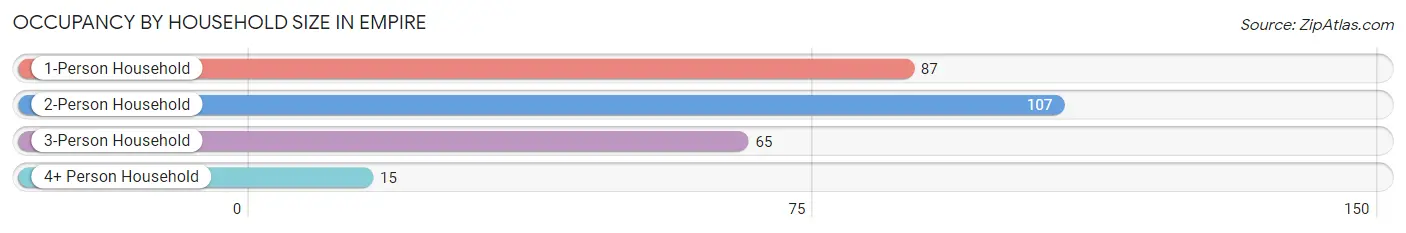
| Household Size | # Housing Units | % Housing Units |
| 1-Person Household | 87 | 31.8% |
| 2-Person Household | 107 | 39.1% |
| 3-Person Household | 65 | 23.7% |
| 4+ Person Household | 15 | 5.5% |
| Total Housing Units | 274 | 100.0% |
Occupancy by Ownership by Household Size in Empire
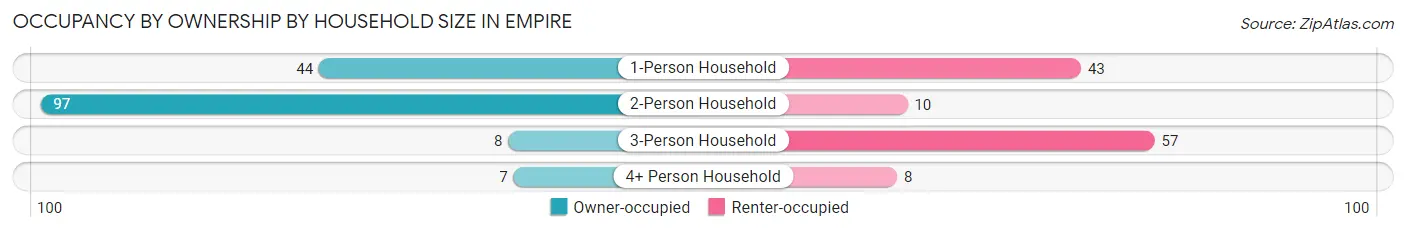
| Household Size | Owner-occupied | Renter-occupied |
| 1-Person Household | 44 (50.6%) | 43 (49.4%) |
| 2-Person Household | 97 (90.6%) | 10 (9.3%) |
| 3-Person Household | 8 (12.3%) | 57 (87.7%) |
| 4+ Person Household | 7 (46.7%) | 8 (53.3%) |
| Total Housing Units | 156 (56.9%) | 118 (43.1%) |
Occupancy by Educational Attainment in Empire
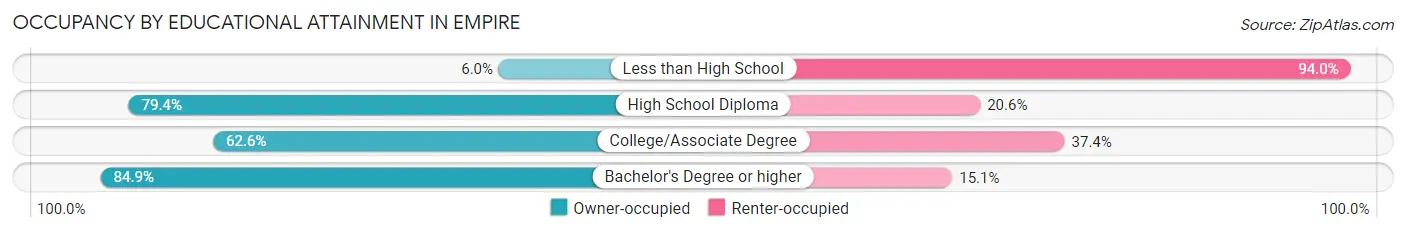
| Household Size | Owner-occupied | Renter-occupied |
| Less than High School | 4 (6.0%) | 63 (94.0%) |
| High School Diploma | 50 (79.4%) | 13 (20.6%) |
| College/Associate Degree | 57 (62.6%) | 34 (37.4%) |
| Bachelor's Degree or higher | 45 (84.9%) | 8 (15.1%) |
Occupancy by Age of Householder in Empire
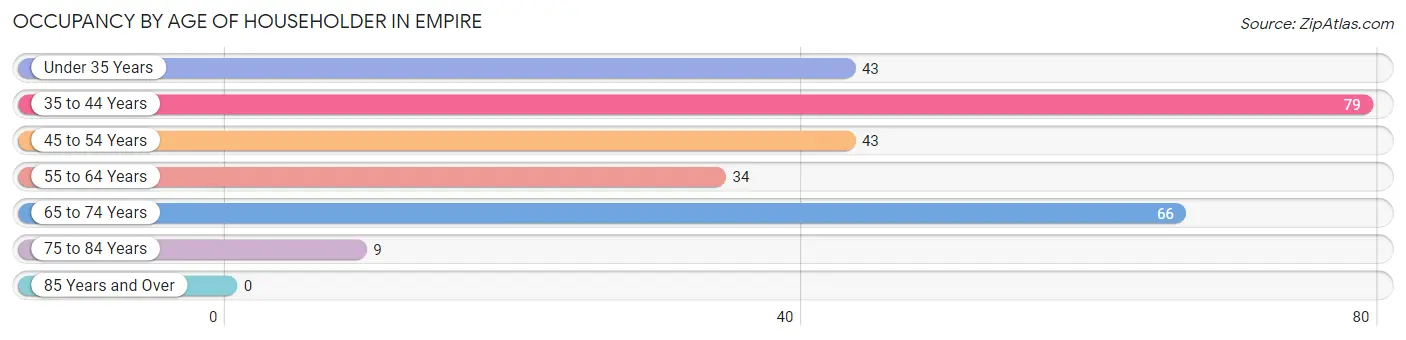
| Age Bracket | # Households | % Households |
| Under 35 Years | 43 | 15.7% |
| 35 to 44 Years | 79 | 28.8% |
| 45 to 54 Years | 43 | 15.7% |
| 55 to 64 Years | 34 | 12.4% |
| 65 to 74 Years | 66 | 24.1% |
| 75 to 84 Years | 9 | 3.3% |
| 85 Years and Over | 0 | 0.0% |
| Total | 274 | 100.0% |
Housing Finances in Empire
Median Income by Occupancy in Empire
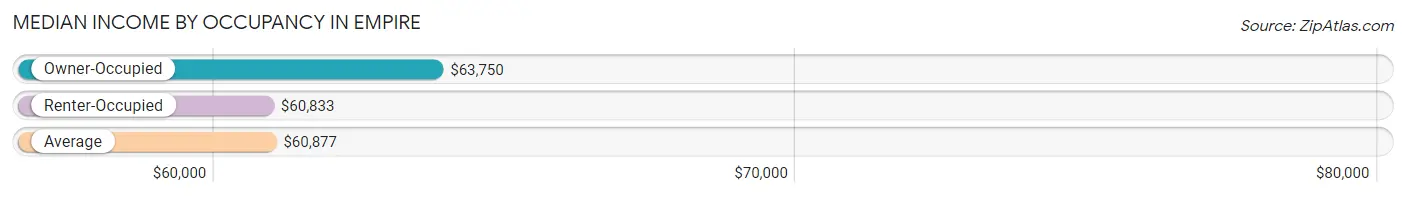
| Occupancy Type | # Households | Median Income |
| Owner-Occupied | 156 (56.9%) | $63,750 |
| Renter-Occupied | 118 (43.1%) | $60,833 |
| Average | 274 (100.0%) | $60,877 |
Occupancy by Householder Income Bracket in Empire
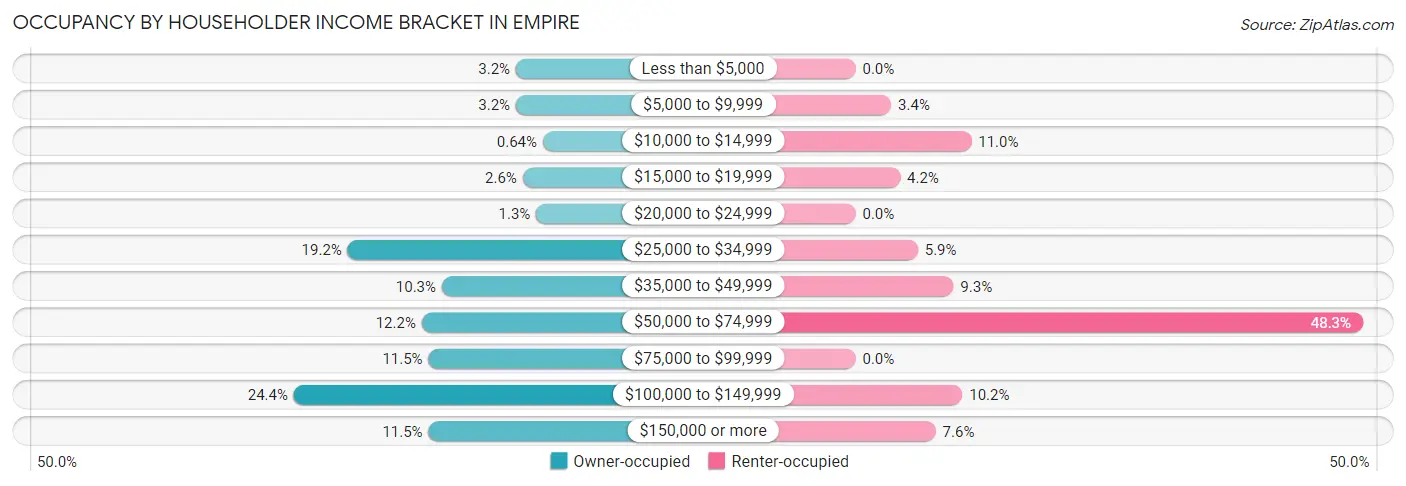
| Income Bracket | Owner-occupied | Renter-occupied |
| Less than $5,000 | 5 (3.2%) | 0 (0.0%) |
| $5,000 to $9,999 | 5 (3.2%) | 4 (3.4%) |
| $10,000 to $14,999 | 1 (0.6%) | 13 (11.0%) |
| $15,000 to $19,999 | 4 (2.6%) | 5 (4.2%) |
| $20,000 to $24,999 | 2 (1.3%) | 0 (0.0%) |
| $25,000 to $34,999 | 30 (19.2%) | 7 (5.9%) |
| $35,000 to $49,999 | 16 (10.3%) | 11 (9.3%) |
| $50,000 to $74,999 | 19 (12.2%) | 57 (48.3%) |
| $75,000 to $99,999 | 18 (11.5%) | 0 (0.0%) |
| $100,000 to $149,999 | 38 (24.4%) | 12 (10.2%) |
| $150,000 or more | 18 (11.5%) | 9 (7.6%) |
| Total | 156 (100.0%) | 118 (100.0%) |
Monthly Housing Cost Tiers in Empire
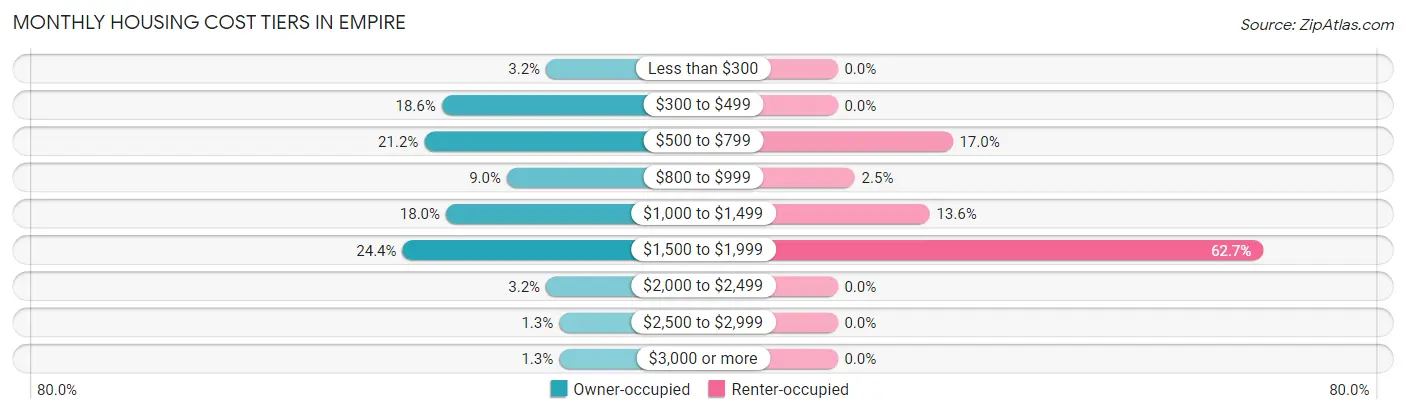
| Monthly Cost | Owner-occupied | Renter-occupied |
| Less than $300 | 5 (3.2%) | 0 (0.0%) |
| $300 to $499 | 29 (18.6%) | 0 (0.0%) |
| $500 to $799 | 33 (21.1%) | 20 (17.0%) |
| $800 to $999 | 14 (9.0%) | 3 (2.5%) |
| $1,000 to $1,499 | 28 (17.9%) | 16 (13.6%) |
| $1,500 to $1,999 | 38 (24.4%) | 74 (62.7%) |
| $2,000 to $2,499 | 5 (3.2%) | 0 (0.0%) |
| $2,500 to $2,999 | 2 (1.3%) | 0 (0.0%) |
| $3,000 or more | 2 (1.3%) | 0 (0.0%) |
| Total | 156 (100.0%) | 118 (100.0%) |
Physical Housing Characteristics in Empire
Housing Structures in Empire
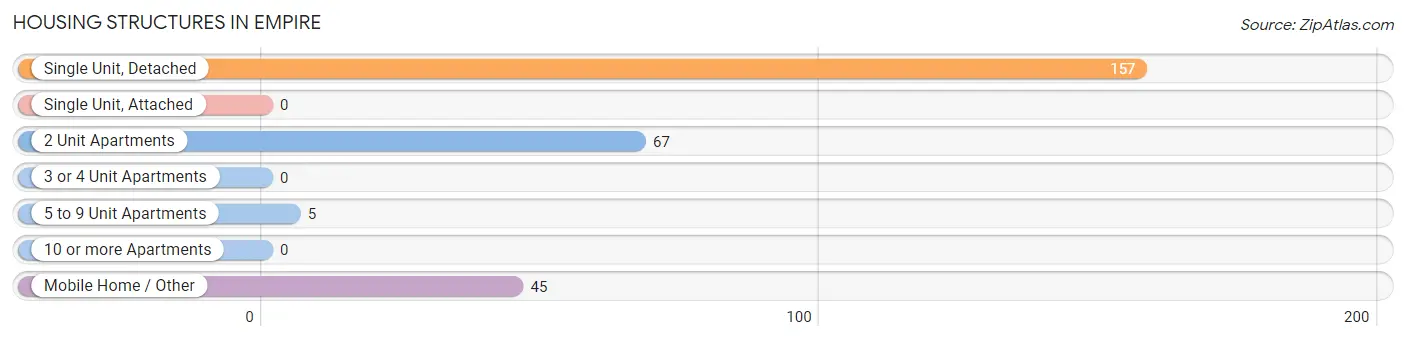
| Structure Type | # Housing Units | % Housing Units |
| Single Unit, Detached | 157 | 57.3% |
| Single Unit, Attached | 0 | 0.0% |
| 2 Unit Apartments | 67 | 24.4% |
| 3 or 4 Unit Apartments | 0 | 0.0% |
| 5 to 9 Unit Apartments | 5 | 1.8% |
| 10 or more Apartments | 0 | 0.0% |
| Mobile Home / Other | 45 | 16.4% |
| Total | 274 | 100.0% |
Housing Structures by Occupancy in Empire
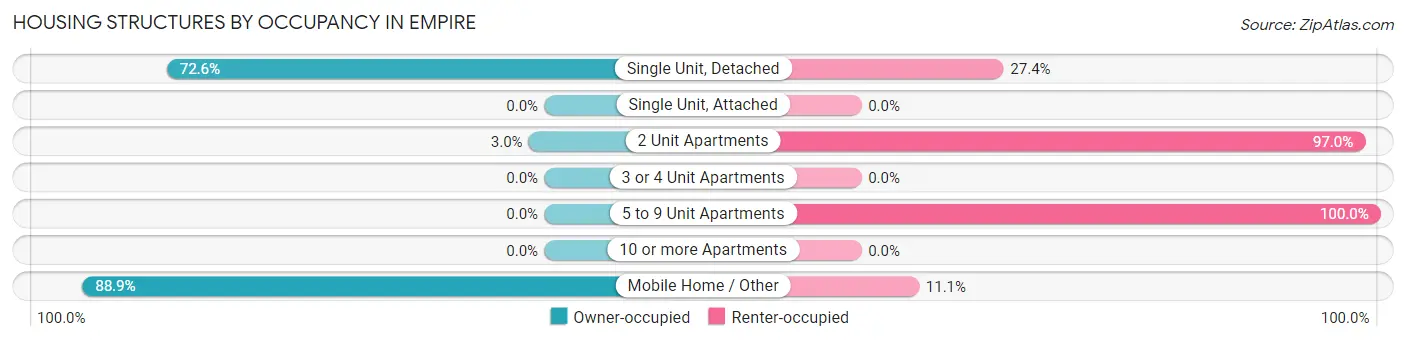
| Structure Type | Owner-occupied | Renter-occupied |
| Single Unit, Detached | 114 (72.6%) | 43 (27.4%) |
| Single Unit, Attached | 0 (0.0%) | 0 (0.0%) |
| 2 Unit Apartments | 2 (3.0%) | 65 (97.0%) |
| 3 or 4 Unit Apartments | 0 (0.0%) | 0 (0.0%) |
| 5 to 9 Unit Apartments | 0 (0.0%) | 5 (100.0%) |
| 10 or more Apartments | 0 (0.0%) | 0 (0.0%) |
| Mobile Home / Other | 40 (88.9%) | 5 (11.1%) |
| Total | 156 (56.9%) | 118 (43.1%) |
Housing Structures by Number of Rooms in Empire
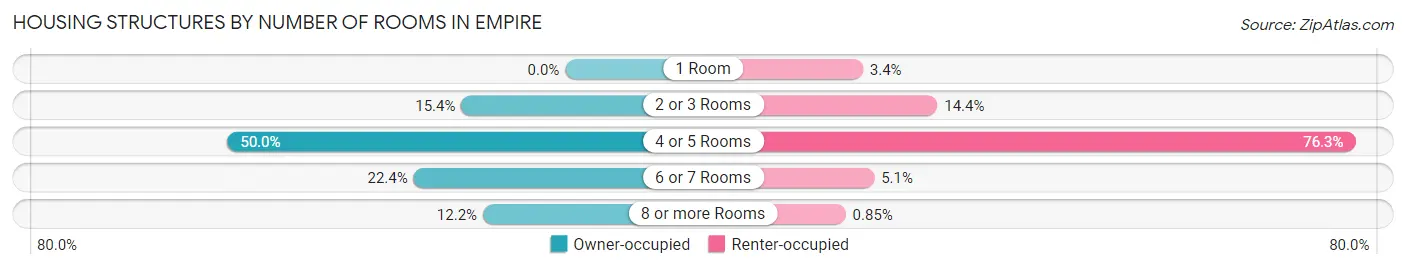
| Number of Rooms | Owner-occupied | Renter-occupied |
| 1 Room | 0 (0.0%) | 4 (3.4%) |
| 2 or 3 Rooms | 24 (15.4%) | 17 (14.4%) |
| 4 or 5 Rooms | 78 (50.0%) | 90 (76.3%) |
| 6 or 7 Rooms | 35 (22.4%) | 6 (5.1%) |
| 8 or more Rooms | 19 (12.2%) | 1 (0.9%) |
| Total | 156 (100.0%) | 118 (100.0%) |
Housing Structure by Heating Type in Empire
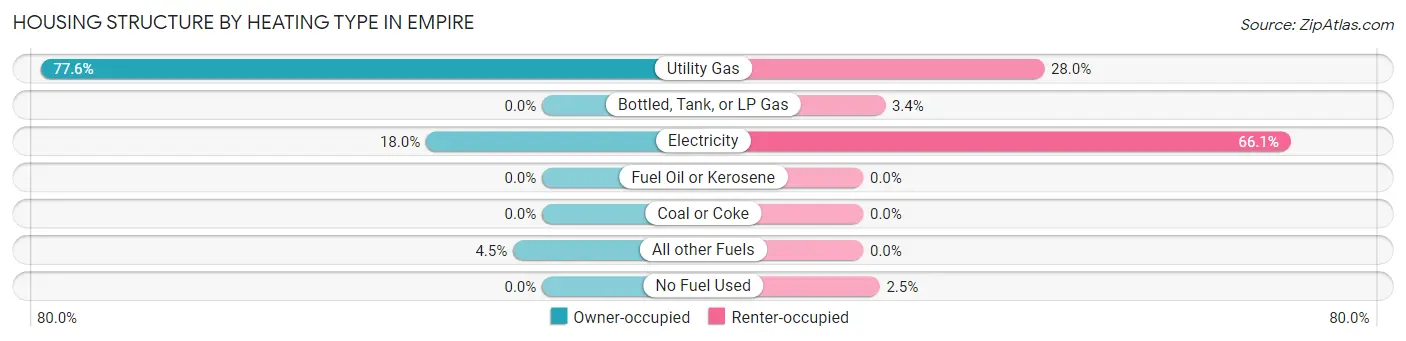
| Heating Type | Owner-occupied | Renter-occupied |
| Utility Gas | 121 (77.6%) | 33 (28.0%) |
| Bottled, Tank, or LP Gas | 0 (0.0%) | 4 (3.4%) |
| Electricity | 28 (17.9%) | 78 (66.1%) |
| Fuel Oil or Kerosene | 0 (0.0%) | 0 (0.0%) |
| Coal or Coke | 0 (0.0%) | 0 (0.0%) |
| All other Fuels | 7 (4.5%) | 0 (0.0%) |
| No Fuel Used | 0 (0.0%) | 3 (2.5%) |
| Total | 156 (100.0%) | 118 (100.0%) |
Household Vehicle Usage in Empire
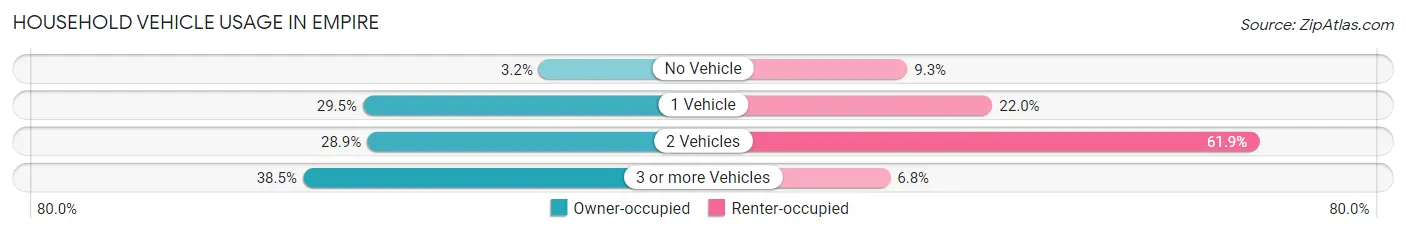
| Vehicles per Household | Owner-occupied | Renter-occupied |
| No Vehicle | 5 (3.2%) | 11 (9.3%) |
| 1 Vehicle | 46 (29.5%) | 26 (22.0%) |
| 2 Vehicles | 45 (28.8%) | 73 (61.9%) |
| 3 or more Vehicles | 60 (38.5%) | 8 (6.8%) |
| Total | 156 (100.0%) | 118 (100.0%) |
Real Estate & Mortgages in Empire
Real Estate and Mortgage Overview in Empire
| Characteristic | Without Mortgage | With Mortgage |
| Housing Units | 70 | 86 |
| Median Property Value | - | - |
| Median Household Income | $41,250 | $12 |
| Monthly Housing Costs | $509 | $2 |
| Real Estate Taxes | $199 | $0 |
Property Value by Mortgage Status in Empire
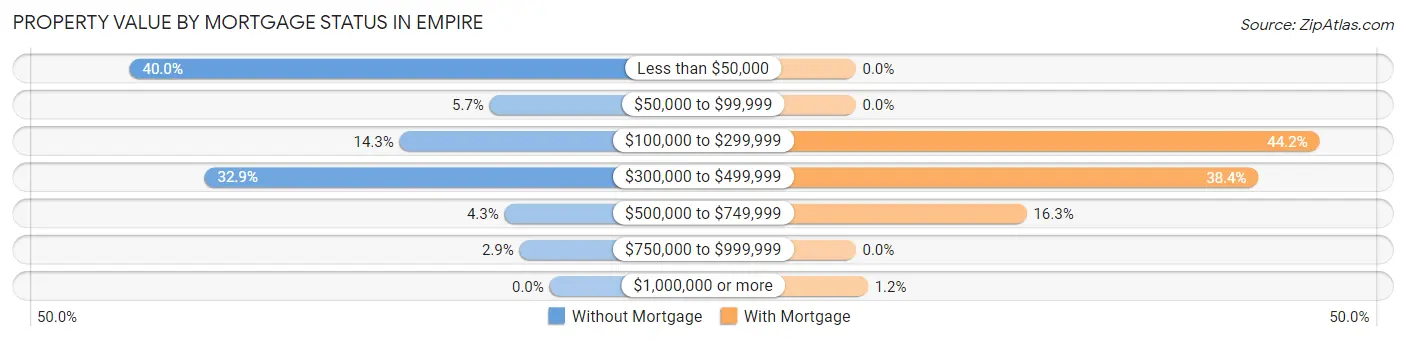
| Property Value | Without Mortgage | With Mortgage |
| Less than $50,000 | 28 (40.0%) | 0 (0.0%) |
| $50,000 to $99,999 | 4 (5.7%) | 0 (0.0%) |
| $100,000 to $299,999 | 10 (14.3%) | 38 (44.2%) |
| $300,000 to $499,999 | 23 (32.9%) | 33 (38.4%) |
| $500,000 to $749,999 | 3 (4.3%) | 14 (16.3%) |
| $750,000 to $999,999 | 2 (2.9%) | 0 (0.0%) |
| $1,000,000 or more | 0 (0.0%) | 1 (1.2%) |
| Total | 70 (100.0%) | 86 (100.0%) |
Household Income by Mortgage Status in Empire
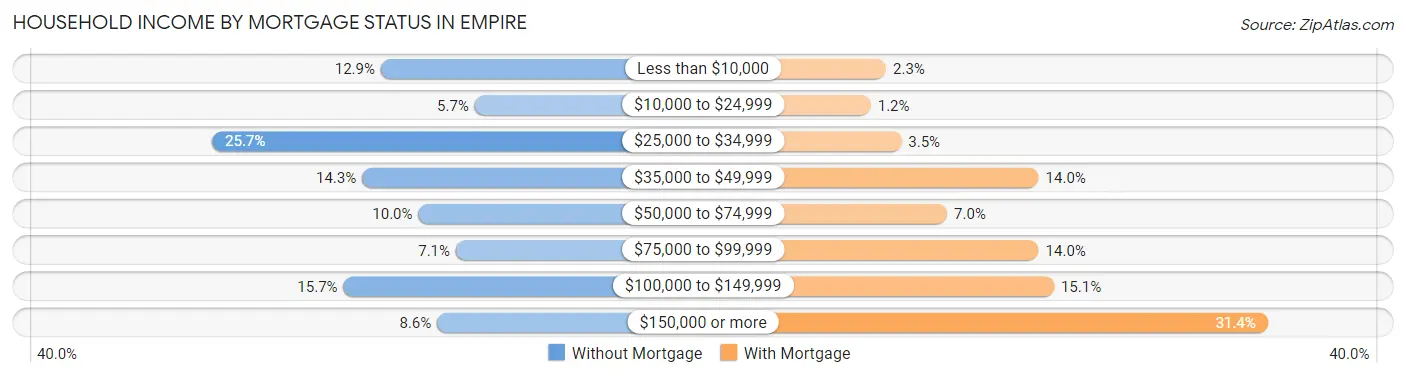
| Household Income | Without Mortgage | With Mortgage |
| Less than $10,000 | 9 (12.9%) | 2 (2.3%) |
| $10,000 to $24,999 | 4 (5.7%) | 1 (1.2%) |
| $25,000 to $34,999 | 18 (25.7%) | 3 (3.5%) |
| $35,000 to $49,999 | 10 (14.3%) | 12 (14.0%) |
| $50,000 to $74,999 | 7 (10.0%) | 6 (7.0%) |
| $75,000 to $99,999 | 5 (7.1%) | 12 (14.0%) |
| $100,000 to $149,999 | 11 (15.7%) | 13 (15.1%) |
| $150,000 or more | 6 (8.6%) | 27 (31.4%) |
| Total | 70 (100.0%) | 86 (100.0%) |
Property Value to Household Income Ratio in Empire
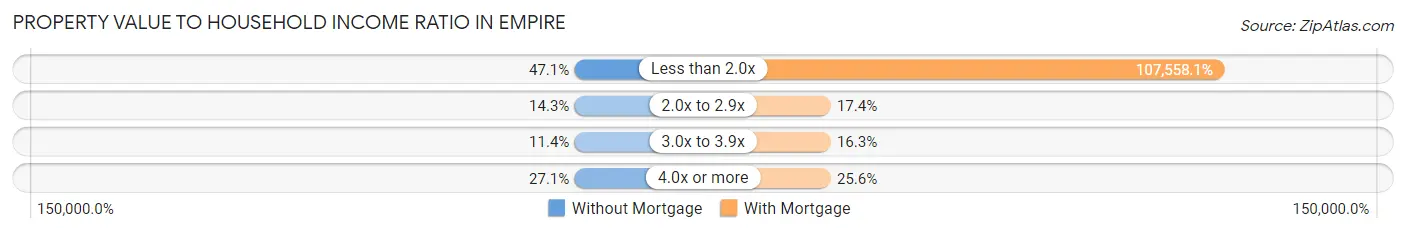
| Value-to-Income Ratio | Without Mortgage | With Mortgage |
| Less than 2.0x | 33 (47.1%) | 92,500 (107,558.1%) |
| 2.0x to 2.9x | 10 (14.3%) | 15 (17.4%) |
| 3.0x to 3.9x | 8 (11.4%) | 14 (16.3%) |
| 4.0x or more | 19 (27.1%) | 22 (25.6%) |
| Total | 70 (100.0%) | 86 (100.0%) |
Real Estate Taxes by Mortgage Status in Empire
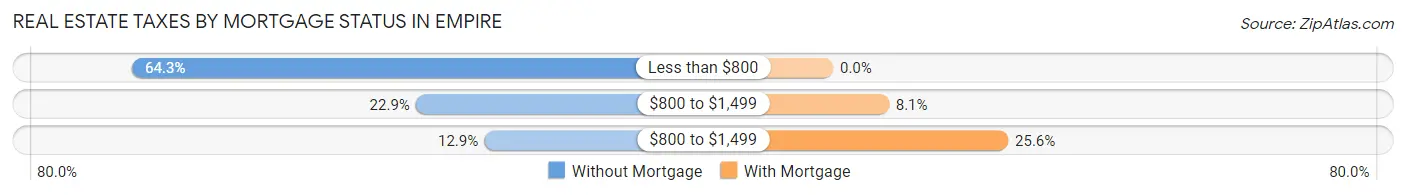
| Property Taxes | Without Mortgage | With Mortgage |
| Less than $800 | 45 (64.3%) | 0 (0.0%) |
| $800 to $1,499 | 16 (22.9%) | 7 (8.1%) |
| $800 to $1,499 | 9 (12.9%) | 22 (25.6%) |
| Total | 70 (100.0%) | 86 (100.0%) |
Health & Disability in Empire
Health Insurance Coverage by Age in Empire
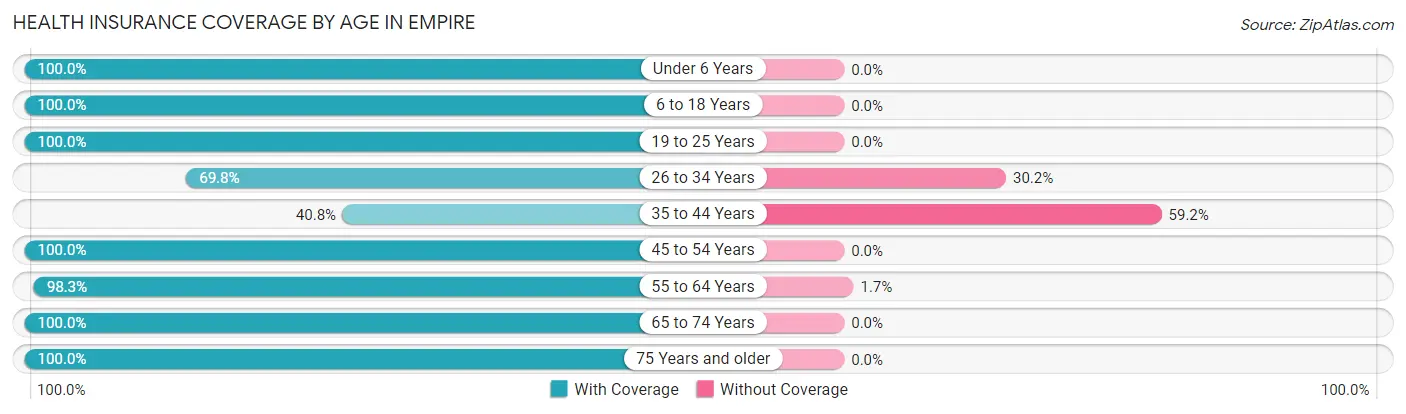
| Age Bracket | With Coverage | Without Coverage |
| Under 6 Years | 8 (100.0%) | 0 (0.0%) |
| 6 to 18 Years | 35 (100.0%) | 0 (0.0%) |
| 19 to 25 Years | 8 (100.0%) | 0 (0.0%) |
| 26 to 34 Years | 44 (69.8%) | 19 (30.2%) |
| 35 to 44 Years | 49 (40.8%) | 71 (59.2%) |
| 45 to 54 Years | 57 (100.0%) | 0 (0.0%) |
| 55 to 64 Years | 57 (98.3%) | 1 (1.7%) |
| 65 to 74 Years | 83 (100.0%) | 0 (0.0%) |
| 75 Years and older | 15 (100.0%) | 0 (0.0%) |
| Total | 356 (79.6%) | 91 (20.4%) |
Health Insurance Coverage by Citizenship Status in Empire
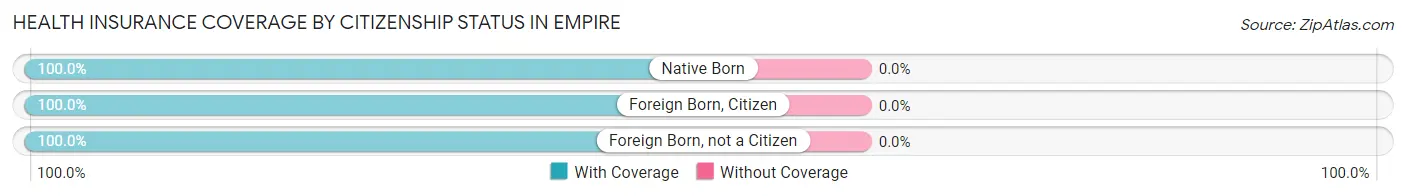
| Citizenship Status | With Coverage | Without Coverage |
| Native Born | 8 (100.0%) | 0 (0.0%) |
| Foreign Born, Citizen | 35 (100.0%) | 0 (0.0%) |
| Foreign Born, not a Citizen | 8 (100.0%) | 0 (0.0%) |
Health Insurance Coverage by Household Income in Empire
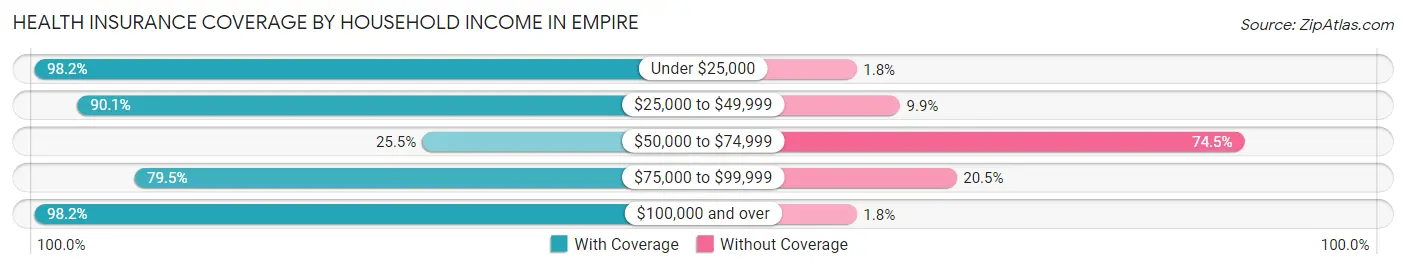
| Household Income | With Coverage | Without Coverage |
| Under $25,000 | 55 (98.2%) | 1 (1.8%) |
| $25,000 to $49,999 | 82 (90.1%) | 9 (9.9%) |
| $50,000 to $74,999 | 24 (25.5%) | 70 (74.5%) |
| $75,000 to $99,999 | 31 (79.5%) | 8 (20.5%) |
| $100,000 and over | 164 (98.2%) | 3 (1.8%) |
Public vs Private Health Insurance Coverage by Age in Empire
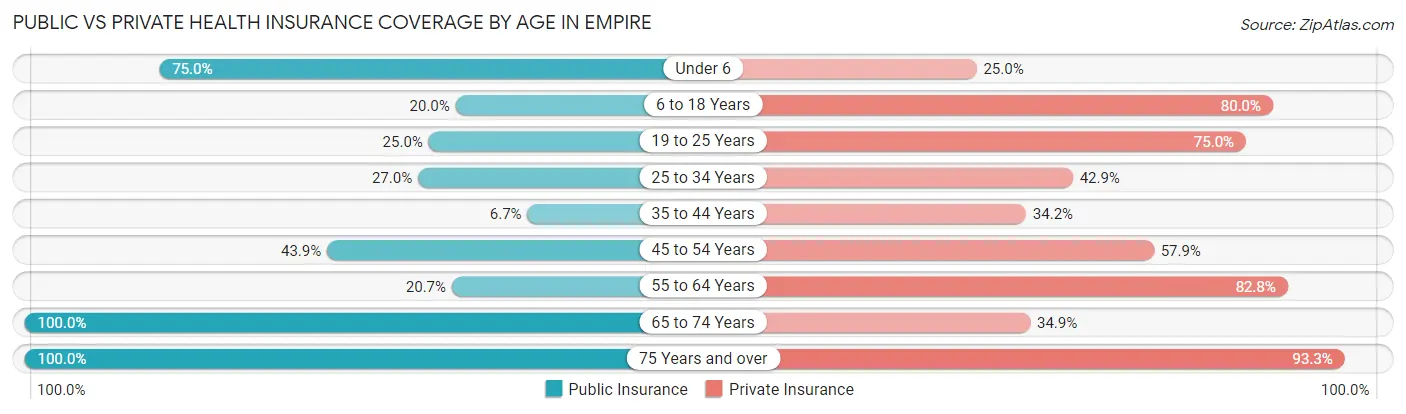
| Age Bracket | Public Insurance | Private Insurance |
| Under 6 | 6 (75.0%) | 2 (25.0%) |
| 6 to 18 Years | 7 (20.0%) | 28 (80.0%) |
| 19 to 25 Years | 2 (25.0%) | 6 (75.0%) |
| 25 to 34 Years | 17 (27.0%) | 27 (42.9%) |
| 35 to 44 Years | 8 (6.7%) | 41 (34.2%) |
| 45 to 54 Years | 25 (43.9%) | 33 (57.9%) |
| 55 to 64 Years | 12 (20.7%) | 48 (82.8%) |
| 65 to 74 Years | 83 (100.0%) | 29 (34.9%) |
| 75 Years and over | 15 (100.0%) | 14 (93.3%) |
| Total | 175 (39.2%) | 228 (51.0%) |
Disability Status by Sex by Age in Empire
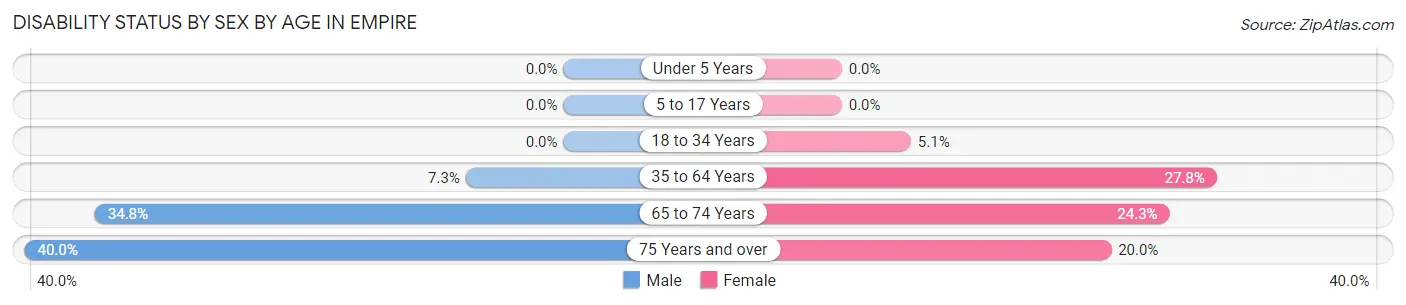
| Age Bracket | Male | Female |
| Under 5 Years | 0 (0.0%) | 0 (0.0%) |
| 5 to 17 Years | 0 (0.0%) | 0 (0.0%) |
| 18 to 34 Years | 0 (0.0%) | 2 (5.1%) |
| 35 to 64 Years | 10 (7.2%) | 27 (27.8%) |
| 65 to 74 Years | 16 (34.8%) | 9 (24.3%) |
| 75 Years and over | 2 (40.0%) | 2 (20.0%) |
Disability Class by Sex by Age in Empire
Disability Class: Hearing Difficulty
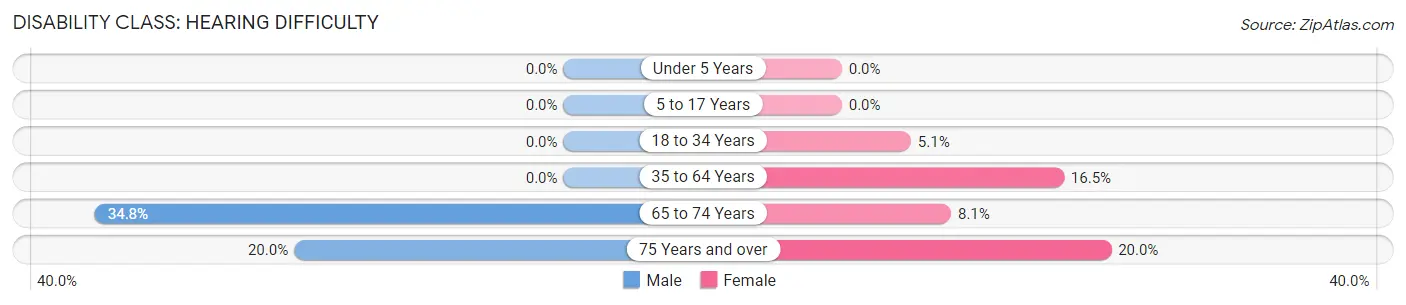
| Age Bracket | Male | Female |
| Under 5 Years | 0 (0.0%) | 0 (0.0%) |
| 5 to 17 Years | 0 (0.0%) | 0 (0.0%) |
| 18 to 34 Years | 0 (0.0%) | 2 (5.1%) |
| 35 to 64 Years | 0 (0.0%) | 16 (16.5%) |
| 65 to 74 Years | 16 (34.8%) | 3 (8.1%) |
| 75 Years and over | 1 (20.0%) | 2 (20.0%) |
Disability Class: Vision Difficulty
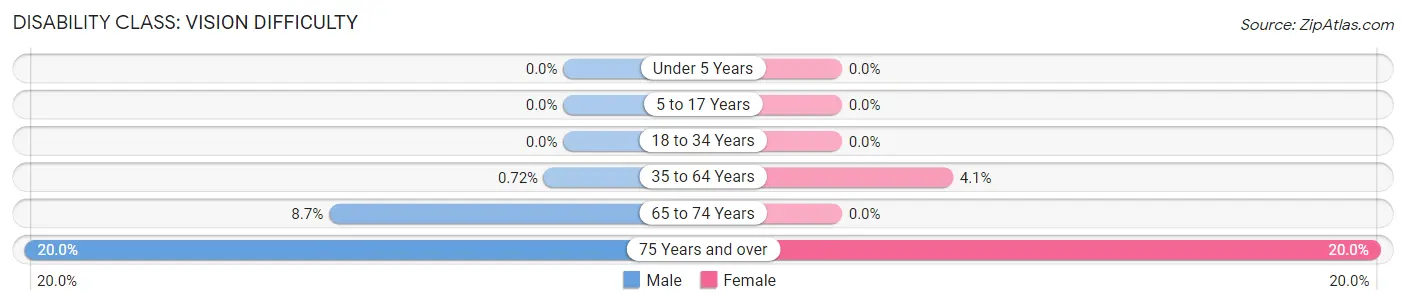
| Age Bracket | Male | Female |
| Under 5 Years | 0 (0.0%) | 0 (0.0%) |
| 5 to 17 Years | 0 (0.0%) | 0 (0.0%) |
| 18 to 34 Years | 0 (0.0%) | 0 (0.0%) |
| 35 to 64 Years | 1 (0.7%) | 4 (4.1%) |
| 65 to 74 Years | 4 (8.7%) | 0 (0.0%) |
| 75 Years and over | 1 (20.0%) | 2 (20.0%) |
Disability Class: Cognitive Difficulty
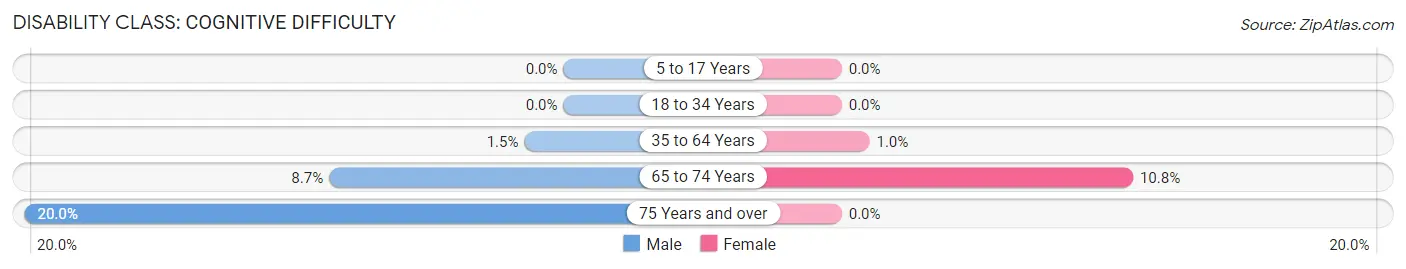
| Age Bracket | Male | Female |
| 5 to 17 Years | 0 (0.0%) | 0 (0.0%) |
| 18 to 34 Years | 0 (0.0%) | 0 (0.0%) |
| 35 to 64 Years | 2 (1.5%) | 1 (1.0%) |
| 65 to 74 Years | 4 (8.7%) | 4 (10.8%) |
| 75 Years and over | 1 (20.0%) | 0 (0.0%) |
Disability Class: Ambulatory Difficulty
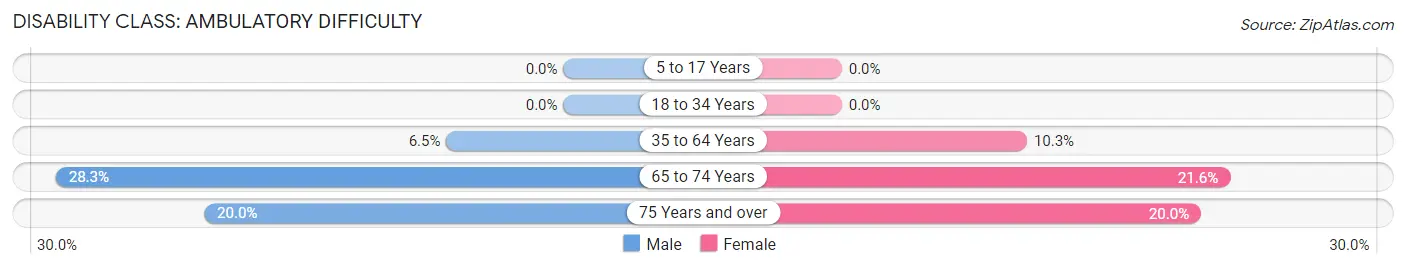
| Age Bracket | Male | Female |
| 5 to 17 Years | 0 (0.0%) | 0 (0.0%) |
| 18 to 34 Years | 0 (0.0%) | 0 (0.0%) |
| 35 to 64 Years | 9 (6.5%) | 10 (10.3%) |
| 65 to 74 Years | 13 (28.3%) | 8 (21.6%) |
| 75 Years and over | 1 (20.0%) | 2 (20.0%) |
Disability Class: Self-Care Difficulty
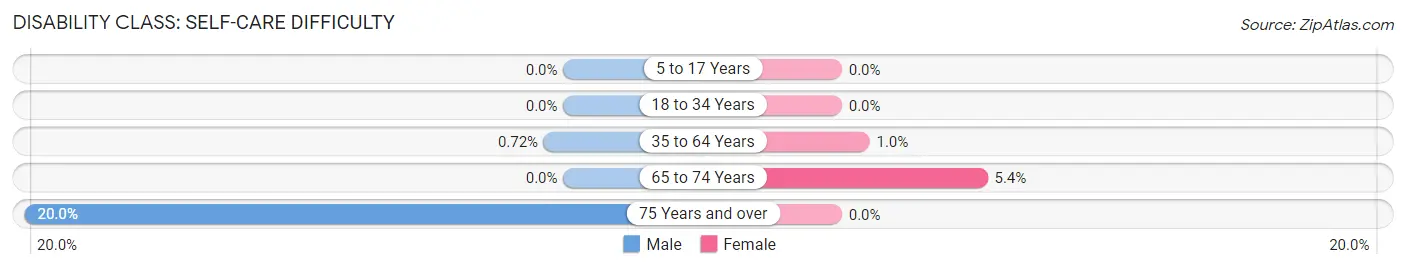
| Age Bracket | Male | Female |
| 5 to 17 Years | 0 (0.0%) | 0 (0.0%) |
| 18 to 34 Years | 0 (0.0%) | 0 (0.0%) |
| 35 to 64 Years | 1 (0.7%) | 1 (1.0%) |
| 65 to 74 Years | 0 (0.0%) | 2 (5.4%) |
| 75 Years and over | 1 (20.0%) | 0 (0.0%) |
Technology Access in Empire
Computing Device Access in Empire
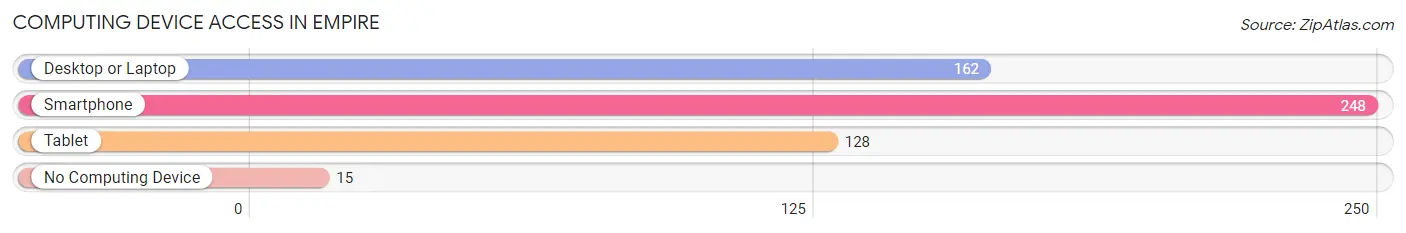
| Device Type | # Households | % Households |
| Desktop or Laptop | 162 | 59.1% |
| Smartphone | 248 | 90.5% |
| Tablet | 128 | 46.7% |
| No Computing Device | 15 | 5.5% |
| Total | 274 | 100.0% |
Internet Access in Empire
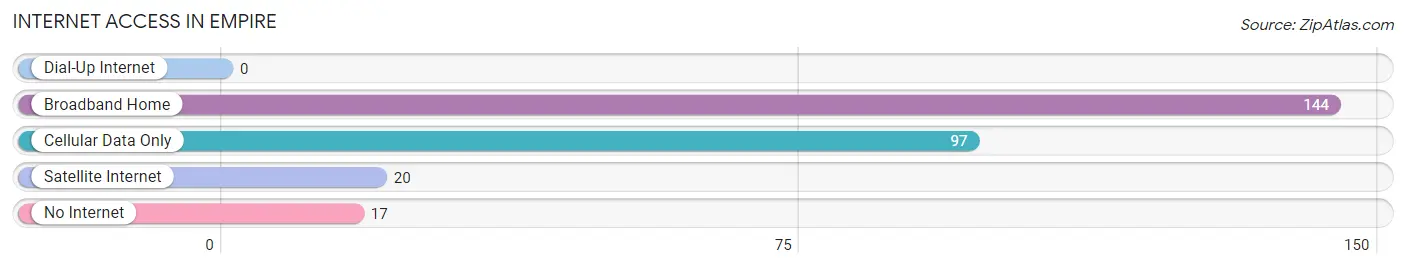
| Internet Type | # Households | % Households |
| Dial-Up Internet | 0 | 0.0% |
| Broadband Home | 144 | 52.5% |
| Cellular Data Only | 97 | 35.4% |
| Satellite Internet | 20 | 7.3% |
| No Internet | 17 | 6.2% |
| Total | 274 | 100.0% |
Empire Summary
Empire is a small town located in Clear Creek County, Colorado, United States. The town is situated in the Rocky Mountains, at an elevation of 8,890 feet (2,710 m). As of the 2010 census, the population of Empire was 462.
Geography
Empire is located in the Rocky Mountains, at an elevation of 8,890 feet (2,710 m). The town is situated in the Clear Creek Valley, between the Front Range and the Continental Divide. The town is surrounded by mountains, including Mount Evans, Mount Bierstadt, and Mount Evans Wilderness. The town is located approximately 30 miles (48 km) west of Denver.
Climate
Empire has a humid continental climate, with cold winters and warm summers. The average annual temperature is 37.2 °F (2.9 °C). The average annual precipitation is 18.3 inches (465 mm).
Demographics
As of the 2010 census, there were 462 people, 181 households, and 122 families residing in Empire. The population density was 5.2 people per square mile (2.0/km2). The racial makeup of the town was 97.4% White, 0.2% African American, 0.2% Native American, 0.2% Asian, 0.2% from other races, and 1.7% from two or more races. Hispanic or Latino of any race were 2.2% of the population.
Economy
Empire is a small town with a limited economy. The town is home to several small businesses, including a grocery store, a hardware store, a restaurant, and a gas station. The town is also home to a small ski resort, which is a popular tourist destination.
The town is also home to several mining operations, including gold, silver, and molybdenum. The mining industry is the primary source of employment in the town.
Conclusion
Empire is a small town located in Clear Creek County, Colorado, United States. The town is situated in the Rocky Mountains, at an elevation of 8,890 feet (2,710 m). As of the 2010 census, the population of Empire was 462. The town has a humid continental climate, with cold winters and warm summers. The town is home to several small businesses, including a grocery store, a hardware store, a restaurant, and a gas station. The town is also home to a small ski resort, which is a popular tourist destination. The mining industry is the primary source of employment in the town.
Common Questions
What is Per Capita Income in Empire?
Per Capita income in Empire is $44,117.
What is the Median Household income in Empire?
Median Household Income in Empire is $60,877.
What is Income or Wage Gap in Empire?
Income or Wage Gap in Empire is 7.5%.
Women in Empire earn 92.5 cents for every dollar earned by a man.
What is Inequality or Gini Index in Empire?
Inequality or Gini Index in Empire is 0.40.
What is the Total Population of Empire?
Total Population of Empire is 447.
What is the Total Male Population of Empire?
Total Male Population of Empire is 246.
What is the Total Female Population of Empire?
Total Female Population of Empire is 201.
What is the Ratio of Males per 100 Females in Empire?
There are 122.39 Males per 100 Females in Empire.
What is the Ratio of Females per 100 Males in Empire?
There are 81.71 Females per 100 Males in Empire.
What is the Median Population Age in Empire?
Median Population Age in Empire is 44.8 Years.
What is the Average Family Size in Empire
Average Family Size in Empire is 1.9 People.
What is the Average Household Size in Empire
Average Household Size in Empire is 1.6 People.
How Large is the Labor Force in Empire?
There are 290 People in the Labor Forcein in Empire.
What is the Percentage of People in the Labor Force in Empire?
70.0% of People are in the Labor Force in Empire.
What is the Unemployment Rate in Empire?
Unemployment Rate in Empire is 2.4%.