Ellicott, CO Map & Demographics
Ellicott Map
Ellicott Overview
$16,827
PER CAPITA INCOME
$44,063
AVG FAMILY INCOME
$44,219
AVG HOUSEHOLD INCOME
44.8%
WAGE / INCOME GAP [ % ]
55.2¢/ $1
WAGE / INCOME GAP [ $ ]
0.45
INEQUALITY / GINI INDEX
1,247
TOTAL POPULATION
670
MALE POPULATION
577
FEMALE POPULATION
116.12
MALES / 100 FEMALES
86.12
FEMALES / 100 MALES
31.8
MEDIAN AGE
3.5
AVG FAMILY SIZE
3.4
AVG HOUSEHOLD SIZE
554
LABOR FORCE [ PEOPLE ]
67.4%
PERCENT IN LABOR FORCE
1.3%
UNEMPLOYMENT RATE
Income in Ellicott
Income Overview in Ellicott
Per Capita Income in Ellicott is $16,827, while median incomes of families and households are $44,063 and $44,219 respectively.
| Characteristic | Number | Measure |
| Per Capita Income | 1,247 | $16,827 |
| Median Family Income | 338 | $44,063 |
| Mean Family Income | 338 | $55,867 |
| Median Household Income | 363 | $44,219 |
| Mean Household Income | 363 | $55,581 |
| Income Deficit | 338 | $0 |
| Wage / Income Gap (%) | 1,247 | 44.81% |
| Wage / Income Gap ($) | 1,247 | 55.19¢ per $1 |
| Gini / Inequality Index | 1,247 | 0.45 |
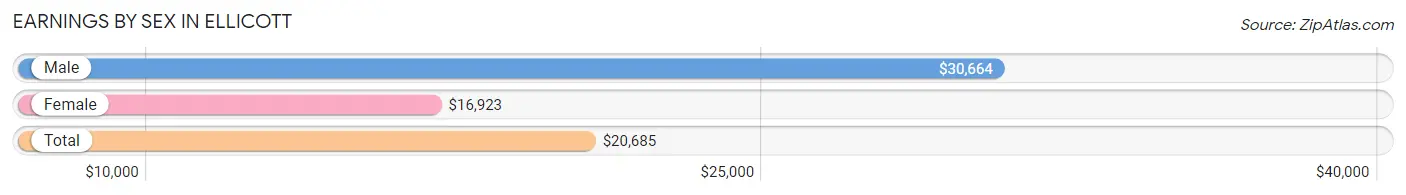
Earnings by Sex in Ellicott
Average Earnings in Ellicott are $20,685, $30,664 for men and $16,923 for women, a difference of 44.8%.
| Sex | Number | Average Earnings |
| Male | 347 (60.6%) | $30,664 |
| Female | 226 (39.4%) | $16,923 |
| Total | 573 (100.0%) | $20,685 |
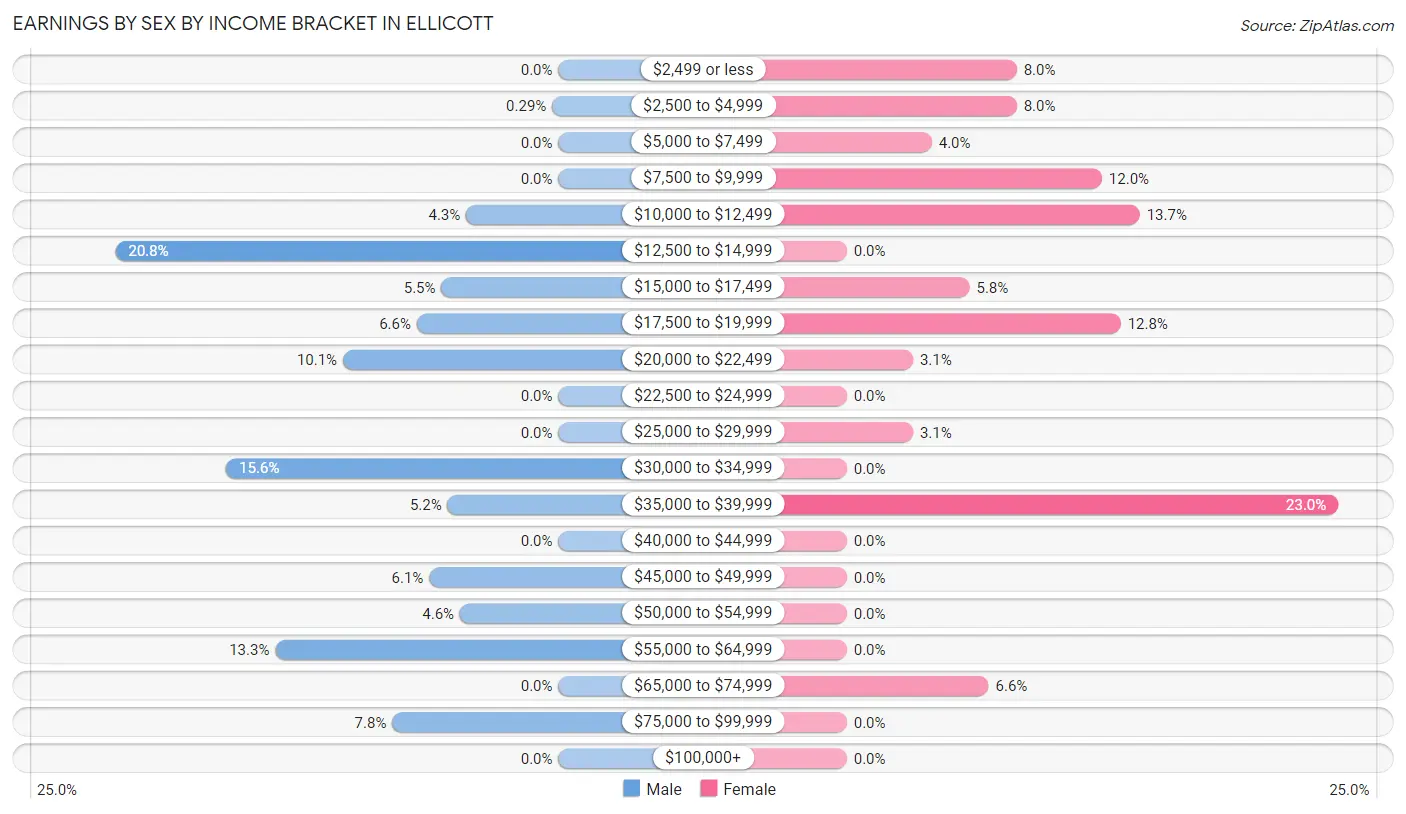
Earnings by Sex by Income Bracket in Ellicott
The most common earnings brackets in Ellicott are $12,500 to $14,999 for men (72 | 20.7%) and $35,000 to $39,999 for women (52 | 23.0%).
| Income | Male | Female |
| $2,499 or less | 0 (0.0%) | 18 (8.0%) |
| $2,500 to $4,999 | 1 (0.3%) | 18 (8.0%) |
| $5,000 to $7,499 | 0 (0.0%) | 9 (4.0%) |
| $7,500 to $9,999 | 0 (0.0%) | 27 (11.9%) |
| $10,000 to $12,499 | 15 (4.3%) | 31 (13.7%) |
| $12,500 to $14,999 | 72 (20.7%) | 0 (0.0%) |
| $15,000 to $17,499 | 19 (5.5%) | 13 (5.8%) |
| $17,500 to $19,999 | 23 (6.6%) | 29 (12.8%) |
| $20,000 to $22,499 | 35 (10.1%) | 7 (3.1%) |
| $22,500 to $24,999 | 0 (0.0%) | 0 (0.0%) |
| $25,000 to $29,999 | 0 (0.0%) | 7 (3.1%) |
| $30,000 to $34,999 | 54 (15.6%) | 0 (0.0%) |
| $35,000 to $39,999 | 18 (5.2%) | 52 (23.0%) |
| $40,000 to $44,999 | 0 (0.0%) | 0 (0.0%) |
| $45,000 to $49,999 | 21 (6.0%) | 0 (0.0%) |
| $50,000 to $54,999 | 16 (4.6%) | 0 (0.0%) |
| $55,000 to $64,999 | 46 (13.3%) | 0 (0.0%) |
| $65,000 to $74,999 | 0 (0.0%) | 15 (6.6%) |
| $75,000 to $99,999 | 27 (7.8%) | 0 (0.0%) |
| $100,000+ | 0 (0.0%) | 0 (0.0%) |
| Total | 347 (100.0%) | 226 (100.0%) |
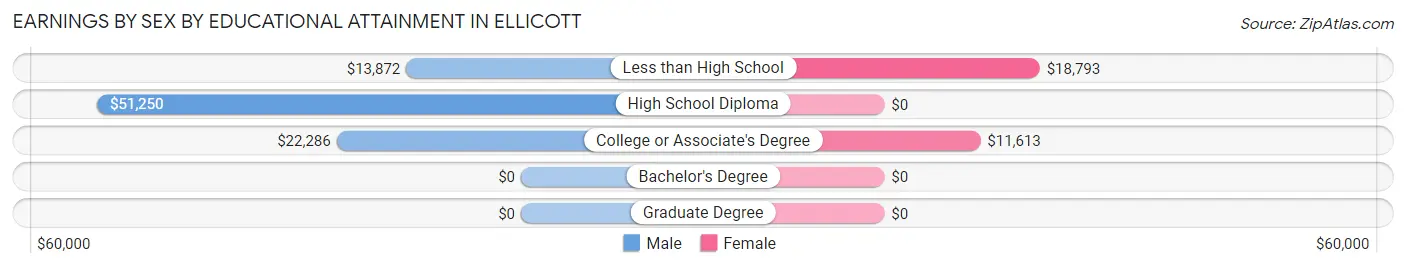
Earnings by Sex by Educational Attainment in Ellicott
Average earnings in Ellicott are $30,924 for men and $18,017 for women, a difference of 41.7%. Men with an educational attainment of high school diploma enjoy the highest average annual earnings of $51,250, while those with less than high school education earn the least with $13,872. Women with an educational attainment of less than high school earn the most with the average annual earnings of $18,793, while those with college or associate's degree education have the smallest earnings of $11,613.
| Educational Attainment | Male Income | Female Income |
| Less than High School | $13,872 | $18,793 |
| High School Diploma | $51,250 | $0 |
| College or Associate's Degree | $22,286 | $11,613 |
| Bachelor's Degree | - | - |
| Graduate Degree | - | - |
| Total | $30,924 | $18,017 |
Family Income in Ellicott
Family Income Brackets in Ellicott
According to the Ellicott family income data, there are 72 families falling into the $10,000 to $14,999 income range, which is the most common income bracket and makes up 21.3% of all families.
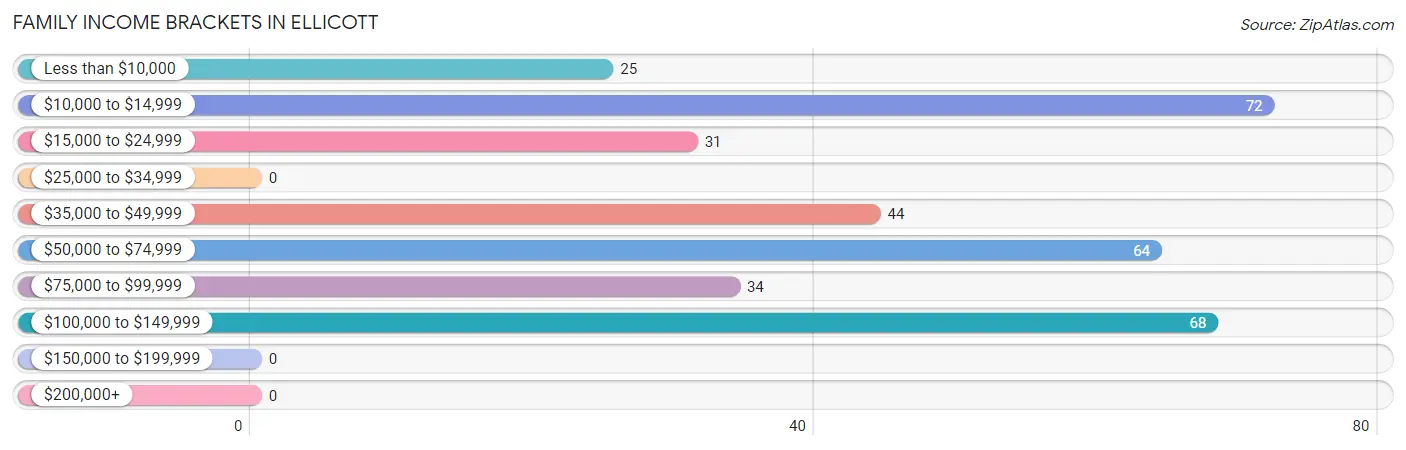
| Income Bracket | # Families | % Families |
| Less than $10,000 | 25 | 7.4% |
| $10,000 to $14,999 | 72 | 21.3% |
| $15,000 to $24,999 | 31 | 9.2% |
| $25,000 to $34,999 | 0 | 0.0% |
| $35,000 to $49,999 | 44 | 13.0% |
| $50,000 to $74,999 | 64 | 18.9% |
| $75,000 to $99,999 | 34 | 10.1% |
| $100,000 to $149,999 | 68 | 20.1% |
| $150,000 to $199,999 | 0 | 0.0% |
| $200,000+ | 0 | 0.0% |
Family Income by Famaliy Size in Ellicott
2-person families (56 | 16.6%) account for the highest median family income in Ellicott with $66,250 per family, while 2-person families (56 | 16.6%) have the highest median income of $33,125 per family member.
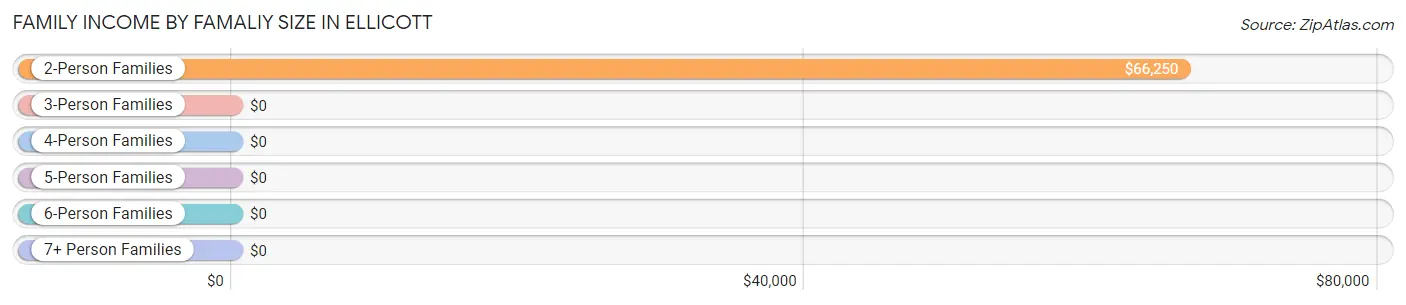
| Income Bracket | # Families | Median Income |
| 2-Person Families | 56 (16.6%) | $66,250 |
| 3-Person Families | 47 (13.9%) | $0 |
| 4-Person Families | 212 (62.7%) | $0 |
| 5-Person Families | 0 (0.0%) | $0 |
| 6-Person Families | 23 (6.8%) | $0 |
| 7+ Person Families | 0 (0.0%) | $0 |
| Total | 338 (100.0%) | $44,063 |
Family Income by Number of Earners in Ellicott
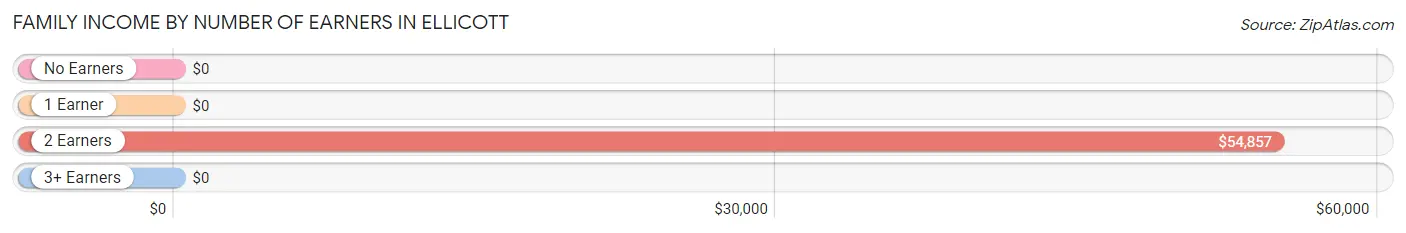
| Number of Earners | # Families | Median Income |
| No Earners | 22 (6.5%) | $0 |
| 1 Earner | 145 (42.9%) | $0 |
| 2 Earners | 110 (32.5%) | $54,857 |
| 3+ Earners | 61 (18.0%) | $0 |
| Total | 338 (100.0%) | $44,063 |
Household Income in Ellicott
Household Income Brackets in Ellicott
With 88 households falling in the category, the $10,000 to $14,999 income range is the most frequent in Ellicott, accounting for 24.2% of all households.
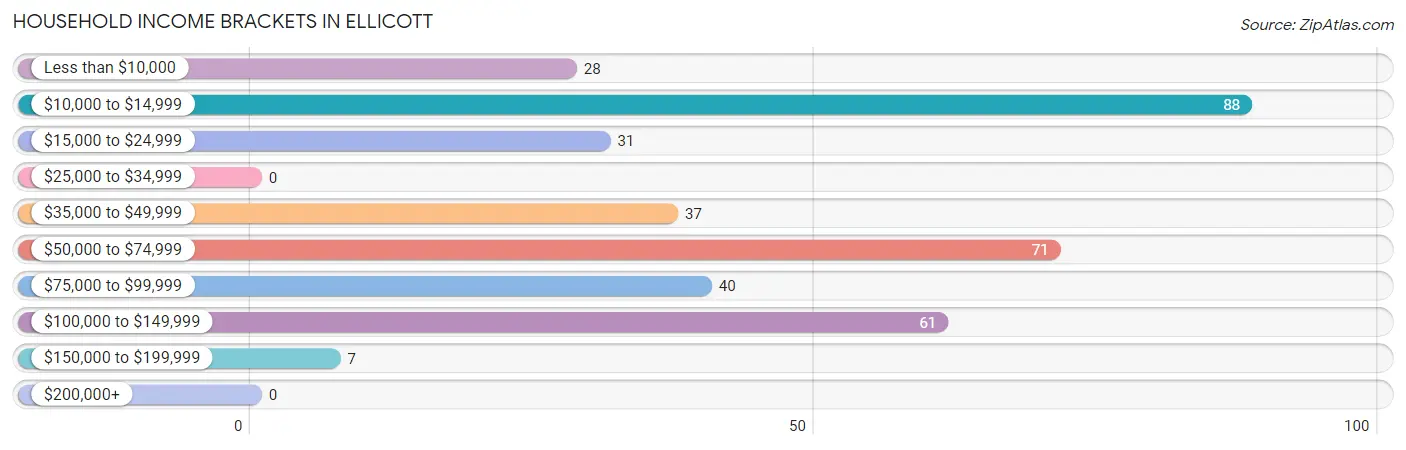
| Income Bracket | # Households | % Households |
| Less than $10,000 | 28 | 7.7% |
| $10,000 to $14,999 | 88 | 24.2% |
| $15,000 to $24,999 | 31 | 8.5% |
| $25,000 to $34,999 | 0 | 0.0% |
| $35,000 to $49,999 | 37 | 10.2% |
| $50,000 to $74,999 | 71 | 19.6% |
| $75,000 to $99,999 | 40 | 11.0% |
| $100,000 to $149,999 | 61 | 16.8% |
| $150,000 to $199,999 | 7 | 1.9% |
| $200,000+ | 0 | 0.0% |
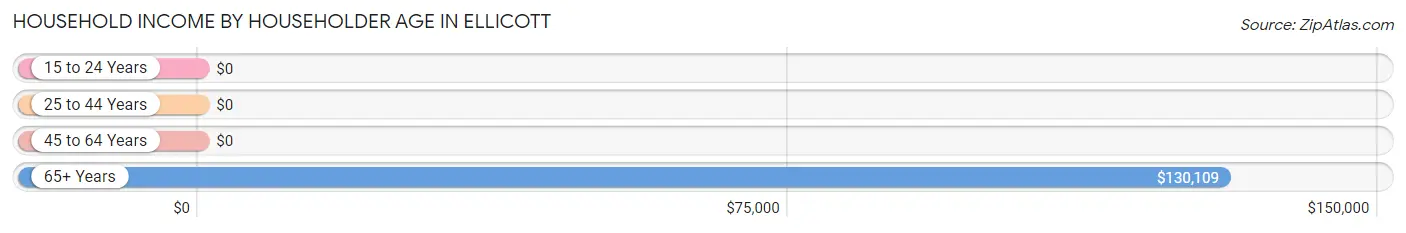
Household Income by Householder Age in Ellicott
The median household income in Ellicott is $44,219, with the highest median household income of $130,109 found in the 65+ years age bracket for the primary householder. A total of 62 households (17.1%) fall into this category. Meanwhile, the 15 to 24 years age bracket for the primary householder has the lowest median household income of $0, with 10 households (2.8%) in this group.
| Income Bracket | # Households | Median Income |
| 15 to 24 Years | 10 (2.8%) | $0 |
| 25 to 44 Years | 181 (49.9%) | $0 |
| 45 to 64 Years | 110 (30.3%) | $0 |
| 65+ Years | 62 (17.1%) | $130,109 |
| Total | 363 (100.0%) | $44,219 |
Poverty in Ellicott
Income Below Poverty by Sex and Age in Ellicott
With 33.9% poverty level for males and 48.3% for females among the residents of Ellicott, 6 to 11 year old males and under 5 year old females are the most vulnerable to poverty, with 115 males (83.9%) and 69 females (100.0%) in their respective age groups living below the poverty level.
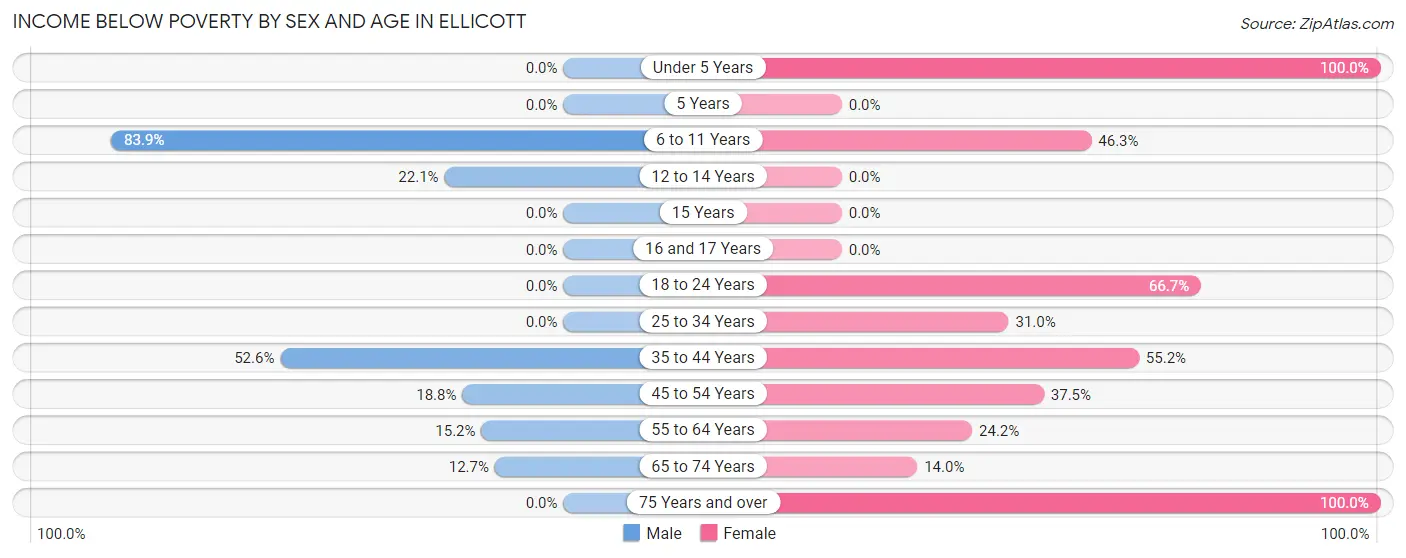
| Age Bracket | Male | Female |
| Under 5 Years | 0 (0.0%) | 69 (100.0%) |
| 5 Years | 0 (0.0%) | 0 (0.0%) |
| 6 to 11 Years | 115 (83.9%) | 44 (46.3%) |
| 12 to 14 Years | 17 (22.1%) | 0 (0.0%) |
| 15 Years | 0 (0.0%) | 0 (0.0%) |
| 16 and 17 Years | 0 (0.0%) | 0 (0.0%) |
| 18 to 24 Years | 0 (0.0%) | 18 (66.7%) |
| 25 to 34 Years | 0 (0.0%) | 13 (30.9%) |
| 35 to 44 Years | 72 (52.5%) | 91 (55.1%) |
| 45 to 54 Years | 9 (18.8%) | 21 (37.5%) |
| 55 to 64 Years | 7 (15.2%) | 15 (24.2%) |
| 65 to 74 Years | 7 (12.7%) | 7 (14.0%) |
| 75 Years and over | 0 (0.0%) | 1 (100.0%) |
| Total | 227 (33.9%) | 279 (48.3%) |
Income Above Poverty by Sex and Age in Ellicott
According to the poverty statistics in Ellicott, males aged under 5 years and females aged 16 and 17 years are the age groups that are most secure financially, with 100.0% of males and 100.0% of females in these age groups living above the poverty line.
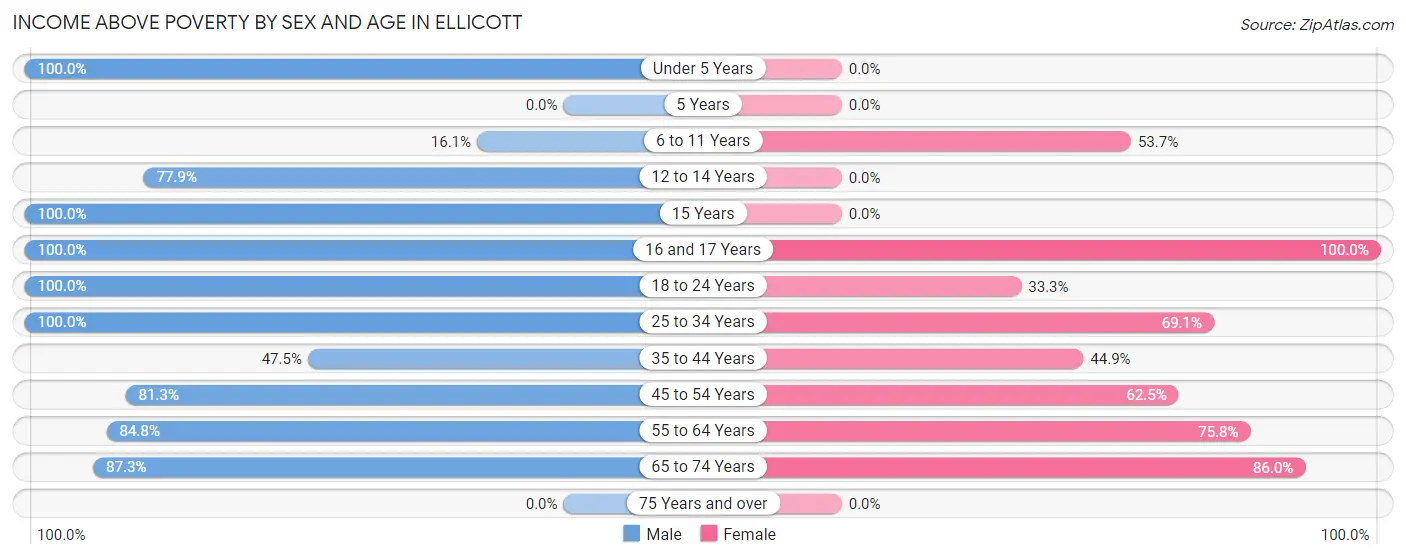
| Age Bracket | Male | Female |
| Under 5 Years | 11 (100.0%) | 0 (0.0%) |
| 5 Years | 0 (0.0%) | 0 (0.0%) |
| 6 to 11 Years | 22 (16.1%) | 51 (53.7%) |
| 12 to 14 Years | 60 (77.9%) | 0 (0.0%) |
| 15 Years | 36 (100.0%) | 0 (0.0%) |
| 16 and 17 Years | 8 (100.0%) | 10 (100.0%) |
| 18 to 24 Years | 38 (100.0%) | 9 (33.3%) |
| 25 to 34 Years | 77 (100.0%) | 29 (69.1%) |
| 35 to 44 Years | 65 (47.4%) | 74 (44.9%) |
| 45 to 54 Years | 39 (81.2%) | 35 (62.5%) |
| 55 to 64 Years | 39 (84.8%) | 47 (75.8%) |
| 65 to 74 Years | 48 (87.3%) | 43 (86.0%) |
| 75 Years and over | 0 (0.0%) | 0 (0.0%) |
| Total | 443 (66.1%) | 298 (51.6%) |
Income Below Poverty Among Married-Couple Families in Ellicott
The poverty statistics for married-couple families in Ellicott show that 29.0% or 83 of the total 286 families live below the poverty line. Families with 1 or 2 children have the highest poverty rate of 37.9%, comprising of 72 families. On the other hand, families with no children have the lowest poverty rate of 11.5%, which includes 11 families.
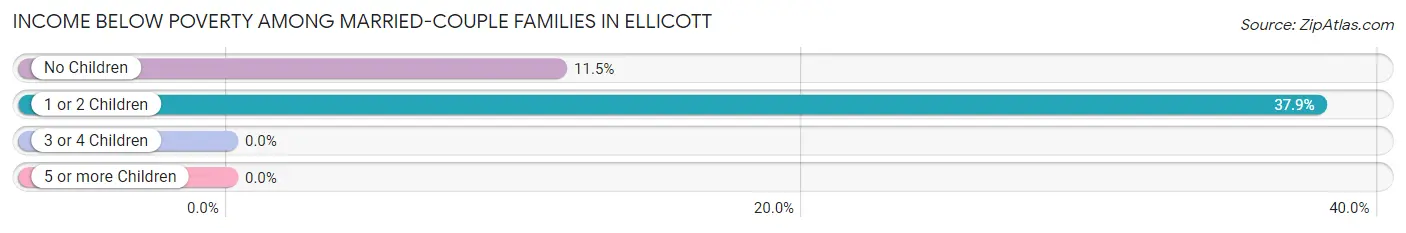
| Children | Above Poverty | Below Poverty |
| No Children | 85 (88.5%) | 11 (11.5%) |
| 1 or 2 Children | 118 (62.1%) | 72 (37.9%) |
| 3 or 4 Children | 0 (0.0%) | 0 (0.0%) |
| 5 or more Children | 0 (0.0%) | 0 (0.0%) |
| Total | 203 (71.0%) | 83 (29.0%) |
Income Below Poverty Among Single-Parent Households in Ellicott
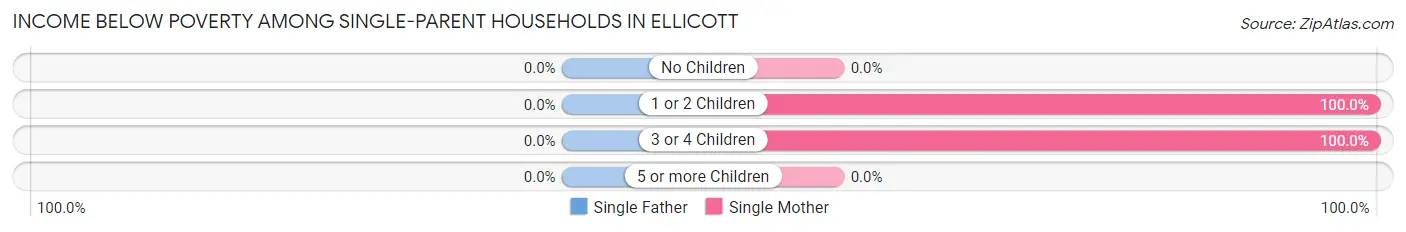
| Children | Single Father | Single Mother |
| No Children | 0 (0.0%) | 0 (0.0%) |
| 1 or 2 Children | 0 (0.0%) | 18 (100.0%) |
| 3 or 4 Children | 0 (0.0%) | 27 (100.0%) |
| 5 or more Children | 0 (0.0%) | 0 (0.0%) |
| Total | 0 (0.0%) | 45 (86.5%) |
Income Below Poverty Among Married-Couple vs Single-Parent Households in Ellicott
The poverty data for Ellicott shows that 83 of the married-couple family households (29.0%) and 45 of the single-parent households (86.5%) are living below the poverty level. Within the married-couple family households, those with 1 or 2 children have the highest poverty rate, with 72 households (37.9%) falling below the poverty line. Among the single-parent households, those with 1 or 2 children have the highest poverty rate, with 18 household (100.0%) living below poverty.
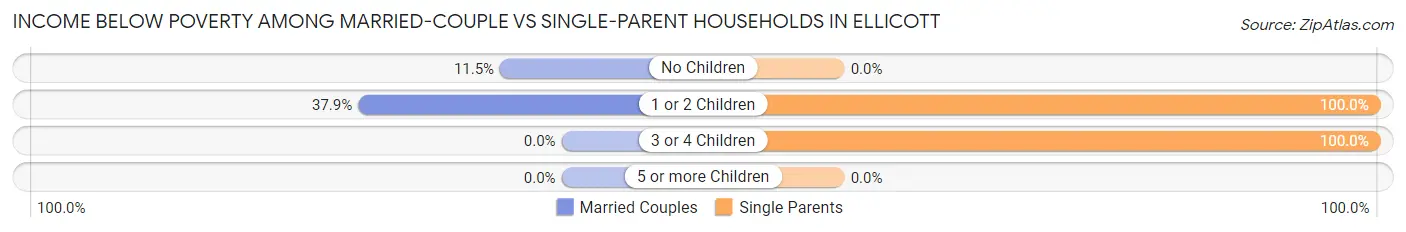
| Children | Married-Couple Families | Single-Parent Households |
| No Children | 11 (11.5%) | 0 (0.0%) |
| 1 or 2 Children | 72 (37.9%) | 18 (100.0%) |
| 3 or 4 Children | 0 (0.0%) | 27 (100.0%) |
| 5 or more Children | 0 (0.0%) | 0 (0.0%) |
| Total | 83 (29.0%) | 45 (86.5%) |
Race in Ellicott
The most populous races in Ellicott are White / Caucasian (809 | 64.9%), Hispanic or Latino (667 | 53.5%), and Two or more Races (351 | 28.1%).
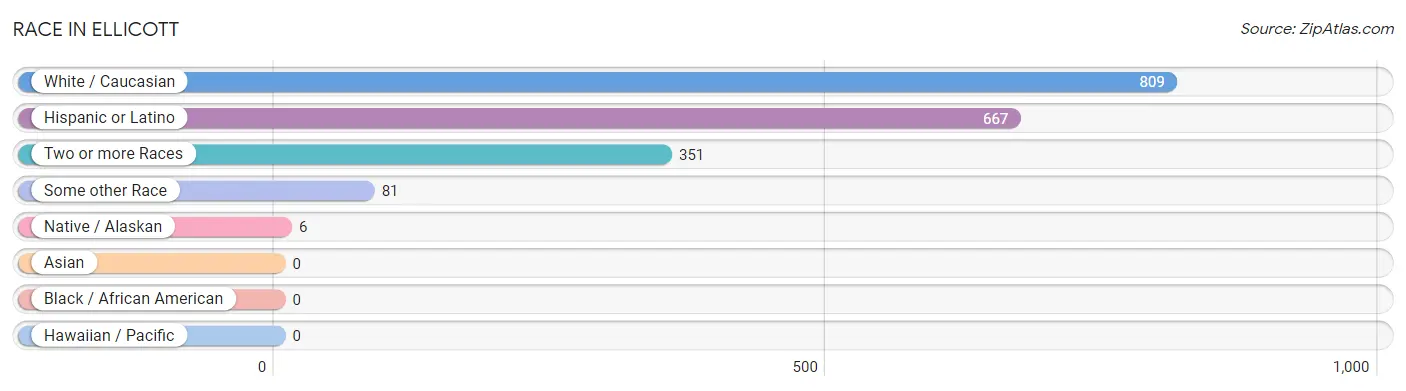
| Race | # Population | % Population |
| Asian | 0 | 0.0% |
| Black / African American | 0 | 0.0% |
| Hawaiian / Pacific | 0 | 0.0% |
| Hispanic or Latino | 667 | 53.5% |
| Native / Alaskan | 6 | 0.5% |
| White / Caucasian | 809 | 64.9% |
| Two or more Races | 351 | 28.1% |
| Some other Race | 81 | 6.5% |
| Total | 1,247 | 100.0% |
Ancestry in Ellicott
The most populous ancestries reported in Ellicott are Mexican (536 | 43.0%), Irish (152 | 12.2%), German (127 | 10.2%), American (61 | 4.9%), and French (36 | 2.9%), together accounting for 73.1% of all Ellicott residents.
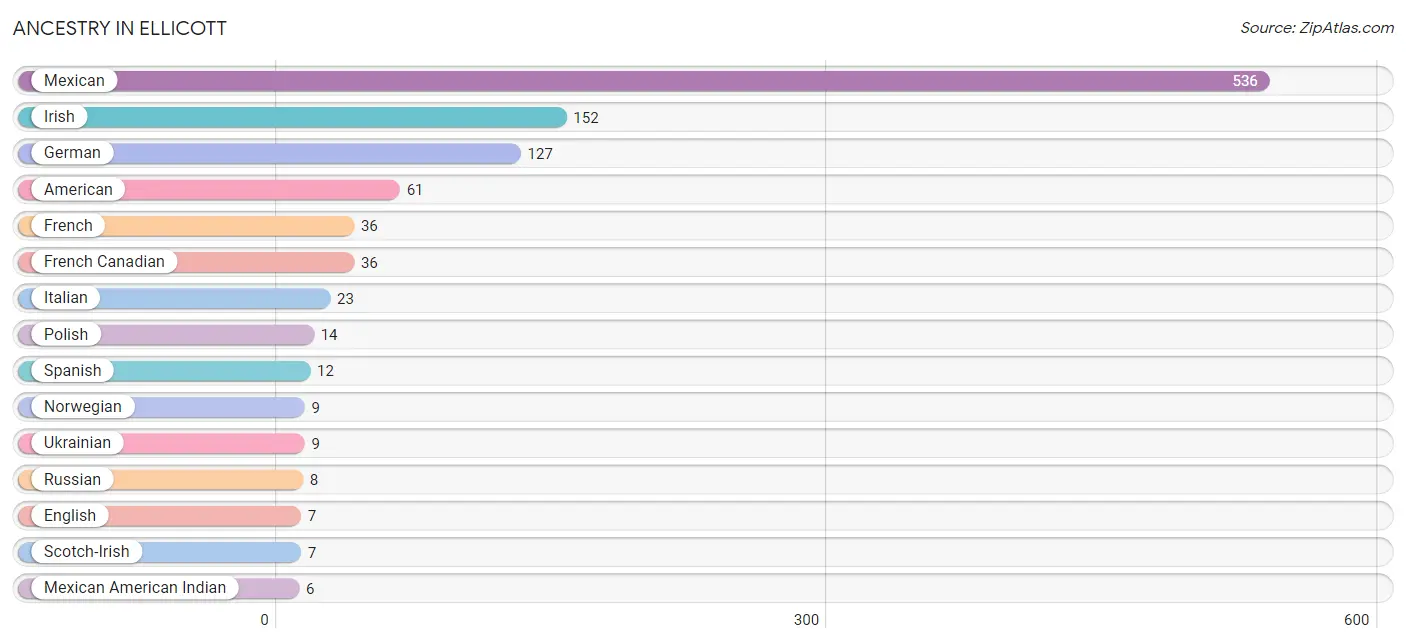
| Ancestry | # Population | % Population |
| American | 61 | 4.9% |
| English | 7 | 0.6% |
| French | 36 | 2.9% |
| French Canadian | 36 | 2.9% |
| German | 127 | 10.2% |
| Irish | 152 | 12.2% |
| Italian | 23 | 1.8% |
| Mexican | 536 | 43.0% |
| Mexican American Indian | 6 | 0.5% |
| Norwegian | 9 | 0.7% |
| Polish | 14 | 1.1% |
| Russian | 8 | 0.6% |
| Scotch-Irish | 7 | 0.6% |
| Spanish | 12 | 1.0% |
| Ukrainian | 9 | 0.7% | View All 15 Rows |
Immigrants in Ellicott
The most numerous immigrant groups reported in Ellicott came from Central America (214 | 17.2%), Latin America (214 | 17.2%), and Mexico (214 | 17.2%), together accounting for 51.5% of all Ellicott residents.
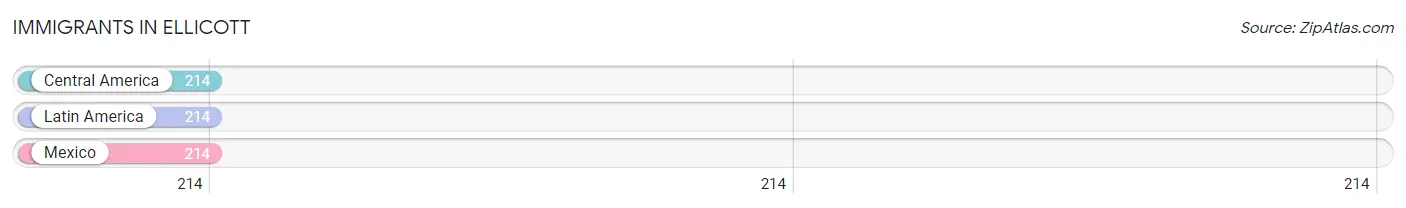
| Immigration Origin | # Population | % Population |
| Central America | 214 | 17.2% |
| Latin America | 214 | 17.2% |
| Mexico | 214 | 17.2% | View All 3 Rows |
Sex and Age in Ellicott
Sex and Age in Ellicott
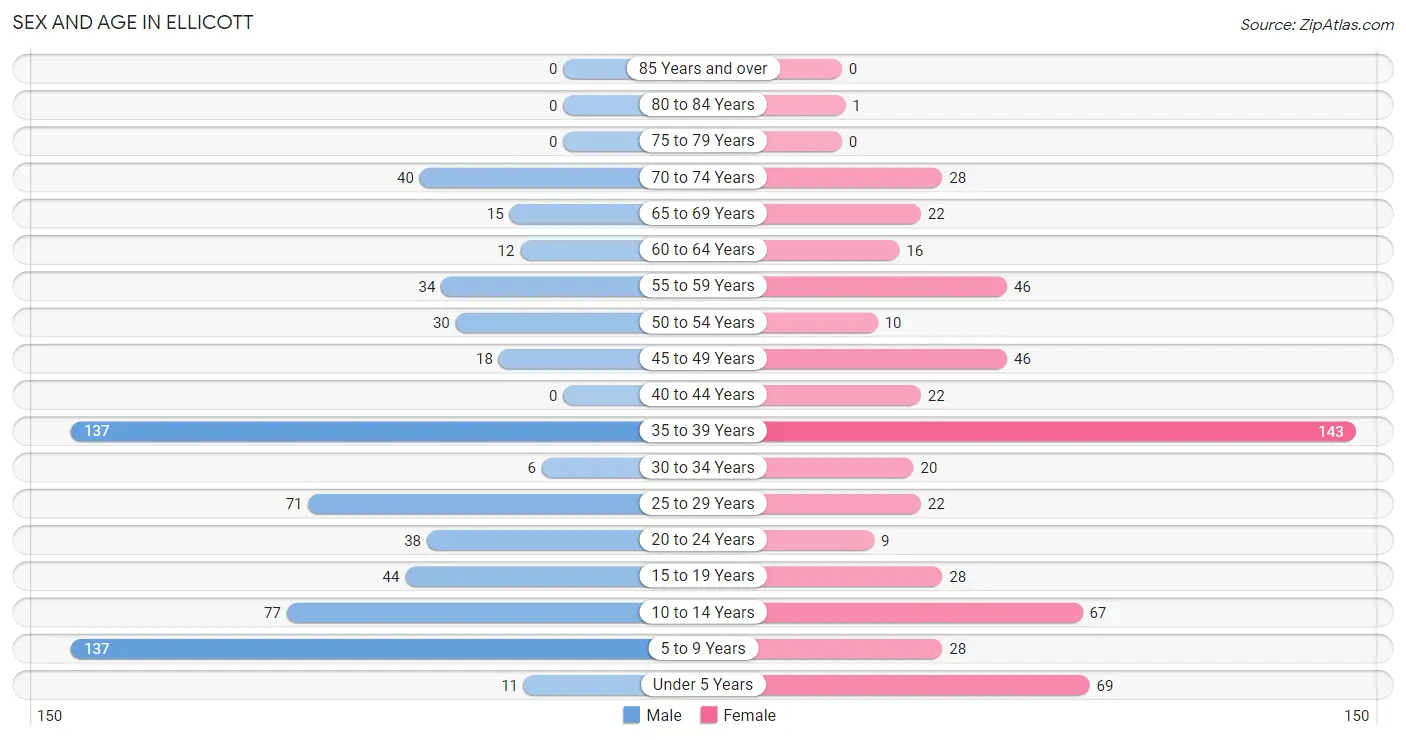
The most populous age groups in Ellicott are 5 to 9 Years (137 | 20.4%) for men and 35 to 39 Years (143 | 24.8%) for women.
| Age Bracket | Male | Female |
| Under 5 Years | 11 (1.6%) | 69 (12.0%) |
| 5 to 9 Years | 137 (20.4%) | 28 (4.9%) |
| 10 to 14 Years | 77 (11.5%) | 67 (11.6%) |
| 15 to 19 Years | 44 (6.6%) | 28 (4.9%) |
| 20 to 24 Years | 38 (5.7%) | 9 (1.6%) |
| 25 to 29 Years | 71 (10.6%) | 22 (3.8%) |
| 30 to 34 Years | 6 (0.9%) | 20 (3.5%) |
| 35 to 39 Years | 137 (20.4%) | 143 (24.8%) |
| 40 to 44 Years | 0 (0.0%) | 22 (3.8%) |
| 45 to 49 Years | 18 (2.7%) | 46 (8.0%) |
| 50 to 54 Years | 30 (4.5%) | 10 (1.7%) |
| 55 to 59 Years | 34 (5.1%) | 46 (8.0%) |
| 60 to 64 Years | 12 (1.8%) | 16 (2.8%) |
| 65 to 69 Years | 15 (2.2%) | 22 (3.8%) |
| 70 to 74 Years | 40 (6.0%) | 28 (4.9%) |
| 75 to 79 Years | 0 (0.0%) | 0 (0.0%) |
| 80 to 84 Years | 0 (0.0%) | 1 (0.2%) |
| 85 Years and over | 0 (0.0%) | 0 (0.0%) |
| Total | 670 (100.0%) | 577 (100.0%) |
Families and Households in Ellicott
Median Family Size in Ellicott
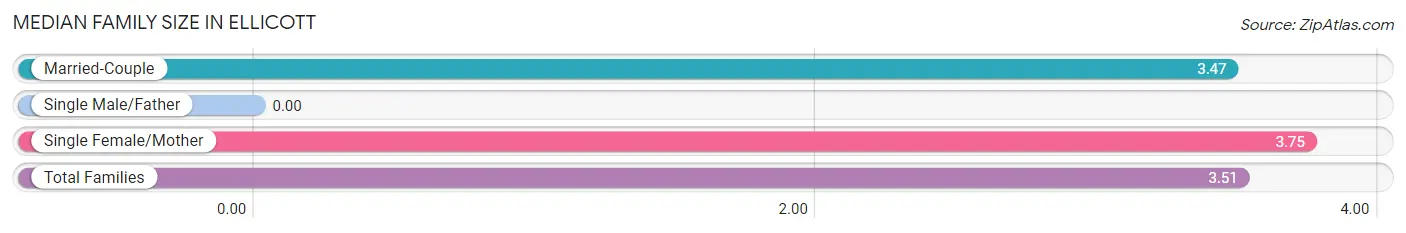
| Family Type | # Families | Family Size |
| Married-Couple | 286 (84.6%) | 3.47 |
| Single Male/Father | 0 (0.0%) | - |
| Single Female/Mother | 52 (15.4%) | 3.75 |
| Total Families | 338 (100.0%) | 3.51 |
Median Household Size in Ellicott
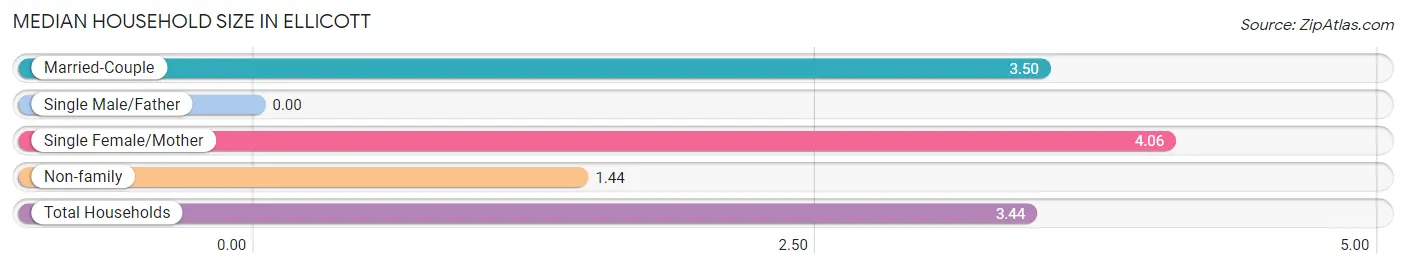
| Household Type | # Households | Household Size |
| Married-Couple | 286 (78.8%) | 3.50 |
| Single Male/Father | 0 (0.0%) | - |
| Single Female/Mother | 52 (14.3%) | 4.06 |
| Non-family | 25 (6.9%) | 1.44 |
| Total Households | 363 (100.0%) | 3.44 |
Household Size by Marriage Status in Ellicott
Out of a total of 363 households in Ellicott, 338 (93.1%) are family households, while 25 (6.9%) are nonfamily households. The most numerous type of family households are 4-person households, comprising 226, and the most common type of nonfamily households are 2-person households, comprising 13.
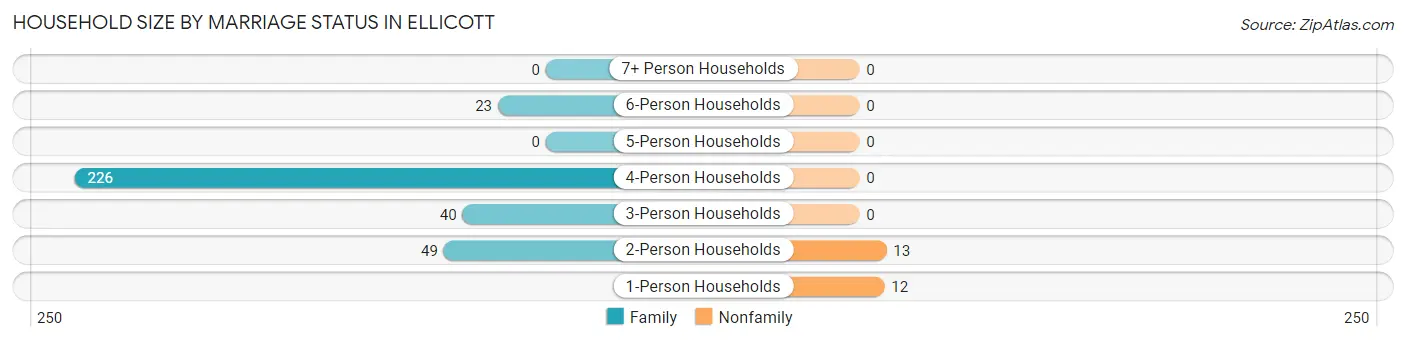
| Household Size | Family Households | Nonfamily Households |
| 1-Person Households | - | 12 (3.3%) |
| 2-Person Households | 49 (13.5%) | 13 (3.6%) |
| 3-Person Households | 40 (11.0%) | 0 (0.0%) |
| 4-Person Households | 226 (62.3%) | 0 (0.0%) |
| 5-Person Households | 0 (0.0%) | 0 (0.0%) |
| 6-Person Households | 23 (6.3%) | 0 (0.0%) |
| 7+ Person Households | 0 (0.0%) | 0 (0.0%) |
| Total | 338 (93.1%) | 25 (6.9%) |
Female Fertility in Ellicott
Fertility by Age in Ellicott
Average fertility rate in Ellicott is 307.0 births per 1,000 women. Women in the age bracket of 35 to 50 years have the highest fertility rate with 422.0 births per 1,000 women. Women in the age bracket of 35 to 50 years acount for 100.0% of all women with births.
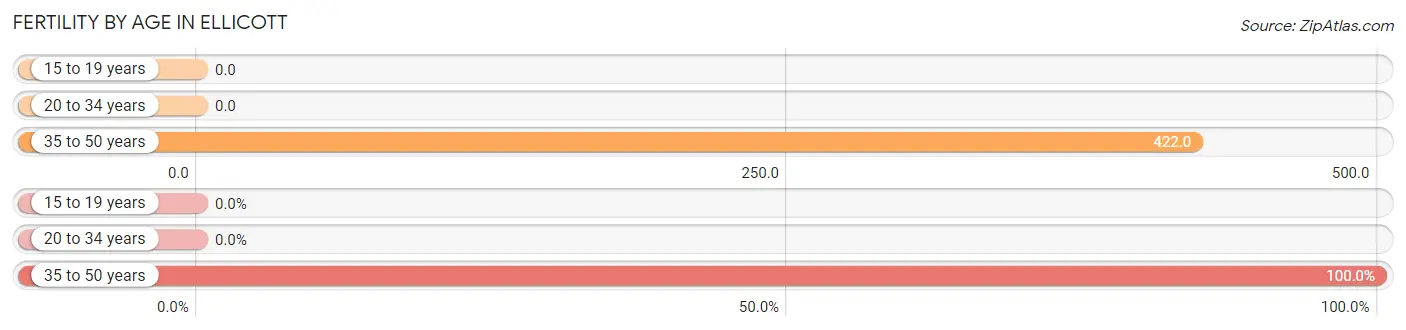
| Age Bracket | Women with Births | Births / 1,000 Women |
| 15 to 19 years | 0 (0.0%) | 0.0 |
| 20 to 34 years | 0 (0.0%) | 0.0 |
| 35 to 50 years | 89 (100.0%) | 422.0 |
| Total | 89 (100.0%) | 307.0 |
Fertility by Age by Marriage Status in Ellicott
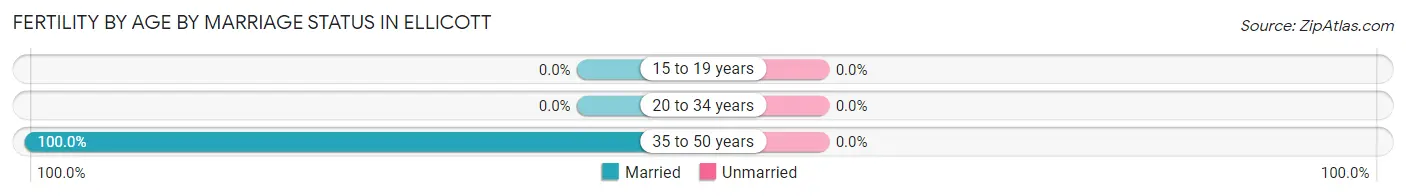
| Age Bracket | Married | Unmarried |
| 15 to 19 years | 0 (0.0%) | 0 (0.0%) |
| 20 to 34 years | 0 (0.0%) | 0 (0.0%) |
| 35 to 50 years | 89 (100.0%) | 0 (0.0%) |
| Total | 89 (100.0%) | 0 (0.0%) |
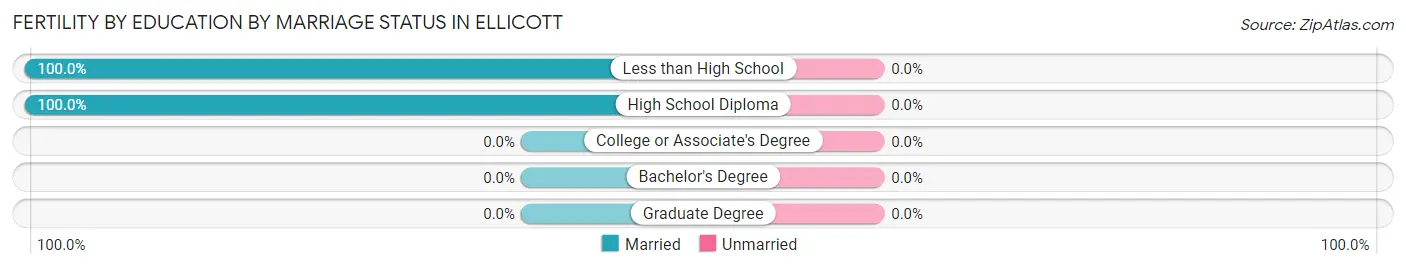
Fertility by Education in Ellicott
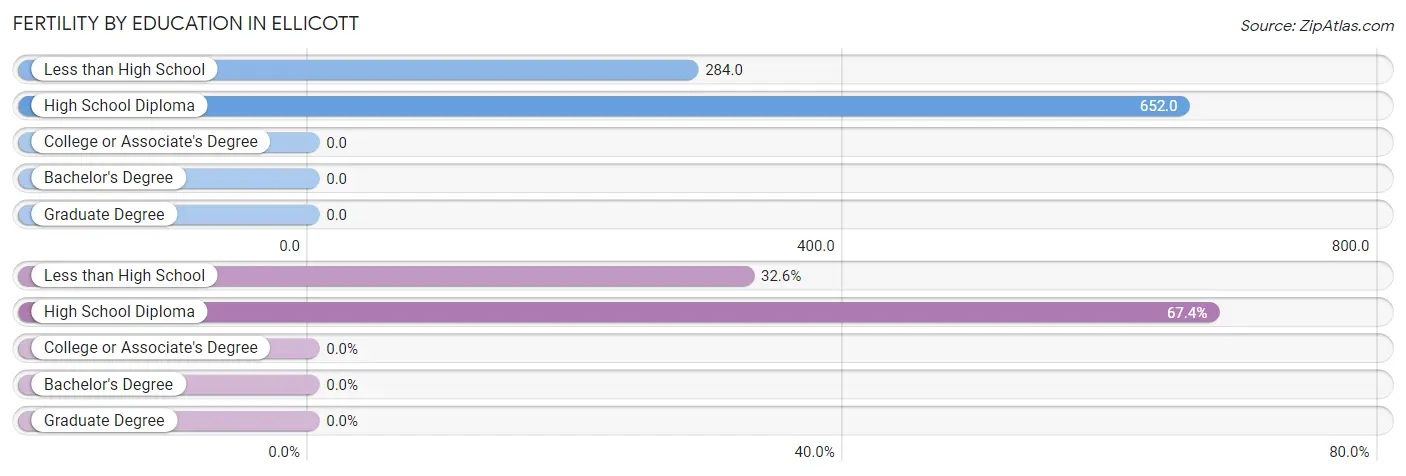
| Educational Attainment | Women with Births | Births / 1,000 Women |
| Less than High School | 29 (32.6%) | 284.0 |
| High School Diploma | 60 (67.4%) | 652.0 |
| College or Associate's Degree | 0 (0.0%) | 0.0 |
| Bachelor's Degree | 0 (0.0%) | 0.0 |
| Graduate Degree | 0 (0.0%) | 0.0 |
| Total | 89 (100.0%) | 307.0 |
Fertility by Education by Marriage Status in Ellicott
| Educational Attainment | Married | Unmarried |
| Less than High School | 29 (100.0%) | 0 (0.0%) |
| High School Diploma | 60 (100.0%) | 0 (0.0%) |
| College or Associate's Degree | 0 (0.0%) | 0 (0.0%) |
| Bachelor's Degree | 0 (0.0%) | 0 (0.0%) |
| Graduate Degree | 0 (0.0%) | 0 (0.0%) |
| Total | 89 (100.0%) | 0 (0.0%) |
Employment Characteristics in Ellicott
Employment by Class of Employer in Ellicott
Among the 526 employed individuals in Ellicott, private company employees (229 | 43.5%), self-employed (not incorporated) (160 | 30.4%), and local government employees (72 | 13.7%) make up the most common classes of employment.
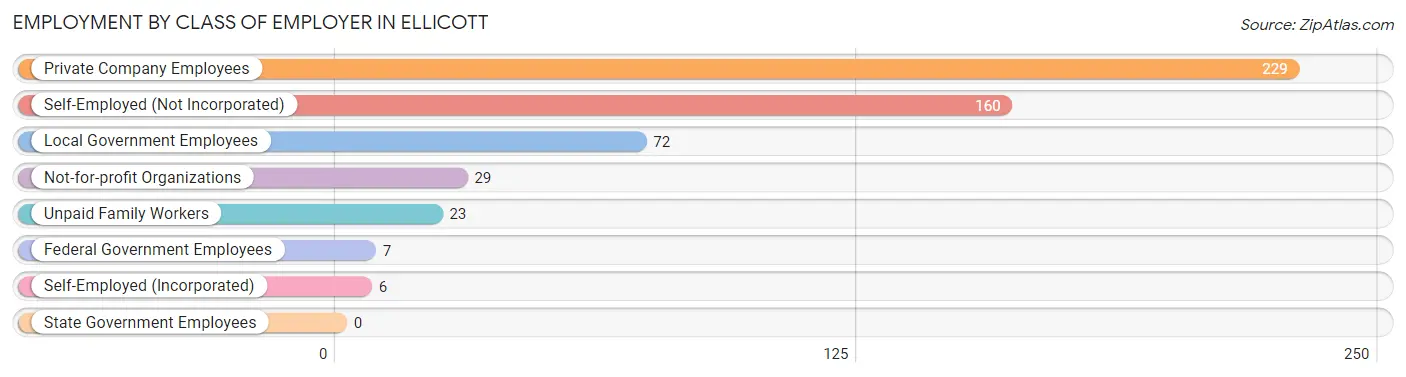
| Employer Class | # Employees | % Employees |
| Private Company Employees | 229 | 43.5% |
| Self-Employed (Incorporated) | 6 | 1.1% |
| Self-Employed (Not Incorporated) | 160 | 30.4% |
| Not-for-profit Organizations | 29 | 5.5% |
| Local Government Employees | 72 | 13.7% |
| State Government Employees | 0 | 0.0% |
| Federal Government Employees | 7 | 1.3% |
| Unpaid Family Workers | 23 | 4.4% |
| Total | 526 | 100.0% |
Employment Status by Age in Ellicott
According to the labor force statistics for Ellicott, out of the total population over 16 years of age (822), 67.4% or 554 individuals are in the labor force, with 1.3% or 7 of them unemployed. The age group with the highest labor force participation rate is 25 to 29 years, with 100.0% or 93 individuals in the labor force. Within the labor force, the 30 to 34 years age range has the highest percentage of unemployed individuals, with 53.8% or 7 of them being unemployed.
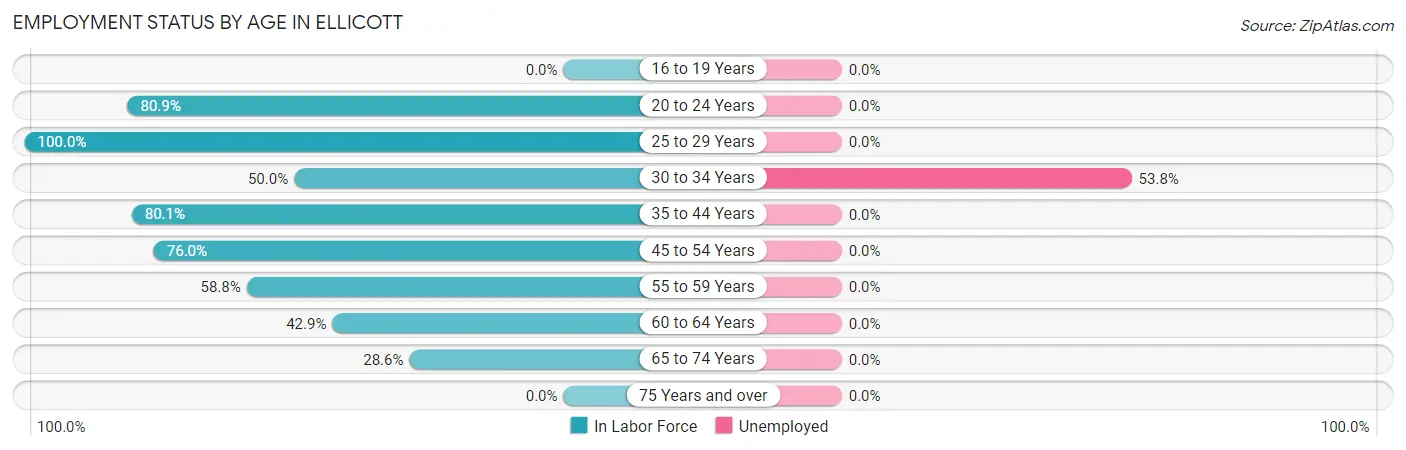
| Age Bracket | In Labor Force | Unemployed |
| 16 to 19 Years | 0 (0.0%) | 0 (0.0%) |
| 20 to 24 Years | 38 (80.9%) | 0 (0.0%) |
| 25 to 29 Years | 93 (100.0%) | 0 (0.0%) |
| 30 to 34 Years | 13 (50.0%) | 7 (53.8%) |
| 35 to 44 Years | 242 (80.1%) | 0 (0.0%) |
| 45 to 54 Years | 79 (76.0%) | 0 (0.0%) |
| 55 to 59 Years | 47 (58.8%) | 0 (0.0%) |
| 60 to 64 Years | 12 (42.9%) | 0 (0.0%) |
| 65 to 74 Years | 30 (28.6%) | 0 (0.0%) |
| 75 Years and over | 0 (0.0%) | 0 (0.0%) |
| Total | 554 (67.4%) | 7 (1.3%) |
Employment Status by Educational Attainment in Ellicott
According to labor force statistics for Ellicott, 76.8% of individuals (486) out of the total population between 25 and 64 years of age (633) are in the labor force, with 1.4% or 7 of them being unemployed. The group with the highest labor force participation rate are those with the educational attainment of less than high school, with 100.0% or 162 individuals in the labor force. Within the labor force, individuals with bachelor's degree or higher education have the highest percentage of unemployment, with 23.3% or 7 of them being unemployed.
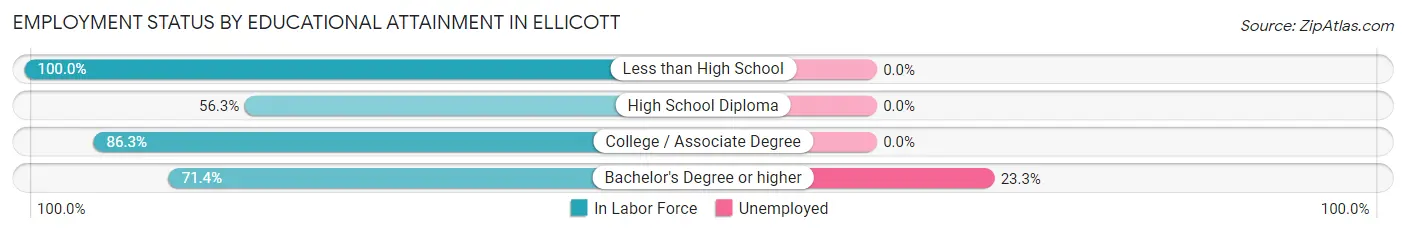
| Educational Attainment | In Labor Force | Unemployed |
| Less than High School | 162 (100.0%) | 0 (0.0%) |
| High School Diploma | 143 (56.3%) | 0 (0.0%) |
| College / Associate Degree | 151 (86.3%) | 0 (0.0%) |
| Bachelor's Degree or higher | 30 (71.4%) | 10 (23.3%) |
| Total | 486 (76.8%) | 9 (1.4%) |
Employment Occupations by Sex in Ellicott
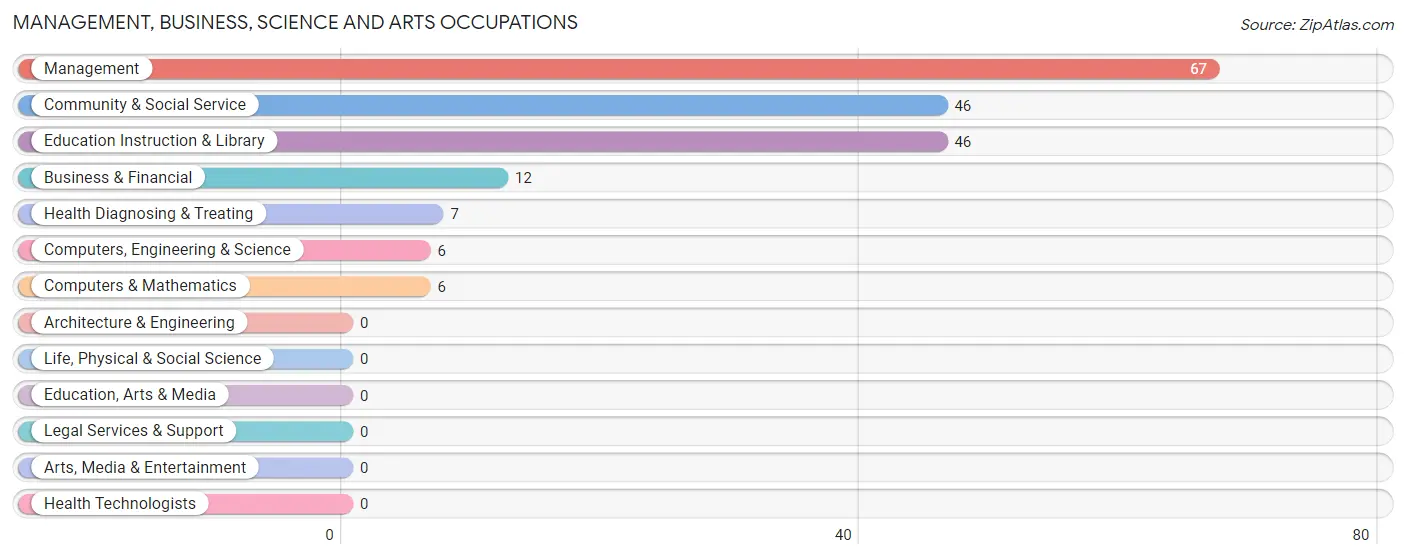
Management, Business, Science and Arts Occupations
The most common Management, Business, Science and Arts occupations in Ellicott are Management (67 | 12.2%), Community & Social Service (46 | 8.4%), Education Instruction & Library (46 | 8.4%), Business & Financial (12 | 2.2%), and Health Diagnosing & Treating (7 | 1.3%).
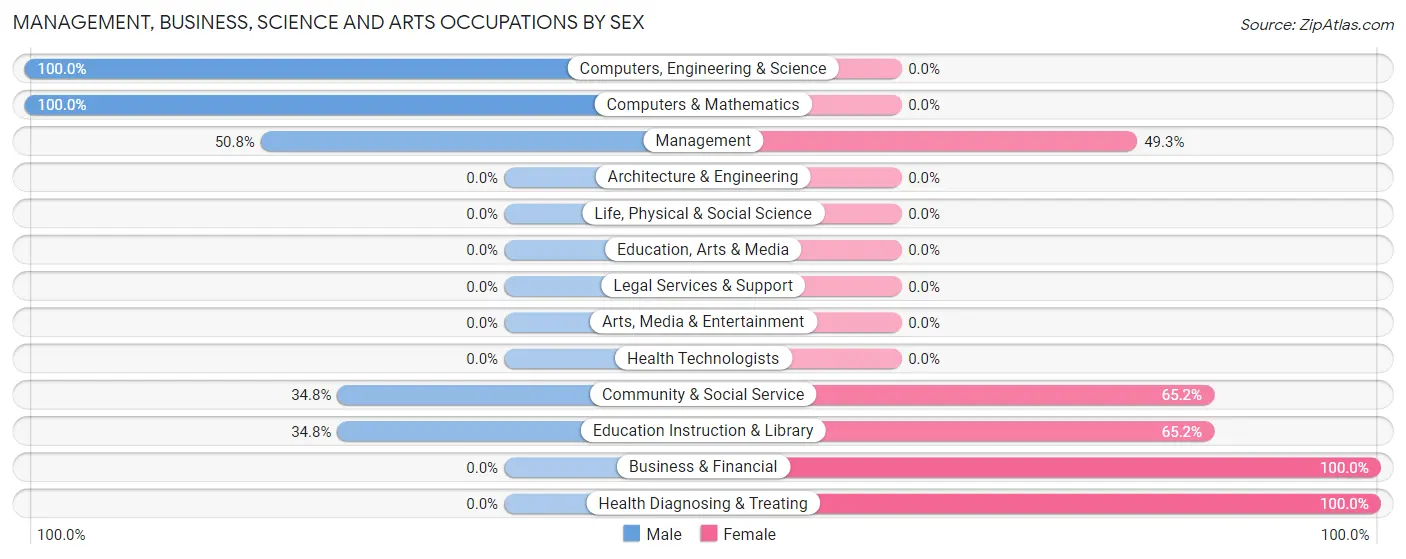
Management, Business, Science and Arts Occupations by Sex
Within the Management, Business, Science and Arts occupations in Ellicott, the most male-oriented occupations are Computers, Engineering & Science (100.0%), Computers & Mathematics (100.0%), and Management (50.7%), while the most female-oriented occupations are Business & Financial (100.0%), Health Diagnosing & Treating (100.0%), and Community & Social Service (65.2%).
| Occupation | Male | Female |
| Management | 34 (50.7%) | 33 (49.2%) |
| Business & Financial | 0 (0.0%) | 12 (100.0%) |
| Computers, Engineering & Science | 6 (100.0%) | 0 (0.0%) |
| Computers & Mathematics | 6 (100.0%) | 0 (0.0%) |
| Architecture & Engineering | 0 (0.0%) | 0 (0.0%) |
| Life, Physical & Social Science | 0 (0.0%) | 0 (0.0%) |
| Community & Social Service | 16 (34.8%) | 30 (65.2%) |
| Education, Arts & Media | 0 (0.0%) | 0 (0.0%) |
| Legal Services & Support | 0 (0.0%) | 0 (0.0%) |
| Education Instruction & Library | 16 (34.8%) | 30 (65.2%) |
| Arts, Media & Entertainment | 0 (0.0%) | 0 (0.0%) |
| Health Diagnosing & Treating | 0 (0.0%) | 7 (100.0%) |
| Health Technologists | 0 (0.0%) | 0 (0.0%) |
| Total (Category) | 56 (40.6%) | 82 (59.4%) |
| Total (Overall) | 339 (62.0%) | 208 (38.0%) |
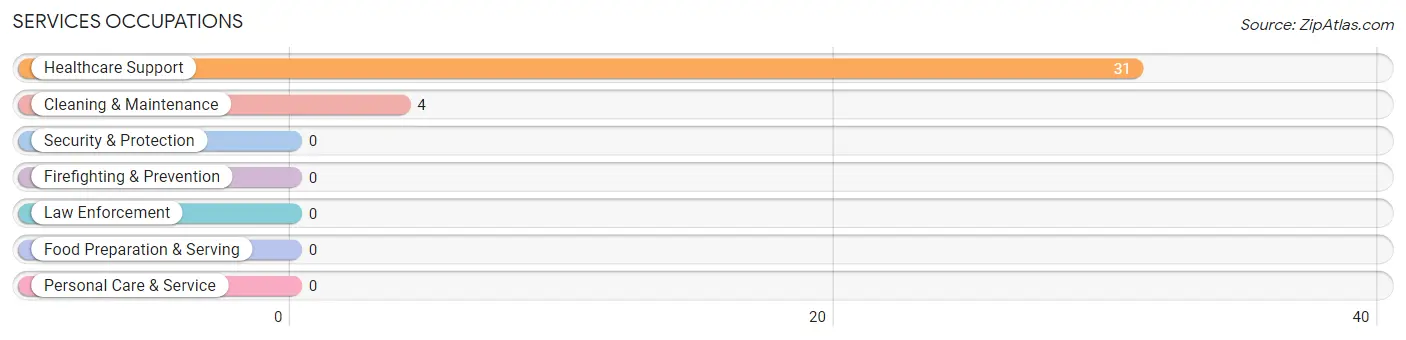
Services Occupations
The most common Services occupations in Ellicott are Healthcare Support (31 | 5.7%), and Cleaning & Maintenance (4 | 0.7%).
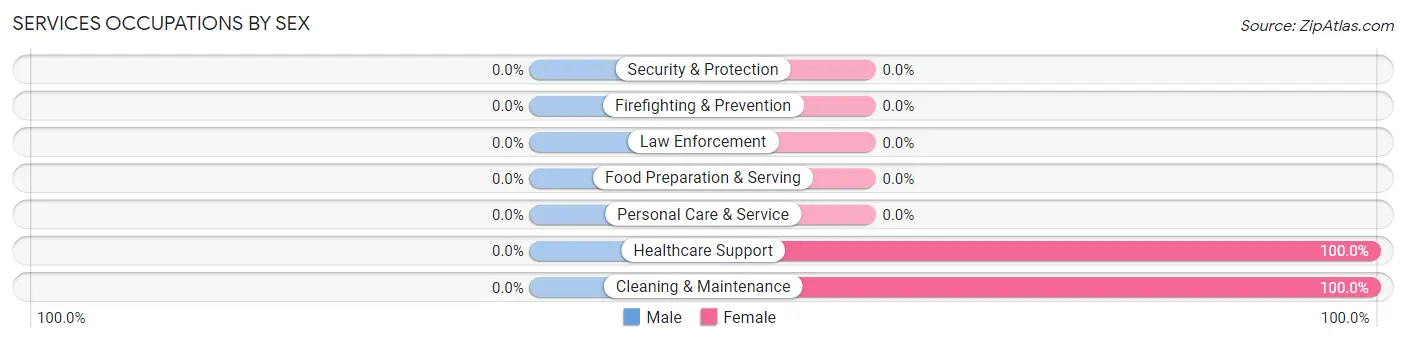
Services Occupations by Sex
| Occupation | Male | Female |
| Healthcare Support | 0 (0.0%) | 31 (100.0%) |
| Security & Protection | 0 (0.0%) | 0 (0.0%) |
| Firefighting & Prevention | 0 (0.0%) | 0 (0.0%) |
| Law Enforcement | 0 (0.0%) | 0 (0.0%) |
| Food Preparation & Serving | 0 (0.0%) | 0 (0.0%) |
| Cleaning & Maintenance | 0 (0.0%) | 4 (100.0%) |
| Personal Care & Service | 0 (0.0%) | 0 (0.0%) |
| Total (Category) | 0 (0.0%) | 35 (100.0%) |
| Total (Overall) | 339 (62.0%) | 208 (38.0%) |
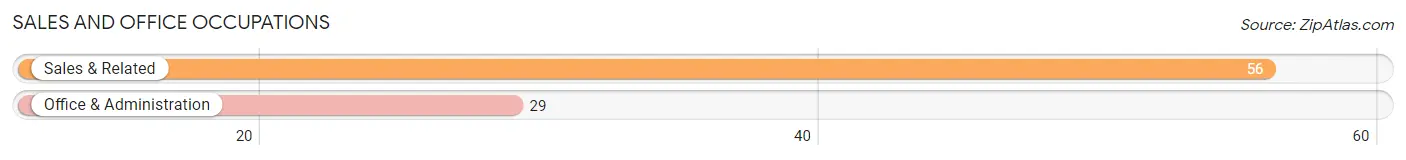
Sales and Office Occupations
The most common Sales and Office occupations in Ellicott are Sales & Related (56 | 10.2%), and Office & Administration (29 | 5.3%).
Sales and Office Occupations by Sex
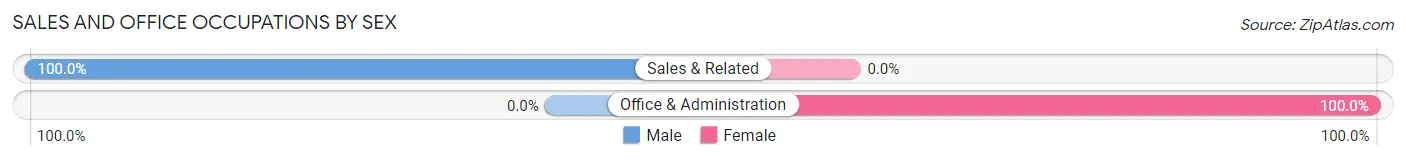
| Occupation | Male | Female |
| Sales & Related | 56 (100.0%) | 0 (0.0%) |
| Office & Administration | 0 (0.0%) | 29 (100.0%) |
| Total (Category) | 56 (65.9%) | 29 (34.1%) |
| Total (Overall) | 339 (62.0%) | 208 (38.0%) |
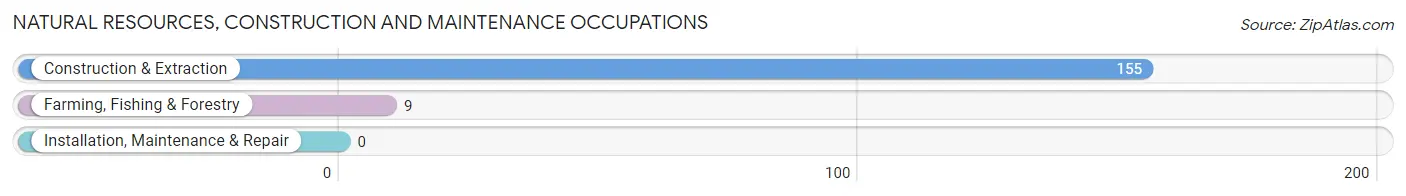
Natural Resources, Construction and Maintenance Occupations
The most common Natural Resources, Construction and Maintenance occupations in Ellicott are Construction & Extraction (155 | 28.3%), and Farming, Fishing & Forestry (9 | 1.7%).
Natural Resources, Construction and Maintenance Occupations by Sex
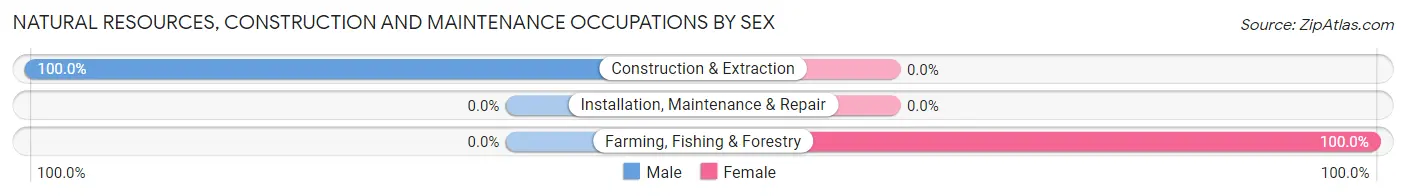
| Occupation | Male | Female |
| Farming, Fishing & Forestry | 0 (0.0%) | 9 (100.0%) |
| Construction & Extraction | 155 (100.0%) | 0 (0.0%) |
| Installation, Maintenance & Repair | 0 (0.0%) | 0 (0.0%) |
| Total (Category) | 155 (94.5%) | 9 (5.5%) |
| Total (Overall) | 339 (62.0%) | 208 (38.0%) |
Production, Transportation and Moving Occupations
The most common Production, Transportation and Moving occupations in Ellicott are Transportation (109 | 19.9%), Production (9 | 1.7%), and Material Moving (7 | 1.3%).
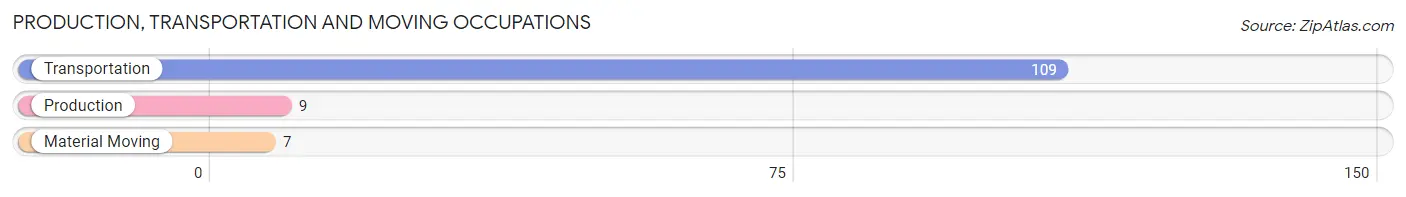
Production, Transportation and Moving Occupations by Sex
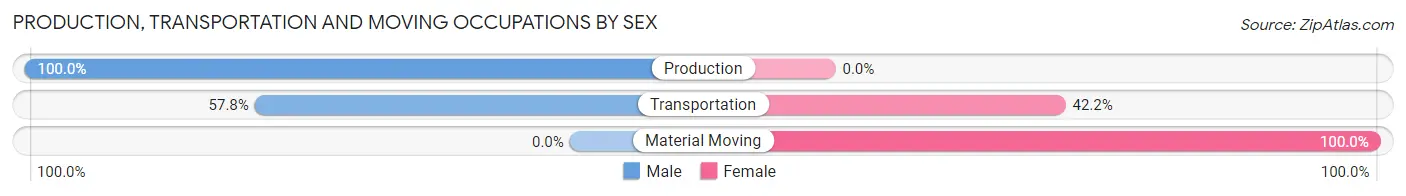
| Occupation | Male | Female |
| Production | 9 (100.0%) | 0 (0.0%) |
| Transportation | 63 (57.8%) | 46 (42.2%) |
| Material Moving | 0 (0.0%) | 7 (100.0%) |
| Total (Category) | 72 (57.6%) | 53 (42.4%) |
| Total (Overall) | 339 (62.0%) | 208 (38.0%) |
Employment Industries by Sex in Ellicott
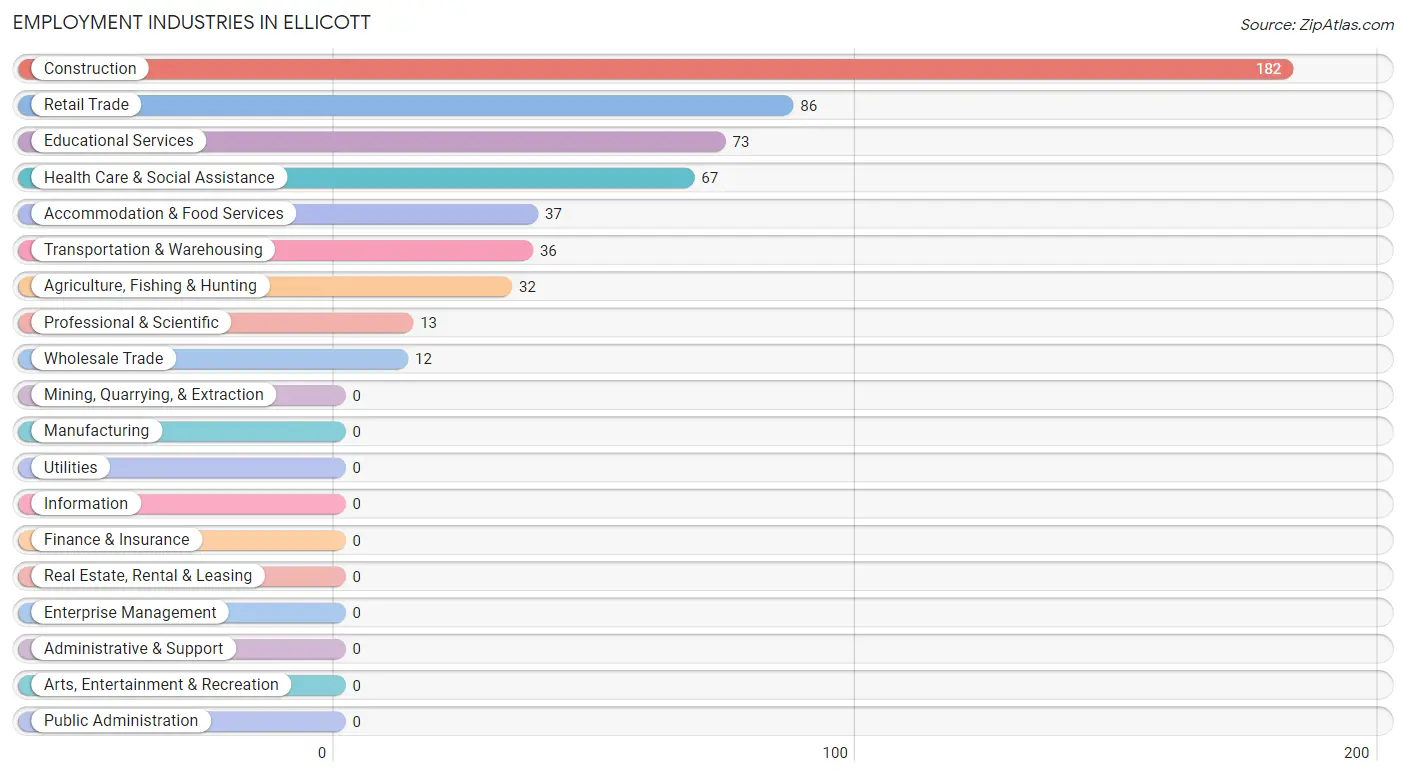
Employment Industries in Ellicott
The major employment industries in Ellicott include Construction (182 | 33.3%), Retail Trade (86 | 15.7%), Educational Services (73 | 13.4%), Health Care & Social Assistance (67 | 12.2%), and Accommodation & Food Services (37 | 6.8%).
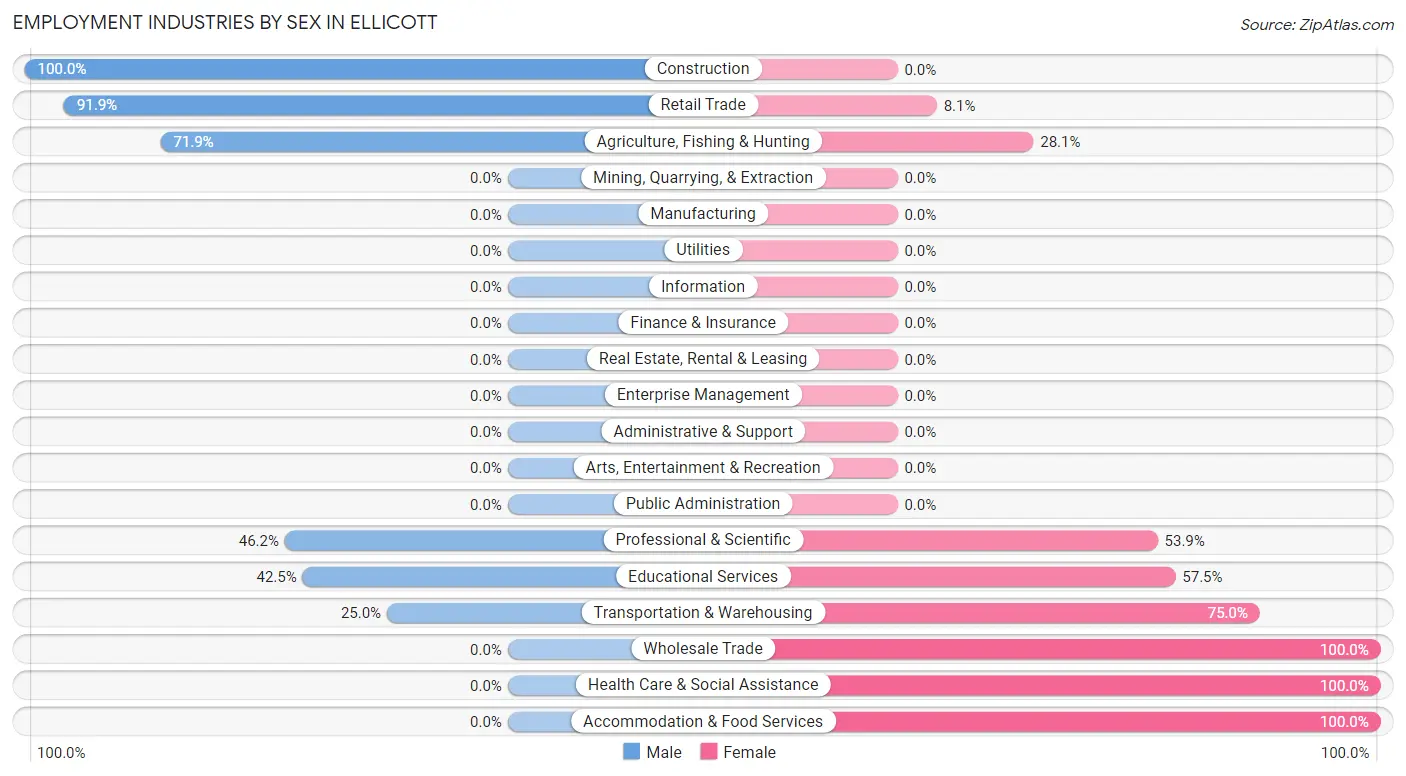
Employment Industries by Sex in Ellicott
The Ellicott industries that see more men than women are Construction (100.0%), Retail Trade (91.9%), and Agriculture, Fishing & Hunting (71.9%), whereas the industries that tend to have a higher number of women are Wholesale Trade (100.0%), Health Care & Social Assistance (100.0%), and Accommodation & Food Services (100.0%).
| Industry | Male | Female |
| Agriculture, Fishing & Hunting | 23 (71.9%) | 9 (28.1%) |
| Mining, Quarrying, & Extraction | 0 (0.0%) | 0 (0.0%) |
| Construction | 182 (100.0%) | 0 (0.0%) |
| Manufacturing | 0 (0.0%) | 0 (0.0%) |
| Wholesale Trade | 0 (0.0%) | 12 (100.0%) |
| Retail Trade | 79 (91.9%) | 7 (8.1%) |
| Transportation & Warehousing | 9 (25.0%) | 27 (75.0%) |
| Utilities | 0 (0.0%) | 0 (0.0%) |
| Information | 0 (0.0%) | 0 (0.0%) |
| Finance & Insurance | 0 (0.0%) | 0 (0.0%) |
| Real Estate, Rental & Leasing | 0 (0.0%) | 0 (0.0%) |
| Professional & Scientific | 6 (46.2%) | 7 (53.8%) |
| Enterprise Management | 0 (0.0%) | 0 (0.0%) |
| Administrative & Support | 0 (0.0%) | 0 (0.0%) |
| Educational Services | 31 (42.5%) | 42 (57.5%) |
| Health Care & Social Assistance | 0 (0.0%) | 67 (100.0%) |
| Arts, Entertainment & Recreation | 0 (0.0%) | 0 (0.0%) |
| Accommodation & Food Services | 0 (0.0%) | 37 (100.0%) |
| Public Administration | 0 (0.0%) | 0 (0.0%) |
| Total | 339 (62.0%) | 208 (38.0%) |
Education in Ellicott
School Enrollment in Ellicott
The most common levels of schooling among the 403 students in Ellicott are elementary school (165 | 40.9%), middle school (127 | 31.5%), and high school (89 | 22.1%).
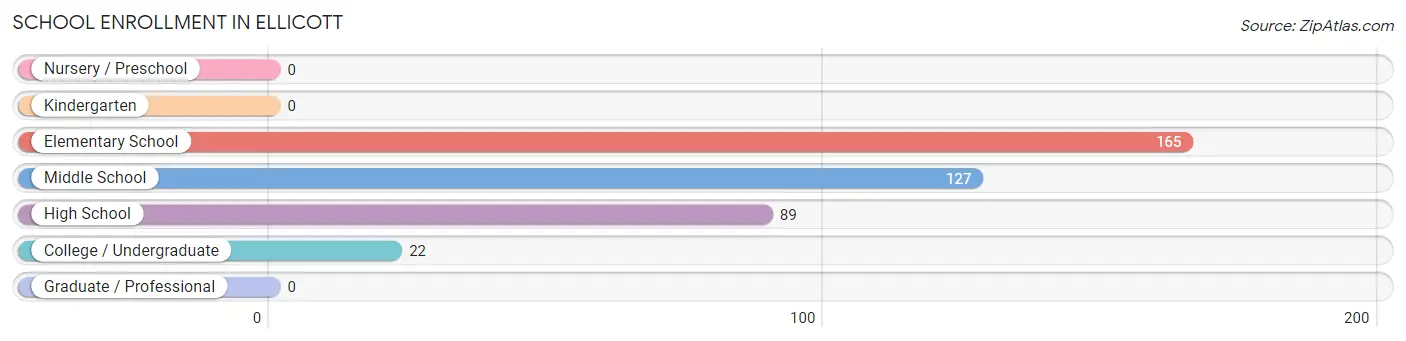
| School Level | # Students | % Students |
| Nursery / Preschool | 0 | 0.0% |
| Kindergarten | 0 | 0.0% |
| Elementary School | 165 | 40.9% |
| Middle School | 127 | 31.5% |
| High School | 89 | 22.1% |
| College / Undergraduate | 22 | 5.5% |
| Graduate / Professional | 0 | 0.0% |
| Total | 403 | 100.0% |
School Enrollment by Age by Funding Source in Ellicott
Out of a total of 403 students who are enrolled in schools in Ellicott, 27 (6.7%) attend a private institution, while the remaining 376 (93.3%) are enrolled in public schools. The age group of 15 to 17 year olds has the highest likelihood of being enrolled in private schools, with 27 (50.0% in the age bracket) enrolled. Conversely, the age group of 5 to 9 year old has the lowest likelihood of being enrolled in a private school, with 165 (100.0% in the age bracket) attending a public institution.
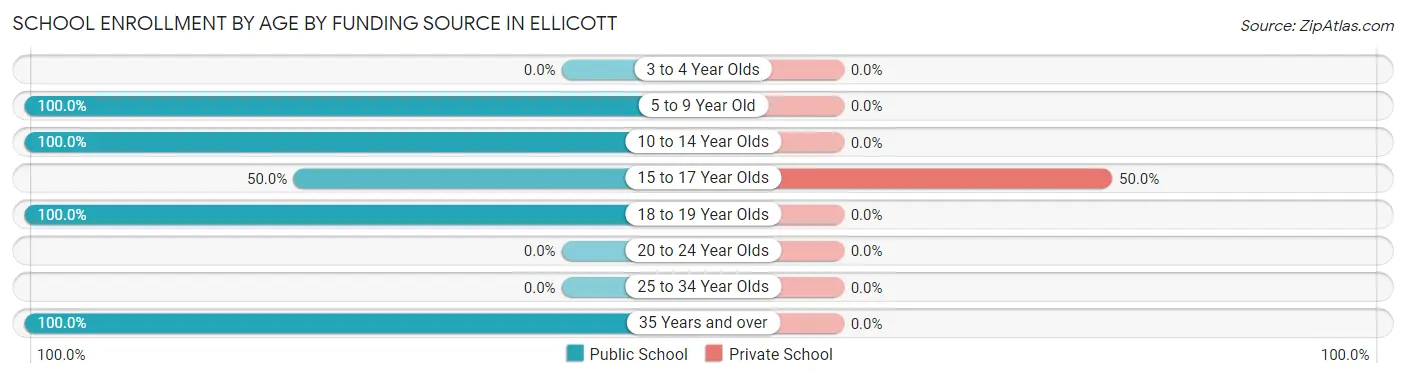
| Age Bracket | Public School | Private School |
| 3 to 4 Year Olds | 0 (0.0%) | 0 (0.0%) |
| 5 to 9 Year Old | 165 (100.0%) | 0 (0.0%) |
| 10 to 14 Year Olds | 144 (100.0%) | 0 (0.0%) |
| 15 to 17 Year Olds | 27 (50.0%) | 27 (50.0%) |
| 18 to 19 Year Olds | 18 (100.0%) | 0 (0.0%) |
| 20 to 24 Year Olds | 0 (0.0%) | 0 (0.0%) |
| 25 to 34 Year Olds | 0 (0.0%) | 0 (0.0%) |
| 35 Years and over | 22 (100.0%) | 0 (0.0%) |
| Total | 376 (93.3%) | 27 (6.7%) |
Educational Attainment by Field of Study in Ellicott
Computers & mathematics (8 | 16.3%), science & technology (8 | 16.3%), bio, nature & agricultural (7 | 14.3%), education (7 | 14.3%), and liberal arts & history (7 | 14.3%) are the most common fields of study among 49 individuals in Ellicott who have obtained a bachelor's degree or higher.
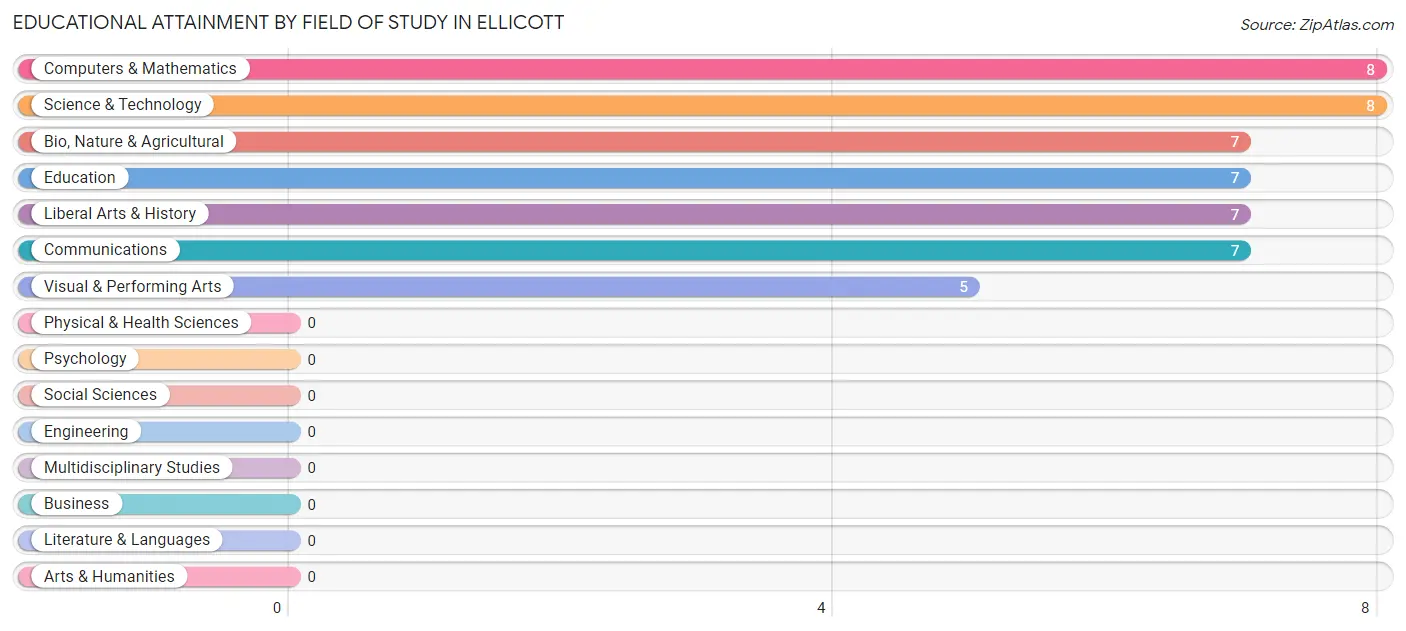
| Field of Study | # Graduates | % Graduates |
| Computers & Mathematics | 8 | 16.3% |
| Bio, Nature & Agricultural | 7 | 14.3% |
| Physical & Health Sciences | 0 | 0.0% |
| Psychology | 0 | 0.0% |
| Social Sciences | 0 | 0.0% |
| Engineering | 0 | 0.0% |
| Multidisciplinary Studies | 0 | 0.0% |
| Science & Technology | 8 | 16.3% |
| Business | 0 | 0.0% |
| Education | 7 | 14.3% |
| Literature & Languages | 0 | 0.0% |
| Liberal Arts & History | 7 | 14.3% |
| Visual & Performing Arts | 5 | 10.2% |
| Communications | 7 | 14.3% |
| Arts & Humanities | 0 | 0.0% |
| Total | 49 | 100.0% |
Transportation & Commute in Ellicott
Vehicle Availability by Sex in Ellicott
The most prevalent vehicle ownership categories in Ellicott are males with 2 vehicles (141, accounting for 43.1%) and females with 2 vehicles (62, making up 70.9%).
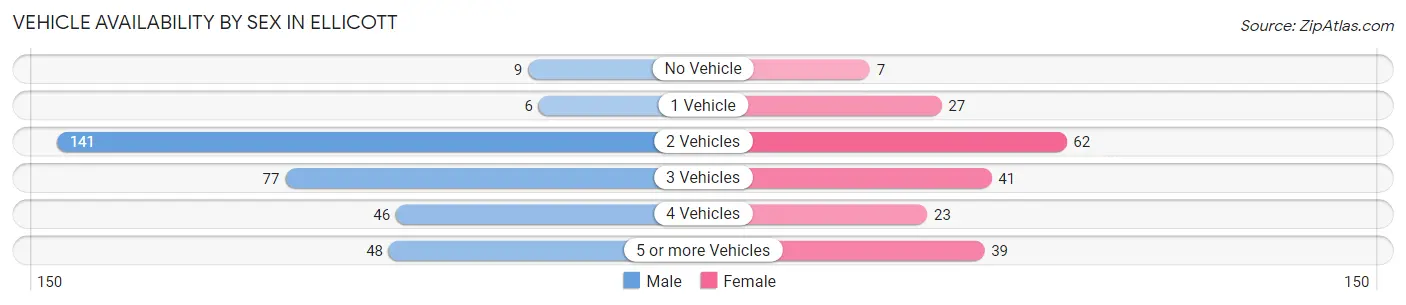
| Vehicles Available | Male | Female |
| No Vehicle | 9 (2.8%) | 7 (3.5%) |
| 1 Vehicle | 6 (1.8%) | 27 (13.6%) |
| 2 Vehicles | 141 (43.1%) | 62 (31.2%) |
| 3 Vehicles | 77 (23.5%) | 41 (20.6%) |
| 4 Vehicles | 46 (14.1%) | 23 (11.6%) |
| 5 or more Vehicles | 48 (14.7%) | 39 (19.6%) |
| Total | 327 (100.0%) | 199 (100.0%) |
Commute Time in Ellicott
The most frequently occuring commute durations in Ellicott are 30 to 34 minutes (168 commuters, 33.3%), 45 to 59 minutes (142 commuters, 28.1%), and 15 to 19 minutes (44 commuters, 8.7%).
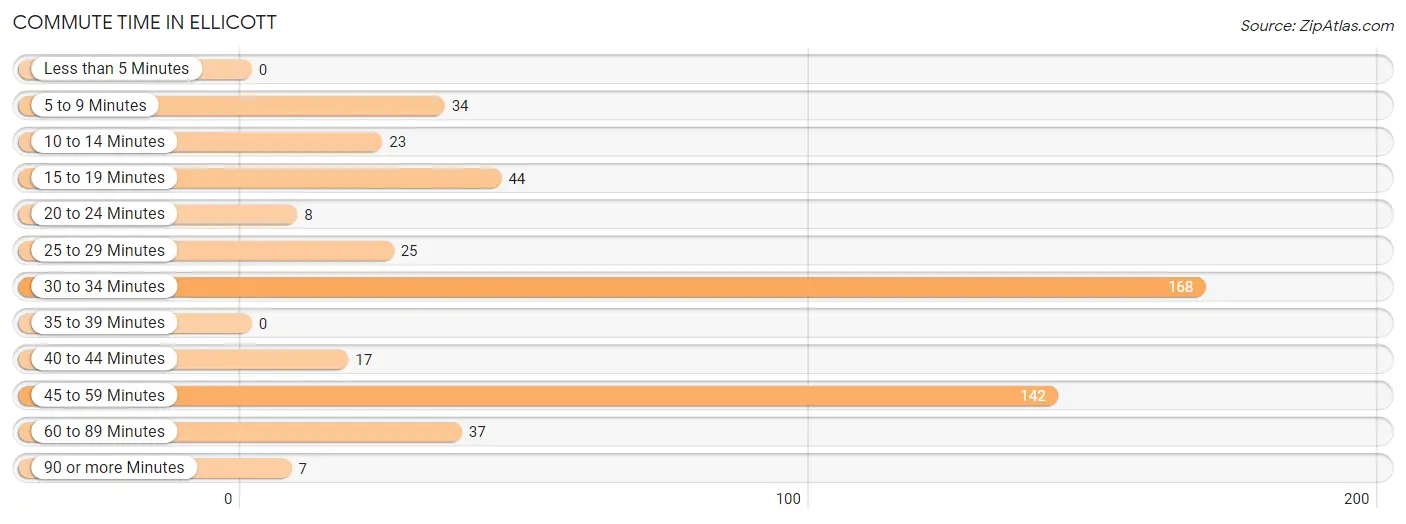
| Commute Time | # Commuters | % Commuters |
| Less than 5 Minutes | 0 | 0.0% |
| 5 to 9 Minutes | 34 | 6.7% |
| 10 to 14 Minutes | 23 | 4.5% |
| 15 to 19 Minutes | 44 | 8.7% |
| 20 to 24 Minutes | 8 | 1.6% |
| 25 to 29 Minutes | 25 | 5.0% |
| 30 to 34 Minutes | 168 | 33.3% |
| 35 to 39 Minutes | 0 | 0.0% |
| 40 to 44 Minutes | 17 | 3.4% |
| 45 to 59 Minutes | 142 | 28.1% |
| 60 to 89 Minutes | 37 | 7.3% |
| 90 or more Minutes | 7 | 1.4% |
Commute Time by Sex in Ellicott
The most common commute times in Ellicott are 30 to 34 minutes (161 commuters, 49.2%) for males and 45 to 59 minutes (72 commuters, 40.5%) for females.
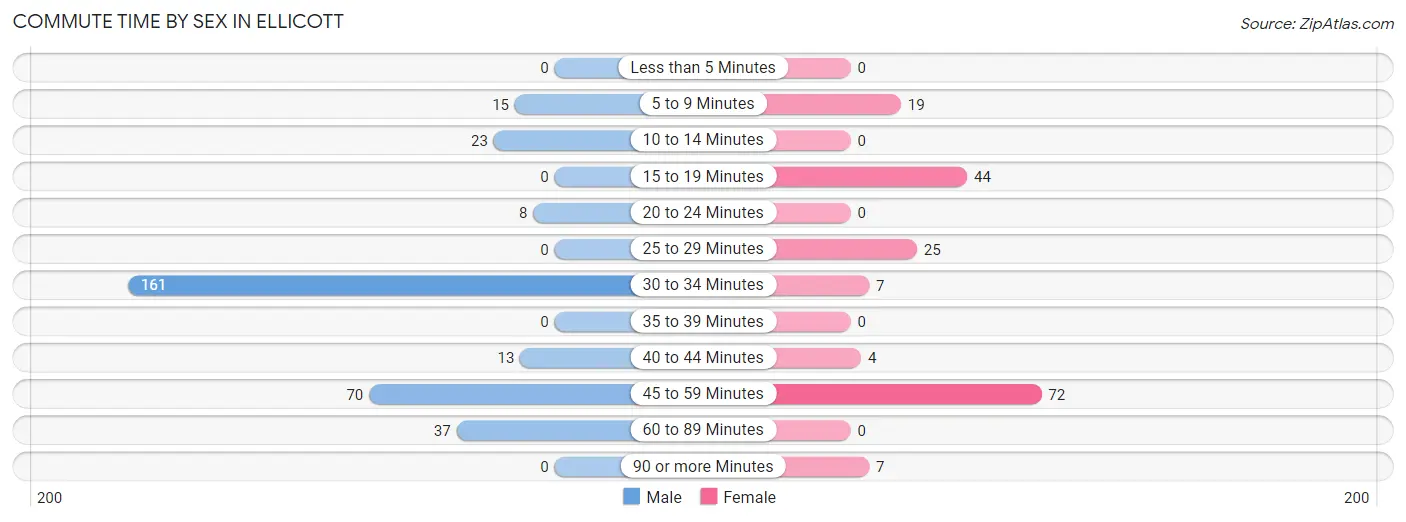
| Commute Time | Male | Female |
| Less than 5 Minutes | 0 (0.0%) | 0 (0.0%) |
| 5 to 9 Minutes | 15 (4.6%) | 19 (10.7%) |
| 10 to 14 Minutes | 23 (7.0%) | 0 (0.0%) |
| 15 to 19 Minutes | 0 (0.0%) | 44 (24.7%) |
| 20 to 24 Minutes | 8 (2.5%) | 0 (0.0%) |
| 25 to 29 Minutes | 0 (0.0%) | 25 (14.0%) |
| 30 to 34 Minutes | 161 (49.2%) | 7 (3.9%) |
| 35 to 39 Minutes | 0 (0.0%) | 0 (0.0%) |
| 40 to 44 Minutes | 13 (4.0%) | 4 (2.2%) |
| 45 to 59 Minutes | 70 (21.4%) | 72 (40.5%) |
| 60 to 89 Minutes | 37 (11.3%) | 0 (0.0%) |
| 90 or more Minutes | 0 (0.0%) | 7 (3.9%) |
Time of Departure to Work by Sex in Ellicott
The most frequent times of departure to work in Ellicott are 7:00 AM to 7:29 AM (170, 52.0%) for males and 12:00 PM to 3:59 PM (50, 28.1%) for females.
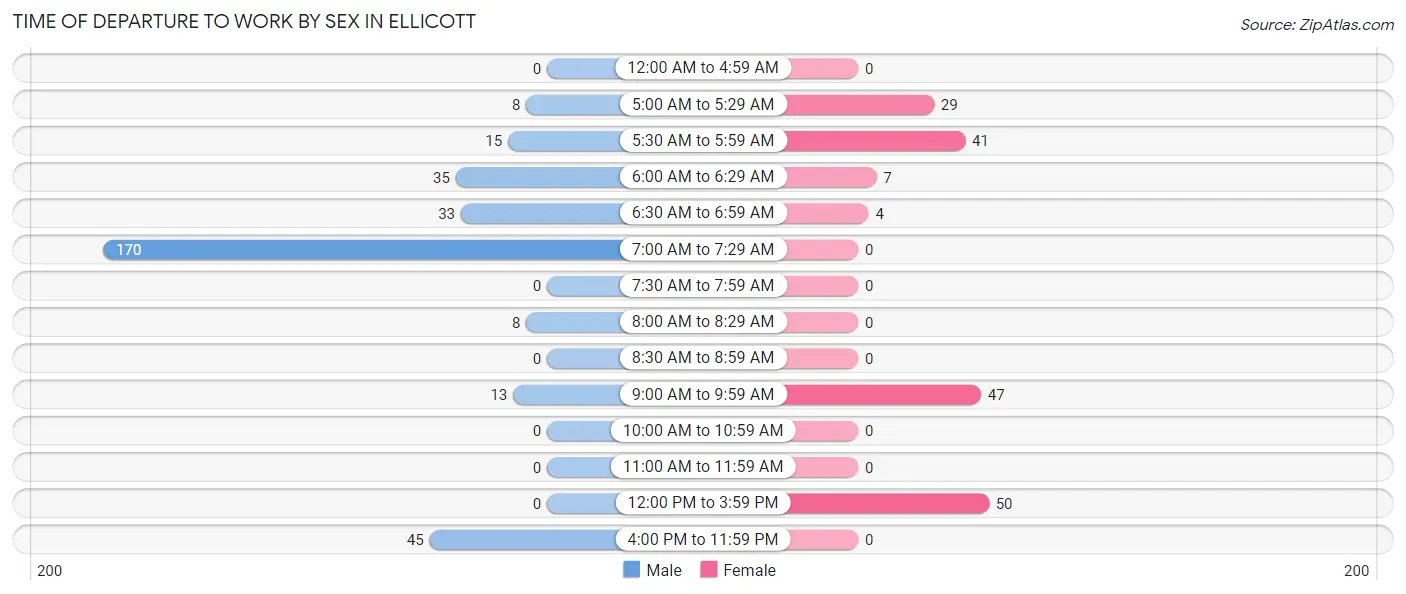
| Time of Departure | Male | Female |
| 12:00 AM to 4:59 AM | 0 (0.0%) | 0 (0.0%) |
| 5:00 AM to 5:29 AM | 8 (2.5%) | 29 (16.3%) |
| 5:30 AM to 5:59 AM | 15 (4.6%) | 41 (23.0%) |
| 6:00 AM to 6:29 AM | 35 (10.7%) | 7 (3.9%) |
| 6:30 AM to 6:59 AM | 33 (10.1%) | 4 (2.2%) |
| 7:00 AM to 7:29 AM | 170 (52.0%) | 0 (0.0%) |
| 7:30 AM to 7:59 AM | 0 (0.0%) | 0 (0.0%) |
| 8:00 AM to 8:29 AM | 8 (2.5%) | 0 (0.0%) |
| 8:30 AM to 8:59 AM | 0 (0.0%) | 0 (0.0%) |
| 9:00 AM to 9:59 AM | 13 (4.0%) | 47 (26.4%) |
| 10:00 AM to 10:59 AM | 0 (0.0%) | 0 (0.0%) |
| 11:00 AM to 11:59 AM | 0 (0.0%) | 0 (0.0%) |
| 12:00 PM to 3:59 PM | 0 (0.0%) | 50 (28.1%) |
| 4:00 PM to 11:59 PM | 45 (13.8%) | 0 (0.0%) |
| Total | 327 (100.0%) | 178 (100.0%) |
Housing Occupancy in Ellicott
Occupancy by Ownership in Ellicott
Of the total 363 dwellings in Ellicott, owner-occupied units account for 250 (68.9%), while renter-occupied units make up 113 (31.1%).
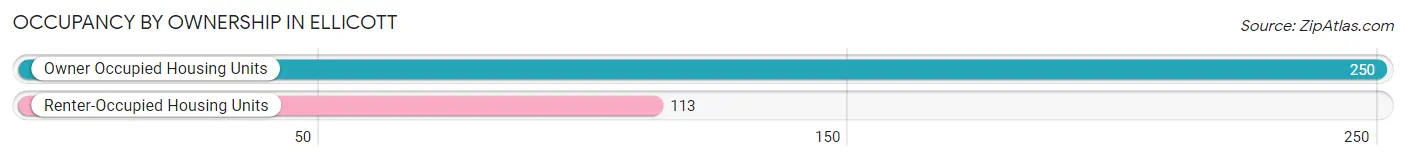
| Occupancy | # Housing Units | % Housing Units |
| Owner Occupied Housing Units | 250 | 68.9% |
| Renter-Occupied Housing Units | 113 | 31.1% |
| Total Occupied Housing Units | 363 | 100.0% |
Occupancy by Household Size in Ellicott
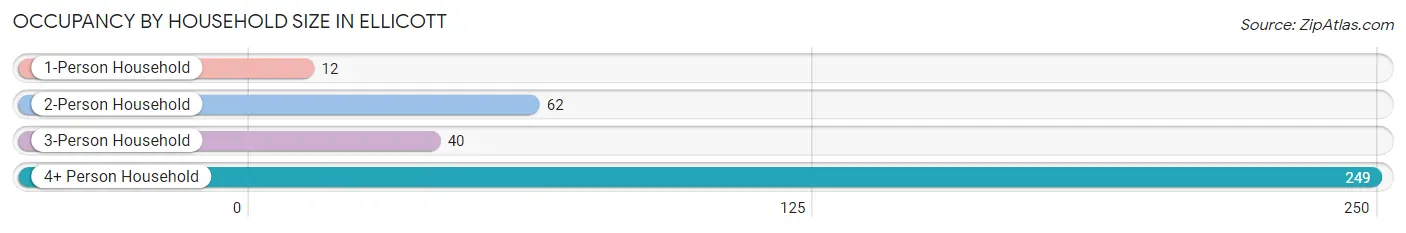
| Household Size | # Housing Units | % Housing Units |
| 1-Person Household | 12 | 3.3% |
| 2-Person Household | 62 | 17.1% |
| 3-Person Household | 40 | 11.0% |
| 4+ Person Household | 249 | 68.6% |
| Total Housing Units | 363 | 100.0% |
Occupancy by Ownership by Household Size in Ellicott
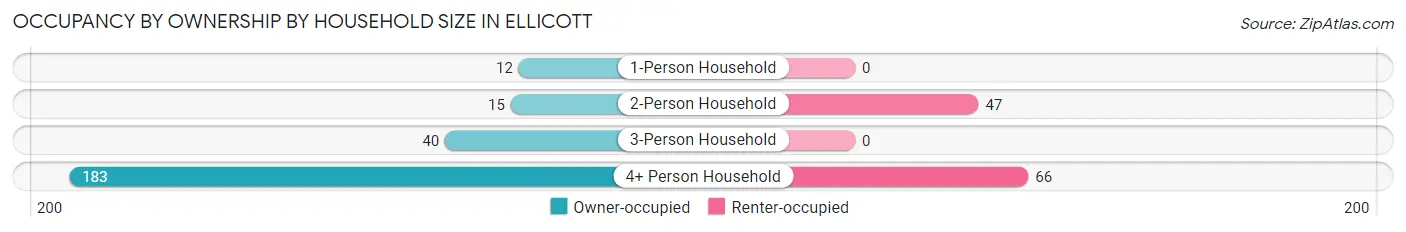
| Household Size | Owner-occupied | Renter-occupied |
| 1-Person Household | 12 (100.0%) | 0 (0.0%) |
| 2-Person Household | 15 (24.2%) | 47 (75.8%) |
| 3-Person Household | 40 (100.0%) | 0 (0.0%) |
| 4+ Person Household | 183 (73.5%) | 66 (26.5%) |
| Total Housing Units | 250 (68.9%) | 113 (31.1%) |
Occupancy by Educational Attainment in Ellicott
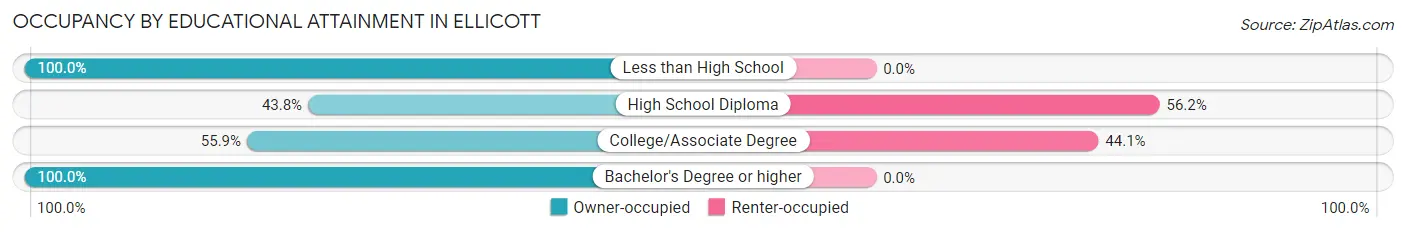
| Household Size | Owner-occupied | Renter-occupied |
| Less than High School | 117 (100.0%) | 0 (0.0%) |
| High School Diploma | 39 (43.8%) | 50 (56.2%) |
| College/Associate Degree | 80 (55.9%) | 63 (44.1%) |
| Bachelor's Degree or higher | 14 (100.0%) | 0 (0.0%) |
Occupancy by Age of Householder in Ellicott
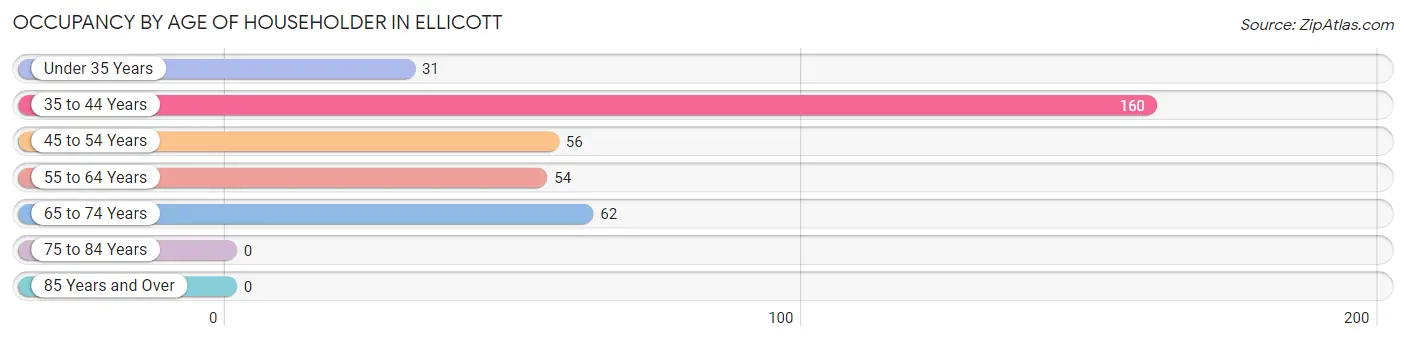
| Age Bracket | # Households | % Households |
| Under 35 Years | 31 | 8.5% |
| 35 to 44 Years | 160 | 44.1% |
| 45 to 54 Years | 56 | 15.4% |
| 55 to 64 Years | 54 | 14.9% |
| 65 to 74 Years | 62 | 17.1% |
| 75 to 84 Years | 0 | 0.0% |
| 85 Years and Over | 0 | 0.0% |
| Total | 363 | 100.0% |
Housing Finances in Ellicott
Median Income by Occupancy in Ellicott
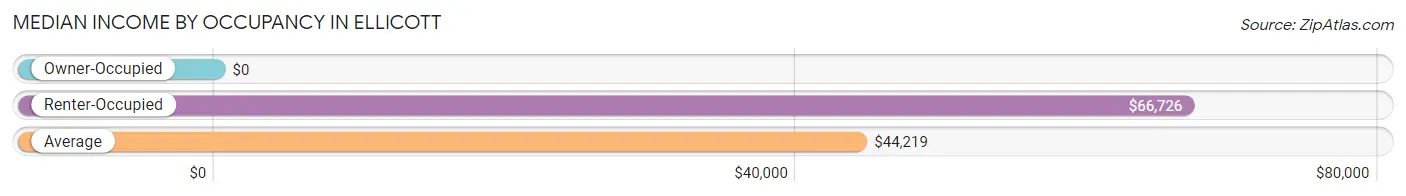
| Occupancy Type | # Households | Median Income |
| Owner-Occupied | 250 (68.9%) | $0 |
| Renter-Occupied | 113 (31.1%) | $66,726 |
| Average | 363 (100.0%) | $44,219 |
Occupancy by Householder Income Bracket in Ellicott
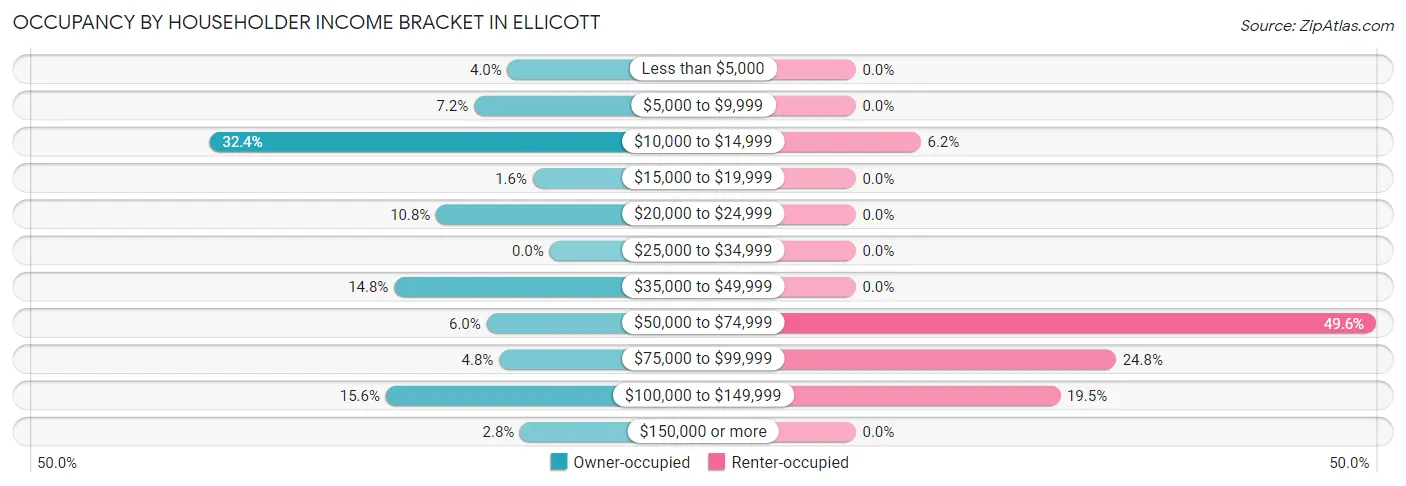
| Income Bracket | Owner-occupied | Renter-occupied |
| Less than $5,000 | 10 (4.0%) | 0 (0.0%) |
| $5,000 to $9,999 | 18 (7.2%) | 0 (0.0%) |
| $10,000 to $14,999 | 81 (32.4%) | 7 (6.2%) |
| $15,000 to $19,999 | 4 (1.6%) | 0 (0.0%) |
| $20,000 to $24,999 | 27 (10.8%) | 0 (0.0%) |
| $25,000 to $34,999 | 0 (0.0%) | 0 (0.0%) |
| $35,000 to $49,999 | 37 (14.8%) | 0 (0.0%) |
| $50,000 to $74,999 | 15 (6.0%) | 56 (49.6%) |
| $75,000 to $99,999 | 12 (4.8%) | 28 (24.8%) |
| $100,000 to $149,999 | 39 (15.6%) | 22 (19.5%) |
| $150,000 or more | 7 (2.8%) | 0 (0.0%) |
| Total | 250 (100.0%) | 113 (100.0%) |
Monthly Housing Cost Tiers in Ellicott
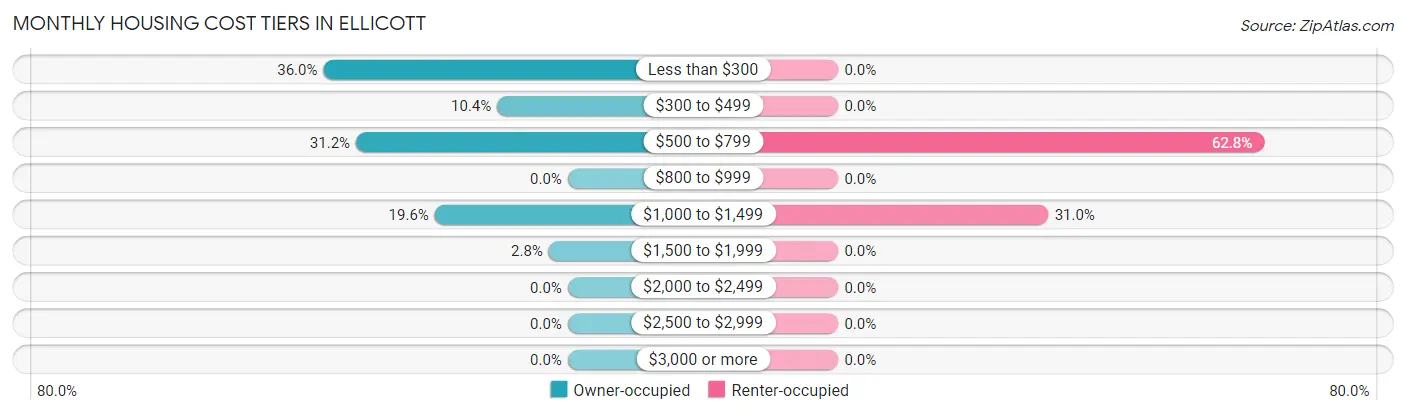
| Monthly Cost | Owner-occupied | Renter-occupied |
| Less than $300 | 90 (36.0%) | 0 (0.0%) |
| $300 to $499 | 26 (10.4%) | 0 (0.0%) |
| $500 to $799 | 78 (31.2%) | 71 (62.8%) |
| $800 to $999 | 0 (0.0%) | 0 (0.0%) |
| $1,000 to $1,499 | 49 (19.6%) | 35 (31.0%) |
| $1,500 to $1,999 | 7 (2.8%) | 0 (0.0%) |
| $2,000 to $2,499 | 0 (0.0%) | 0 (0.0%) |
| $2,500 to $2,999 | 0 (0.0%) | 0 (0.0%) |
| $3,000 or more | 0 (0.0%) | 0 (0.0%) |
| Total | 250 (100.0%) | 113 (100.0%) |
Physical Housing Characteristics in Ellicott
Housing Structures in Ellicott
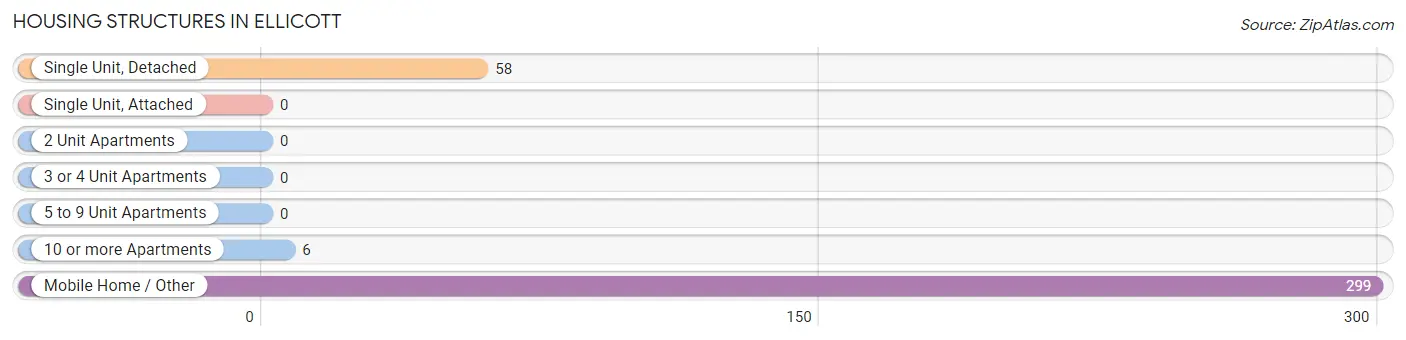
| Structure Type | # Housing Units | % Housing Units |
| Single Unit, Detached | 58 | 16.0% |
| Single Unit, Attached | 0 | 0.0% |
| 2 Unit Apartments | 0 | 0.0% |
| 3 or 4 Unit Apartments | 0 | 0.0% |
| 5 to 9 Unit Apartments | 0 | 0.0% |
| 10 or more Apartments | 6 | 1.7% |
| Mobile Home / Other | 299 | 82.4% |
| Total | 363 | 100.0% |
Housing Structures by Occupancy in Ellicott
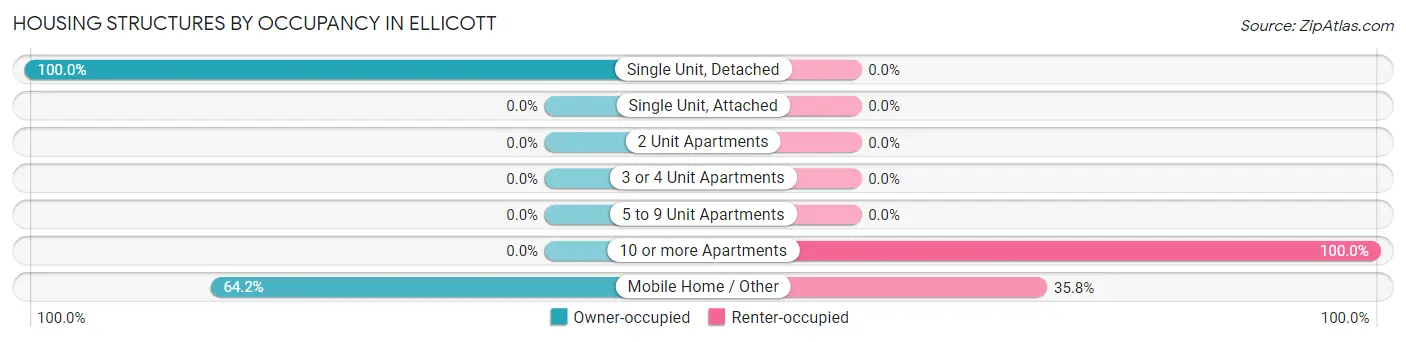
| Structure Type | Owner-occupied | Renter-occupied |
| Single Unit, Detached | 58 (100.0%) | 0 (0.0%) |
| Single Unit, Attached | 0 (0.0%) | 0 (0.0%) |
| 2 Unit Apartments | 0 (0.0%) | 0 (0.0%) |
| 3 or 4 Unit Apartments | 0 (0.0%) | 0 (0.0%) |
| 5 to 9 Unit Apartments | 0 (0.0%) | 0 (0.0%) |
| 10 or more Apartments | 0 (0.0%) | 6 (100.0%) |
| Mobile Home / Other | 192 (64.2%) | 107 (35.8%) |
| Total | 250 (68.9%) | 113 (31.1%) |
Housing Structures by Number of Rooms in Ellicott
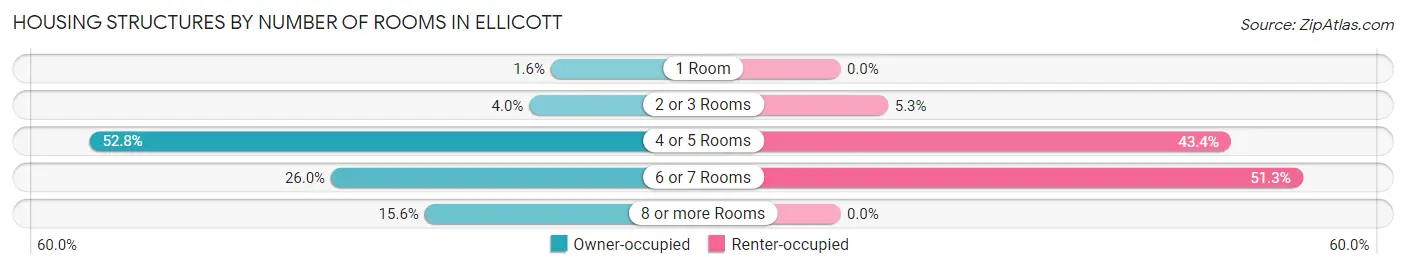
| Number of Rooms | Owner-occupied | Renter-occupied |
| 1 Room | 4 (1.6%) | 0 (0.0%) |
| 2 or 3 Rooms | 10 (4.0%) | 6 (5.3%) |
| 4 or 5 Rooms | 132 (52.8%) | 49 (43.4%) |
| 6 or 7 Rooms | 65 (26.0%) | 58 (51.3%) |
| 8 or more Rooms | 39 (15.6%) | 0 (0.0%) |
| Total | 250 (100.0%) | 113 (100.0%) |
Housing Structure by Heating Type in Ellicott
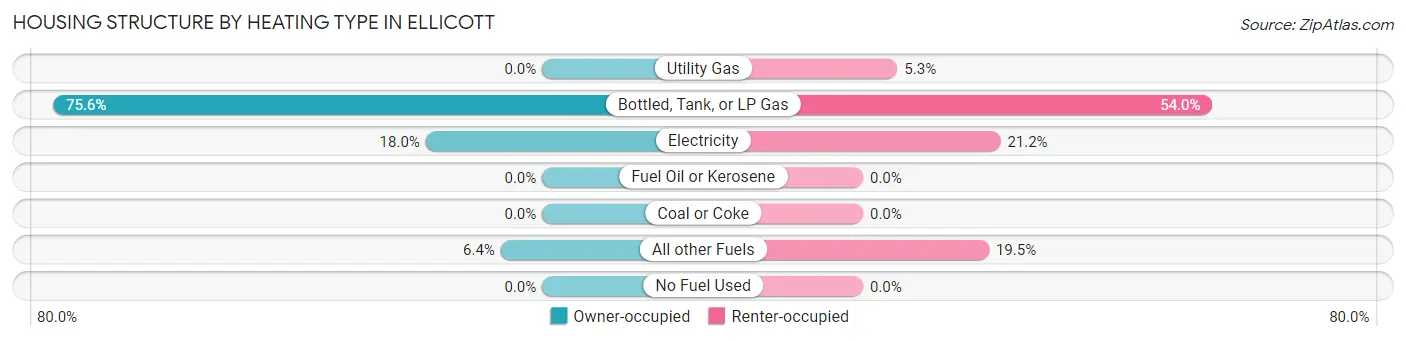
| Heating Type | Owner-occupied | Renter-occupied |
| Utility Gas | 0 (0.0%) | 6 (5.3%) |
| Bottled, Tank, or LP Gas | 189 (75.6%) | 61 (54.0%) |
| Electricity | 45 (18.0%) | 24 (21.2%) |
| Fuel Oil or Kerosene | 0 (0.0%) | 0 (0.0%) |
| Coal or Coke | 0 (0.0%) | 0 (0.0%) |
| All other Fuels | 16 (6.4%) | 22 (19.5%) |
| No Fuel Used | 0 (0.0%) | 0 (0.0%) |
| Total | 250 (100.0%) | 113 (100.0%) |
Household Vehicle Usage in Ellicott
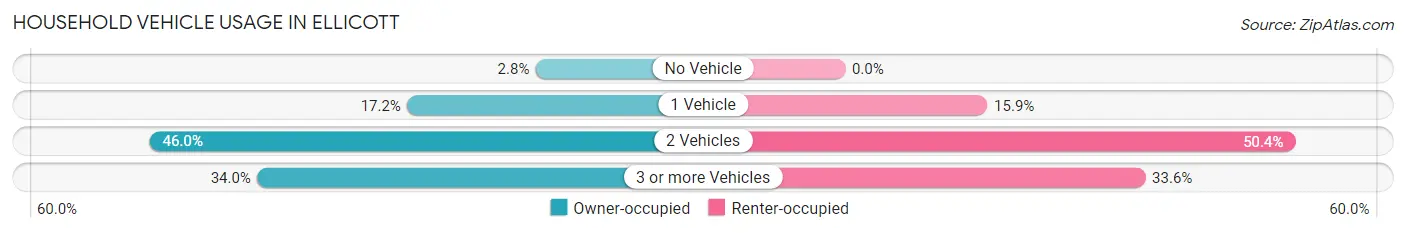
| Vehicles per Household | Owner-occupied | Renter-occupied |
| No Vehicle | 7 (2.8%) | 0 (0.0%) |
| 1 Vehicle | 43 (17.2%) | 18 (15.9%) |
| 2 Vehicles | 115 (46.0%) | 57 (50.4%) |
| 3 or more Vehicles | 85 (34.0%) | 38 (33.6%) |
| Total | 250 (100.0%) | 113 (100.0%) |
Real Estate & Mortgages in Ellicott
Real Estate and Mortgage Overview in Ellicott
| Characteristic | Without Mortgage | With Mortgage |
| Housing Units | 201 | 49 |
| Median Property Value | $9,999 | $0 |
| Median Household Income | - | - |
| Monthly Housing Costs | $414 | $0 |
| Real Estate Taxes | $250 | $0 |
Property Value by Mortgage Status in Ellicott
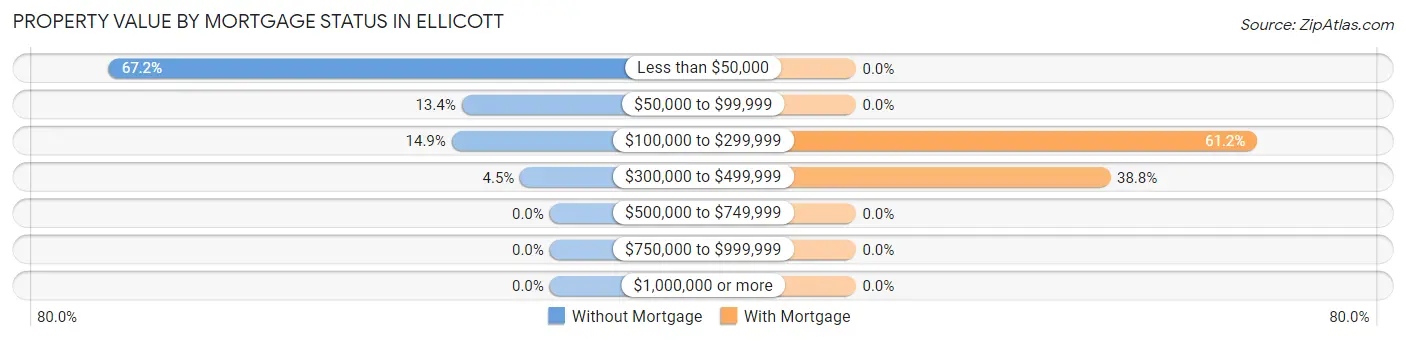
| Property Value | Without Mortgage | With Mortgage |
| Less than $50,000 | 135 (67.2%) | 0 (0.0%) |
| $50,000 to $99,999 | 27 (13.4%) | 0 (0.0%) |
| $100,000 to $299,999 | 30 (14.9%) | 30 (61.2%) |
| $300,000 to $499,999 | 9 (4.5%) | 19 (38.8%) |
| $500,000 to $749,999 | 0 (0.0%) | 0 (0.0%) |
| $750,000 to $999,999 | 0 (0.0%) | 0 (0.0%) |
| $1,000,000 or more | 0 (0.0%) | 0 (0.0%) |
| Total | 201 (100.0%) | 49 (100.0%) |
Household Income by Mortgage Status in Ellicott
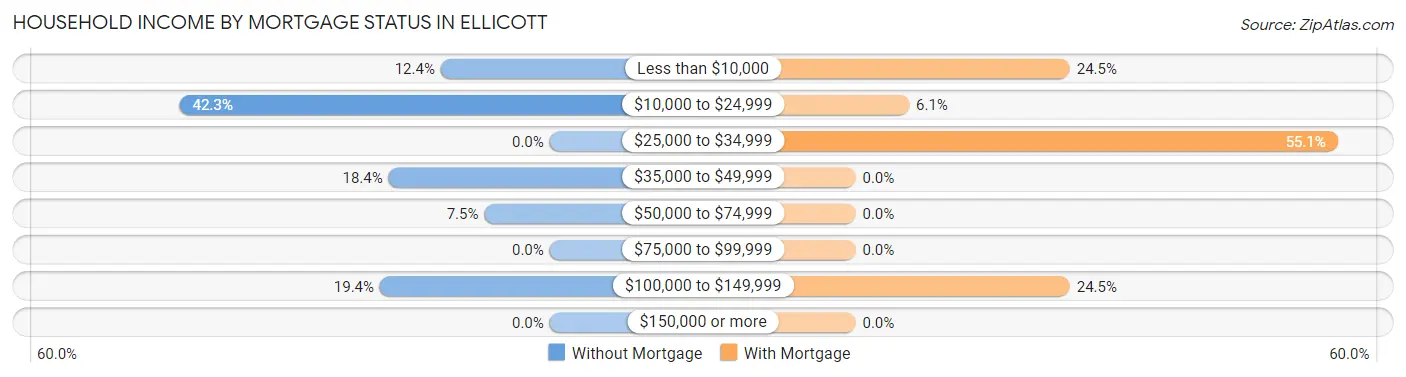
| Household Income | Without Mortgage | With Mortgage |
| Less than $10,000 | 25 (12.4%) | 12 (24.5%) |
| $10,000 to $24,999 | 85 (42.3%) | 3 (6.1%) |
| $25,000 to $34,999 | 0 (0.0%) | 27 (55.1%) |
| $35,000 to $49,999 | 37 (18.4%) | 0 (0.0%) |
| $50,000 to $74,999 | 15 (7.5%) | 0 (0.0%) |
| $75,000 to $99,999 | 0 (0.0%) | 0 (0.0%) |
| $100,000 to $149,999 | 39 (19.4%) | 12 (24.5%) |
| $150,000 or more | 0 (0.0%) | 0 (0.0%) |
| Total | 201 (100.0%) | 49 (100.0%) |
Property Value to Household Income Ratio in Ellicott
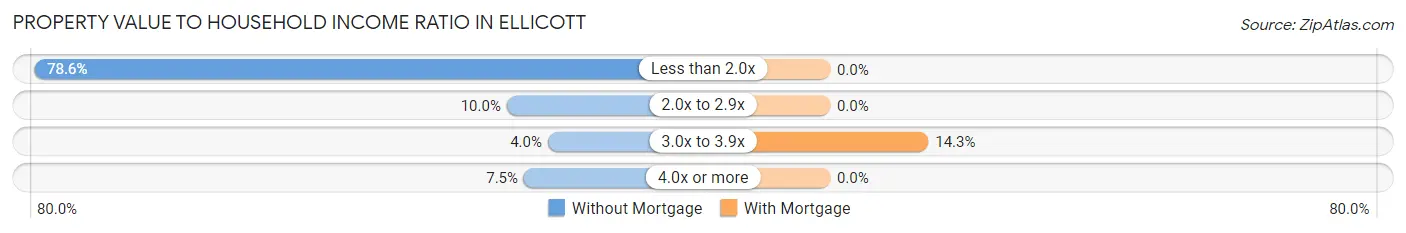
| Value-to-Income Ratio | Without Mortgage | With Mortgage |
| Less than 2.0x | 158 (78.6%) | 0 (0.0%) |
| 2.0x to 2.9x | 20 (10.0%) | 0 (0.0%) |
| 3.0x to 3.9x | 8 (4.0%) | 7 (14.3%) |
| 4.0x or more | 15 (7.5%) | 0 (0.0%) |
| Total | 201 (100.0%) | 49 (100.0%) |
Real Estate Taxes by Mortgage Status in Ellicott
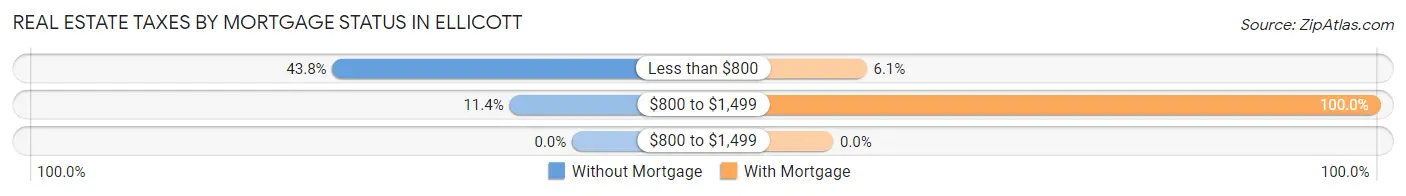
| Property Taxes | Without Mortgage | With Mortgage |
| Less than $800 | 88 (43.8%) | 3 (6.1%) |
| $800 to $1,499 | 23 (11.4%) | 49 (100.0%) |
| $800 to $1,499 | 0 (0.0%) | 0 (0.0%) |
| Total | 201 (100.0%) | 49 (100.0%) |
Health & Disability in Ellicott
Health Insurance Coverage by Age in Ellicott
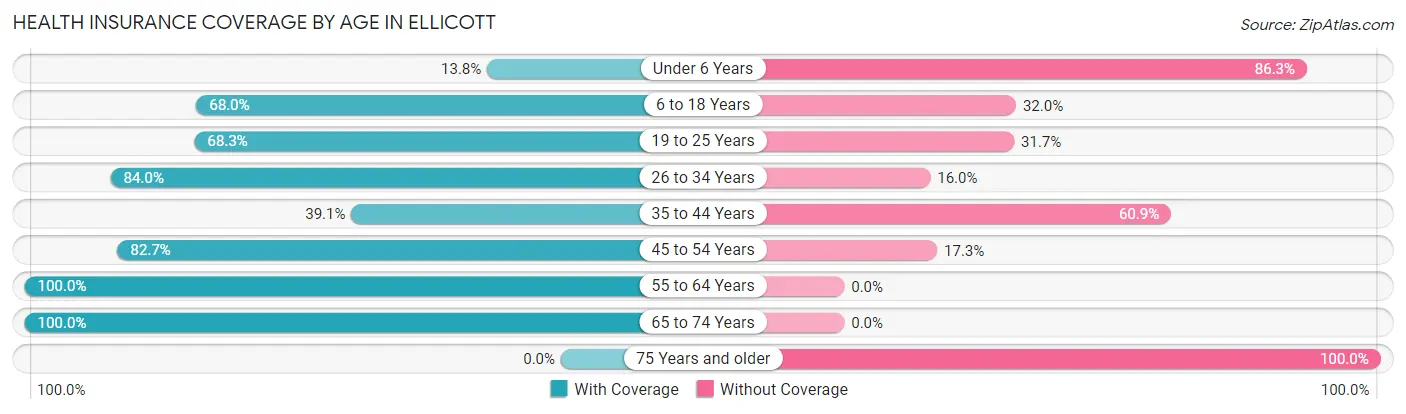
| Age Bracket | With Coverage | Without Coverage |
| Under 6 Years | 11 (13.8%) | 69 (86.3%) |
| 6 to 18 Years | 259 (68.0%) | 122 (32.0%) |
| 19 to 25 Years | 41 (68.3%) | 19 (31.7%) |
| 26 to 34 Years | 89 (84.0%) | 17 (16.0%) |
| 35 to 44 Years | 118 (39.1%) | 184 (60.9%) |
| 45 to 54 Years | 86 (82.7%) | 18 (17.3%) |
| 55 to 64 Years | 108 (100.0%) | 0 (0.0%) |
| 65 to 74 Years | 105 (100.0%) | 0 (0.0%) |
| 75 Years and older | 0 (0.0%) | 1 (100.0%) |
| Total | 817 (65.5%) | 430 (34.5%) |
Health Insurance Coverage by Citizenship Status in Ellicott
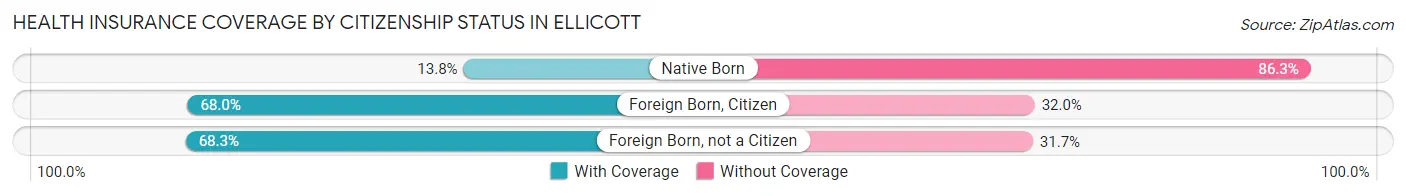
| Citizenship Status | With Coverage | Without Coverage |
| Native Born | 11 (13.8%) | 69 (86.3%) |
| Foreign Born, Citizen | 259 (68.0%) | 122 (32.0%) |
| Foreign Born, not a Citizen | 41 (68.3%) | 19 (31.7%) |
Health Insurance Coverage by Household Income in Ellicott
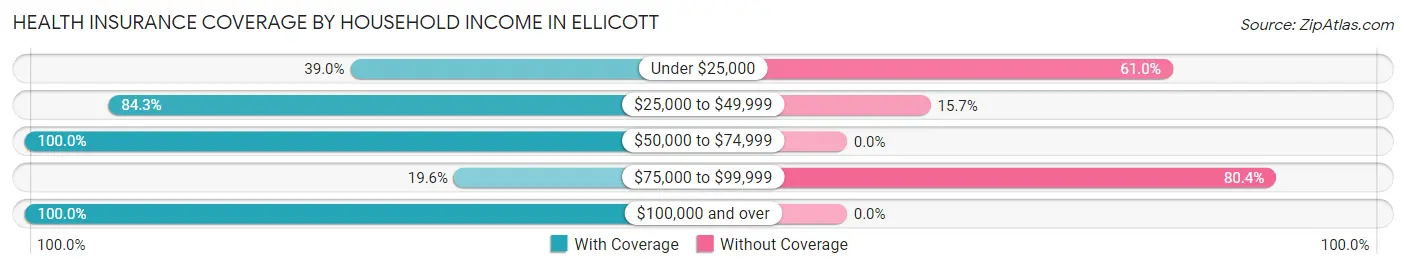
| Household Income | With Coverage | Without Coverage |
| Under $25,000 | 189 (39.0%) | 296 (61.0%) |
| $25,000 to $49,999 | 102 (84.3%) | 19 (15.7%) |
| $50,000 to $74,999 | 234 (100.0%) | 0 (0.0%) |
| $75,000 to $99,999 | 28 (19.6%) | 115 (80.4%) |
| $100,000 and over | 264 (100.0%) | 0 (0.0%) |
Public vs Private Health Insurance Coverage by Age in Ellicott
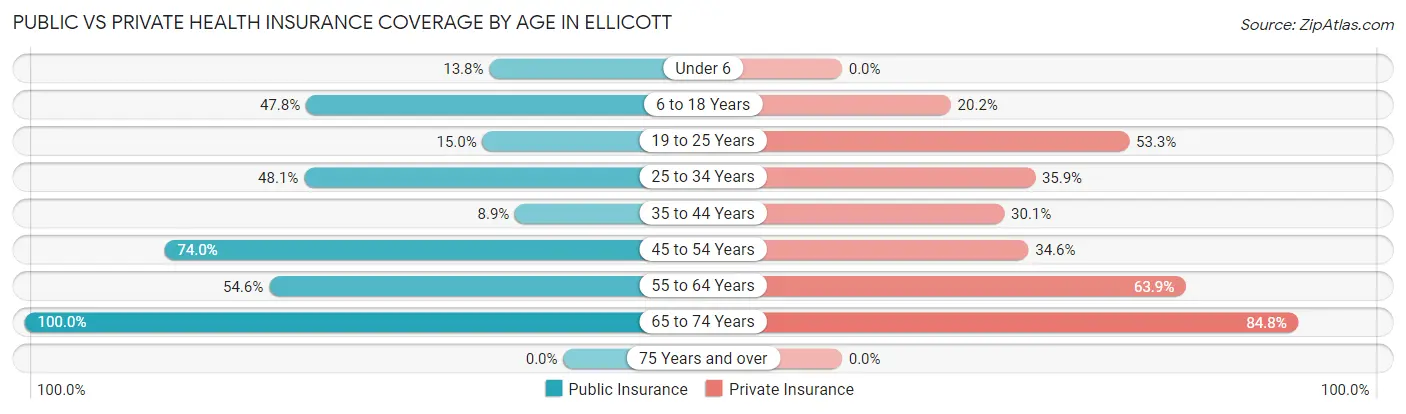
| Age Bracket | Public Insurance | Private Insurance |
| Under 6 | 11 (13.8%) | 0 (0.0%) |
| 6 to 18 Years | 182 (47.8%) | 77 (20.2%) |
| 19 to 25 Years | 9 (15.0%) | 32 (53.3%) |
| 25 to 34 Years | 51 (48.1%) | 38 (35.8%) |
| 35 to 44 Years | 27 (8.9%) | 91 (30.1%) |
| 45 to 54 Years | 77 (74.0%) | 36 (34.6%) |
| 55 to 64 Years | 59 (54.6%) | 69 (63.9%) |
| 65 to 74 Years | 105 (100.0%) | 89 (84.8%) |
| 75 Years and over | 0 (0.0%) | 0 (0.0%) |
| Total | 521 (41.8%) | 432 (34.6%) |
Disability Status by Sex by Age in Ellicott
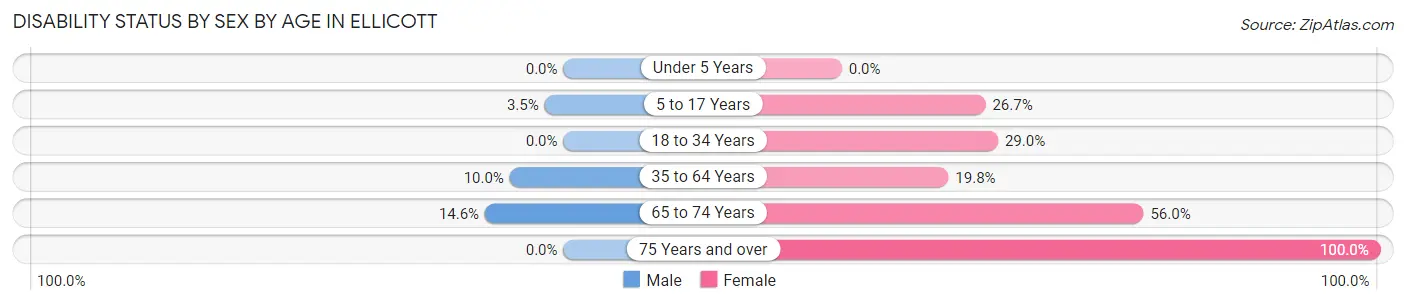
| Age Bracket | Male | Female |
| Under 5 Years | 0 (0.0%) | 0 (0.0%) |
| 5 to 17 Years | 9 (3.5%) | 28 (26.7%) |
| 18 to 34 Years | 0 (0.0%) | 20 (29.0%) |
| 35 to 64 Years | 23 (10.0%) | 56 (19.8%) |
| 65 to 74 Years | 8 (14.5%) | 28 (56.0%) |
| 75 Years and over | 0 (0.0%) | 1 (100.0%) |
Disability Class by Sex by Age in Ellicott
Disability Class: Hearing Difficulty
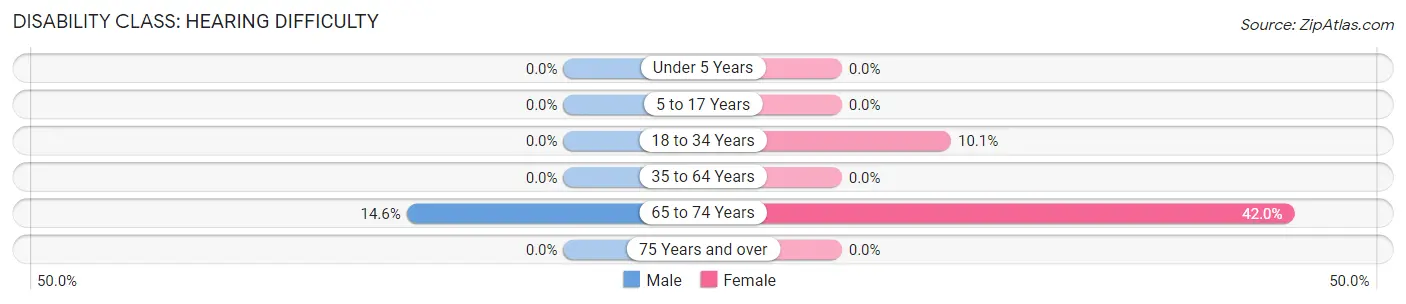
| Age Bracket | Male | Female |
| Under 5 Years | 0 (0.0%) | 0 (0.0%) |
| 5 to 17 Years | 0 (0.0%) | 0 (0.0%) |
| 18 to 34 Years | 0 (0.0%) | 7 (10.1%) |
| 35 to 64 Years | 0 (0.0%) | 0 (0.0%) |
| 65 to 74 Years | 8 (14.5%) | 21 (42.0%) |
| 75 Years and over | 0 (0.0%) | 0 (0.0%) |
Disability Class: Vision Difficulty
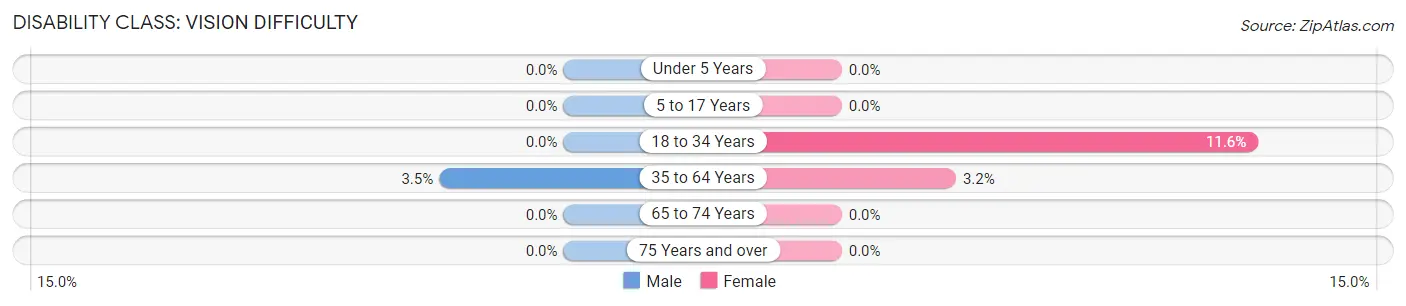
| Age Bracket | Male | Female |
| Under 5 Years | 0 (0.0%) | 0 (0.0%) |
| 5 to 17 Years | 0 (0.0%) | 0 (0.0%) |
| 18 to 34 Years | 0 (0.0%) | 8 (11.6%) |
| 35 to 64 Years | 8 (3.5%) | 9 (3.2%) |
| 65 to 74 Years | 0 (0.0%) | 0 (0.0%) |
| 75 Years and over | 0 (0.0%) | 0 (0.0%) |
Disability Class: Cognitive Difficulty
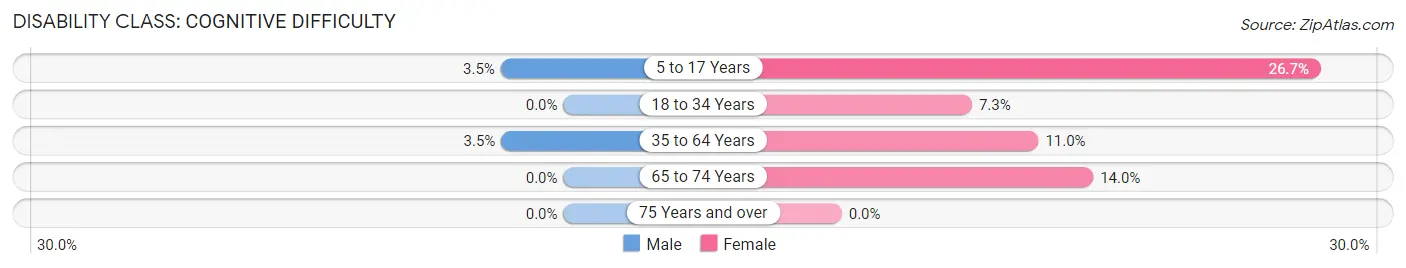
| Age Bracket | Male | Female |
| 5 to 17 Years | 9 (3.5%) | 28 (26.7%) |
| 18 to 34 Years | 0 (0.0%) | 5 (7.2%) |
| 35 to 64 Years | 8 (3.5%) | 31 (11.0%) |
| 65 to 74 Years | 0 (0.0%) | 7 (14.0%) |
| 75 Years and over | 0 (0.0%) | 0 (0.0%) |
Disability Class: Ambulatory Difficulty
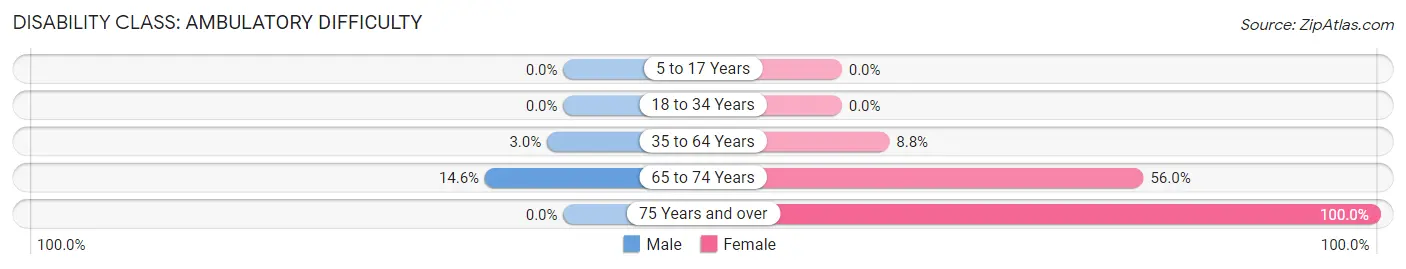
| Age Bracket | Male | Female |
| 5 to 17 Years | 0 (0.0%) | 0 (0.0%) |
| 18 to 34 Years | 0 (0.0%) | 0 (0.0%) |
| 35 to 64 Years | 7 (3.0%) | 25 (8.8%) |
| 65 to 74 Years | 8 (14.5%) | 28 (56.0%) |
| 75 Years and over | 0 (0.0%) | 1 (100.0%) |
Disability Class: Self-Care Difficulty
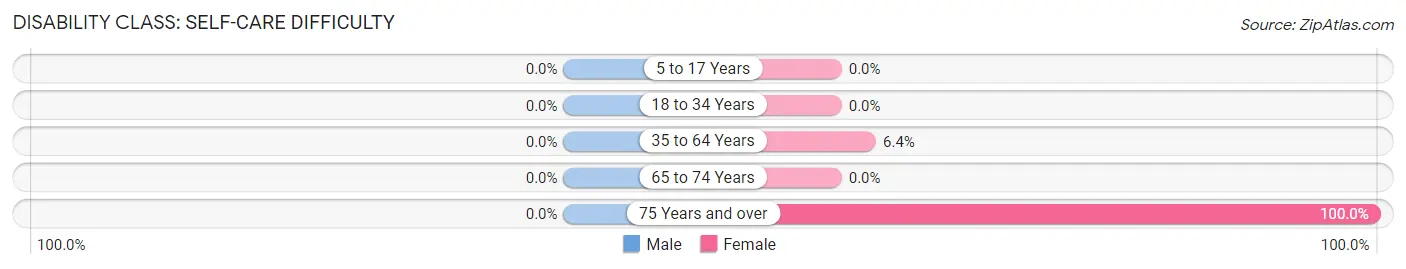
| Age Bracket | Male | Female |
| 5 to 17 Years | 0 (0.0%) | 0 (0.0%) |
| 18 to 34 Years | 0 (0.0%) | 0 (0.0%) |
| 35 to 64 Years | 0 (0.0%) | 18 (6.4%) |
| 65 to 74 Years | 0 (0.0%) | 0 (0.0%) |
| 75 Years and over | 0 (0.0%) | 1 (100.0%) |
Technology Access in Ellicott
Computing Device Access in Ellicott
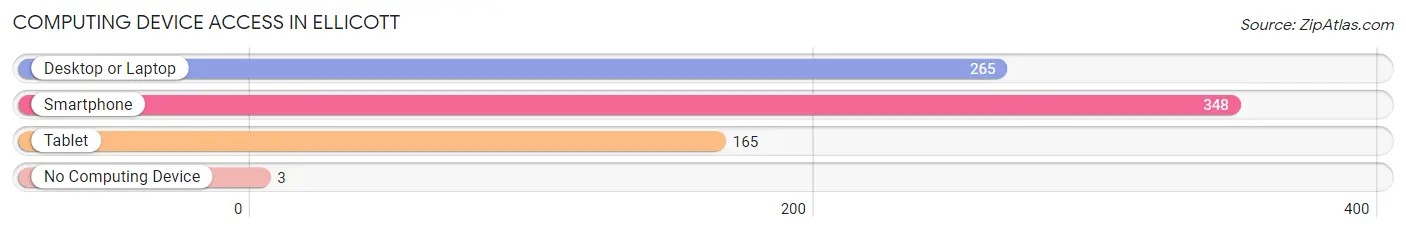
| Device Type | # Households | % Households |
| Desktop or Laptop | 265 | 73.0% |
| Smartphone | 348 | 95.9% |
| Tablet | 165 | 45.5% |
| No Computing Device | 3 | 0.8% |
| Total | 363 | 100.0% |
Internet Access in Ellicott
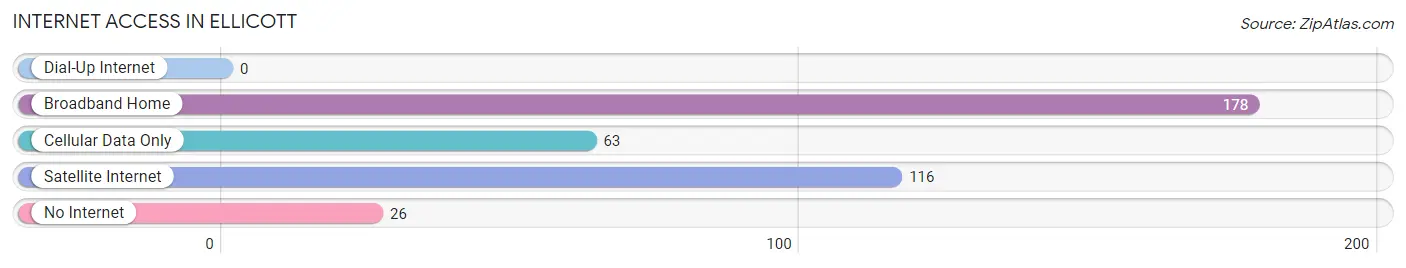
| Internet Type | # Households | % Households |
| Dial-Up Internet | 0 | 0.0% |
| Broadband Home | 178 | 49.0% |
| Cellular Data Only | 63 | 17.4% |
| Satellite Internet | 116 | 32.0% |
| No Internet | 26 | 7.2% |
| Total | 363 | 100.0% |
Ellicott Summary
Ellicott, Colorado is a small town located in El Paso County, Colorado. It is situated in the foothills of the Rocky Mountains, approximately 10 miles east of Colorado Springs. The town was founded in 1859 by General William Jackson Palmer, who named it after his friend Benjamin Ellicott. The town has a population of approximately 1,000 people and is known for its rural charm and small-town atmosphere.
History
Ellicott was founded in 1859 by General William Jackson Palmer, who named it after his friend Benjamin Ellicott. The town was originally a stagecoach stop on the Denver and Rio Grande Railroad. In the late 1800s, Ellicott was a bustling mining town, with several gold and silver mines in the area. The town was also home to a number of saloons, hotels, and other businesses.
In the early 1900s, Ellicott began to decline as the mining industry in the area declined. The town was eventually abandoned in the 1930s, but was re-established in the 1950s. Since then, Ellicott has become a popular destination for tourists and outdoor enthusiasts.
Geography
Ellicott is located in El Paso County, Colorado, approximately 10 miles east of Colorado Springs. The town is situated in the foothills of the Rocky Mountains, at an elevation of 6,845 feet. The town is surrounded by rolling hills and open meadows, with views of the mountains in the distance.
The climate in Ellicott is semi-arid, with hot summers and cold winters. The average annual temperature is around 50 degrees Fahrenheit, with an average of 16 inches of precipitation per year.
Economy
The economy of Ellicott is largely based on tourism and outdoor recreation. The town is home to several small businesses, including restaurants, shops, and galleries. The town is also home to a number of outdoor recreation activities, such as hiking, camping, fishing, and hunting.
The town is also home to a number of small farms and ranches, which produce a variety of crops and livestock. The town is also home to a number of wineries, which produce a variety of wines.
Demographics
As of the 2010 census, Ellicott had a population of 1,000 people. The racial makeup of the town was 94.2% White, 0.7% African American, 0.3% Native American, 0.3% Asian, 0.1% Pacific Islander, and 4.5% from other races. The median household income was $45,000, and the median age was 43.
Ellicott is a small, rural town with a strong sense of community. The town is home to a number of churches, schools, and other organizations that help to foster a sense of community. The town is also home to a number of festivals and events throughout the year, which help to bring the community together.
Common Questions
What is Per Capita Income in Ellicott?
Per Capita income in Ellicott is $16,827.
What is the Median Family Income in Ellicott?
Median Family Income in Ellicott is $44,063.
What is the Median Household income in Ellicott?
Median Household Income in Ellicott is $44,219.
What is Income or Wage Gap in Ellicott?
Income or Wage Gap in Ellicott is 44.8%.
Women in Ellicott earn 55.2 cents for every dollar earned by a man.
What is Inequality or Gini Index in Ellicott?
Inequality or Gini Index in Ellicott is 0.45.
What is the Total Population of Ellicott?
Total Population of Ellicott is 1,247.
What is the Total Male Population of Ellicott?
Total Male Population of Ellicott is 670.
What is the Total Female Population of Ellicott?
Total Female Population of Ellicott is 577.
What is the Ratio of Males per 100 Females in Ellicott?
There are 116.12 Males per 100 Females in Ellicott.
What is the Ratio of Females per 100 Males in Ellicott?
There are 86.12 Females per 100 Males in Ellicott.
What is the Median Population Age in Ellicott?
Median Population Age in Ellicott is 31.8 Years.
What is the Average Family Size in Ellicott
Average Family Size in Ellicott is 3.5 People.
What is the Average Household Size in Ellicott
Average Household Size in Ellicott is 3.4 People.
How Large is the Labor Force in Ellicott?
There are 554 People in the Labor Forcein in Ellicott.
What is the Percentage of People in the Labor Force in Ellicott?
67.4% of People are in the Labor Force in Ellicott.
What is the Unemployment Rate in Ellicott?
Unemployment Rate in Ellicott is 1.3%.