Eagle, CO Map & Demographics
Eagle Map
Eagle Overview
$41,572
PER CAPITA INCOME
$120,190
AVG FAMILY INCOME
$101,373
AVG HOUSEHOLD INCOME
35.9%
WAGE / INCOME GAP [ % ]
64.1¢/ $1
WAGE / INCOME GAP [ $ ]
0.41
INEQUALITY / GINI INDEX
7,481
TOTAL POPULATION
3,759
MALE POPULATION
3,722
FEMALE POPULATION
100.99
MALES / 100 FEMALES
99.02
FEMALES / 100 MALES
35.1
MEDIAN AGE
3.7
AVG FAMILY SIZE
3.1
AVG HOUSEHOLD SIZE
4,278
LABOR FORCE [ PEOPLE ]
76.3%
PERCENT IN LABOR FORCE
2.0%
UNEMPLOYMENT RATE
Eagle Zip Codes
Eagle Area Codes
Income in Eagle
Income Overview in Eagle
Per Capita Income in Eagle is $41,572, while median incomes of families and households are $120,190 and $101,373 respectively.
| Characteristic | Number | Measure |
| Per Capita Income | 7,481 | $41,572 |
| Median Family Income | 1,750 | $120,190 |
| Mean Family Income | 1,750 | $141,535 |
| Median Household Income | 2,370 | $101,373 |
| Mean Household Income | 2,370 | $124,163 |
| Income Deficit | 1,750 | $0 |
| Wage / Income Gap (%) | 7,481 | 35.94% |
| Wage / Income Gap ($) | 7,481 | 64.06¢ per $1 |
| Gini / Inequality Index | 7,481 | 0.41 |
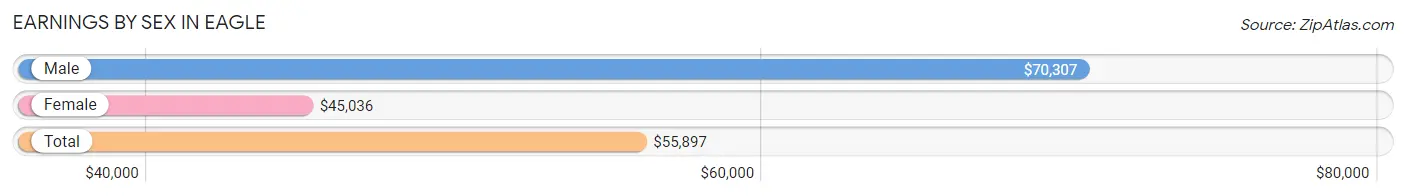
Earnings by Sex in Eagle
Average Earnings in Eagle are $55,897, $70,307 for men and $45,036 for women, a difference of 35.9%.
| Sex | Number | Average Earnings |
| Male | 2,236 (51.4%) | $70,307 |
| Female | 2,113 (48.6%) | $45,036 |
| Total | 4,349 (100.0%) | $55,897 |
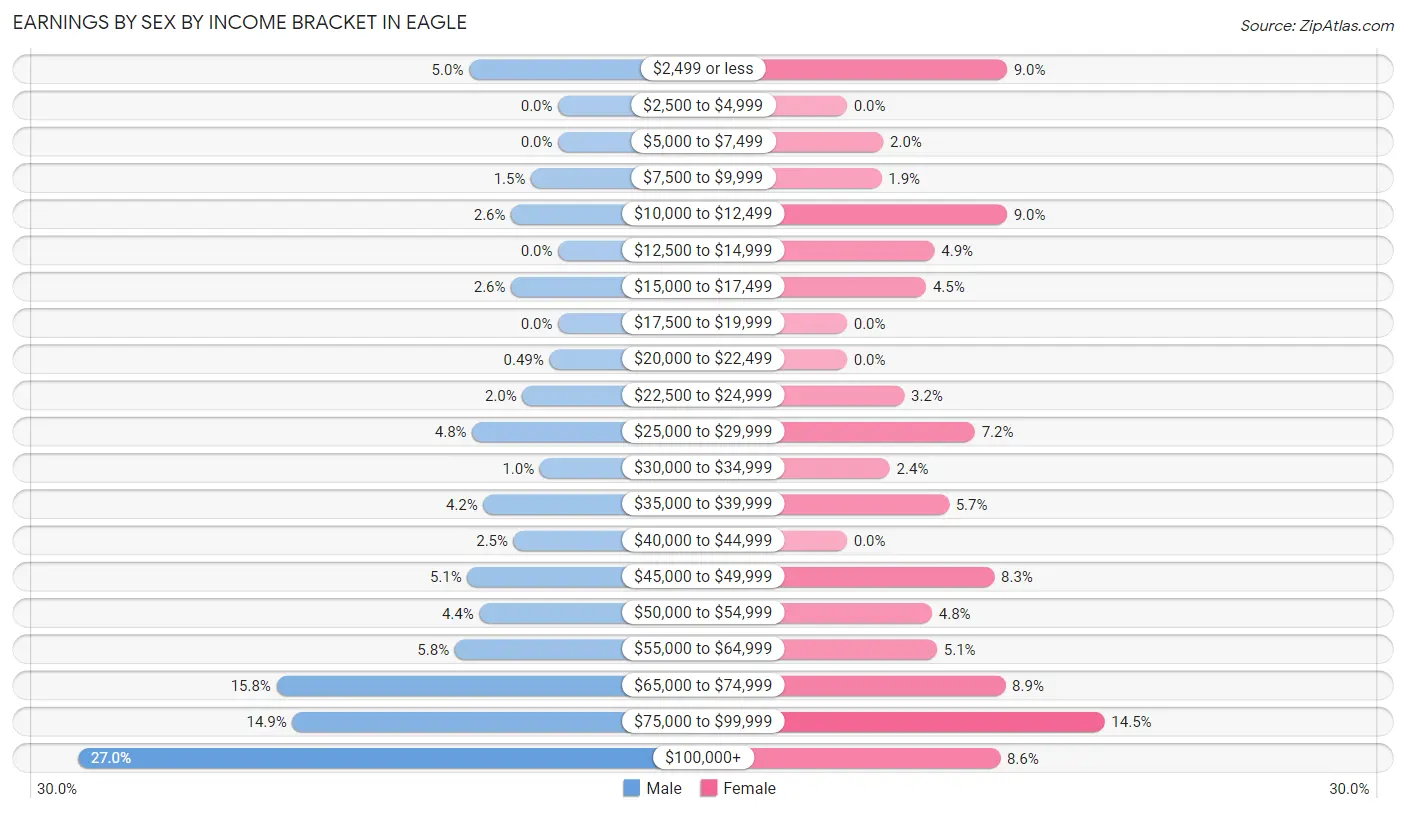
Earnings by Sex by Income Bracket in Eagle
The most common earnings brackets in Eagle are $100,000+ for men (604 | 27.0%) and $75,000 to $99,999 for women (306 | 14.5%).
| Income | Male | Female |
| $2,499 or less | 112 (5.0%) | 190 (9.0%) |
| $2,500 to $4,999 | 0 (0.0%) | 0 (0.0%) |
| $5,000 to $7,499 | 0 (0.0%) | 43 (2.0%) |
| $7,500 to $9,999 | 34 (1.5%) | 41 (1.9%) |
| $10,000 to $12,499 | 59 (2.6%) | 190 (9.0%) |
| $12,500 to $14,999 | 0 (0.0%) | 104 (4.9%) |
| $15,000 to $17,499 | 59 (2.6%) | 94 (4.4%) |
| $17,500 to $19,999 | 0 (0.0%) | 0 (0.0%) |
| $20,000 to $22,499 | 11 (0.5%) | 0 (0.0%) |
| $22,500 to $24,999 | 45 (2.0%) | 68 (3.2%) |
| $25,000 to $29,999 | 108 (4.8%) | 152 (7.2%) |
| $30,000 to $34,999 | 23 (1.0%) | 51 (2.4%) |
| $35,000 to $39,999 | 94 (4.2%) | 121 (5.7%) |
| $40,000 to $44,999 | 56 (2.5%) | 0 (0.0%) |
| $45,000 to $49,999 | 114 (5.1%) | 175 (8.3%) |
| $50,000 to $54,999 | 99 (4.4%) | 101 (4.8%) |
| $55,000 to $64,999 | 130 (5.8%) | 107 (5.1%) |
| $65,000 to $74,999 | 354 (15.8%) | 188 (8.9%) |
| $75,000 to $99,999 | 334 (14.9%) | 306 (14.5%) |
| $100,000+ | 604 (27.0%) | 182 (8.6%) |
| Total | 2,236 (100.0%) | 2,113 (100.0%) |
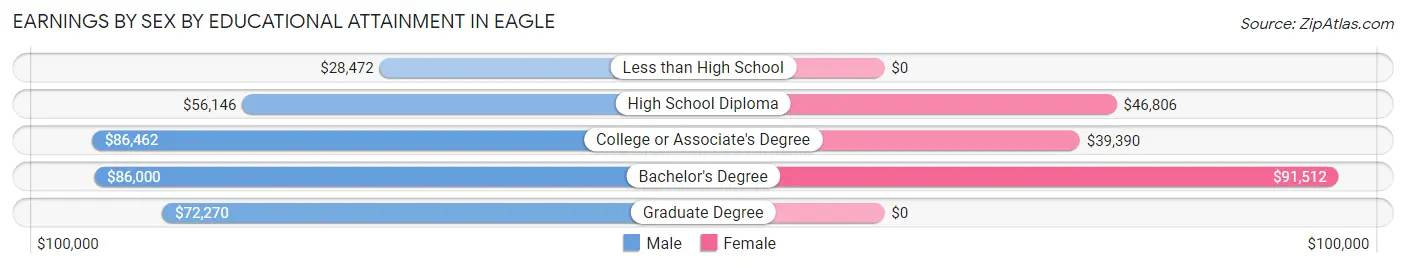
Earnings by Sex by Educational Attainment in Eagle
Average earnings in Eagle are $72,984 for men and $50,174 for women, a difference of 31.2%. Men with an educational attainment of college or associate's degree enjoy the highest average annual earnings of $86,462, while those with less than high school education earn the least with $28,472. Women with an educational attainment of bachelor's degree earn the most with the average annual earnings of $91,512, while those with college or associate's degree education have the smallest earnings of $39,390.
| Educational Attainment | Male Income | Female Income |
| Less than High School | $28,472 | $0 |
| High School Diploma | $56,146 | $46,806 |
| College or Associate's Degree | $86,462 | $39,390 |
| Bachelor's Degree | $86,000 | $91,512 |
| Graduate Degree | $72,270 | $0 |
| Total | $72,984 | $50,174 |
Family Income in Eagle
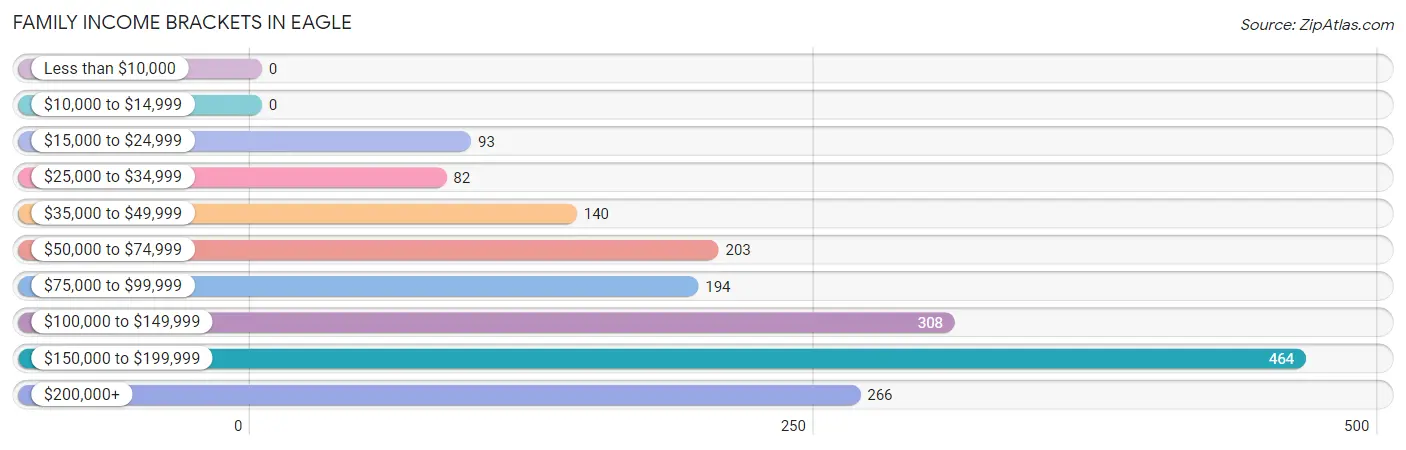
Family Income Brackets in Eagle
According to the Eagle family income data, there are 464 families falling into the $150,000 to $199,999 income range, which is the most common income bracket and makes up 26.5% of all families.
| Income Bracket | # Families | % Families |
| Less than $10,000 | 0 | 0.0% |
| $10,000 to $14,999 | 0 | 0.0% |
| $15,000 to $24,999 | 93 | 5.3% |
| $25,000 to $34,999 | 82 | 4.7% |
| $35,000 to $49,999 | 140 | 8.0% |
| $50,000 to $74,999 | 203 | 11.6% |
| $75,000 to $99,999 | 194 | 11.1% |
| $100,000 to $149,999 | 308 | 17.6% |
| $150,000 to $199,999 | 464 | 26.5% |
| $200,000+ | 266 | 15.2% |
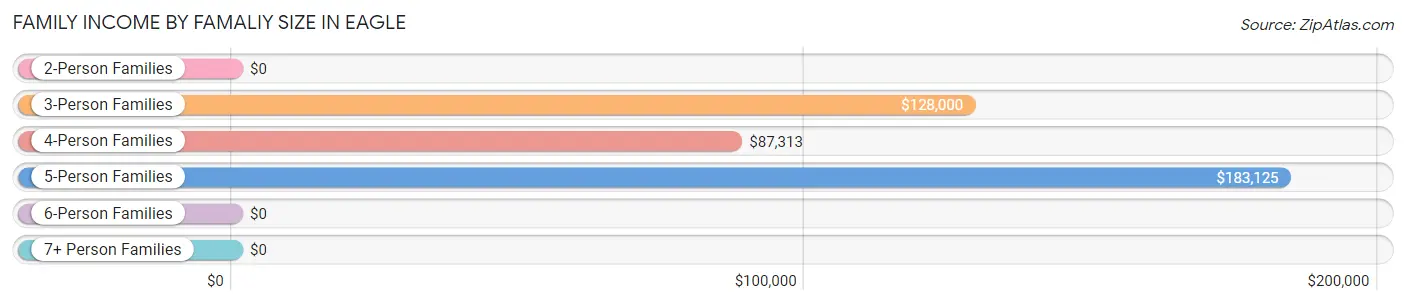
Family Income by Famaliy Size in Eagle
5-person families (122 | 7.0%) account for the highest median family income in Eagle with $183,125 per family, while 3-person families (600 | 34.3%) have the highest median income of $42,667 per family member.
| Income Bracket | # Families | Median Income |
| 2-Person Families | 391 (22.3%) | $0 |
| 3-Person Families | 600 (34.3%) | $128,000 |
| 4-Person Families | 574 (32.8%) | $87,313 |
| 5-Person Families | 122 (7.0%) | $183,125 |
| 6-Person Families | 63 (3.6%) | $0 |
| 7+ Person Families | 0 (0.0%) | $0 |
| Total | 1,750 (100.0%) | $120,190 |
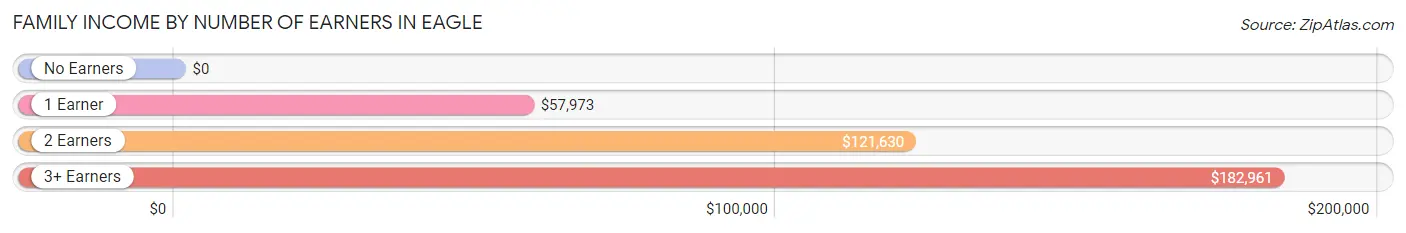
Family Income by Number of Earners in Eagle
| Number of Earners | # Families | Median Income |
| No Earners | 0 (0.0%) | $0 |
| 1 Earner | 504 (28.8%) | $57,973 |
| 2 Earners | 966 (55.2%) | $121,630 |
| 3+ Earners | 280 (16.0%) | $182,961 |
| Total | 1,750 (100.0%) | $120,190 |
Household Income in Eagle
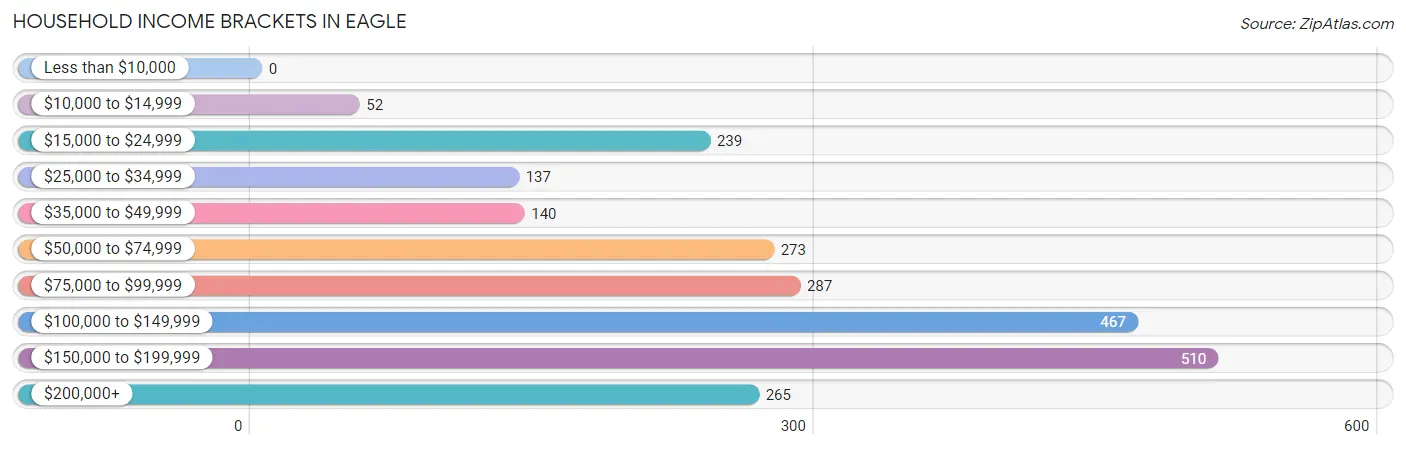
Household Income Brackets in Eagle
With 510 households falling in the category, the $150,000 to $199,999 income range is the most frequent in Eagle, accounting for 21.5% of all households.
| Income Bracket | # Households | % Households |
| Less than $10,000 | 0 | 0.0% |
| $10,000 to $14,999 | 52 | 2.2% |
| $15,000 to $24,999 | 239 | 10.1% |
| $25,000 to $34,999 | 137 | 5.8% |
| $35,000 to $49,999 | 140 | 5.9% |
| $50,000 to $74,999 | 273 | 11.5% |
| $75,000 to $99,999 | 287 | 12.1% |
| $100,000 to $149,999 | 467 | 19.7% |
| $150,000 to $199,999 | 510 | 21.5% |
| $200,000+ | 265 | 11.2% |
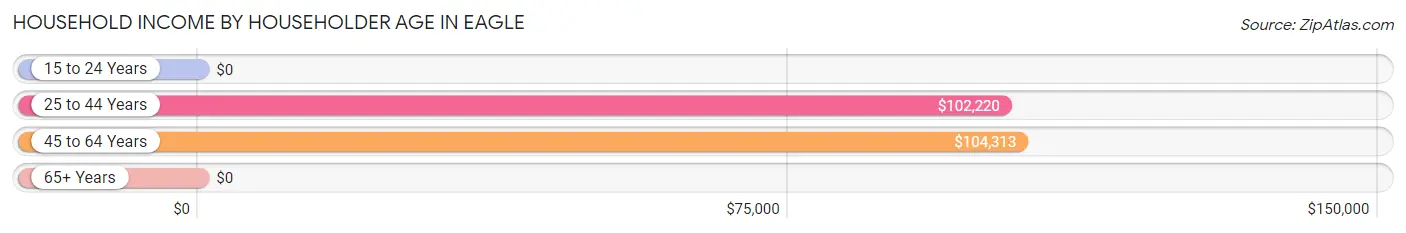
Household Income by Householder Age in Eagle
The median household income in Eagle is $101,373, with the highest median household income of $104,313 found in the 45 to 64 years age bracket for the primary householder. A total of 1,173 households (49.5%) fall into this category.
| Income Bracket | # Households | Median Income |
| 15 to 24 Years | 0 (0.0%) | $0 |
| 25 to 44 Years | 839 (35.4%) | $102,220 |
| 45 to 64 Years | 1,173 (49.5%) | $104,313 |
| 65+ Years | 358 (15.1%) | $0 |
| Total | 2,370 (100.0%) | $101,373 |
Poverty in Eagle
Income Below Poverty by Sex and Age in Eagle
With 6.5% poverty level for males and 7.7% for females among the residents of Eagle, 6 to 11 year old males and 16 and 17 year old females are the most vulnerable to poverty, with 83 males (18.4%) and 44 females (37.9%) in their respective age groups living below the poverty level.
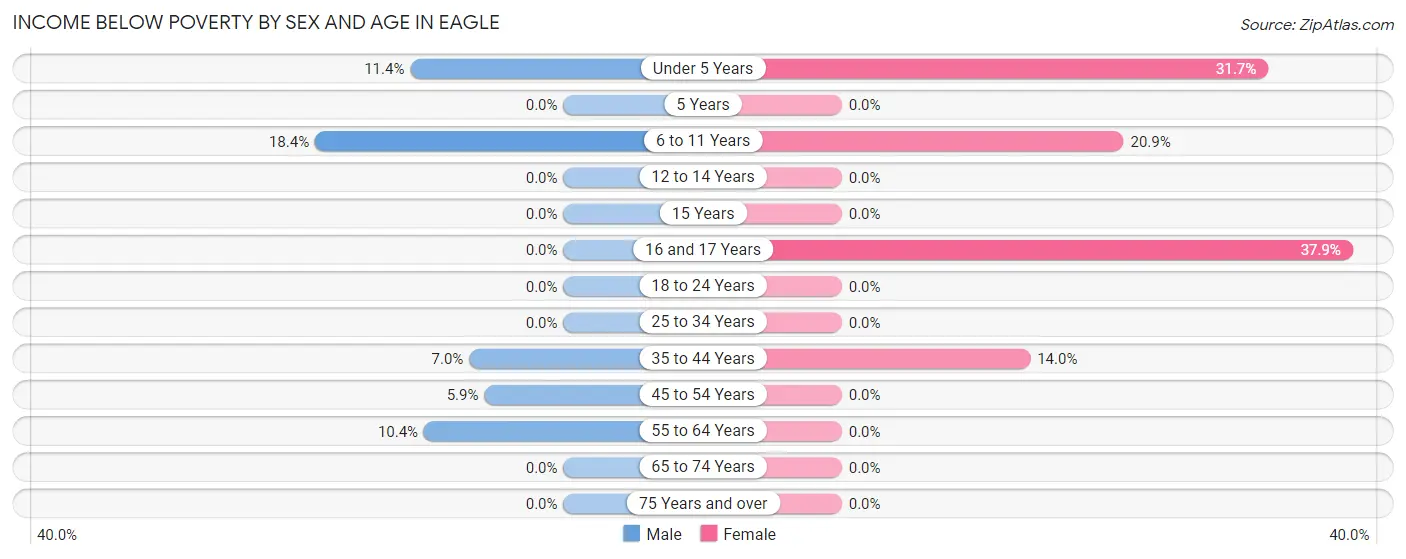
| Age Bracket | Male | Female |
| Under 5 Years | 24 (11.4%) | 69 (31.7%) |
| 5 Years | 0 (0.0%) | 0 (0.0%) |
| 6 to 11 Years | 83 (18.4%) | 64 (20.9%) |
| 12 to 14 Years | 0 (0.0%) | 0 (0.0%) |
| 15 Years | 0 (0.0%) | 0 (0.0%) |
| 16 and 17 Years | 0 (0.0%) | 44 (37.9%) |
| 18 to 24 Years | 0 (0.0%) | 0 (0.0%) |
| 25 to 34 Years | 0 (0.0%) | 0 (0.0%) |
| 35 to 44 Years | 48 (7.0%) | 110 (14.0%) |
| 45 to 54 Years | 31 (5.9%) | 0 (0.0%) |
| 55 to 64 Years | 53 (10.3%) | 0 (0.0%) |
| 65 to 74 Years | 0 (0.0%) | 0 (0.0%) |
| 75 Years and over | 0 (0.0%) | 0 (0.0%) |
| Total | 239 (6.5%) | 287 (7.7%) |
Income Above Poverty by Sex and Age in Eagle
According to the poverty statistics in Eagle, males aged 5 years and females aged 5 years are the age groups that are most secure financially, with 100.0% of males and 100.0% of females in these age groups living above the poverty line.
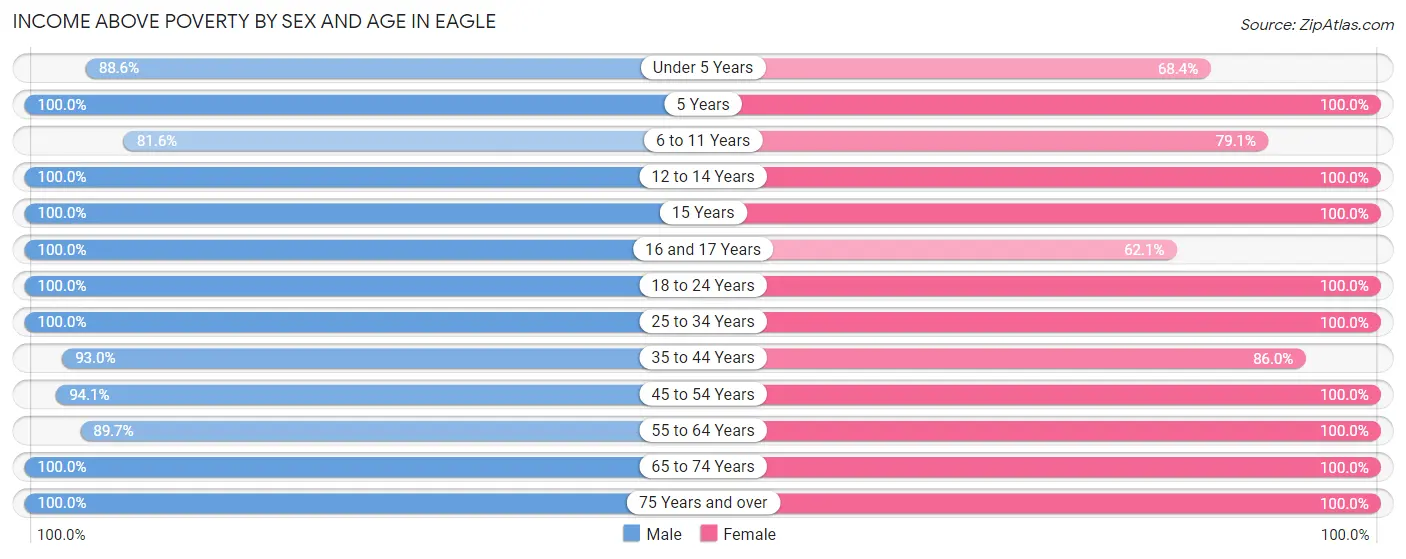
| Age Bracket | Male | Female |
| Under 5 Years | 187 (88.6%) | 149 (68.3%) |
| 5 Years | 58 (100.0%) | 12 (100.0%) |
| 6 to 11 Years | 367 (81.6%) | 242 (79.1%) |
| 12 to 14 Years | 187 (100.0%) | 243 (100.0%) |
| 15 Years | 121 (100.0%) | 68 (100.0%) |
| 16 and 17 Years | 112 (100.0%) | 72 (62.1%) |
| 18 to 24 Years | 295 (100.0%) | 493 (100.0%) |
| 25 to 34 Years | 235 (100.0%) | 548 (100.0%) |
| 35 to 44 Years | 639 (93.0%) | 676 (86.0%) |
| 45 to 54 Years | 497 (94.1%) | 538 (100.0%) |
| 55 to 64 Years | 459 (89.6%) | 181 (100.0%) |
| 65 to 74 Years | 241 (100.0%) | 156 (100.0%) |
| 75 Years and over | 46 (100.0%) | 47 (100.0%) |
| Total | 3,444 (93.5%) | 3,425 (92.3%) |
Income Below Poverty Among Married-Couple Families in Eagle
The poverty statistics for married-couple families in Eagle show that 2.8% or 36 of the total 1,297 families live below the poverty line. Families with 1 or 2 children have the highest poverty rate of 4.4%, comprising of 36 families. On the other hand, families with no children have the lowest poverty rate of 0.0%, which includes 0 families.
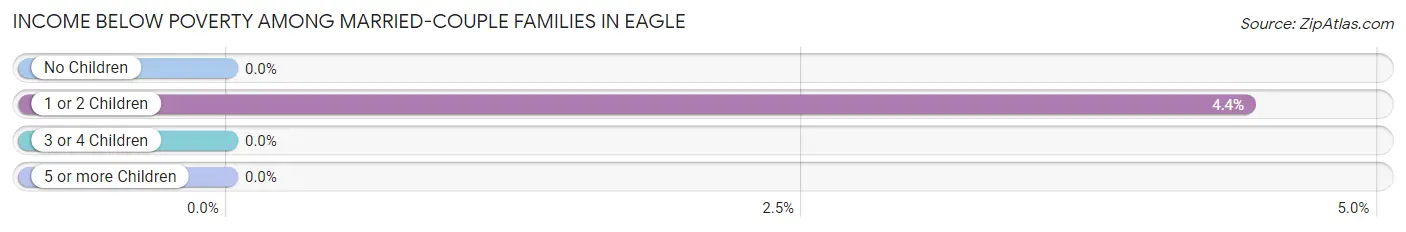
| Children | Above Poverty | Below Poverty |
| No Children | 424 (100.0%) | 0 (0.0%) |
| 1 or 2 Children | 777 (95.6%) | 36 (4.4%) |
| 3 or 4 Children | 60 (100.0%) | 0 (0.0%) |
| 5 or more Children | 0 (0.0%) | 0 (0.0%) |
| Total | 1,261 (97.2%) | 36 (2.8%) |
Income Below Poverty Among Single-Parent Households in Eagle
According to the poverty data in Eagle, 15.1% or 31 single-father households and 16.1% or 40 single-mother households are living below the poverty line. Among single-father households, those with 3 or 4 children have the highest poverty rate, with 31 households (100.0%) experiencing poverty. Likewise, among single-mother households, those with 3 or 4 children have the highest poverty rate, with 40 households (38.8%) falling below the poverty line.
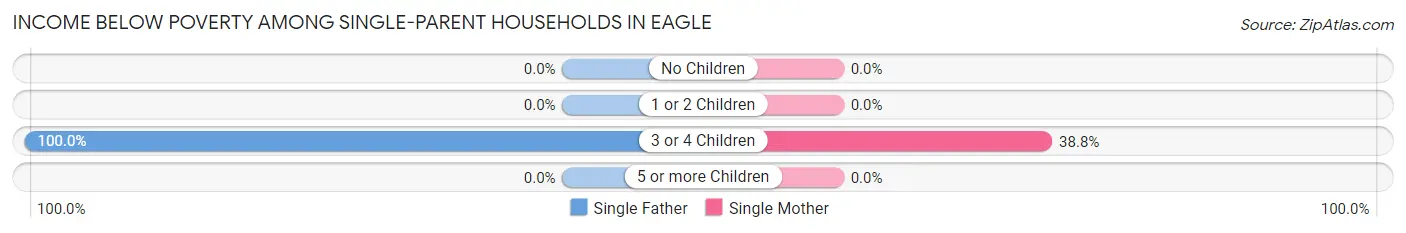
| Children | Single Father | Single Mother |
| No Children | 0 (0.0%) | 0 (0.0%) |
| 1 or 2 Children | 0 (0.0%) | 0 (0.0%) |
| 3 or 4 Children | 31 (100.0%) | 40 (38.8%) |
| 5 or more Children | 0 (0.0%) | 0 (0.0%) |
| Total | 31 (15.1%) | 40 (16.1%) |
Income Below Poverty Among Married-Couple vs Single-Parent Households in Eagle
The poverty data for Eagle shows that 36 of the married-couple family households (2.8%) and 71 of the single-parent households (15.7%) are living below the poverty level. Within the married-couple family households, those with 1 or 2 children have the highest poverty rate, with 36 households (4.4%) falling below the poverty line. Among the single-parent households, those with 3 or 4 children have the highest poverty rate, with 71 household (53.0%) living below poverty.
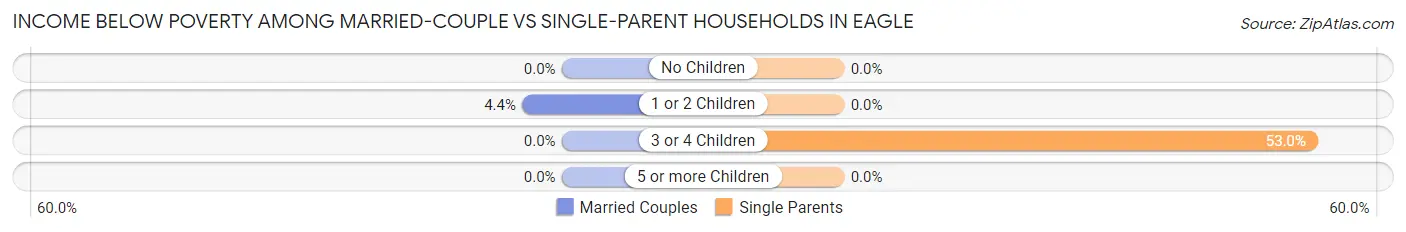
| Children | Married-Couple Families | Single-Parent Households |
| No Children | 0 (0.0%) | 0 (0.0%) |
| 1 or 2 Children | 36 (4.4%) | 0 (0.0%) |
| 3 or 4 Children | 0 (0.0%) | 71 (53.0%) |
| 5 or more Children | 0 (0.0%) | 0 (0.0%) |
| Total | 36 (2.8%) | 71 (15.7%) |
Race in Eagle
The most populous races in Eagle are White / Caucasian (6,212 | 83.0%), Hispanic or Latino (2,056 | 27.5%), and Two or more Races (1,102 | 14.7%).
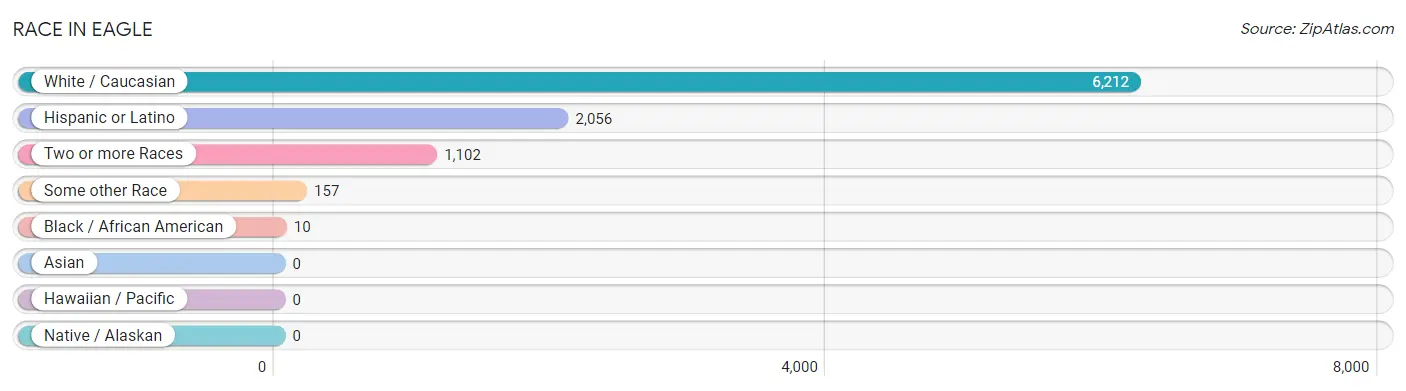
| Race | # Population | % Population |
| Asian | 0 | 0.0% |
| Black / African American | 10 | 0.1% |
| Hawaiian / Pacific | 0 | 0.0% |
| Hispanic or Latino | 2,056 | 27.5% |
| Native / Alaskan | 0 | 0.0% |
| White / Caucasian | 6,212 | 83.0% |
| Two or more Races | 1,102 | 14.7% |
| Some other Race | 157 | 2.1% |
| Total | 7,481 | 100.0% |
Ancestry in Eagle
The most populous ancestries reported in Eagle are Mexican (2,016 | 27.0%), German (931 | 12.4%), English (836 | 11.2%), Irish (577 | 7.7%), and Italian (433 | 5.8%), together accounting for 64.1% of all Eagle residents.
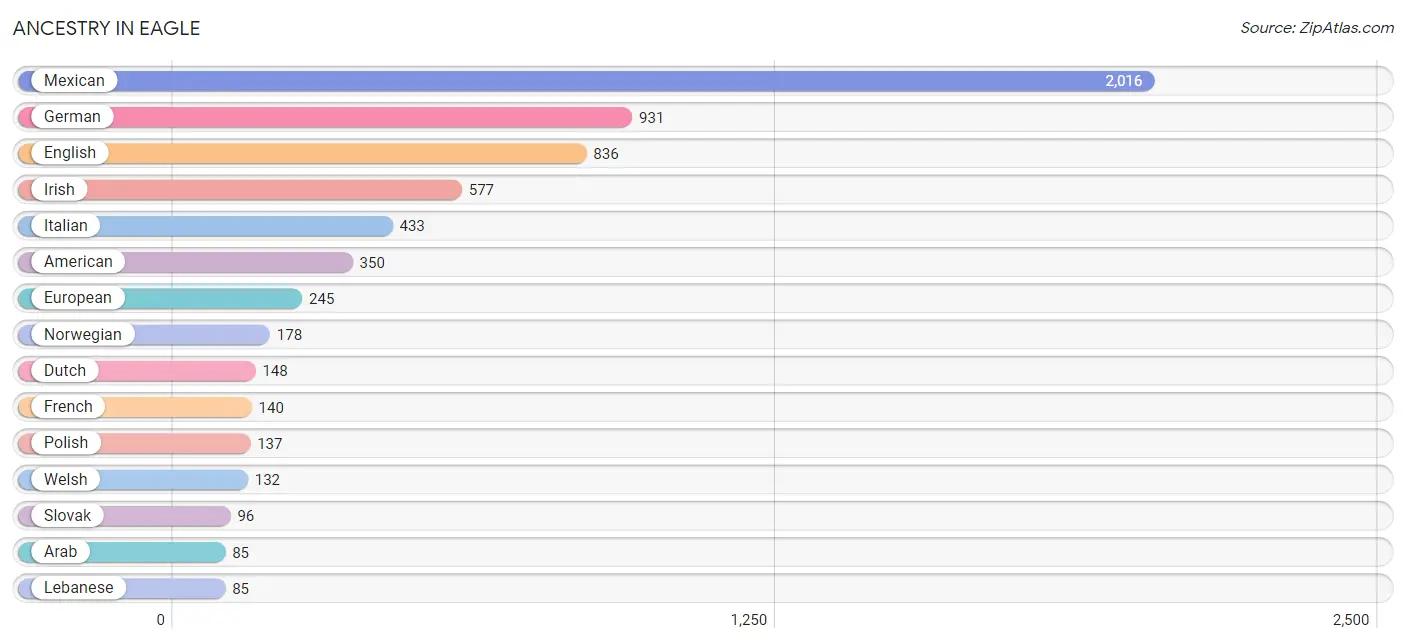
| Ancestry | # Population | % Population |
| American | 350 | 4.7% |
| Arab | 85 | 1.1% |
| Argentinean | 29 | 0.4% |
| Austrian | 32 | 0.4% |
| Dutch | 148 | 2.0% |
| English | 836 | 11.2% |
| European | 245 | 3.3% |
| Finnish | 60 | 0.8% |
| French | 140 | 1.9% |
| German | 931 | 12.4% |
| Irish | 577 | 7.7% |
| Italian | 433 | 5.8% |
| Lebanese | 85 | 1.1% |
| Mexican | 2,016 | 27.0% |
| Norwegian | 178 | 2.4% |
| Polish | 137 | 1.8% |
| Russian | 60 | 0.8% |
| Slovak | 96 | 1.3% |
| South American | 29 | 0.4% |
| Spaniard | 11 | 0.2% |
| Swedish | 54 | 0.7% |
| Ukrainian | 44 | 0.6% |
| Welsh | 132 | 1.8% | View All 23 Rows |
Immigrants in Eagle
The most numerous immigrant groups reported in Eagle came from Latin America (682 | 9.1%), Central America (612 | 8.2%), Mexico (576 | 7.7%), Canada (62 | 0.8%), and Europe (48 | 0.6%), together accounting for 26.5% of all Eagle residents.
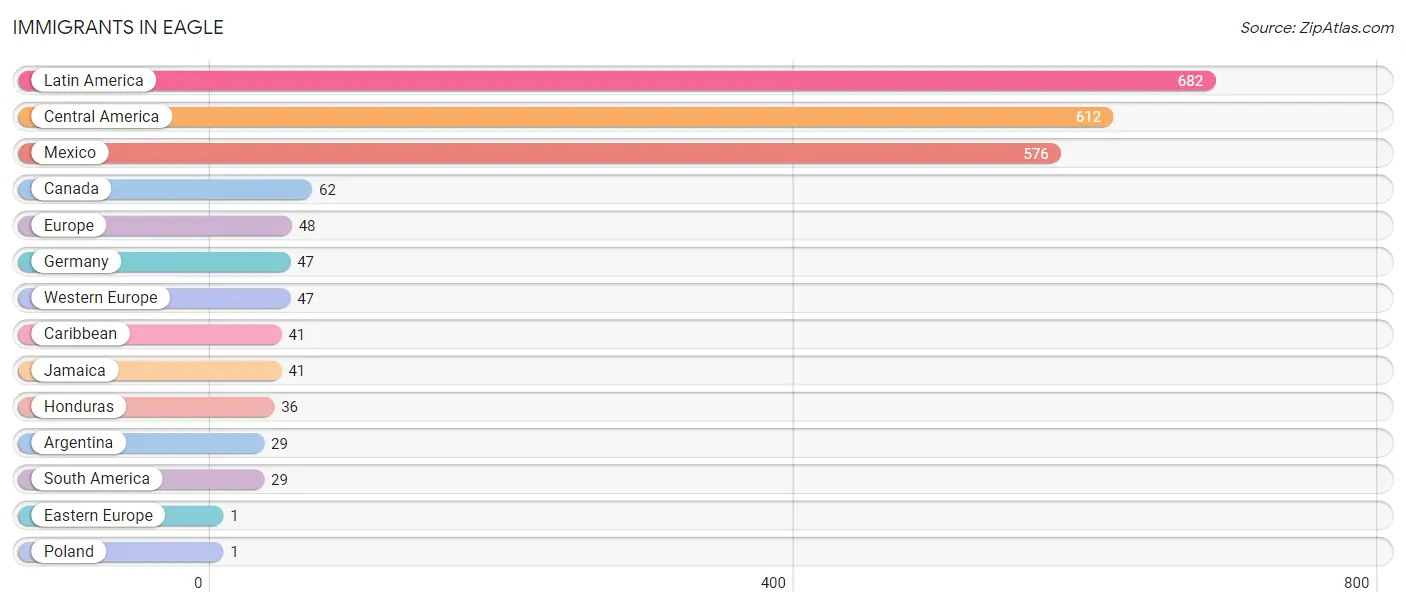
| Immigration Origin | # Population | % Population |
| Argentina | 29 | 0.4% |
| Canada | 62 | 0.8% |
| Caribbean | 41 | 0.5% |
| Central America | 612 | 8.2% |
| Eastern Europe | 1 | 0.0% |
| Europe | 48 | 0.6% |
| Germany | 47 | 0.6% |
| Honduras | 36 | 0.5% |
| Jamaica | 41 | 0.5% |
| Latin America | 682 | 9.1% |
| Mexico | 576 | 7.7% |
| Poland | 1 | 0.0% |
| South America | 29 | 0.4% |
| Western Europe | 47 | 0.6% | View All 14 Rows |
Sex and Age in Eagle
Sex and Age in Eagle
The most populous age groups in Eagle are 15 to 19 Years (411 | 10.9%) for men and 35 to 39 Years (559 | 15.0%) for women.
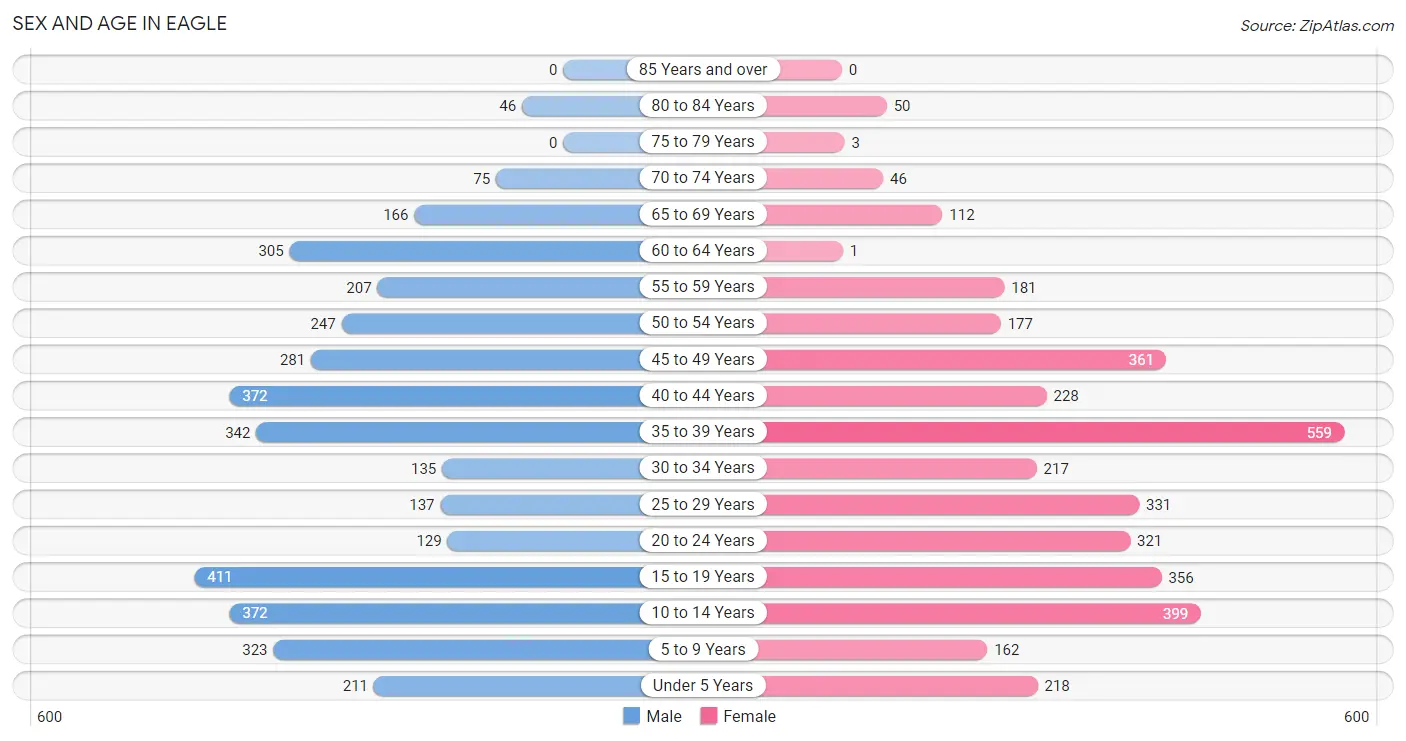
| Age Bracket | Male | Female |
| Under 5 Years | 211 (5.6%) | 218 (5.9%) |
| 5 to 9 Years | 323 (8.6%) | 162 (4.3%) |
| 10 to 14 Years | 372 (9.9%) | 399 (10.7%) |
| 15 to 19 Years | 411 (10.9%) | 356 (9.6%) |
| 20 to 24 Years | 129 (3.4%) | 321 (8.6%) |
| 25 to 29 Years | 137 (3.6%) | 331 (8.9%) |
| 30 to 34 Years | 135 (3.6%) | 217 (5.8%) |
| 35 to 39 Years | 342 (9.1%) | 559 (15.0%) |
| 40 to 44 Years | 372 (9.9%) | 228 (6.1%) |
| 45 to 49 Years | 281 (7.5%) | 361 (9.7%) |
| 50 to 54 Years | 247 (6.6%) | 177 (4.8%) |
| 55 to 59 Years | 207 (5.5%) | 181 (4.9%) |
| 60 to 64 Years | 305 (8.1%) | 1 (0.0%) |
| 65 to 69 Years | 166 (4.4%) | 112 (3.0%) |
| 70 to 74 Years | 75 (2.0%) | 46 (1.2%) |
| 75 to 79 Years | 0 (0.0%) | 3 (0.1%) |
| 80 to 84 Years | 46 (1.2%) | 50 (1.3%) |
| 85 Years and over | 0 (0.0%) | 0 (0.0%) |
| Total | 3,759 (100.0%) | 3,722 (100.0%) |
Families and Households in Eagle
Median Family Size in Eagle
The median family size in Eagle is 3.68 persons per family, with single female/mother families (248 | 14.2%) accounting for the largest median family size of 4.51 persons per family. On the other hand, single male/father families (205 | 11.7%) represent the smallest median family size with 3.36 persons per family.
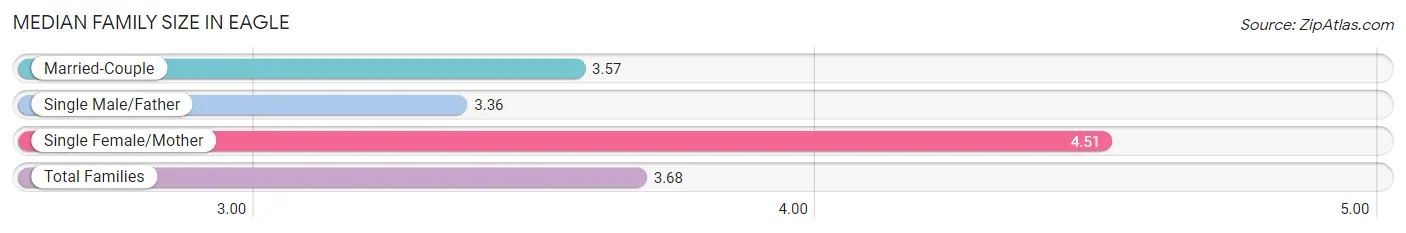
| Family Type | # Families | Family Size |
| Married-Couple | 1,297 (74.1%) | 3.57 |
| Single Male/Father | 205 (11.7%) | 3.36 |
| Single Female/Mother | 248 (14.2%) | 4.51 |
| Total Families | 1,750 (100.0%) | 3.68 |
Median Household Size in Eagle
The median household size in Eagle is 3.12 persons per household, with single female/mother households (248 | 10.5%) accounting for the largest median household size of 4.51 persons per household. non-family households (620 | 26.2%) represent the smallest median household size with 1.10 persons per household.
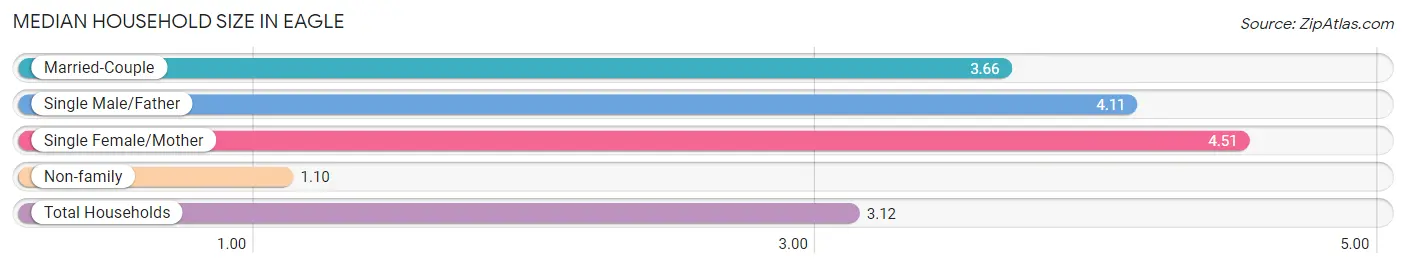
| Household Type | # Households | Household Size |
| Married-Couple | 1,297 (54.7%) | 3.66 |
| Single Male/Father | 205 (8.6%) | 4.11 |
| Single Female/Mother | 248 (10.5%) | 4.51 |
| Non-family | 620 (26.2%) | 1.10 |
| Total Households | 2,370 (100.0%) | 3.12 |
Household Size by Marriage Status in Eagle
Out of a total of 2,370 households in Eagle, 1,750 (73.8%) are family households, while 620 (26.2%) are nonfamily households. The most numerous type of family households are 3-person households, comprising 644, and the most common type of nonfamily households are 1-person households, comprising 561.
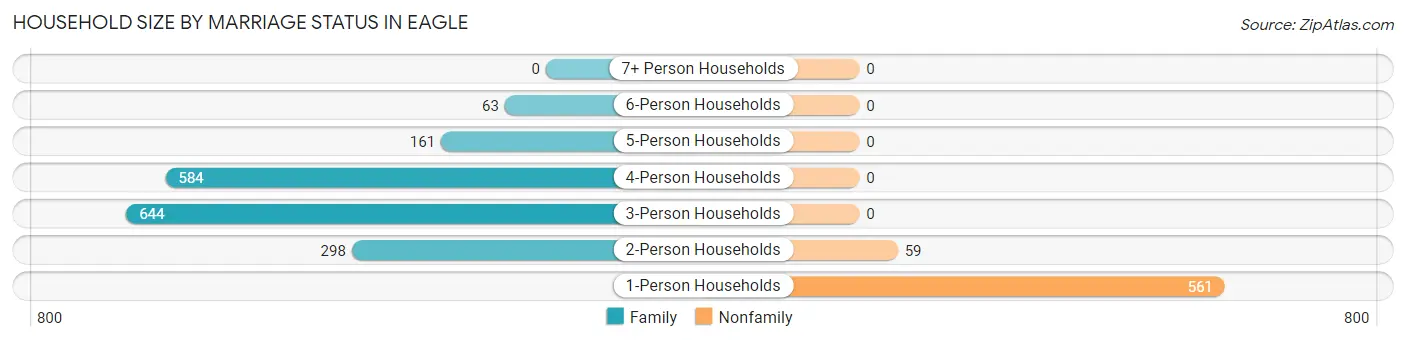
| Household Size | Family Households | Nonfamily Households |
| 1-Person Households | - | 561 (23.7%) |
| 2-Person Households | 298 (12.6%) | 59 (2.5%) |
| 3-Person Households | 644 (27.2%) | 0 (0.0%) |
| 4-Person Households | 584 (24.6%) | 0 (0.0%) |
| 5-Person Households | 161 (6.8%) | 0 (0.0%) |
| 6-Person Households | 63 (2.7%) | 0 (0.0%) |
| 7+ Person Households | 0 (0.0%) | 0 (0.0%) |
| Total | 1,750 (73.8%) | 620 (26.2%) |
Female Fertility in Eagle
Fertility by Age in Eagle
Average fertility rate in Eagle is 15.0 births per 1,000 women. Women in the age bracket of 35 to 50 years have the highest fertility rate with 29.0 births per 1,000 women. Women in the age bracket of 35 to 50 years acount for 100.0% of all women with births.
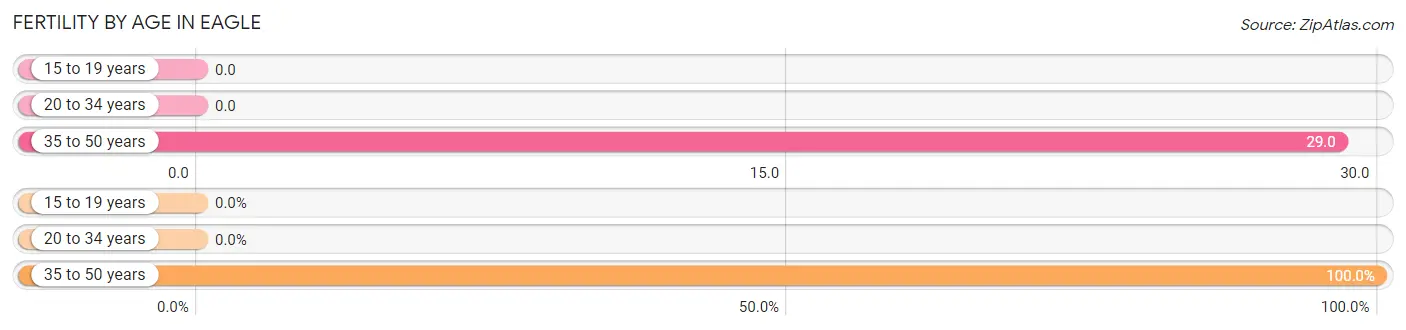
| Age Bracket | Women with Births | Births / 1,000 Women |
| 15 to 19 years | 0 (0.0%) | 0.0 |
| 20 to 34 years | 0 (0.0%) | 0.0 |
| 35 to 50 years | 36 (100.0%) | 29.0 |
| Total | 36 (100.0%) | 15.0 |
Fertility by Age by Marriage Status in Eagle
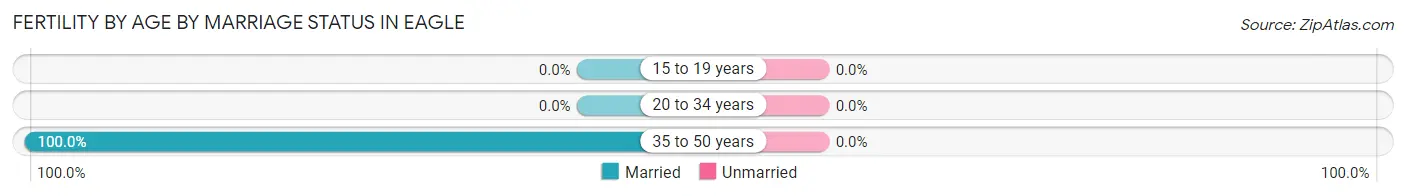
| Age Bracket | Married | Unmarried |
| 15 to 19 years | 0 (0.0%) | 0 (0.0%) |
| 20 to 34 years | 0 (0.0%) | 0 (0.0%) |
| 35 to 50 years | 36 (100.0%) | 0 (0.0%) |
| Total | 36 (100.0%) | 0 (0.0%) |
Fertility by Education in Eagle
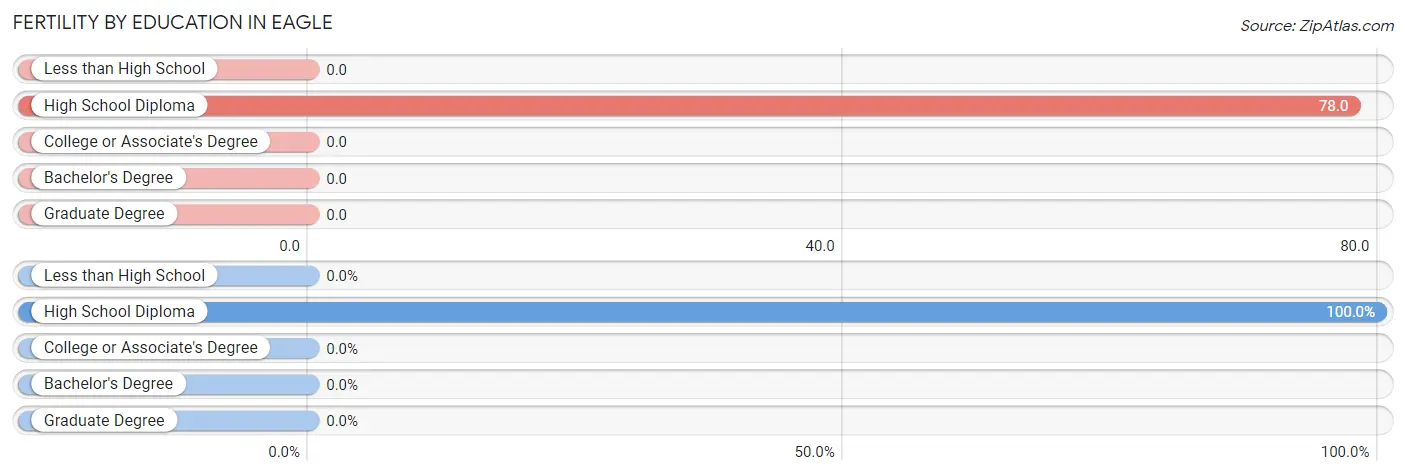
| Educational Attainment | Women with Births | Births / 1,000 Women |
| Less than High School | 0 (0.0%) | 0.0 |
| High School Diploma | 36 (100.0%) | 78.0 |
| College or Associate's Degree | 0 (0.0%) | 0.0 |
| Bachelor's Degree | 0 (0.0%) | 0.0 |
| Graduate Degree | 0 (0.0%) | 0.0 |
| Total | 36 (100.0%) | 15.0 |
Fertility by Education by Marriage Status in Eagle
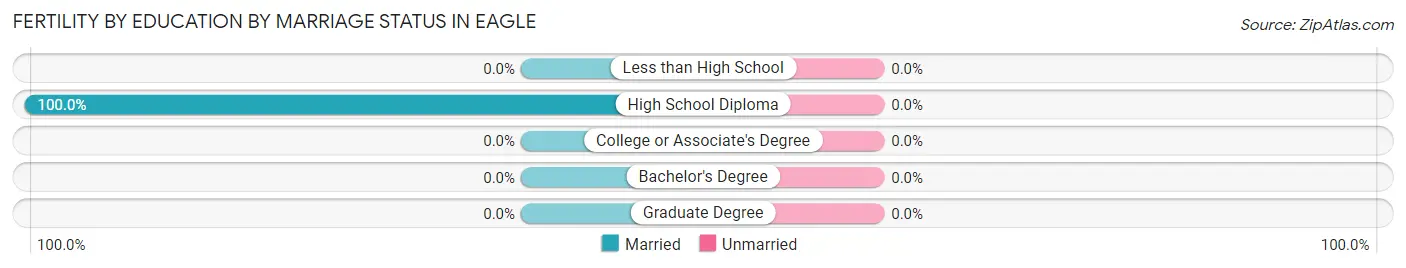
| Educational Attainment | Married | Unmarried |
| Less than High School | 0 (0.0%) | 0 (0.0%) |
| High School Diploma | 36 (100.0%) | 0 (0.0%) |
| College or Associate's Degree | 0 (0.0%) | 0 (0.0%) |
| Bachelor's Degree | 0 (0.0%) | 0 (0.0%) |
| Graduate Degree | 0 (0.0%) | 0 (0.0%) |
| Total | 36 (100.0%) | 0 (0.0%) |
Employment Characteristics in Eagle
Employment by Class of Employer in Eagle
Among the 4,104 employed individuals in Eagle, private company employees (2,702 | 65.8%), local government employees (469 | 11.4%), and self-employed (not incorporated) (362 | 8.8%) make up the most common classes of employment.
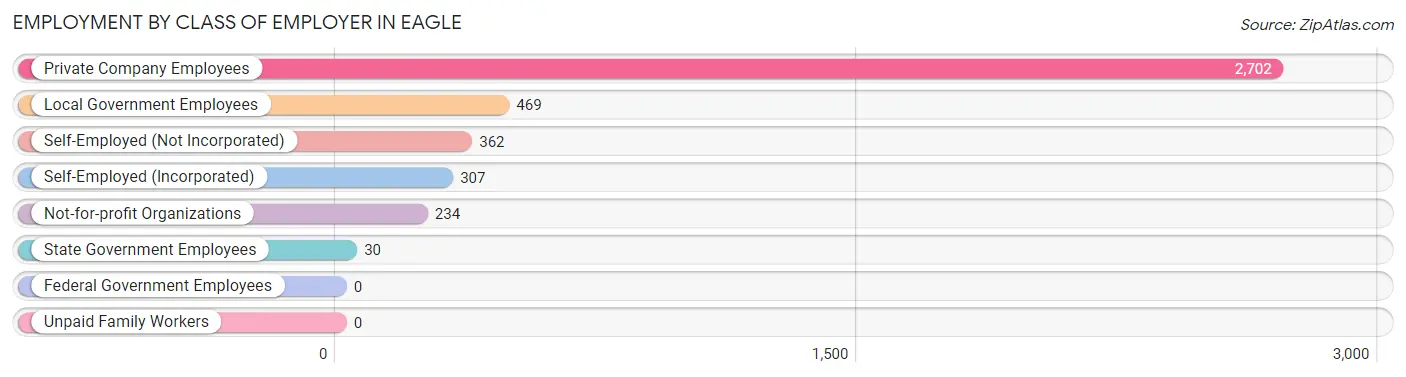
| Employer Class | # Employees | % Employees |
| Private Company Employees | 2,702 | 65.8% |
| Self-Employed (Incorporated) | 307 | 7.5% |
| Self-Employed (Not Incorporated) | 362 | 8.8% |
| Not-for-profit Organizations | 234 | 5.7% |
| Local Government Employees | 469 | 11.4% |
| State Government Employees | 30 | 0.7% |
| Federal Government Employees | 0 | 0.0% |
| Unpaid Family Workers | 0 | 0.0% |
| Total | 4,104 | 100.0% |
Employment Status by Age in Eagle
According to the labor force statistics for Eagle, out of the total population over 16 years of age (5,607), 76.3% or 4,278 individuals are in the labor force, with 2.0% or 86 of them unemployed. The age group with the highest labor force participation rate is 45 to 54 years, with 96.9% or 1,033 individuals in the labor force. Within the labor force, the 20 to 24 years age range has the highest percentage of unemployed individuals, with 12.9% or 51 of them being unemployed.
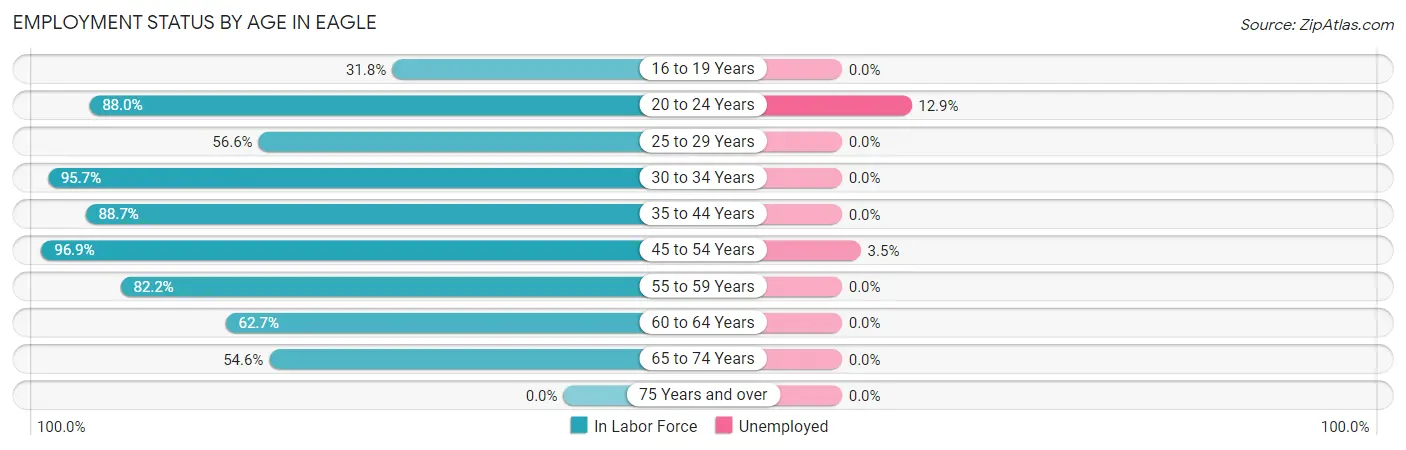
| Age Bracket | In Labor Force | Unemployed |
| 16 to 19 Years | 184 (31.8%) | 0 (0.0%) |
| 20 to 24 Years | 396 (88.0%) | 51 (12.9%) |
| 25 to 29 Years | 265 (56.6%) | 0 (0.0%) |
| 30 to 34 Years | 337 (95.7%) | 0 (0.0%) |
| 35 to 44 Years | 1,331 (88.7%) | 0 (0.0%) |
| 45 to 54 Years | 1,033 (96.9%) | 36 (3.5%) |
| 55 to 59 Years | 319 (82.2%) | 0 (0.0%) |
| 60 to 64 Years | 192 (62.7%) | 0 (0.0%) |
| 65 to 74 Years | 218 (54.6%) | 0 (0.0%) |
| 75 Years and over | 0 (0.0%) | 0 (0.0%) |
| Total | 4,278 (76.3%) | 86 (2.0%) |
Employment Status by Educational Attainment in Eagle
According to labor force statistics for Eagle, 85.2% of individuals (3,477) out of the total population between 25 and 64 years of age (4,081) are in the labor force, with 1.0% or 35 of them being unemployed. The group with the highest labor force participation rate are those with the educational attainment of college / associate degree, with 95.8% or 597 individuals in the labor force. Within the labor force, individuals with college / associate degree education have the highest percentage of unemployment, with 6.0% or 36 of them being unemployed.
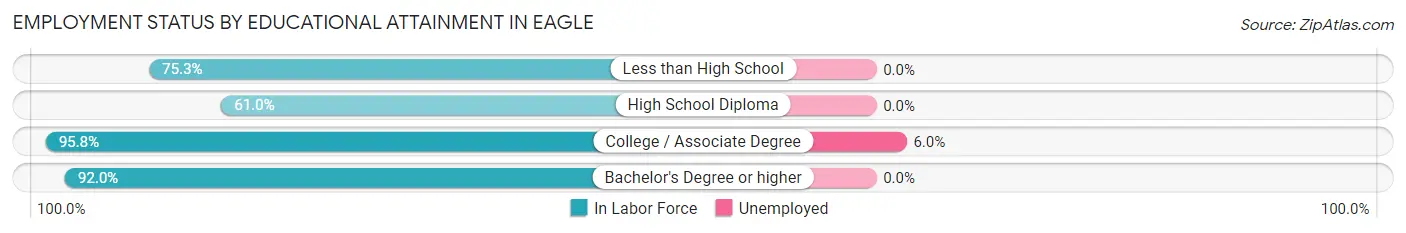
| Educational Attainment | In Labor Force | Unemployed |
| Less than High School | 326 (75.3%) | 0 (0.0%) |
| High School Diploma | 448 (61.0%) | 0 (0.0%) |
| College / Associate Degree | 597 (95.8%) | 37 (6.0%) |
| Bachelor's Degree or higher | 2,107 (92.0%) | 0 (0.0%) |
| Total | 3,477 (85.2%) | 41 (1.0%) |
Employment Occupations by Sex in Eagle
Management, Business, Science and Arts Occupations
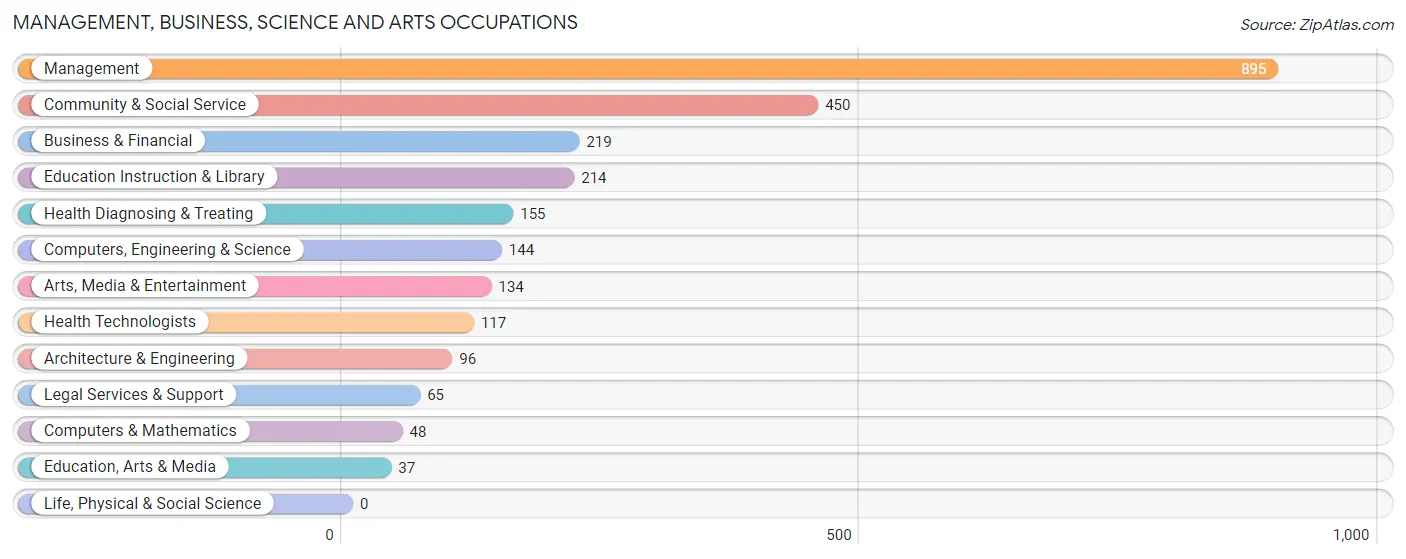
The most common Management, Business, Science and Arts occupations in Eagle are Management (895 | 21.4%), Community & Social Service (450 | 10.7%), Business & Financial (219 | 5.2%), Education Instruction & Library (214 | 5.1%), and Health Diagnosing & Treating (155 | 3.7%).
Management, Business, Science and Arts Occupations by Sex
Within the Management, Business, Science and Arts occupations in Eagle, the most male-oriented occupations are Computers, Engineering & Science (100.0%), Computers & Mathematics (100.0%), and Architecture & Engineering (100.0%), while the most female-oriented occupations are Education, Arts & Media (100.0%), Health Diagnosing & Treating (100.0%), and Health Technologists (100.0%).
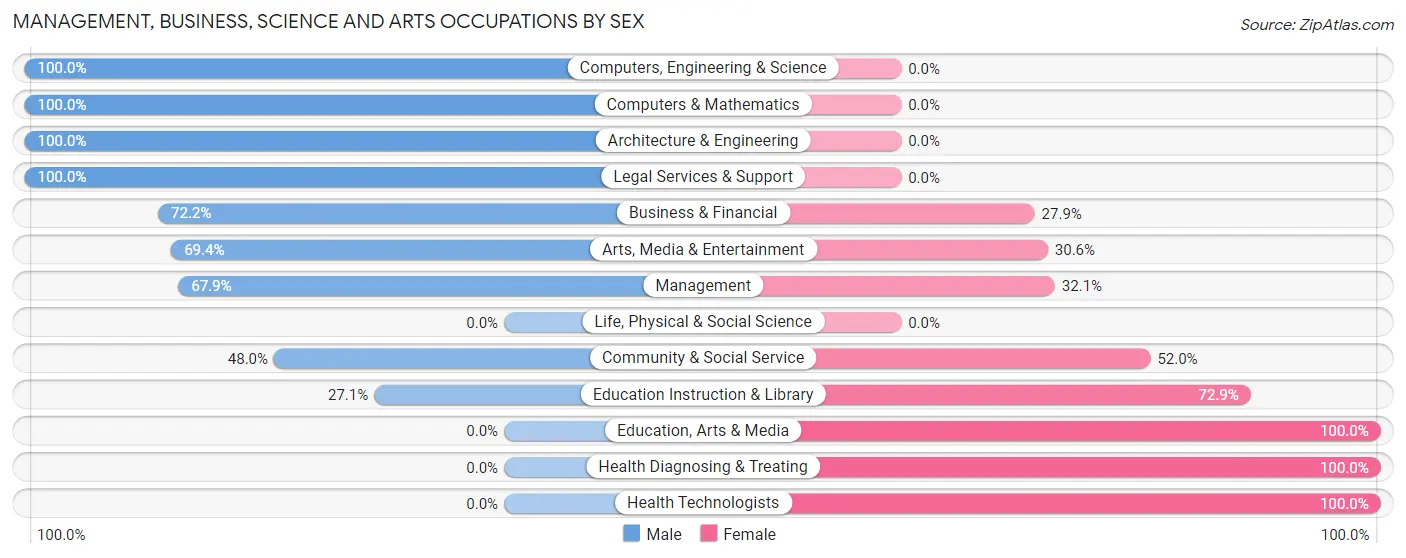
| Occupation | Male | Female |
| Management | 608 (67.9%) | 287 (32.1%) |
| Business & Financial | 158 (72.2%) | 61 (27.9%) |
| Computers, Engineering & Science | 144 (100.0%) | 0 (0.0%) |
| Computers & Mathematics | 48 (100.0%) | 0 (0.0%) |
| Architecture & Engineering | 96 (100.0%) | 0 (0.0%) |
| Life, Physical & Social Science | 0 (0.0%) | 0 (0.0%) |
| Community & Social Service | 216 (48.0%) | 234 (52.0%) |
| Education, Arts & Media | 0 (0.0%) | 37 (100.0%) |
| Legal Services & Support | 65 (100.0%) | 0 (0.0%) |
| Education Instruction & Library | 58 (27.1%) | 156 (72.9%) |
| Arts, Media & Entertainment | 93 (69.4%) | 41 (30.6%) |
| Health Diagnosing & Treating | 0 (0.0%) | 155 (100.0%) |
| Health Technologists | 0 (0.0%) | 117 (100.0%) |
| Total (Category) | 1,126 (60.4%) | 737 (39.6%) |
| Total (Overall) | 2,108 (50.3%) | 2,081 (49.7%) |
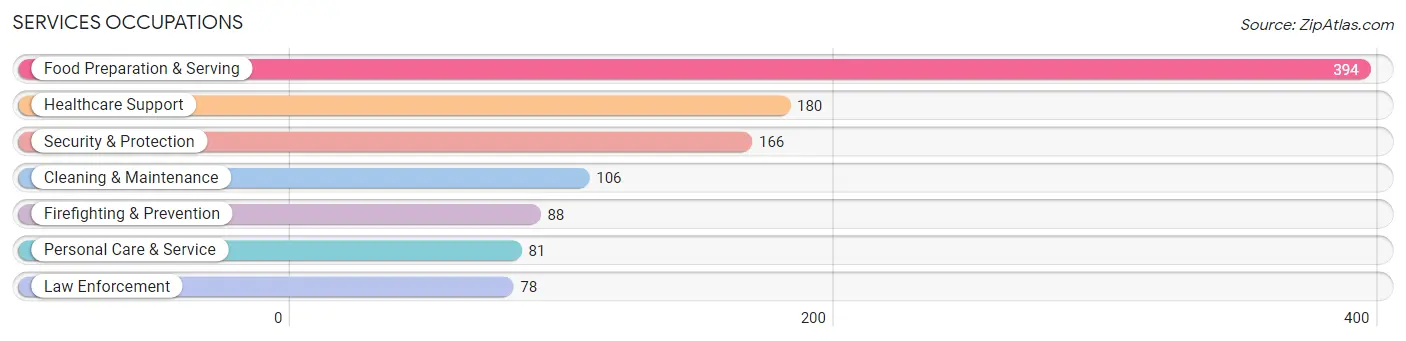
Services Occupations
The most common Services occupations in Eagle are Food Preparation & Serving (394 | 9.4%), Healthcare Support (180 | 4.3%), Security & Protection (166 | 4.0%), Cleaning & Maintenance (106 | 2.5%), and Firefighting & Prevention (88 | 2.1%).
Services Occupations by Sex
Within the Services occupations in Eagle, the most male-oriented occupations are Security & Protection (100.0%), Firefighting & Prevention (100.0%), and Law Enforcement (100.0%), while the most female-oriented occupations are Personal Care & Service (100.0%), Food Preparation & Serving (74.4%), and Healthcare Support (62.2%).
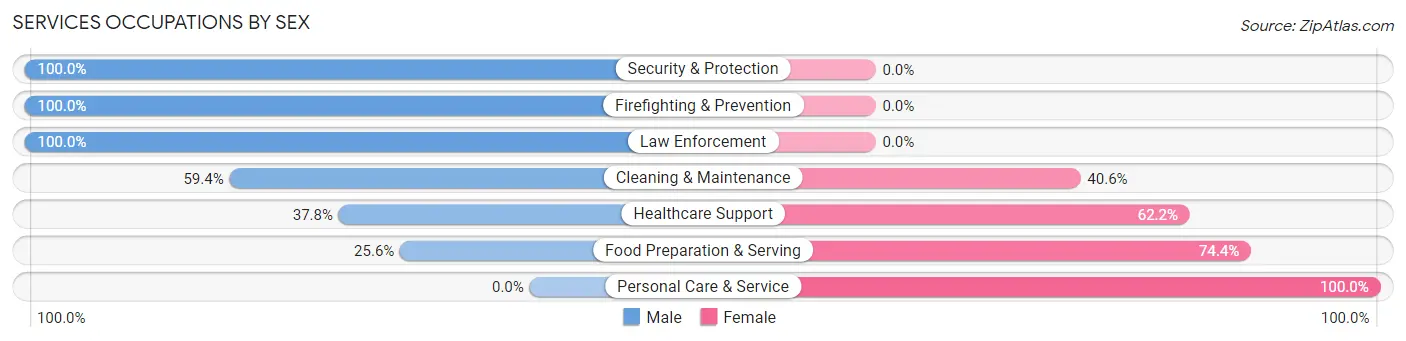
| Occupation | Male | Female |
| Healthcare Support | 68 (37.8%) | 112 (62.2%) |
| Security & Protection | 166 (100.0%) | 0 (0.0%) |
| Firefighting & Prevention | 88 (100.0%) | 0 (0.0%) |
| Law Enforcement | 78 (100.0%) | 0 (0.0%) |
| Food Preparation & Serving | 101 (25.6%) | 293 (74.4%) |
| Cleaning & Maintenance | 63 (59.4%) | 43 (40.6%) |
| Personal Care & Service | 0 (0.0%) | 81 (100.0%) |
| Total (Category) | 398 (42.9%) | 529 (57.1%) |
| Total (Overall) | 2,108 (50.3%) | 2,081 (49.7%) |
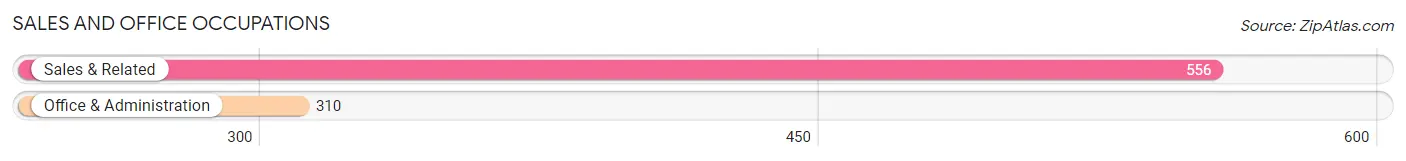
Sales and Office Occupations
The most common Sales and Office occupations in Eagle are Sales & Related (556 | 13.3%), and Office & Administration (310 | 7.4%).
Sales and Office Occupations by Sex
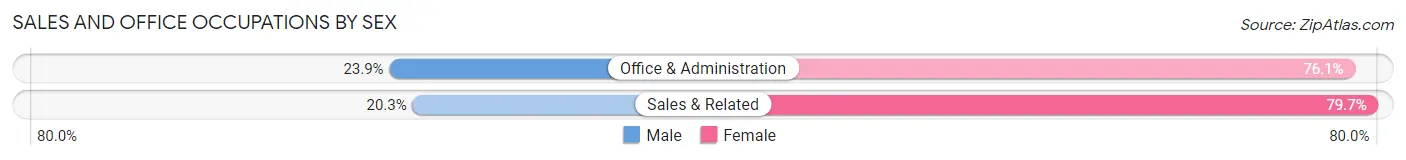
| Occupation | Male | Female |
| Sales & Related | 113 (20.3%) | 443 (79.7%) |
| Office & Administration | 74 (23.9%) | 236 (76.1%) |
| Total (Category) | 187 (21.6%) | 679 (78.4%) |
| Total (Overall) | 2,108 (50.3%) | 2,081 (49.7%) |
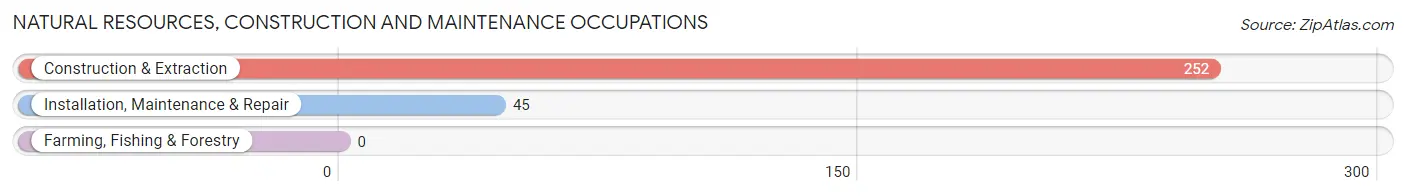
Natural Resources, Construction and Maintenance Occupations
The most common Natural Resources, Construction and Maintenance occupations in Eagle are Construction & Extraction (252 | 6.0%), and Installation, Maintenance & Repair (45 | 1.1%).
Natural Resources, Construction and Maintenance Occupations by Sex
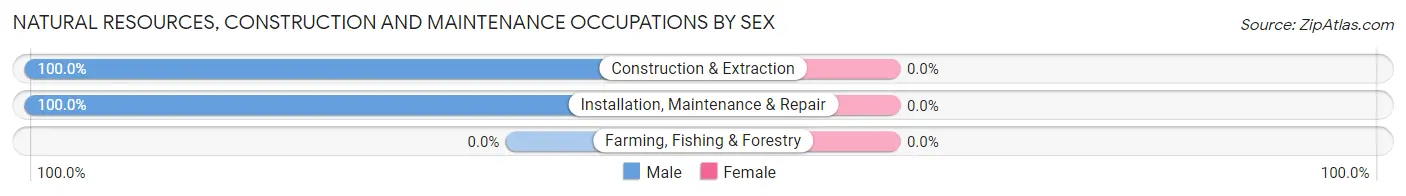
| Occupation | Male | Female |
| Farming, Fishing & Forestry | 0 (0.0%) | 0 (0.0%) |
| Construction & Extraction | 252 (100.0%) | 0 (0.0%) |
| Installation, Maintenance & Repair | 45 (100.0%) | 0 (0.0%) |
| Total (Category) | 297 (100.0%) | 0 (0.0%) |
| Total (Overall) | 2,108 (50.3%) | 2,081 (49.7%) |
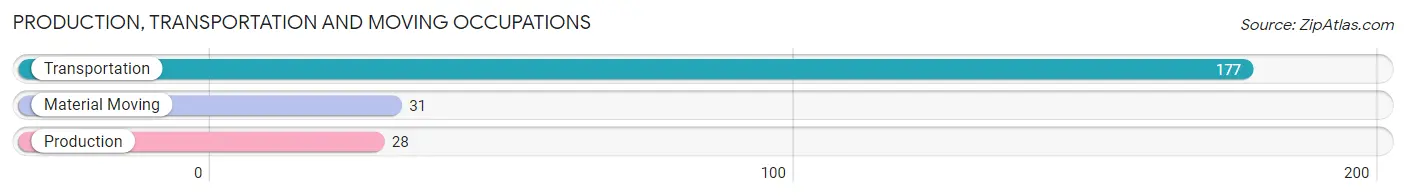
Production, Transportation and Moving Occupations
The most common Production, Transportation and Moving occupations in Eagle are Transportation (177 | 4.2%), Material Moving (31 | 0.7%), and Production (28 | 0.7%).
Production, Transportation and Moving Occupations by Sex
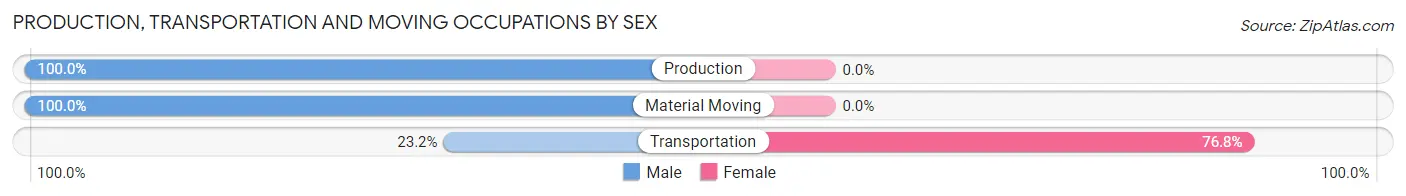
| Occupation | Male | Female |
| Production | 28 (100.0%) | 0 (0.0%) |
| Transportation | 41 (23.2%) | 136 (76.8%) |
| Material Moving | 31 (100.0%) | 0 (0.0%) |
| Total (Category) | 100 (42.4%) | 136 (57.6%) |
| Total (Overall) | 2,108 (50.3%) | 2,081 (49.7%) |
Employment Industries by Sex in Eagle
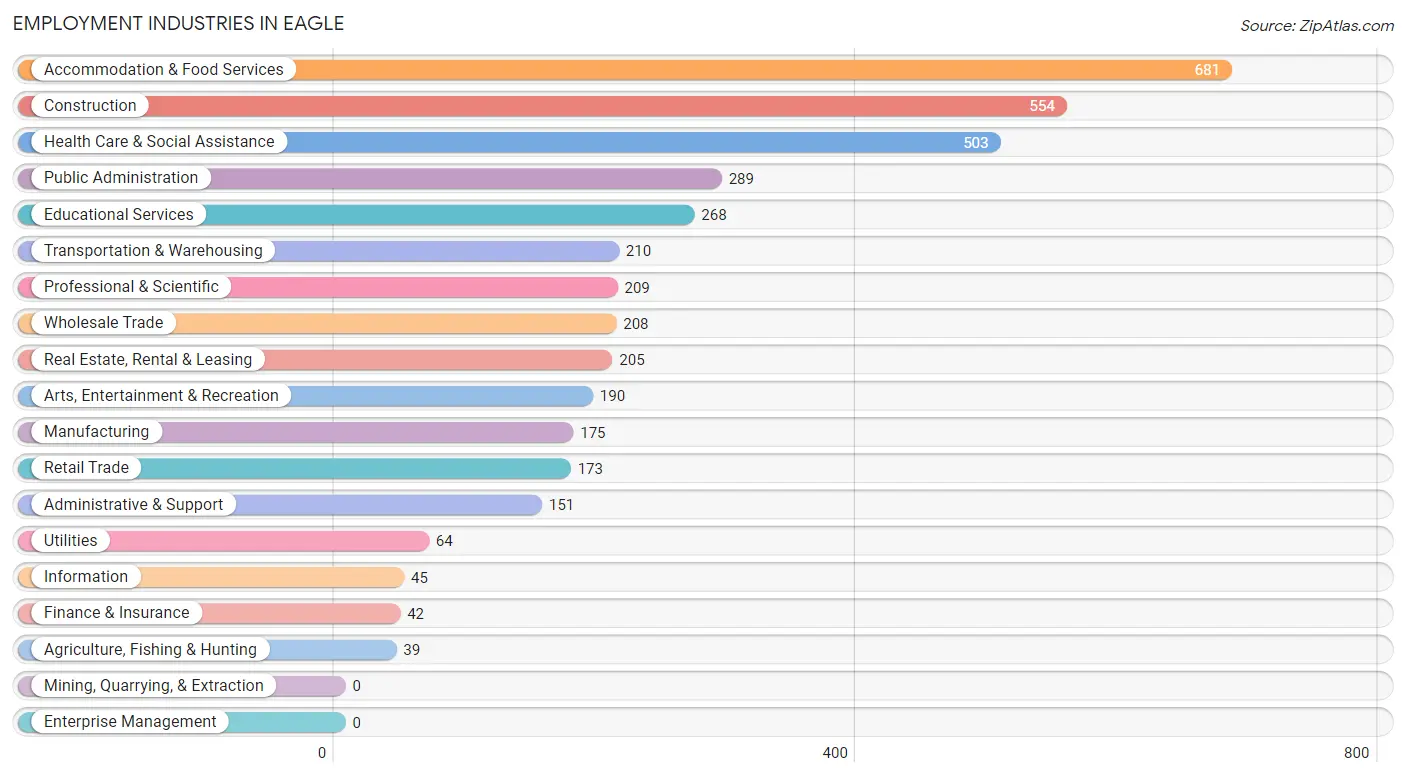
Employment Industries in Eagle
The major employment industries in Eagle include Accommodation & Food Services (681 | 16.3%), Construction (554 | 13.2%), Health Care & Social Assistance (503 | 12.0%), Public Administration (289 | 6.9%), and Educational Services (268 | 6.4%).
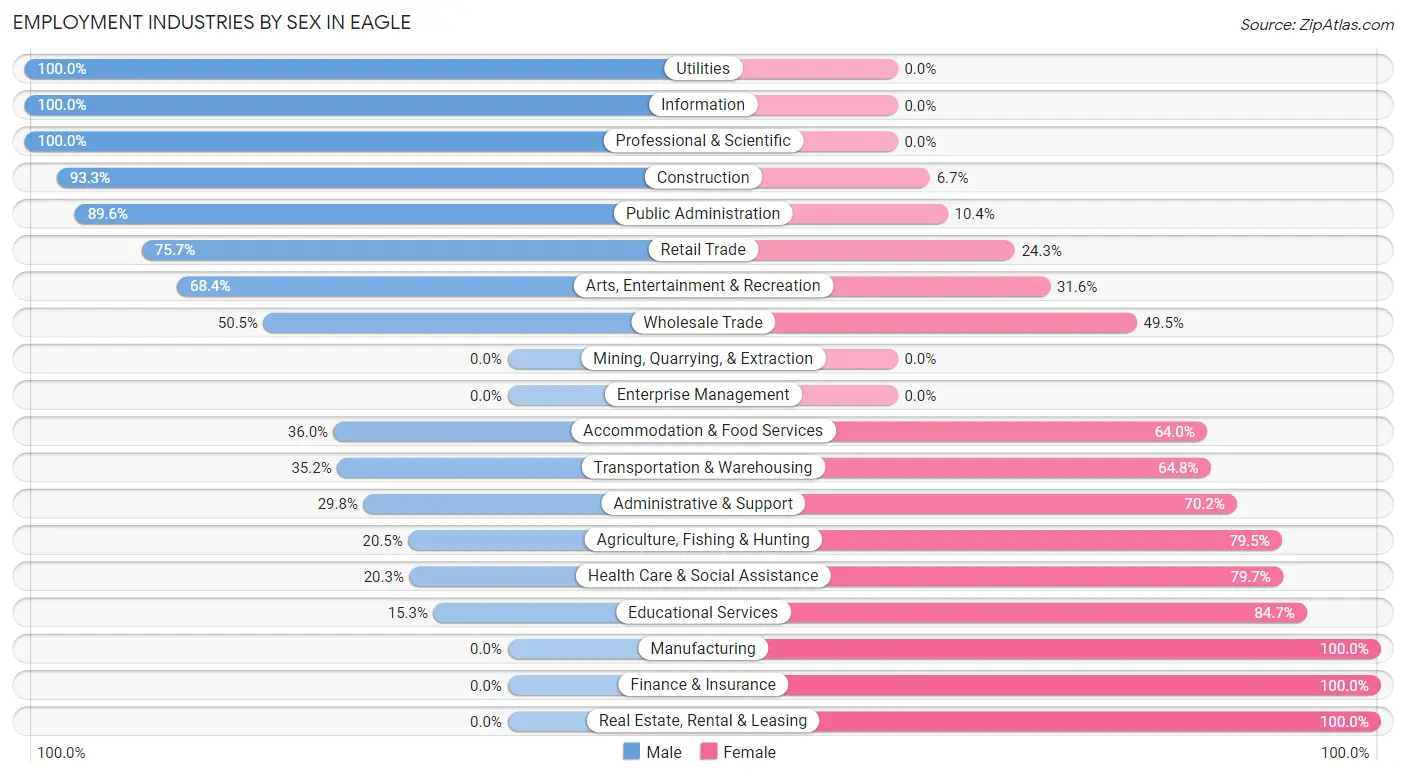
Employment Industries by Sex in Eagle
The Eagle industries that see more men than women are Utilities (100.0%), Information (100.0%), and Professional & Scientific (100.0%), whereas the industries that tend to have a higher number of women are Manufacturing (100.0%), Finance & Insurance (100.0%), and Real Estate, Rental & Leasing (100.0%).
| Industry | Male | Female |
| Agriculture, Fishing & Hunting | 8 (20.5%) | 31 (79.5%) |
| Mining, Quarrying, & Extraction | 0 (0.0%) | 0 (0.0%) |
| Construction | 517 (93.3%) | 37 (6.7%) |
| Manufacturing | 0 (0.0%) | 175 (100.0%) |
| Wholesale Trade | 105 (50.5%) | 103 (49.5%) |
| Retail Trade | 131 (75.7%) | 42 (24.3%) |
| Transportation & Warehousing | 74 (35.2%) | 136 (64.8%) |
| Utilities | 64 (100.0%) | 0 (0.0%) |
| Information | 45 (100.0%) | 0 (0.0%) |
| Finance & Insurance | 0 (0.0%) | 42 (100.0%) |
| Real Estate, Rental & Leasing | 0 (0.0%) | 205 (100.0%) |
| Professional & Scientific | 209 (100.0%) | 0 (0.0%) |
| Enterprise Management | 0 (0.0%) | 0 (0.0%) |
| Administrative & Support | 45 (29.8%) | 106 (70.2%) |
| Educational Services | 41 (15.3%) | 227 (84.7%) |
| Health Care & Social Assistance | 102 (20.3%) | 401 (79.7%) |
| Arts, Entertainment & Recreation | 130 (68.4%) | 60 (31.6%) |
| Accommodation & Food Services | 245 (36.0%) | 436 (64.0%) |
| Public Administration | 259 (89.6%) | 30 (10.4%) |
| Total | 2,108 (50.3%) | 2,081 (49.7%) |
Education in Eagle
School Enrollment in Eagle
The most common levels of schooling among the 2,625 students in Eagle are high school (699 | 26.6%), middle school (669 | 25.5%), and elementary school (486 | 18.5%).
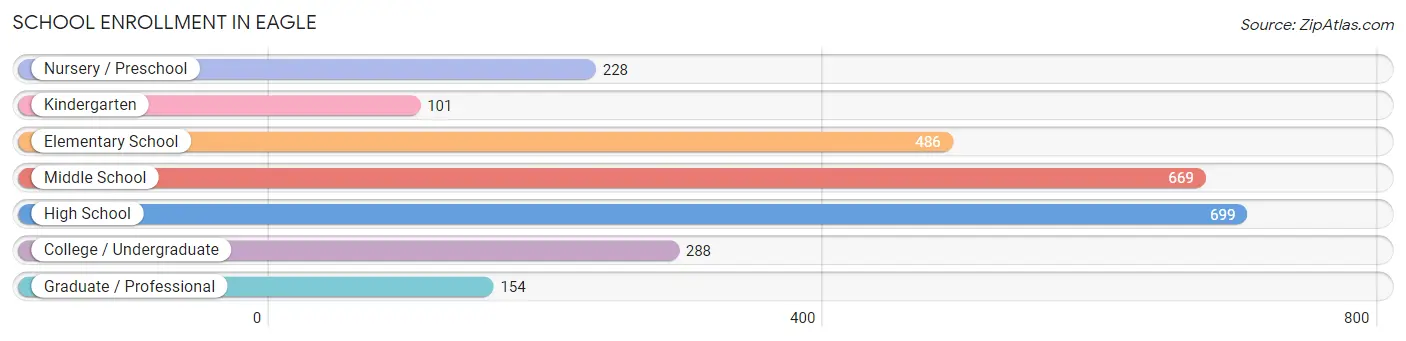
| School Level | # Students | % Students |
| Nursery / Preschool | 228 | 8.7% |
| Kindergarten | 101 | 3.8% |
| Elementary School | 486 | 18.5% |
| Middle School | 669 | 25.5% |
| High School | 699 | 26.6% |
| College / Undergraduate | 288 | 11.0% |
| Graduate / Professional | 154 | 5.9% |
| Total | 2,625 | 100.0% |
School Enrollment by Age by Funding Source in Eagle
Out of a total of 2,625 students who are enrolled in schools in Eagle, 312 (11.9%) attend a private institution, while the remaining 2,313 (88.1%) are enrolled in public schools. The age group of 25 to 34 year olds has the highest likelihood of being enrolled in private schools, with 50 (100.0% in the age bracket) enrolled. Conversely, the age group of 5 to 9 year old has the lowest likelihood of being enrolled in a private school, with 485 (100.0% in the age bracket) attending a public institution.
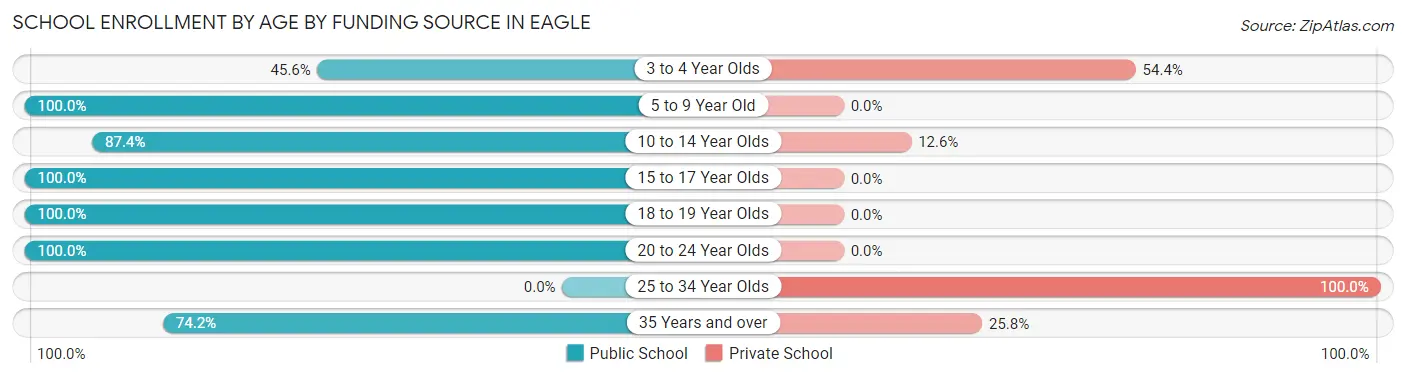
| Age Bracket | Public School | Private School |
| 3 to 4 Year Olds | 104 (45.6%) | 124 (54.4%) |
| 5 to 9 Year Old | 485 (100.0%) | 0 (0.0%) |
| 10 to 14 Year Olds | 674 (87.4%) | 97 (12.6%) |
| 15 to 17 Year Olds | 417 (100.0%) | 0 (0.0%) |
| 18 to 19 Year Olds | 282 (100.0%) | 0 (0.0%) |
| 20 to 24 Year Olds | 229 (100.0%) | 0 (0.0%) |
| 25 to 34 Year Olds | 0 (0.0%) | 50 (100.0%) |
| 35 Years and over | 121 (74.2%) | 42 (25.8%) |
| Total | 2,313 (88.1%) | 312 (11.9%) |
Educational Attainment by Field of Study in Eagle
Business (383 | 14.3%), science & technology (322 | 12.1%), education (308 | 11.5%), arts & humanities (303 | 11.4%), and visual & performing arts (248 | 9.3%) are the most common fields of study among 2,669 individuals in Eagle who have obtained a bachelor's degree or higher.
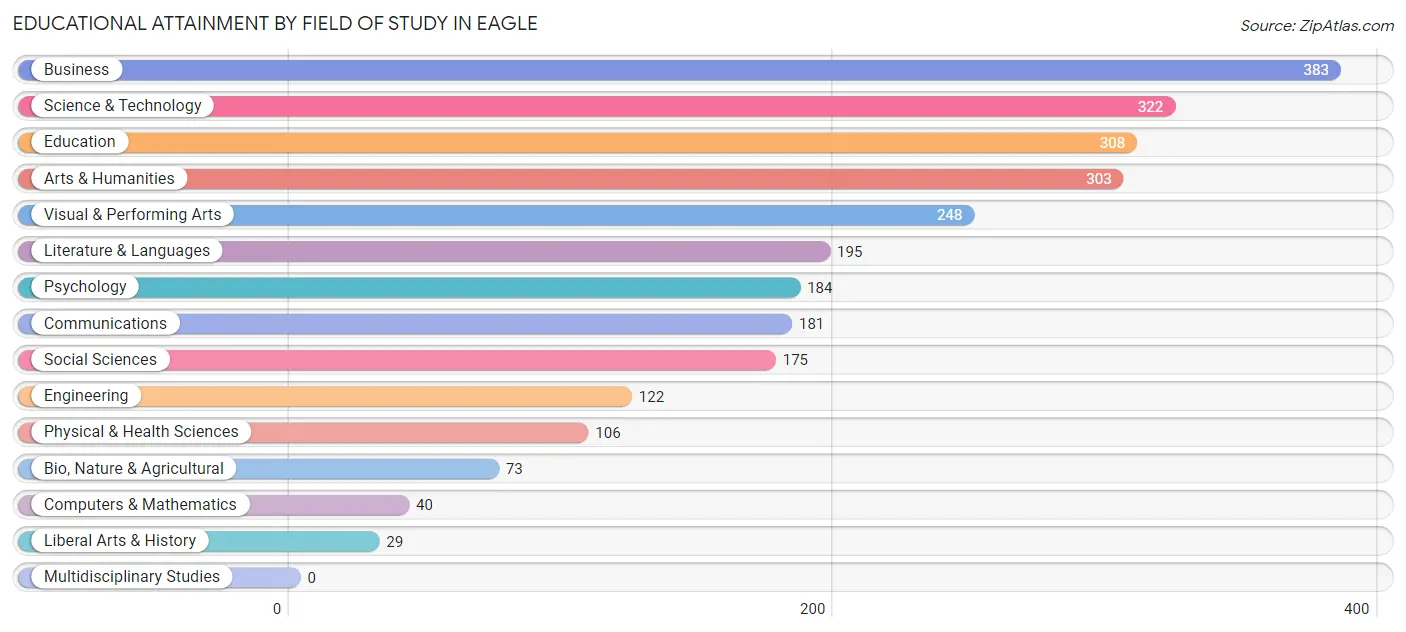
| Field of Study | # Graduates | % Graduates |
| Computers & Mathematics | 40 | 1.5% |
| Bio, Nature & Agricultural | 73 | 2.7% |
| Physical & Health Sciences | 106 | 4.0% |
| Psychology | 184 | 6.9% |
| Social Sciences | 175 | 6.6% |
| Engineering | 122 | 4.6% |
| Multidisciplinary Studies | 0 | 0.0% |
| Science & Technology | 322 | 12.1% |
| Business | 383 | 14.3% |
| Education | 308 | 11.5% |
| Literature & Languages | 195 | 7.3% |
| Liberal Arts & History | 29 | 1.1% |
| Visual & Performing Arts | 248 | 9.3% |
| Communications | 181 | 6.8% |
| Arts & Humanities | 303 | 11.4% |
| Total | 2,669 | 100.0% |
Transportation & Commute in Eagle
Vehicle Availability by Sex in Eagle
The most prevalent vehicle ownership categories in Eagle are males with 3 vehicles (858, accounting for 41.6%) and females with 3 vehicles (680, making up 42.0%).
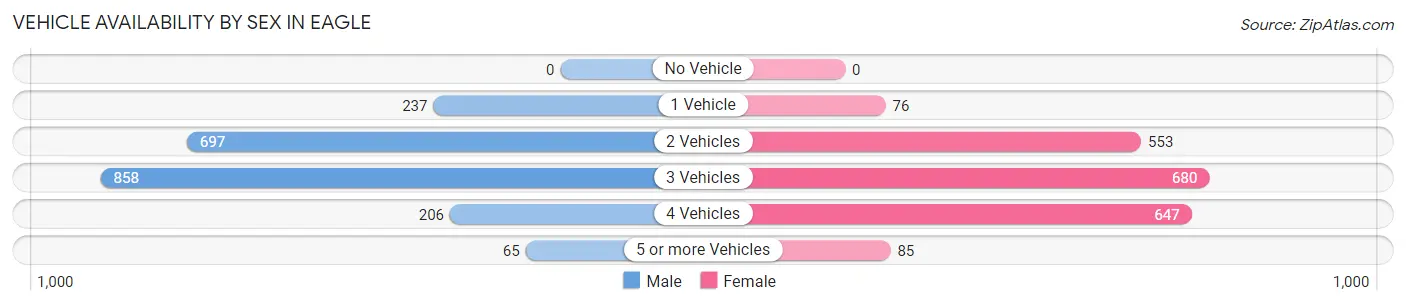
| Vehicles Available | Male | Female |
| No Vehicle | 0 (0.0%) | 0 (0.0%) |
| 1 Vehicle | 237 (11.5%) | 76 (3.7%) |
| 2 Vehicles | 697 (33.8%) | 553 (27.1%) |
| 3 Vehicles | 858 (41.6%) | 680 (33.3%) |
| 4 Vehicles | 206 (10.0%) | 647 (31.7%) |
| 5 or more Vehicles | 65 (3.2%) | 85 (4.2%) |
| Total | 2,063 (100.0%) | 2,041 (100.0%) |
Commute Time in Eagle
The most frequently occuring commute durations in Eagle are 30 to 34 minutes (788 commuters, 21.3%), 20 to 24 minutes (656 commuters, 17.7%), and 5 to 9 minutes (595 commuters, 16.1%).
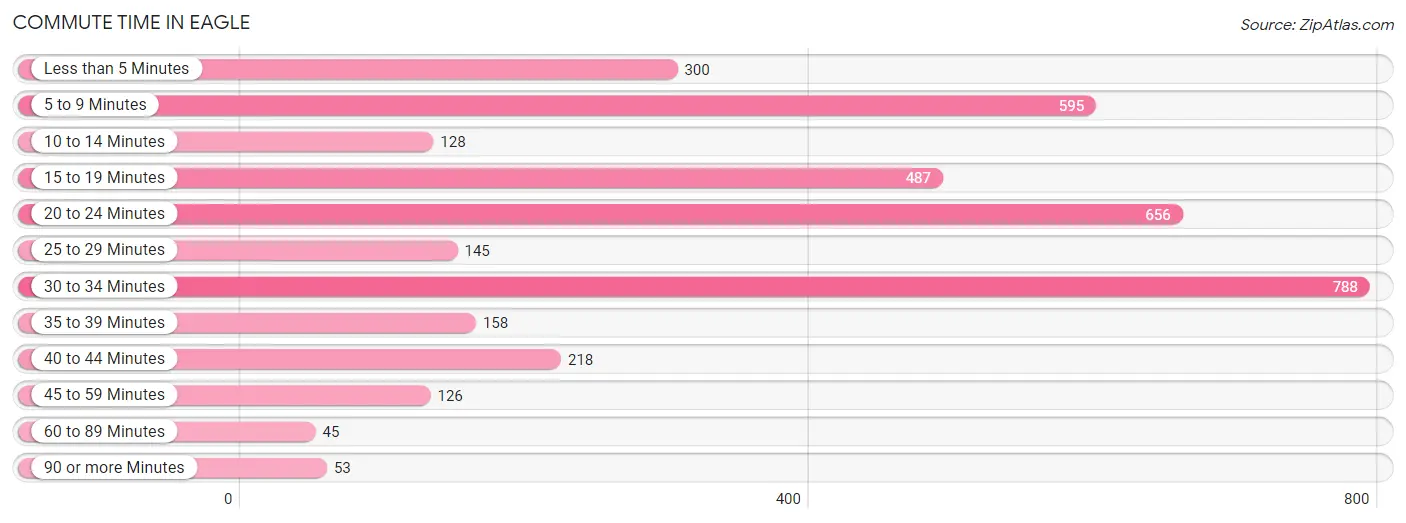
| Commute Time | # Commuters | % Commuters |
| Less than 5 Minutes | 300 | 8.1% |
| 5 to 9 Minutes | 595 | 16.1% |
| 10 to 14 Minutes | 128 | 3.5% |
| 15 to 19 Minutes | 487 | 13.2% |
| 20 to 24 Minutes | 656 | 17.7% |
| 25 to 29 Minutes | 145 | 3.9% |
| 30 to 34 Minutes | 788 | 21.3% |
| 35 to 39 Minutes | 158 | 4.3% |
| 40 to 44 Minutes | 218 | 5.9% |
| 45 to 59 Minutes | 126 | 3.4% |
| 60 to 89 Minutes | 45 | 1.2% |
| 90 or more Minutes | 53 | 1.4% |
Commute Time by Sex in Eagle
The most common commute times in Eagle are 30 to 34 minutes (678 commuters, 35.8%) for males and 5 to 9 minutes (427 commuters, 23.7%) for females.
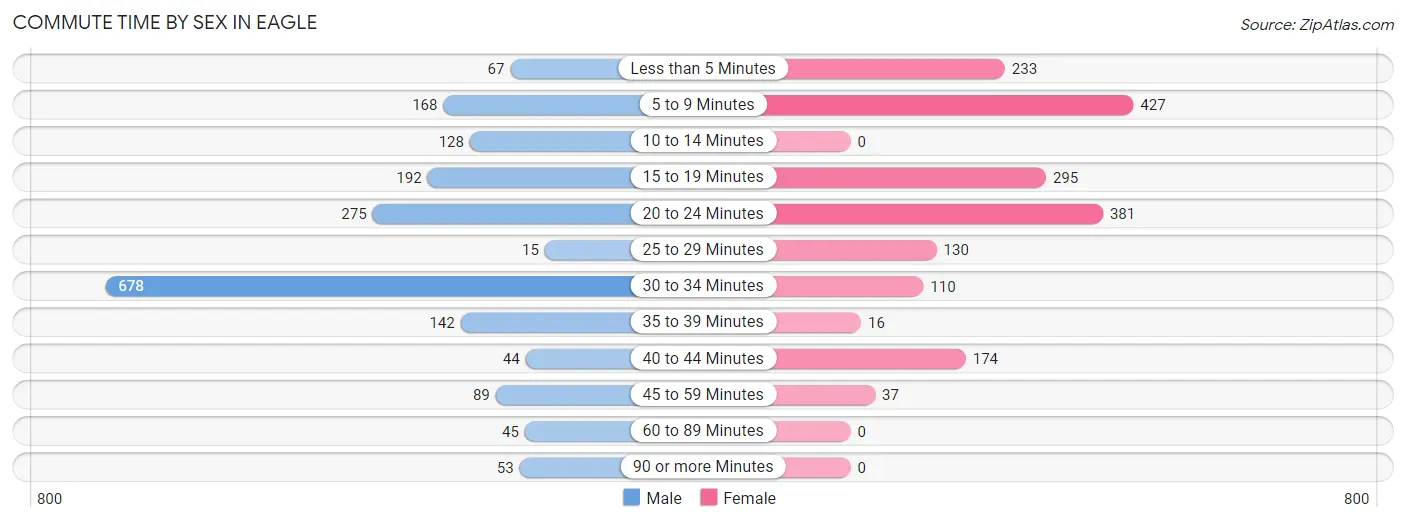
| Commute Time | Male | Female |
| Less than 5 Minutes | 67 (3.5%) | 233 (12.9%) |
| 5 to 9 Minutes | 168 (8.9%) | 427 (23.7%) |
| 10 to 14 Minutes | 128 (6.8%) | 0 (0.0%) |
| 15 to 19 Minutes | 192 (10.1%) | 295 (16.4%) |
| 20 to 24 Minutes | 275 (14.5%) | 381 (21.1%) |
| 25 to 29 Minutes | 15 (0.8%) | 130 (7.2%) |
| 30 to 34 Minutes | 678 (35.8%) | 110 (6.1%) |
| 35 to 39 Minutes | 142 (7.5%) | 16 (0.9%) |
| 40 to 44 Minutes | 44 (2.3%) | 174 (9.7%) |
| 45 to 59 Minutes | 89 (4.7%) | 37 (2.1%) |
| 60 to 89 Minutes | 45 (2.4%) | 0 (0.0%) |
| 90 or more Minutes | 53 (2.8%) | 0 (0.0%) |
Time of Departure to Work by Sex in Eagle
The most frequent times of departure to work in Eagle are 7:30 AM to 7:59 AM (422, 22.3%) for males and 7:00 AM to 7:29 AM (452, 25.1%) for females.
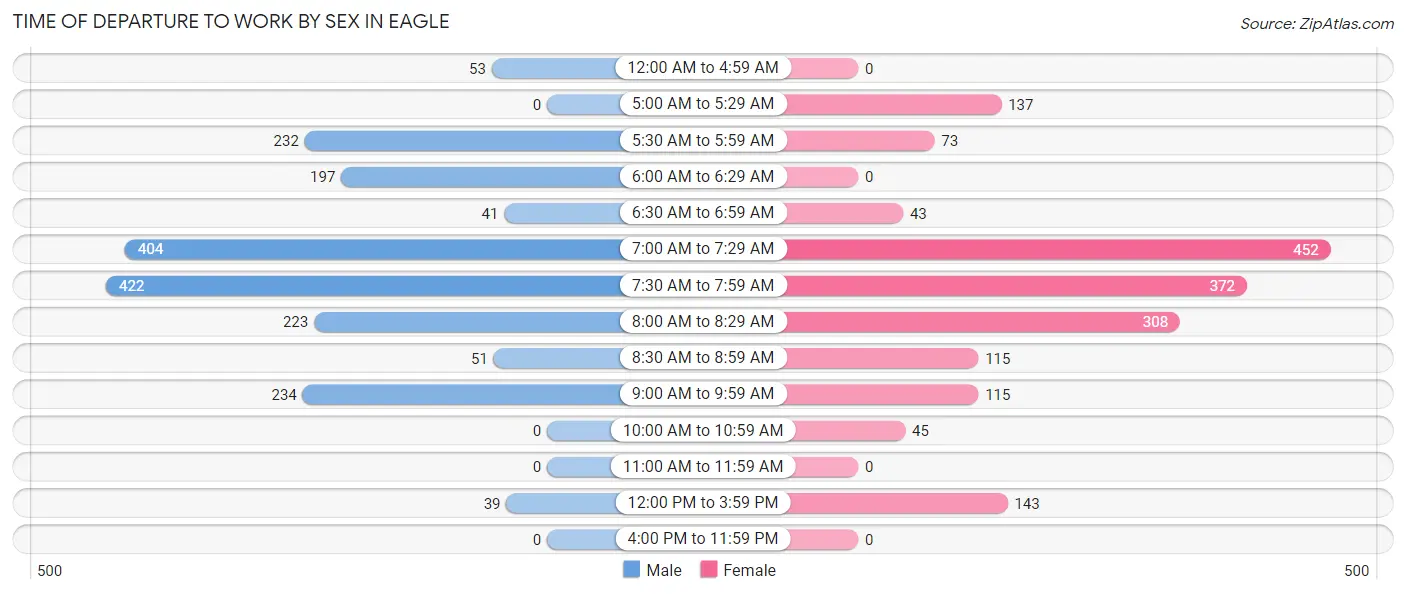
| Time of Departure | Male | Female |
| 12:00 AM to 4:59 AM | 53 (2.8%) | 0 (0.0%) |
| 5:00 AM to 5:29 AM | 0 (0.0%) | 137 (7.6%) |
| 5:30 AM to 5:59 AM | 232 (12.2%) | 73 (4.1%) |
| 6:00 AM to 6:29 AM | 197 (10.4%) | 0 (0.0%) |
| 6:30 AM to 6:59 AM | 41 (2.2%) | 43 (2.4%) |
| 7:00 AM to 7:29 AM | 404 (21.3%) | 452 (25.1%) |
| 7:30 AM to 7:59 AM | 422 (22.3%) | 372 (20.6%) |
| 8:00 AM to 8:29 AM | 223 (11.8%) | 308 (17.1%) |
| 8:30 AM to 8:59 AM | 51 (2.7%) | 115 (6.4%) |
| 9:00 AM to 9:59 AM | 234 (12.3%) | 115 (6.4%) |
| 10:00 AM to 10:59 AM | 0 (0.0%) | 45 (2.5%) |
| 11:00 AM to 11:59 AM | 0 (0.0%) | 0 (0.0%) |
| 12:00 PM to 3:59 PM | 39 (2.1%) | 143 (7.9%) |
| 4:00 PM to 11:59 PM | 0 (0.0%) | 0 (0.0%) |
| Total | 1,896 (100.0%) | 1,803 (100.0%) |
Housing Occupancy in Eagle
Occupancy by Ownership in Eagle
Of the total 2,370 dwellings in Eagle, owner-occupied units account for 1,605 (67.7%), while renter-occupied units make up 765 (32.3%).
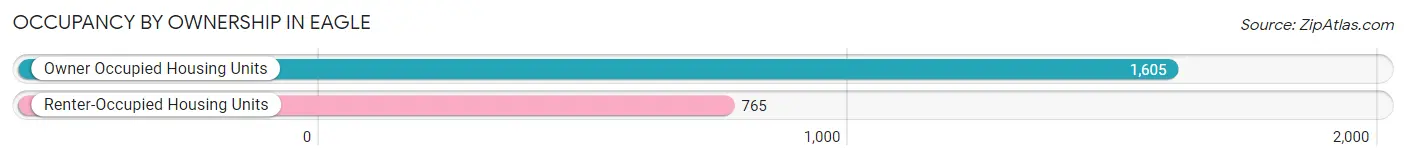
| Occupancy | # Housing Units | % Housing Units |
| Owner Occupied Housing Units | 1,605 | 67.7% |
| Renter-Occupied Housing Units | 765 | 32.3% |
| Total Occupied Housing Units | 2,370 | 100.0% |
Occupancy by Household Size in Eagle
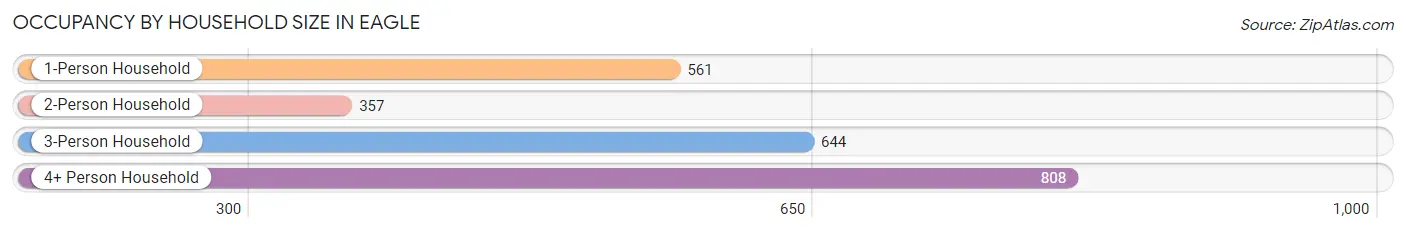
| Household Size | # Housing Units | % Housing Units |
| 1-Person Household | 561 | 23.7% |
| 2-Person Household | 357 | 15.1% |
| 3-Person Household | 644 | 27.2% |
| 4+ Person Household | 808 | 34.1% |
| Total Housing Units | 2,370 | 100.0% |
Occupancy by Ownership by Household Size in Eagle
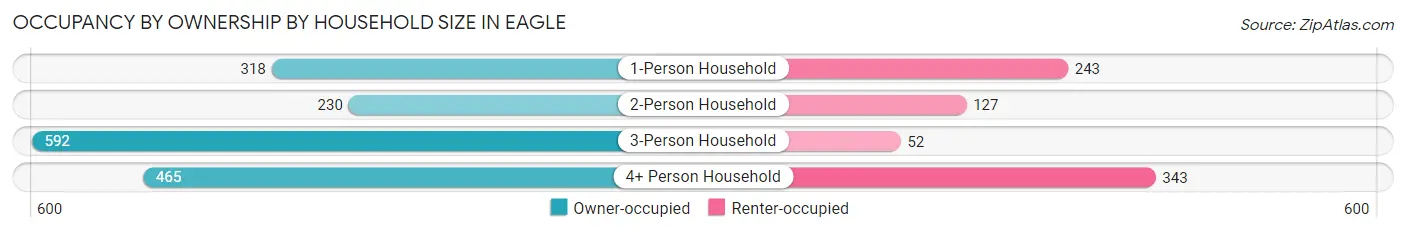
| Household Size | Owner-occupied | Renter-occupied |
| 1-Person Household | 318 (56.7%) | 243 (43.3%) |
| 2-Person Household | 230 (64.4%) | 127 (35.6%) |
| 3-Person Household | 592 (91.9%) | 52 (8.1%) |
| 4+ Person Household | 465 (57.6%) | 343 (42.4%) |
| Total Housing Units | 1,605 (67.7%) | 765 (32.3%) |
Occupancy by Educational Attainment in Eagle
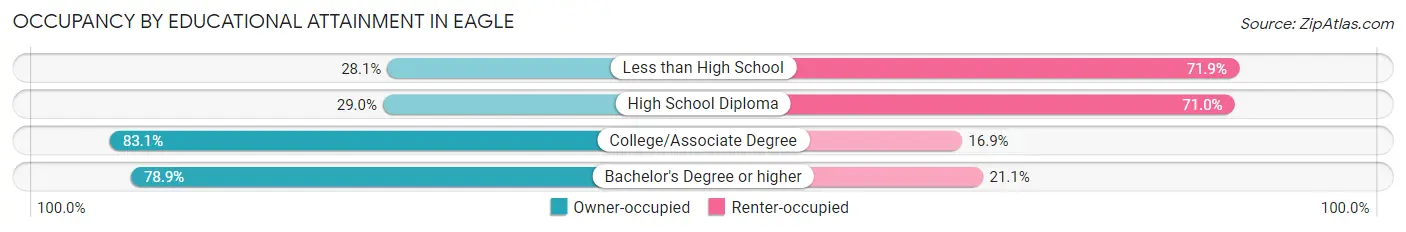
| Household Size | Owner-occupied | Renter-occupied |
| Less than High School | 61 (28.1%) | 156 (71.9%) |
| High School Diploma | 102 (29.0%) | 250 (71.0%) |
| College/Associate Degree | 413 (83.1%) | 84 (16.9%) |
| Bachelor's Degree or higher | 1,029 (78.9%) | 275 (21.1%) |
Occupancy by Age of Householder in Eagle
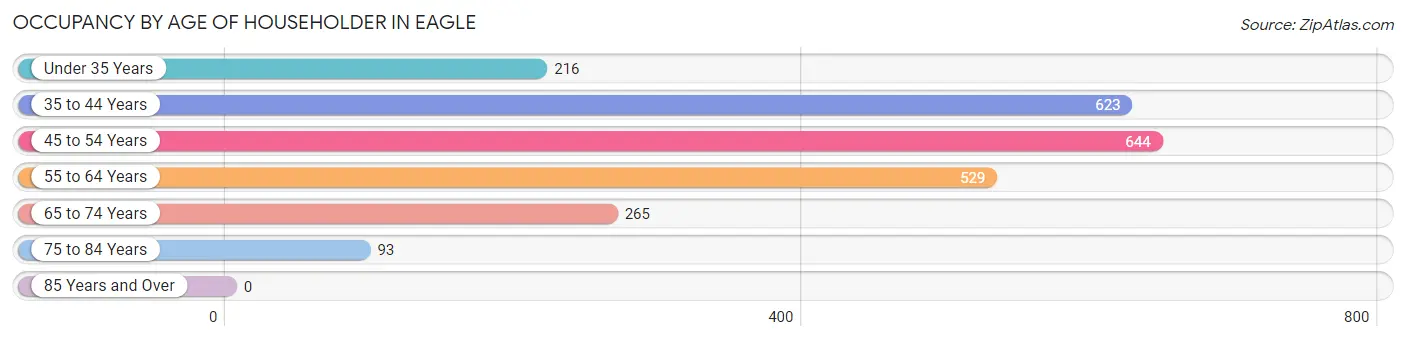
| Age Bracket | # Households | % Households |
| Under 35 Years | 216 | 9.1% |
| 35 to 44 Years | 623 | 26.3% |
| 45 to 54 Years | 644 | 27.2% |
| 55 to 64 Years | 529 | 22.3% |
| 65 to 74 Years | 265 | 11.2% |
| 75 to 84 Years | 93 | 3.9% |
| 85 Years and Over | 0 | 0.0% |
| Total | 2,370 | 100.0% |
Housing Finances in Eagle
Median Income by Occupancy in Eagle
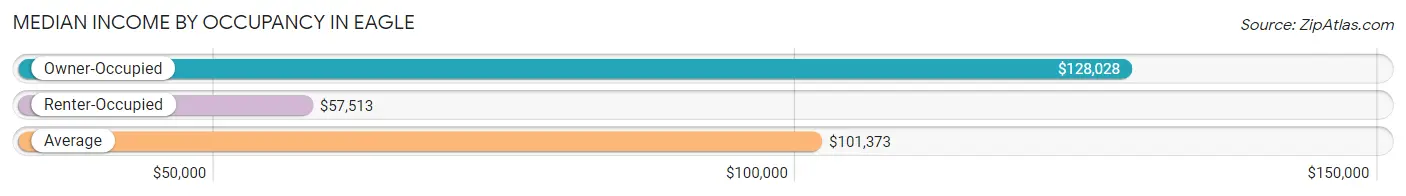
| Occupancy Type | # Households | Median Income |
| Owner-Occupied | 1,605 (67.7%) | $128,028 |
| Renter-Occupied | 765 (32.3%) | $57,513 |
| Average | 2,370 (100.0%) | $101,373 |
Occupancy by Householder Income Bracket in Eagle
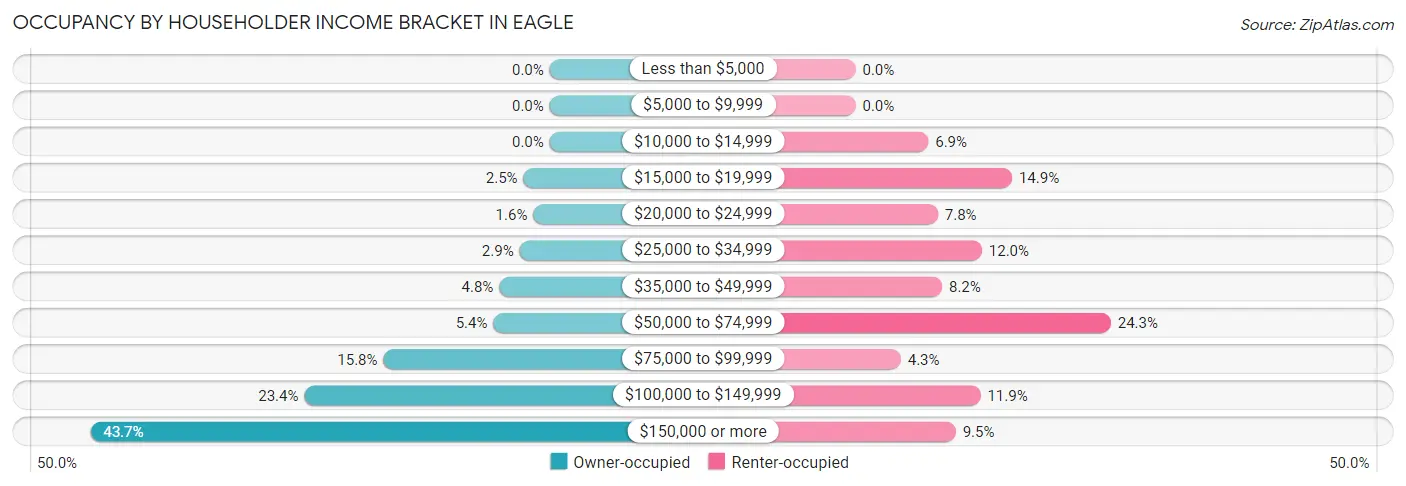
| Income Bracket | Owner-occupied | Renter-occupied |
| Less than $5,000 | 0 (0.0%) | 0 (0.0%) |
| $5,000 to $9,999 | 0 (0.0%) | 0 (0.0%) |
| $10,000 to $14,999 | 0 (0.0%) | 53 (6.9%) |
| $15,000 to $19,999 | 40 (2.5%) | 114 (14.9%) |
| $20,000 to $24,999 | 25 (1.6%) | 60 (7.8%) |
| $25,000 to $34,999 | 46 (2.9%) | 92 (12.0%) |
| $35,000 to $49,999 | 77 (4.8%) | 63 (8.2%) |
| $50,000 to $74,999 | 86 (5.4%) | 186 (24.3%) |
| $75,000 to $99,999 | 254 (15.8%) | 33 (4.3%) |
| $100,000 to $149,999 | 375 (23.4%) | 91 (11.9%) |
| $150,000 or more | 702 (43.7%) | 73 (9.5%) |
| Total | 1,605 (100.0%) | 765 (100.0%) |
Monthly Housing Cost Tiers in Eagle
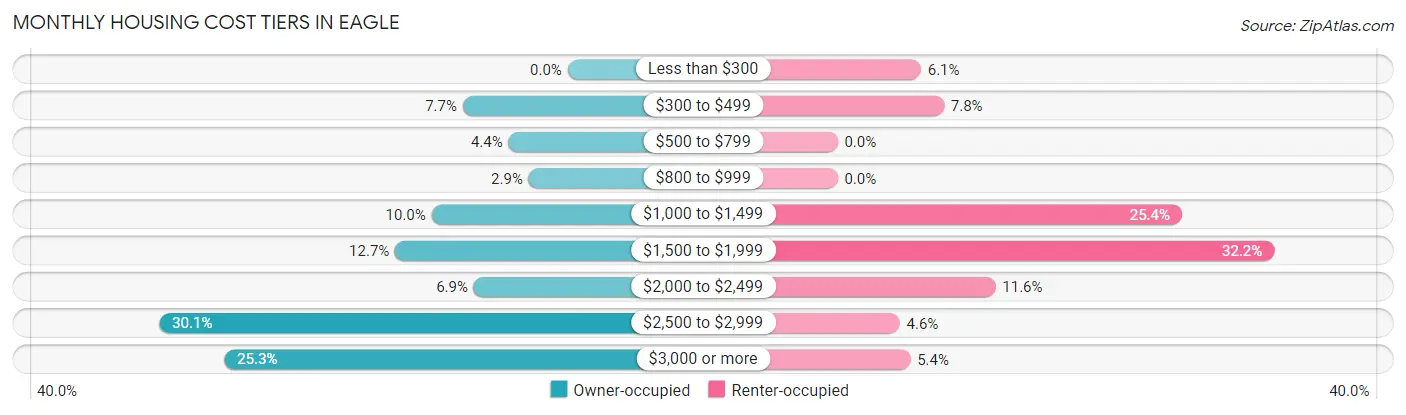
| Monthly Cost | Owner-occupied | Renter-occupied |
| Less than $300 | 0 (0.0%) | 47 (6.1%) |
| $300 to $499 | 124 (7.7%) | 60 (7.8%) |
| $500 to $799 | 70 (4.4%) | 0 (0.0%) |
| $800 to $999 | 46 (2.9%) | 0 (0.0%) |
| $1,000 to $1,499 | 161 (10.0%) | 194 (25.4%) |
| $1,500 to $1,999 | 204 (12.7%) | 246 (32.2%) |
| $2,000 to $2,499 | 111 (6.9%) | 89 (11.6%) |
| $2,500 to $2,999 | 483 (30.1%) | 35 (4.6%) |
| $3,000 or more | 406 (25.3%) | 41 (5.4%) |
| Total | 1,605 (100.0%) | 765 (100.0%) |
Physical Housing Characteristics in Eagle
Housing Structures in Eagle
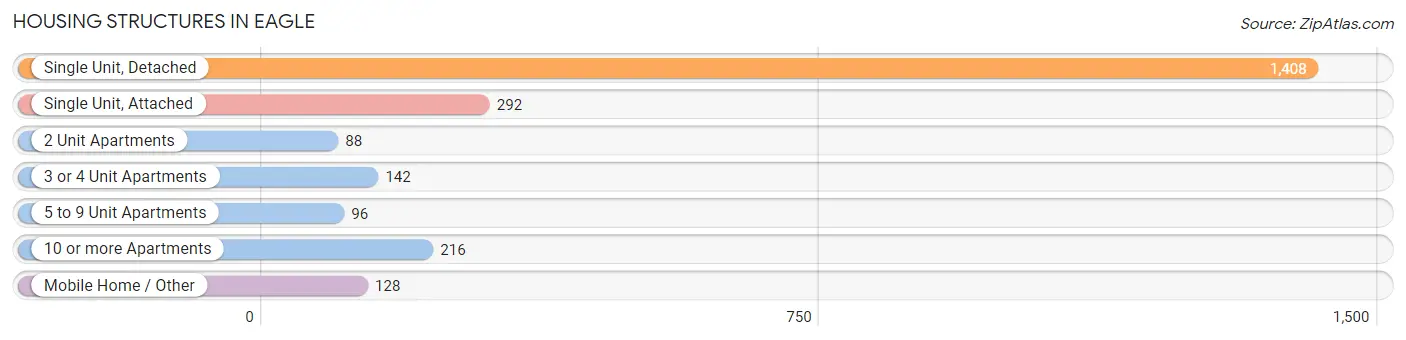
| Structure Type | # Housing Units | % Housing Units |
| Single Unit, Detached | 1,408 | 59.4% |
| Single Unit, Attached | 292 | 12.3% |
| 2 Unit Apartments | 88 | 3.7% |
| 3 or 4 Unit Apartments | 142 | 6.0% |
| 5 to 9 Unit Apartments | 96 | 4.1% |
| 10 or more Apartments | 216 | 9.1% |
| Mobile Home / Other | 128 | 5.4% |
| Total | 2,370 | 100.0% |
Housing Structures by Occupancy in Eagle
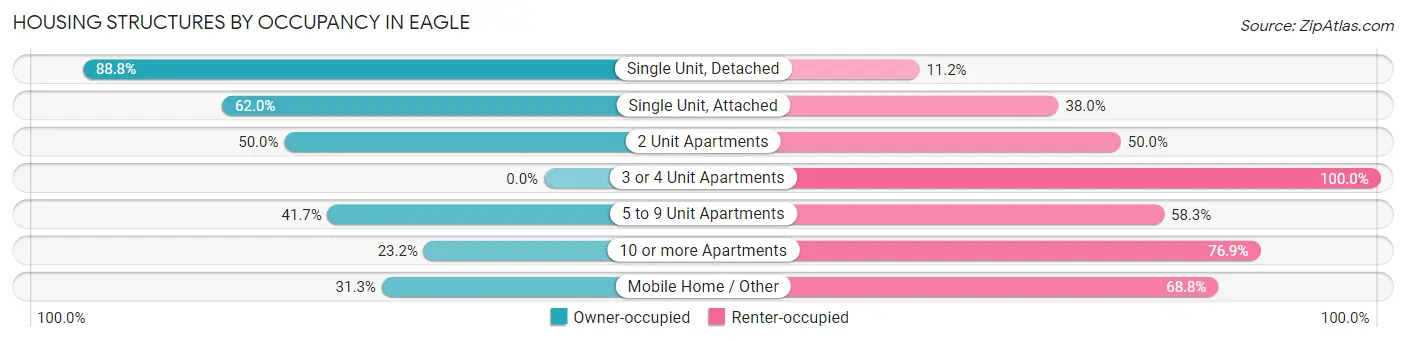
| Structure Type | Owner-occupied | Renter-occupied |
| Single Unit, Detached | 1,250 (88.8%) | 158 (11.2%) |
| Single Unit, Attached | 181 (62.0%) | 111 (38.0%) |
| 2 Unit Apartments | 44 (50.0%) | 44 (50.0%) |
| 3 or 4 Unit Apartments | 0 (0.0%) | 142 (100.0%) |
| 5 to 9 Unit Apartments | 40 (41.7%) | 56 (58.3%) |
| 10 or more Apartments | 50 (23.2%) | 166 (76.8%) |
| Mobile Home / Other | 40 (31.2%) | 88 (68.8%) |
| Total | 1,605 (67.7%) | 765 (32.3%) |
Housing Structures by Number of Rooms in Eagle
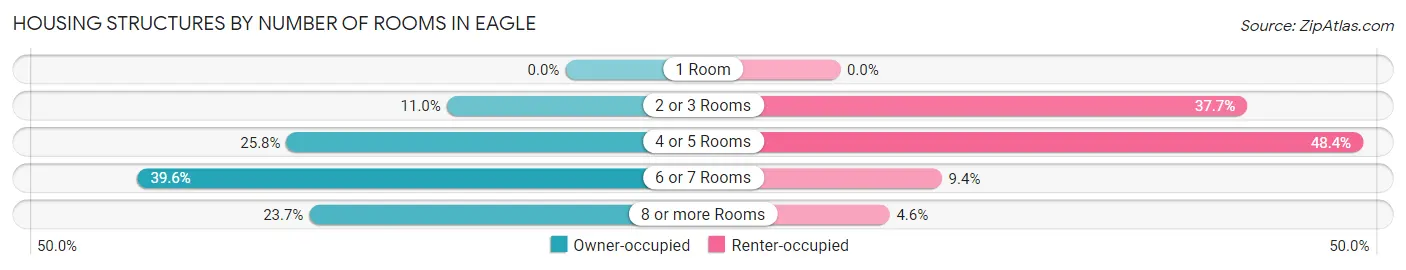
| Number of Rooms | Owner-occupied | Renter-occupied |
| 1 Room | 0 (0.0%) | 0 (0.0%) |
| 2 or 3 Rooms | 176 (11.0%) | 288 (37.7%) |
| 4 or 5 Rooms | 414 (25.8%) | 370 (48.4%) |
| 6 or 7 Rooms | 635 (39.6%) | 72 (9.4%) |
| 8 or more Rooms | 380 (23.7%) | 35 (4.6%) |
| Total | 1,605 (100.0%) | 765 (100.0%) |
Housing Structure by Heating Type in Eagle
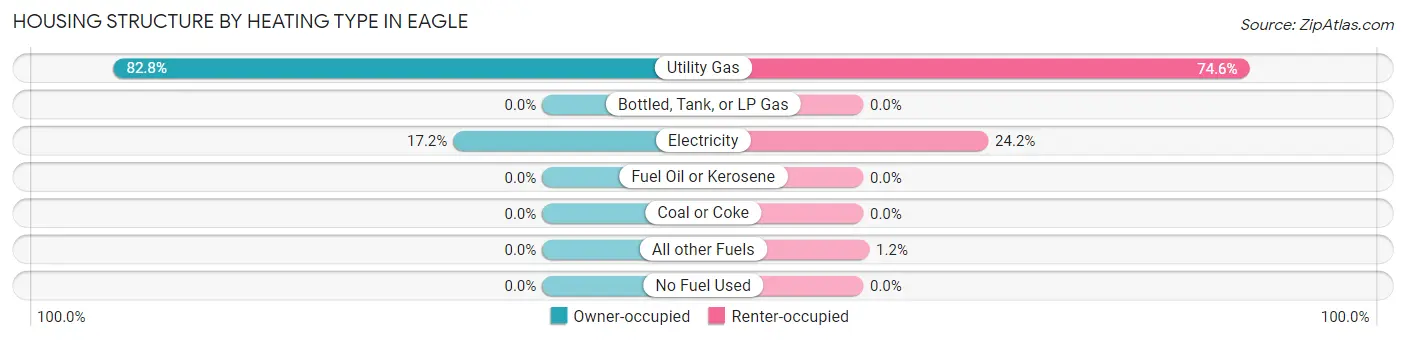
| Heating Type | Owner-occupied | Renter-occupied |
| Utility Gas | 1,329 (82.8%) | 571 (74.6%) |
| Bottled, Tank, or LP Gas | 0 (0.0%) | 0 (0.0%) |
| Electricity | 276 (17.2%) | 185 (24.2%) |
| Fuel Oil or Kerosene | 0 (0.0%) | 0 (0.0%) |
| Coal or Coke | 0 (0.0%) | 0 (0.0%) |
| All other Fuels | 0 (0.0%) | 9 (1.2%) |
| No Fuel Used | 0 (0.0%) | 0 (0.0%) |
| Total | 1,605 (100.0%) | 765 (100.0%) |
Household Vehicle Usage in Eagle
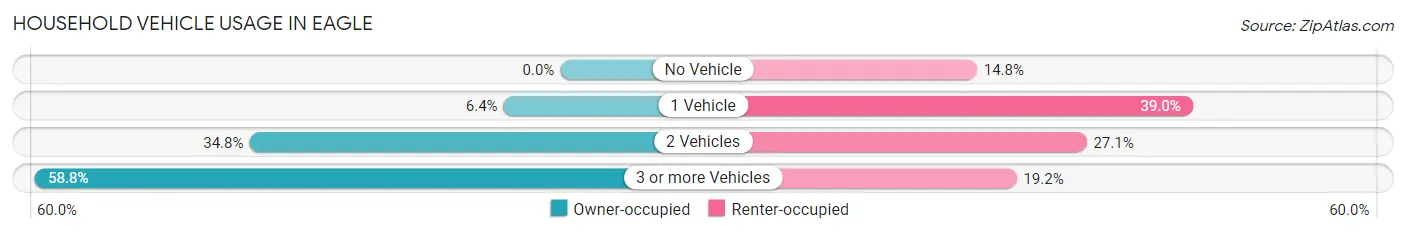
| Vehicles per Household | Owner-occupied | Renter-occupied |
| No Vehicle | 0 (0.0%) | 113 (14.8%) |
| 1 Vehicle | 102 (6.4%) | 298 (39.0%) |
| 2 Vehicles | 559 (34.8%) | 207 (27.1%) |
| 3 or more Vehicles | 944 (58.8%) | 147 (19.2%) |
| Total | 1,605 (100.0%) | 765 (100.0%) |
Real Estate & Mortgages in Eagle
Real Estate and Mortgage Overview in Eagle
| Characteristic | Without Mortgage | With Mortgage |
| Housing Units | 240 | 1,365 |
| Median Property Value | $629,900 | $666,700 |
| Median Household Income | $52,361 | $664 |
| Monthly Housing Costs | $491 | $406 |
| Real Estate Taxes | $3,087 | $16 |
Property Value by Mortgage Status in Eagle
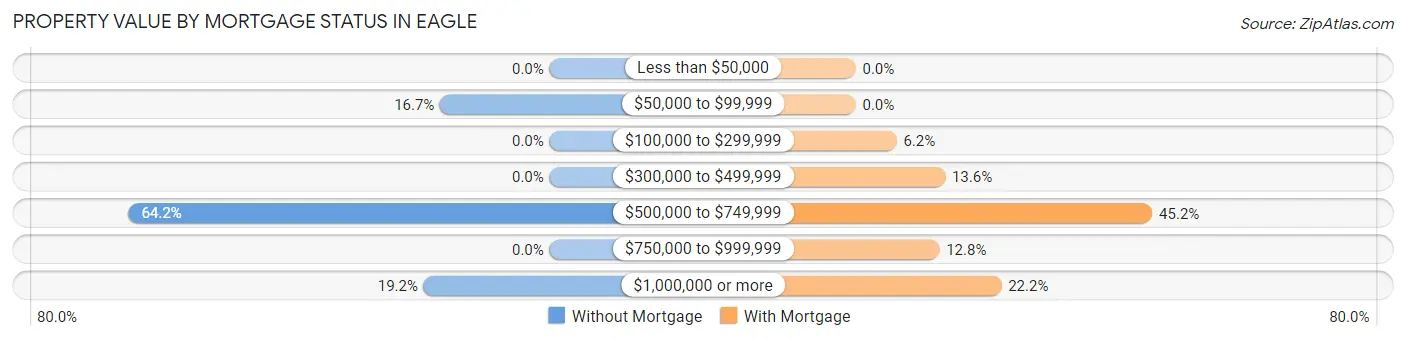
| Property Value | Without Mortgage | With Mortgage |
| Less than $50,000 | 0 (0.0%) | 0 (0.0%) |
| $50,000 to $99,999 | 40 (16.7%) | 0 (0.0%) |
| $100,000 to $299,999 | 0 (0.0%) | 85 (6.2%) |
| $300,000 to $499,999 | 0 (0.0%) | 186 (13.6%) |
| $500,000 to $749,999 | 154 (64.2%) | 617 (45.2%) |
| $750,000 to $999,999 | 0 (0.0%) | 174 (12.8%) |
| $1,000,000 or more | 46 (19.2%) | 303 (22.2%) |
| Total | 240 (100.0%) | 1,365 (100.0%) |
Household Income by Mortgage Status in Eagle
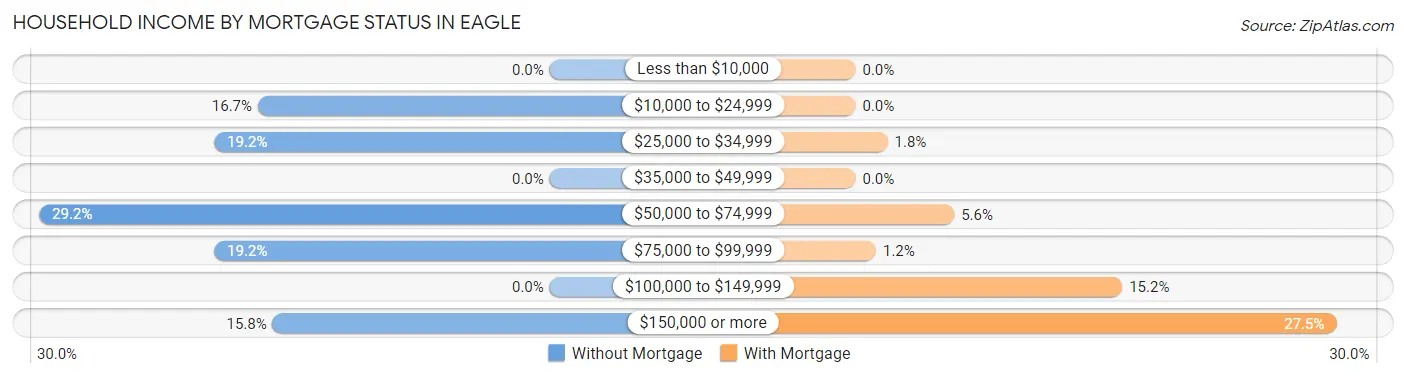
| Household Income | Without Mortgage | With Mortgage |
| Less than $10,000 | 0 (0.0%) | 0 (0.0%) |
| $10,000 to $24,999 | 40 (16.7%) | 0 (0.0%) |
| $25,000 to $34,999 | 46 (19.2%) | 25 (1.8%) |
| $35,000 to $49,999 | 0 (0.0%) | 0 (0.0%) |
| $50,000 to $74,999 | 70 (29.2%) | 77 (5.6%) |
| $75,000 to $99,999 | 46 (19.2%) | 16 (1.2%) |
| $100,000 to $149,999 | 0 (0.0%) | 208 (15.2%) |
| $150,000 or more | 38 (15.8%) | 375 (27.5%) |
| Total | 240 (100.0%) | 1,365 (100.0%) |
Property Value to Household Income Ratio in Eagle
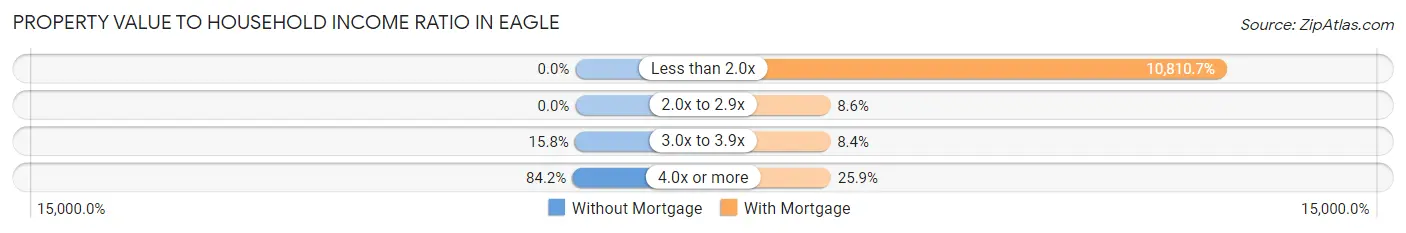
| Value-to-Income Ratio | Without Mortgage | With Mortgage |
| Less than 2.0x | 0 (0.0%) | 147,566 (10,810.7%) |
| 2.0x to 2.9x | 0 (0.0%) | 117 (8.6%) |
| 3.0x to 3.9x | 38 (15.8%) | 115 (8.4%) |
| 4.0x or more | 202 (84.2%) | 354 (25.9%) |
| Total | 240 (100.0%) | 1,365 (100.0%) |
Real Estate Taxes by Mortgage Status in Eagle
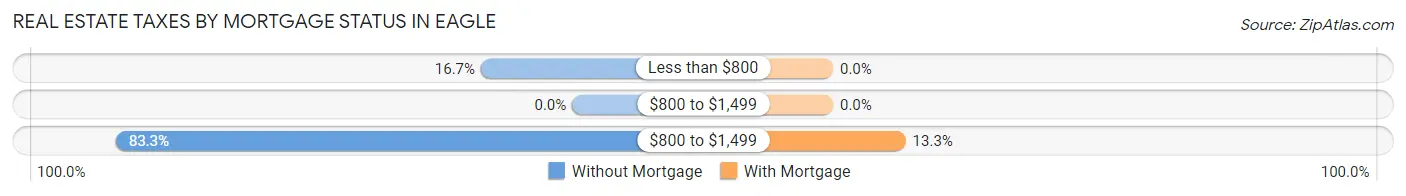
| Property Taxes | Without Mortgage | With Mortgage |
| Less than $800 | 40 (16.7%) | 0 (0.0%) |
| $800 to $1,499 | 0 (0.0%) | 0 (0.0%) |
| $800 to $1,499 | 200 (83.3%) | 181 (13.3%) |
| Total | 240 (100.0%) | 1,365 (100.0%) |
Health & Disability in Eagle
Health Insurance Coverage by Age in Eagle
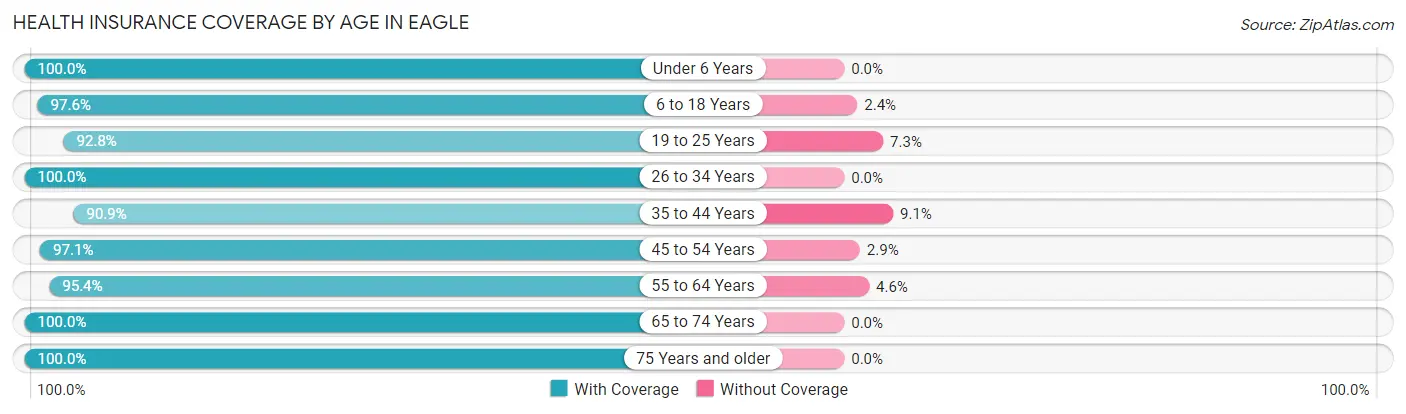
| Age Bracket | With Coverage | Without Coverage |
| Under 6 Years | 499 (100.0%) | 0 (0.0%) |
| 6 to 18 Years | 1,839 (97.6%) | 46 (2.4%) |
| 19 to 25 Years | 537 (92.7%) | 42 (7.2%) |
| 26 to 34 Years | 710 (100.0%) | 0 (0.0%) |
| 35 to 44 Years | 1,339 (90.9%) | 134 (9.1%) |
| 45 to 54 Years | 1,035 (97.1%) | 31 (2.9%) |
| 55 to 64 Years | 661 (95.4%) | 32 (4.6%) |
| 65 to 74 Years | 397 (100.0%) | 0 (0.0%) |
| 75 Years and older | 93 (100.0%) | 0 (0.0%) |
| Total | 7,110 (96.2%) | 285 (3.8%) |
Health Insurance Coverage by Citizenship Status in Eagle
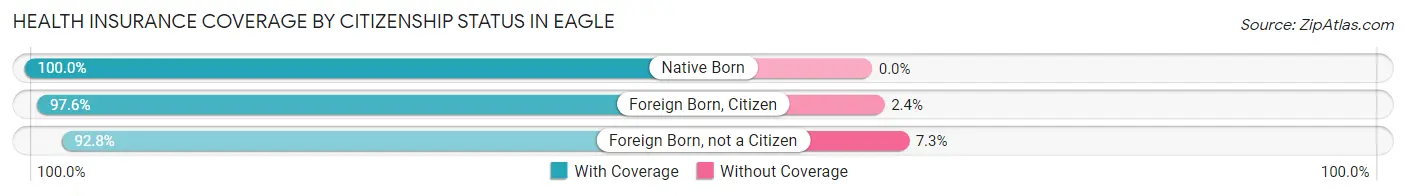
| Citizenship Status | With Coverage | Without Coverage |
| Native Born | 499 (100.0%) | 0 (0.0%) |
| Foreign Born, Citizen | 1,839 (97.6%) | 46 (2.4%) |
| Foreign Born, not a Citizen | 537 (92.7%) | 42 (7.2%) |
Health Insurance Coverage by Household Income in Eagle
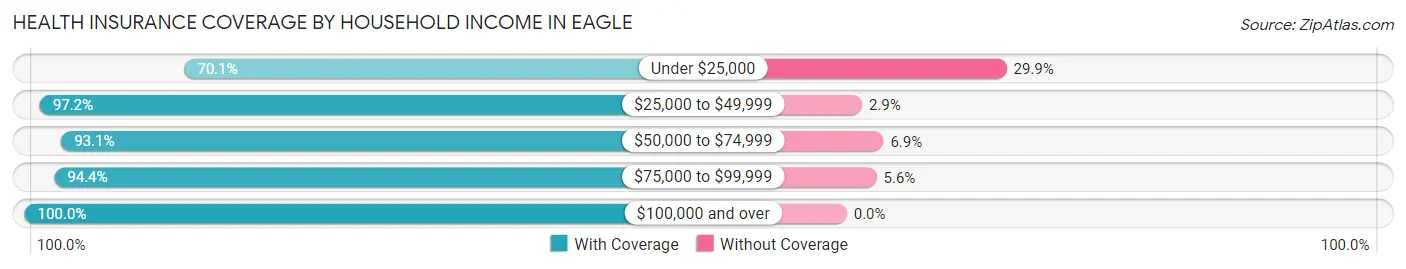
| Household Income | With Coverage | Without Coverage |
| Under $25,000 | 377 (70.1%) | 161 (29.9%) |
| $25,000 to $49,999 | 1,226 (97.2%) | 36 (2.9%) |
| $50,000 to $74,999 | 569 (93.1%) | 42 (6.9%) |
| $75,000 to $99,999 | 779 (94.4%) | 46 (5.6%) |
| $100,000 and over | 4,159 (100.0%) | 0 (0.0%) |
Public vs Private Health Insurance Coverage by Age in Eagle
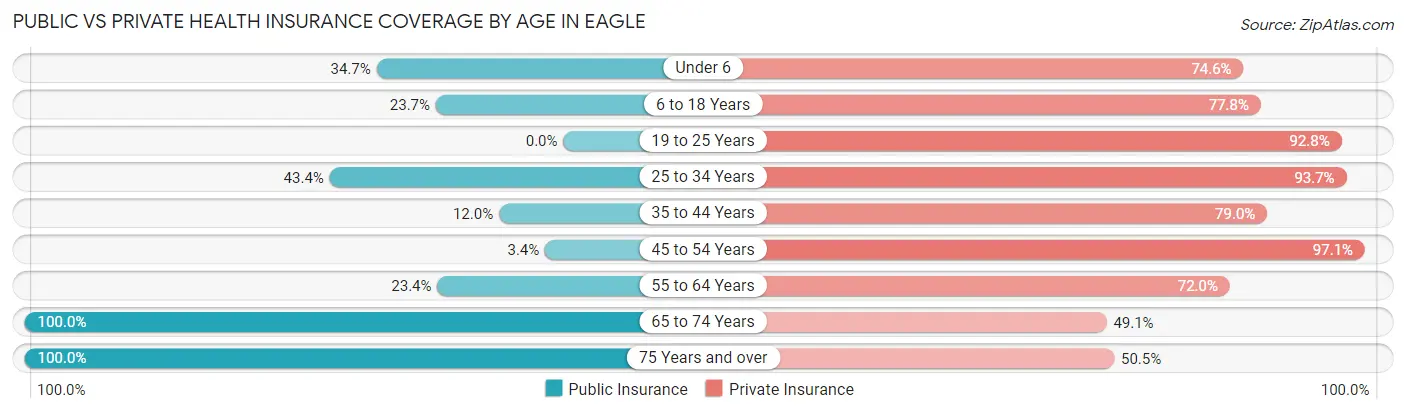
| Age Bracket | Public Insurance | Private Insurance |
| Under 6 | 173 (34.7%) | 372 (74.6%) |
| 6 to 18 Years | 446 (23.7%) | 1,466 (77.8%) |
| 19 to 25 Years | 0 (0.0%) | 537 (92.7%) |
| 25 to 34 Years | 308 (43.4%) | 665 (93.7%) |
| 35 to 44 Years | 176 (11.9%) | 1,163 (78.9%) |
| 45 to 54 Years | 36 (3.4%) | 1,035 (97.1%) |
| 55 to 64 Years | 162 (23.4%) | 499 (72.0%) |
| 65 to 74 Years | 397 (100.0%) | 195 (49.1%) |
| 75 Years and over | 93 (100.0%) | 47 (50.5%) |
| Total | 1,791 (24.2%) | 5,979 (80.8%) |
Disability Status by Sex by Age in Eagle
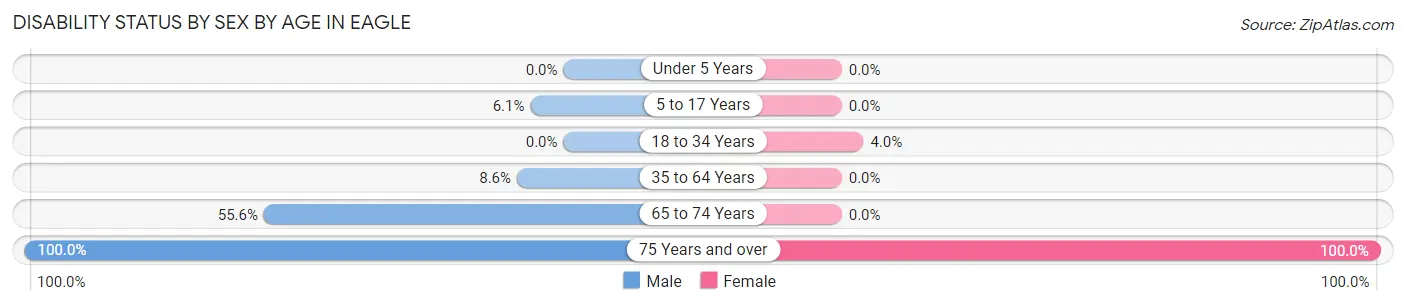
| Age Bracket | Male | Female |
| Under 5 Years | 0 (0.0%) | 0 (0.0%) |
| 5 to 17 Years | 57 (6.1%) | 0 (0.0%) |
| 18 to 34 Years | 0 (0.0%) | 42 (4.0%) |
| 35 to 64 Years | 149 (8.6%) | 0 (0.0%) |
| 65 to 74 Years | 134 (55.6%) | 0 (0.0%) |
| 75 Years and over | 46 (100.0%) | 47 (100.0%) |
Disability Class by Sex by Age in Eagle
Disability Class: Hearing Difficulty
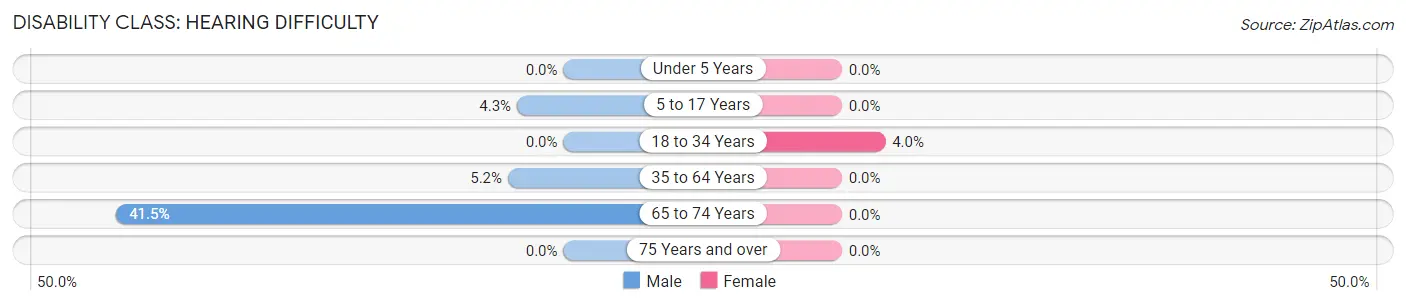
| Age Bracket | Male | Female |
| Under 5 Years | 0 (0.0%) | 0 (0.0%) |
| 5 to 17 Years | 40 (4.3%) | 0 (0.0%) |
| 18 to 34 Years | 0 (0.0%) | 42 (4.0%) |
| 35 to 64 Years | 89 (5.1%) | 0 (0.0%) |
| 65 to 74 Years | 100 (41.5%) | 0 (0.0%) |
| 75 Years and over | 0 (0.0%) | 0 (0.0%) |
Disability Class: Vision Difficulty
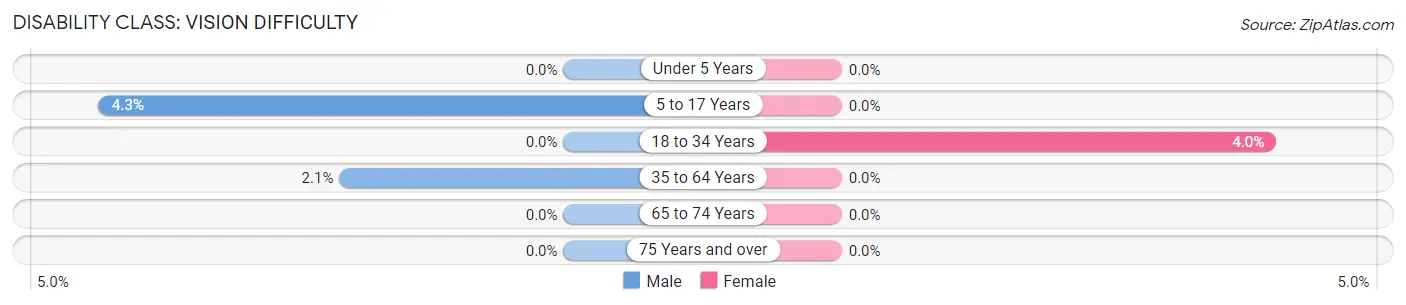
| Age Bracket | Male | Female |
| Under 5 Years | 0 (0.0%) | 0 (0.0%) |
| 5 to 17 Years | 40 (4.3%) | 0 (0.0%) |
| 18 to 34 Years | 0 (0.0%) | 42 (4.0%) |
| 35 to 64 Years | 36 (2.1%) | 0 (0.0%) |
| 65 to 74 Years | 0 (0.0%) | 0 (0.0%) |
| 75 Years and over | 0 (0.0%) | 0 (0.0%) |
Disability Class: Cognitive Difficulty
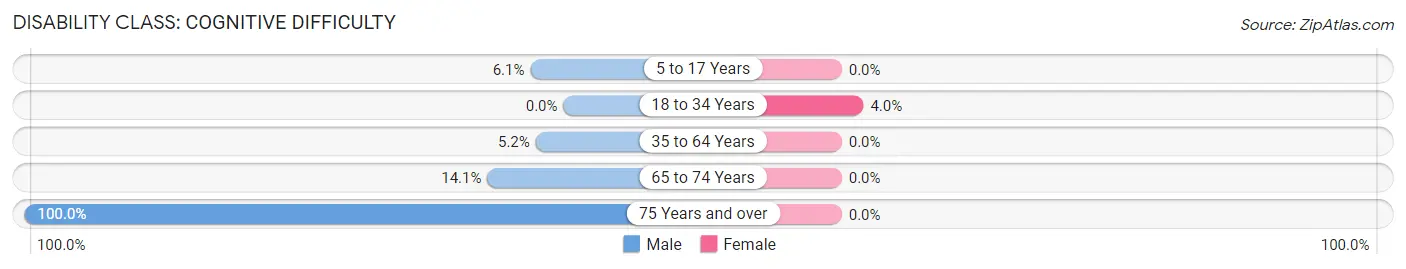
| Age Bracket | Male | Female |
| 5 to 17 Years | 57 (6.1%) | 0 (0.0%) |
| 18 to 34 Years | 0 (0.0%) | 42 (4.0%) |
| 35 to 64 Years | 89 (5.1%) | 0 (0.0%) |
| 65 to 74 Years | 34 (14.1%) | 0 (0.0%) |
| 75 Years and over | 46 (100.0%) | 0 (0.0%) |
Disability Class: Ambulatory Difficulty
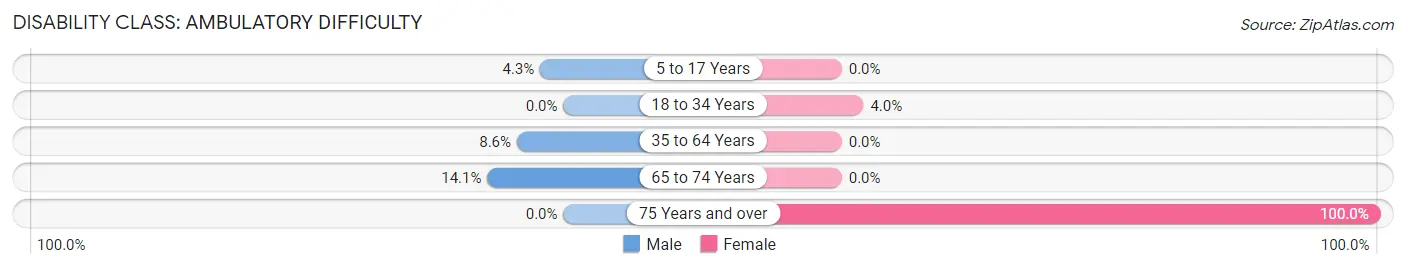
| Age Bracket | Male | Female |
| 5 to 17 Years | 40 (4.3%) | 0 (0.0%) |
| 18 to 34 Years | 0 (0.0%) | 42 (4.0%) |
| 35 to 64 Years | 149 (8.6%) | 0 (0.0%) |
| 65 to 74 Years | 34 (14.1%) | 0 (0.0%) |
| 75 Years and over | 0 (0.0%) | 47 (100.0%) |
Disability Class: Self-Care Difficulty
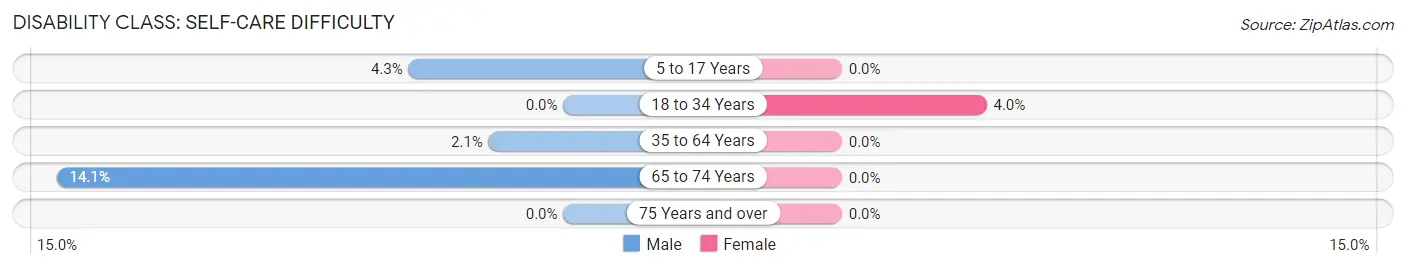
| Age Bracket | Male | Female |
| 5 to 17 Years | 40 (4.3%) | 0 (0.0%) |
| 18 to 34 Years | 0 (0.0%) | 42 (4.0%) |
| 35 to 64 Years | 36 (2.1%) | 0 (0.0%) |
| 65 to 74 Years | 34 (14.1%) | 0 (0.0%) |
| 75 Years and over | 0 (0.0%) | 0 (0.0%) |
Technology Access in Eagle
Computing Device Access in Eagle
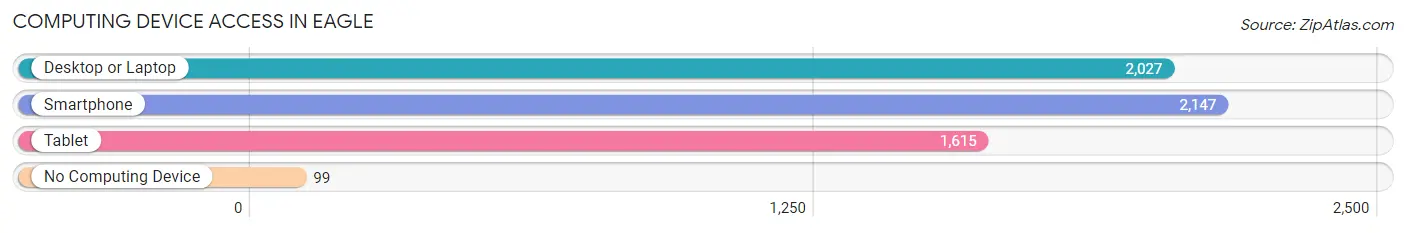
| Device Type | # Households | % Households |
| Desktop or Laptop | 2,027 | 85.5% |
| Smartphone | 2,147 | 90.6% |
| Tablet | 1,615 | 68.1% |
| No Computing Device | 99 | 4.2% |
| Total | 2,370 | 100.0% |
Internet Access in Eagle
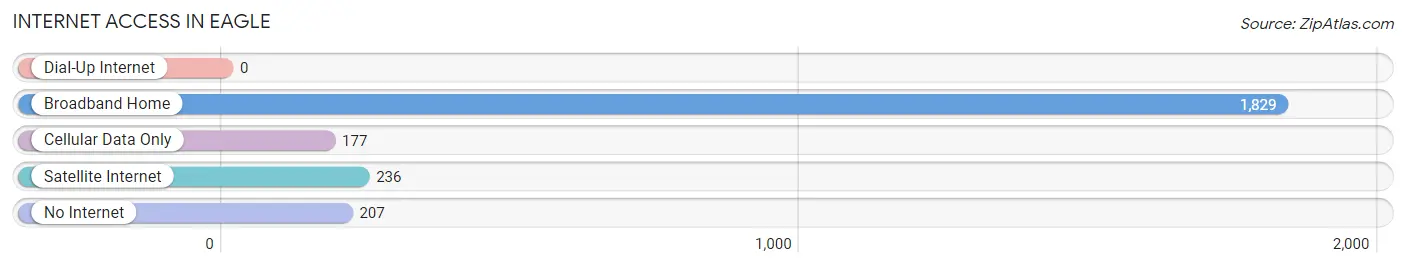
| Internet Type | # Households | % Households |
| Dial-Up Internet | 0 | 0.0% |
| Broadband Home | 1,829 | 77.2% |
| Cellular Data Only | 177 | 7.5% |
| Satellite Internet | 236 | 10.0% |
| No Internet | 207 | 8.7% |
| Total | 2,370 | 100.0% |
Eagle Summary
Eagle, Colorado is a small town located in the heart of the Rocky Mountains. It is situated in Eagle County, which is part of the Vail Valley region of Colorado. The town is located at the confluence of the Eagle and Colorado Rivers, and is surrounded by the White River National Forest. The town has a population of approximately 6,500 people, and is the county seat of Eagle County.
Geography
Eagle is located in the Rocky Mountains of Colorado, at an elevation of 6,845 feet. The town is situated in the Eagle Valley, which is surrounded by the Sawatch Range to the west, the Gore Range to the east, and the Flat Tops to the north. The town is located at the confluence of the Eagle and Colorado Rivers, and is surrounded by the White River National Forest. The town is located approximately 100 miles west of Denver, and is accessible by Interstate 70.
Climate
Eagle has a semi-arid climate, with hot summers and cold winters. The average high temperature in the summer is around 85°F, and the average low temperature in the winter is around 10°F. The town receives an average of 18 inches of precipitation per year, with most of it falling in the form of snow.
Economy
Eagle’s economy is largely based on tourism, as the town is located in a popular ski and snowboarding destination. The town is also home to several businesses, including restaurants, retail stores, and lodging. The town is also home to several manufacturing companies, including a paper mill and a brewery.
Demographics
As of the 2010 census, the population of Eagle was 6,508. The racial makeup of the town was 94.3% White, 0.7% African American, 0.7% Native American, 0.7% Asian, 0.2% Pacific Islander, 1.2% from other races, and 2.2% from two or more races. Hispanic or Latino of any race were 5.3% of the population.
The median income for a household in Eagle was $50,977, and the median income for a family was $60,977. The per capita income for the town was $27,977. About 8.3% of families and 11.2% of the population were below the poverty line, including 15.2% of those under age 18 and 5.2% of those age 65 or over.
Conclusion
Eagle, Colorado is a small town located in the heart of the Rocky Mountains. It is situated in Eagle County, which is part of the Vail Valley region of Colorado. The town is located at the confluence of the Eagle and Colorado Rivers, and is surrounded by the White River National Forest. The town has a population of approximately 6,500 people, and is the county seat of Eagle County. The town’s economy is largely based on tourism, as it is located in a popular ski and snowboarding destination. The town is also home to several businesses, including restaurants, retail stores, and lodging. The town has a semi-arid climate, with hot summers and cold winters. The racial makeup of the town is 94.3% White, 0.7% African American, 0.7% Native American, 0.7% Asian, 0.2% Pacific Islander, 1.2% from other races, and 2.2% from two or more races. The median income for a household in Eagle was $50,977, and the median income for a family was $60,977.
Common Questions
What is Per Capita Income in Eagle?
Per Capita income in Eagle is $41,572.
What is the Median Family Income in Eagle?
Median Family Income in Eagle is $120,190.
What is the Median Household income in Eagle?
Median Household Income in Eagle is $101,373.
What is Income or Wage Gap in Eagle?
Income or Wage Gap in Eagle is 35.9%.
Women in Eagle earn 64.1 cents for every dollar earned by a man.
What is Inequality or Gini Index in Eagle?
Inequality or Gini Index in Eagle is 0.41.
What is the Total Population of Eagle?
Total Population of Eagle is 7,481.
What is the Total Male Population of Eagle?
Total Male Population of Eagle is 3,759.
What is the Total Female Population of Eagle?
Total Female Population of Eagle is 3,722.
What is the Ratio of Males per 100 Females in Eagle?
There are 100.99 Males per 100 Females in Eagle.
What is the Ratio of Females per 100 Males in Eagle?
There are 99.02 Females per 100 Males in Eagle.
What is the Median Population Age in Eagle?
Median Population Age in Eagle is 35.1 Years.
What is the Average Family Size in Eagle
Average Family Size in Eagle is 3.7 People.
What is the Average Household Size in Eagle
Average Household Size in Eagle is 3.1 People.
How Large is the Labor Force in Eagle?
There are 4,278 People in the Labor Forcein in Eagle.
What is the Percentage of People in the Labor Force in Eagle?
76.3% of People are in the Labor Force in Eagle.
What is the Unemployment Rate in Eagle?
Unemployment Rate in Eagle is 2.0%.