Dove Creek, CO
Dove Creek Map
Dove Creek Overview
775
TOTAL POPULATION
488
MALE POPULATION
287
FEMALE POPULATION
170.03
MALES / 100 FEMALES
58.81
FEMALES / 100 MALES
44.0
MEDIAN AGE
2.9
AVG FAMILY SIZE
2.6
AVG HOUSEHOLD SIZE
$39,798
PER CAPITA INCOME
$71,136
AVG FAMILY INCOME
$70,855
AVG HOUSEHOLD INCOME
32.1%
WAGE / INCOME GAP [ % ]
67.9¢/ $1
WAGE / INCOME GAP [ $ ]
0.47
INEQUALITY / GINI INDEX
319
LABOR FORCE [ PEOPLE ]
51.5%
PERCENT IN LABOR FORCE
5.6%
UNEMPLOYMENT RATE
Dove Creek Zip Codes
Dove Creek Area Codes
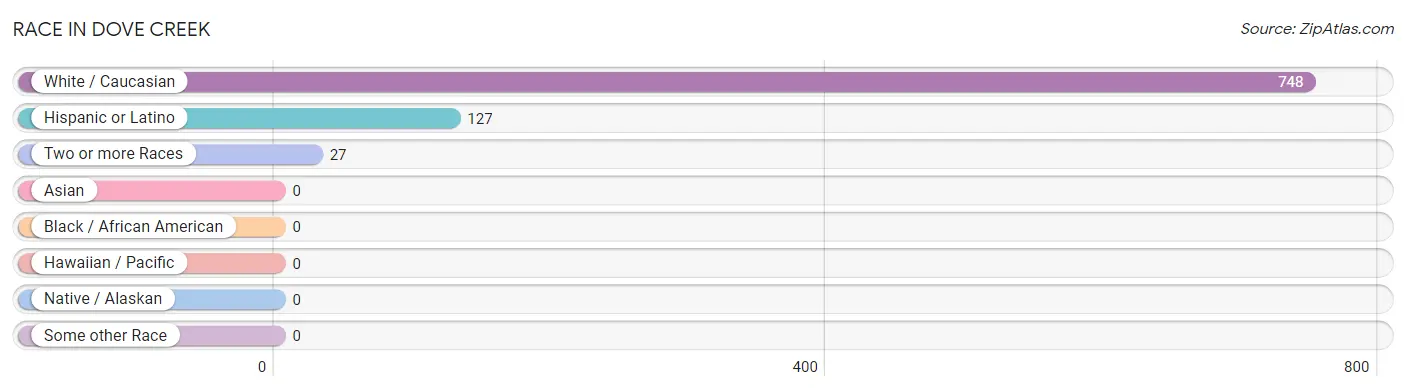
Race in Dove Creek
The most populous races in Dove Creek are White / Caucasian (748 | 96.5%), Hispanic or Latino (127 | 16.4%), and Two or more Races (27 | 3.5%).
| Race | # Population | % Population |
| Asian | 0 | 0.0% |
| Black / African American | 0 | 0.0% |
| Hawaiian / Pacific | 0 | 0.0% |
| Hispanic or Latino | 127 | 16.4% |
| Native / Alaskan | 0 | 0.0% |
| White / Caucasian | 748 | 96.5% |
| Two or more Races | 27 | 3.5% |
| Some other Race | 0 | 0.0% |
| Total | 775 | 100.0% |
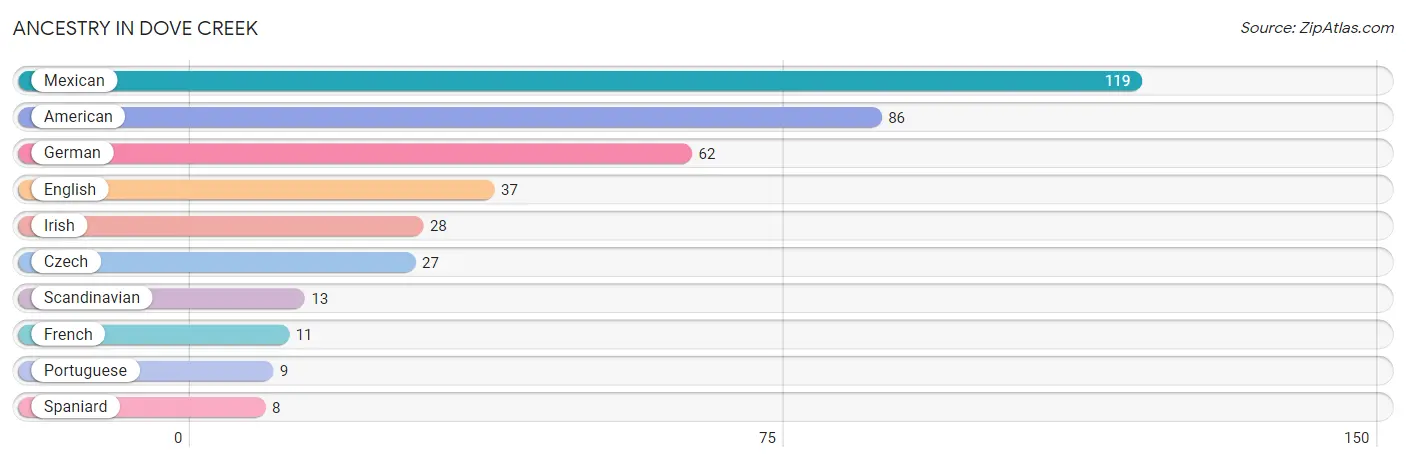
Ancestry in Dove Creek
The most populous ancestries reported in Dove Creek are Mexican (119 | 15.3%), American (86 | 11.1%), German (62 | 8.0%), English (37 | 4.8%), and Irish (28 | 3.6%), together accounting for 42.8% of all Dove Creek residents.
| Ancestry | # Population | % Population |
| American | 86 | 11.1% |
| Czech | 27 | 3.5% |
| English | 37 | 4.8% |
| French | 11 | 1.4% |
| German | 62 | 8.0% |
| Irish | 28 | 3.6% |
| Mexican | 119 | 15.3% |
| Portuguese | 9 | 1.2% |
| Scandinavian | 13 | 1.7% |
| Spaniard | 8 | 1.0% | View All 10 Rows |
Immigrants in Dove Creek

| Immigration Origin | # Population | % Population | View All 0 Rows |
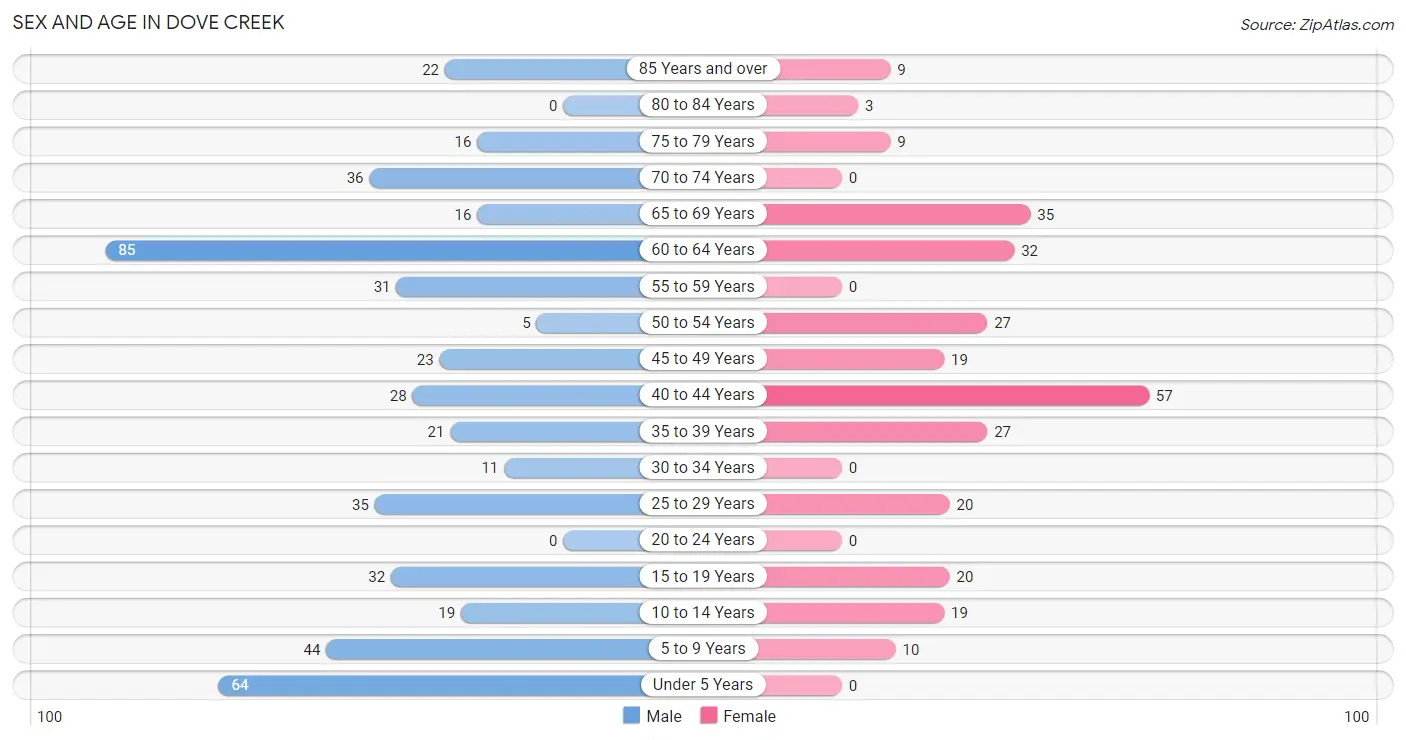
Sex and Age in Dove Creek
Sex and Age in Dove Creek
The most populous age groups in Dove Creek are 60 to 64 Years (85 | 17.4%) for men and 40 to 44 Years (57 | 19.9%) for women.
| Age Bracket | Male | Female |
| Under 5 Years | 64 (13.1%) | 0 (0.0%) |
| 5 to 9 Years | 44 (9.0%) | 10 (3.5%) |
| 10 to 14 Years | 19 (3.9%) | 19 (6.6%) |
| 15 to 19 Years | 32 (6.6%) | 20 (7.0%) |
| 20 to 24 Years | 0 (0.0%) | 0 (0.0%) |
| 25 to 29 Years | 35 (7.2%) | 20 (7.0%) |
| 30 to 34 Years | 11 (2.2%) | 0 (0.0%) |
| 35 to 39 Years | 21 (4.3%) | 27 (9.4%) |
| 40 to 44 Years | 28 (5.7%) | 57 (19.9%) |
| 45 to 49 Years | 23 (4.7%) | 19 (6.6%) |
| 50 to 54 Years | 5 (1.0%) | 27 (9.4%) |
| 55 to 59 Years | 31 (6.4%) | 0 (0.0%) |
| 60 to 64 Years | 85 (17.4%) | 32 (11.2%) |
| 65 to 69 Years | 16 (3.3%) | 35 (12.2%) |
| 70 to 74 Years | 36 (7.4%) | 0 (0.0%) |
| 75 to 79 Years | 16 (3.3%) | 9 (3.1%) |
| 80 to 84 Years | 0 (0.0%) | 3 (1.1%) |
| 85 Years and over | 22 (4.5%) | 9 (3.1%) |
| Total | 488 (100.0%) | 287 (100.0%) |
Families and Households in Dove Creek
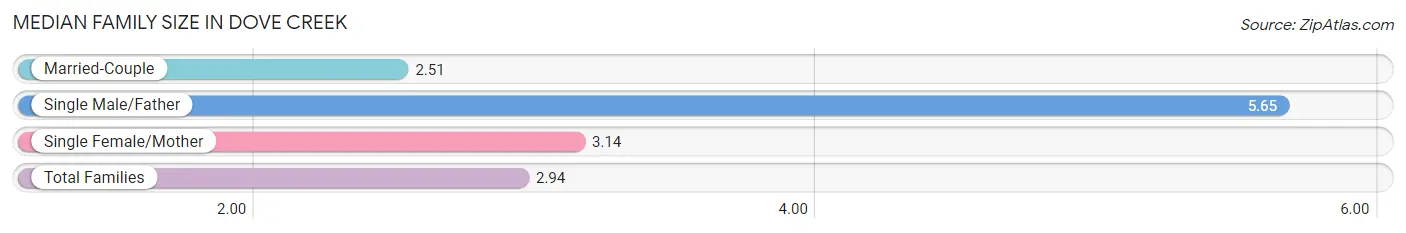
Median Family Size in Dove Creek
The median family size in Dove Creek is 2.94 persons per family, with single male/father families (23 | 9.8%) accounting for the largest median family size of 5.65 persons per family. On the other hand, married-couple families (164 | 69.5%) represent the smallest median family size with 2.51 persons per family.
| Family Type | # Families | Family Size |
| Married-Couple | 164 (69.5%) | 2.51 |
| Single Male/Father | 23 (9.8%) | 5.65 |
| Single Female/Mother | 49 (20.8%) | 3.14 |
| Total Families | 236 (100.0%) | 2.94 |
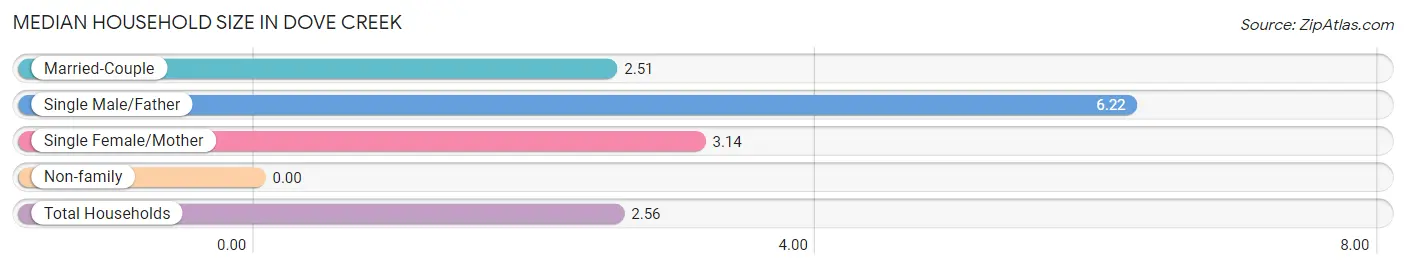
Median Household Size in Dove Creek
| Household Type | # Households | Household Size |
| Married-Couple | 164 (54.1%) | 2.51 |
| Single Male/Father | 23 (7.6%) | 6.22 |
| Single Female/Mother | 49 (16.2%) | 3.14 |
| Non-family | 67 (22.1%) | - |
| Total Households | 303 (100.0%) | 2.56 |
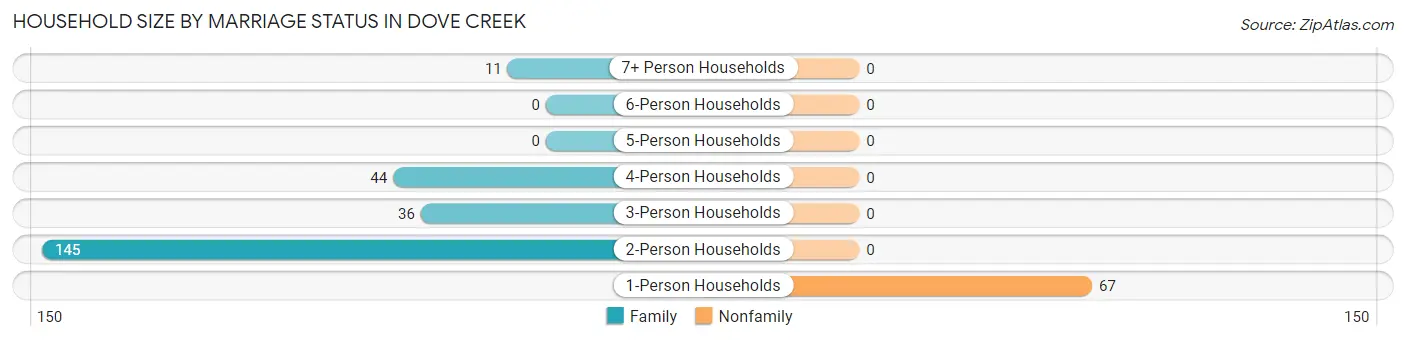
Household Size by Marriage Status in Dove Creek
Out of a total of 303 households in Dove Creek, 236 (77.9%) are family households, while 67 (22.1%) are nonfamily households. The most numerous type of family households are 2-person households, comprising 145, and the most common type of nonfamily households are 1-person households, comprising 67.
| Household Size | Family Households | Nonfamily Households |
| 1-Person Households | - | 67 (22.1%) |
| 2-Person Households | 145 (47.8%) | 0 (0.0%) |
| 3-Person Households | 36 (11.9%) | 0 (0.0%) |
| 4-Person Households | 44 (14.5%) | 0 (0.0%) |
| 5-Person Households | 0 (0.0%) | 0 (0.0%) |
| 6-Person Households | 0 (0.0%) | 0 (0.0%) |
| 7+ Person Households | 11 (3.6%) | 0 (0.0%) |
| Total | 236 (77.9%) | 67 (22.1%) |
Female Fertility in Dove Creek
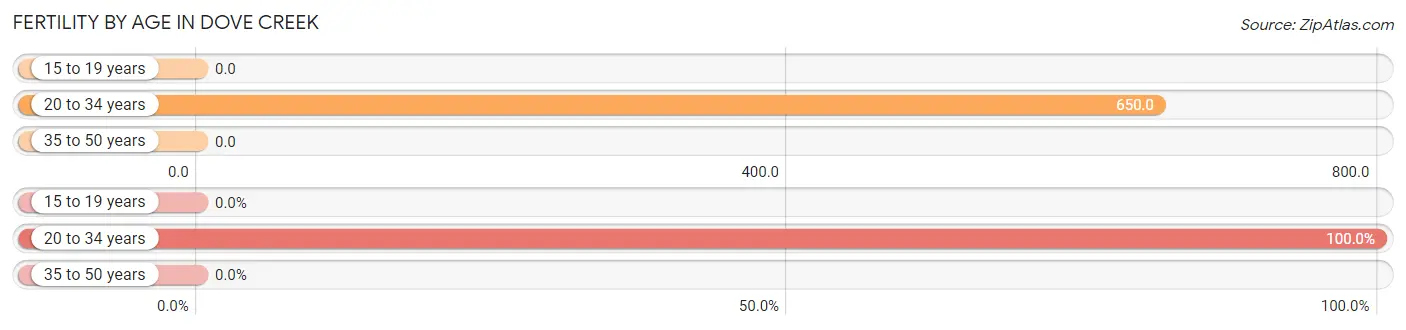
Fertility by Age in Dove Creek
Average fertility rate in Dove Creek is 88.0 births per 1,000 women. Women in the age bracket of 20 to 34 years have the highest fertility rate with 650.0 births per 1,000 women. Women in the age bracket of 20 to 34 years acount for 100.0% of all women with births.
| Age Bracket | Women with Births | Births / 1,000 Women |
| 15 to 19 years | 0 (0.0%) | 0.0 |
| 20 to 34 years | 13 (100.0%) | 650.0 |
| 35 to 50 years | 0 (0.0%) | 0.0 |
| Total | 13 (100.0%) | 88.0 |
Fertility by Age by Marriage Status in Dove Creek
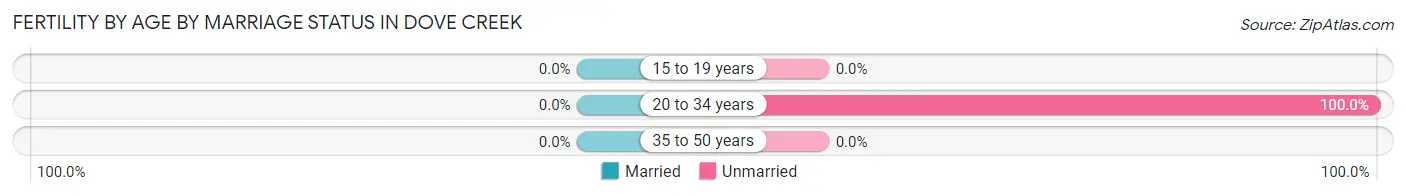
| Age Bracket | Married | Unmarried |
| 15 to 19 years | 0 (0.0%) | 0 (0.0%) |
| 20 to 34 years | 0 (0.0%) | 13 (100.0%) |
| 35 to 50 years | 0 (0.0%) | 0 (0.0%) |
| Total | 0 (0.0%) | 13 (100.0%) |
Fertility by Education in Dove Creek
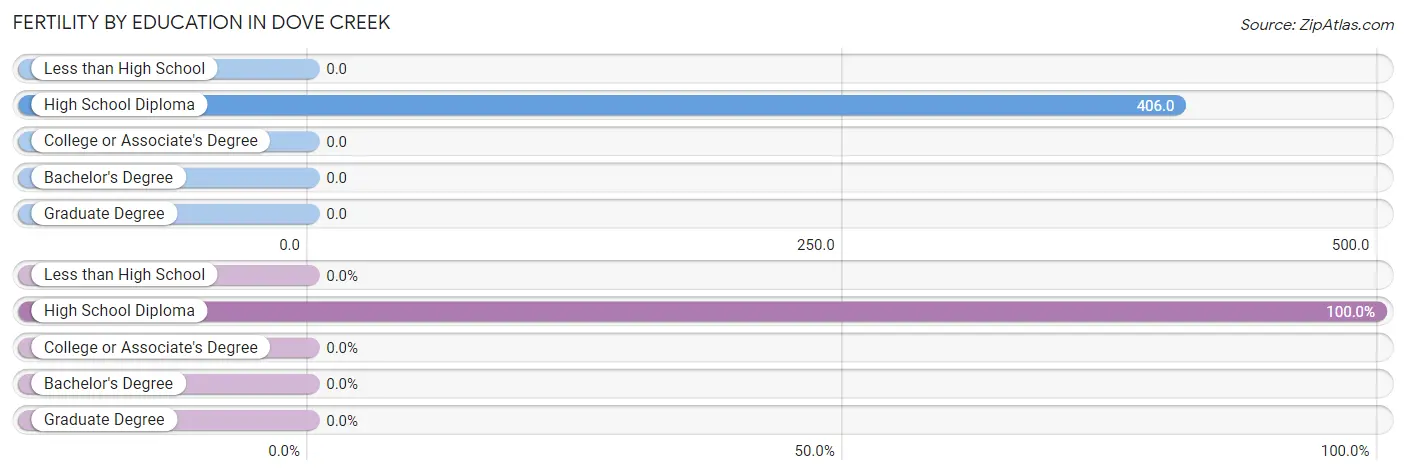
| Educational Attainment | Women with Births | Births / 1,000 Women |
| Less than High School | 0 (0.0%) | 0.0 |
| High School Diploma | 13 (100.0%) | 406.0 |
| College or Associate's Degree | 0 (0.0%) | 0.0 |
| Bachelor's Degree | 0 (0.0%) | 0.0 |
| Graduate Degree | 0 (0.0%) | 0.0 |
| Total | 13 (100.0%) | 88.0 |
Fertility by Education by Marriage Status in Dove Creek
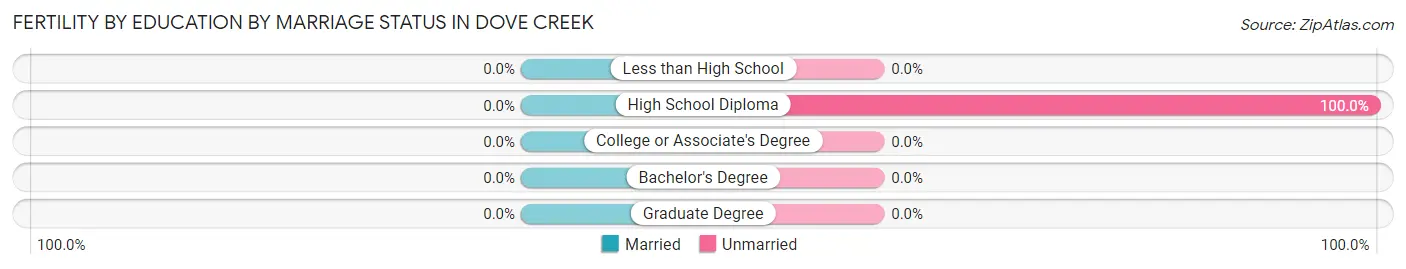
| Educational Attainment | Married | Unmarried |
| Less than High School | 0 (0.0%) | 0 (0.0%) |
| High School Diploma | 0 (0.0%) | 13 (100.0%) |
| College or Associate's Degree | 0 (0.0%) | 0 (0.0%) |
| Bachelor's Degree | 0 (0.0%) | 0 (0.0%) |
| Graduate Degree | 0 (0.0%) | 0 (0.0%) |
| Total | 0 (0.0%) | 13 (100.0%) |
Income in Dove Creek
Income Overview in Dove Creek
Per Capita Income in Dove Creek is $39,798, while median incomes of families and households are $71,136 and $70,855 respectively.
| Characteristic | Number | Measure |
| Per Capita Income | 775 | $39,798 |
| Median Family Income | 236 | $71,136 |
| Mean Family Income | 236 | $98,348 |
| Median Household Income | 303 | $70,855 |
| Mean Household Income | 303 | $97,805 |
| Income Deficit | 236 | $0 |
| Wage / Income Gap (%) | 775 | 32.09% |
| Wage / Income Gap ($) | 775 | 67.91¢ per $1 |
| Gini / Inequality Index | 775 | 0.47 |
Earnings by Sex in Dove Creek
Average Earnings in Dove Creek are $45,000, $46,019 for men and $31,250 for women, a difference of 32.1%.
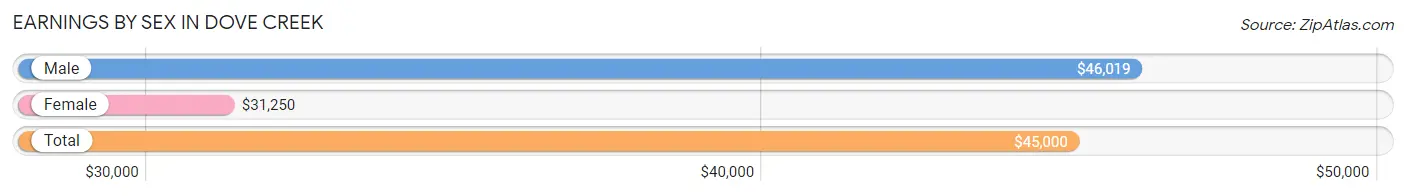
| Sex | Number | Average Earnings |
| Male | 232 (70.7%) | $46,019 |
| Female | 96 (29.3%) | $31,250 |
| Total | 328 (100.0%) | $45,000 |
Earnings by Sex by Income Bracket in Dove Creek
The most common earnings brackets in Dove Creek are $100,000+ for men (72 | 31.0%) and $2,500 to $4,999 for women (19 | 19.8%).
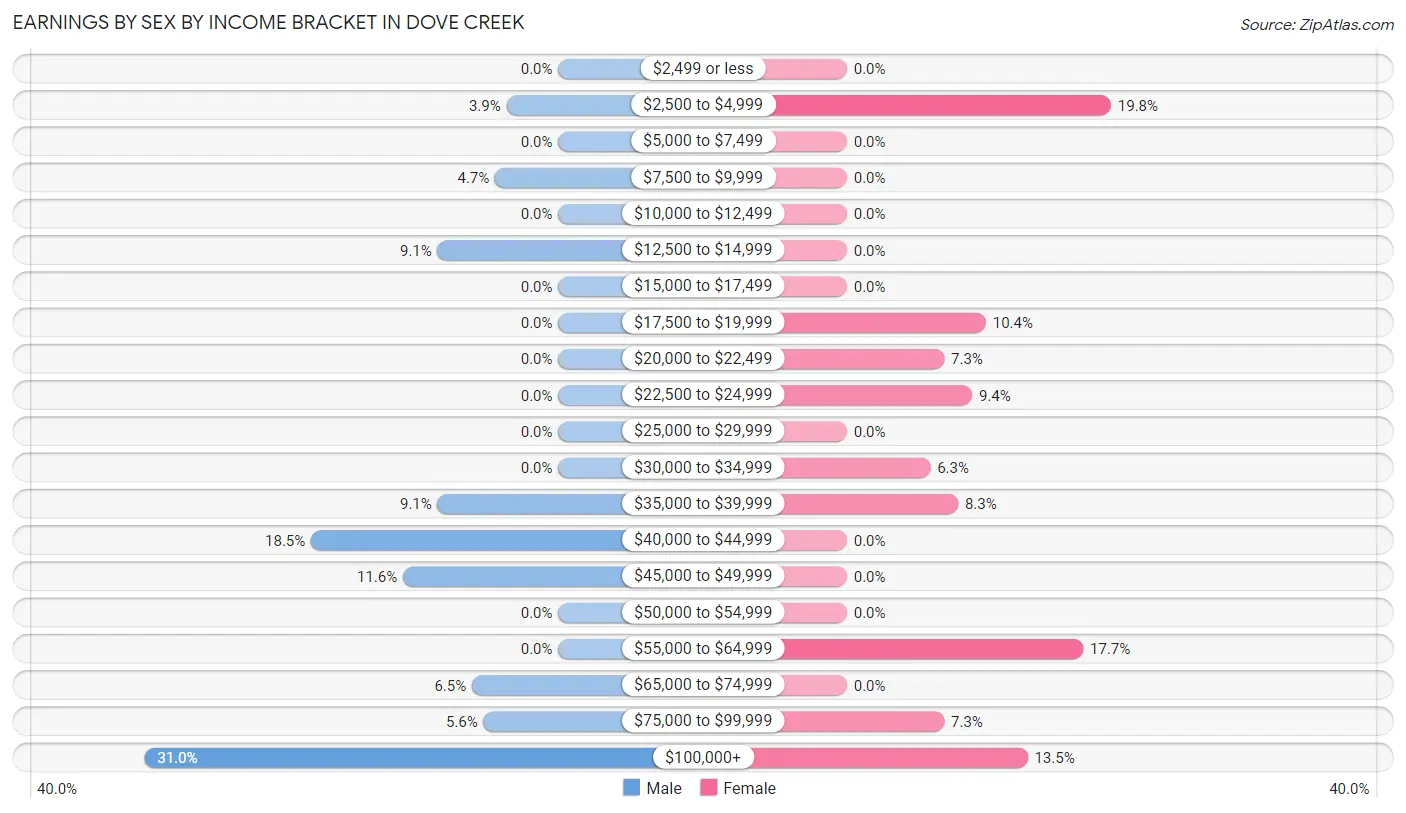
| Income | Male | Female |
| $2,499 or less | 0 (0.0%) | 0 (0.0%) |
| $2,500 to $4,999 | 9 (3.9%) | 19 (19.8%) |
| $5,000 to $7,499 | 0 (0.0%) | 0 (0.0%) |
| $7,500 to $9,999 | 11 (4.7%) | 0 (0.0%) |
| $10,000 to $12,499 | 0 (0.0%) | 0 (0.0%) |
| $12,500 to $14,999 | 21 (9.0%) | 0 (0.0%) |
| $15,000 to $17,499 | 0 (0.0%) | 0 (0.0%) |
| $17,500 to $19,999 | 0 (0.0%) | 10 (10.4%) |
| $20,000 to $22,499 | 0 (0.0%) | 7 (7.3%) |
| $22,500 to $24,999 | 0 (0.0%) | 9 (9.4%) |
| $25,000 to $29,999 | 0 (0.0%) | 0 (0.0%) |
| $30,000 to $34,999 | 0 (0.0%) | 6 (6.2%) |
| $35,000 to $39,999 | 21 (9.0%) | 8 (8.3%) |
| $40,000 to $44,999 | 43 (18.5%) | 0 (0.0%) |
| $45,000 to $49,999 | 27 (11.6%) | 0 (0.0%) |
| $50,000 to $54,999 | 0 (0.0%) | 0 (0.0%) |
| $55,000 to $64,999 | 0 (0.0%) | 17 (17.7%) |
| $65,000 to $74,999 | 15 (6.5%) | 0 (0.0%) |
| $75,000 to $99,999 | 13 (5.6%) | 7 (7.3%) |
| $100,000+ | 72 (31.0%) | 13 (13.5%) |
| Total | 232 (100.0%) | 96 (100.0%) |
Earnings by Sex by Educational Attainment in Dove Creek
Average earnings in Dove Creek are $46,435 for men and $31,250 for women, a difference of 32.7%. Men with an educational attainment of college or associate's degree enjoy the highest average annual earnings of $127,614, while those with high school diploma education earn the least with $40,444. Women with an educational attainment of college or associate's degree earn the most with the average annual earnings of $32,083, while those with college or associate's degree education have the smallest earnings of $32,083.
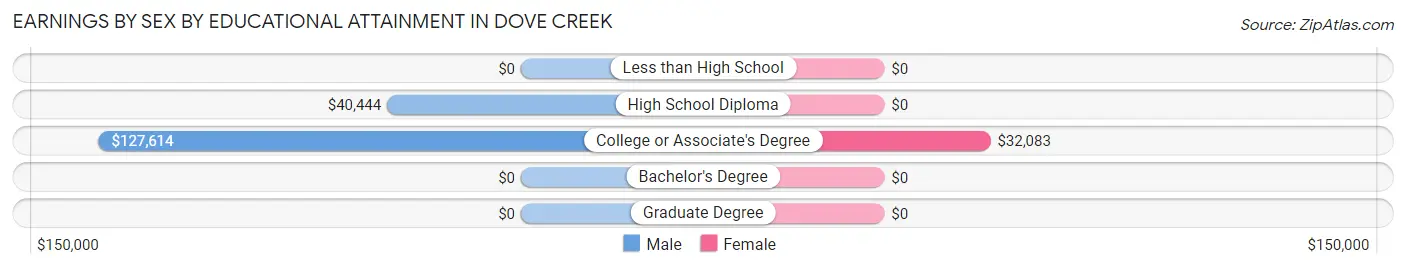
| Educational Attainment | Male Income | Female Income |
| Less than High School | - | - |
| High School Diploma | $40,444 | $0 |
| College or Associate's Degree | $127,614 | $32,083 |
| Bachelor's Degree | - | - |
| Graduate Degree | - | - |
| Total | $46,435 | $31,250 |
Family Income in Dove Creek
Family Income Brackets in Dove Creek
According to the Dove Creek family income data, there are 61 families falling into the $100,000 to $149,999 income range, which is the most common income bracket and makes up 25.9% of all families.
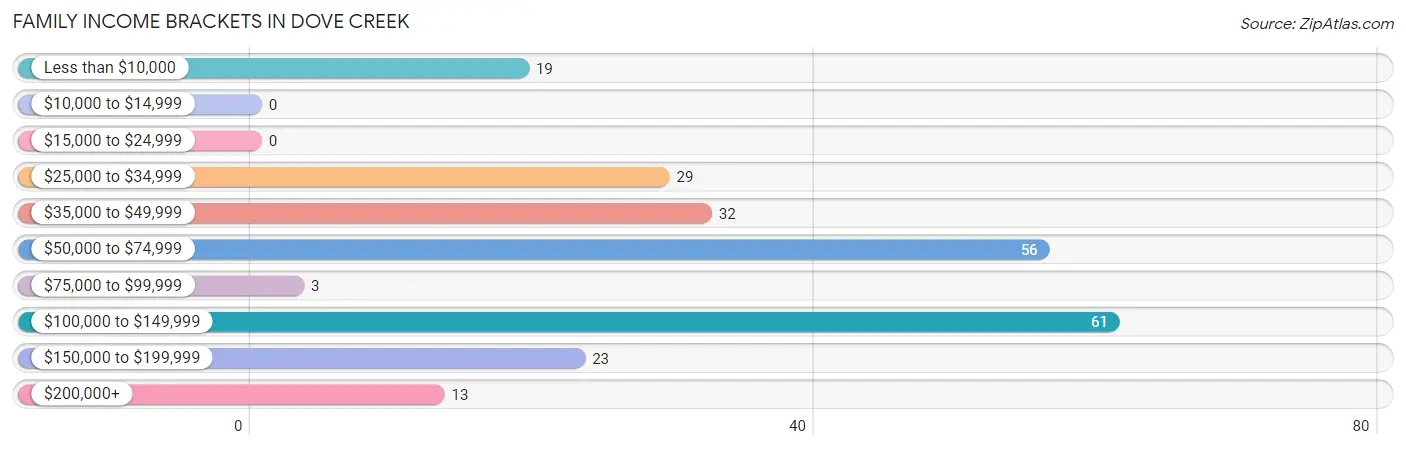
| Income Bracket | # Families | % Families |
| Less than $10,000 | 19 | 8.1% |
| $10,000 to $14,999 | 0 | 0.0% |
| $15,000 to $24,999 | 0 | 0.0% |
| $25,000 to $34,999 | 29 | 12.3% |
| $35,000 to $49,999 | 32 | 13.6% |
| $50,000 to $74,999 | 56 | 23.7% |
| $75,000 to $99,999 | 3 | 1.3% |
| $100,000 to $149,999 | 61 | 25.8% |
| $150,000 to $199,999 | 23 | 9.7% |
| $200,000+ | 13 | 5.5% |
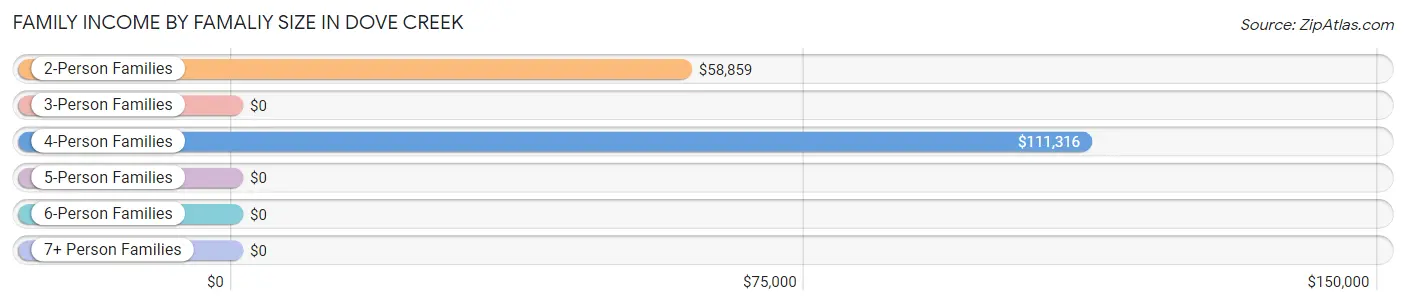
Family Income by Famaliy Size in Dove Creek
4-person families (44 | 18.6%) account for the highest median family income in Dove Creek with $111,316 per family, while 2-person families (145 | 61.4%) have the highest median income of $29,430 per family member.
| Income Bracket | # Families | Median Income |
| 2-Person Families | 145 (61.4%) | $58,859 |
| 3-Person Families | 36 (15.2%) | $0 |
| 4-Person Families | 44 (18.6%) | $111,316 |
| 5-Person Families | 0 (0.0%) | $0 |
| 6-Person Families | 11 (4.7%) | $0 |
| 7+ Person Families | 0 (0.0%) | $0 |
| Total | 236 (100.0%) | $71,136 |
Family Income by Number of Earners in Dove Creek
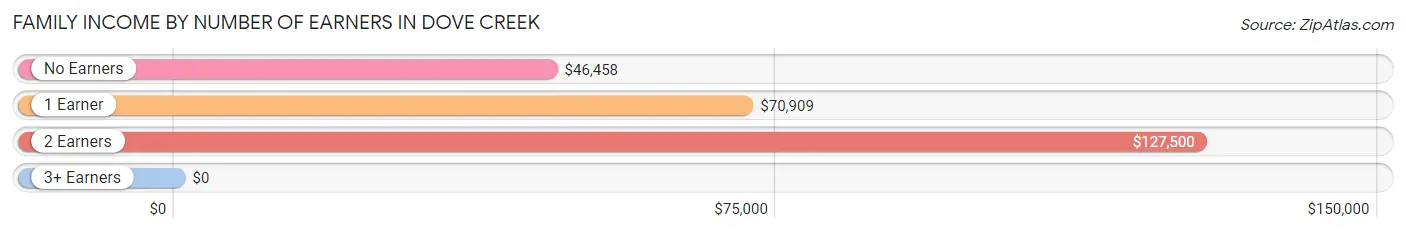
| Number of Earners | # Families | Median Income |
| No Earners | 58 (24.6%) | $46,458 |
| 1 Earner | 106 (44.9%) | $70,909 |
| 2 Earners | 72 (30.5%) | $127,500 |
| 3+ Earners | 0 (0.0%) | $0 |
| Total | 236 (100.0%) | $71,136 |
Household Income in Dove Creek
Household Income Brackets in Dove Creek
With 64 households falling in the category, the $50,000 to $74,999 income range is the most frequent in Dove Creek, accounting for 21.1% of all households.
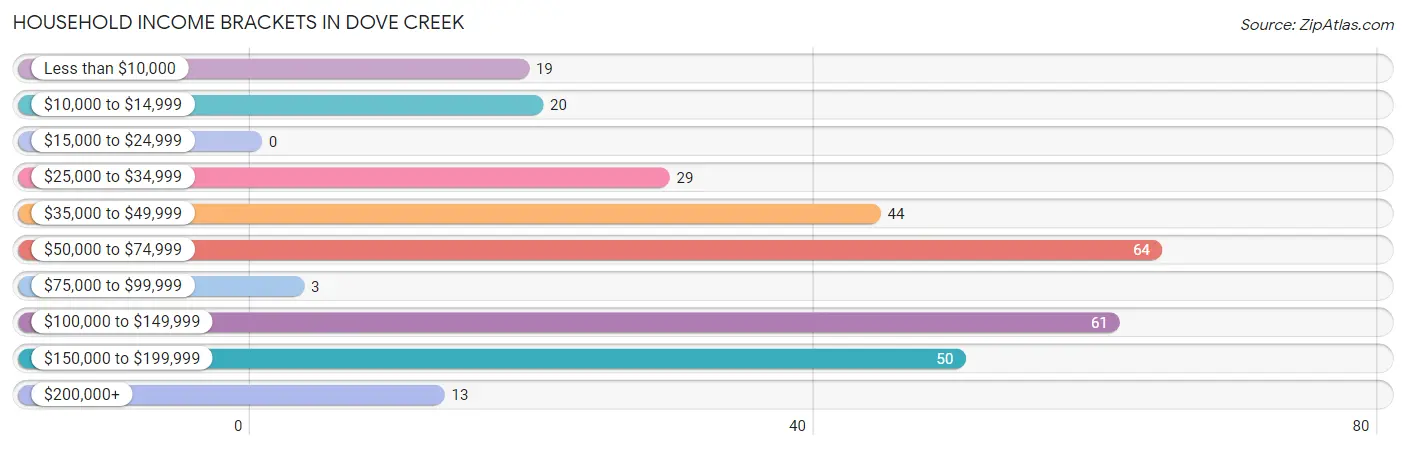
| Income Bracket | # Households | % Households |
| Less than $10,000 | 19 | 6.3% |
| $10,000 to $14,999 | 20 | 6.6% |
| $15,000 to $24,999 | 0 | 0.0% |
| $25,000 to $34,999 | 29 | 9.6% |
| $35,000 to $49,999 | 44 | 14.5% |
| $50,000 to $74,999 | 64 | 21.1% |
| $75,000 to $99,999 | 3 | 1.0% |
| $100,000 to $149,999 | 61 | 20.1% |
| $150,000 to $199,999 | 50 | 16.5% |
| $200,000+ | 13 | 4.3% |
Household Income by Householder Age in Dove Creek
The median household income in Dove Creek is $70,855, with the highest median household income of $107,083 found in the 45 to 64 years age bracket for the primary householder. A total of 80 households (26.4%) fall into this category.
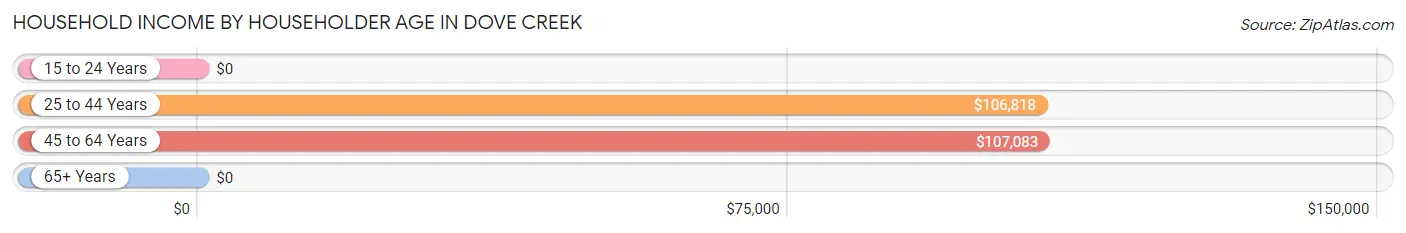
| Income Bracket | # Households | Median Income |
| 15 to 24 Years | 0 (0.0%) | $0 |
| 25 to 44 Years | 120 (39.6%) | $106,818 |
| 45 to 64 Years | 80 (26.4%) | $107,083 |
| 65+ Years | 103 (34.0%) | $0 |
| Total | 303 (100.0%) | $70,855 |
Poverty in Dove Creek
Income Below Poverty by Sex and Age in Dove Creek
With 10.9% poverty level for males and 25.4% for females among the residents of Dove Creek, 18 to 24 year old males and 16 and 17 year old females are the most vulnerable to poverty, with 23 males (100.0%) and 20 females (100.0%) in their respective age groups living below the poverty level.
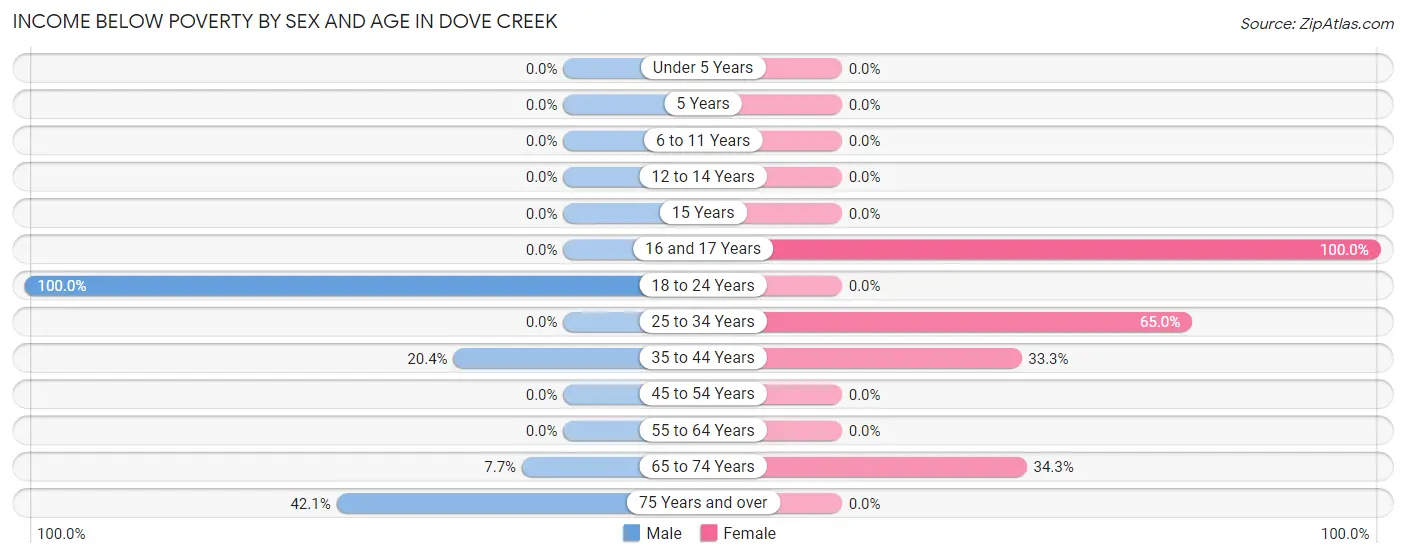
| Age Bracket | Male | Female |
| Under 5 Years | 0 (0.0%) | 0 (0.0%) |
| 5 Years | 0 (0.0%) | 0 (0.0%) |
| 6 to 11 Years | 0 (0.0%) | 0 (0.0%) |
| 12 to 14 Years | 0 (0.0%) | 0 (0.0%) |
| 15 Years | 0 (0.0%) | 0 (0.0%) |
| 16 and 17 Years | 0 (0.0%) | 20 (100.0%) |
| 18 to 24 Years | 23 (100.0%) | 0 (0.0%) |
| 25 to 34 Years | 0 (0.0%) | 13 (65.0%) |
| 35 to 44 Years | 10 (20.4%) | 28 (33.3%) |
| 45 to 54 Years | 0 (0.0%) | 0 (0.0%) |
| 55 to 64 Years | 0 (0.0%) | 0 (0.0%) |
| 65 to 74 Years | 4 (7.7%) | 12 (34.3%) |
| 75 Years and over | 16 (42.1%) | 0 (0.0%) |
| Total | 53 (10.9%) | 73 (25.4%) |
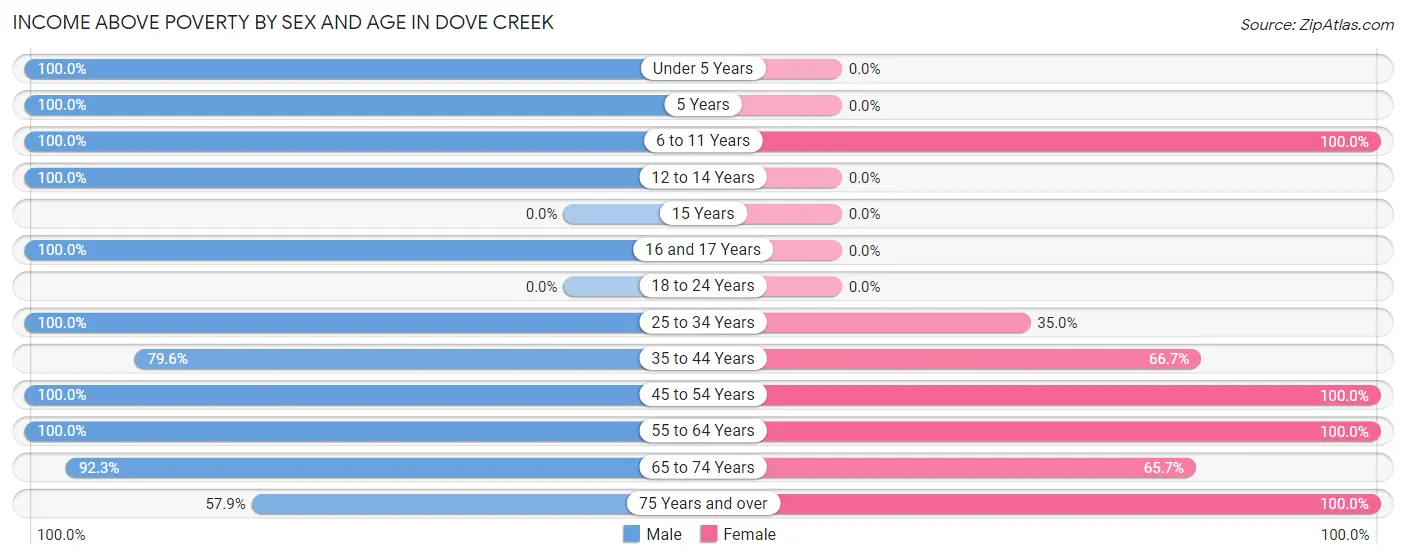
Income Above Poverty by Sex and Age in Dove Creek
According to the poverty statistics in Dove Creek, males aged under 5 years and females aged 6 to 11 years are the age groups that are most secure financially, with 100.0% of males and 100.0% of females in these age groups living above the poverty line.
| Age Bracket | Male | Female |
| Under 5 Years | 64 (100.0%) | 0 (0.0%) |
| 5 Years | 17 (100.0%) | 0 (0.0%) |
| 6 to 11 Years | 27 (100.0%) | 29 (100.0%) |
| 12 to 14 Years | 19 (100.0%) | 0 (0.0%) |
| 15 Years | 0 (0.0%) | 0 (0.0%) |
| 16 and 17 Years | 9 (100.0%) | 0 (0.0%) |
| 18 to 24 Years | 0 (0.0%) | 0 (0.0%) |
| 25 to 34 Years | 46 (100.0%) | 7 (35.0%) |
| 35 to 44 Years | 39 (79.6%) | 56 (66.7%) |
| 45 to 54 Years | 28 (100.0%) | 46 (100.0%) |
| 55 to 64 Years | 116 (100.0%) | 32 (100.0%) |
| 65 to 74 Years | 48 (92.3%) | 23 (65.7%) |
| 75 Years and over | 22 (57.9%) | 21 (100.0%) |
| Total | 435 (89.1%) | 214 (74.6%) |
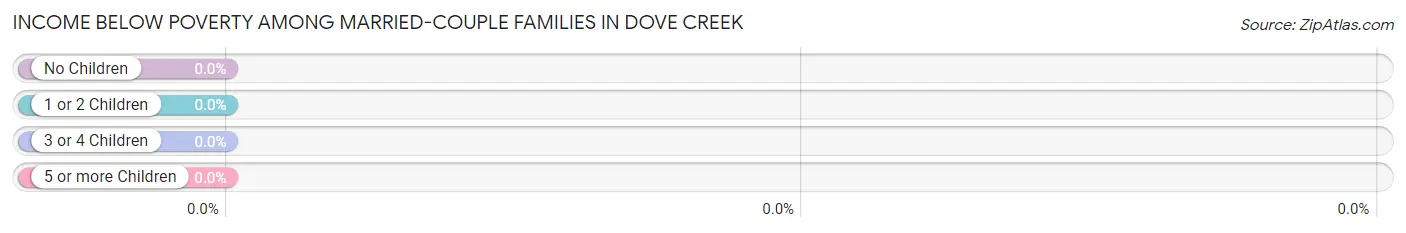
Income Below Poverty Among Married-Couple Families in Dove Creek
| Children | Above Poverty | Below Poverty |
| No Children | 111 (100.0%) | 0 (0.0%) |
| 1 or 2 Children | 53 (100.0%) | 0 (0.0%) |
| 3 or 4 Children | 0 (0.0%) | 0 (0.0%) |
| 5 or more Children | 0 (0.0%) | 0 (0.0%) |
| Total | 164 (100.0%) | 0 (0.0%) |
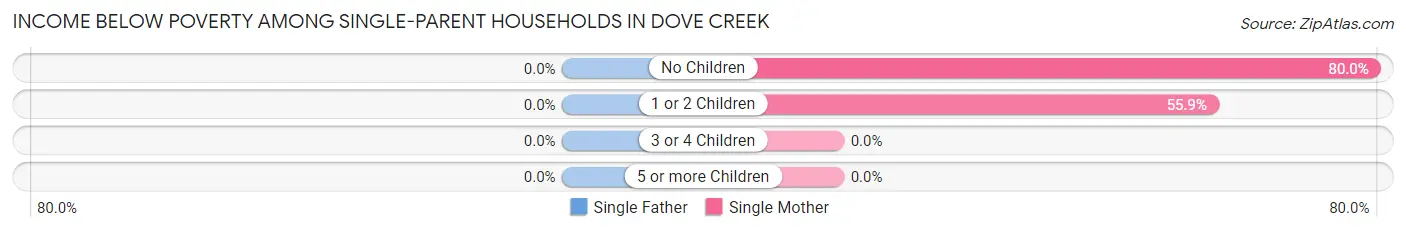
Income Below Poverty Among Single-Parent Households in Dove Creek
| Children | Single Father | Single Mother |
| No Children | 0 (0.0%) | 12 (80.0%) |
| 1 or 2 Children | 0 (0.0%) | 19 (55.9%) |
| 3 or 4 Children | 0 (0.0%) | 0 (0.0%) |
| 5 or more Children | 0 (0.0%) | 0 (0.0%) |
| Total | 0 (0.0%) | 31 (63.3%) |
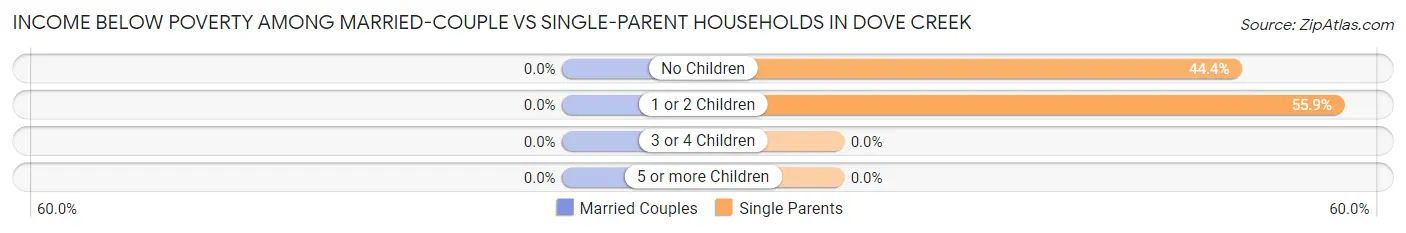
Income Below Poverty Among Married-Couple vs Single-Parent Households in Dove Creek
| Children | Married-Couple Families | Single-Parent Households |
| No Children | 0 (0.0%) | 12 (44.4%) |
| 1 or 2 Children | 0 (0.0%) | 19 (55.9%) |
| 3 or 4 Children | 0 (0.0%) | 0 (0.0%) |
| 5 or more Children | 0 (0.0%) | 0 (0.0%) |
| Total | 0 (0.0%) | 31 (43.1%) |
Employment Characteristics in Dove Creek
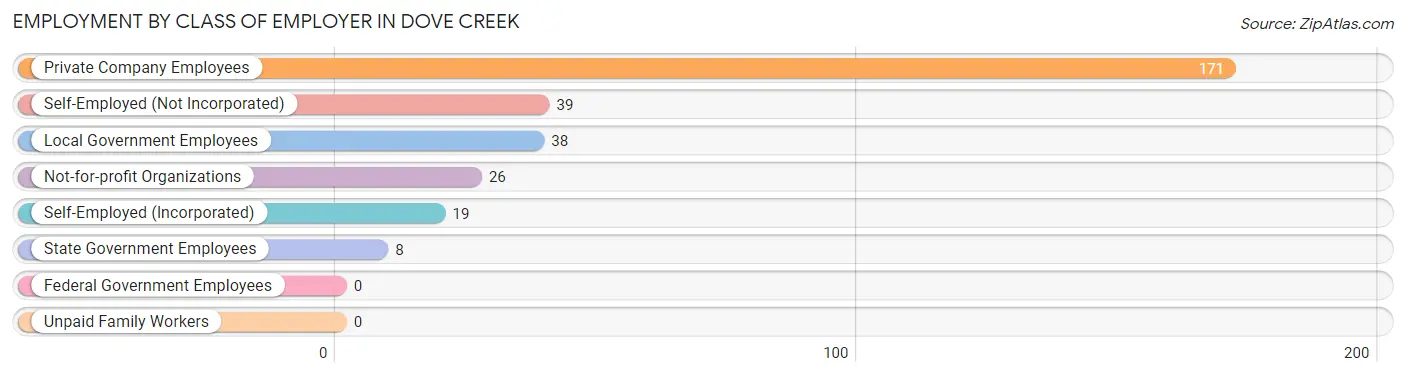
Employment by Class of Employer in Dove Creek
Among the 301 employed individuals in Dove Creek, private company employees (171 | 56.8%), self-employed (not incorporated) (39 | 13.0%), and local government employees (38 | 12.6%) make up the most common classes of employment.
| Employer Class | # Employees | % Employees |
| Private Company Employees | 171 | 56.8% |
| Self-Employed (Incorporated) | 19 | 6.3% |
| Self-Employed (Not Incorporated) | 39 | 13.0% |
| Not-for-profit Organizations | 26 | 8.6% |
| Local Government Employees | 38 | 12.6% |
| State Government Employees | 8 | 2.7% |
| Federal Government Employees | 0 | 0.0% |
| Unpaid Family Workers | 0 | 0.0% |
| Total | 301 | 100.0% |
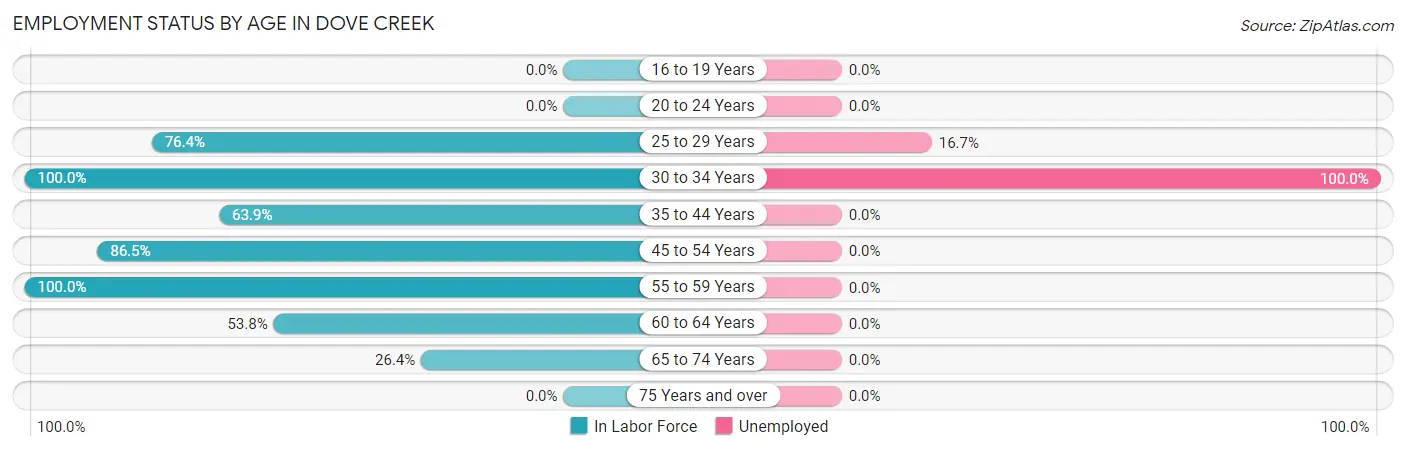
Employment Status by Age in Dove Creek
According to the labor force statistics for Dove Creek, out of the total population over 16 years of age (619), 51.5% or 319 individuals are in the labor force, with 5.6% or 18 of them unemployed. The age group with the highest labor force participation rate is 30 to 34 years, with 100.0% or 11 individuals in the labor force. Within the labor force, the 30 to 34 years age range has the highest percentage of unemployed individuals, with 100.0% or 11 of them being unemployed.
| Age Bracket | In Labor Force | Unemployed |
| 16 to 19 Years | 0 (0.0%) | 0 (0.0%) |
| 20 to 24 Years | 0 (0.0%) | 0 (0.0%) |
| 25 to 29 Years | 42 (76.4%) | 7 (16.7%) |
| 30 to 34 Years | 11 (100.0%) | 11 (100.0%) |
| 35 to 44 Years | 85 (63.9%) | 0 (0.0%) |
| 45 to 54 Years | 64 (86.5%) | 0 (0.0%) |
| 55 to 59 Years | 31 (100.0%) | 0 (0.0%) |
| 60 to 64 Years | 63 (53.8%) | 0 (0.0%) |
| 65 to 74 Years | 23 (26.4%) | 0 (0.0%) |
| 75 Years and over | 0 (0.0%) | 0 (0.0%) |
| Total | 319 (51.5%) | 18 (5.6%) |
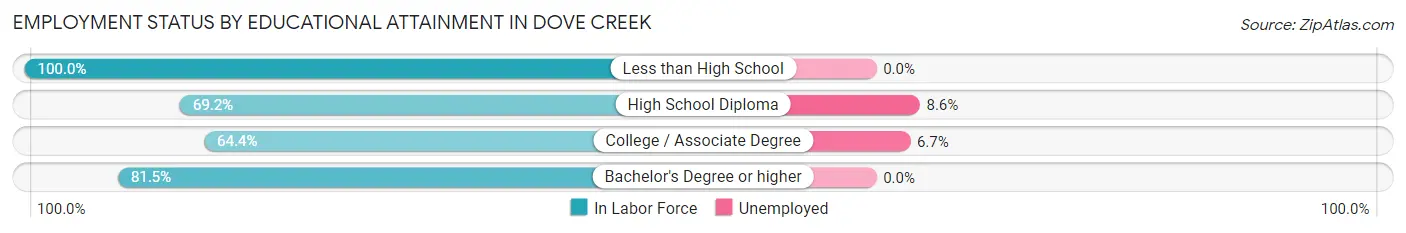
Employment Status by Educational Attainment in Dove Creek
According to labor force statistics for Dove Creek, 70.3% of individuals (296) out of the total population between 25 and 64 years of age (421) are in the labor force, with 6.1% or 18 of them being unemployed. The group with the highest labor force participation rate are those with the educational attainment of less than high school, with 100.0% or 19 individuals in the labor force. Within the labor force, individuals with high school diploma education have the highest percentage of unemployment, with 8.6% or 11 of them being unemployed.
| Educational Attainment | In Labor Force | Unemployed |
| Less than High School | 19 (100.0%) | 0 (0.0%) |
| High School Diploma | 128 (69.2%) | 16 (8.6%) |
| College / Associate Degree | 105 (64.4%) | 11 (6.7%) |
| Bachelor's Degree or higher | 44 (81.5%) | 0 (0.0%) |
| Total | 296 (70.3%) | 26 (6.1%) |
Employment Occupations by Sex in Dove Creek
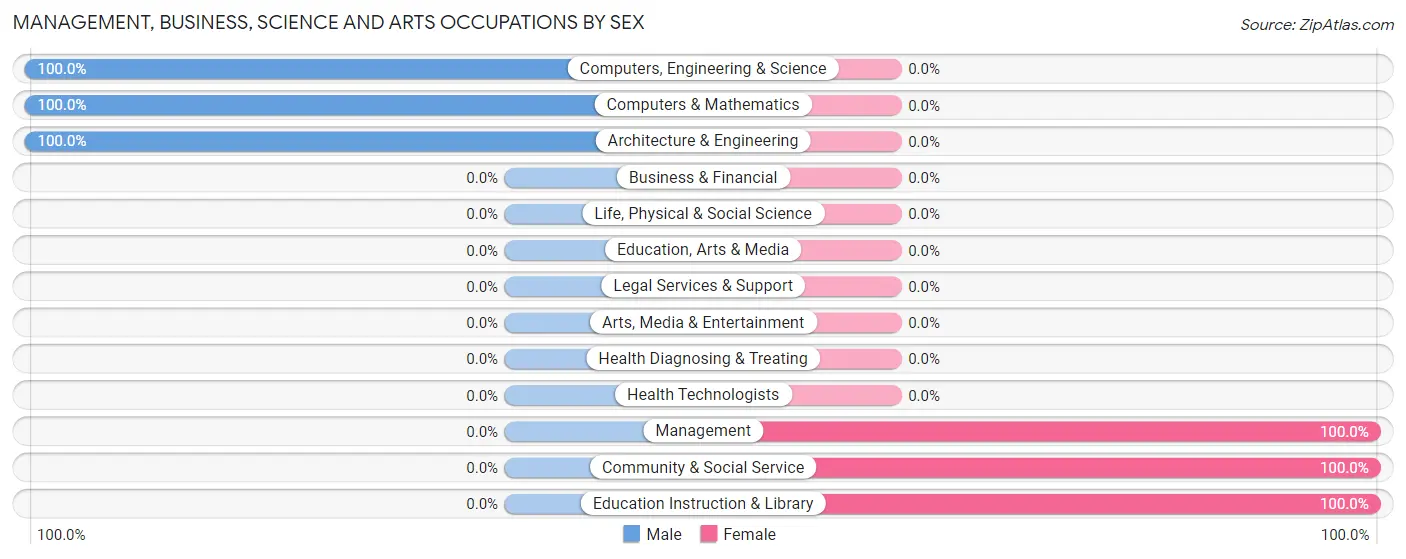
Management, Business, Science and Arts Occupations
The most common Management, Business, Science and Arts occupations in Dove Creek are Computers, Engineering & Science (50 | 16.6%), Computers & Mathematics (27 | 9.0%), Architecture & Engineering (23 | 7.6%), Community & Social Service (19 | 6.3%), and Education Instruction & Library (19 | 6.3%).
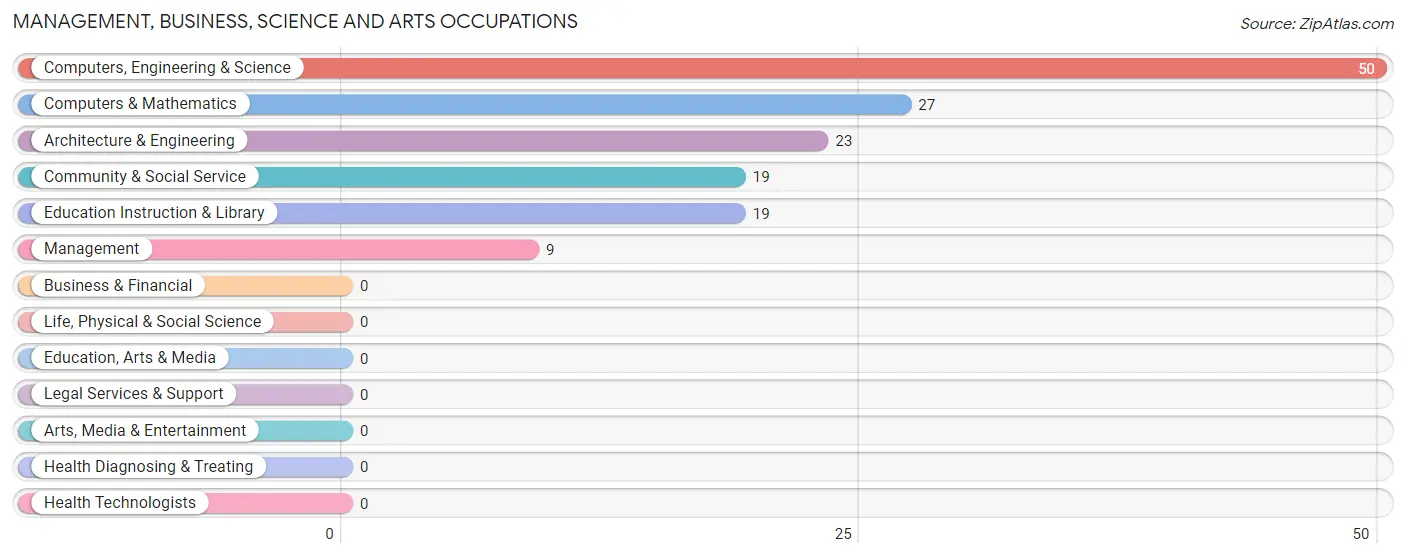
Management, Business, Science and Arts Occupations by Sex
Within the Management, Business, Science and Arts occupations in Dove Creek, the most male-oriented occupations are Computers, Engineering & Science (100.0%), Computers & Mathematics (100.0%), and Architecture & Engineering (100.0%), while the most female-oriented occupations are Management (100.0%), Community & Social Service (100.0%), and Education Instruction & Library (100.0%).
| Occupation | Male | Female |
| Management | 0 (0.0%) | 9 (100.0%) |
| Business & Financial | 0 (0.0%) | 0 (0.0%) |
| Computers, Engineering & Science | 50 (100.0%) | 0 (0.0%) |
| Computers & Mathematics | 27 (100.0%) | 0 (0.0%) |
| Architecture & Engineering | 23 (100.0%) | 0 (0.0%) |
| Life, Physical & Social Science | 0 (0.0%) | 0 (0.0%) |
| Community & Social Service | 0 (0.0%) | 19 (100.0%) |
| Education, Arts & Media | 0 (0.0%) | 0 (0.0%) |
| Legal Services & Support | 0 (0.0%) | 0 (0.0%) |
| Education Instruction & Library | 0 (0.0%) | 19 (100.0%) |
| Arts, Media & Entertainment | 0 (0.0%) | 0 (0.0%) |
| Health Diagnosing & Treating | 0 (0.0%) | 0 (0.0%) |
| Health Technologists | 0 (0.0%) | 0 (0.0%) |
| Total (Category) | 50 (64.1%) | 28 (35.9%) |
| Total (Overall) | 212 (70.4%) | 89 (29.6%) |
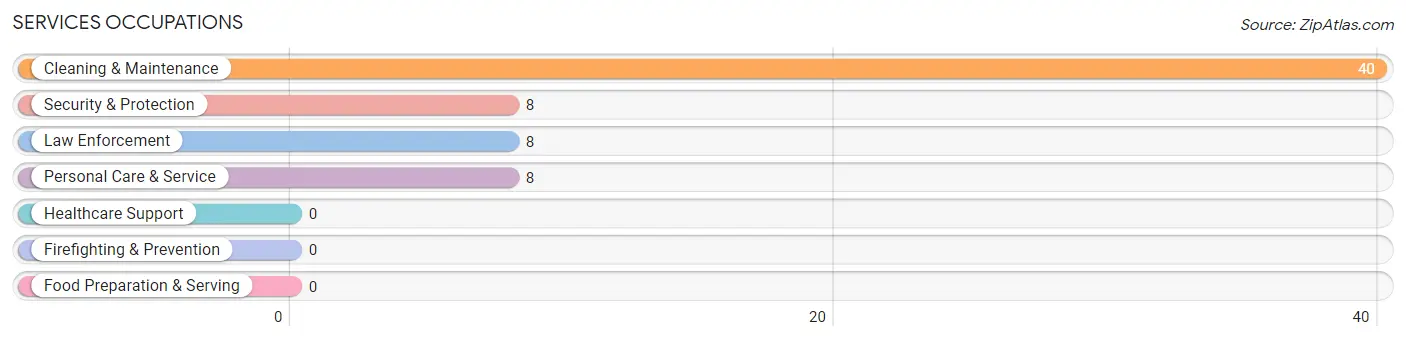
Services Occupations
The most common Services occupations in Dove Creek are Cleaning & Maintenance (40 | 13.3%), Security & Protection (8 | 2.7%), Law Enforcement (8 | 2.7%), and Personal Care & Service (8 | 2.7%).
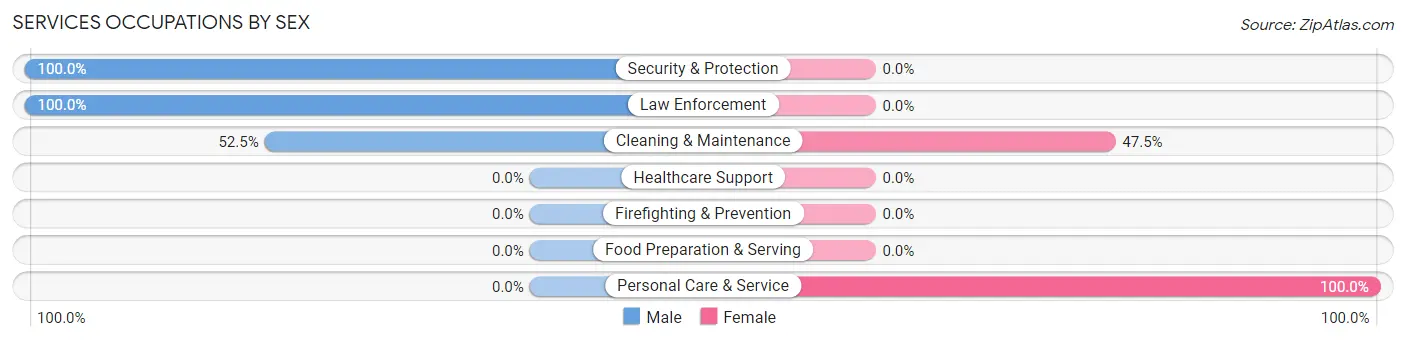
Services Occupations by Sex
Within the Services occupations in Dove Creek, the most male-oriented occupations are Security & Protection (100.0%), Law Enforcement (100.0%), and Cleaning & Maintenance (52.5%), while the most female-oriented occupations are Personal Care & Service (100.0%), and Cleaning & Maintenance (47.5%).
| Occupation | Male | Female |
| Healthcare Support | 0 (0.0%) | 0 (0.0%) |
| Security & Protection | 8 (100.0%) | 0 (0.0%) |
| Firefighting & Prevention | 0 (0.0%) | 0 (0.0%) |
| Law Enforcement | 8 (100.0%) | 0 (0.0%) |
| Food Preparation & Serving | 0 (0.0%) | 0 (0.0%) |
| Cleaning & Maintenance | 21 (52.5%) | 19 (47.5%) |
| Personal Care & Service | 0 (0.0%) | 8 (100.0%) |
| Total (Category) | 29 (51.8%) | 27 (48.2%) |
| Total (Overall) | 212 (70.4%) | 89 (29.6%) |
Sales and Office Occupations
The most common Sales and Office occupations in Dove Creek are Office & Administration (45 | 14.9%), and Sales & Related (13 | 4.3%).

Sales and Office Occupations by Sex

| Occupation | Male | Female |
| Sales & Related | 13 (100.0%) | 0 (0.0%) |
| Office & Administration | 11 (24.4%) | 34 (75.6%) |
| Total (Category) | 24 (41.4%) | 34 (58.6%) |
| Total (Overall) | 212 (70.4%) | 89 (29.6%) |
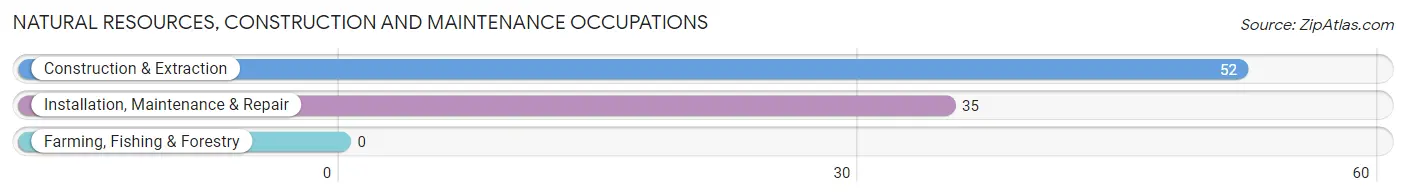
Natural Resources, Construction and Maintenance Occupations
The most common Natural Resources, Construction and Maintenance occupations in Dove Creek are Construction & Extraction (52 | 17.3%), and Installation, Maintenance & Repair (35 | 11.6%).
Natural Resources, Construction and Maintenance Occupations by Sex
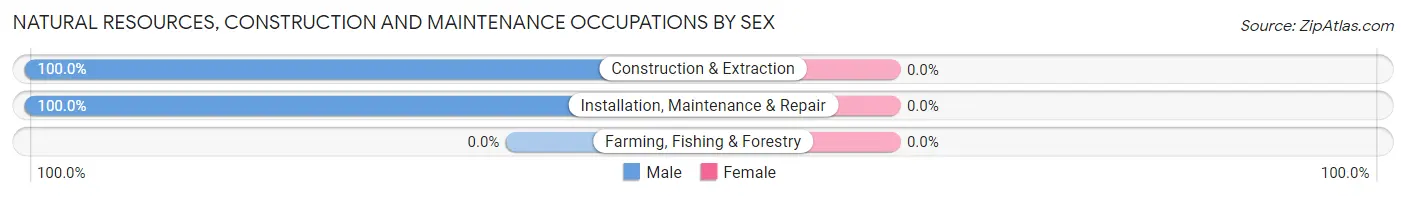
| Occupation | Male | Female |
| Farming, Fishing & Forestry | 0 (0.0%) | 0 (0.0%) |
| Construction & Extraction | 52 (100.0%) | 0 (0.0%) |
| Installation, Maintenance & Repair | 35 (100.0%) | 0 (0.0%) |
| Total (Category) | 87 (100.0%) | 0 (0.0%) |
| Total (Overall) | 212 (70.4%) | 89 (29.6%) |
Production, Transportation and Moving Occupations
The most common Production, Transportation and Moving occupations in Dove Creek are , and Transportation (22 | 7.3%).
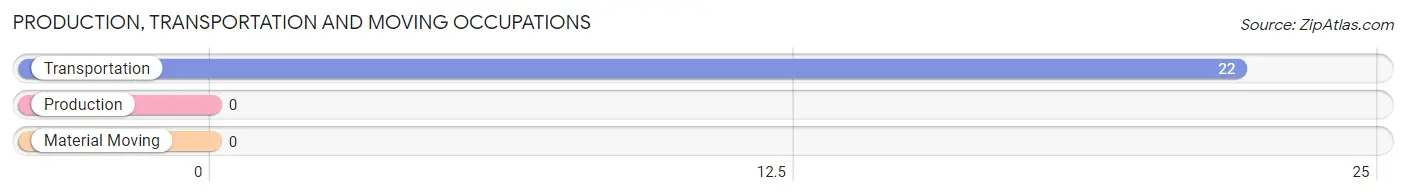
Production, Transportation and Moving Occupations by Sex
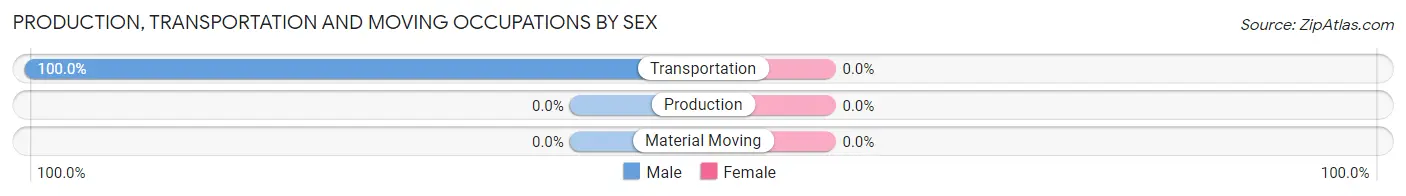
| Occupation | Male | Female |
| Production | 0 (0.0%) | 0 (0.0%) |
| Transportation | 22 (100.0%) | 0 (0.0%) |
| Material Moving | 0 (0.0%) | 0 (0.0%) |
| Total (Category) | 22 (100.0%) | 0 (0.0%) |
| Total (Overall) | 212 (70.4%) | 89 (29.6%) |
Employment Industries by Sex in Dove Creek
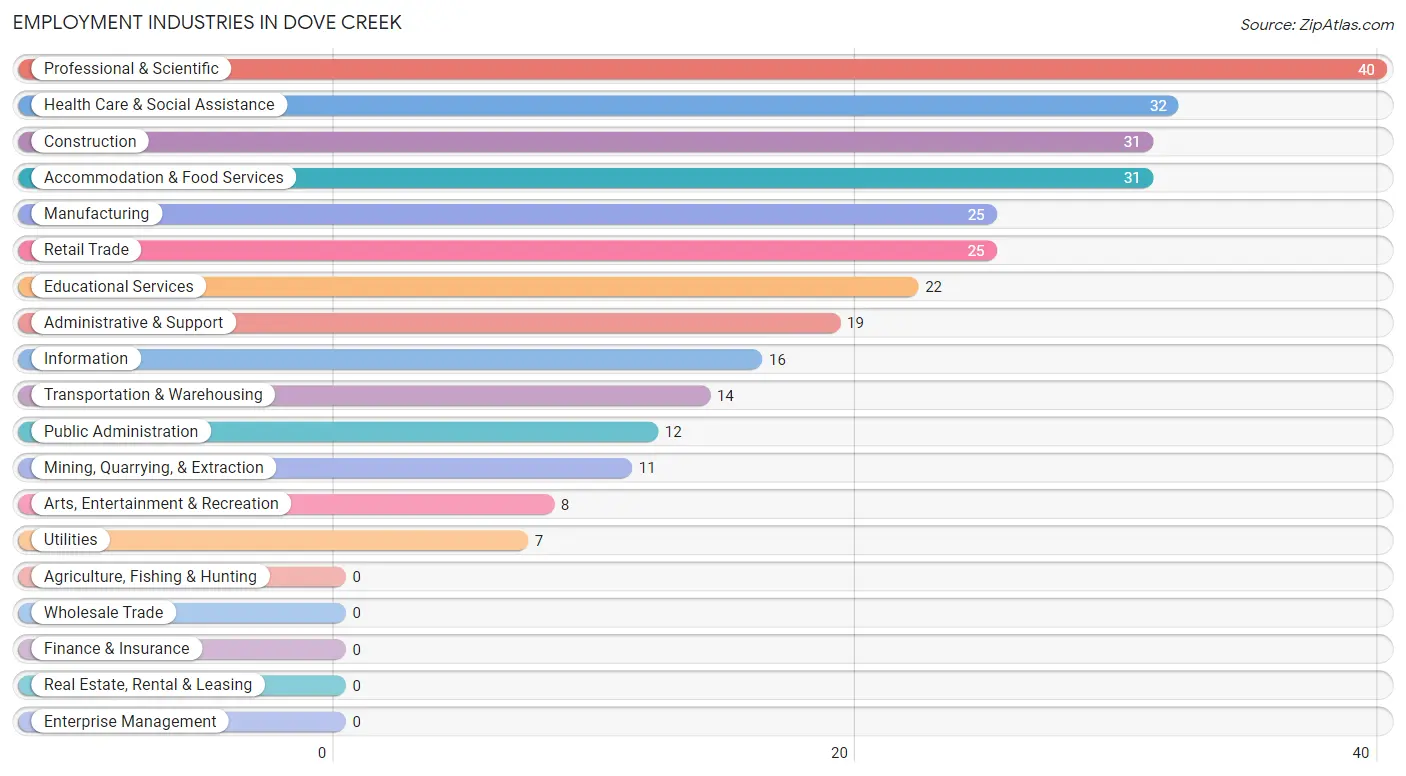
Employment Industries in Dove Creek
The major employment industries in Dove Creek include Professional & Scientific (40 | 13.3%), Health Care & Social Assistance (32 | 10.6%), Construction (31 | 10.3%), Accommodation & Food Services (31 | 10.3%), and Manufacturing (25 | 8.3%).
Employment Industries by Sex in Dove Creek
The Dove Creek industries that see more men than women are Mining, Quarrying, & Extraction (100.0%), Construction (100.0%), and Retail Trade (100.0%), whereas the industries that tend to have a higher number of women are Administrative & Support (100.0%), Educational Services (100.0%), and Public Administration (100.0%).
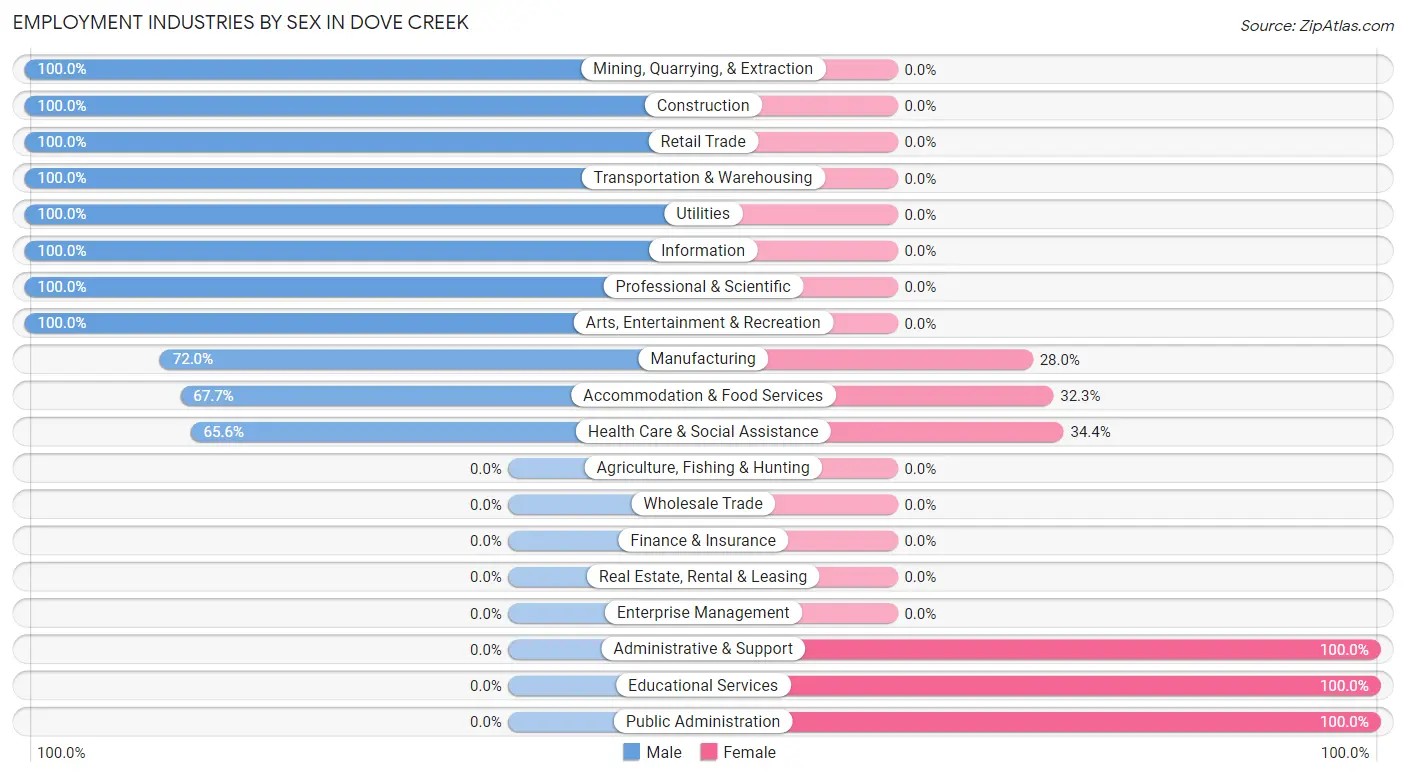
| Industry | Male | Female |
| Agriculture, Fishing & Hunting | 0 (0.0%) | 0 (0.0%) |
| Mining, Quarrying, & Extraction | 11 (100.0%) | 0 (0.0%) |
| Construction | 31 (100.0%) | 0 (0.0%) |
| Manufacturing | 18 (72.0%) | 7 (28.0%) |
| Wholesale Trade | 0 (0.0%) | 0 (0.0%) |
| Retail Trade | 25 (100.0%) | 0 (0.0%) |
| Transportation & Warehousing | 14 (100.0%) | 0 (0.0%) |
| Utilities | 7 (100.0%) | 0 (0.0%) |
| Information | 16 (100.0%) | 0 (0.0%) |
| Finance & Insurance | 0 (0.0%) | 0 (0.0%) |
| Real Estate, Rental & Leasing | 0 (0.0%) | 0 (0.0%) |
| Professional & Scientific | 40 (100.0%) | 0 (0.0%) |
| Enterprise Management | 0 (0.0%) | 0 (0.0%) |
| Administrative & Support | 0 (0.0%) | 19 (100.0%) |
| Educational Services | 0 (0.0%) | 22 (100.0%) |
| Health Care & Social Assistance | 21 (65.6%) | 11 (34.4%) |
| Arts, Entertainment & Recreation | 8 (100.0%) | 0 (0.0%) |
| Accommodation & Food Services | 21 (67.7%) | 10 (32.3%) |
| Public Administration | 0 (0.0%) | 12 (100.0%) |
| Total | 212 (70.4%) | 89 (29.6%) |
Education in Dove Creek
School Enrollment in Dove Creek
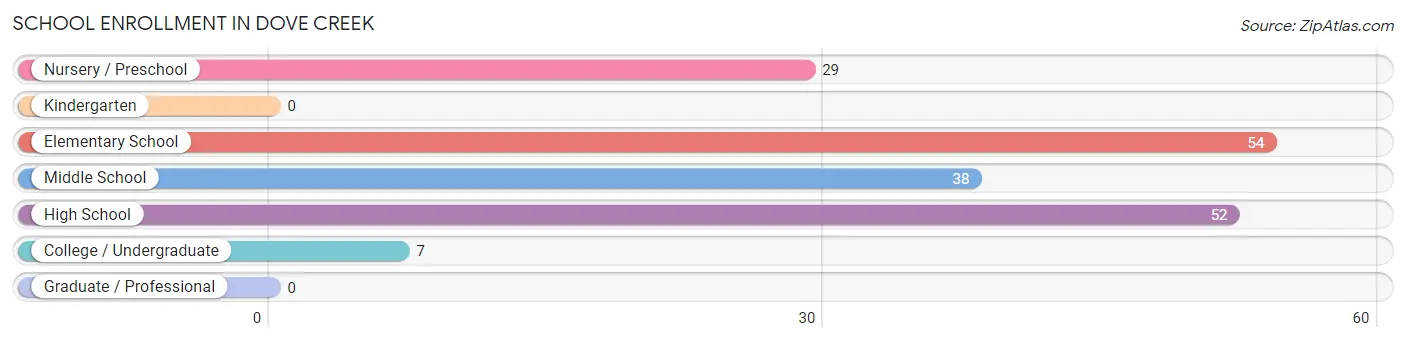
The most common levels of schooling among the 180 students in Dove Creek are elementary school (54 | 30.0%), high school (52 | 28.9%), and middle school (38 | 21.1%).
| School Level | # Students | % Students |
| Nursery / Preschool | 29 | 16.1% |
| Kindergarten | 0 | 0.0% |
| Elementary School | 54 | 30.0% |
| Middle School | 38 | 21.1% |
| High School | 52 | 28.9% |
| College / Undergraduate | 7 | 3.9% |
| Graduate / Professional | 0 | 0.0% |
| Total | 180 | 100.0% |
School Enrollment by Age by Funding Source in Dove Creek
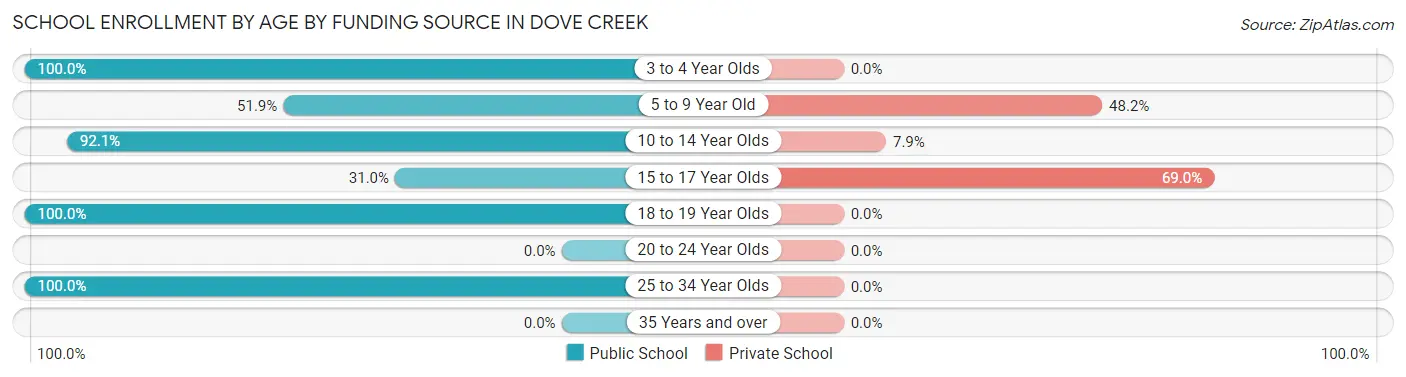
Out of a total of 180 students who are enrolled in schools in Dove Creek, 49 (27.2%) attend a private institution, while the remaining 131 (72.8%) are enrolled in public schools. The age group of 15 to 17 year olds has the highest likelihood of being enrolled in private schools, with 20 (69.0% in the age bracket) enrolled. Conversely, the age group of 3 to 4 year olds has the lowest likelihood of being enrolled in a private school, with 29 (100.0% in the age bracket) attending a public institution.
| Age Bracket | Public School | Private School |
| 3 to 4 Year Olds | 29 (100.0%) | 0 (0.0%) |
| 5 to 9 Year Old | 28 (51.8%) | 26 (48.1%) |
| 10 to 14 Year Olds | 35 (92.1%) | 3 (7.9%) |
| 15 to 17 Year Olds | 9 (31.0%) | 20 (69.0%) |
| 18 to 19 Year Olds | 23 (100.0%) | 0 (0.0%) |
| 20 to 24 Year Olds | 0 (0.0%) | 0 (0.0%) |
| 25 to 34 Year Olds | 7 (100.0%) | 0 (0.0%) |
| 35 Years and over | 0 (0.0%) | 0 (0.0%) |
| Total | 131 (72.8%) | 49 (27.2%) |
Educational Attainment by Field of Study in Dove Creek
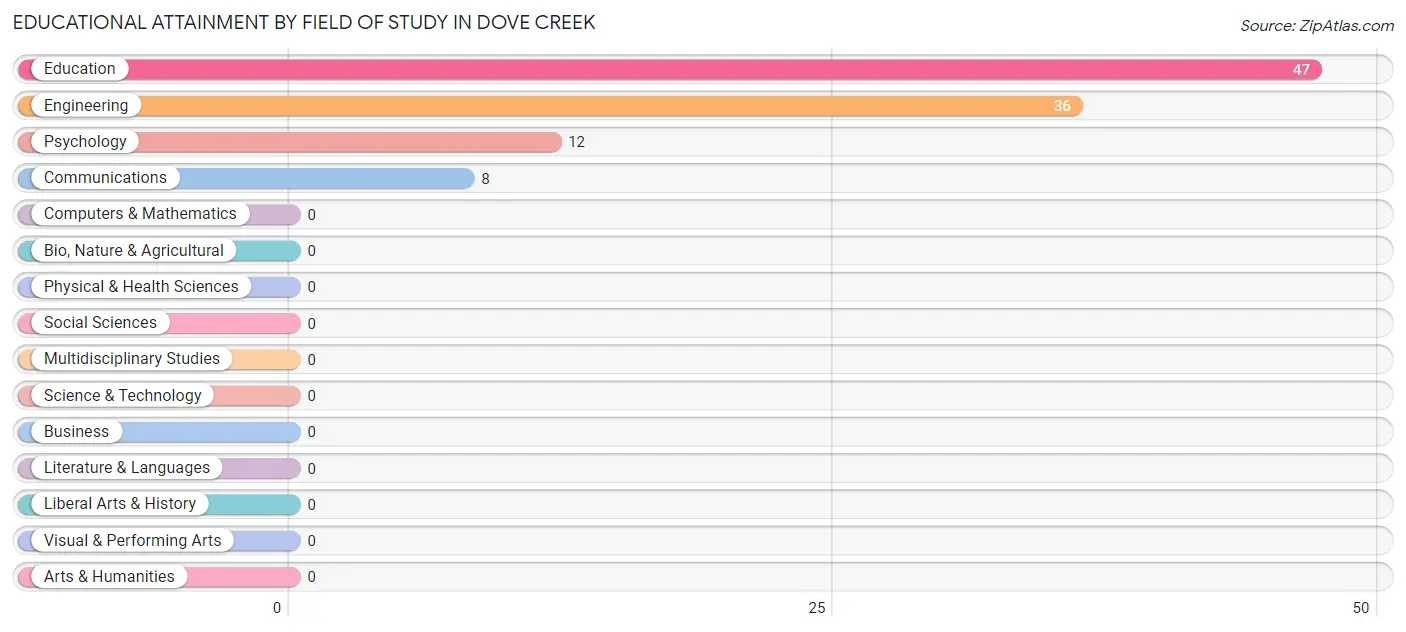
Education (47 | 45.6%), engineering (36 | 34.9%), psychology (12 | 11.7%), and communications (8 | 7.8%) are the most common fields of study among 103 individuals in Dove Creek who have obtained a bachelor's degree or higher.
| Field of Study | # Graduates | % Graduates |
| Computers & Mathematics | 0 | 0.0% |
| Bio, Nature & Agricultural | 0 | 0.0% |
| Physical & Health Sciences | 0 | 0.0% |
| Psychology | 12 | 11.7% |
| Social Sciences | 0 | 0.0% |
| Engineering | 36 | 34.9% |
| Multidisciplinary Studies | 0 | 0.0% |
| Science & Technology | 0 | 0.0% |
| Business | 0 | 0.0% |
| Education | 47 | 45.6% |
| Literature & Languages | 0 | 0.0% |
| Liberal Arts & History | 0 | 0.0% |
| Visual & Performing Arts | 0 | 0.0% |
| Communications | 8 | 7.8% |
| Arts & Humanities | 0 | 0.0% |
| Total | 103 | 100.0% |
Transportation & Commute in Dove Creek
Vehicle Availability by Sex in Dove Creek
The most prevalent vehicle ownership categories in Dove Creek are males with 2 vehicles (110, accounting for 51.9%) and females with 2 vehicles (32, making up 123.6%).
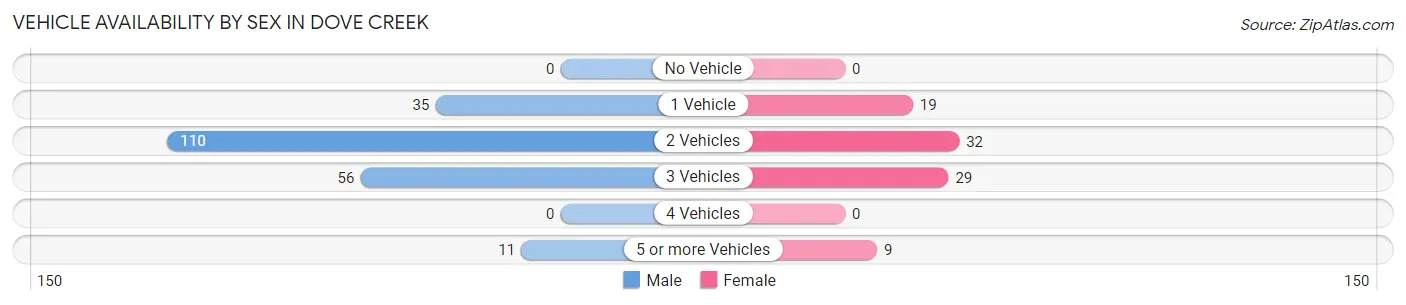
| Vehicles Available | Male | Female |
| No Vehicle | 0 (0.0%) | 0 (0.0%) |
| 1 Vehicle | 35 (16.5%) | 19 (21.3%) |
| 2 Vehicles | 110 (51.9%) | 32 (36.0%) |
| 3 Vehicles | 56 (26.4%) | 29 (32.6%) |
| 4 Vehicles | 0 (0.0%) | 0 (0.0%) |
| 5 or more Vehicles | 11 (5.2%) | 9 (10.1%) |
| Total | 212 (100.0%) | 89 (100.0%) |
Commute Time in Dove Creek
The most frequently occuring commute durations in Dove Creek are 5 to 9 minutes (100 commuters, 45.7%), 10 to 14 minutes (29 commuters, 13.2%), and less than 5 minutes (28 commuters, 12.8%).
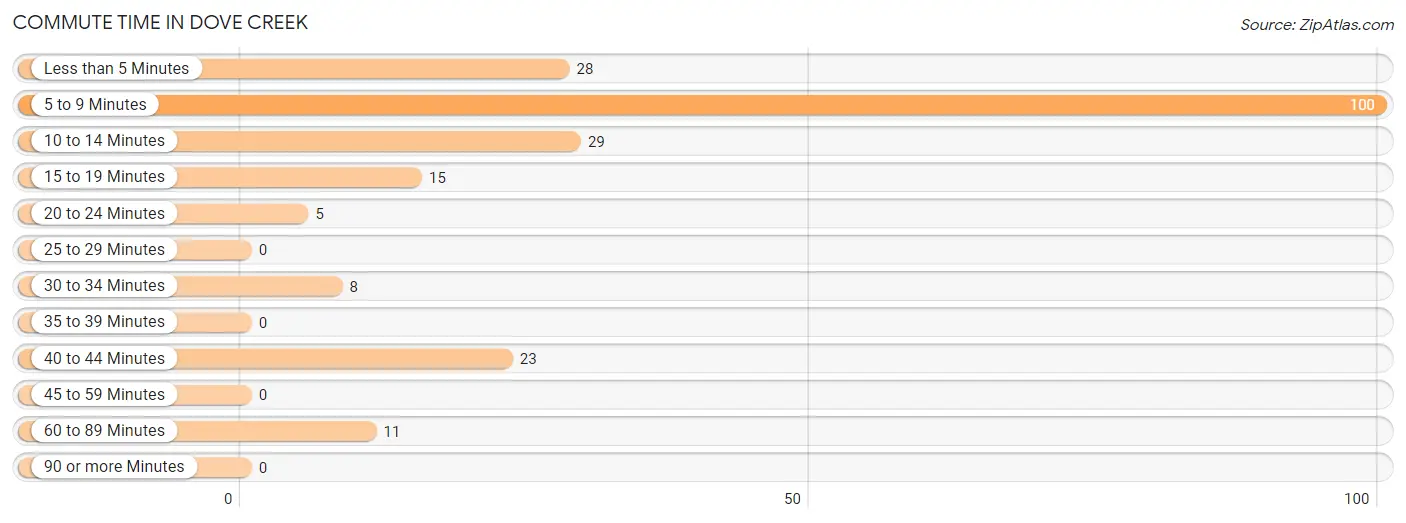
| Commute Time | # Commuters | % Commuters |
| Less than 5 Minutes | 28 | 12.8% |
| 5 to 9 Minutes | 100 | 45.7% |
| 10 to 14 Minutes | 29 | 13.2% |
| 15 to 19 Minutes | 15 | 6.9% |
| 20 to 24 Minutes | 5 | 2.3% |
| 25 to 29 Minutes | 0 | 0.0% |
| 30 to 34 Minutes | 8 | 3.6% |
| 35 to 39 Minutes | 0 | 0.0% |
| 40 to 44 Minutes | 23 | 10.5% |
| 45 to 59 Minutes | 0 | 0.0% |
| 60 to 89 Minutes | 11 | 5.0% |
| 90 or more Minutes | 0 | 0.0% |
Commute Time by Sex in Dove Creek
The most common commute times in Dove Creek are 5 to 9 minutes (67 commuters, 46.9%) for males and 5 to 9 minutes (33 commuters, 43.4%) for females.
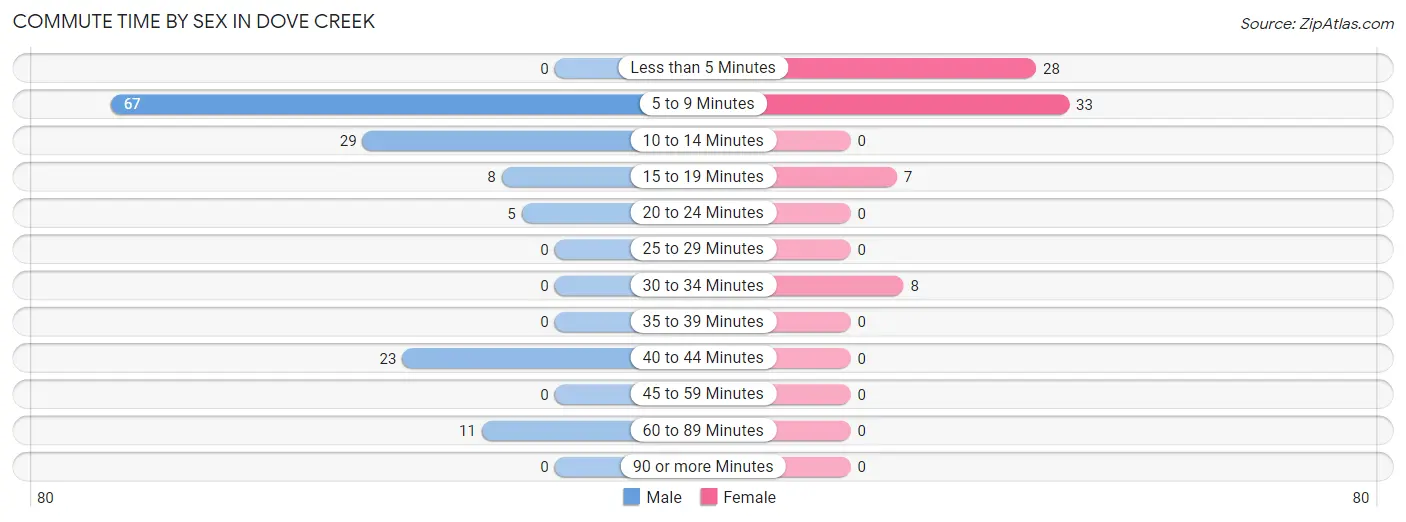
| Commute Time | Male | Female |
| Less than 5 Minutes | 0 (0.0%) | 28 (36.8%) |
| 5 to 9 Minutes | 67 (46.9%) | 33 (43.4%) |
| 10 to 14 Minutes | 29 (20.3%) | 0 (0.0%) |
| 15 to 19 Minutes | 8 (5.6%) | 7 (9.2%) |
| 20 to 24 Minutes | 5 (3.5%) | 0 (0.0%) |
| 25 to 29 Minutes | 0 (0.0%) | 0 (0.0%) |
| 30 to 34 Minutes | 0 (0.0%) | 8 (10.5%) |
| 35 to 39 Minutes | 0 (0.0%) | 0 (0.0%) |
| 40 to 44 Minutes | 23 (16.1%) | 0 (0.0%) |
| 45 to 59 Minutes | 0 (0.0%) | 0 (0.0%) |
| 60 to 89 Minutes | 11 (7.7%) | 0 (0.0%) |
| 90 or more Minutes | 0 (0.0%) | 0 (0.0%) |
Time of Departure to Work by Sex in Dove Creek
The most frequent times of departure to work in Dove Creek are 7:30 AM to 7:59 AM (38, 26.6%) for males and 4:00 PM to 11:59 PM (19, 25.0%) for females.
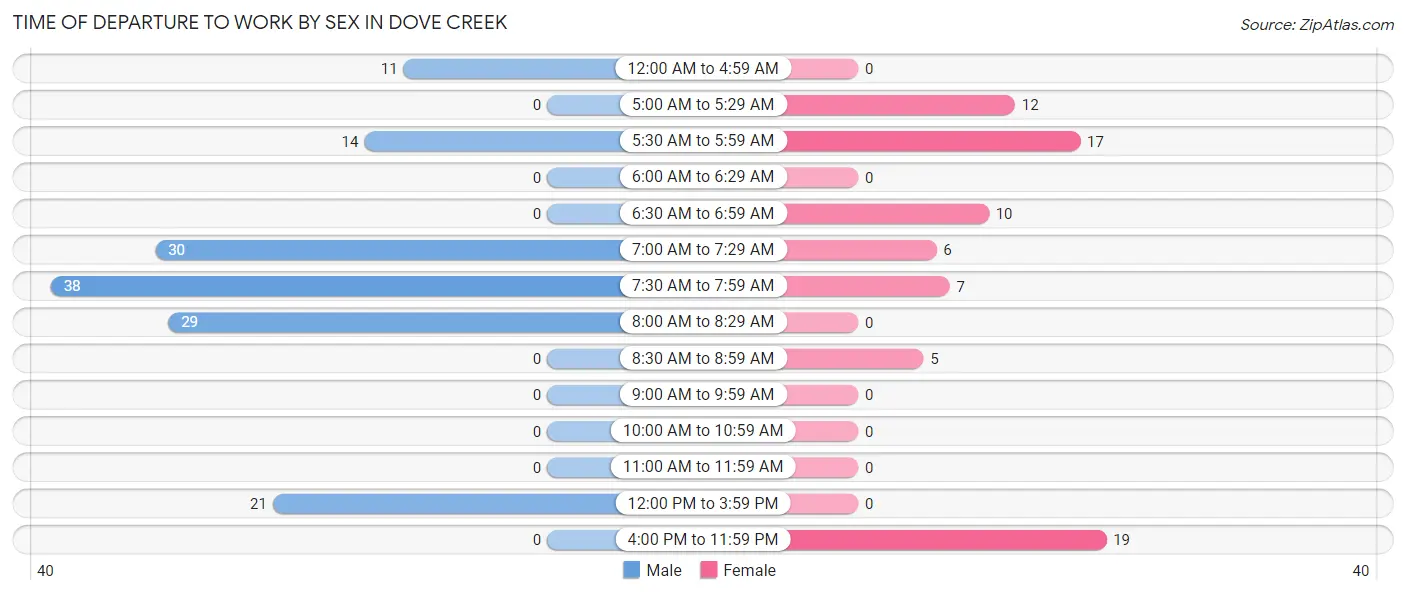
| Time of Departure | Male | Female |
| 12:00 AM to 4:59 AM | 11 (7.7%) | 0 (0.0%) |
| 5:00 AM to 5:29 AM | 0 (0.0%) | 12 (15.8%) |
| 5:30 AM to 5:59 AM | 14 (9.8%) | 17 (22.4%) |
| 6:00 AM to 6:29 AM | 0 (0.0%) | 0 (0.0%) |
| 6:30 AM to 6:59 AM | 0 (0.0%) | 10 (13.2%) |
| 7:00 AM to 7:29 AM | 30 (21.0%) | 6 (7.9%) |
| 7:30 AM to 7:59 AM | 38 (26.6%) | 7 (9.2%) |
| 8:00 AM to 8:29 AM | 29 (20.3%) | 0 (0.0%) |
| 8:30 AM to 8:59 AM | 0 (0.0%) | 5 (6.6%) |
| 9:00 AM to 9:59 AM | 0 (0.0%) | 0 (0.0%) |
| 10:00 AM to 10:59 AM | 0 (0.0%) | 0 (0.0%) |
| 11:00 AM to 11:59 AM | 0 (0.0%) | 0 (0.0%) |
| 12:00 PM to 3:59 PM | 21 (14.7%) | 0 (0.0%) |
| 4:00 PM to 11:59 PM | 0 (0.0%) | 19 (25.0%) |
| Total | 143 (100.0%) | 76 (100.0%) |
Housing Occupancy in Dove Creek
Occupancy by Ownership in Dove Creek
Of the total 303 dwellings in Dove Creek, owner-occupied units account for 218 (72.0%), while renter-occupied units make up 85 (28.1%).
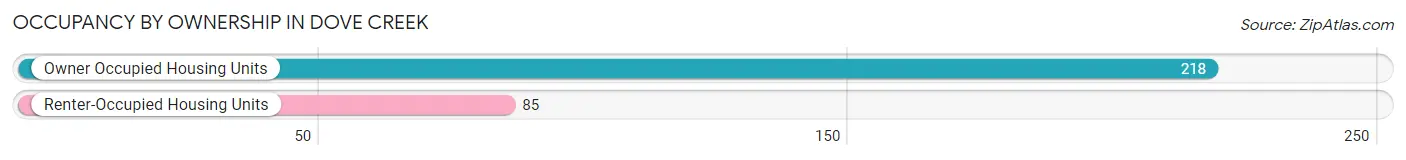
| Occupancy | # Housing Units | % Housing Units |
| Owner Occupied Housing Units | 218 | 72.0% |
| Renter-Occupied Housing Units | 85 | 28.1% |
| Total Occupied Housing Units | 303 | 100.0% |
Occupancy by Household Size in Dove Creek
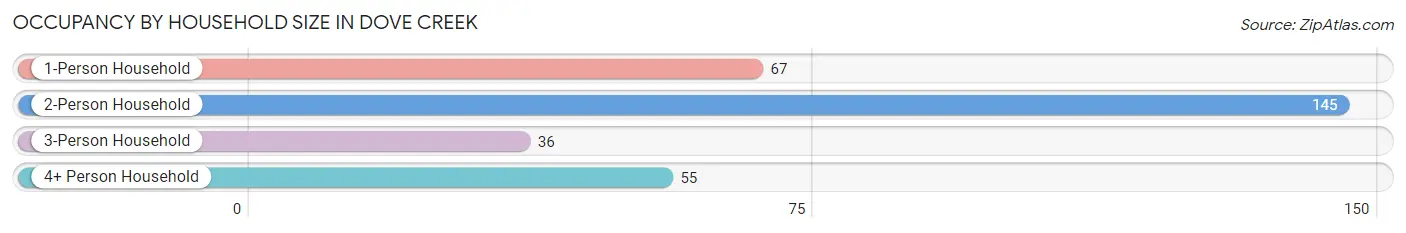
| Household Size | # Housing Units | % Housing Units |
| 1-Person Household | 67 | 22.1% |
| 2-Person Household | 145 | 47.8% |
| 3-Person Household | 36 | 11.9% |
| 4+ Person Household | 55 | 18.1% |
| Total Housing Units | 303 | 100.0% |
Occupancy by Ownership by Household Size in Dove Creek
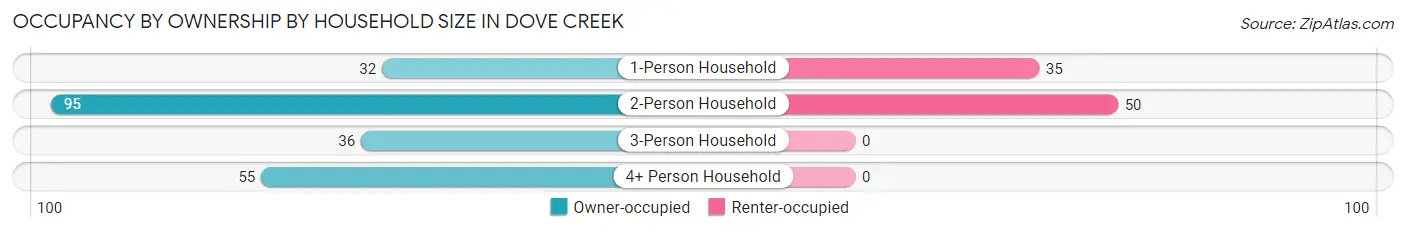
| Household Size | Owner-occupied | Renter-occupied |
| 1-Person Household | 32 (47.8%) | 35 (52.2%) |
| 2-Person Household | 95 (65.5%) | 50 (34.5%) |
| 3-Person Household | 36 (100.0%) | 0 (0.0%) |
| 4+ Person Household | 55 (100.0%) | 0 (0.0%) |
| Total Housing Units | 218 (72.0%) | 85 (28.1%) |
Occupancy by Educational Attainment in Dove Creek
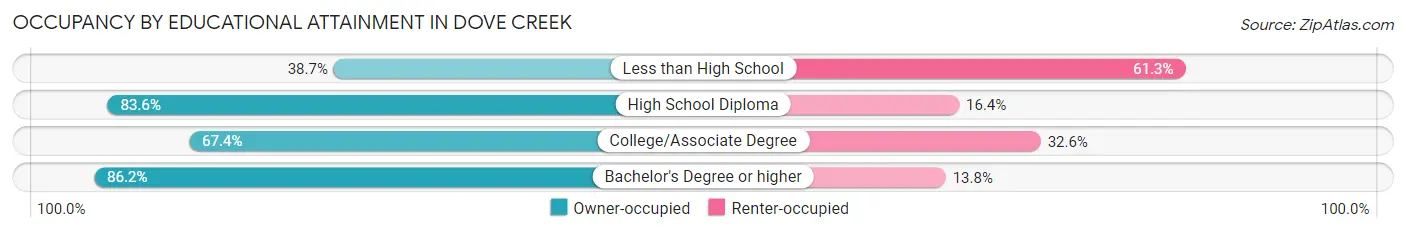
| Household Size | Owner-occupied | Renter-occupied |
| Less than High School | 12 (38.7%) | 19 (61.3%) |
| High School Diploma | 61 (83.6%) | 12 (16.4%) |
| College/Associate Degree | 95 (67.4%) | 46 (32.6%) |
| Bachelor's Degree or higher | 50 (86.2%) | 8 (13.8%) |
Occupancy by Age of Householder in Dove Creek
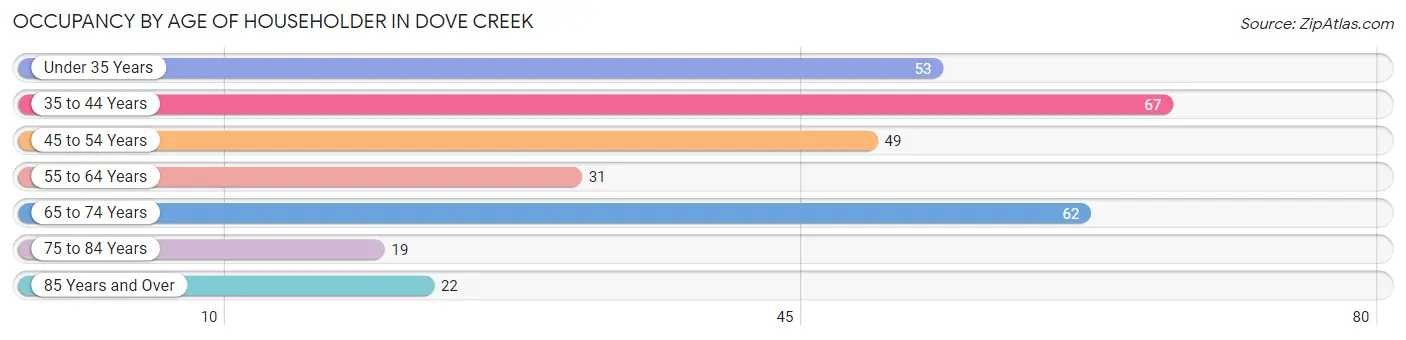
| Age Bracket | # Households | % Households |
| Under 35 Years | 53 | 17.5% |
| 35 to 44 Years | 67 | 22.1% |
| 45 to 54 Years | 49 | 16.2% |
| 55 to 64 Years | 31 | 10.2% |
| 65 to 74 Years | 62 | 20.5% |
| 75 to 84 Years | 19 | 6.3% |
| 85 Years and Over | 22 | 7.3% |
| Total | 303 | 100.0% |
Housing Finances in Dove Creek
Median Income by Occupancy in Dove Creek
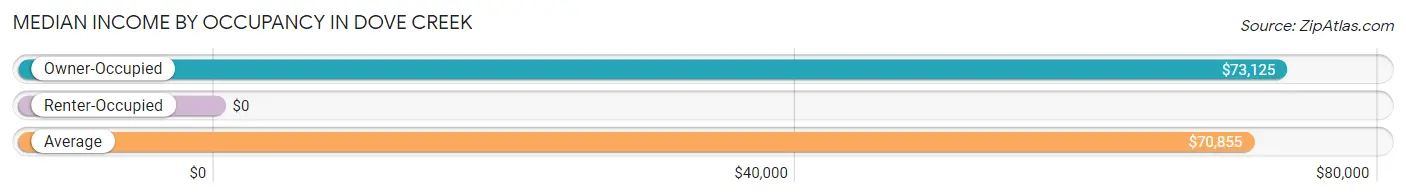
| Occupancy Type | # Households | Median Income |
| Owner-Occupied | 218 (72.0%) | $73,125 |
| Renter-Occupied | 85 (28.1%) | $0 |
| Average | 303 (100.0%) | $70,855 |
Occupancy by Householder Income Bracket in Dove Creek
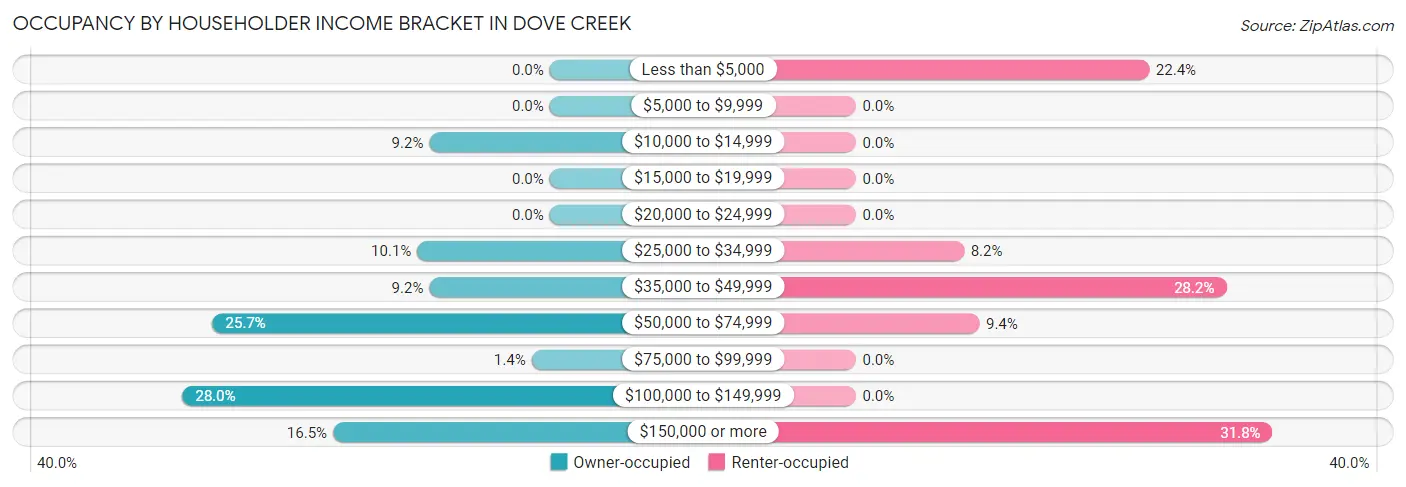
| Income Bracket | Owner-occupied | Renter-occupied |
| Less than $5,000 | 0 (0.0%) | 19 (22.4%) |
| $5,000 to $9,999 | 0 (0.0%) | 0 (0.0%) |
| $10,000 to $14,999 | 20 (9.2%) | 0 (0.0%) |
| $15,000 to $19,999 | 0 (0.0%) | 0 (0.0%) |
| $20,000 to $24,999 | 0 (0.0%) | 0 (0.0%) |
| $25,000 to $34,999 | 22 (10.1%) | 7 (8.2%) |
| $35,000 to $49,999 | 20 (9.2%) | 24 (28.2%) |
| $50,000 to $74,999 | 56 (25.7%) | 8 (9.4%) |
| $75,000 to $99,999 | 3 (1.4%) | 0 (0.0%) |
| $100,000 to $149,999 | 61 (28.0%) | 0 (0.0%) |
| $150,000 or more | 36 (16.5%) | 27 (31.8%) |
| Total | 218 (100.0%) | 85 (100.0%) |
Monthly Housing Cost Tiers in Dove Creek
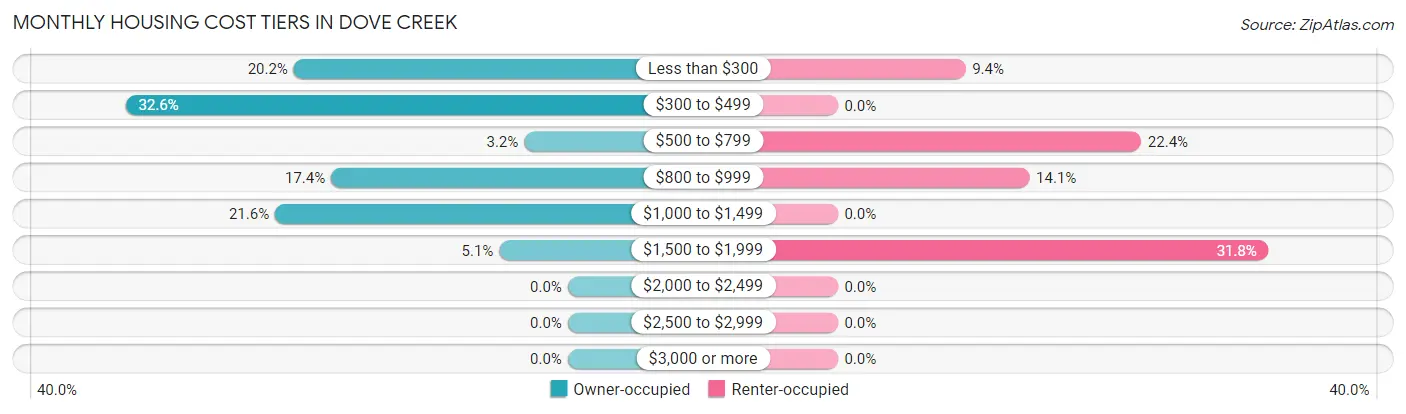
| Monthly Cost | Owner-occupied | Renter-occupied |
| Less than $300 | 44 (20.2%) | 8 (9.4%) |
| $300 to $499 | 71 (32.6%) | 0 (0.0%) |
| $500 to $799 | 7 (3.2%) | 19 (22.4%) |
| $800 to $999 | 38 (17.4%) | 12 (14.1%) |
| $1,000 to $1,499 | 47 (21.6%) | 0 (0.0%) |
| $1,500 to $1,999 | 11 (5.1%) | 27 (31.8%) |
| $2,000 to $2,499 | 0 (0.0%) | 0 (0.0%) |
| $2,500 to $2,999 | 0 (0.0%) | 0 (0.0%) |
| $3,000 or more | 0 (0.0%) | 0 (0.0%) |
| Total | 218 (100.0%) | 85 (100.0%) |
Physical Housing Characteristics in Dove Creek
Housing Structures in Dove Creek
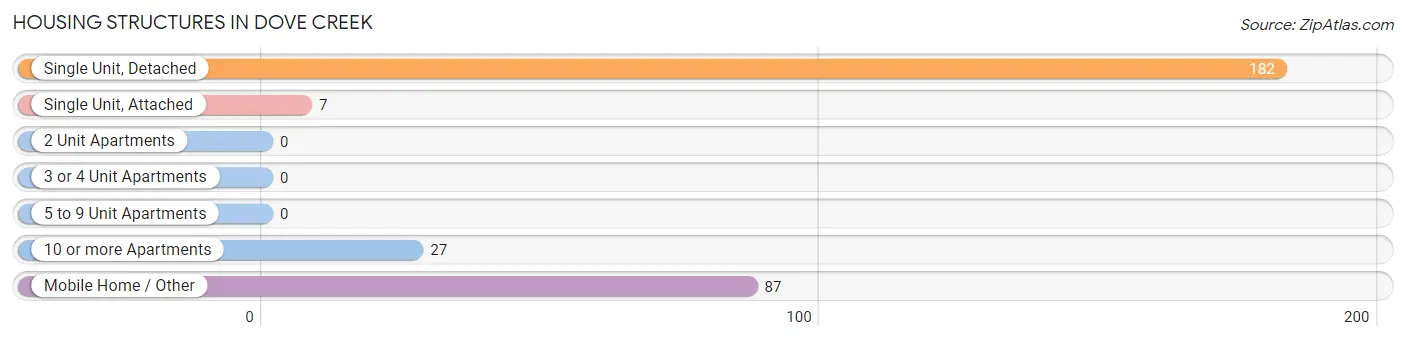
| Structure Type | # Housing Units | % Housing Units |
| Single Unit, Detached | 182 | 60.1% |
| Single Unit, Attached | 7 | 2.3% |
| 2 Unit Apartments | 0 | 0.0% |
| 3 or 4 Unit Apartments | 0 | 0.0% |
| 5 to 9 Unit Apartments | 0 | 0.0% |
| 10 or more Apartments | 27 | 8.9% |
| Mobile Home / Other | 87 | 28.7% |
| Total | 303 | 100.0% |
Housing Structures by Occupancy in Dove Creek
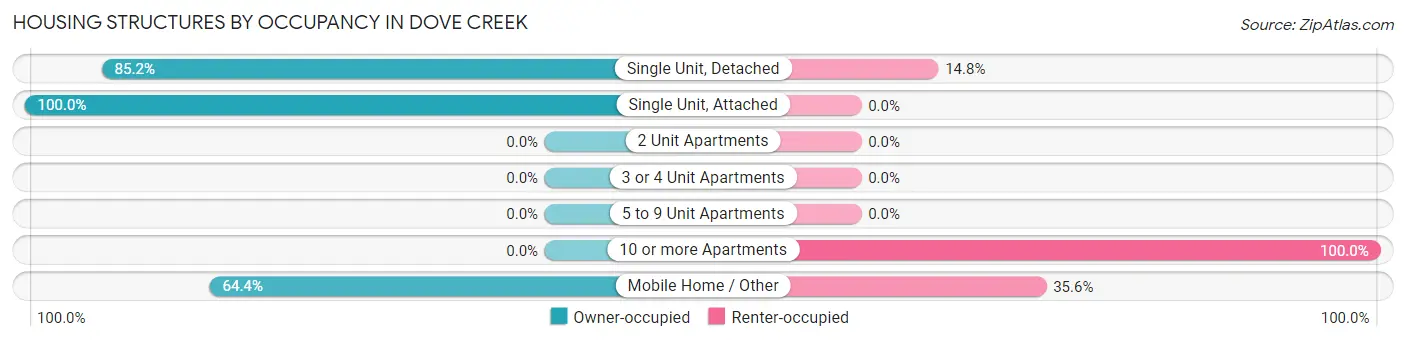
| Structure Type | Owner-occupied | Renter-occupied |
| Single Unit, Detached | 155 (85.2%) | 27 (14.8%) |
| Single Unit, Attached | 7 (100.0%) | 0 (0.0%) |
| 2 Unit Apartments | 0 (0.0%) | 0 (0.0%) |
| 3 or 4 Unit Apartments | 0 (0.0%) | 0 (0.0%) |
| 5 to 9 Unit Apartments | 0 (0.0%) | 0 (0.0%) |
| 10 or more Apartments | 0 (0.0%) | 27 (100.0%) |
| Mobile Home / Other | 56 (64.4%) | 31 (35.6%) |
| Total | 218 (72.0%) | 85 (28.1%) |
Housing Structures by Number of Rooms in Dove Creek
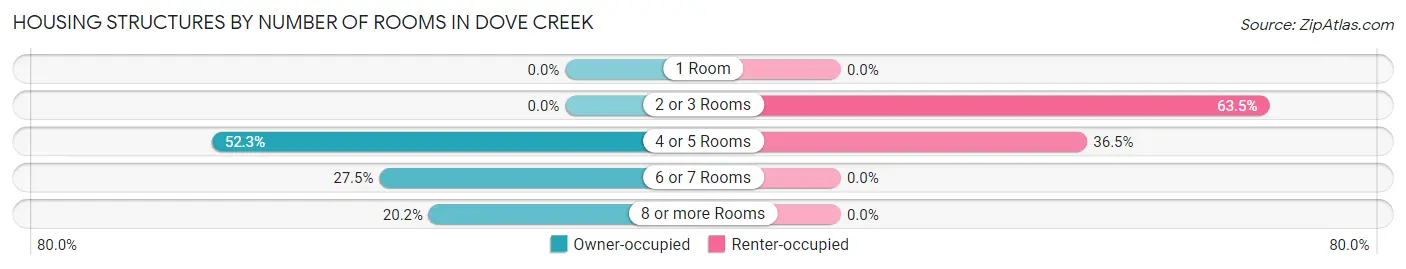
| Number of Rooms | Owner-occupied | Renter-occupied |
| 1 Room | 0 (0.0%) | 0 (0.0%) |
| 2 or 3 Rooms | 0 (0.0%) | 54 (63.5%) |
| 4 or 5 Rooms | 114 (52.3%) | 31 (36.5%) |
| 6 or 7 Rooms | 60 (27.5%) | 0 (0.0%) |
| 8 or more Rooms | 44 (20.2%) | 0 (0.0%) |
| Total | 218 (100.0%) | 85 (100.0%) |
Housing Structure by Heating Type in Dove Creek
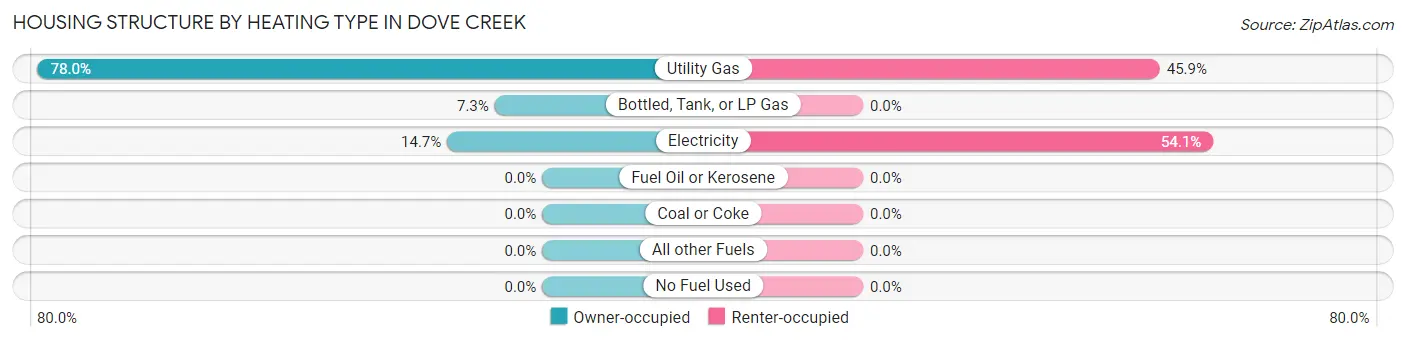
| Heating Type | Owner-occupied | Renter-occupied |
| Utility Gas | 170 (78.0%) | 39 (45.9%) |
| Bottled, Tank, or LP Gas | 16 (7.3%) | 0 (0.0%) |
| Electricity | 32 (14.7%) | 46 (54.1%) |
| Fuel Oil or Kerosene | 0 (0.0%) | 0 (0.0%) |
| Coal or Coke | 0 (0.0%) | 0 (0.0%) |
| All other Fuels | 0 (0.0%) | 0 (0.0%) |
| No Fuel Used | 0 (0.0%) | 0 (0.0%) |
| Total | 218 (100.0%) | 85 (100.0%) |
Household Vehicle Usage in Dove Creek
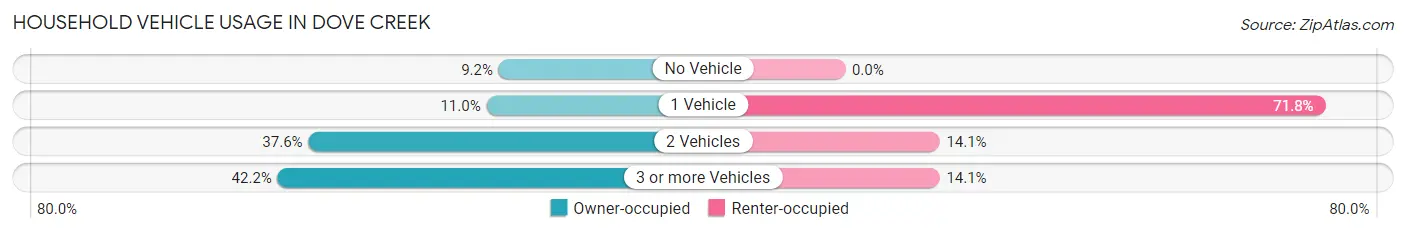
| Vehicles per Household | Owner-occupied | Renter-occupied |
| No Vehicle | 20 (9.2%) | 0 (0.0%) |
| 1 Vehicle | 24 (11.0%) | 61 (71.8%) |
| 2 Vehicles | 82 (37.6%) | 12 (14.1%) |
| 3 or more Vehicles | 92 (42.2%) | 12 (14.1%) |
| Total | 218 (100.0%) | 85 (100.0%) |
Real Estate & Mortgages in Dove Creek
Real Estate and Mortgage Overview in Dove Creek
| Characteristic | Without Mortgage | With Mortgage |
| Housing Units | 115 | 103 |
| Median Property Value | $128,600 | $115,000 |
| Median Household Income | - | - |
| Monthly Housing Costs | $323 | $0 |
| Real Estate Taxes | $354 | $0 |
Property Value by Mortgage Status in Dove Creek
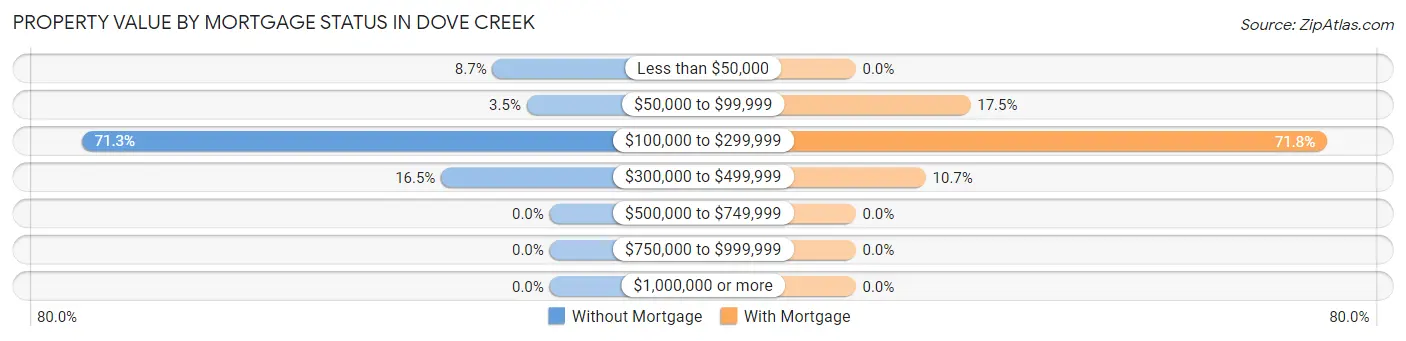
| Property Value | Without Mortgage | With Mortgage |
| Less than $50,000 | 10 (8.7%) | 0 (0.0%) |
| $50,000 to $99,999 | 4 (3.5%) | 18 (17.5%) |
| $100,000 to $299,999 | 82 (71.3%) | 74 (71.8%) |
| $300,000 to $499,999 | 19 (16.5%) | 11 (10.7%) |
| $500,000 to $749,999 | 0 (0.0%) | 0 (0.0%) |
| $750,000 to $999,999 | 0 (0.0%) | 0 (0.0%) |
| $1,000,000 or more | 0 (0.0%) | 0 (0.0%) |
| Total | 115 (100.0%) | 103 (100.0%) |
Household Income by Mortgage Status in Dove Creek
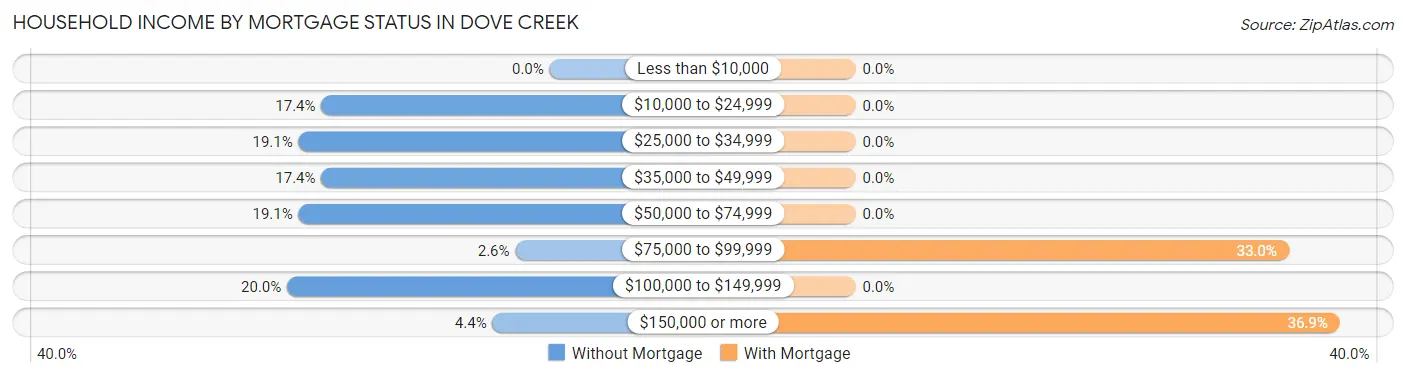
| Household Income | Without Mortgage | With Mortgage |
| Less than $10,000 | 0 (0.0%) | 0 (0.0%) |
| $10,000 to $24,999 | 20 (17.4%) | 0 (0.0%) |
| $25,000 to $34,999 | 22 (19.1%) | 0 (0.0%) |
| $35,000 to $49,999 | 20 (17.4%) | 0 (0.0%) |
| $50,000 to $74,999 | 22 (19.1%) | 0 (0.0%) |
| $75,000 to $99,999 | 3 (2.6%) | 34 (33.0%) |
| $100,000 to $149,999 | 23 (20.0%) | 0 (0.0%) |
| $150,000 or more | 5 (4.3%) | 38 (36.9%) |
| Total | 115 (100.0%) | 103 (100.0%) |
Property Value to Household Income Ratio in Dove Creek
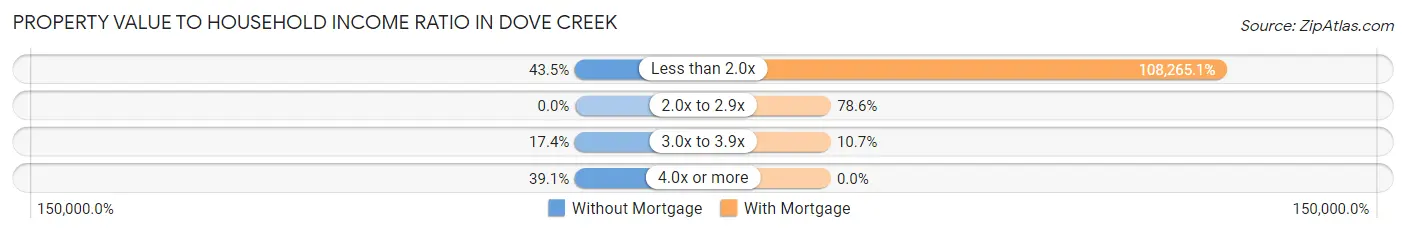
| Value-to-Income Ratio | Without Mortgage | With Mortgage |
| Less than 2.0x | 50 (43.5%) | 111,513 (108,265.0%) |
| 2.0x to 2.9x | 0 (0.0%) | 81 (78.6%) |
| 3.0x to 3.9x | 20 (17.4%) | 11 (10.7%) |
| 4.0x or more | 45 (39.1%) | 0 (0.0%) |
| Total | 115 (100.0%) | 103 (100.0%) |
Real Estate Taxes by Mortgage Status in Dove Creek
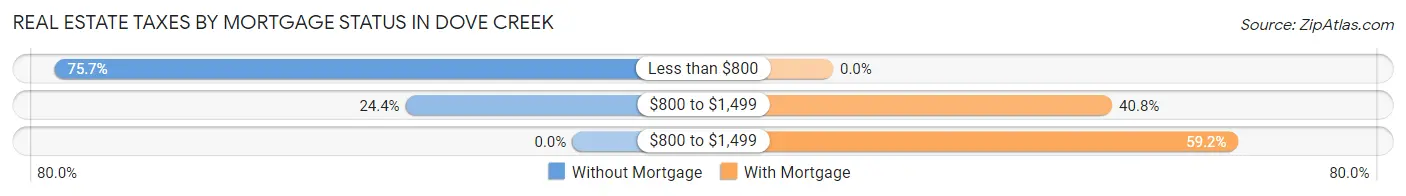
| Property Taxes | Without Mortgage | With Mortgage |
| Less than $800 | 87 (75.6%) | 0 (0.0%) |
| $800 to $1,499 | 28 (24.3%) | 42 (40.8%) |
| $800 to $1,499 | 0 (0.0%) | 61 (59.2%) |
| Total | 115 (100.0%) | 103 (100.0%) |
Health & Disability in Dove Creek
Health Insurance Coverage by Age in Dove Creek
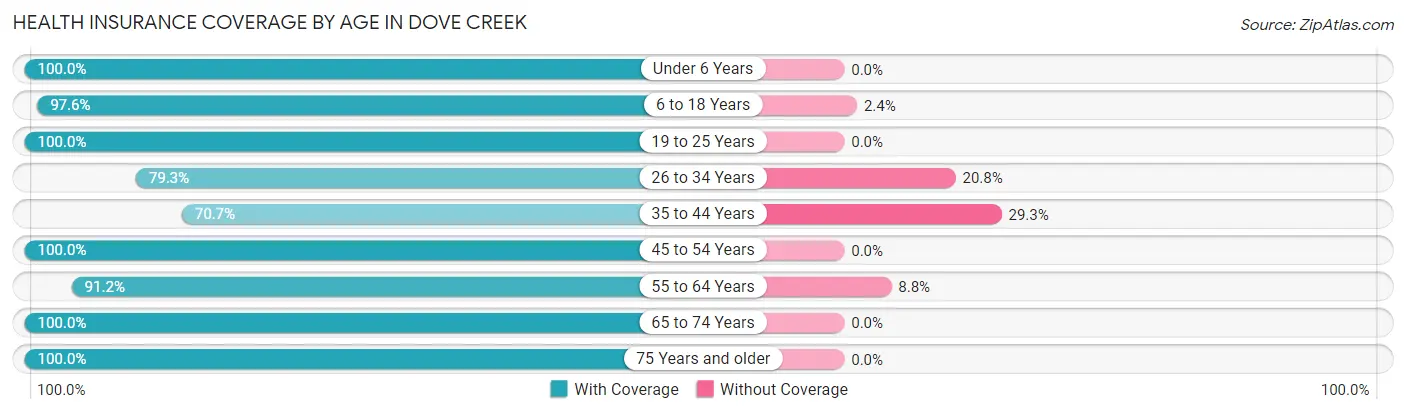
| Age Bracket | With Coverage | Without Coverage |
| Under 6 Years | 81 (100.0%) | 0 (0.0%) |
| 6 to 18 Years | 124 (97.6%) | 3 (2.4%) |
| 19 to 25 Years | 13 (100.0%) | 0 (0.0%) |
| 26 to 34 Years | 42 (79.2%) | 11 (20.7%) |
| 35 to 44 Years | 94 (70.7%) | 39 (29.3%) |
| 45 to 54 Years | 74 (100.0%) | 0 (0.0%) |
| 55 to 64 Years | 135 (91.2%) | 13 (8.8%) |
| 65 to 74 Years | 87 (100.0%) | 0 (0.0%) |
| 75 Years and older | 59 (100.0%) | 0 (0.0%) |
| Total | 709 (91.5%) | 66 (8.5%) |
Health Insurance Coverage by Citizenship Status in Dove Creek
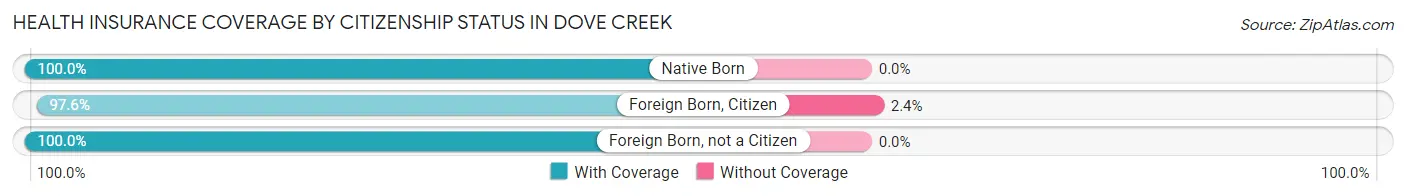
| Citizenship Status | With Coverage | Without Coverage |
| Native Born | 81 (100.0%) | 0 (0.0%) |
| Foreign Born, Citizen | 124 (97.6%) | 3 (2.4%) |
| Foreign Born, not a Citizen | 13 (100.0%) | 0 (0.0%) |
Health Insurance Coverage by Household Income in Dove Creek
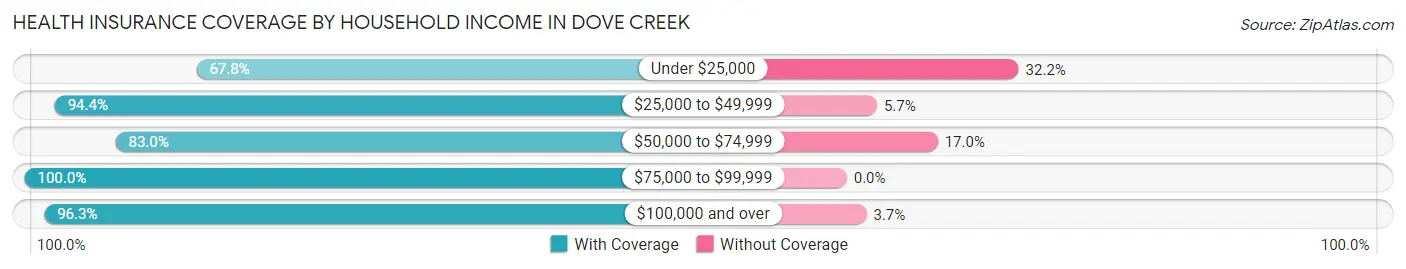
| Household Income | With Coverage | Without Coverage |
| Under $25,000 | 40 (67.8%) | 19 (32.2%) |
| $25,000 to $49,999 | 167 (94.4%) | 10 (5.7%) |
| $50,000 to $74,999 | 112 (83.0%) | 23 (17.0%) |
| $75,000 to $99,999 | 24 (100.0%) | 0 (0.0%) |
| $100,000 and over | 366 (96.3%) | 14 (3.7%) |
Public vs Private Health Insurance Coverage by Age in Dove Creek
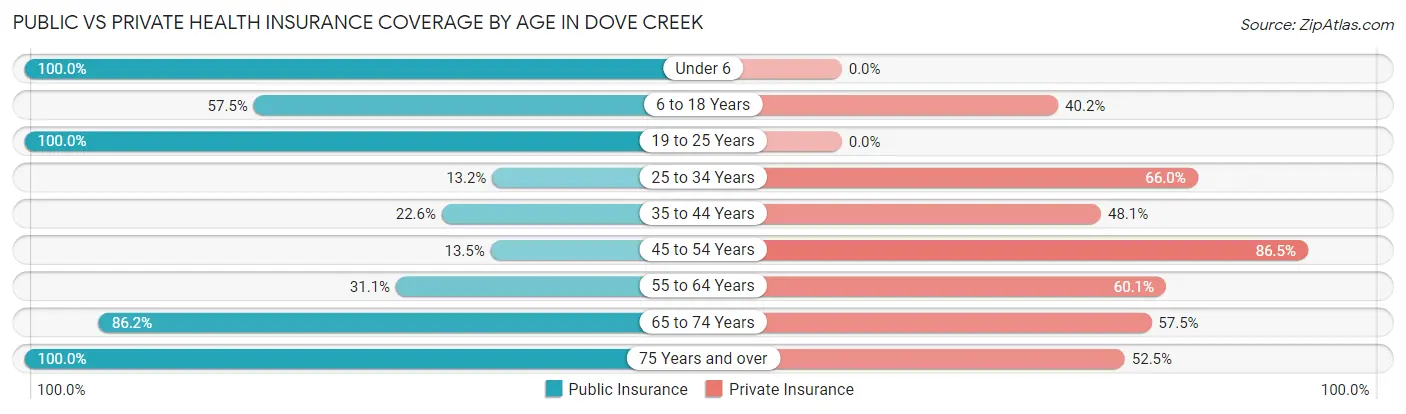
| Age Bracket | Public Insurance | Private Insurance |
| Under 6 | 81 (100.0%) | 0 (0.0%) |
| 6 to 18 Years | 73 (57.5%) | 51 (40.2%) |
| 19 to 25 Years | 13 (100.0%) | 0 (0.0%) |
| 25 to 34 Years | 7 (13.2%) | 35 (66.0%) |
| 35 to 44 Years | 30 (22.6%) | 64 (48.1%) |
| 45 to 54 Years | 10 (13.5%) | 64 (86.5%) |
| 55 to 64 Years | 46 (31.1%) | 89 (60.1%) |
| 65 to 74 Years | 75 (86.2%) | 50 (57.5%) |
| 75 Years and over | 59 (100.0%) | 31 (52.5%) |
| Total | 394 (50.8%) | 384 (49.5%) |
Disability Status by Sex by Age in Dove Creek
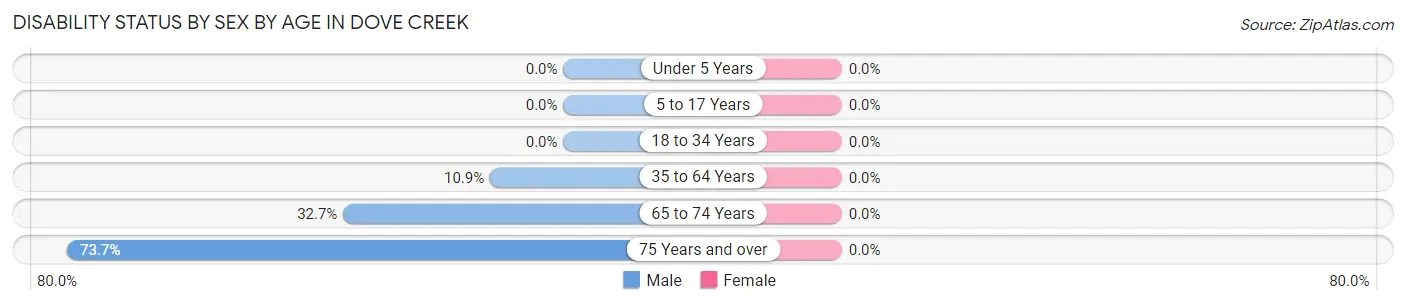
| Age Bracket | Male | Female |
| Under 5 Years | 0 (0.0%) | 0 (0.0%) |
| 5 to 17 Years | 0 (0.0%) | 0 (0.0%) |
| 18 to 34 Years | 0 (0.0%) | 0 (0.0%) |
| 35 to 64 Years | 21 (10.9%) | 0 (0.0%) |
| 65 to 74 Years | 17 (32.7%) | 0 (0.0%) |
| 75 Years and over | 28 (73.7%) | 0 (0.0%) |
Disability Class by Sex by Age in Dove Creek
Disability Class: Hearing Difficulty
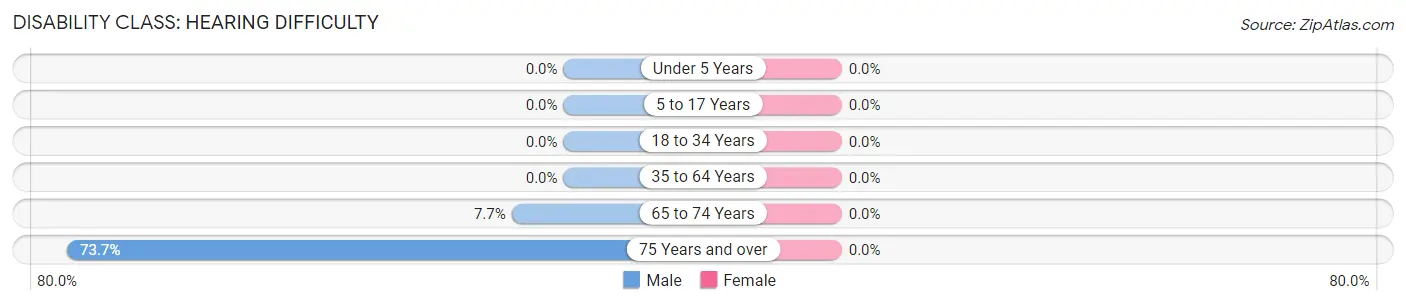
| Age Bracket | Male | Female |
| Under 5 Years | 0 (0.0%) | 0 (0.0%) |
| 5 to 17 Years | 0 (0.0%) | 0 (0.0%) |
| 18 to 34 Years | 0 (0.0%) | 0 (0.0%) |
| 35 to 64 Years | 0 (0.0%) | 0 (0.0%) |
| 65 to 74 Years | 4 (7.7%) | 0 (0.0%) |
| 75 Years and over | 28 (73.7%) | 0 (0.0%) |
Disability Class: Vision Difficulty
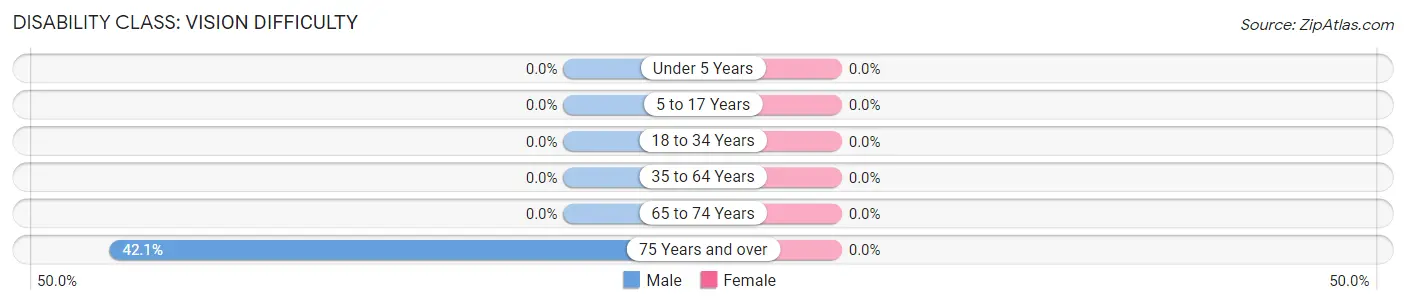
| Age Bracket | Male | Female |
| Under 5 Years | 0 (0.0%) | 0 (0.0%) |
| 5 to 17 Years | 0 (0.0%) | 0 (0.0%) |
| 18 to 34 Years | 0 (0.0%) | 0 (0.0%) |
| 35 to 64 Years | 0 (0.0%) | 0 (0.0%) |
| 65 to 74 Years | 0 (0.0%) | 0 (0.0%) |
| 75 Years and over | 16 (42.1%) | 0 (0.0%) |
Disability Class: Cognitive Difficulty
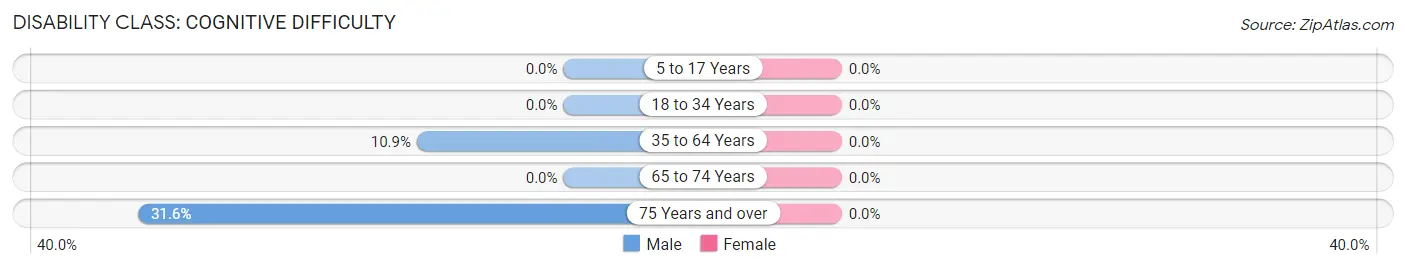
| Age Bracket | Male | Female |
| 5 to 17 Years | 0 (0.0%) | 0 (0.0%) |
| 18 to 34 Years | 0 (0.0%) | 0 (0.0%) |
| 35 to 64 Years | 21 (10.9%) | 0 (0.0%) |
| 65 to 74 Years | 0 (0.0%) | 0 (0.0%) |
| 75 Years and over | 12 (31.6%) | 0 (0.0%) |
Disability Class: Ambulatory Difficulty
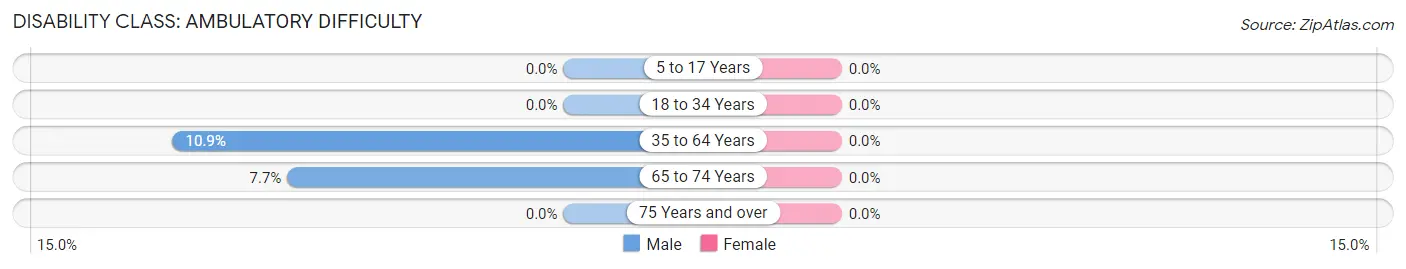
| Age Bracket | Male | Female |
| 5 to 17 Years | 0 (0.0%) | 0 (0.0%) |
| 18 to 34 Years | 0 (0.0%) | 0 (0.0%) |
| 35 to 64 Years | 21 (10.9%) | 0 (0.0%) |
| 65 to 74 Years | 4 (7.7%) | 0 (0.0%) |
| 75 Years and over | 0 (0.0%) | 0 (0.0%) |
Disability Class: Self-Care Difficulty
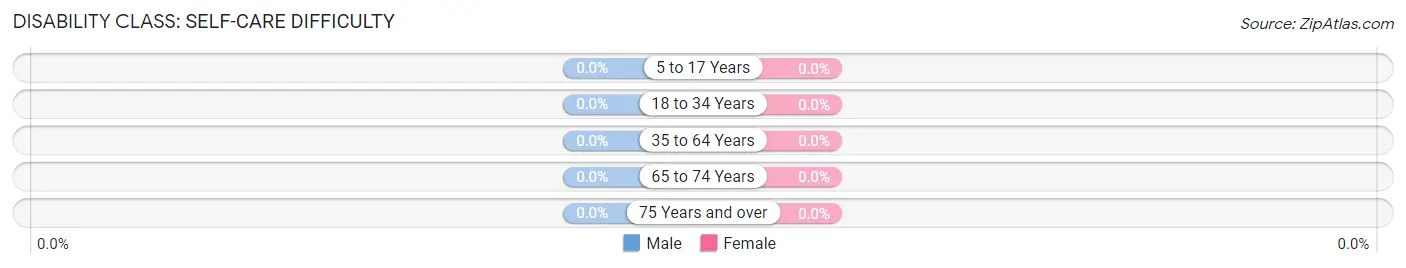
| Age Bracket | Male | Female |
| 5 to 17 Years | 0 (0.0%) | 0 (0.0%) |
| 18 to 34 Years | 0 (0.0%) | 0 (0.0%) |
| 35 to 64 Years | 0 (0.0%) | 0 (0.0%) |
| 65 to 74 Years | 0 (0.0%) | 0 (0.0%) |
| 75 Years and over | 0 (0.0%) | 0 (0.0%) |
Technology Access in Dove Creek
Computing Device Access in Dove Creek
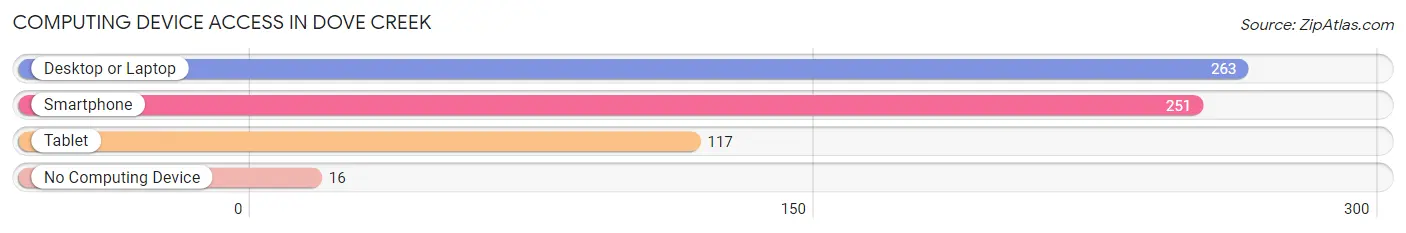
| Device Type | # Households | % Households |
| Desktop or Laptop | 263 | 86.8% |
| Smartphone | 251 | 82.8% |
| Tablet | 117 | 38.6% |
| No Computing Device | 16 | 5.3% |
| Total | 303 | 100.0% |
Internet Access in Dove Creek
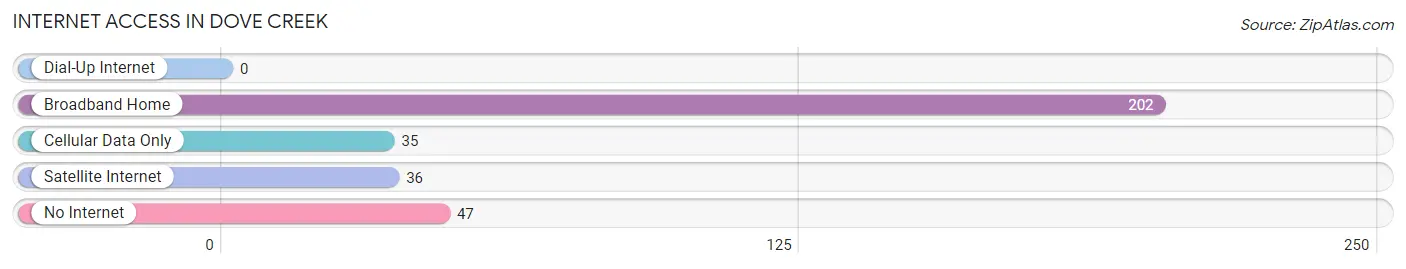
| Internet Type | # Households | % Households |
| Dial-Up Internet | 0 | 0.0% |
| Broadband Home | 202 | 66.7% |
| Cellular Data Only | 35 | 11.6% |
| Satellite Internet | 36 | 11.9% |
| No Internet | 47 | 15.5% |
| Total | 303 | 100.0% |
Dove Creek Summary
Dove Creek is a small town located in the southwestern corner of Colorado, in the county of Dolores. It is situated at an elevation of 6,000 feet and is surrounded by the San Juan Mountains. The town is located on the banks of the Dolores River, and is home to a population of approximately 800 people.
History
The area around Dove Creek was first inhabited by the Ute Indians, who lived in the area for centuries before the arrival of the first European settlers. The first settlers arrived in the area in the late 1800s, and the town of Dove Creek was officially established in 1881. The town was named after the nearby creek, which was named for the large number of doves that lived in the area.
In the early 1900s, Dove Creek became an important stop on the Denver and Rio Grande Western Railroad. The railroad brought in new settlers and businesses, and the town began to grow. In the 1920s, the town was incorporated and the population grew to over 1,000 people.
Geography
Dove Creek is located in the southwestern corner of Colorado, in the county of Dolores. It is situated at an elevation of 6,000 feet and is surrounded by the San Juan Mountains. The town is located on the banks of the Dolores River, and is home to a population of approximately 800 people.
The town is located in a semi-arid climate, with hot summers and cold winters. The average annual temperature is around 50 degrees Fahrenheit, and the average annual precipitation is around 12 inches.
Economy
The economy of Dove Creek is largely based on agriculture and tourism. The town is home to several farms and ranches, which produce a variety of crops and livestock. The town is also home to several tourist attractions, including the nearby Mesa Verde National Park and the San Juan National Forest.
The town is also home to several small businesses, including restaurants, shops, and other services. The town is also home to a small airport, which serves as a hub for private and commercial flights.
Demographics
As of the 2010 census, the population of Dove Creek was 803 people. The racial makeup of the town was 94.3% White, 0.4% African American, 0.4% Native American, 0.4% Asian, 0.1% Pacific Islander, 2.2% from other races, and 2.2% from two or more races. Hispanic or Latino of any race were 5.2% of the population.
The median income for a household in the town was $35,000, and the median income for a family was $41,000. The per capita income for the town was $17,000. About 11.3% of families and 14.2% of the population were below the poverty line, including 18.2% of those under age 18 and 8.3% of those age 65 or over.
Conclusion
Dove Creek is a small town located in the southwestern corner of Colorado, in the county of Dolores. It is situated at an elevation of 6,000 feet and is surrounded by the San Juan Mountains. The town is located on the banks of the Dolores River, and is home to a population of approximately 800 people. The economy of Dove Creek is largely based on agriculture and tourism, and the town is home to several small businesses. The racial makeup of the town is predominantly White, with a small percentage of African American, Native American, Asian, and Pacific Islander residents. The median income for a household in the town is $35,000, and the median income for a family is $41,000.
Common Questions
What is the Total Population of Dove Creek?
Total Population of Dove Creek is 775.
What is the Total Male Population of Dove Creek?
Total Male Population of Dove Creek is 488.
What is the Total Female Population of Dove Creek?
Total Female Population of Dove Creek is 287.
What is the Ratio of Males per 100 Females in Dove Creek?
There are 170.03 Males per 100 Females in Dove Creek.
What is the Ratio of Females per 100 Males in Dove Creek?
There are 58.81 Females per 100 Males in Dove Creek.
What is the Median Population Age in Dove Creek?
Median Population Age in Dove Creek is 44.0 Years.
What is the Average Family Size in Dove Creek
Average Family Size in Dove Creek is 2.9 People.
What is the Average Household Size in Dove Creek
Average Household Size in Dove Creek is 2.6 People.
What is Per Capita Income in Dove Creek?
Per Capita income in Dove Creek is $39,798.
What is the Median Family Income in Dove Creek?
Median Family Income in Dove Creek is $71,136.
What is the Median Household income in Dove Creek?
Median Household Income in Dove Creek is $70,855.
What is Income or Wage Gap in Dove Creek?
Income or Wage Gap in Dove Creek is 32.1%.
Women in Dove Creek earn 67.9 cents for every dollar earned by a man.
What is Inequality or Gini Index in Dove Creek?
Inequality or Gini Index in Dove Creek is 0.47.
How Large is the Labor Force in Dove Creek?
There are 319 People in the Labor Forcein in Dove Creek.
What is the Percentage of People in the Labor Force in Dove Creek?
51.5% of People are in the Labor Force in Dove Creek.
What is the Unemployment Rate in Dove Creek?
Unemployment Rate in Dove Creek is 5.6%.