Dacono, CO Map & Demographics
Dacono Map
Dacono Overview
$37,467
PER CAPITA INCOME
$95,647
AVG FAMILY INCOME
$94,783
AVG HOUSEHOLD INCOME
22.7%
WAGE / INCOME GAP [ % ]
77.3¢/ $1
WAGE / INCOME GAP [ $ ]
0.37
INEQUALITY / GINI INDEX
6,260
TOTAL POPULATION
3,085
MALE POPULATION
3,175
FEMALE POPULATION
97.17
MALES / 100 FEMALES
102.92
FEMALES / 100 MALES
31.9
MEDIAN AGE
3.3
AVG FAMILY SIZE
3.0
AVG HOUSEHOLD SIZE
3,350
LABOR FORCE [ PEOPLE ]
76.0%
PERCENT IN LABOR FORCE
2.2%
UNEMPLOYMENT RATE
Dacono Zip Codes
Income in Dacono
Income Overview in Dacono
Per Capita Income in Dacono is $37,467, while median incomes of families and households are $95,647 and $94,783 respectively.
| Characteristic | Number | Measure |
| Per Capita Income | 6,260 | $37,467 |
| Median Family Income | 1,644 | $95,647 |
| Mean Family Income | 1,644 | $115,485 |
| Median Household Income | 2,118 | $94,783 |
| Mean Household Income | 2,118 | $107,795 |
| Income Deficit | 1,644 | $0 |
| Wage / Income Gap (%) | 6,260 | 22.72% |
| Wage / Income Gap ($) | 6,260 | 77.28¢ per $1 |
| Gini / Inequality Index | 6,260 | 0.37 |
Earnings by Sex in Dacono
Average Earnings in Dacono are $53,034, $59,203 for men and $45,755 for women, a difference of 22.7%.
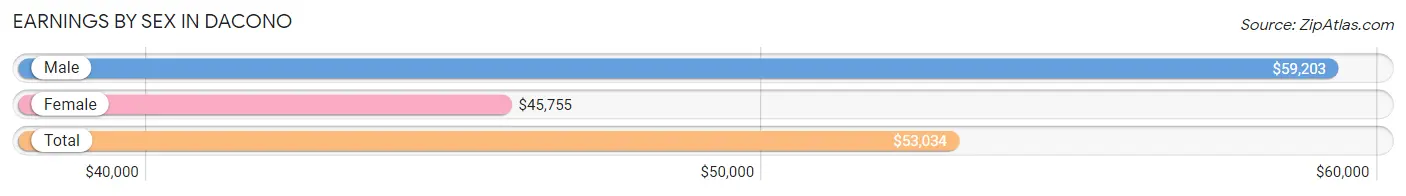
| Sex | Number | Average Earnings |
| Male | 2,084 (60.4%) | $59,203 |
| Female | 1,365 (39.6%) | $45,755 |
| Total | 3,449 (100.0%) | $53,034 |
Earnings by Sex by Income Bracket in Dacono
The most common earnings brackets in Dacono are $55,000 to $64,999 for men (354 | 17.0%) and $30,000 to $34,999 for women (227 | 16.6%).
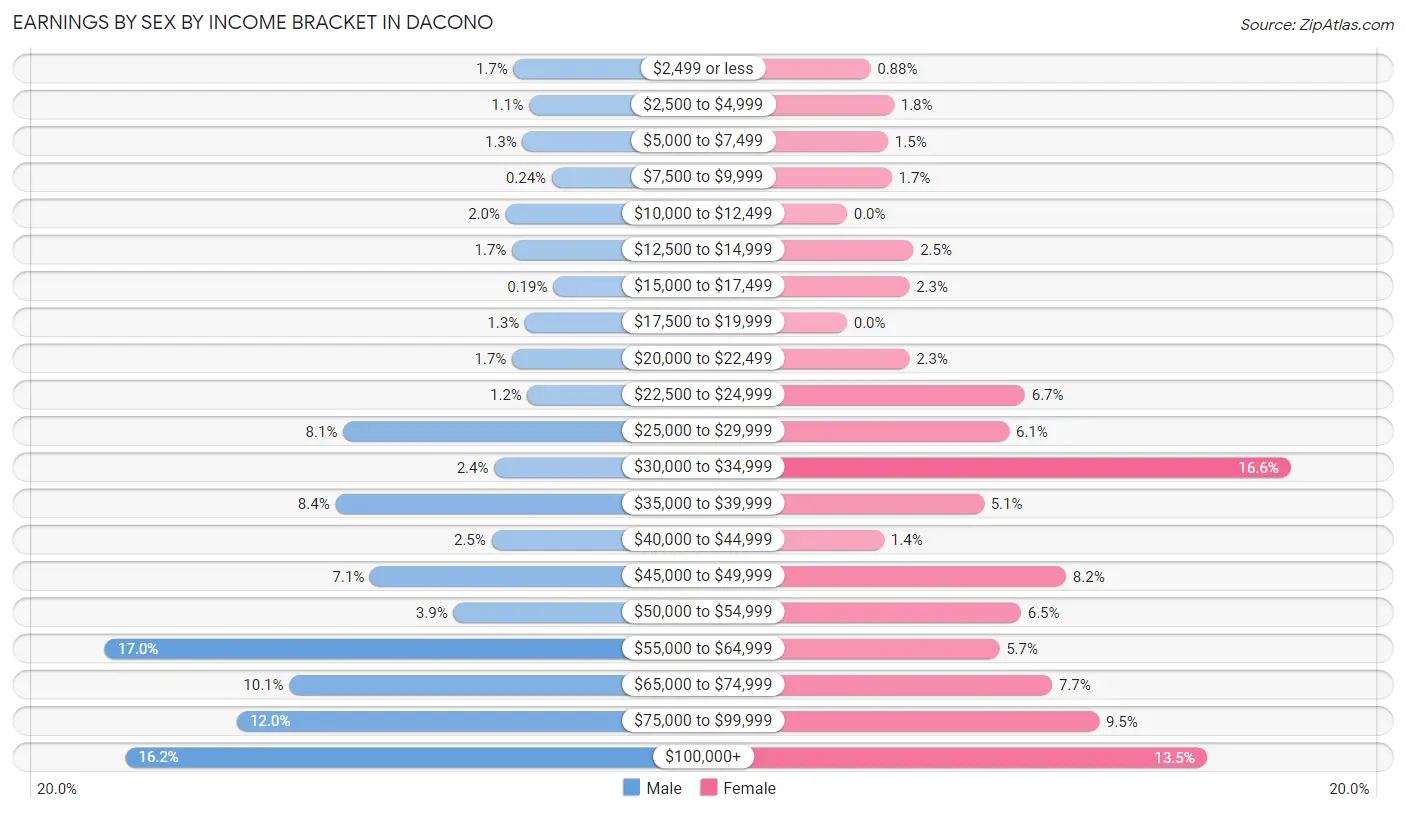
| Income | Male | Female |
| $2,499 or less | 35 (1.7%) | 12 (0.9%) |
| $2,500 to $4,999 | 23 (1.1%) | 24 (1.8%) |
| $5,000 to $7,499 | 28 (1.3%) | 21 (1.5%) |
| $7,500 to $9,999 | 5 (0.2%) | 23 (1.7%) |
| $10,000 to $12,499 | 41 (2.0%) | 0 (0.0%) |
| $12,500 to $14,999 | 36 (1.7%) | 34 (2.5%) |
| $15,000 to $17,499 | 4 (0.2%) | 32 (2.3%) |
| $17,500 to $19,999 | 26 (1.3%) | 0 (0.0%) |
| $20,000 to $22,499 | 36 (1.7%) | 32 (2.3%) |
| $22,500 to $24,999 | 24 (1.1%) | 91 (6.7%) |
| $25,000 to $29,999 | 168 (8.1%) | 83 (6.1%) |
| $30,000 to $34,999 | 50 (2.4%) | 227 (16.6%) |
| $35,000 to $39,999 | 174 (8.4%) | 70 (5.1%) |
| $40,000 to $44,999 | 52 (2.5%) | 19 (1.4%) |
| $45,000 to $49,999 | 147 (7.0%) | 112 (8.2%) |
| $50,000 to $54,999 | 82 (3.9%) | 89 (6.5%) |
| $55,000 to $64,999 | 354 (17.0%) | 78 (5.7%) |
| $65,000 to $74,999 | 210 (10.1%) | 105 (7.7%) |
| $75,000 to $99,999 | 251 (12.0%) | 129 (9.5%) |
| $100,000+ | 338 (16.2%) | 184 (13.5%) |
| Total | 2,084 (100.0%) | 1,365 (100.0%) |
Earnings by Sex by Educational Attainment in Dacono
Average earnings in Dacono are $60,962 for men and $47,793 for women, a difference of 21.6%. Men with an educational attainment of graduate degree enjoy the highest average annual earnings of $86,845, while those with less than high school education earn the least with $42,500. Women with an educational attainment of graduate degree earn the most with the average annual earnings of $113,000, while those with college or associate's degree education have the smallest earnings of $33,500.
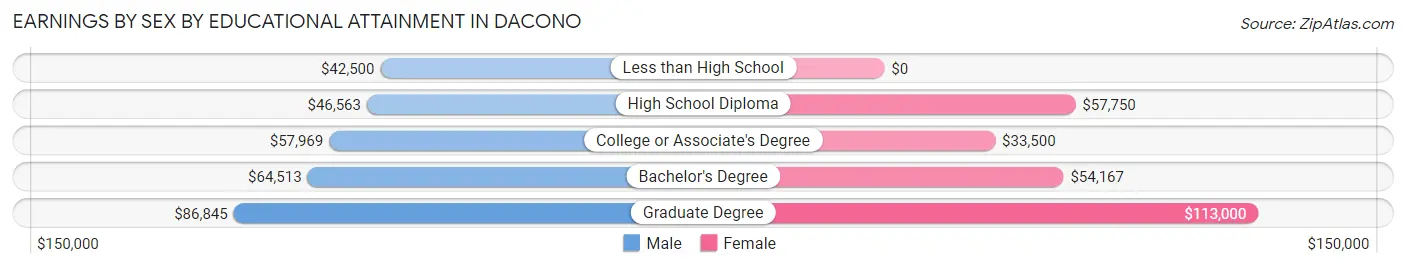
| Educational Attainment | Male Income | Female Income |
| Less than High School | $42,500 | $0 |
| High School Diploma | $46,563 | $57,750 |
| College or Associate's Degree | $57,969 | $33,500 |
| Bachelor's Degree | $64,513 | $54,167 |
| Graduate Degree | $86,845 | $113,000 |
| Total | $60,962 | $47,793 |
Family Income in Dacono
Family Income Brackets in Dacono
According to the Dacono family income data, there are 376 families falling into the $75,000 to $99,999 income range, which is the most common income bracket and makes up 22.9% of all families.
| Income Bracket | # Families | % Families |
| Less than $10,000 | 12 | 0.7% |
| $10,000 to $14,999 | 0 | 0.0% |
| $15,000 to $24,999 | 141 | 8.6% |
| $25,000 to $34,999 | 41 | 2.5% |
| $35,000 to $49,999 | 81 | 4.9% |
| $50,000 to $74,999 | 322 | 19.6% |
| $75,000 to $99,999 | 376 | 22.9% |
| $100,000 to $149,999 | 316 | 19.2% |
| $150,000 to $199,999 | 145 | 8.8% |
| $200,000+ | 210 | 12.8% |
Family Income by Famaliy Size in Dacono
6-person families (105 | 6.4%) account for the highest median family income in Dacono with $98,813 per family, while 2-person families (666 | 40.5%) have the highest median income of $47,686 per family member.

| Income Bracket | # Families | Median Income |
| 2-Person Families | 666 (40.5%) | $95,373 |
| 3-Person Families | 267 (16.2%) | $0 |
| 4-Person Families | 357 (21.7%) | $94,509 |
| 5-Person Families | 249 (15.1%) | $89,811 |
| 6-Person Families | 105 (6.4%) | $98,813 |
| 7+ Person Families | 0 (0.0%) | $0 |
| Total | 1,644 (100.0%) | $95,647 |
Family Income by Number of Earners in Dacono
The median family income in Dacono is $95,647, with families comprising 3+ earners (177) having the highest median family income of $207,784, while families with no earners (87) have the lowest median family income of $21,118, accounting for 10.8% and 5.3% of families, respectively.
| Number of Earners | # Families | Median Income |
| No Earners | 87 (5.3%) | $21,118 |
| 1 Earner | 521 (31.7%) | $61,295 |
| 2 Earners | 859 (52.2%) | $102,426 |
| 3+ Earners | 177 (10.8%) | $207,784 |
| Total | 1,644 (100.0%) | $95,647 |
Household Income in Dacono
Household Income Brackets in Dacono
With 481 households falling in the category, the $100,000 to $149,999 income range is the most frequent in Dacono, accounting for 22.7% of all households. In contrast, only 13 households (0.6%) fall into the less than $10,000 income bracket, making it the least populous group.
| Income Bracket | # Households | % Households |
| Less than $10,000 | 13 | 0.6% |
| $10,000 to $14,999 | 40 | 1.9% |
| $15,000 to $24,999 | 180 | 8.5% |
| $25,000 to $34,999 | 72 | 3.4% |
| $35,000 to $49,999 | 106 | 5.0% |
| $50,000 to $74,999 | 402 | 19.0% |
| $75,000 to $99,999 | 449 | 21.2% |
| $100,000 to $149,999 | 481 | 22.7% |
| $150,000 to $199,999 | 161 | 7.6% |
| $200,000+ | 214 | 10.1% |
Household Income by Householder Age in Dacono
The median household income in Dacono is $94,783, with the highest median household income of $110,909 found in the 45 to 64 years age bracket for the primary householder. A total of 584 households (27.6%) fall into this category. Meanwhile, the 65+ years age bracket for the primary householder has the lowest median household income of $50,139, with 295 households (13.9%) in this group.
| Income Bracket | # Households | Median Income |
| 15 to 24 Years | 74 (3.5%) | $69,111 |
| 25 to 44 Years | 1,165 (55.0%) | $95,604 |
| 45 to 64 Years | 584 (27.6%) | $110,909 |
| 65+ Years | 295 (13.9%) | $50,139 |
| Total | 2,118 (100.0%) | $94,783 |
Poverty in Dacono
Income Below Poverty by Sex and Age in Dacono
With 5.0% poverty level for males and 8.8% for females among the residents of Dacono, 75 year old and over males and 25 to 34 year old females are the most vulnerable to poverty, with 32 males (65.3%) and 87 females (15.7%) in their respective age groups living below the poverty level.
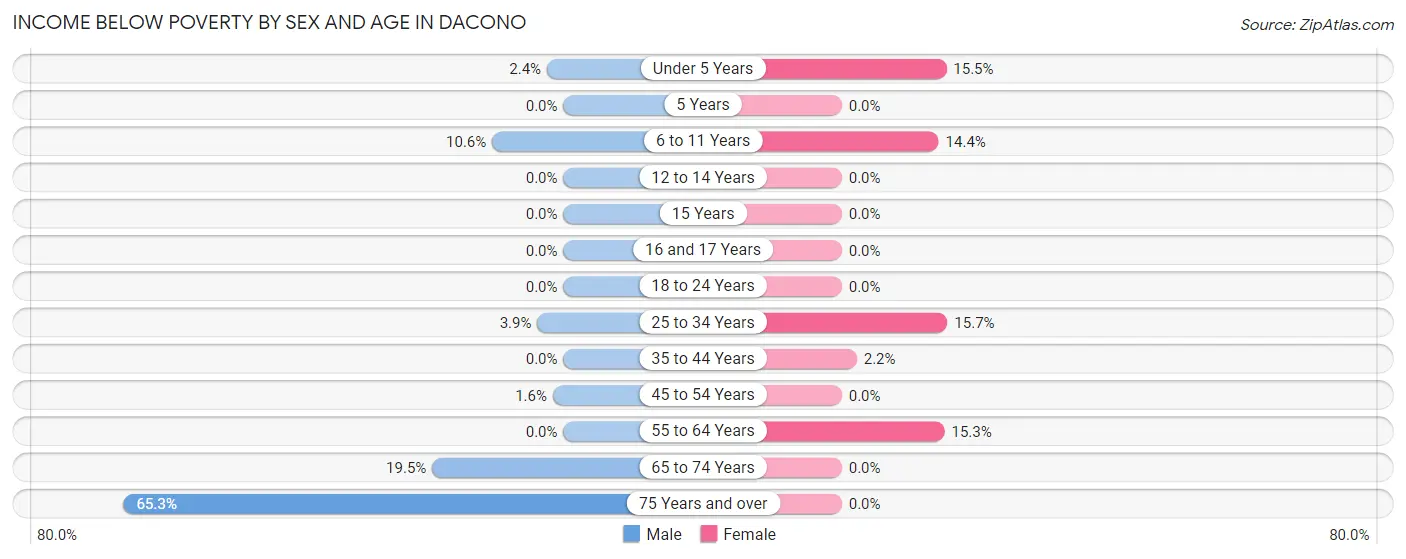
| Age Bracket | Male | Female |
| Under 5 Years | 10 (2.4%) | 64 (15.5%) |
| 5 Years | 0 (0.0%) | 0 (0.0%) |
| 6 to 11 Years | 29 (10.6%) | 69 (14.4%) |
| 12 to 14 Years | 0 (0.0%) | 0 (0.0%) |
| 15 Years | 0 (0.0%) | 0 (0.0%) |
| 16 and 17 Years | 0 (0.0%) | 0 (0.0%) |
| 18 to 24 Years | 0 (0.0%) | 0 (0.0%) |
| 25 to 34 Years | 31 (3.9%) | 87 (15.7%) |
| 35 to 44 Years | 0 (0.0%) | 12 (2.2%) |
| 45 to 54 Years | 7 (1.6%) | 0 (0.0%) |
| 55 to 64 Years | 0 (0.0%) | 49 (15.3%) |
| 65 to 74 Years | 45 (19.5%) | 0 (0.0%) |
| 75 Years and over | 32 (65.3%) | 0 (0.0%) |
| Total | 154 (5.0%) | 281 (8.8%) |
Income Above Poverty by Sex and Age in Dacono
According to the poverty statistics in Dacono, males aged 5 years and females aged 5 years are the age groups that are most secure financially, with 100.0% of males and 100.0% of females in these age groups living above the poverty line.
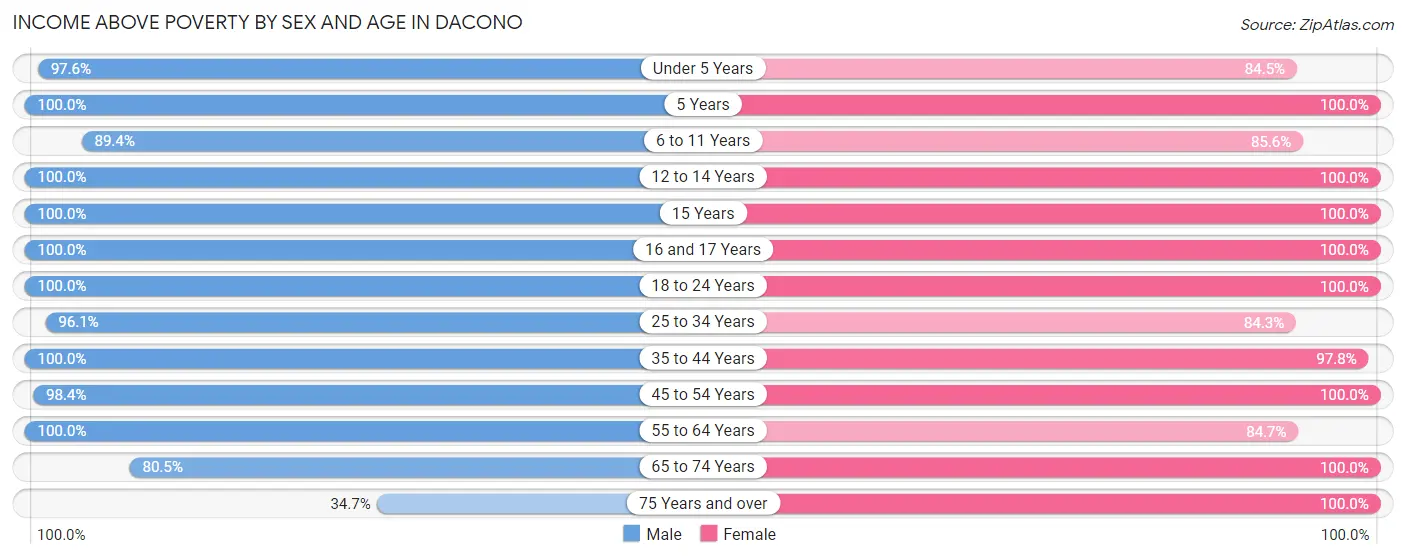
| Age Bracket | Male | Female |
| Under 5 Years | 400 (97.6%) | 348 (84.5%) |
| 5 Years | 22 (100.0%) | 30 (100.0%) |
| 6 to 11 Years | 245 (89.4%) | 411 (85.6%) |
| 12 to 14 Years | 69 (100.0%) | 115 (100.0%) |
| 15 Years | 1 (100.0%) | 39 (100.0%) |
| 16 and 17 Years | 30 (100.0%) | 106 (100.0%) |
| 18 to 24 Years | 105 (100.0%) | 106 (100.0%) |
| 25 to 34 Years | 771 (96.1%) | 468 (84.3%) |
| 35 to 44 Years | 472 (100.0%) | 527 (97.8%) |
| 45 to 54 Years | 439 (98.4%) | 231 (100.0%) |
| 55 to 64 Years | 174 (100.0%) | 272 (84.7%) |
| 65 to 74 Years | 186 (80.5%) | 177 (100.0%) |
| 75 Years and over | 17 (34.7%) | 64 (100.0%) |
| Total | 2,931 (95.0%) | 2,894 (91.1%) |
Income Below Poverty Among Married-Couple Families in Dacono
The poverty statistics for married-couple families in Dacono show that 3.3% or 45 of the total 1,354 families live below the poverty line. Families with no children have the highest poverty rate of 5.8%, comprising of 35 families. On the other hand, families with 3 or 4 children have the lowest poverty rate of 0.0%, which includes 0 families.
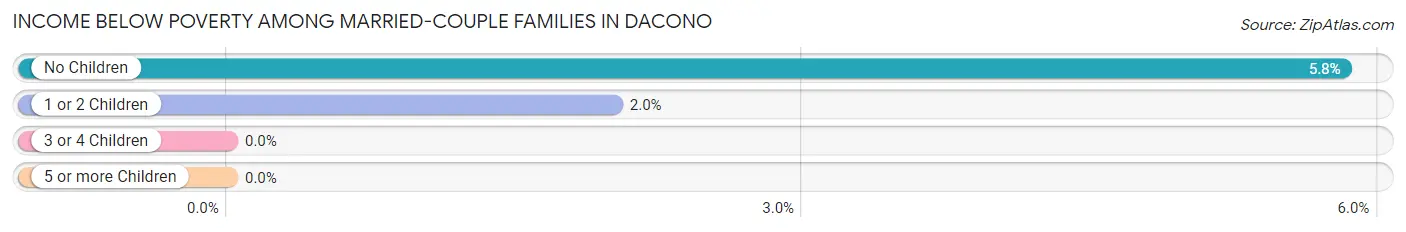
| Children | Above Poverty | Below Poverty |
| No Children | 566 (94.2%) | 35 (5.8%) |
| 1 or 2 Children | 487 (98.0%) | 10 (2.0%) |
| 3 or 4 Children | 256 (100.0%) | 0 (0.0%) |
| 5 or more Children | 0 (0.0%) | 0 (0.0%) |
| Total | 1,309 (96.7%) | 45 (3.3%) |
Income Below Poverty Among Single-Parent Households in Dacono
According to the poverty data in Dacono, 4.8% or 4 single-father households and 29.5% or 61 single-mother households are living below the poverty line. Among single-father households, those with 1 or 2 children have the highest poverty rate, with 4 households (10.0%) experiencing poverty. Likewise, among single-mother households, those with 3 or 4 children have the highest poverty rate, with 29 households (44.6%) falling below the poverty line.
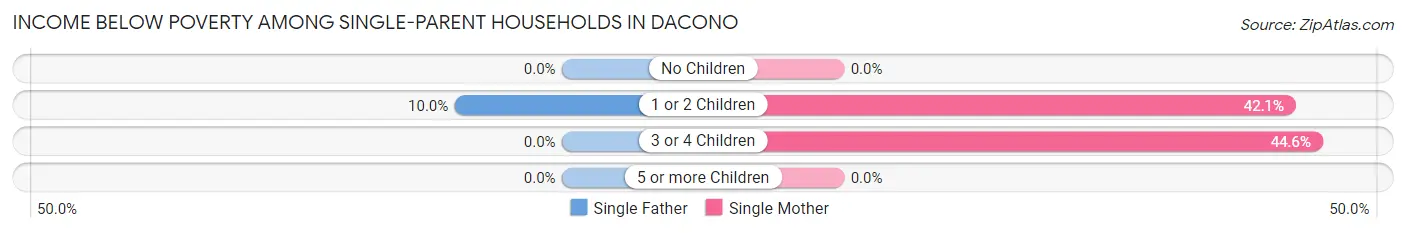
| Children | Single Father | Single Mother |
| No Children | 0 (0.0%) | 0 (0.0%) |
| 1 or 2 Children | 4 (10.0%) | 32 (42.1%) |
| 3 or 4 Children | 0 (0.0%) | 29 (44.6%) |
| 5 or more Children | 0 (0.0%) | 0 (0.0%) |
| Total | 4 (4.8%) | 61 (29.5%) |
Income Below Poverty Among Married-Couple vs Single-Parent Households in Dacono
The poverty data for Dacono shows that 45 of the married-couple family households (3.3%) and 65 of the single-parent households (22.4%) are living below the poverty level. Within the married-couple family households, those with no children have the highest poverty rate, with 35 households (5.8%) falling below the poverty line. Among the single-parent households, those with 3 or 4 children have the highest poverty rate, with 29 household (37.7%) living below poverty.
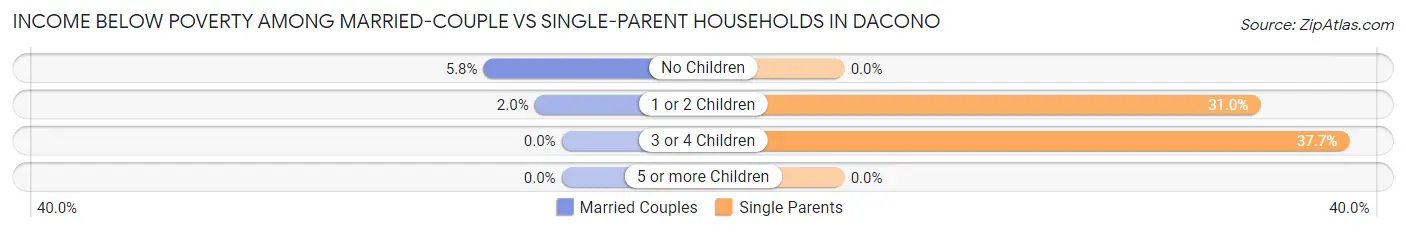
| Children | Married-Couple Families | Single-Parent Households |
| No Children | 35 (5.8%) | 0 (0.0%) |
| 1 or 2 Children | 10 (2.0%) | 36 (31.0%) |
| 3 or 4 Children | 0 (0.0%) | 29 (37.7%) |
| 5 or more Children | 0 (0.0%) | 0 (0.0%) |
| Total | 45 (3.3%) | 65 (22.4%) |
Race in Dacono
The most populous races in Dacono are White / Caucasian (4,767 | 76.1%), Hispanic or Latino (1,782 | 28.5%), and Two or more Races (625 | 10.0%).
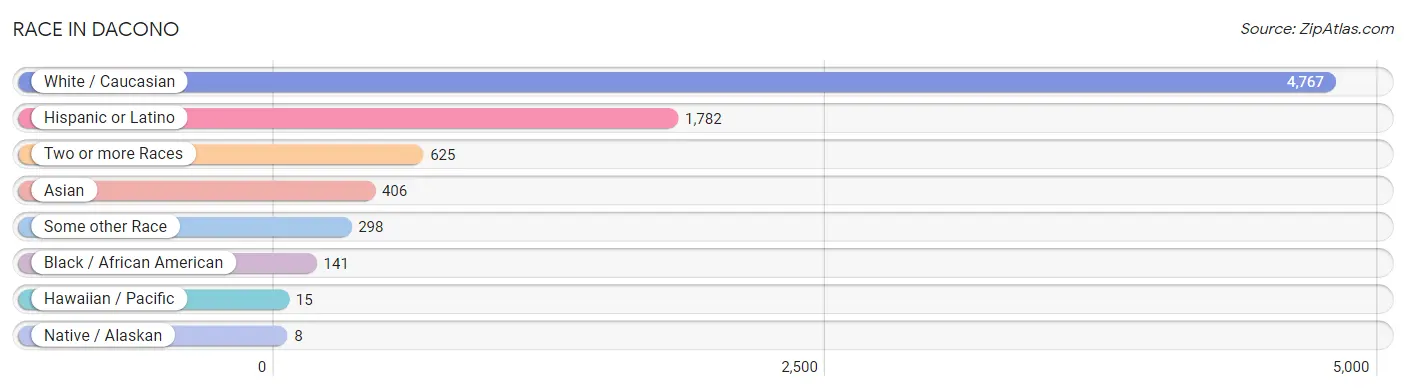
| Race | # Population | % Population |
| Asian | 406 | 6.5% |
| Black / African American | 141 | 2.2% |
| Hawaiian / Pacific | 15 | 0.2% |
| Hispanic or Latino | 1,782 | 28.5% |
| Native / Alaskan | 8 | 0.1% |
| White / Caucasian | 4,767 | 76.1% |
| Two or more Races | 625 | 10.0% |
| Some other Race | 298 | 4.8% |
| Total | 6,260 | 100.0% |
Ancestry in Dacono
The most populous ancestries reported in Dacono are Mexican (1,551 | 24.8%), German (1,328 | 21.2%), English (732 | 11.7%), Irish (644 | 10.3%), and European (346 | 5.5%), together accounting for 73.5% of all Dacono residents.
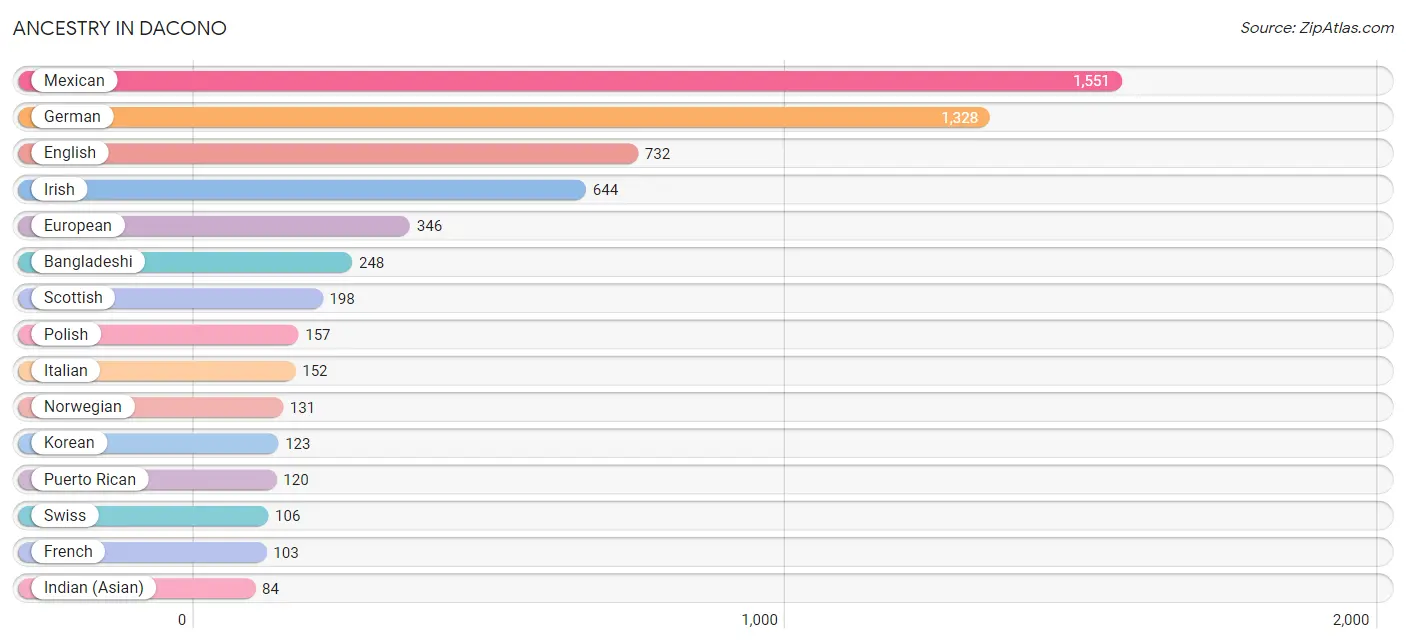
| Ancestry | # Population | % Population |
| American | 62 | 1.0% |
| Apache | 7 | 0.1% |
| Austrian | 34 | 0.5% |
| Bangladeshi | 248 | 4.0% |
| Belgian | 12 | 0.2% |
| Brazilian | 36 | 0.6% |
| British | 46 | 0.7% |
| Central American | 55 | 0.9% |
| Cherokee | 13 | 0.2% |
| Czechoslovakian | 5 | 0.1% |
| Danish | 21 | 0.3% |
| Dutch | 55 | 0.9% |
| English | 732 | 11.7% |
| European | 346 | 5.5% |
| French | 103 | 1.7% |
| French Canadian | 4 | 0.1% |
| German | 1,328 | 21.2% |
| Greek | 45 | 0.7% |
| Hungarian | 9 | 0.1% |
| Indian (Asian) | 84 | 1.3% |
| Irish | 644 | 10.3% |
| Italian | 152 | 2.4% |
| Korean | 123 | 2.0% |
| Malaysian | 18 | 0.3% |
| Mexican | 1,551 | 24.8% |
| Mexican American Indian | 9 | 0.1% |
| Nicaraguan | 5 | 0.1% |
| Norwegian | 131 | 2.1% |
| Polish | 157 | 2.5% |
| Puerto Rican | 120 | 1.9% |
| Russian | 4 | 0.1% |
| Salvadoran | 50 | 0.8% |
| Scandinavian | 11 | 0.2% |
| Scotch-Irish | 25 | 0.4% |
| Scottish | 198 | 3.2% |
| Spaniard | 11 | 0.2% |
| Spanish | 7 | 0.1% |
| Subsaharan African | 16 | 0.3% |
| Swedish | 57 | 0.9% |
| Swiss | 106 | 1.7% |
| Thai | 27 | 0.4% |
| Welsh | 14 | 0.2% |
| Yugoslavian | 6 | 0.1% | View All 43 Rows |
Immigrants in Dacono
The most numerous immigrant groups reported in Dacono came from Latin America (466 | 7.4%), Central America (459 | 7.3%), Mexico (428 | 6.8%), Europe (95 | 1.5%), and Asia (77 | 1.2%), together accounting for 24.4% of all Dacono residents.
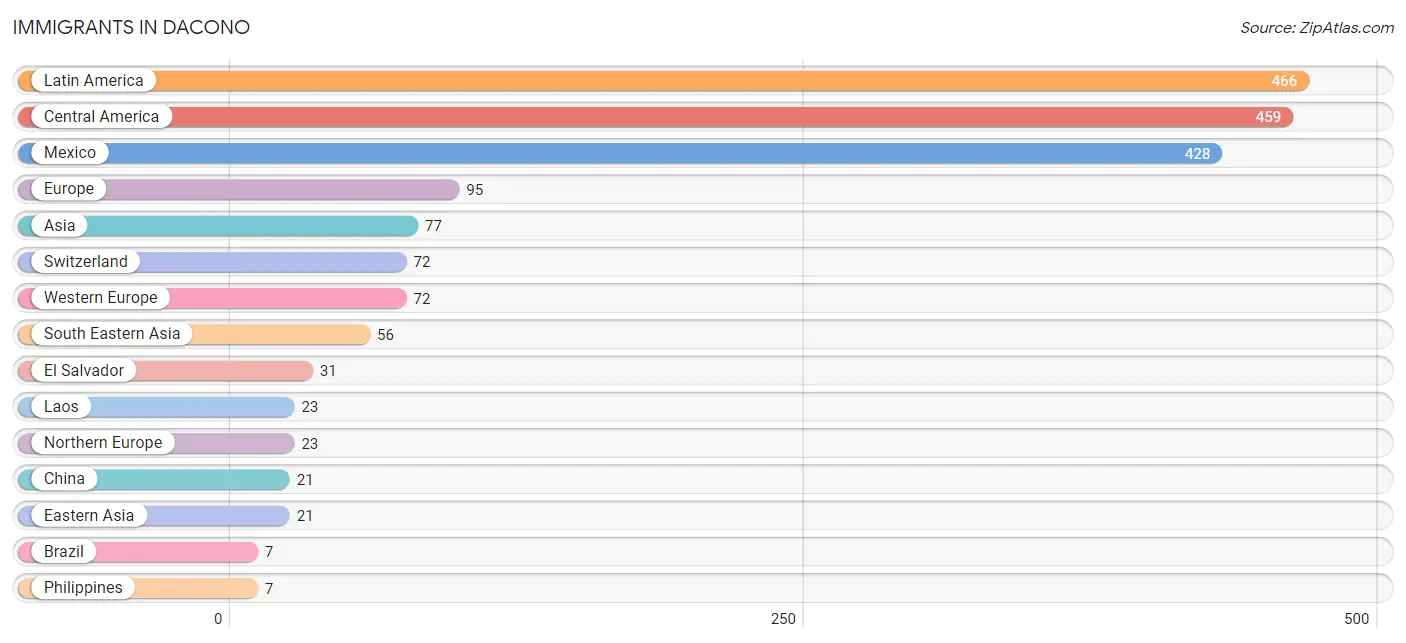
| Immigration Origin | # Population | % Population |
| Asia | 77 | 1.2% |
| Brazil | 7 | 0.1% |
| Central America | 459 | 7.3% |
| China | 21 | 0.3% |
| Eastern Asia | 21 | 0.3% |
| El Salvador | 31 | 0.5% |
| Europe | 95 | 1.5% |
| Laos | 23 | 0.4% |
| Latin America | 466 | 7.4% |
| Mexico | 428 | 6.8% |
| Northern Europe | 23 | 0.4% |
| Philippines | 7 | 0.1% |
| South America | 7 | 0.1% |
| South Eastern Asia | 56 | 0.9% |
| Switzerland | 72 | 1.1% |
| Thailand | 5 | 0.1% |
| Western Europe | 72 | 1.1% | View All 17 Rows |
Sex and Age in Dacono
Sex and Age in Dacono
The most populous age groups in Dacono are 30 to 34 Years (434 | 14.1%) for men and Under 5 Years (412 | 13.0%) for women.
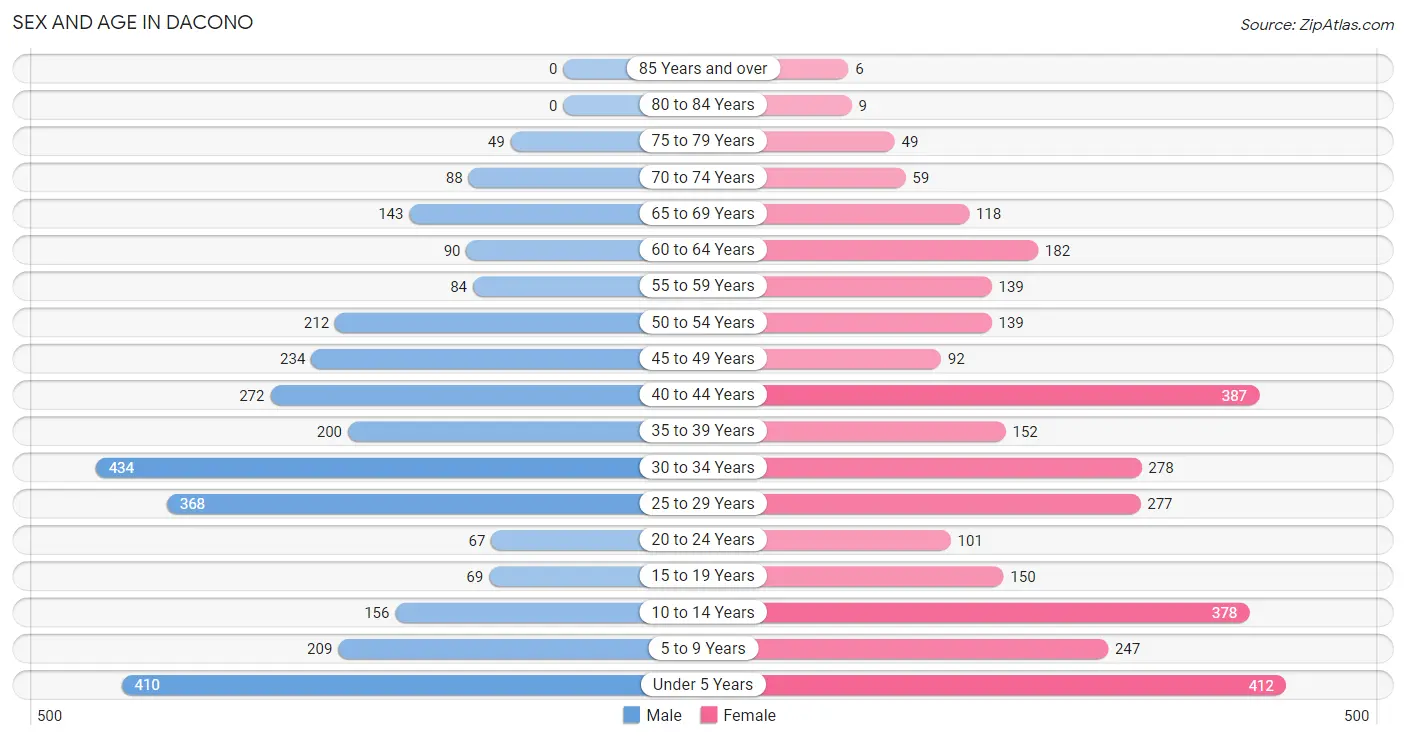
| Age Bracket | Male | Female |
| Under 5 Years | 410 (13.3%) | 412 (13.0%) |
| 5 to 9 Years | 209 (6.8%) | 247 (7.8%) |
| 10 to 14 Years | 156 (5.1%) | 378 (11.9%) |
| 15 to 19 Years | 69 (2.2%) | 150 (4.7%) |
| 20 to 24 Years | 67 (2.2%) | 101 (3.2%) |
| 25 to 29 Years | 368 (11.9%) | 277 (8.7%) |
| 30 to 34 Years | 434 (14.1%) | 278 (8.8%) |
| 35 to 39 Years | 200 (6.5%) | 152 (4.8%) |
| 40 to 44 Years | 272 (8.8%) | 387 (12.2%) |
| 45 to 49 Years | 234 (7.6%) | 92 (2.9%) |
| 50 to 54 Years | 212 (6.9%) | 139 (4.4%) |
| 55 to 59 Years | 84 (2.7%) | 139 (4.4%) |
| 60 to 64 Years | 90 (2.9%) | 182 (5.7%) |
| 65 to 69 Years | 143 (4.6%) | 118 (3.7%) |
| 70 to 74 Years | 88 (2.9%) | 59 (1.9%) |
| 75 to 79 Years | 49 (1.6%) | 49 (1.5%) |
| 80 to 84 Years | 0 (0.0%) | 9 (0.3%) |
| 85 Years and over | 0 (0.0%) | 6 (0.2%) |
| Total | 3,085 (100.0%) | 3,175 (100.0%) |
Families and Households in Dacono
Median Family Size in Dacono
The median family size in Dacono is 3.33 persons per family, with single female/mother families (207 | 12.6%) accounting for the largest median family size of 3.43 persons per family. On the other hand, single male/father families (83 | 5.1%) represent the smallest median family size with 2.51 persons per family.
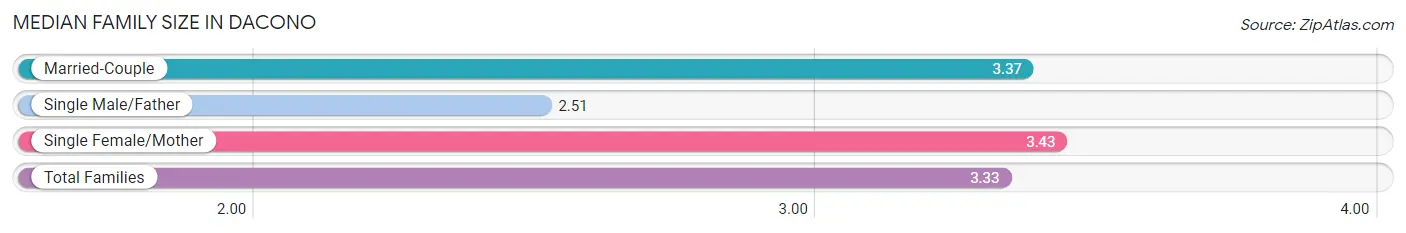
| Family Type | # Families | Family Size |
| Married-Couple | 1,354 (82.4%) | 3.37 |
| Single Male/Father | 83 (5.1%) | 2.51 |
| Single Female/Mother | 207 (12.6%) | 3.43 |
| Total Families | 1,644 (100.0%) | 3.33 |
Median Household Size in Dacono
The median household size in Dacono is 2.96 persons per household, with single female/mother households (207 | 9.8%) accounting for the largest median household size of 3.54 persons per household. non-family households (474 | 22.4%) represent the smallest median household size with 1.43 persons per household.
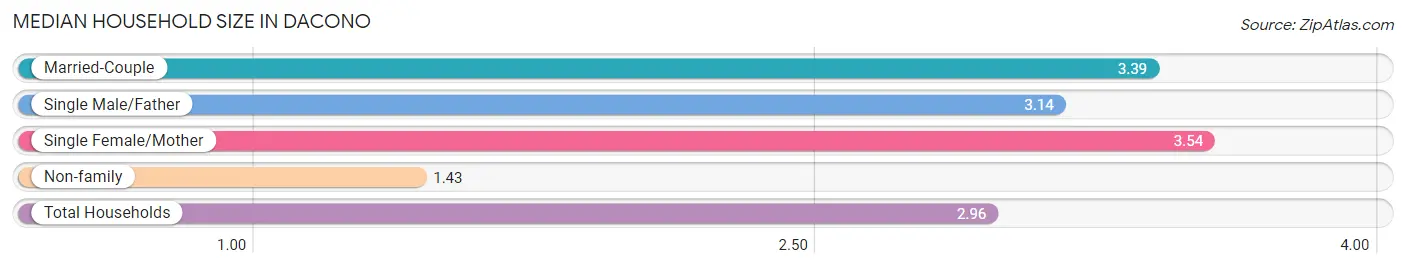
| Household Type | # Households | Household Size |
| Married-Couple | 1,354 (63.9%) | 3.39 |
| Single Male/Father | 83 (3.9%) | 3.14 |
| Single Female/Mother | 207 (9.8%) | 3.54 |
| Non-family | 474 (22.4%) | 1.43 |
| Total Households | 2,118 (100.0%) | 2.96 |
Household Size by Marriage Status in Dacono
Out of a total of 2,118 households in Dacono, 1,644 (77.6%) are family households, while 474 (22.4%) are nonfamily households. The most numerous type of family households are 2-person households, comprising 621, and the most common type of nonfamily households are 1-person households, comprising 323.
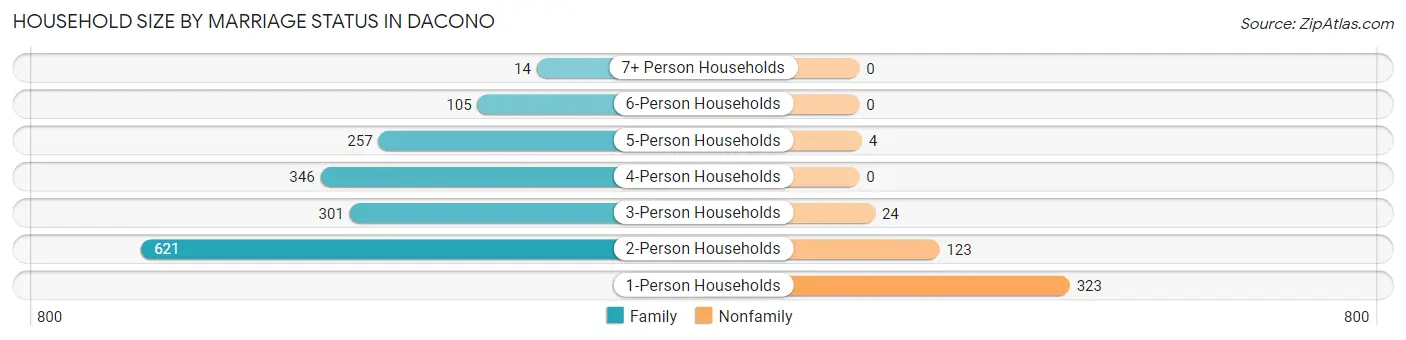
| Household Size | Family Households | Nonfamily Households |
| 1-Person Households | - | 323 (15.2%) |
| 2-Person Households | 621 (29.3%) | 123 (5.8%) |
| 3-Person Households | 301 (14.2%) | 24 (1.1%) |
| 4-Person Households | 346 (16.3%) | 0 (0.0%) |
| 5-Person Households | 257 (12.1%) | 4 (0.2%) |
| 6-Person Households | 105 (5.0%) | 0 (0.0%) |
| 7+ Person Households | 14 (0.7%) | 0 (0.0%) |
| Total | 1,644 (77.6%) | 474 (22.4%) |
Female Fertility in Dacono
Fertility by Age in Dacono
Average fertility rate in Dacono is 135.0 births per 1,000 women. Women in the age bracket of 20 to 34 years have the highest fertility rate with 224.0 births per 1,000 women. Women in the age bracket of 20 to 34 years acount for 72.8% of all women with births.
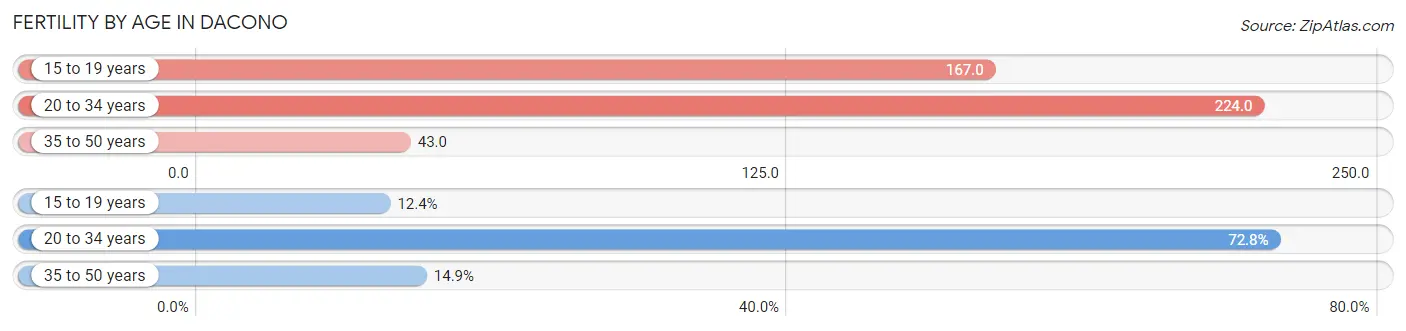
| Age Bracket | Women with Births | Births / 1,000 Women |
| 15 to 19 years | 25 (12.4%) | 167.0 |
| 20 to 34 years | 147 (72.8%) | 224.0 |
| 35 to 50 years | 30 (14.8%) | 43.0 |
| Total | 202 (100.0%) | 135.0 |
Fertility by Age by Marriage Status in Dacono
68.3% of women with births (202) in Dacono are married. The highest percentage of unmarried women with births falls into 15 to 19 years age bracket with 100.0% of them unmarried at the time of birth, while the lowest percentage of unmarried women with births belong to 20 to 34 years age bracket with 21.8% of them unmarried.
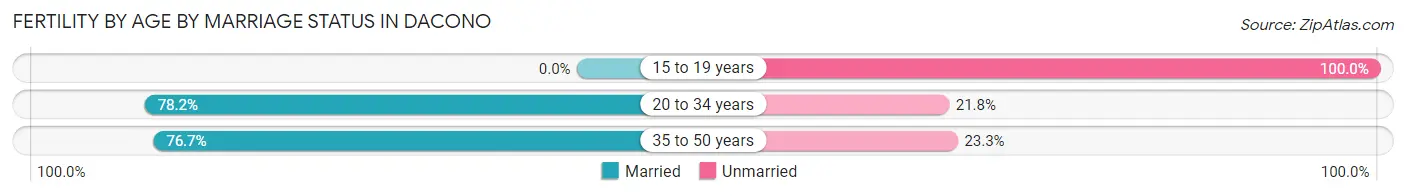
| Age Bracket | Married | Unmarried |
| 15 to 19 years | 0 (0.0%) | 25 (100.0%) |
| 20 to 34 years | 115 (78.2%) | 32 (21.8%) |
| 35 to 50 years | 23 (76.7%) | 7 (23.3%) |
| Total | 138 (68.3%) | 64 (31.7%) |
Fertility by Education in Dacono
Average fertility rate in Dacono is 135.0 births per 1,000 women. Women with the education attainment of bachelor's degree have the highest fertility rate of 309.0 births per 1,000 women, while women with the education attainment of high school diploma have the lowest fertility at 37.0 births per 1,000 women. Women with the education attainment of bachelor's degree represent 45.5% of all women with births.
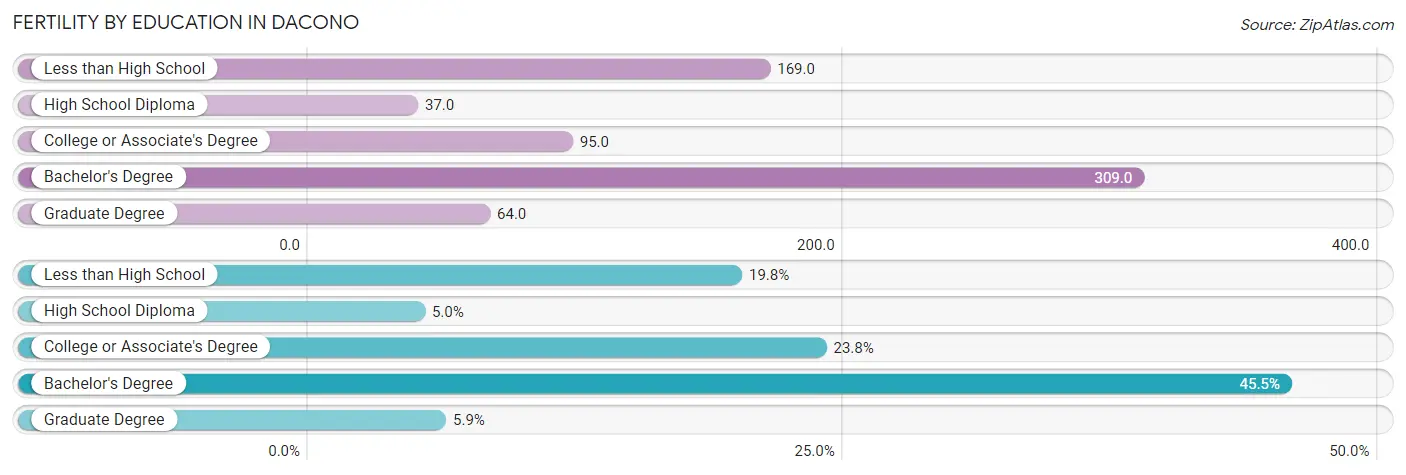
| Educational Attainment | Women with Births | Births / 1,000 Women |
| Less than High School | 40 (19.8%) | 169.0 |
| High School Diploma | 10 (5.0%) | 37.0 |
| College or Associate's Degree | 48 (23.8%) | 95.0 |
| Bachelor's Degree | 92 (45.5%) | 309.0 |
| Graduate Degree | 12 (5.9%) | 64.0 |
| Total | 202 (100.0%) | 135.0 |
Fertility by Education by Marriage Status in Dacono
31.7% of women with births in Dacono are unmarried. Women with the educational attainment of high school diploma are most likely to be married with 100.0% of them married at childbirth, while women with the educational attainment of less than high school are least likely to be married with 80.0% of them unmarried at childbirth.
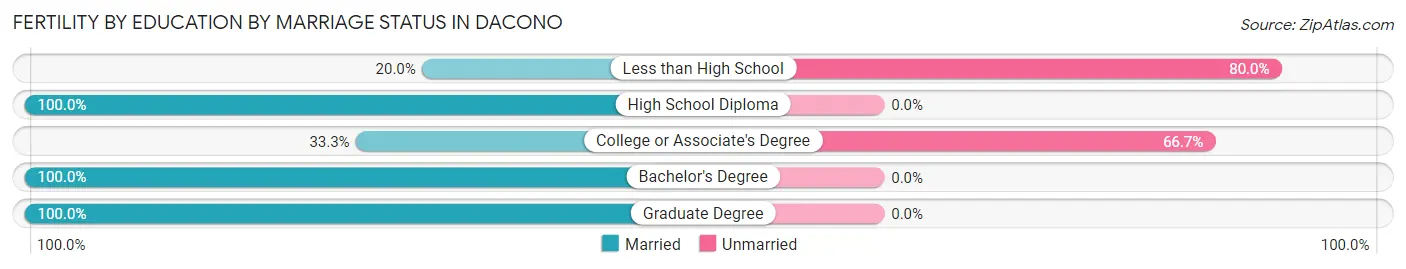
| Educational Attainment | Married | Unmarried |
| Less than High School | 8 (20.0%) | 32 (80.0%) |
| High School Diploma | 10 (100.0%) | 0 (0.0%) |
| College or Associate's Degree | 16 (33.3%) | 32 (66.7%) |
| Bachelor's Degree | 92 (100.0%) | 0 (0.0%) |
| Graduate Degree | 12 (100.0%) | 0 (0.0%) |
| Total | 138 (68.3%) | 64 (31.7%) |
Employment Characteristics in Dacono
Employment by Class of Employer in Dacono
Among the 3,239 employed individuals in Dacono, private company employees (2,285 | 70.6%), not-for-profit organizations (259 | 8.0%), and local government employees (217 | 6.7%) make up the most common classes of employment.
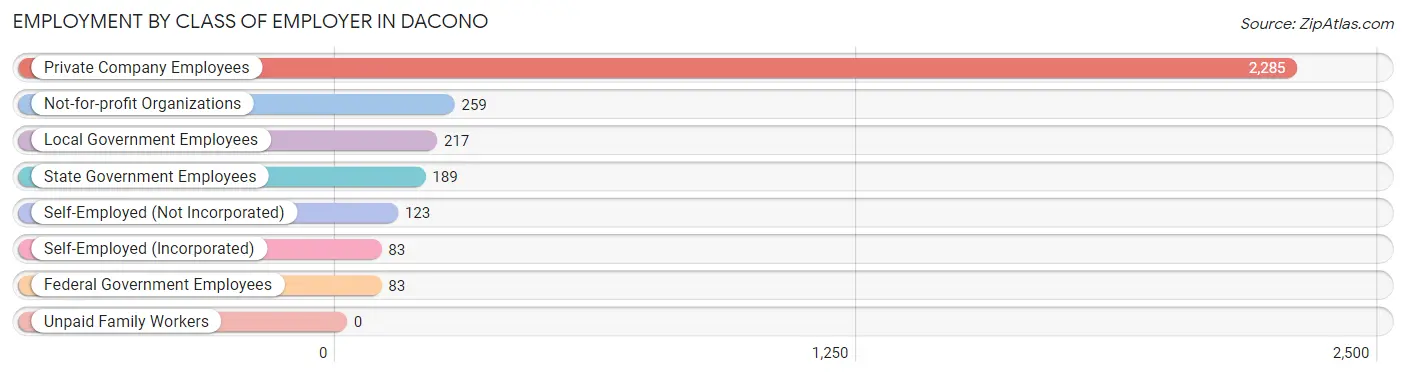
| Employer Class | # Employees | % Employees |
| Private Company Employees | 2,285 | 70.6% |
| Self-Employed (Incorporated) | 83 | 2.6% |
| Self-Employed (Not Incorporated) | 123 | 3.8% |
| Not-for-profit Organizations | 259 | 8.0% |
| Local Government Employees | 217 | 6.7% |
| State Government Employees | 189 | 5.8% |
| Federal Government Employees | 83 | 2.6% |
| Unpaid Family Workers | 0 | 0.0% |
| Total | 3,239 | 100.0% |
Employment Status by Age in Dacono
According to the labor force statistics for Dacono, out of the total population over 16 years of age (4,408), 76.0% or 3,350 individuals are in the labor force, with 2.2% or 74 of them unemployed. The age group with the highest labor force participation rate is 45 to 54 years, with 93.6% or 634 individuals in the labor force. Within the labor force, the 16 to 19 years age range has the highest percentage of unemployed individuals, with 10.1% or 9 of them being unemployed.
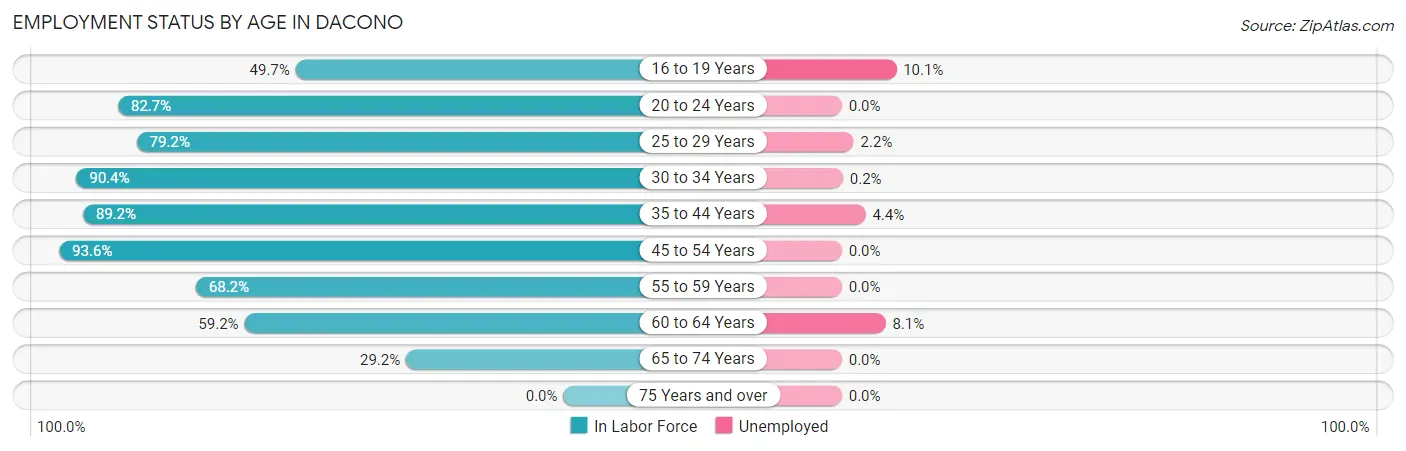
| Age Bracket | In Labor Force | Unemployed |
| 16 to 19 Years | 89 (49.7%) | 9 (10.1%) |
| 20 to 24 Years | 139 (82.7%) | 0 (0.0%) |
| 25 to 29 Years | 511 (79.2%) | 11 (2.2%) |
| 30 to 34 Years | 644 (90.4%) | 1 (0.2%) |
| 35 to 44 Years | 902 (89.2%) | 40 (4.4%) |
| 45 to 54 Years | 634 (93.6%) | 0 (0.0%) |
| 55 to 59 Years | 152 (68.2%) | 0 (0.0%) |
| 60 to 64 Years | 161 (59.2%) | 13 (8.1%) |
| 65 to 74 Years | 119 (29.2%) | 0 (0.0%) |
| 75 Years and over | 0 (0.0%) | 0 (0.0%) |
| Total | 3,350 (76.0%) | 74 (2.2%) |
Employment Status by Educational Attainment in Dacono
According to labor force statistics for Dacono, 84.9% of individuals (3,005) out of the total population between 25 and 64 years of age (3,540) are in the labor force, with 2.2% or 66 of them being unemployed. The group with the highest labor force participation rate are those with the educational attainment of bachelor's degree or higher, with 92.9% or 1,031 individuals in the labor force. Within the labor force, individuals with less than high school education have the highest percentage of unemployment, with 6.6% or 13 of them being unemployed.
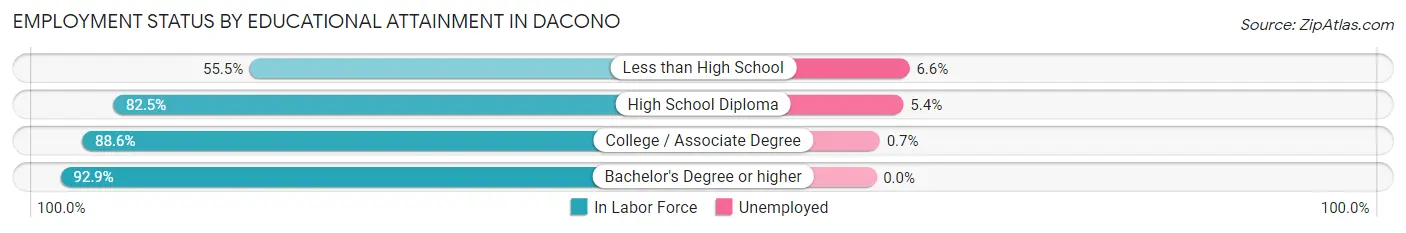
| Educational Attainment | In Labor Force | Unemployed |
| Less than High School | 198 (55.5%) | 24 (6.6%) |
| High School Diploma | 828 (82.5%) | 54 (5.4%) |
| College / Associate Degree | 947 (88.6%) | 7 (0.7%) |
| Bachelor's Degree or higher | 1,031 (92.9%) | 0 (0.0%) |
| Total | 3,005 (84.9%) | 78 (2.2%) |
Employment Occupations by Sex in Dacono
Management, Business, Science and Arts Occupations
The most common Management, Business, Science and Arts occupations in Dacono are Health Diagnosing & Treating (259 | 7.9%), Management (253 | 7.7%), Community & Social Service (225 | 6.9%), Computers, Engineering & Science (201 | 6.1%), and Business & Financial (200 | 6.1%).
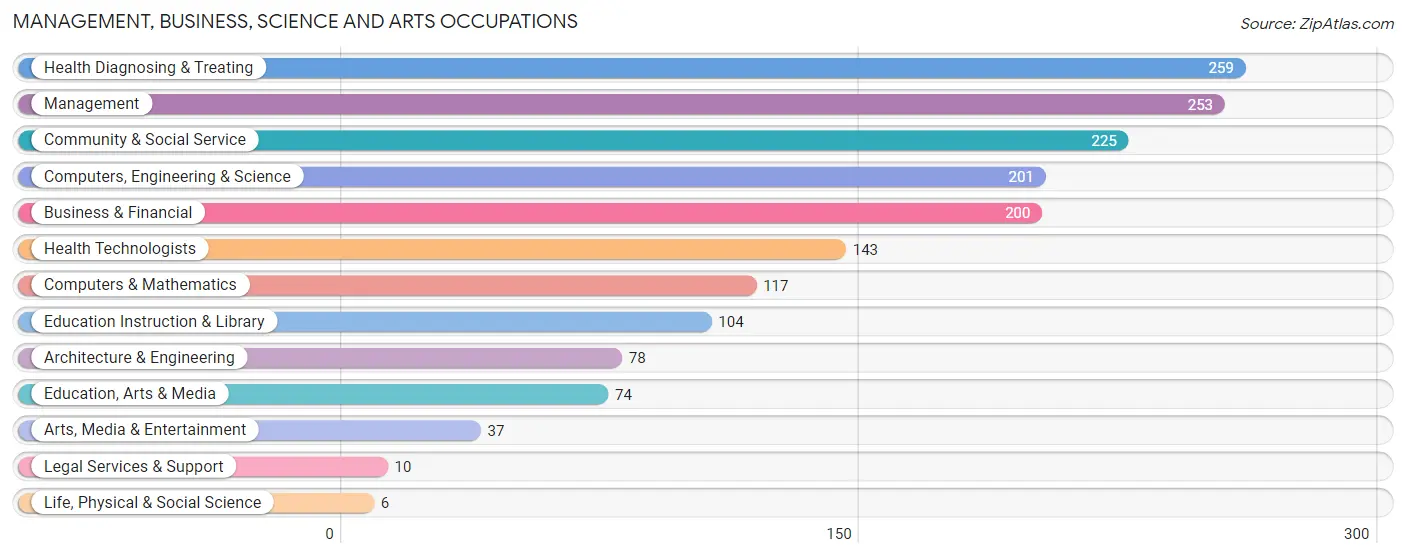
Management, Business, Science and Arts Occupations by Sex
Within the Management, Business, Science and Arts occupations in Dacono, the most male-oriented occupations are Life, Physical & Social Science (100.0%), Legal Services & Support (100.0%), and Arts, Media & Entertainment (100.0%), while the most female-oriented occupations are Health Technologists (95.8%), Education, Arts & Media (90.5%), and Health Diagnosing & Treating (63.7%).
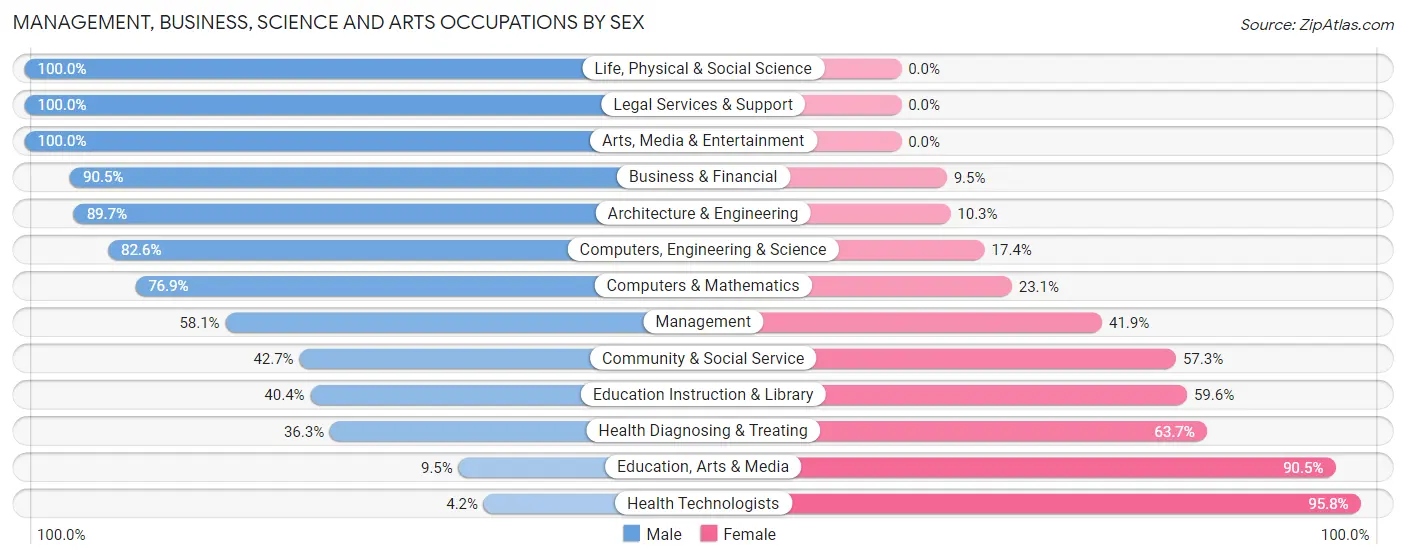
| Occupation | Male | Female |
| Management | 147 (58.1%) | 106 (41.9%) |
| Business & Financial | 181 (90.5%) | 19 (9.5%) |
| Computers, Engineering & Science | 166 (82.6%) | 35 (17.4%) |
| Computers & Mathematics | 90 (76.9%) | 27 (23.1%) |
| Architecture & Engineering | 70 (89.7%) | 8 (10.3%) |
| Life, Physical & Social Science | 6 (100.0%) | 0 (0.0%) |
| Community & Social Service | 96 (42.7%) | 129 (57.3%) |
| Education, Arts & Media | 7 (9.5%) | 67 (90.5%) |
| Legal Services & Support | 10 (100.0%) | 0 (0.0%) |
| Education Instruction & Library | 42 (40.4%) | 62 (59.6%) |
| Arts, Media & Entertainment | 37 (100.0%) | 0 (0.0%) |
| Health Diagnosing & Treating | 94 (36.3%) | 165 (63.7%) |
| Health Technologists | 6 (4.2%) | 137 (95.8%) |
| Total (Category) | 684 (60.1%) | 454 (39.9%) |
| Total (Overall) | 2,021 (61.7%) | 1,256 (38.3%) |
Services Occupations
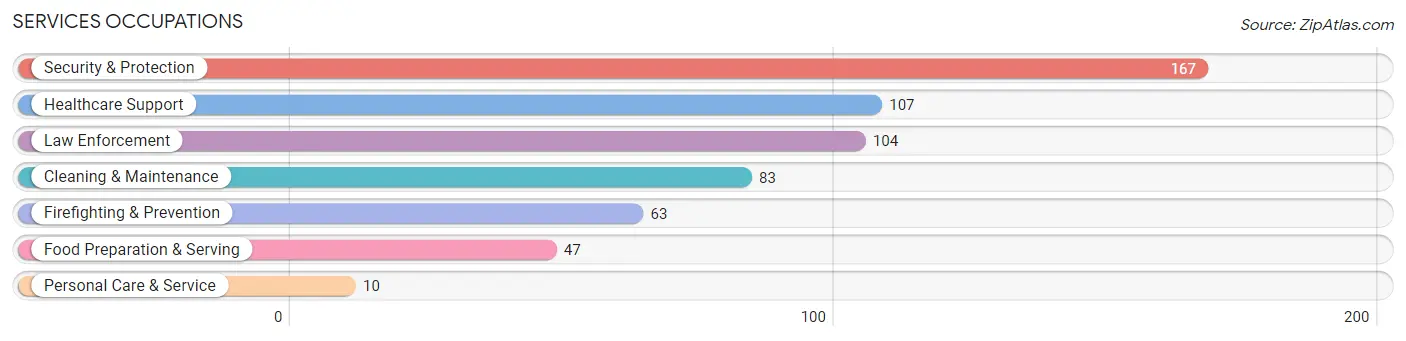
The most common Services occupations in Dacono are Security & Protection (167 | 5.1%), Healthcare Support (107 | 3.3%), Law Enforcement (104 | 3.2%), Cleaning & Maintenance (83 | 2.5%), and Firefighting & Prevention (63 | 1.9%).
Services Occupations by Sex
Within the Services occupations in Dacono, the most male-oriented occupations are Law Enforcement (100.0%), Security & Protection (91.0%), and Food Preparation & Serving (87.2%), while the most female-oriented occupations are Healthcare Support (100.0%), Cleaning & Maintenance (71.1%), and Personal Care & Service (40.0%).
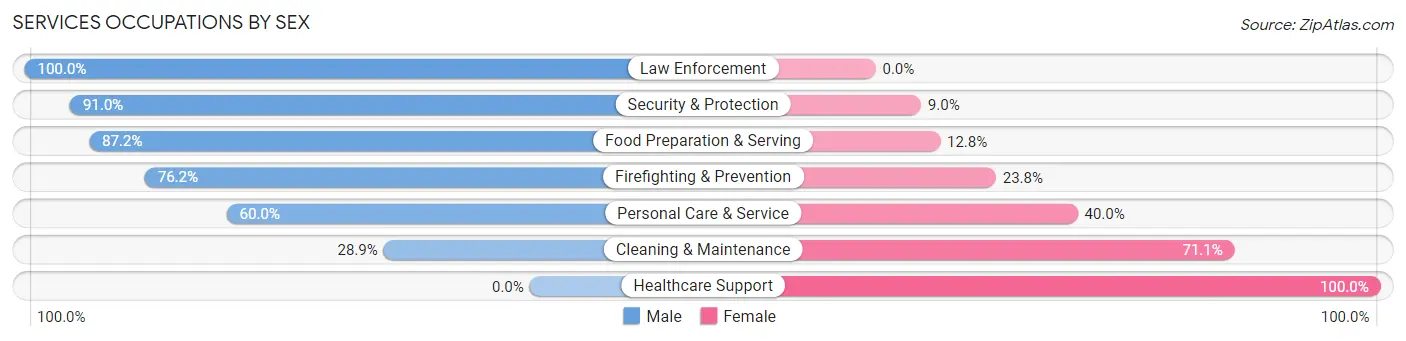
| Occupation | Male | Female |
| Healthcare Support | 0 (0.0%) | 107 (100.0%) |
| Security & Protection | 152 (91.0%) | 15 (9.0%) |
| Firefighting & Prevention | 48 (76.2%) | 15 (23.8%) |
| Law Enforcement | 104 (100.0%) | 0 (0.0%) |
| Food Preparation & Serving | 41 (87.2%) | 6 (12.8%) |
| Cleaning & Maintenance | 24 (28.9%) | 59 (71.1%) |
| Personal Care & Service | 6 (60.0%) | 4 (40.0%) |
| Total (Category) | 223 (53.9%) | 191 (46.1%) |
| Total (Overall) | 2,021 (61.7%) | 1,256 (38.3%) |
Sales and Office Occupations
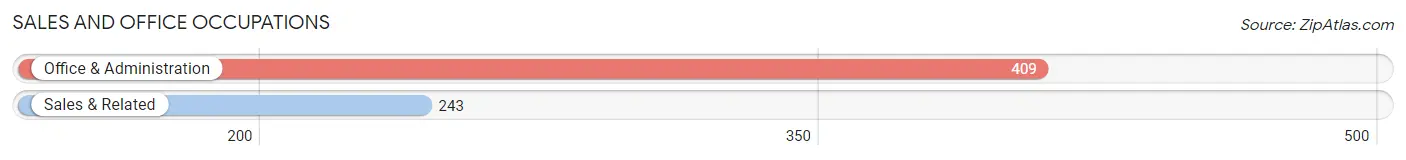
The most common Sales and Office occupations in Dacono are Office & Administration (409 | 12.5%), and Sales & Related (243 | 7.4%).
Sales and Office Occupations by Sex
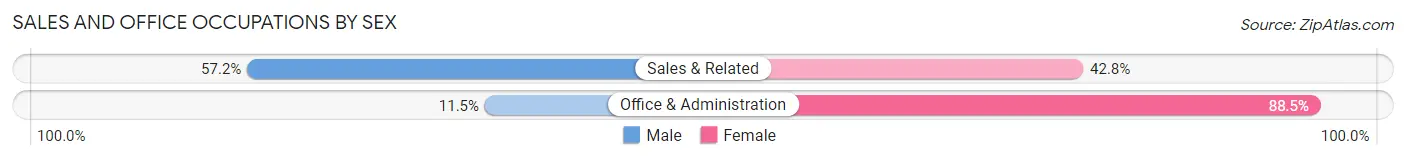
| Occupation | Male | Female |
| Sales & Related | 139 (57.2%) | 104 (42.8%) |
| Office & Administration | 47 (11.5%) | 362 (88.5%) |
| Total (Category) | 186 (28.5%) | 466 (71.5%) |
| Total (Overall) | 2,021 (61.7%) | 1,256 (38.3%) |
Natural Resources, Construction and Maintenance Occupations
The most common Natural Resources, Construction and Maintenance occupations in Dacono are Construction & Extraction (257 | 7.8%), and Installation, Maintenance & Repair (145 | 4.4%).
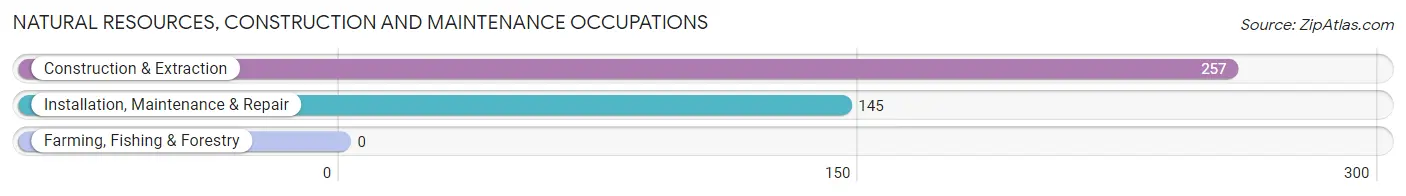
Natural Resources, Construction and Maintenance Occupations by Sex
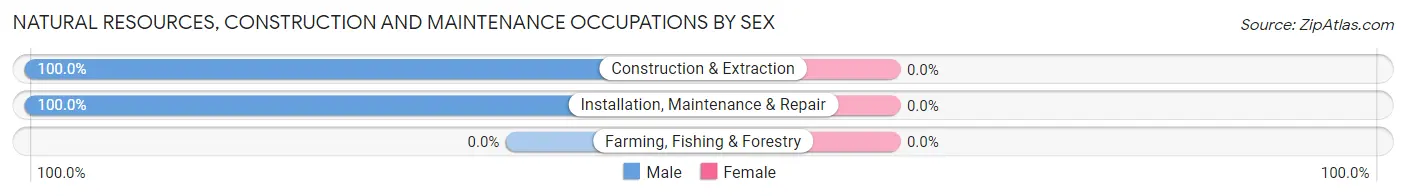
| Occupation | Male | Female |
| Farming, Fishing & Forestry | 0 (0.0%) | 0 (0.0%) |
| Construction & Extraction | 257 (100.0%) | 0 (0.0%) |
| Installation, Maintenance & Repair | 145 (100.0%) | 0 (0.0%) |
| Total (Category) | 402 (100.0%) | 0 (0.0%) |
| Total (Overall) | 2,021 (61.7%) | 1,256 (38.3%) |
Production, Transportation and Moving Occupations
The most common Production, Transportation and Moving occupations in Dacono are Material Moving (288 | 8.8%), Production (206 | 6.3%), and Transportation (177 | 5.4%).
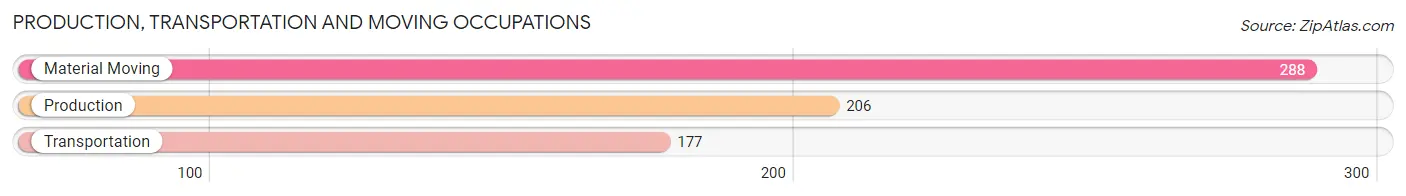
Production, Transportation and Moving Occupations by Sex
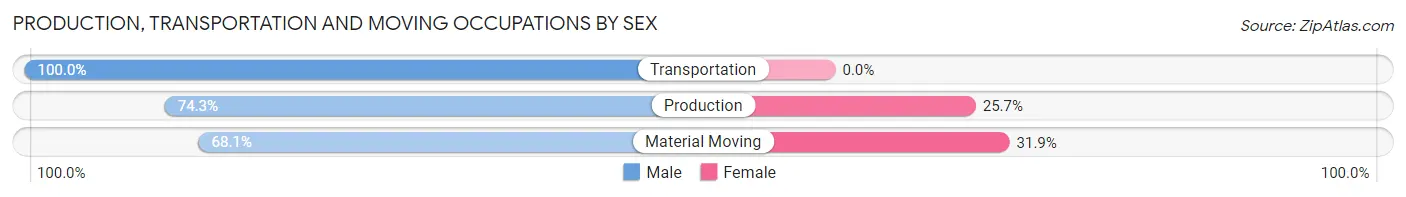
| Occupation | Male | Female |
| Production | 153 (74.3%) | 53 (25.7%) |
| Transportation | 177 (100.0%) | 0 (0.0%) |
| Material Moving | 196 (68.1%) | 92 (31.9%) |
| Total (Category) | 526 (78.4%) | 145 (21.6%) |
| Total (Overall) | 2,021 (61.7%) | 1,256 (38.3%) |
Employment Industries by Sex in Dacono
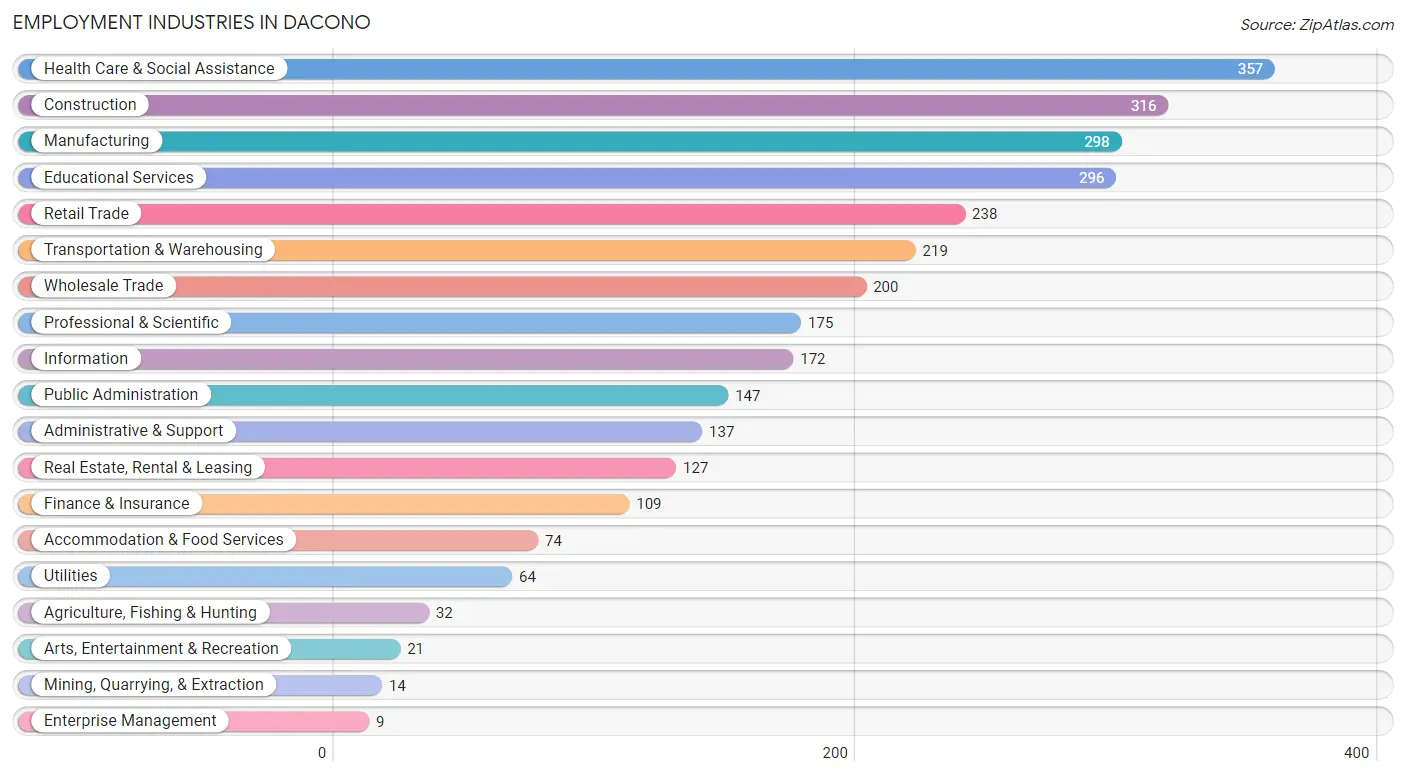
Employment Industries in Dacono
The major employment industries in Dacono include Health Care & Social Assistance (357 | 10.9%), Construction (316 | 9.6%), Manufacturing (298 | 9.1%), Educational Services (296 | 9.0%), and Retail Trade (238 | 7.3%).
Employment Industries by Sex in Dacono
The Dacono industries that see more men than women are Mining, Quarrying, & Extraction (100.0%), Utilities (100.0%), and Construction (93.7%), whereas the industries that tend to have a higher number of women are Agriculture, Fishing & Hunting (100.0%), Enterprise Management (100.0%), and Health Care & Social Assistance (89.6%).
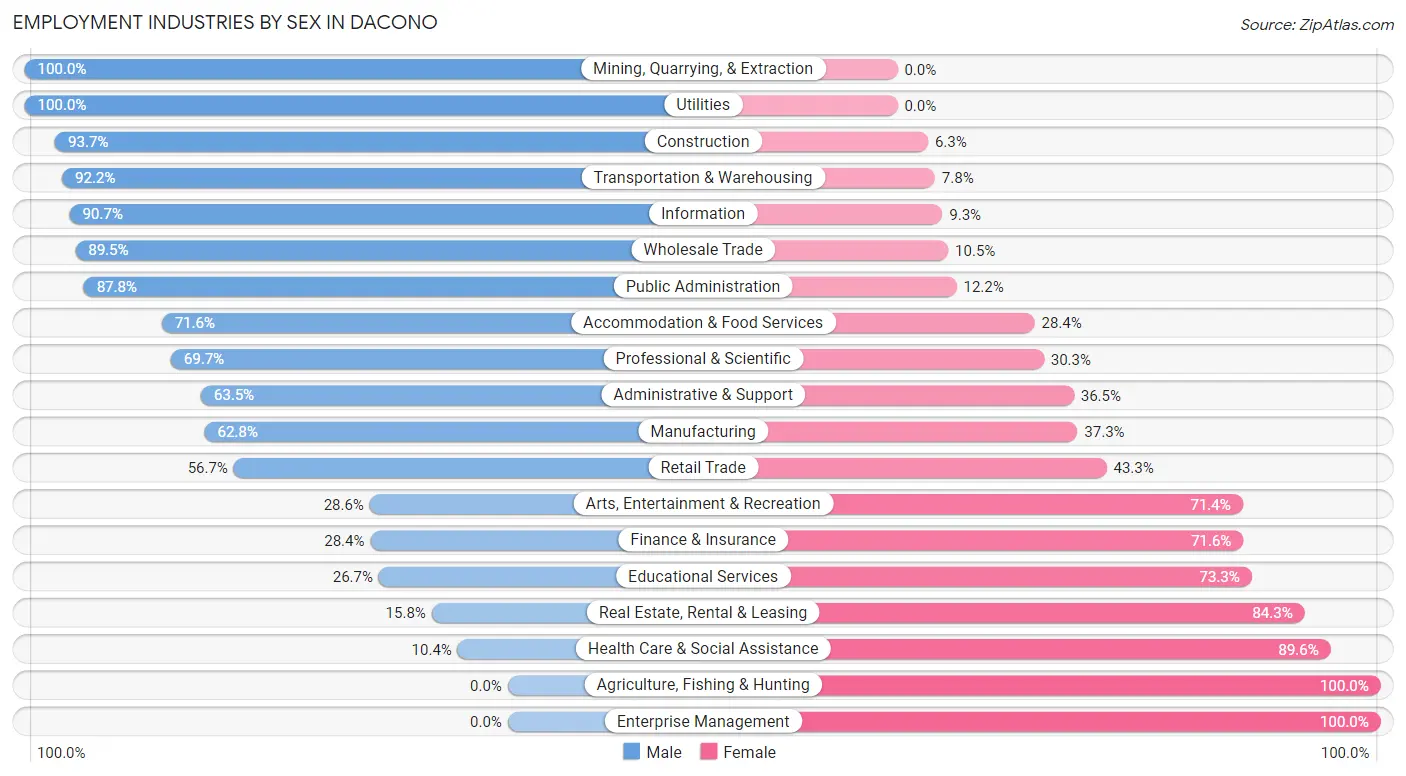
| Industry | Male | Female |
| Agriculture, Fishing & Hunting | 0 (0.0%) | 32 (100.0%) |
| Mining, Quarrying, & Extraction | 14 (100.0%) | 0 (0.0%) |
| Construction | 296 (93.7%) | 20 (6.3%) |
| Manufacturing | 187 (62.7%) | 111 (37.2%) |
| Wholesale Trade | 179 (89.5%) | 21 (10.5%) |
| Retail Trade | 135 (56.7%) | 103 (43.3%) |
| Transportation & Warehousing | 202 (92.2%) | 17 (7.8%) |
| Utilities | 64 (100.0%) | 0 (0.0%) |
| Information | 156 (90.7%) | 16 (9.3%) |
| Finance & Insurance | 31 (28.4%) | 78 (71.6%) |
| Real Estate, Rental & Leasing | 20 (15.8%) | 107 (84.3%) |
| Professional & Scientific | 122 (69.7%) | 53 (30.3%) |
| Enterprise Management | 0 (0.0%) | 9 (100.0%) |
| Administrative & Support | 87 (63.5%) | 50 (36.5%) |
| Educational Services | 79 (26.7%) | 217 (73.3%) |
| Health Care & Social Assistance | 37 (10.4%) | 320 (89.6%) |
| Arts, Entertainment & Recreation | 6 (28.6%) | 15 (71.4%) |
| Accommodation & Food Services | 53 (71.6%) | 21 (28.4%) |
| Public Administration | 129 (87.8%) | 18 (12.2%) |
| Total | 2,021 (61.7%) | 1,256 (38.3%) |
Education in Dacono
School Enrollment in Dacono
The most common levels of schooling among the 1,493 students in Dacono are elementary school (433 | 29.0%), middle school (420 | 28.1%), and high school (222 | 14.9%).
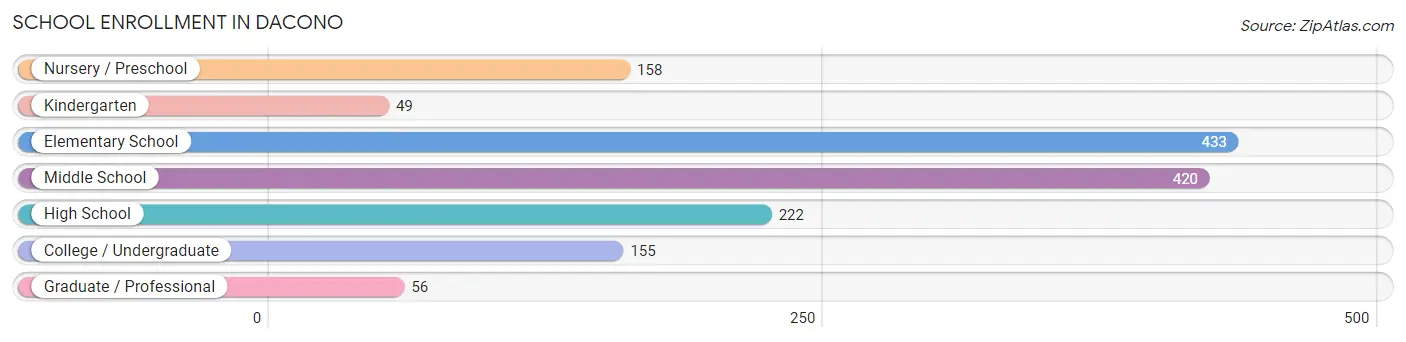
| School Level | # Students | % Students |
| Nursery / Preschool | 158 | 10.6% |
| Kindergarten | 49 | 3.3% |
| Elementary School | 433 | 29.0% |
| Middle School | 420 | 28.1% |
| High School | 222 | 14.9% |
| College / Undergraduate | 155 | 10.4% |
| Graduate / Professional | 56 | 3.7% |
| Total | 1,493 | 100.0% |
School Enrollment by Age by Funding Source in Dacono
Out of a total of 1,493 students who are enrolled in schools in Dacono, 225 (15.1%) attend a private institution, while the remaining 1,268 (84.9%) are enrolled in public schools. The age group of 3 to 4 year olds has the highest likelihood of being enrolled in private schools, with 108 (73.0% in the age bracket) enrolled. Conversely, the age group of 18 to 19 year olds has the lowest likelihood of being enrolled in a private school, with 38 (100.0% in the age bracket) attending a public institution.
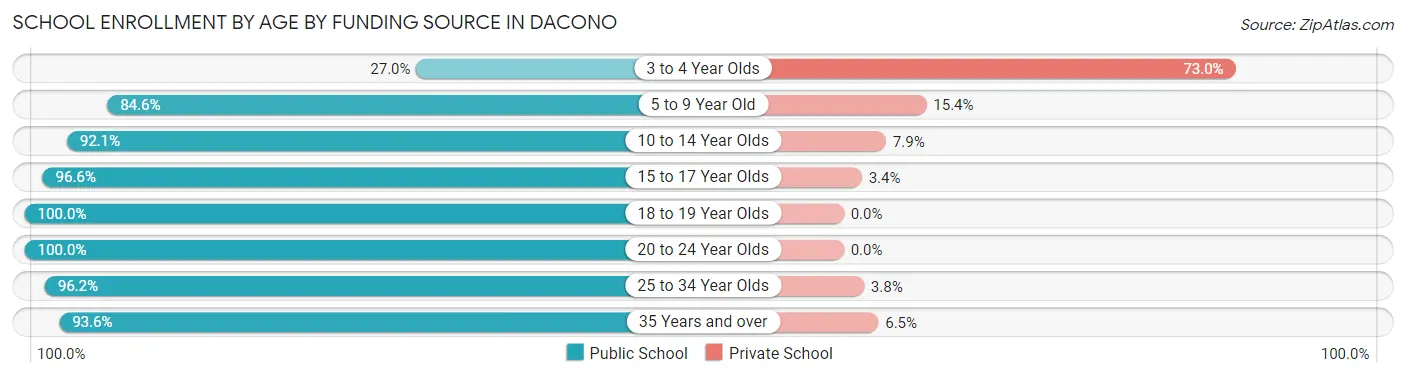
| Age Bracket | Public School | Private School |
| 3 to 4 Year Olds | 40 (27.0%) | 108 (73.0%) |
| 5 to 9 Year Old | 346 (84.6%) | 63 (15.4%) |
| 10 to 14 Year Olds | 492 (92.1%) | 42 (7.9%) |
| 15 to 17 Year Olds | 144 (96.6%) | 5 (3.4%) |
| 18 to 19 Year Olds | 38 (100.0%) | 0 (0.0%) |
| 20 to 24 Year Olds | 47 (100.0%) | 0 (0.0%) |
| 25 to 34 Year Olds | 102 (96.2%) | 4 (3.8%) |
| 35 Years and over | 58 (93.5%) | 4 (6.5%) |
| Total | 1,268 (84.9%) | 225 (15.1%) |
Educational Attainment by Field of Study in Dacono
Business (326 | 25.5%), science & technology (203 | 15.9%), arts & humanities (154 | 12.0%), literature & languages (107 | 8.4%), and bio, nature & agricultural (84 | 6.6%) are the most common fields of study among 1,280 individuals in Dacono who have obtained a bachelor's degree or higher.
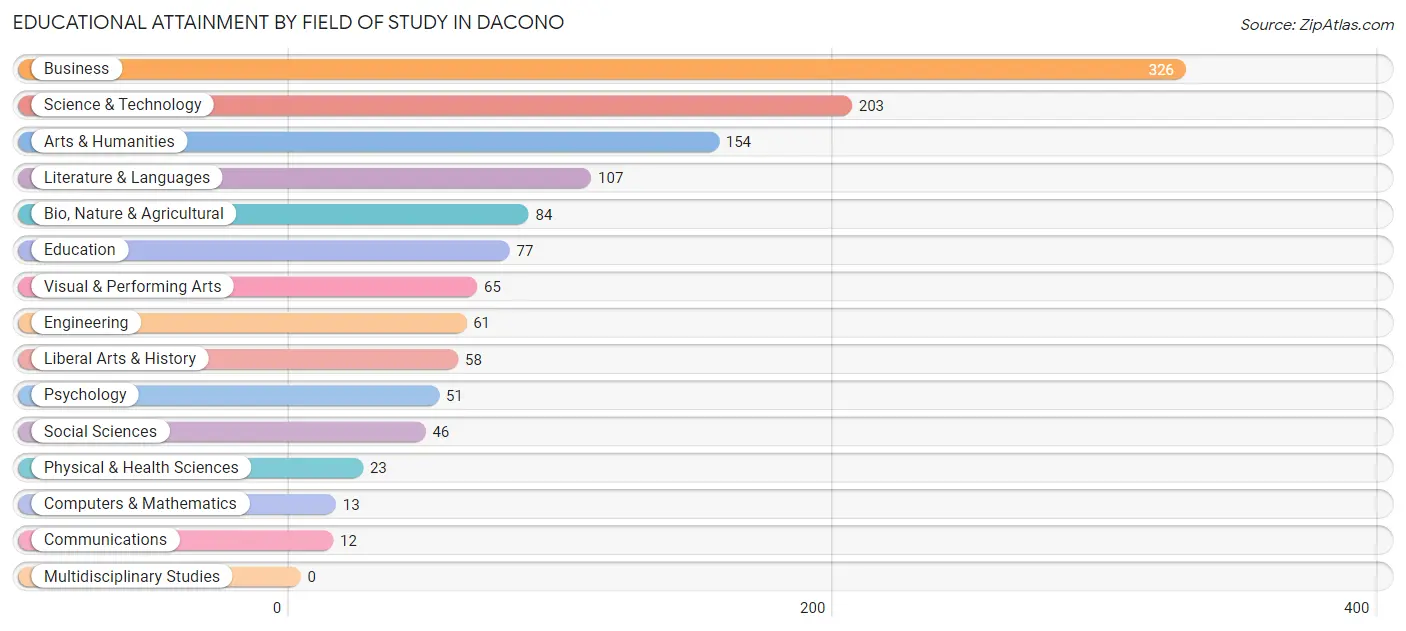
| Field of Study | # Graduates | % Graduates |
| Computers & Mathematics | 13 | 1.0% |
| Bio, Nature & Agricultural | 84 | 6.6% |
| Physical & Health Sciences | 23 | 1.8% |
| Psychology | 51 | 4.0% |
| Social Sciences | 46 | 3.6% |
| Engineering | 61 | 4.8% |
| Multidisciplinary Studies | 0 | 0.0% |
| Science & Technology | 203 | 15.9% |
| Business | 326 | 25.5% |
| Education | 77 | 6.0% |
| Literature & Languages | 107 | 8.4% |
| Liberal Arts & History | 58 | 4.5% |
| Visual & Performing Arts | 65 | 5.1% |
| Communications | 12 | 0.9% |
| Arts & Humanities | 154 | 12.0% |
| Total | 1,280 | 100.0% |
Transportation & Commute in Dacono
Vehicle Availability by Sex in Dacono
The most prevalent vehicle ownership categories in Dacono are males with 2 vehicles (978, accounting for 48.7%) and females with 2 vehicles (569, making up 79.4%).
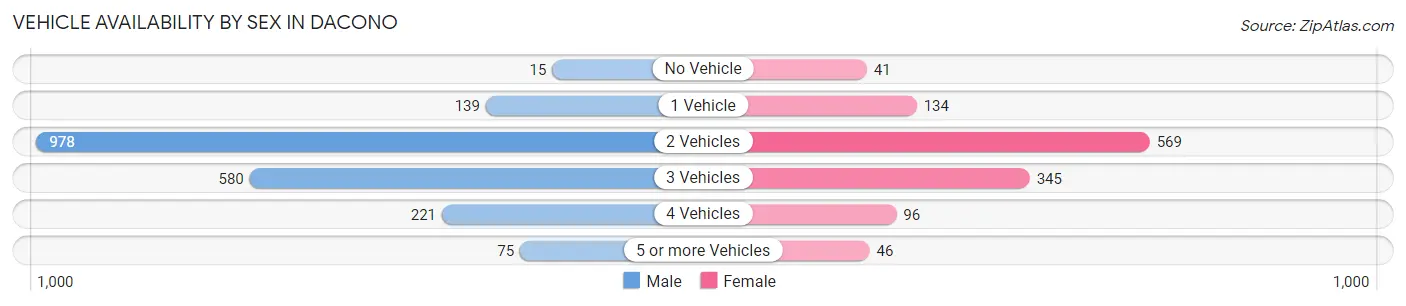
| Vehicles Available | Male | Female |
| No Vehicle | 15 (0.7%) | 41 (3.3%) |
| 1 Vehicle | 139 (6.9%) | 134 (10.9%) |
| 2 Vehicles | 978 (48.7%) | 569 (46.2%) |
| 3 Vehicles | 580 (28.9%) | 345 (28.0%) |
| 4 Vehicles | 221 (11.0%) | 96 (7.8%) |
| 5 or more Vehicles | 75 (3.7%) | 46 (3.7%) |
| Total | 2,008 (100.0%) | 1,231 (100.0%) |
Commute Time in Dacono
The most frequently occuring commute durations in Dacono are 30 to 34 minutes (695 commuters, 25.3%), 20 to 24 minutes (341 commuters, 12.4%), and 45 to 59 minutes (315 commuters, 11.5%).
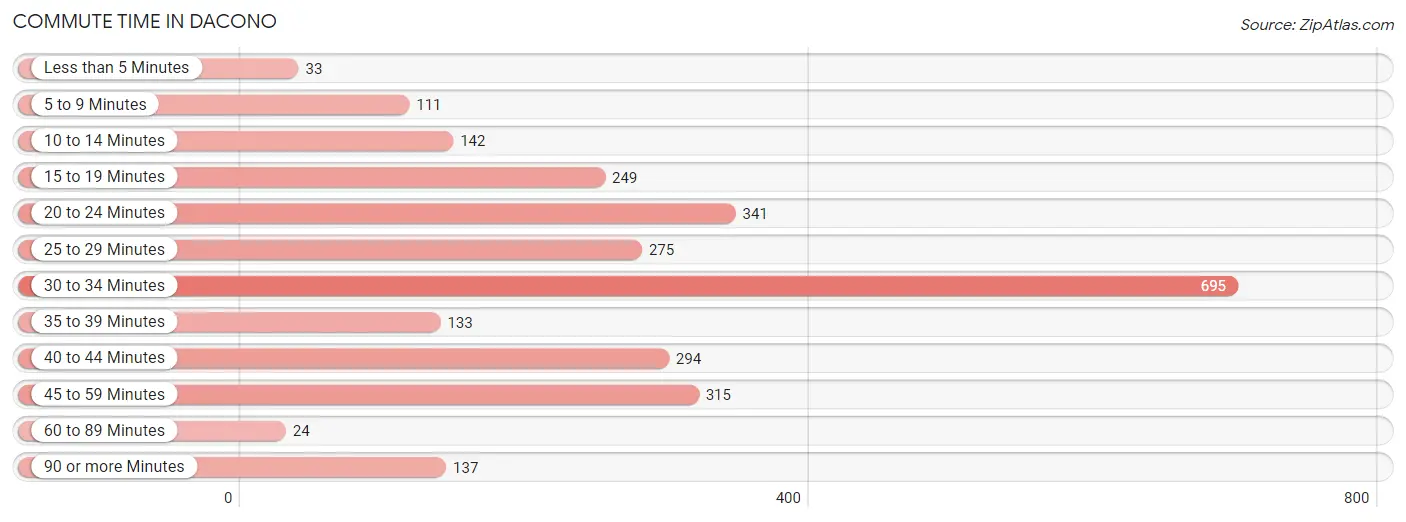
| Commute Time | # Commuters | % Commuters |
| Less than 5 Minutes | 33 | 1.2% |
| 5 to 9 Minutes | 111 | 4.0% |
| 10 to 14 Minutes | 142 | 5.2% |
| 15 to 19 Minutes | 249 | 9.1% |
| 20 to 24 Minutes | 341 | 12.4% |
| 25 to 29 Minutes | 275 | 10.0% |
| 30 to 34 Minutes | 695 | 25.3% |
| 35 to 39 Minutes | 133 | 4.8% |
| 40 to 44 Minutes | 294 | 10.7% |
| 45 to 59 Minutes | 315 | 11.5% |
| 60 to 89 Minutes | 24 | 0.9% |
| 90 or more Minutes | 137 | 5.0% |
Commute Time by Sex in Dacono
The most common commute times in Dacono are 30 to 34 minutes (421 commuters, 25.1%) for males and 30 to 34 minutes (274 commuters, 25.6%) for females.
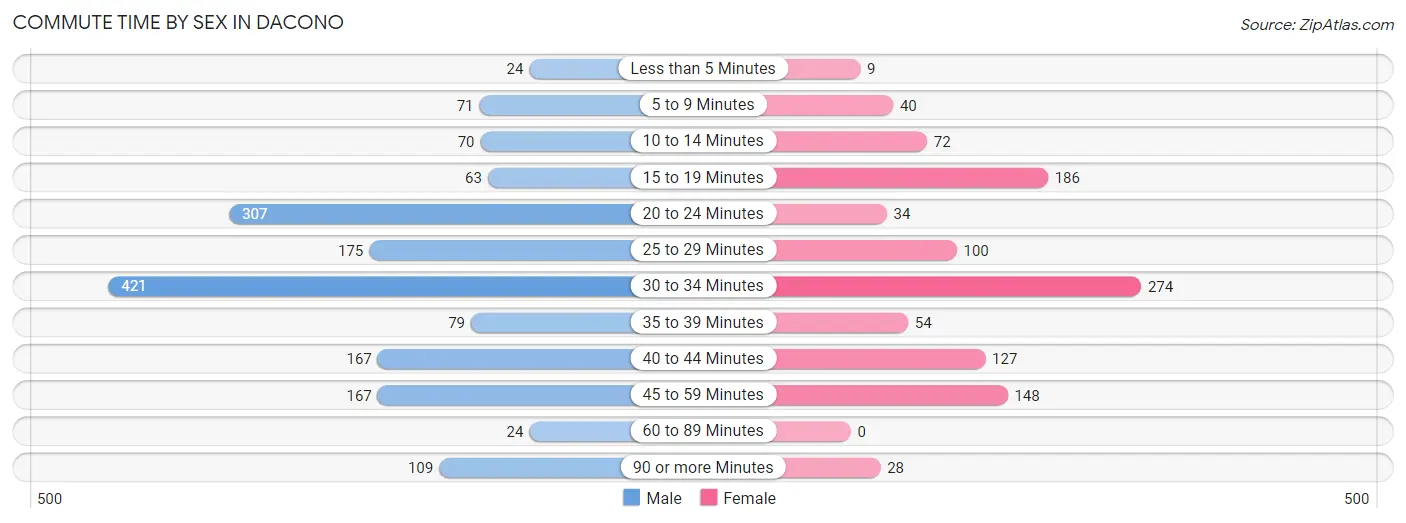
| Commute Time | Male | Female |
| Less than 5 Minutes | 24 (1.4%) | 9 (0.8%) |
| 5 to 9 Minutes | 71 (4.2%) | 40 (3.7%) |
| 10 to 14 Minutes | 70 (4.2%) | 72 (6.7%) |
| 15 to 19 Minutes | 63 (3.8%) | 186 (17.3%) |
| 20 to 24 Minutes | 307 (18.3%) | 34 (3.2%) |
| 25 to 29 Minutes | 175 (10.4%) | 100 (9.3%) |
| 30 to 34 Minutes | 421 (25.1%) | 274 (25.6%) |
| 35 to 39 Minutes | 79 (4.7%) | 54 (5.0%) |
| 40 to 44 Minutes | 167 (10.0%) | 127 (11.8%) |
| 45 to 59 Minutes | 167 (10.0%) | 148 (13.8%) |
| 60 to 89 Minutes | 24 (1.4%) | 0 (0.0%) |
| 90 or more Minutes | 109 (6.5%) | 28 (2.6%) |
Time of Departure to Work by Sex in Dacono
The most frequent times of departure to work in Dacono are 5:30 AM to 5:59 AM (289, 17.2%) for males and 6:30 AM to 6:59 AM (262, 24.4%) for females.
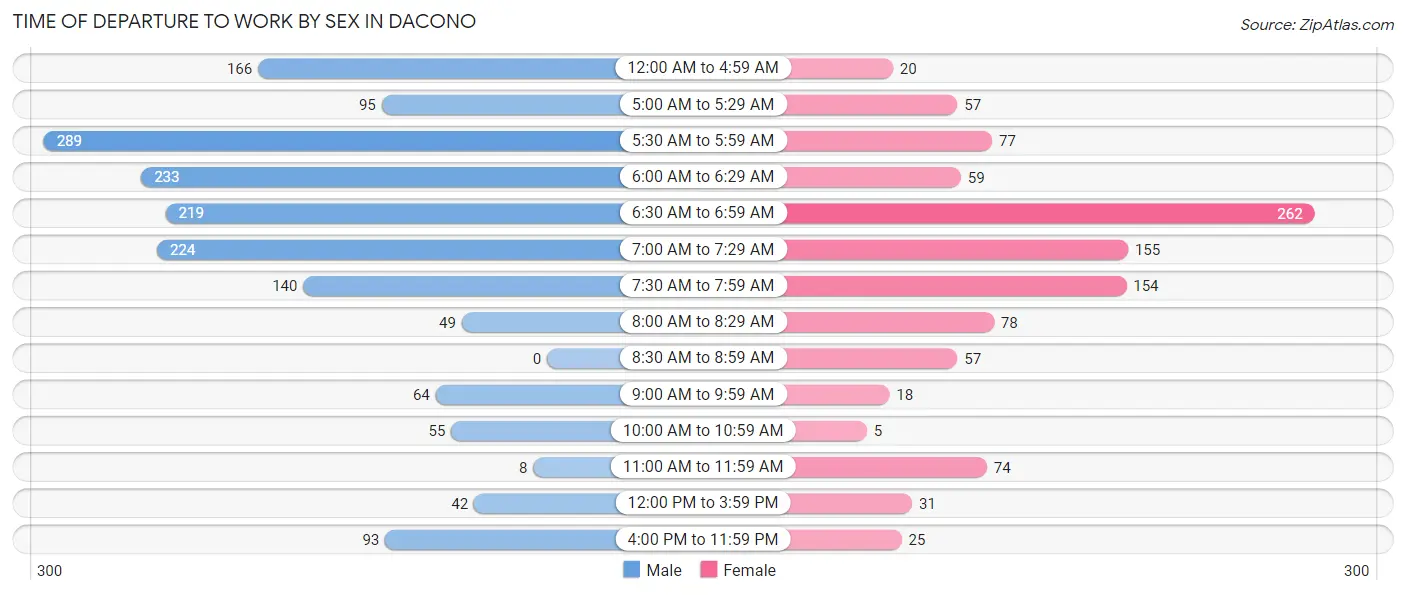
| Time of Departure | Male | Female |
| 12:00 AM to 4:59 AM | 166 (9.9%) | 20 (1.9%) |
| 5:00 AM to 5:29 AM | 95 (5.7%) | 57 (5.3%) |
| 5:30 AM to 5:59 AM | 289 (17.2%) | 77 (7.2%) |
| 6:00 AM to 6:29 AM | 233 (13.9%) | 59 (5.5%) |
| 6:30 AM to 6:59 AM | 219 (13.1%) | 262 (24.4%) |
| 7:00 AM to 7:29 AM | 224 (13.4%) | 155 (14.5%) |
| 7:30 AM to 7:59 AM | 140 (8.4%) | 154 (14.4%) |
| 8:00 AM to 8:29 AM | 49 (2.9%) | 78 (7.3%) |
| 8:30 AM to 8:59 AM | 0 (0.0%) | 57 (5.3%) |
| 9:00 AM to 9:59 AM | 64 (3.8%) | 18 (1.7%) |
| 10:00 AM to 10:59 AM | 55 (3.3%) | 5 (0.5%) |
| 11:00 AM to 11:59 AM | 8 (0.5%) | 74 (6.9%) |
| 12:00 PM to 3:59 PM | 42 (2.5%) | 31 (2.9%) |
| 4:00 PM to 11:59 PM | 93 (5.6%) | 25 (2.3%) |
| Total | 1,677 (100.0%) | 1,072 (100.0%) |
Housing Occupancy in Dacono
Occupancy by Ownership in Dacono
Of the total 2,118 dwellings in Dacono, owner-occupied units account for 1,617 (76.3%), while renter-occupied units make up 501 (23.6%).
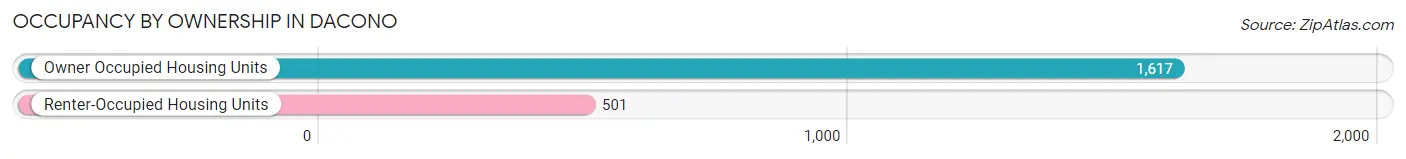
| Occupancy | # Housing Units | % Housing Units |
| Owner Occupied Housing Units | 1,617 | 76.3% |
| Renter-Occupied Housing Units | 501 | 23.6% |
| Total Occupied Housing Units | 2,118 | 100.0% |
Occupancy by Household Size in Dacono
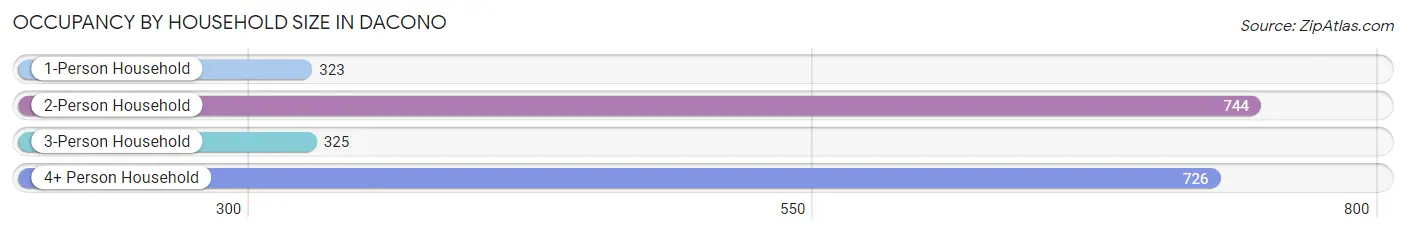
| Household Size | # Housing Units | % Housing Units |
| 1-Person Household | 323 | 15.2% |
| 2-Person Household | 744 | 35.1% |
| 3-Person Household | 325 | 15.3% |
| 4+ Person Household | 726 | 34.3% |
| Total Housing Units | 2,118 | 100.0% |
Occupancy by Ownership by Household Size in Dacono
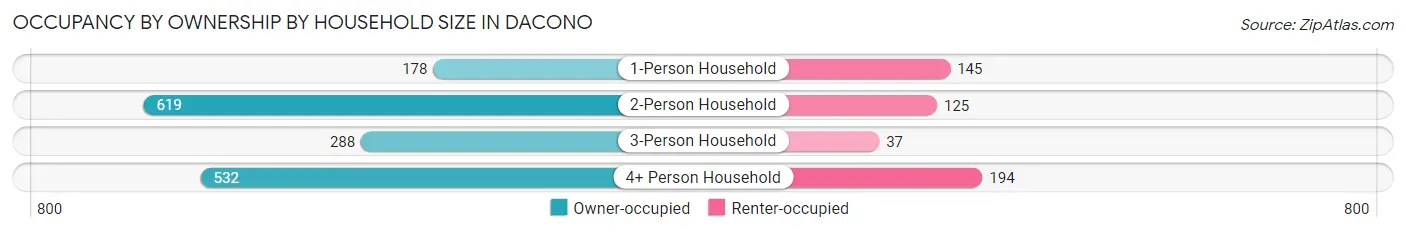
| Household Size | Owner-occupied | Renter-occupied |
| 1-Person Household | 178 (55.1%) | 145 (44.9%) |
| 2-Person Household | 619 (83.2%) | 125 (16.8%) |
| 3-Person Household | 288 (88.6%) | 37 (11.4%) |
| 4+ Person Household | 532 (73.3%) | 194 (26.7%) |
| Total Housing Units | 1,617 (76.3%) | 501 (23.6%) |
Occupancy by Educational Attainment in Dacono
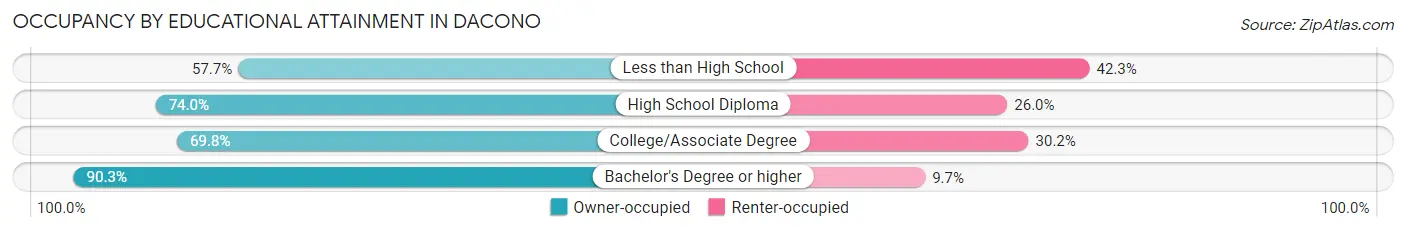
| Household Size | Owner-occupied | Renter-occupied |
| Less than High School | 120 (57.7%) | 88 (42.3%) |
| High School Diploma | 404 (74.0%) | 142 (26.0%) |
| College/Associate Degree | 471 (69.8%) | 204 (30.2%) |
| Bachelor's Degree or higher | 622 (90.3%) | 67 (9.7%) |
Occupancy by Age of Householder in Dacono
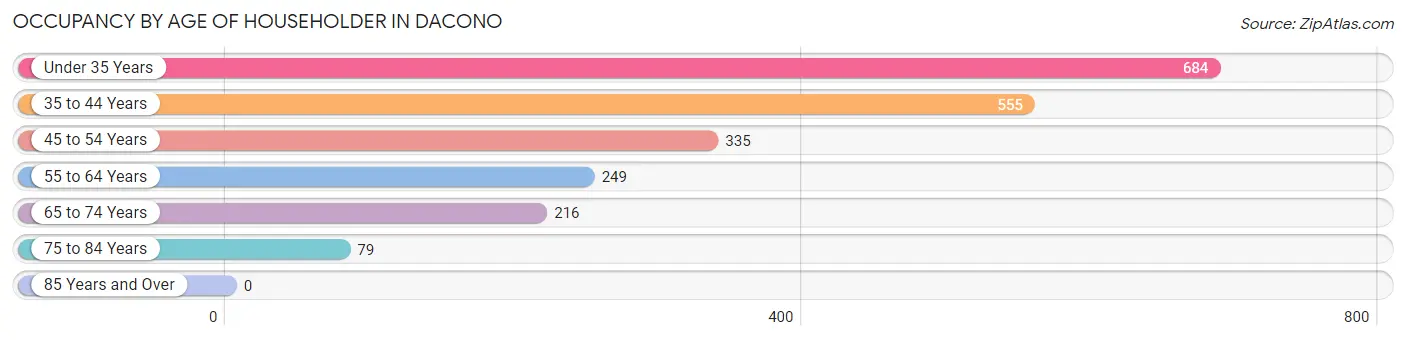
| Age Bracket | # Households | % Households |
| Under 35 Years | 684 | 32.3% |
| 35 to 44 Years | 555 | 26.2% |
| 45 to 54 Years | 335 | 15.8% |
| 55 to 64 Years | 249 | 11.8% |
| 65 to 74 Years | 216 | 10.2% |
| 75 to 84 Years | 79 | 3.7% |
| 85 Years and Over | 0 | 0.0% |
| Total | 2,118 | 100.0% |
Housing Finances in Dacono
Median Income by Occupancy in Dacono
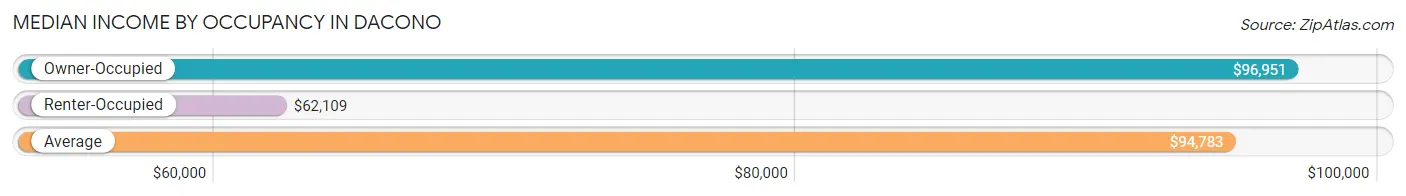
| Occupancy Type | # Households | Median Income |
| Owner-Occupied | 1,617 (76.3%) | $96,951 |
| Renter-Occupied | 501 (23.6%) | $62,109 |
| Average | 2,118 (100.0%) | $94,783 |
Occupancy by Householder Income Bracket in Dacono
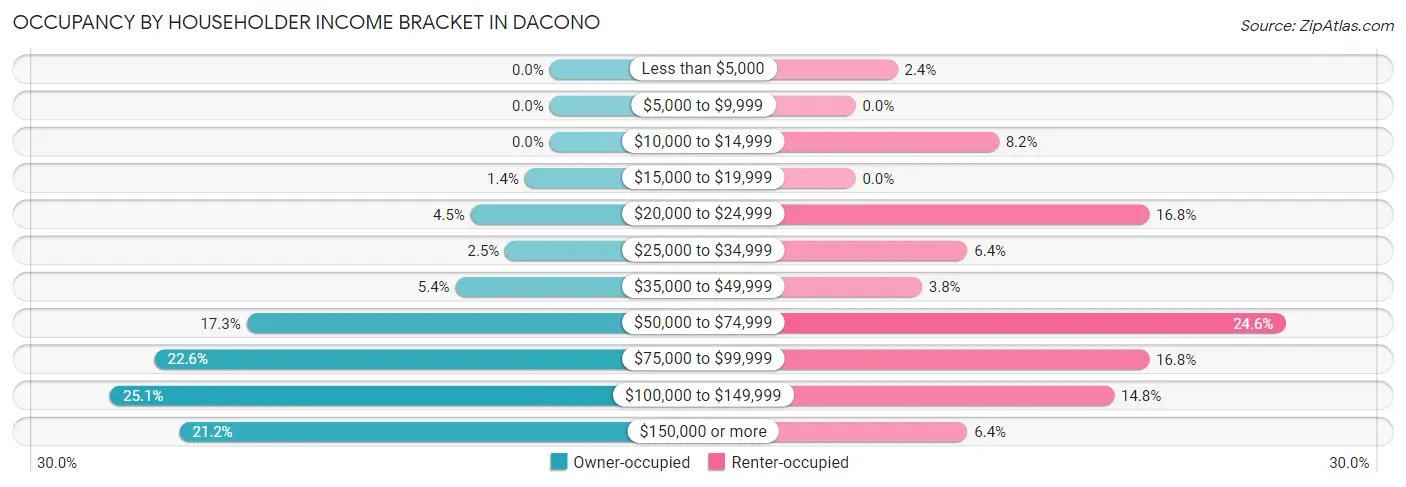
| Income Bracket | Owner-occupied | Renter-occupied |
| Less than $5,000 | 0 (0.0%) | 12 (2.4%) |
| $5,000 to $9,999 | 0 (0.0%) | 0 (0.0%) |
| $10,000 to $14,999 | 0 (0.0%) | 41 (8.2%) |
| $15,000 to $19,999 | 23 (1.4%) | 0 (0.0%) |
| $20,000 to $24,999 | 73 (4.5%) | 84 (16.8%) |
| $25,000 to $34,999 | 41 (2.5%) | 32 (6.4%) |
| $35,000 to $49,999 | 87 (5.4%) | 19 (3.8%) |
| $50,000 to $74,999 | 280 (17.3%) | 123 (24.5%) |
| $75,000 to $99,999 | 365 (22.6%) | 84 (16.8%) |
| $100,000 to $149,999 | 406 (25.1%) | 74 (14.8%) |
| $150,000 or more | 342 (21.1%) | 32 (6.4%) |
| Total | 1,617 (100.0%) | 501 (100.0%) |
Monthly Housing Cost Tiers in Dacono
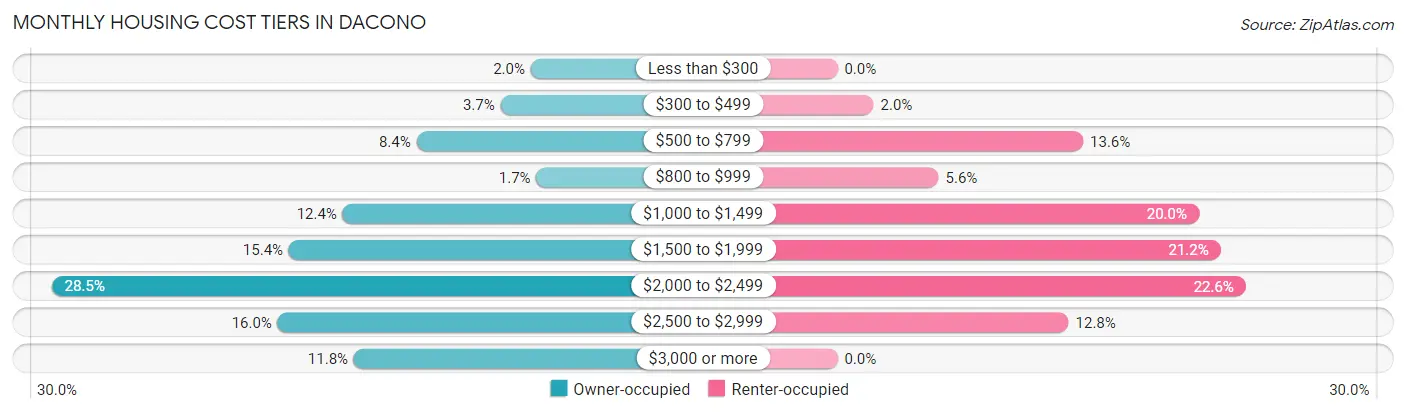
| Monthly Cost | Owner-occupied | Renter-occupied |
| Less than $300 | 33 (2.0%) | 0 (0.0%) |
| $300 to $499 | 60 (3.7%) | 10 (2.0%) |
| $500 to $799 | 135 (8.4%) | 68 (13.6%) |
| $800 to $999 | 28 (1.7%) | 28 (5.6%) |
| $1,000 to $1,499 | 201 (12.4%) | 100 (20.0%) |
| $1,500 to $1,999 | 249 (15.4%) | 106 (21.2%) |
| $2,000 to $2,499 | 461 (28.5%) | 113 (22.6%) |
| $2,500 to $2,999 | 259 (16.0%) | 64 (12.8%) |
| $3,000 or more | 191 (11.8%) | 0 (0.0%) |
| Total | 1,617 (100.0%) | 501 (100.0%) |
Physical Housing Characteristics in Dacono
Housing Structures in Dacono
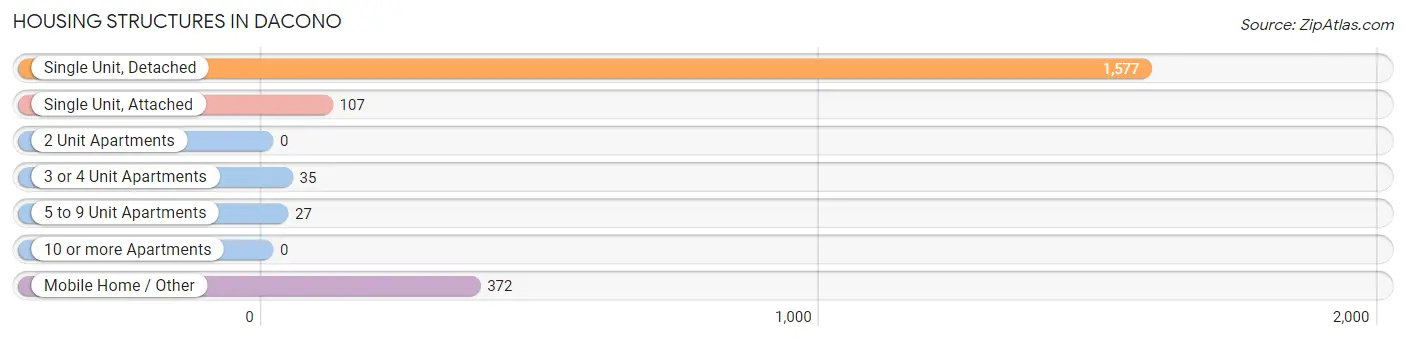
| Structure Type | # Housing Units | % Housing Units |
| Single Unit, Detached | 1,577 | 74.5% |
| Single Unit, Attached | 107 | 5.1% |
| 2 Unit Apartments | 0 | 0.0% |
| 3 or 4 Unit Apartments | 35 | 1.7% |
| 5 to 9 Unit Apartments | 27 | 1.3% |
| 10 or more Apartments | 0 | 0.0% |
| Mobile Home / Other | 372 | 17.6% |
| Total | 2,118 | 100.0% |
Housing Structures by Occupancy in Dacono
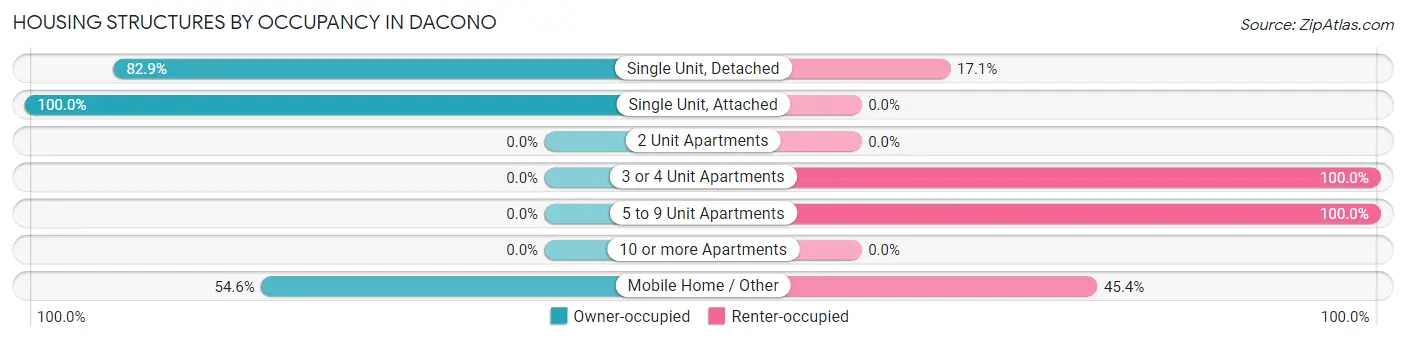
| Structure Type | Owner-occupied | Renter-occupied |
| Single Unit, Detached | 1,307 (82.9%) | 270 (17.1%) |
| Single Unit, Attached | 107 (100.0%) | 0 (0.0%) |
| 2 Unit Apartments | 0 (0.0%) | 0 (0.0%) |
| 3 or 4 Unit Apartments | 0 (0.0%) | 35 (100.0%) |
| 5 to 9 Unit Apartments | 0 (0.0%) | 27 (100.0%) |
| 10 or more Apartments | 0 (0.0%) | 0 (0.0%) |
| Mobile Home / Other | 203 (54.6%) | 169 (45.4%) |
| Total | 1,617 (76.3%) | 501 (23.6%) |
Housing Structures by Number of Rooms in Dacono
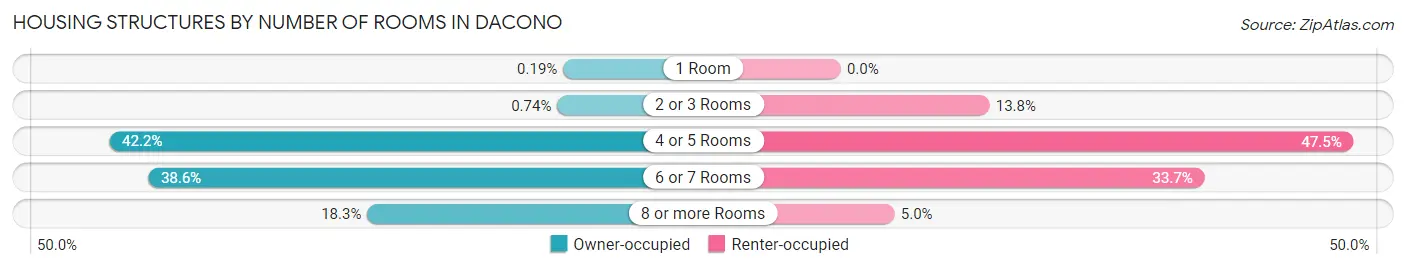
| Number of Rooms | Owner-occupied | Renter-occupied |
| 1 Room | 3 (0.2%) | 0 (0.0%) |
| 2 or 3 Rooms | 12 (0.7%) | 69 (13.8%) |
| 4 or 5 Rooms | 682 (42.2%) | 238 (47.5%) |
| 6 or 7 Rooms | 624 (38.6%) | 169 (33.7%) |
| 8 or more Rooms | 296 (18.3%) | 25 (5.0%) |
| Total | 1,617 (100.0%) | 501 (100.0%) |
Housing Structure by Heating Type in Dacono
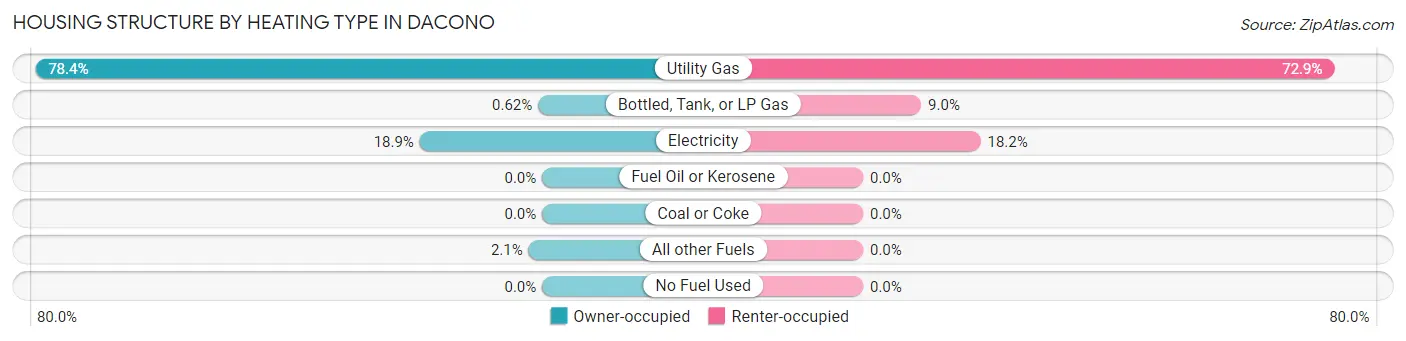
| Heating Type | Owner-occupied | Renter-occupied |
| Utility Gas | 1,267 (78.3%) | 365 (72.9%) |
| Bottled, Tank, or LP Gas | 10 (0.6%) | 45 (9.0%) |
| Electricity | 306 (18.9%) | 91 (18.2%) |
| Fuel Oil or Kerosene | 0 (0.0%) | 0 (0.0%) |
| Coal or Coke | 0 (0.0%) | 0 (0.0%) |
| All other Fuels | 34 (2.1%) | 0 (0.0%) |
| No Fuel Used | 0 (0.0%) | 0 (0.0%) |
| Total | 1,617 (100.0%) | 501 (100.0%) |
Household Vehicle Usage in Dacono
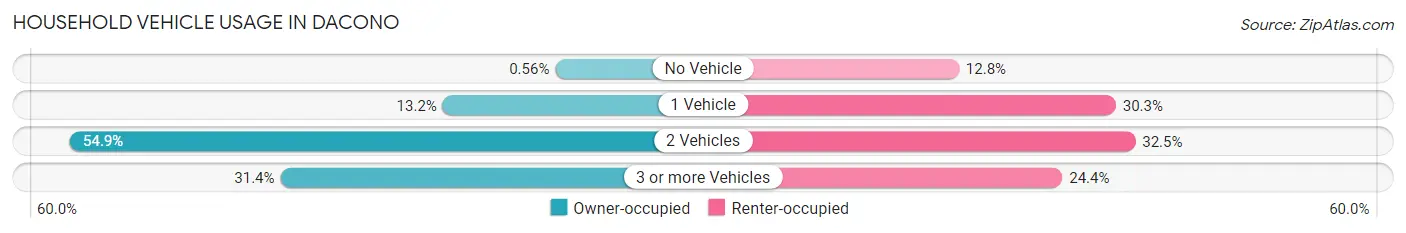
| Vehicles per Household | Owner-occupied | Renter-occupied |
| No Vehicle | 9 (0.6%) | 64 (12.8%) |
| 1 Vehicle | 213 (13.2%) | 152 (30.3%) |
| 2 Vehicles | 888 (54.9%) | 163 (32.5%) |
| 3 or more Vehicles | 507 (31.4%) | 122 (24.3%) |
| Total | 1,617 (100.0%) | 501 (100.0%) |
Real Estate & Mortgages in Dacono
Real Estate and Mortgage Overview in Dacono
| Characteristic | Without Mortgage | With Mortgage |
| Housing Units | 211 | 1,406 |
| Median Property Value | $322,300 | $430,100 |
| Median Household Income | $80,060 | $330 |
| Monthly Housing Costs | $520 | $191 |
| Real Estate Taxes | $1,779 | $0 |
Property Value by Mortgage Status in Dacono
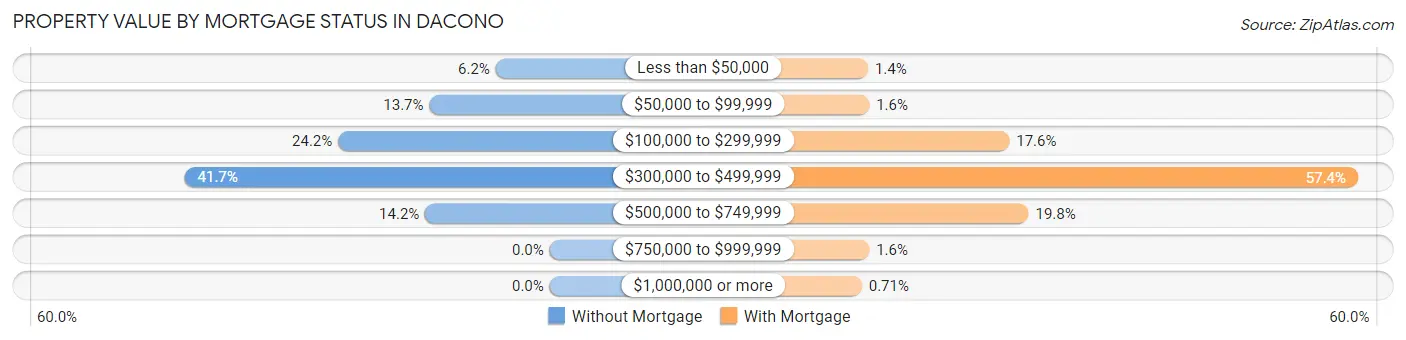
| Property Value | Without Mortgage | With Mortgage |
| Less than $50,000 | 13 (6.2%) | 20 (1.4%) |
| $50,000 to $99,999 | 29 (13.7%) | 22 (1.6%) |
| $100,000 to $299,999 | 51 (24.2%) | 247 (17.6%) |
| $300,000 to $499,999 | 88 (41.7%) | 807 (57.4%) |
| $500,000 to $749,999 | 30 (14.2%) | 278 (19.8%) |
| $750,000 to $999,999 | 0 (0.0%) | 22 (1.6%) |
| $1,000,000 or more | 0 (0.0%) | 10 (0.7%) |
| Total | 211 (100.0%) | 1,406 (100.0%) |
Household Income by Mortgage Status in Dacono
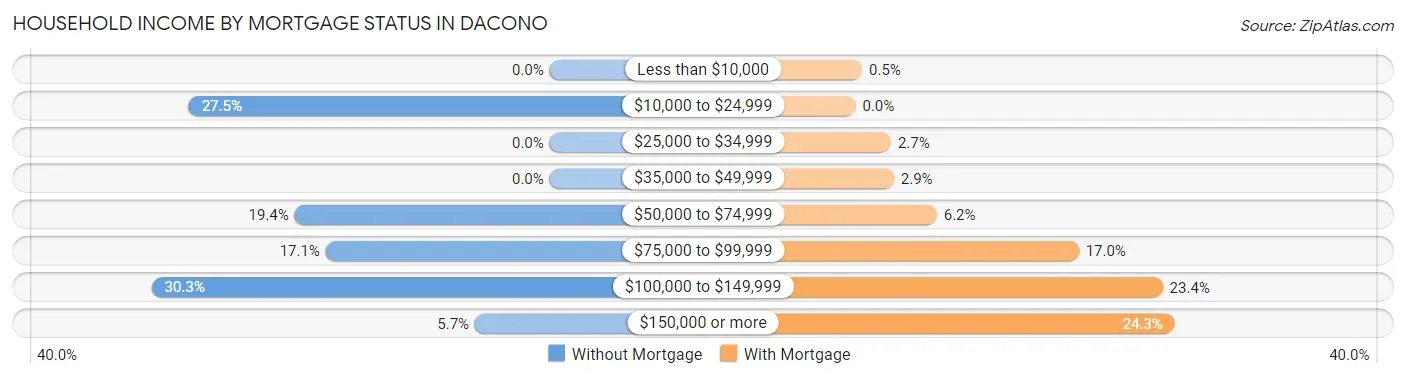
| Household Income | Without Mortgage | With Mortgage |
| Less than $10,000 | 0 (0.0%) | 7 (0.5%) |
| $10,000 to $24,999 | 58 (27.5%) | 0 (0.0%) |
| $25,000 to $34,999 | 0 (0.0%) | 38 (2.7%) |
| $35,000 to $49,999 | 0 (0.0%) | 41 (2.9%) |
| $50,000 to $74,999 | 41 (19.4%) | 87 (6.2%) |
| $75,000 to $99,999 | 36 (17.1%) | 239 (17.0%) |
| $100,000 to $149,999 | 64 (30.3%) | 329 (23.4%) |
| $150,000 or more | 12 (5.7%) | 342 (24.3%) |
| Total | 211 (100.0%) | 1,406 (100.0%) |
Property Value to Household Income Ratio in Dacono
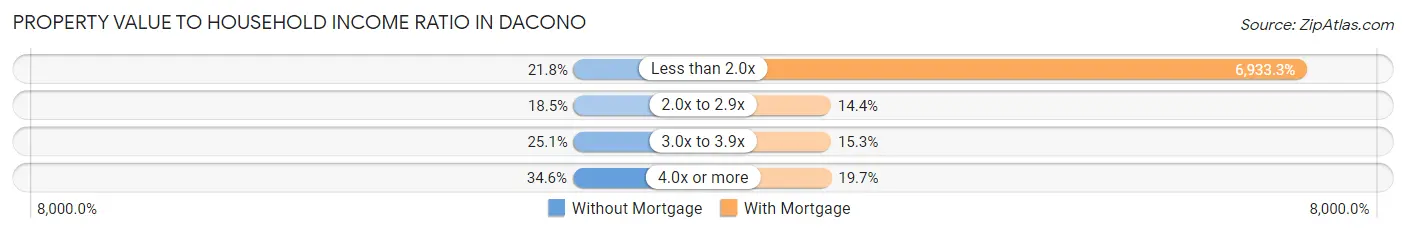
| Value-to-Income Ratio | Without Mortgage | With Mortgage |
| Less than 2.0x | 46 (21.8%) | 97,482 (6,933.3%) |
| 2.0x to 2.9x | 39 (18.5%) | 202 (14.4%) |
| 3.0x to 3.9x | 53 (25.1%) | 215 (15.3%) |
| 4.0x or more | 73 (34.6%) | 277 (19.7%) |
| Total | 211 (100.0%) | 1,406 (100.0%) |
Real Estate Taxes by Mortgage Status in Dacono
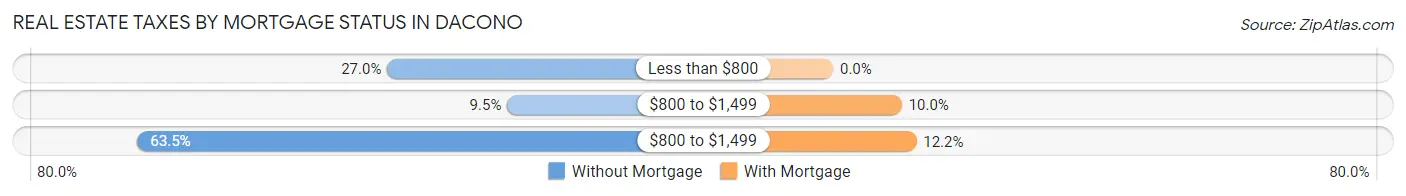
| Property Taxes | Without Mortgage | With Mortgage |
| Less than $800 | 57 (27.0%) | 0 (0.0%) |
| $800 to $1,499 | 20 (9.5%) | 141 (10.0%) |
| $800 to $1,499 | 134 (63.5%) | 171 (12.2%) |
| Total | 211 (100.0%) | 1,406 (100.0%) |
Health & Disability in Dacono
Health Insurance Coverage by Age in Dacono
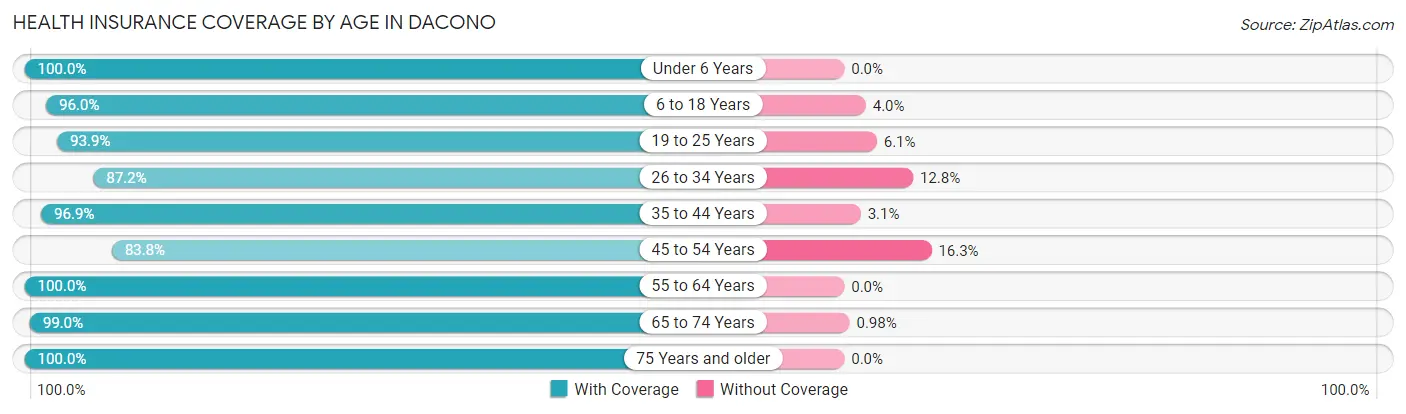
| Age Bracket | With Coverage | Without Coverage |
| Under 6 Years | 874 (100.0%) | 0 (0.0%) |
| 6 to 18 Years | 1,101 (96.0%) | 46 (4.0%) |
| 19 to 25 Years | 217 (93.9%) | 14 (6.1%) |
| 26 to 34 Years | 1,137 (87.2%) | 167 (12.8%) |
| 35 to 44 Years | 980 (96.9%) | 31 (3.1%) |
| 45 to 54 Years | 567 (83.8%) | 110 (16.3%) |
| 55 to 64 Years | 495 (100.0%) | 0 (0.0%) |
| 65 to 74 Years | 404 (99.0%) | 4 (1.0%) |
| 75 Years and older | 113 (100.0%) | 0 (0.0%) |
| Total | 5,888 (94.1%) | 372 (5.9%) |
Health Insurance Coverage by Citizenship Status in Dacono
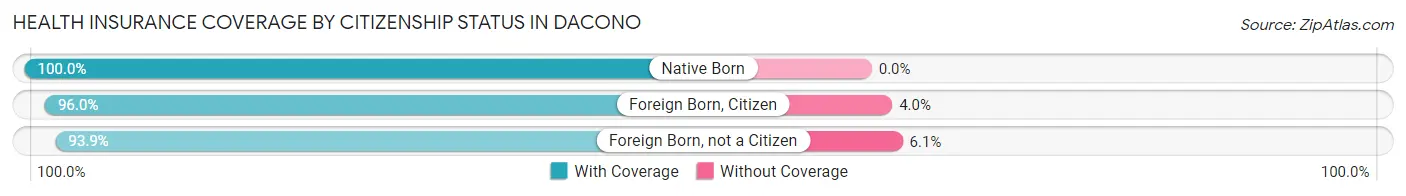
| Citizenship Status | With Coverage | Without Coverage |
| Native Born | 874 (100.0%) | 0 (0.0%) |
| Foreign Born, Citizen | 1,101 (96.0%) | 46 (4.0%) |
| Foreign Born, not a Citizen | 217 (93.9%) | 14 (6.1%) |
Health Insurance Coverage by Household Income in Dacono
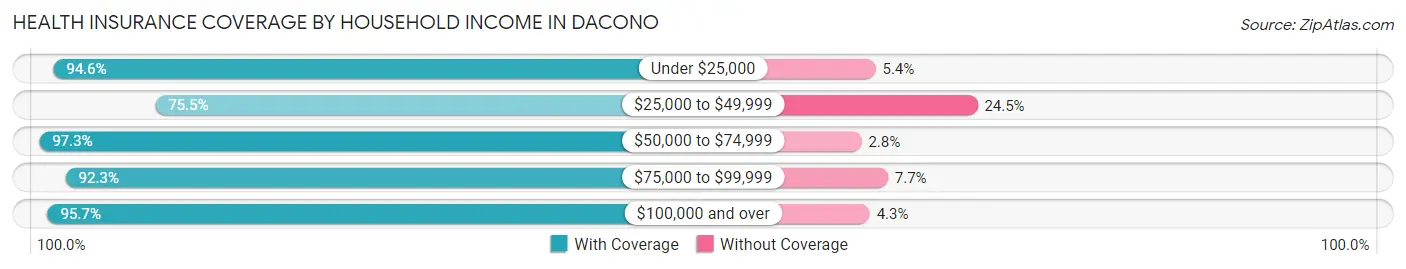
| Household Income | With Coverage | Without Coverage |
| Under $25,000 | 474 (94.6%) | 27 (5.4%) |
| $25,000 to $49,999 | 256 (75.5%) | 83 (24.5%) |
| $50,000 to $74,999 | 1,132 (97.3%) | 32 (2.8%) |
| $75,000 to $99,999 | 1,284 (92.3%) | 107 (7.7%) |
| $100,000 and over | 2,742 (95.7%) | 123 (4.3%) |
Public vs Private Health Insurance Coverage by Age in Dacono
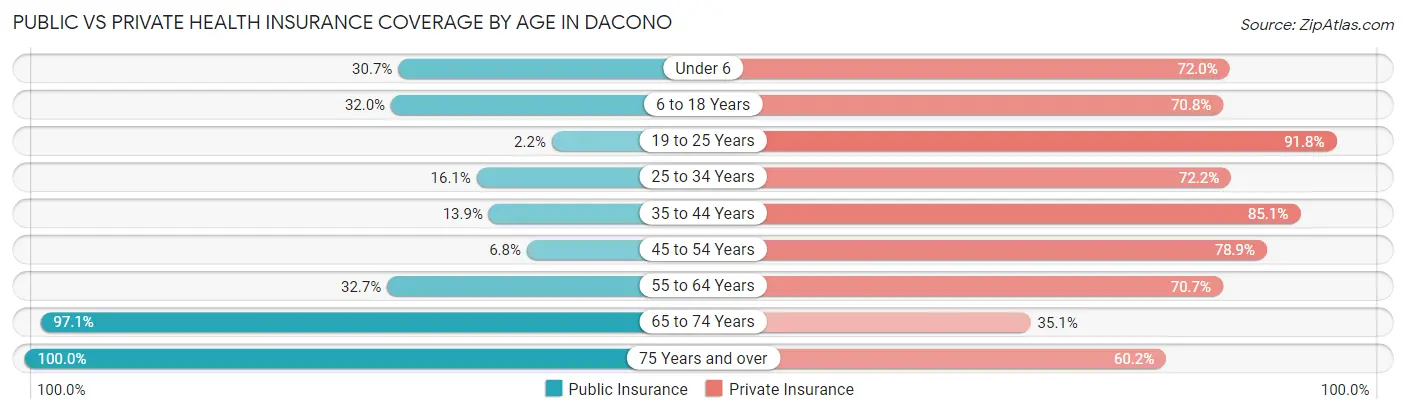
| Age Bracket | Public Insurance | Private Insurance |
| Under 6 | 268 (30.7%) | 629 (72.0%) |
| 6 to 18 Years | 367 (32.0%) | 812 (70.8%) |
| 19 to 25 Years | 5 (2.2%) | 212 (91.8%) |
| 25 to 34 Years | 210 (16.1%) | 942 (72.2%) |
| 35 to 44 Years | 140 (13.9%) | 860 (85.1%) |
| 45 to 54 Years | 46 (6.8%) | 534 (78.9%) |
| 55 to 64 Years | 162 (32.7%) | 350 (70.7%) |
| 65 to 74 Years | 396 (97.1%) | 143 (35.0%) |
| 75 Years and over | 113 (100.0%) | 68 (60.2%) |
| Total | 1,707 (27.3%) | 4,550 (72.7%) |
Disability Status by Sex by Age in Dacono
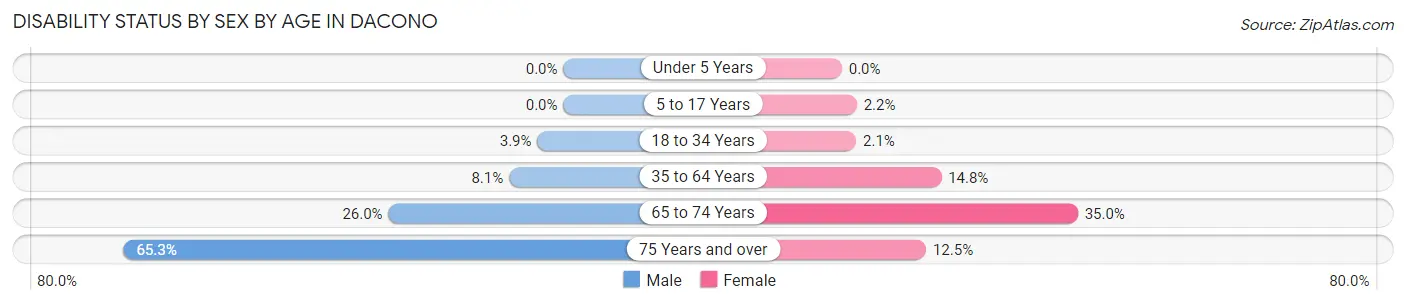
| Age Bracket | Male | Female |
| Under 5 Years | 0 (0.0%) | 0 (0.0%) |
| 5 to 17 Years | 0 (0.0%) | 17 (2.2%) |
| 18 to 34 Years | 35 (3.9%) | 14 (2.1%) |
| 35 to 64 Years | 88 (8.1%) | 161 (14.8%) |
| 65 to 74 Years | 60 (26.0%) | 62 (35.0%) |
| 75 Years and over | 32 (65.3%) | 8 (12.5%) |
Disability Class by Sex by Age in Dacono
Disability Class: Hearing Difficulty
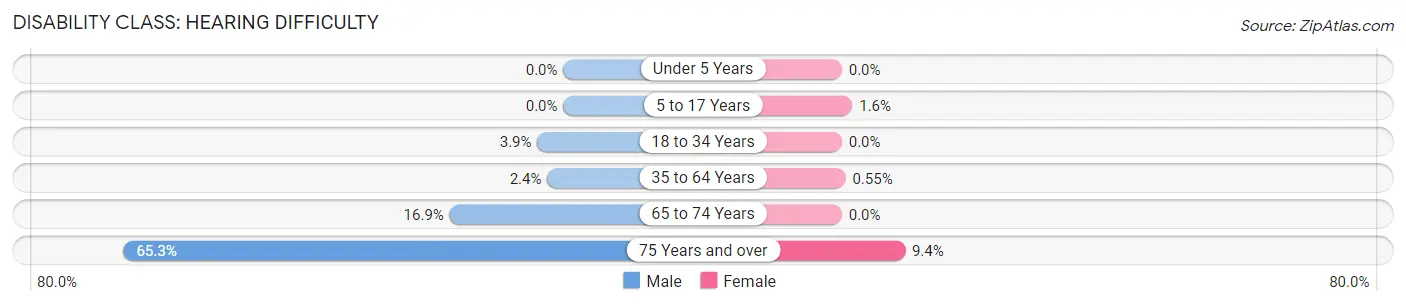
| Age Bracket | Male | Female |
| Under 5 Years | 0 (0.0%) | 0 (0.0%) |
| 5 to 17 Years | 0 (0.0%) | 12 (1.6%) |
| 18 to 34 Years | 35 (3.9%) | 0 (0.0%) |
| 35 to 64 Years | 26 (2.4%) | 6 (0.5%) |
| 65 to 74 Years | 39 (16.9%) | 0 (0.0%) |
| 75 Years and over | 32 (65.3%) | 6 (9.4%) |
Disability Class: Vision Difficulty
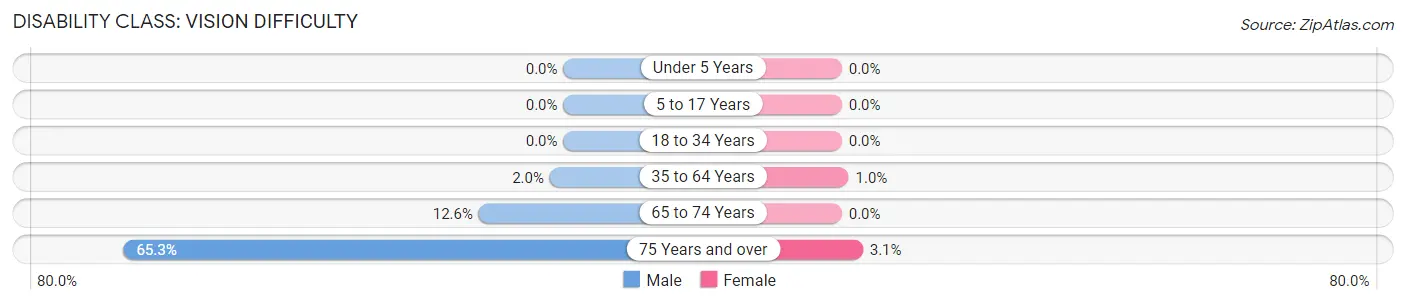
| Age Bracket | Male | Female |
| Under 5 Years | 0 (0.0%) | 0 (0.0%) |
| 5 to 17 Years | 0 (0.0%) | 0 (0.0%) |
| 18 to 34 Years | 0 (0.0%) | 0 (0.0%) |
| 35 to 64 Years | 22 (2.0%) | 11 (1.0%) |
| 65 to 74 Years | 29 (12.6%) | 0 (0.0%) |
| 75 Years and over | 32 (65.3%) | 2 (3.1%) |
Disability Class: Cognitive Difficulty
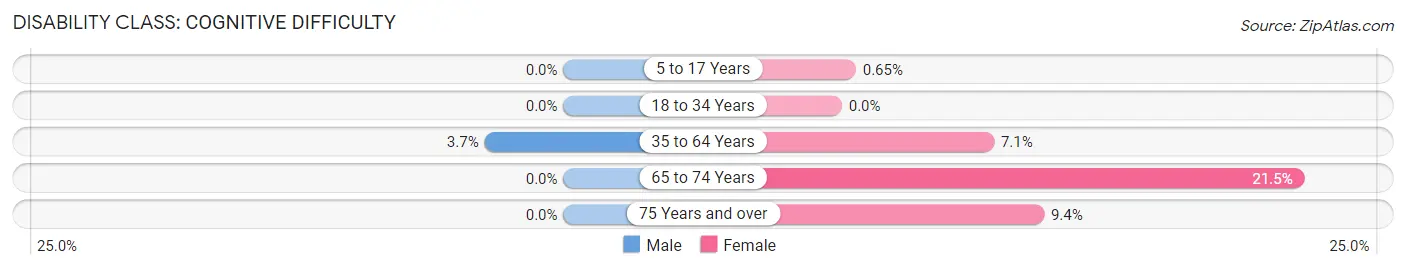
| Age Bracket | Male | Female |
| 5 to 17 Years | 0 (0.0%) | 5 (0.6%) |
| 18 to 34 Years | 0 (0.0%) | 0 (0.0%) |
| 35 to 64 Years | 40 (3.7%) | 77 (7.1%) |
| 65 to 74 Years | 0 (0.0%) | 38 (21.5%) |
| 75 Years and over | 0 (0.0%) | 6 (9.4%) |
Disability Class: Ambulatory Difficulty
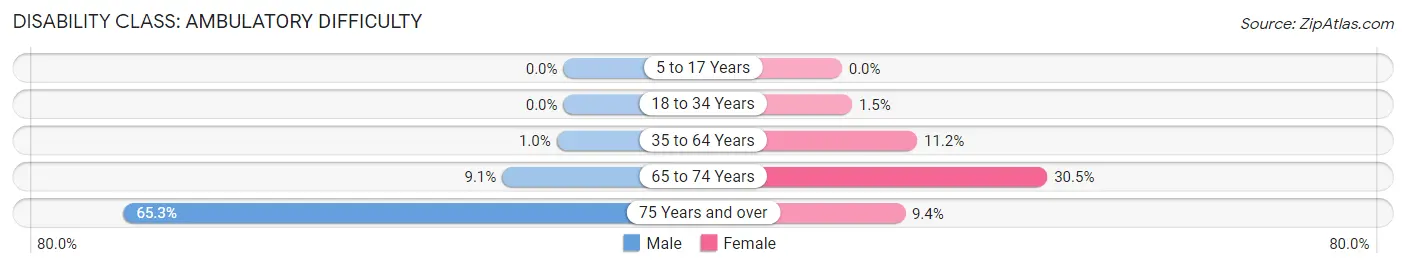
| Age Bracket | Male | Female |
| 5 to 17 Years | 0 (0.0%) | 0 (0.0%) |
| 18 to 34 Years | 0 (0.0%) | 10 (1.5%) |
| 35 to 64 Years | 11 (1.0%) | 122 (11.2%) |
| 65 to 74 Years | 21 (9.1%) | 54 (30.5%) |
| 75 Years and over | 32 (65.3%) | 6 (9.4%) |
Disability Class: Self-Care Difficulty
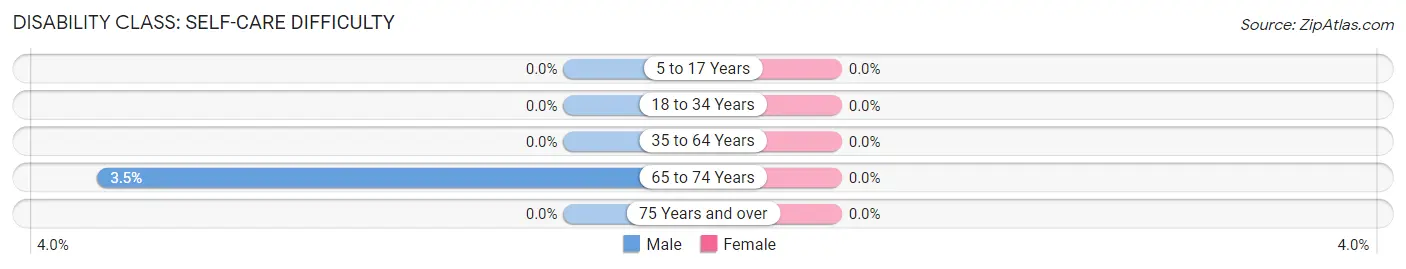
| Age Bracket | Male | Female |
| 5 to 17 Years | 0 (0.0%) | 0 (0.0%) |
| 18 to 34 Years | 0 (0.0%) | 0 (0.0%) |
| 35 to 64 Years | 0 (0.0%) | 0 (0.0%) |
| 65 to 74 Years | 8 (3.5%) | 0 (0.0%) |
| 75 Years and over | 0 (0.0%) | 0 (0.0%) |
Technology Access in Dacono
Computing Device Access in Dacono
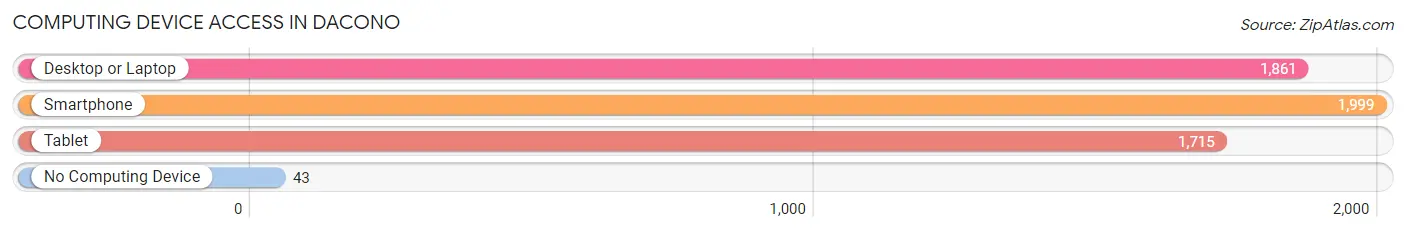
| Device Type | # Households | % Households |
| Desktop or Laptop | 1,861 | 87.9% |
| Smartphone | 1,999 | 94.4% |
| Tablet | 1,715 | 81.0% |
| No Computing Device | 43 | 2.0% |
| Total | 2,118 | 100.0% |
Internet Access in Dacono
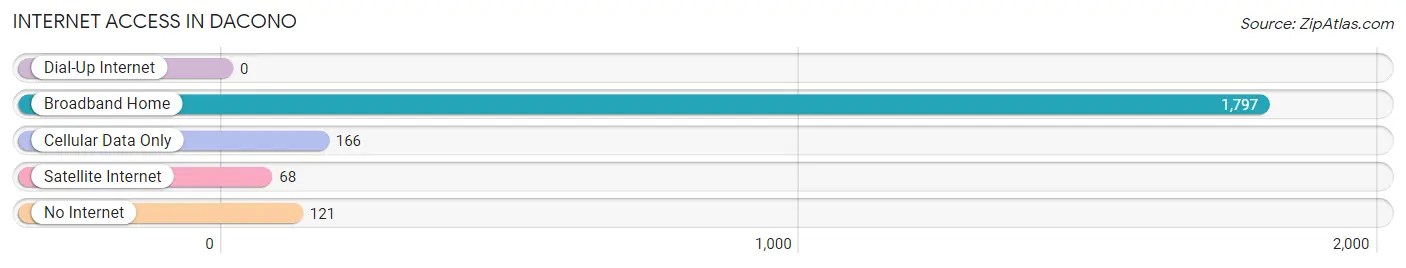
| Internet Type | # Households | % Households |
| Dial-Up Internet | 0 | 0.0% |
| Broadband Home | 1,797 | 84.8% |
| Cellular Data Only | 166 | 7.8% |
| Satellite Internet | 68 | 3.2% |
| No Internet | 121 | 5.7% |
| Total | 2,118 | 100.0% |
Dacono Summary
Dacono is a small city located in Weld County, Colorado, United States. It is situated along the South Platte River, approximately 10 miles northeast of Denver. The city was founded in 1906 and incorporated in 1908. As of the 2010 census, the population of Dacono was 5,194.
Geography
Dacono is located at 40°5'25"N 104°56'45"W (40.090278, -104.945556). It is situated along the South Platte River, approximately 10 miles northeast of Denver. The city has a total area of 1.3 square miles, all of which is land.
History
Dacono was founded in 1906 by the Dacono Land and Improvement Company. The company was formed by a group of investors from Denver who purchased the land from the Union Pacific Railroad. The name Dacono is derived from the first two letters of the names of the three original investors: DAvid, COlby, and NOlan.
The city was incorporated in 1908 and was initially a farming community. In the 1950s, the city began to experience rapid growth due to its proximity to Denver. This growth continued into the 1970s and 1980s, when the city experienced a population boom.
Economy
Dacono's economy is largely based on agriculture and manufacturing. The city is home to several large agricultural operations, including a dairy farm, a feedlot, and a vegetable farm. The city is also home to several manufacturing companies, including a plastics manufacturer and a metal fabrication company.
The city is also home to several retail businesses, including a grocery store, a hardware store, and a variety of restaurants.
Demographics
As of the 2010 census, the population of Dacono was 5,194. The racial makeup of the city was 79.2% White, 0.7% African American, 0.7% Native American, 0.7% Asian, 0.1% Pacific Islander, 16.2% from other races, and 2.4% from two or more races. Hispanic or Latino of any race were 33.2% of the population.
The median income for a household in the city was $45,938, and the median income for a family was $51,944. The per capita income for the city was $20,945. About 11.2% of families and 14.2% of the population were below the poverty line, including 19.2% of those under age 18 and 8.2% of those age 65 or over.
Conclusion
Dacono is a small city located in Weld County, Colorado, United States. It is situated along the South Platte River, approximately 10 miles northeast of Denver. The city was founded in 1906 and incorporated in 1908. As of the 2010 census, the population of Dacono was 5,194. The city's economy is largely based on agriculture and manufacturing, and it is home to several retail businesses. The racial makeup of the city is 79.2% White, 0.7% African American, 0.7% Native American, 0.7% Asian, 0.1% Pacific Islander, 16.2% from other races, and 2.4% from two or more races. The median income for a household in the city was $45,938, and the median income for a family was $51,944. About 11.2% of families and 14.2% of the population were below the poverty line.
Common Questions
What is Per Capita Income in Dacono?
Per Capita income in Dacono is $37,467.
What is the Median Family Income in Dacono?
Median Family Income in Dacono is $95,647.
What is the Median Household income in Dacono?
Median Household Income in Dacono is $94,783.
What is Income or Wage Gap in Dacono?
Income or Wage Gap in Dacono is 22.7%.
Women in Dacono earn 77.3 cents for every dollar earned by a man.
What is Inequality or Gini Index in Dacono?
Inequality or Gini Index in Dacono is 0.37.
What is the Total Population of Dacono?
Total Population of Dacono is 6,260.
What is the Total Male Population of Dacono?
Total Male Population of Dacono is 3,085.
What is the Total Female Population of Dacono?
Total Female Population of Dacono is 3,175.
What is the Ratio of Males per 100 Females in Dacono?
There are 97.17 Males per 100 Females in Dacono.
What is the Ratio of Females per 100 Males in Dacono?
There are 102.92 Females per 100 Males in Dacono.
What is the Median Population Age in Dacono?
Median Population Age in Dacono is 31.9 Years.
What is the Average Family Size in Dacono
Average Family Size in Dacono is 3.3 People.
What is the Average Household Size in Dacono
Average Household Size in Dacono is 3.0 People.
How Large is the Labor Force in Dacono?
There are 3,350 People in the Labor Forcein in Dacono.
What is the Percentage of People in the Labor Force in Dacono?
76.0% of People are in the Labor Force in Dacono.
What is the Unemployment Rate in Dacono?
Unemployment Rate in Dacono is 2.2%.