Craig, CO Map & Demographics
Craig Map
Craig Overview
$32,182
PER CAPITA INCOME
$75,163
AVG FAMILY INCOME
$52,443
AVG HOUSEHOLD INCOME
25.3%
WAGE / INCOME GAP [ % ]
74.7¢/ $1
WAGE / INCOME GAP [ $ ]
$10,611
FAMILY INCOME DEFICIT
0.45
INEQUALITY / GINI INDEX
9,013
TOTAL POPULATION
4,336
MALE POPULATION
4,677
FEMALE POPULATION
92.71
MALES / 100 FEMALES
107.86
FEMALES / 100 MALES
37.4
MEDIAN AGE
2.9
AVG FAMILY SIZE
2.3
AVG HOUSEHOLD SIZE
4,620
LABOR FORCE [ PEOPLE ]
64.9%
PERCENT IN LABOR FORCE
3.1%
UNEMPLOYMENT RATE
Craig Zip Codes
Craig Area Codes
Income in Craig
Income Overview in Craig
Per Capita Income in Craig is $32,182, while median incomes of families and households are $75,163 and $52,443 respectively.
| Characteristic | Number | Measure |
| Per Capita Income | 9,013 | $32,182 |
| Median Family Income | 2,328 | $75,163 |
| Mean Family Income | 2,328 | $86,064 |
| Median Household Income | 3,806 | $52,443 |
| Mean Household Income | 3,806 | $72,571 |
| Income Deficit | 2,328 | $10,611 |
| Wage / Income Gap (%) | 9,013 | 25.30% |
| Wage / Income Gap ($) | 9,013 | 74.70¢ per $1 |
| Gini / Inequality Index | 9,013 | 0.45 |
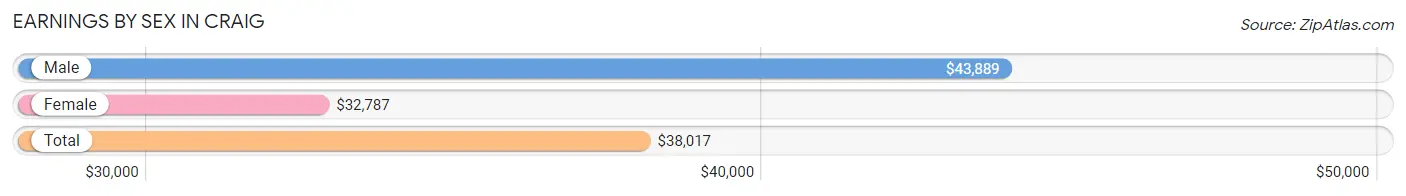
Earnings by Sex in Craig
Average Earnings in Craig are $38,017, $43,889 for men and $32,787 for women, a difference of 25.3%.
| Sex | Number | Average Earnings |
| Male | 2,692 (53.9%) | $43,889 |
| Female | 2,305 (46.1%) | $32,787 |
| Total | 4,997 (100.0%) | $38,017 |
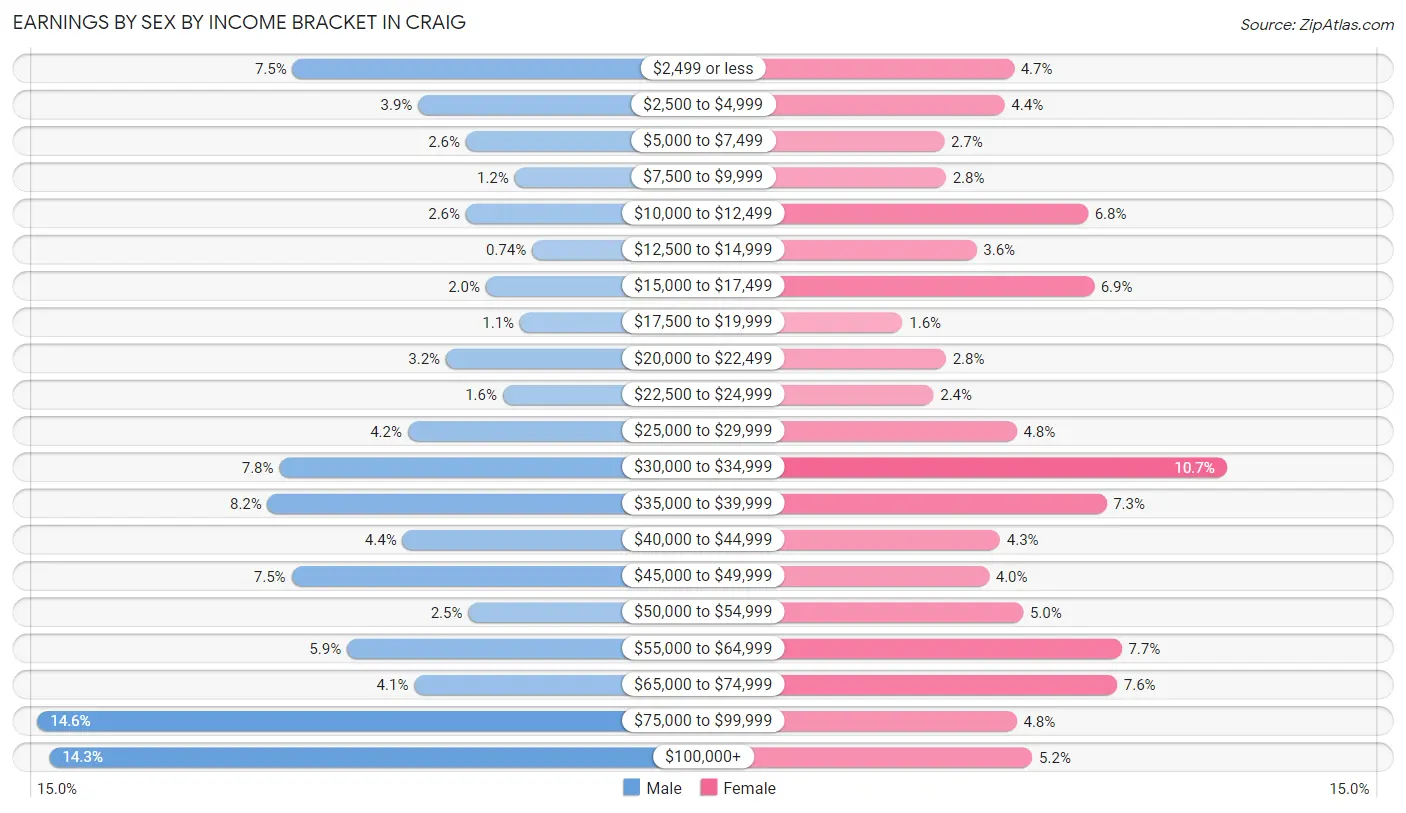
Earnings by Sex by Income Bracket in Craig
The most common earnings brackets in Craig are $75,000 to $99,999 for men (394 | 14.6%) and $30,000 to $34,999 for women (246 | 10.7%).
| Income | Male | Female |
| $2,499 or less | 201 (7.5%) | 108 (4.7%) |
| $2,500 to $4,999 | 106 (3.9%) | 102 (4.4%) |
| $5,000 to $7,499 | 70 (2.6%) | 63 (2.7%) |
| $7,500 to $9,999 | 33 (1.2%) | 64 (2.8%) |
| $10,000 to $12,499 | 70 (2.6%) | 156 (6.8%) |
| $12,500 to $14,999 | 20 (0.7%) | 84 (3.6%) |
| $15,000 to $17,499 | 55 (2.0%) | 160 (6.9%) |
| $17,500 to $19,999 | 29 (1.1%) | 36 (1.6%) |
| $20,000 to $22,499 | 85 (3.2%) | 64 (2.8%) |
| $22,500 to $24,999 | 42 (1.6%) | 56 (2.4%) |
| $25,000 to $29,999 | 114 (4.2%) | 110 (4.8%) |
| $30,000 to $34,999 | 211 (7.8%) | 246 (10.7%) |
| $35,000 to $39,999 | 220 (8.2%) | 168 (7.3%) |
| $40,000 to $44,999 | 118 (4.4%) | 99 (4.3%) |
| $45,000 to $49,999 | 202 (7.5%) | 92 (4.0%) |
| $50,000 to $54,999 | 68 (2.5%) | 114 (5.0%) |
| $55,000 to $64,999 | 160 (5.9%) | 178 (7.7%) |
| $65,000 to $74,999 | 109 (4.1%) | 175 (7.6%) |
| $75,000 to $99,999 | 394 (14.6%) | 110 (4.8%) |
| $100,000+ | 385 (14.3%) | 120 (5.2%) |
| Total | 2,692 (100.0%) | 2,305 (100.0%) |
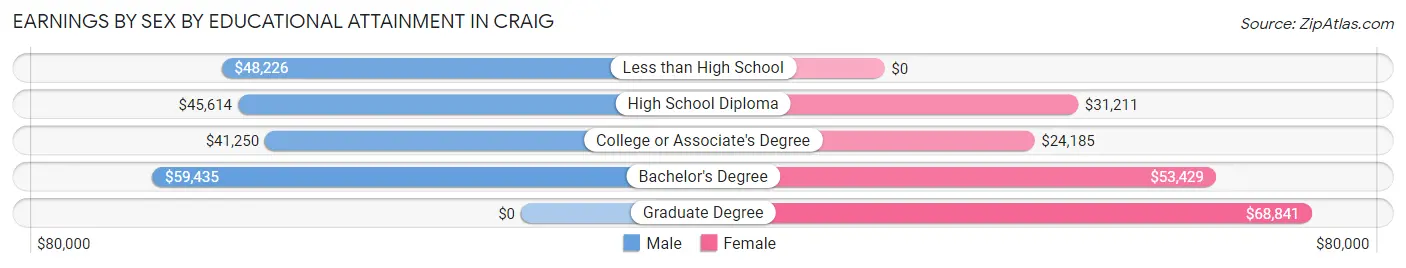
Earnings by Sex by Educational Attainment in Craig
Average earnings in Craig are $47,407 for men and $32,913 for women, a difference of 30.6%. Men with an educational attainment of bachelor's degree enjoy the highest average annual earnings of $59,435, while those with college or associate's degree education earn the least with $41,250. Women with an educational attainment of graduate degree earn the most with the average annual earnings of $68,841, while those with college or associate's degree education have the smallest earnings of $24,185.
| Educational Attainment | Male Income | Female Income |
| Less than High School | $48,226 | $0 |
| High School Diploma | $45,614 | $31,211 |
| College or Associate's Degree | $41,250 | $24,185 |
| Bachelor's Degree | $59,435 | $53,429 |
| Graduate Degree | - | - |
| Total | $47,407 | $32,913 |
Family Income in Craig
Family Income Brackets in Craig
According to the Craig family income data, there are 533 families falling into the $100,000 to $149,999 income range, which is the most common income bracket and makes up 22.9% of all families. Conversely, the $10,000 to $14,999 income bracket is the least frequent group with only 63 families (2.7%) belonging to this category.
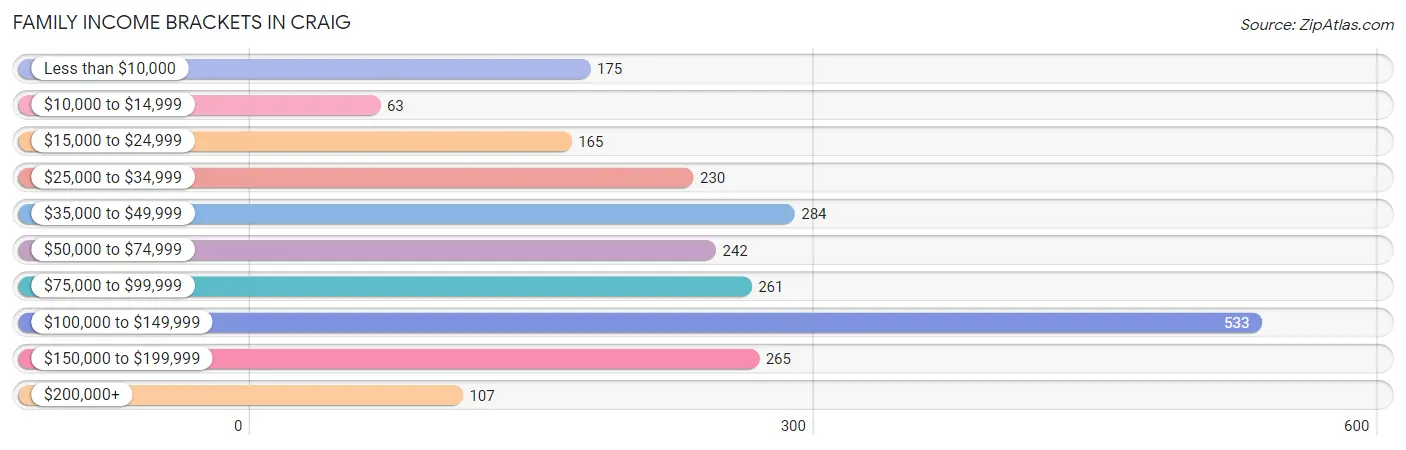
| Income Bracket | # Families | % Families |
| Less than $10,000 | 175 | 7.5% |
| $10,000 to $14,999 | 63 | 2.7% |
| $15,000 to $24,999 | 165 | 7.1% |
| $25,000 to $34,999 | 230 | 9.9% |
| $35,000 to $49,999 | 284 | 12.2% |
| $50,000 to $74,999 | 242 | 10.4% |
| $75,000 to $99,999 | 261 | 11.2% |
| $100,000 to $149,999 | 533 | 22.9% |
| $150,000 to $199,999 | 265 | 11.4% |
| $200,000+ | 107 | 4.6% |
Family Income by Famaliy Size in Craig
5-person families (149 | 6.4%) account for the highest median family income in Craig with $127,431 per family, while 2-person families (1,321 | 56.7%) have the highest median income of $32,349 per family member.
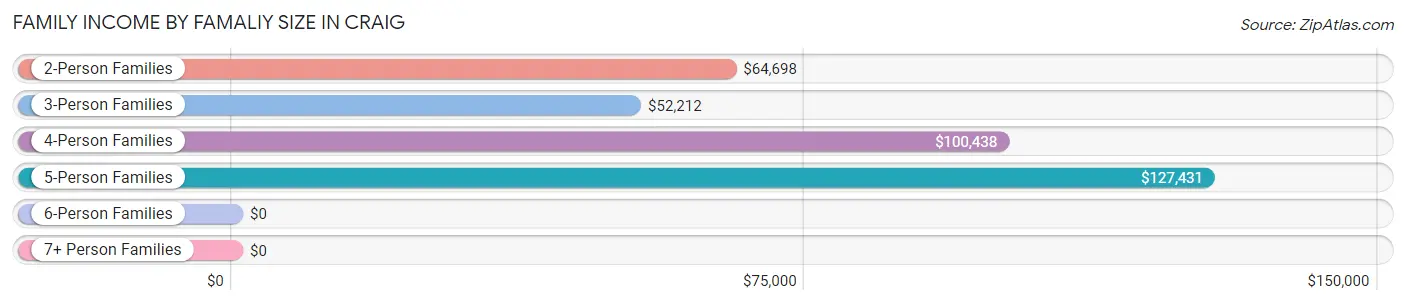
| Income Bracket | # Families | Median Income |
| 2-Person Families | 1,321 (56.7%) | $64,698 |
| 3-Person Families | 541 (23.2%) | $52,212 |
| 4-Person Families | 309 (13.3%) | $100,438 |
| 5-Person Families | 149 (6.4%) | $127,431 |
| 6-Person Families | 8 (0.3%) | $0 |
| 7+ Person Families | 0 (0.0%) | $0 |
| Total | 2,328 (100.0%) | $75,163 |
Family Income by Number of Earners in Craig
The median family income in Craig is $75,163, with families comprising 3+ earners (163) having the highest median family income of $148,906, while families with 1 earner (945) have the lowest median family income of $37,567, accounting for 7.0% and 40.6% of families, respectively.
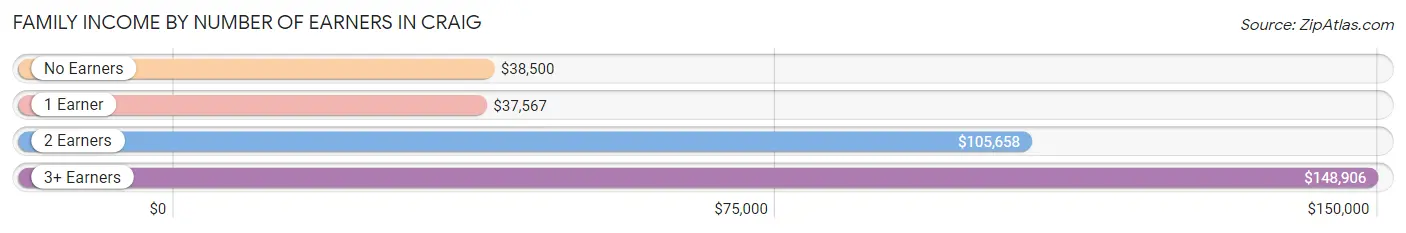
| Number of Earners | # Families | Median Income |
| No Earners | 362 (15.5%) | $38,500 |
| 1 Earner | 945 (40.6%) | $37,567 |
| 2 Earners | 858 (36.9%) | $105,658 |
| 3+ Earners | 163 (7.0%) | $148,906 |
| Total | 2,328 (100.0%) | $75,163 |
Household Income in Craig
Household Income Brackets in Craig
With 651 households falling in the category, the $100,000 to $149,999 income range is the most frequent in Craig, accounting for 17.1% of all households. In contrast, only 126 households (3.3%) fall into the $10,000 to $14,999 income bracket, making it the least populous group.
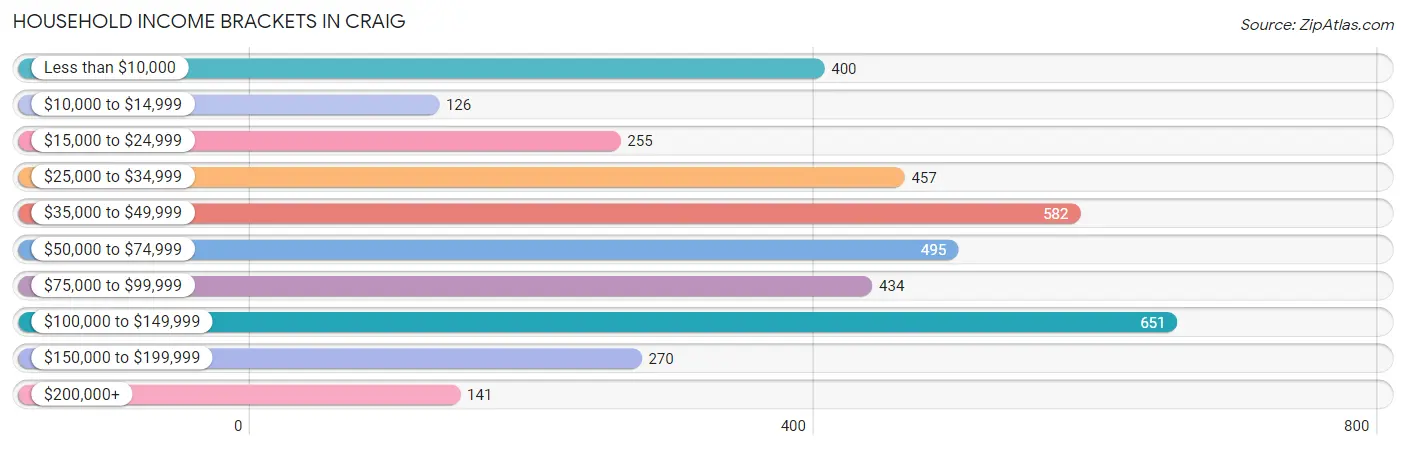
| Income Bracket | # Households | % Households |
| Less than $10,000 | 400 | 10.5% |
| $10,000 to $14,999 | 126 | 3.3% |
| $15,000 to $24,999 | 255 | 6.7% |
| $25,000 to $34,999 | 457 | 12.0% |
| $35,000 to $49,999 | 582 | 15.3% |
| $50,000 to $74,999 | 495 | 13.0% |
| $75,000 to $99,999 | 434 | 11.4% |
| $100,000 to $149,999 | 651 | 17.1% |
| $150,000 to $199,999 | 270 | 7.1% |
| $200,000+ | 141 | 3.7% |
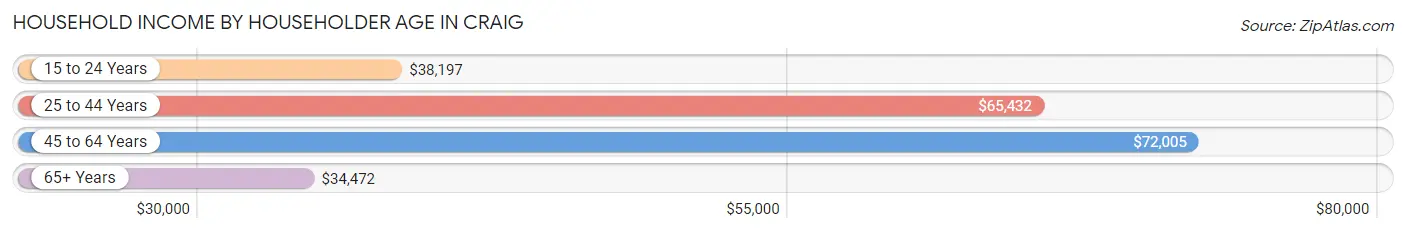
Household Income by Householder Age in Craig
The median household income in Craig is $52,443, with the highest median household income of $72,005 found in the 45 to 64 years age bracket for the primary householder. A total of 1,273 households (33.5%) fall into this category. Meanwhile, the 65+ years age bracket for the primary householder has the lowest median household income of $34,472, with 1,037 households (27.3%) in this group.
| Income Bracket | # Households | Median Income |
| 15 to 24 Years | 173 (4.5%) | $38,197 |
| 25 to 44 Years | 1,323 (34.8%) | $65,432 |
| 45 to 64 Years | 1,273 (33.5%) | $72,005 |
| 65+ Years | 1,037 (27.3%) | $34,472 |
| Total | 3,806 (100.0%) | $52,443 |
Poverty in Craig
Income Below Poverty by Sex and Age in Craig
With 13.6% poverty level for males and 16.0% for females among the residents of Craig, 5 year old males and under 5 year old females are the most vulnerable to poverty, with 37 males (37.4%) and 114 females (36.8%) in their respective age groups living below the poverty level.
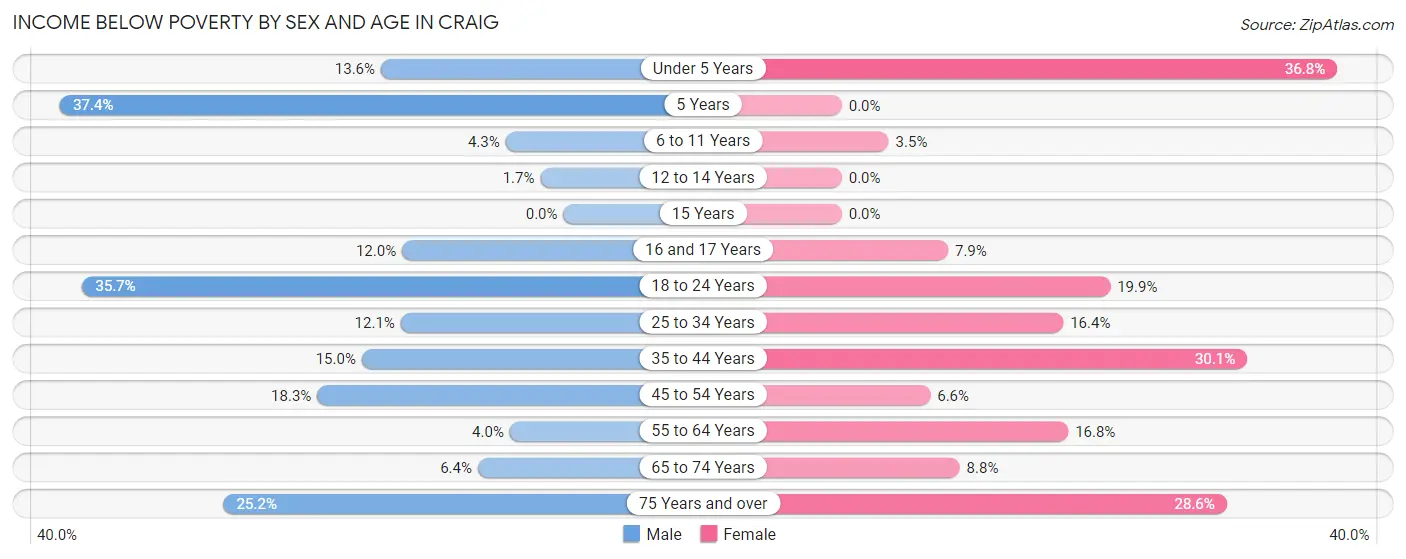
| Age Bracket | Male | Female |
| Under 5 Years | 37 (13.6%) | 114 (36.8%) |
| 5 Years | 37 (37.4%) | 0 (0.0%) |
| 6 to 11 Years | 9 (4.3%) | 13 (3.5%) |
| 12 to 14 Years | 3 (1.7%) | 0 (0.0%) |
| 15 Years | 0 (0.0%) | 0 (0.0%) |
| 16 and 17 Years | 20 (12.0%) | 9 (7.9%) |
| 18 to 24 Years | 110 (35.7%) | 54 (19.9%) |
| 25 to 34 Years | 87 (12.1%) | 119 (16.4%) |
| 35 to 44 Years | 84 (15.0%) | 176 (30.1%) |
| 45 to 54 Years | 89 (18.3%) | 33 (6.6%) |
| 55 to 64 Years | 23 (4.0%) | 98 (16.8%) |
| 65 to 74 Years | 28 (6.4%) | 40 (8.7%) |
| 75 Years and over | 54 (25.2%) | 84 (28.6%) |
| Total | 581 (13.6%) | 740 (16.0%) |
Income Above Poverty by Sex and Age in Craig
According to the poverty statistics in Craig, males aged 15 years and females aged 5 years are the age groups that are most secure financially, with 100.0% of males and 100.0% of females in these age groups living above the poverty line.
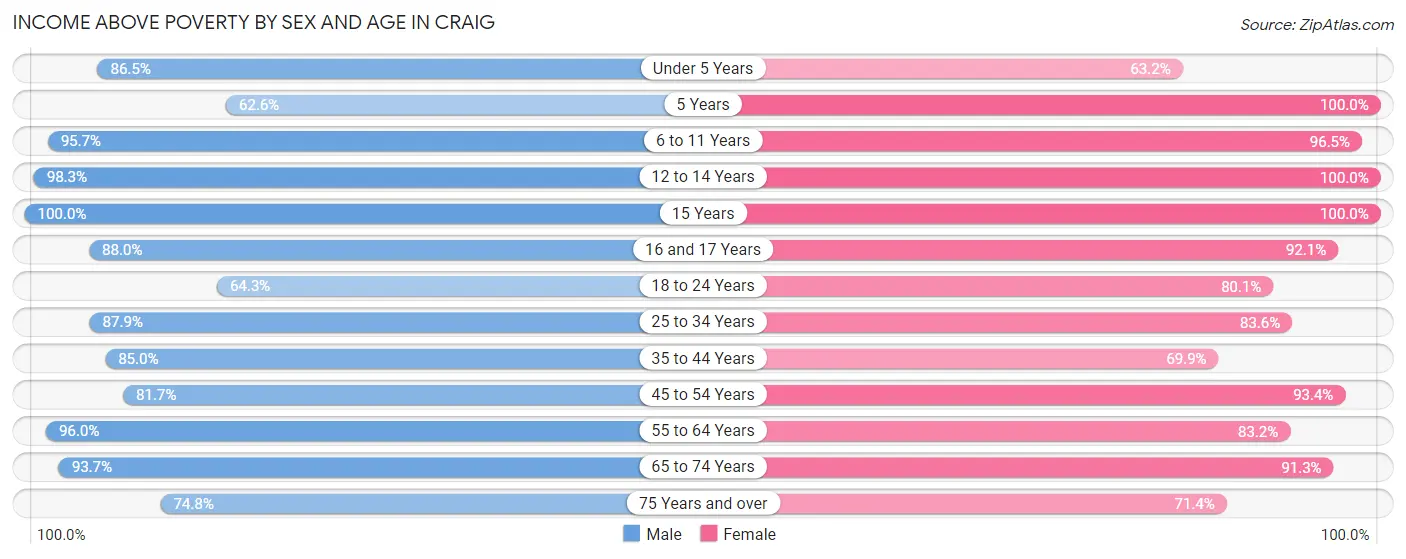
| Age Bracket | Male | Female |
| Under 5 Years | 236 (86.5%) | 196 (63.2%) |
| 5 Years | 62 (62.6%) | 29 (100.0%) |
| 6 to 11 Years | 201 (95.7%) | 361 (96.5%) |
| 12 to 14 Years | 172 (98.3%) | 275 (100.0%) |
| 15 Years | 33 (100.0%) | 116 (100.0%) |
| 16 and 17 Years | 147 (88.0%) | 105 (92.1%) |
| 18 to 24 Years | 198 (64.3%) | 217 (80.1%) |
| 25 to 34 Years | 633 (87.9%) | 605 (83.6%) |
| 35 to 44 Years | 477 (85.0%) | 409 (69.9%) |
| 45 to 54 Years | 398 (81.7%) | 469 (93.4%) |
| 55 to 64 Years | 555 (96.0%) | 485 (83.2%) |
| 65 to 74 Years | 413 (93.6%) | 417 (91.2%) |
| 75 Years and over | 160 (74.8%) | 210 (71.4%) |
| Total | 3,685 (86.4%) | 3,894 (84.0%) |
Income Below Poverty Among Married-Couple Families in Craig
The poverty statistics for married-couple families in Craig show that 10.4% or 163 of the total 1,571 families live below the poverty line. Families with 1 or 2 children have the highest poverty rate of 16.5%, comprising of 69 families. On the other hand, families with 3 or 4 children have the lowest poverty rate of 0.0%, which includes 0 families.
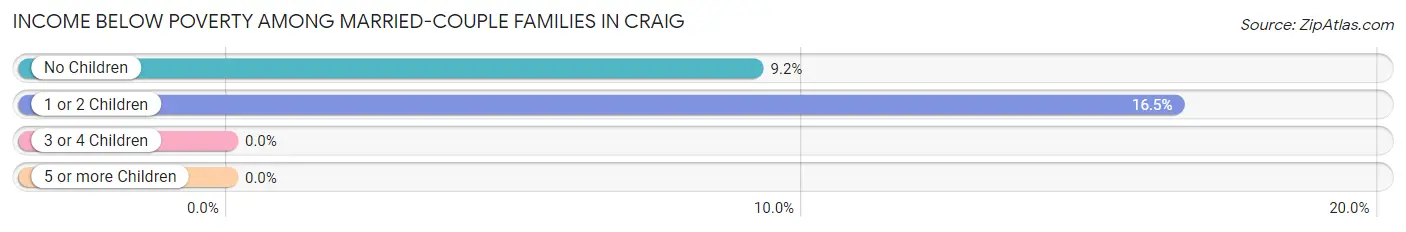
| Children | Above Poverty | Below Poverty |
| No Children | 933 (90.8%) | 94 (9.1%) |
| 1 or 2 Children | 350 (83.5%) | 69 (16.5%) |
| 3 or 4 Children | 125 (100.0%) | 0 (0.0%) |
| 5 or more Children | 0 (0.0%) | 0 (0.0%) |
| Total | 1,408 (89.6%) | 163 (10.4%) |
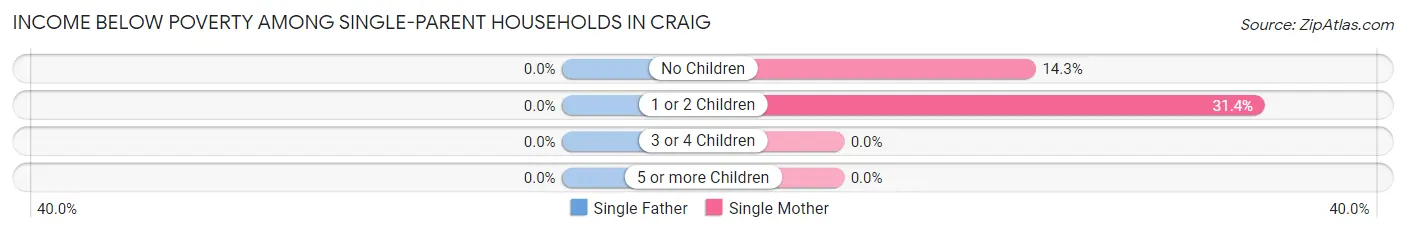
Income Below Poverty Among Single-Parent Households in Craig
| Children | Single Father | Single Mother |
| No Children | 0 (0.0%) | 14 (14.3%) |
| 1 or 2 Children | 0 (0.0%) | 155 (31.4%) |
| 3 or 4 Children | 0 (0.0%) | 0 (0.0%) |
| 5 or more Children | 0 (0.0%) | 0 (0.0%) |
| Total | 0 (0.0%) | 169 (27.3%) |
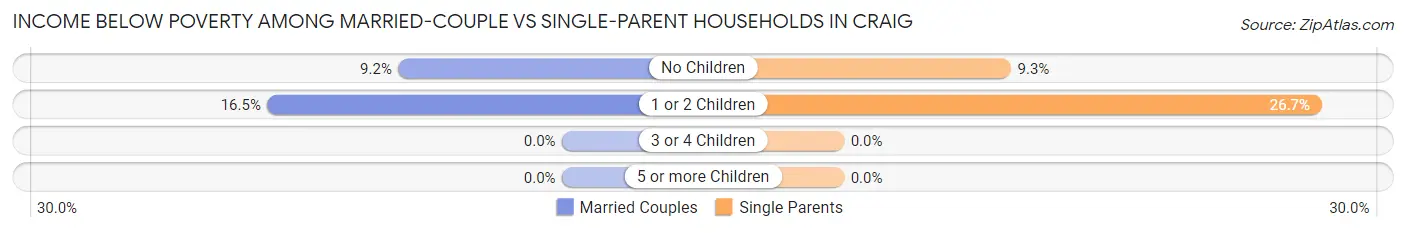
Income Below Poverty Among Married-Couple vs Single-Parent Households in Craig
The poverty data for Craig shows that 163 of the married-couple family households (10.4%) and 169 of the single-parent households (22.3%) are living below the poverty level. Within the married-couple family households, those with 1 or 2 children have the highest poverty rate, with 69 households (16.5%) falling below the poverty line. Among the single-parent households, those with 1 or 2 children have the highest poverty rate, with 155 household (26.7%) living below poverty.
| Children | Married-Couple Families | Single-Parent Households |
| No Children | 94 (9.1%) | 14 (9.3%) |
| 1 or 2 Children | 69 (16.5%) | 155 (26.7%) |
| 3 or 4 Children | 0 (0.0%) | 0 (0.0%) |
| 5 or more Children | 0 (0.0%) | 0 (0.0%) |
| Total | 163 (10.4%) | 169 (22.3%) |
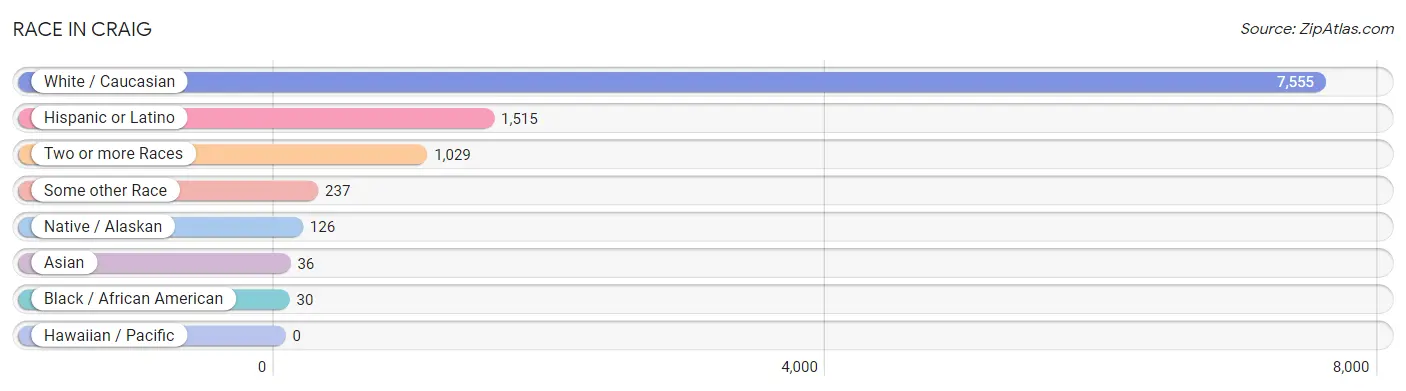
Race in Craig
The most populous races in Craig are White / Caucasian (7,555 | 83.8%), Hispanic or Latino (1,515 | 16.8%), and Two or more Races (1,029 | 11.4%).
| Race | # Population | % Population |
| Asian | 36 | 0.4% |
| Black / African American | 30 | 0.3% |
| Hawaiian / Pacific | 0 | 0.0% |
| Hispanic or Latino | 1,515 | 16.8% |
| Native / Alaskan | 126 | 1.4% |
| White / Caucasian | 7,555 | 83.8% |
| Two or more Races | 1,029 | 11.4% |
| Some other Race | 237 | 2.6% |
| Total | 9,013 | 100.0% |
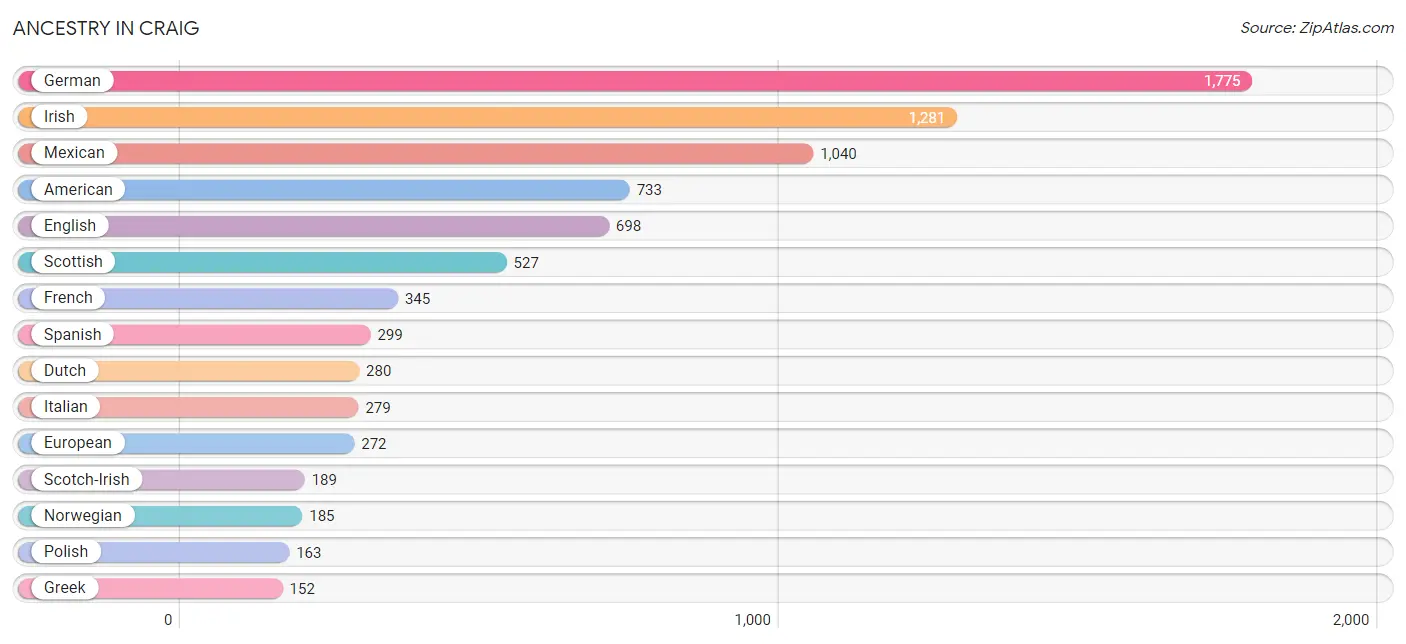
Ancestry in Craig
The most populous ancestries reported in Craig are German (1,775 | 19.7%), Irish (1,281 | 14.2%), Mexican (1,040 | 11.5%), American (733 | 8.1%), and English (698 | 7.7%), together accounting for 61.3% of all Craig residents.
| Ancestry | # Population | % Population |
| African | 6 | 0.1% |
| American | 733 | 8.1% |
| Arab | 29 | 0.3% |
| Austrian | 13 | 0.1% |
| Bahamian | 4 | 0.0% |
| Basque | 11 | 0.1% |
| Belgian | 94 | 1.0% |
| Blackfeet | 18 | 0.2% |
| British | 63 | 0.7% |
| Burmese | 36 | 0.4% |
| Canadian | 9 | 0.1% |
| Cherokee | 134 | 1.5% |
| Chippewa | 2 | 0.0% |
| Czech | 4 | 0.0% |
| Czechoslovakian | 92 | 1.0% |
| Danish | 62 | 0.7% |
| Dutch | 280 | 3.1% |
| Eastern European | 56 | 0.6% |
| English | 698 | 7.7% |
| European | 272 | 3.0% |
| Finnish | 40 | 0.4% |
| French | 345 | 3.8% |
| French Canadian | 53 | 0.6% |
| German | 1,775 | 19.7% |
| Greek | 152 | 1.7% |
| Hungarian | 16 | 0.2% |
| Indian (Asian) | 42 | 0.5% |
| Irish | 1,281 | 14.2% |
| Italian | 279 | 3.1% |
| Korean | 95 | 1.1% |
| Lebanese | 29 | 0.3% |
| Mexican | 1,040 | 11.5% |
| Mexican American Indian | 6 | 0.1% |
| Navajo | 13 | 0.1% |
| Northern European | 27 | 0.3% |
| Norwegian | 185 | 2.1% |
| Osage | 40 | 0.4% |
| Peruvian | 36 | 0.4% |
| Polish | 163 | 1.8% |
| Portuguese | 69 | 0.8% |
| Pueblo | 9 | 0.1% |
| Puerto Rican | 102 | 1.1% |
| Russian | 9 | 0.1% |
| Scandinavian | 74 | 0.8% |
| Scotch-Irish | 189 | 2.1% |
| Scottish | 527 | 5.9% |
| Seminole | 14 | 0.2% |
| Sioux | 12 | 0.1% |
| Slovak | 24 | 0.3% |
| South American | 36 | 0.4% |
| Spaniard | 28 | 0.3% |
| Spanish | 299 | 3.3% |
| Subsaharan African | 6 | 0.1% |
| Swedish | 126 | 1.4% |
| Swiss | 12 | 0.1% |
| Thai | 13 | 0.1% |
| Ukrainian | 96 | 1.1% |
| Ute | 45 | 0.5% |
| Welsh | 141 | 1.6% |
| Yugoslavian | 21 | 0.2% | View All 60 Rows |
Immigrants in Craig
The most numerous immigrant groups reported in Craig came from Latin America (558 | 6.2%), Central America (508 | 5.6%), Mexico (441 | 4.9%), Honduras (67 | 0.7%), and South America (46 | 0.5%), together accounting for 18.0% of all Craig residents.
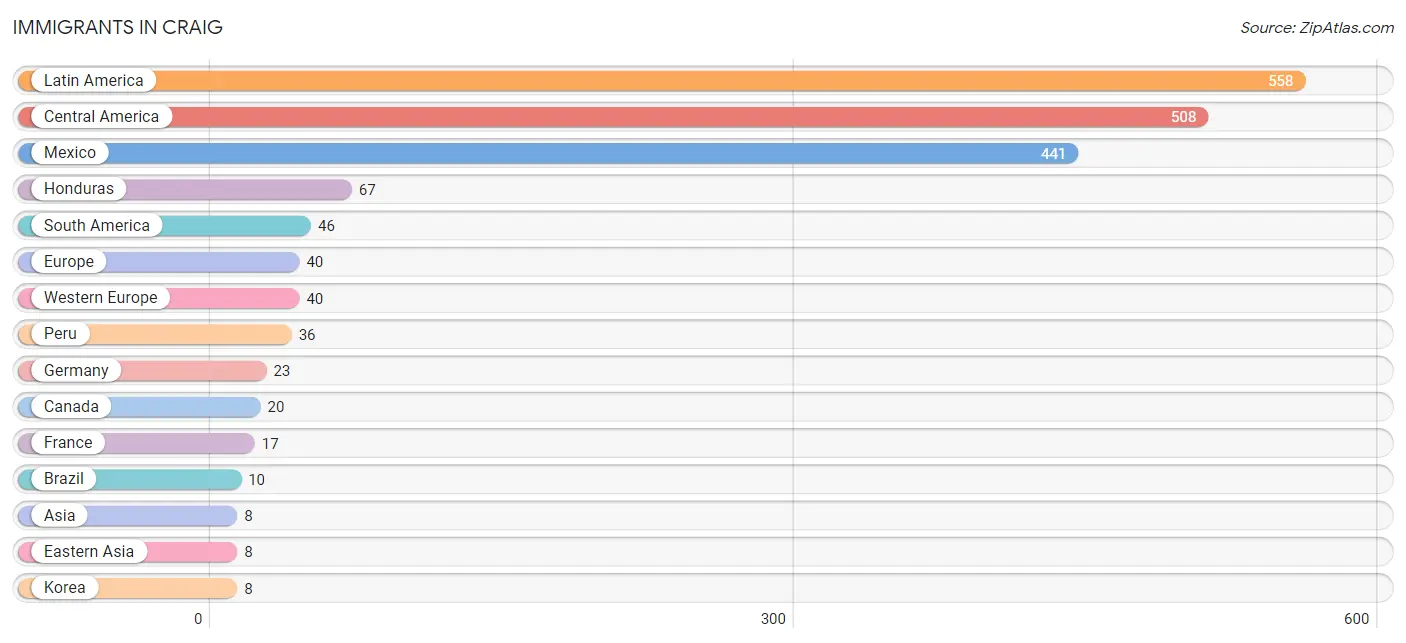
| Immigration Origin | # Population | % Population |
| Asia | 8 | 0.1% |
| Bahamas | 4 | 0.0% |
| Brazil | 10 | 0.1% |
| Canada | 20 | 0.2% |
| Caribbean | 4 | 0.0% |
| Central America | 508 | 5.6% |
| Eastern Asia | 8 | 0.1% |
| Europe | 40 | 0.4% |
| France | 17 | 0.2% |
| Germany | 23 | 0.3% |
| Honduras | 67 | 0.7% |
| Korea | 8 | 0.1% |
| Latin America | 558 | 6.2% |
| Mexico | 441 | 4.9% |
| Peru | 36 | 0.4% |
| South America | 46 | 0.5% |
| Western Europe | 40 | 0.4% | View All 17 Rows |
Sex and Age in Craig
Sex and Age in Craig
The most populous age groups in Craig are 55 to 59 Years (420 | 9.7%) for men and 10 to 14 Years (454 | 9.7%) for women.
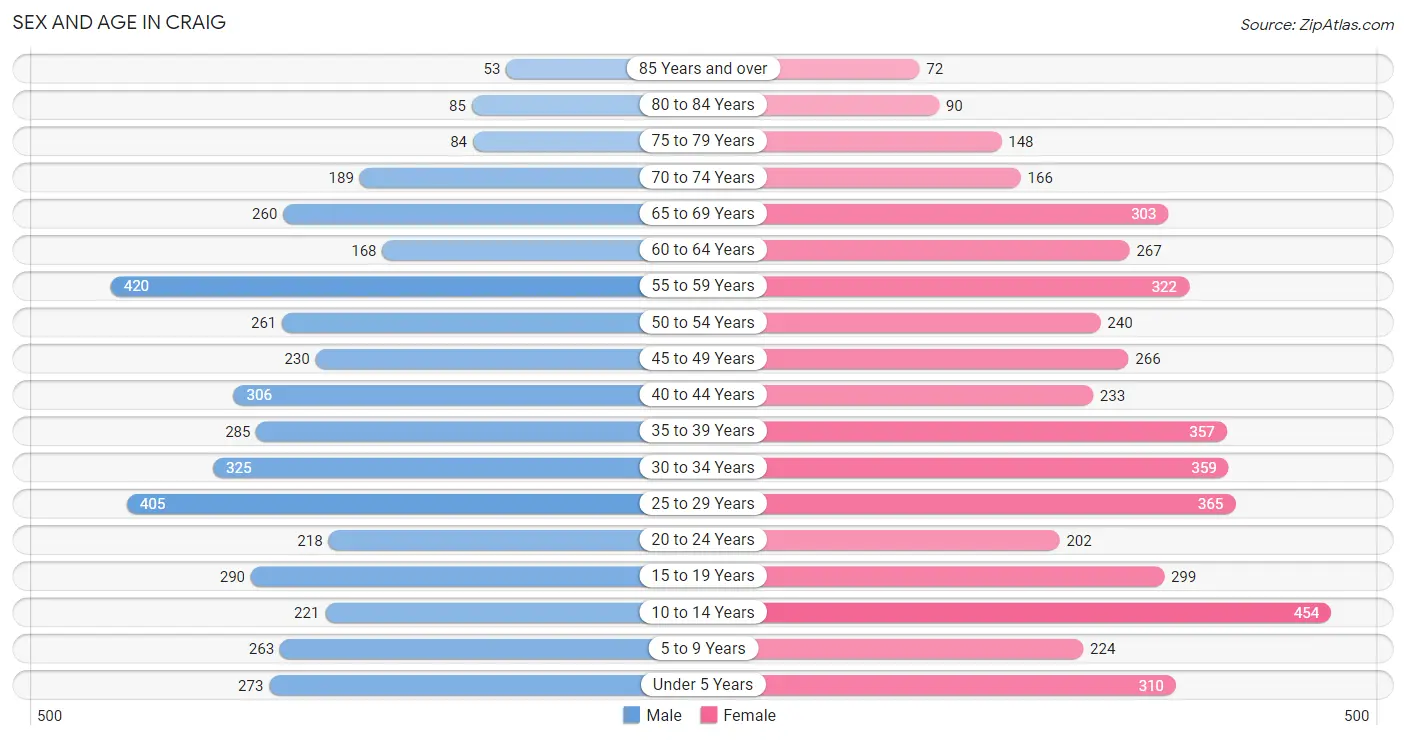
| Age Bracket | Male | Female |
| Under 5 Years | 273 (6.3%) | 310 (6.6%) |
| 5 to 9 Years | 263 (6.1%) | 224 (4.8%) |
| 10 to 14 Years | 221 (5.1%) | 454 (9.7%) |
| 15 to 19 Years | 290 (6.7%) | 299 (6.4%) |
| 20 to 24 Years | 218 (5.0%) | 202 (4.3%) |
| 25 to 29 Years | 405 (9.3%) | 365 (7.8%) |
| 30 to 34 Years | 325 (7.5%) | 359 (7.7%) |
| 35 to 39 Years | 285 (6.6%) | 357 (7.6%) |
| 40 to 44 Years | 306 (7.1%) | 233 (5.0%) |
| 45 to 49 Years | 230 (5.3%) | 266 (5.7%) |
| 50 to 54 Years | 261 (6.0%) | 240 (5.1%) |
| 55 to 59 Years | 420 (9.7%) | 322 (6.9%) |
| 60 to 64 Years | 168 (3.9%) | 267 (5.7%) |
| 65 to 69 Years | 260 (6.0%) | 303 (6.5%) |
| 70 to 74 Years | 189 (4.4%) | 166 (3.5%) |
| 75 to 79 Years | 84 (1.9%) | 148 (3.2%) |
| 80 to 84 Years | 85 (2.0%) | 90 (1.9%) |
| 85 Years and over | 53 (1.2%) | 72 (1.5%) |
| Total | 4,336 (100.0%) | 4,677 (100.0%) |
Families and Households in Craig
Median Family Size in Craig
The median family size in Craig is 2.92 persons per family, with married-couple families (1,571 | 67.5%) accounting for the largest median family size of 2.98 persons per family. On the other hand, single male/father families (138 | 5.9%) represent the smallest median family size with 2.64 persons per family.
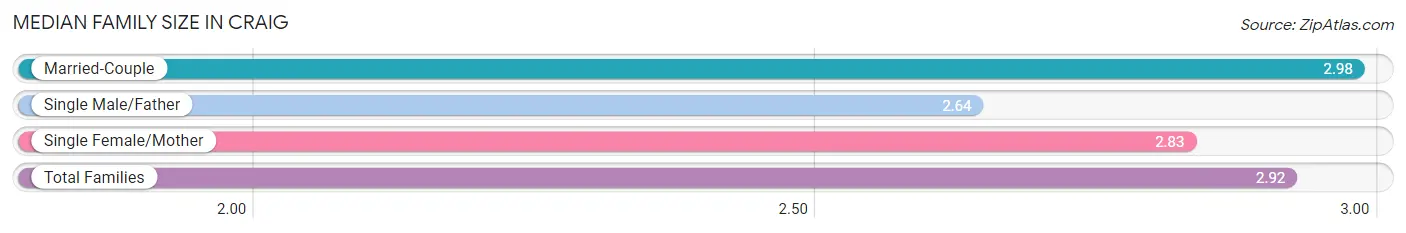
| Family Type | # Families | Family Size |
| Married-Couple | 1,571 (67.5%) | 2.98 |
| Single Male/Father | 138 (5.9%) | 2.64 |
| Single Female/Mother | 619 (26.6%) | 2.83 |
| Total Families | 2,328 (100.0%) | 2.92 |
Median Household Size in Craig
The median household size in Craig is 2.33 persons per household, with single female/mother households (619 | 16.3%) accounting for the largest median household size of 3.2 persons per household. non-family households (1,478 | 38.8%) represent the smallest median household size with 1.22 persons per household.
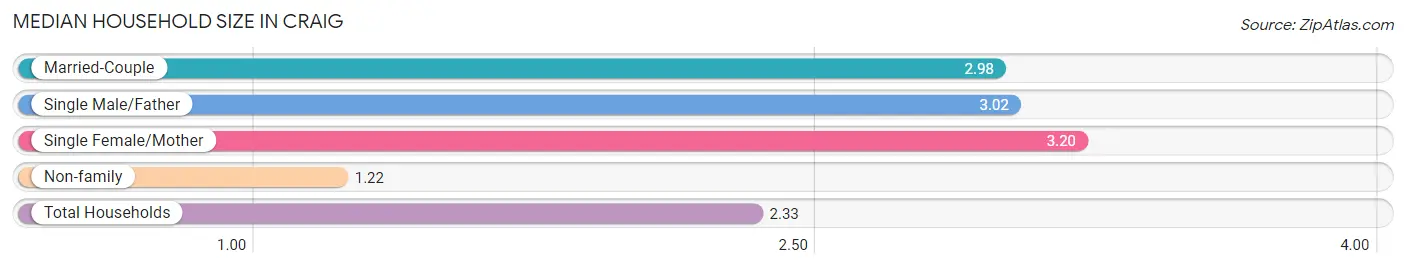
| Household Type | # Households | Household Size |
| Married-Couple | 1,571 (41.3%) | 2.98 |
| Single Male/Father | 138 (3.6%) | 3.02 |
| Single Female/Mother | 619 (16.3%) | 3.20 |
| Non-family | 1,478 (38.8%) | 1.22 |
| Total Households | 3,806 (100.0%) | 2.33 |
Household Size by Marriage Status in Craig
Out of a total of 3,806 households in Craig, 2,328 (61.2%) are family households, while 1,478 (38.8%) are nonfamily households. The most numerous type of family households are 2-person households, comprising 1,272, and the most common type of nonfamily households are 1-person households, comprising 1,251.
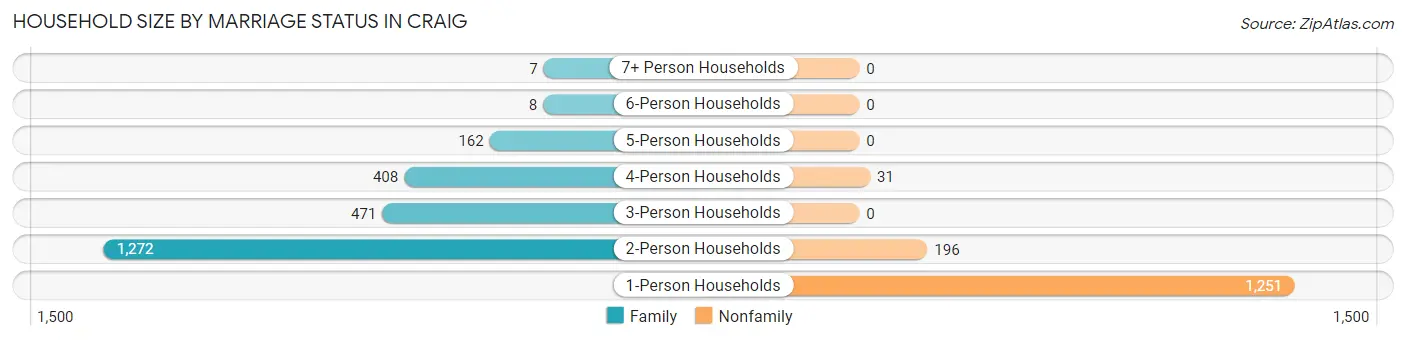
| Household Size | Family Households | Nonfamily Households |
| 1-Person Households | - | 1,251 (32.9%) |
| 2-Person Households | 1,272 (33.4%) | 196 (5.1%) |
| 3-Person Households | 471 (12.4%) | 0 (0.0%) |
| 4-Person Households | 408 (10.7%) | 31 (0.8%) |
| 5-Person Households | 162 (4.3%) | 0 (0.0%) |
| 6-Person Households | 8 (0.2%) | 0 (0.0%) |
| 7+ Person Households | 7 (0.2%) | 0 (0.0%) |
| Total | 2,328 (61.2%) | 1,478 (38.8%) |
Female Fertility in Craig
Fertility by Age in Craig
Average fertility rate in Craig is 53.0 births per 1,000 women. Women in the age bracket of 20 to 34 years have the highest fertility rate with 100.0 births per 1,000 women. Women in the age bracket of 20 to 34 years acount for 82.3% of all women with births.
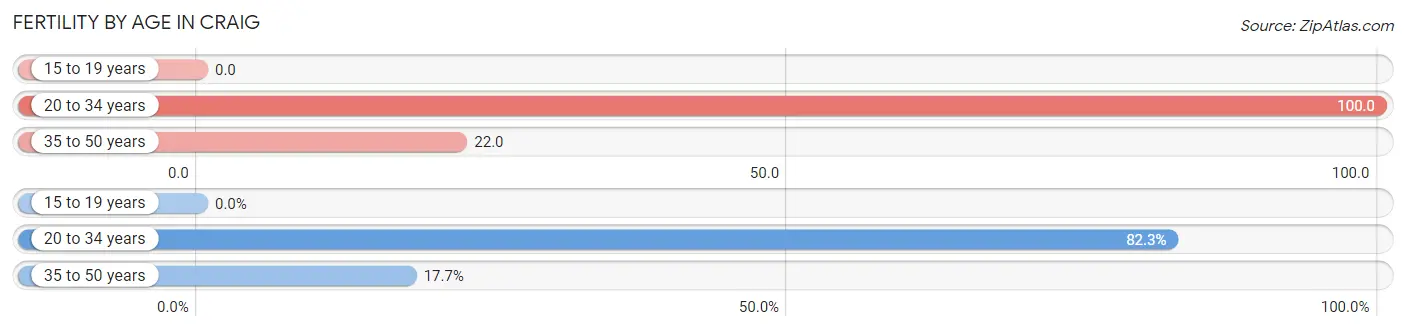
| Age Bracket | Women with Births | Births / 1,000 Women |
| 15 to 19 years | 0 (0.0%) | 0.0 |
| 20 to 34 years | 93 (82.3%) | 100.0 |
| 35 to 50 years | 20 (17.7%) | 22.0 |
| Total | 113 (100.0%) | 53.0 |
Fertility by Age by Marriage Status in Craig
56.6% of women with births (113) in Craig are married. The highest percentage of unmarried women with births falls into 20 to 34 years age bracket with 52.7% of them unmarried at the time of birth, while the lowest percentage of unmarried women with births belong to 35 to 50 years age bracket with 0.0% of them unmarried.
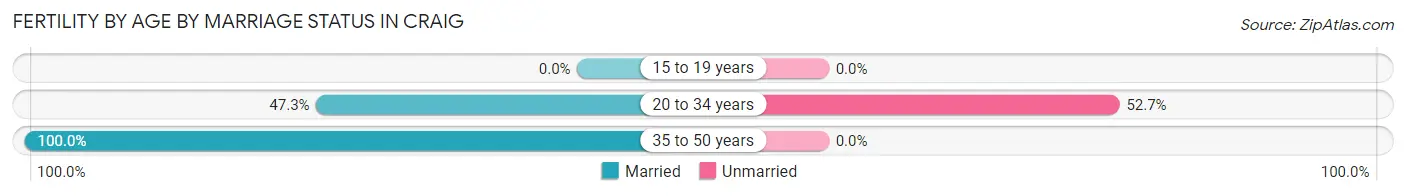
| Age Bracket | Married | Unmarried |
| 15 to 19 years | 0 (0.0%) | 0 (0.0%) |
| 20 to 34 years | 44 (47.3%) | 49 (52.7%) |
| 35 to 50 years | 20 (100.0%) | 0 (0.0%) |
| Total | 64 (56.6%) | 49 (43.4%) |
Fertility by Education in Craig
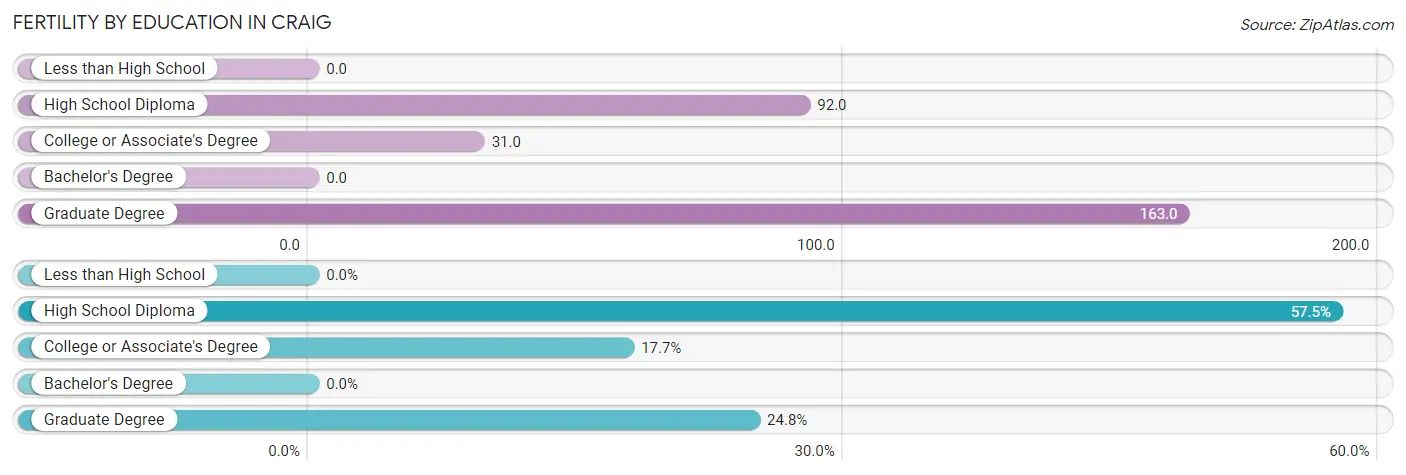
| Educational Attainment | Women with Births | Births / 1,000 Women |
| Less than High School | 0 (0.0%) | 0.0 |
| High School Diploma | 65 (57.5%) | 92.0 |
| College or Associate's Degree | 20 (17.7%) | 31.0 |
| Bachelor's Degree | 0 (0.0%) | 0.0 |
| Graduate Degree | 28 (24.8%) | 163.0 |
| Total | 113 (100.0%) | 53.0 |
Fertility by Education by Marriage Status in Craig
43.4% of women with births in Craig are unmarried. Women with the educational attainment of college or associate's degree are most likely to be married with 100.0% of them married at childbirth, while women with the educational attainment of high school diploma are least likely to be married with 64.6% of them unmarried at childbirth.
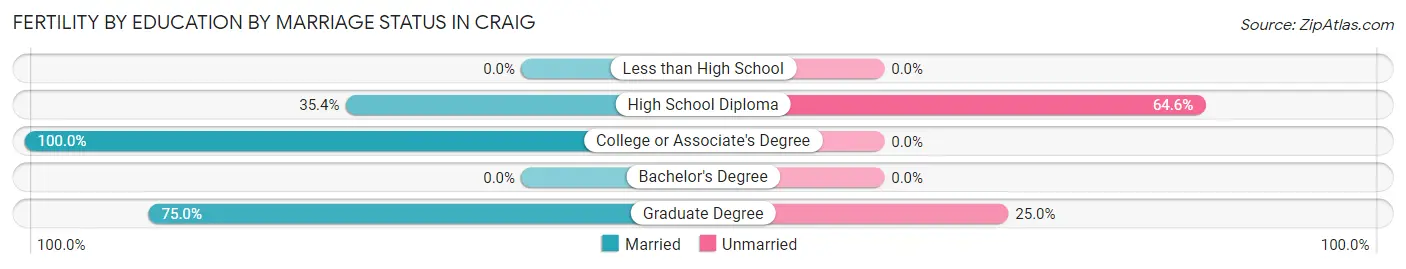
| Educational Attainment | Married | Unmarried |
| Less than High School | 0 (0.0%) | 0 (0.0%) |
| High School Diploma | 23 (35.4%) | 42 (64.6%) |
| College or Associate's Degree | 20 (100.0%) | 0 (0.0%) |
| Bachelor's Degree | 0 (0.0%) | 0 (0.0%) |
| Graduate Degree | 21 (75.0%) | 7 (25.0%) |
| Total | 64 (56.6%) | 49 (43.4%) |
Employment Characteristics in Craig
Employment by Class of Employer in Craig
Among the 4,422 employed individuals in Craig, private company employees (2,186 | 49.4%), not-for-profit organizations (605 | 13.7%), and local government employees (595 | 13.5%) make up the most common classes of employment.
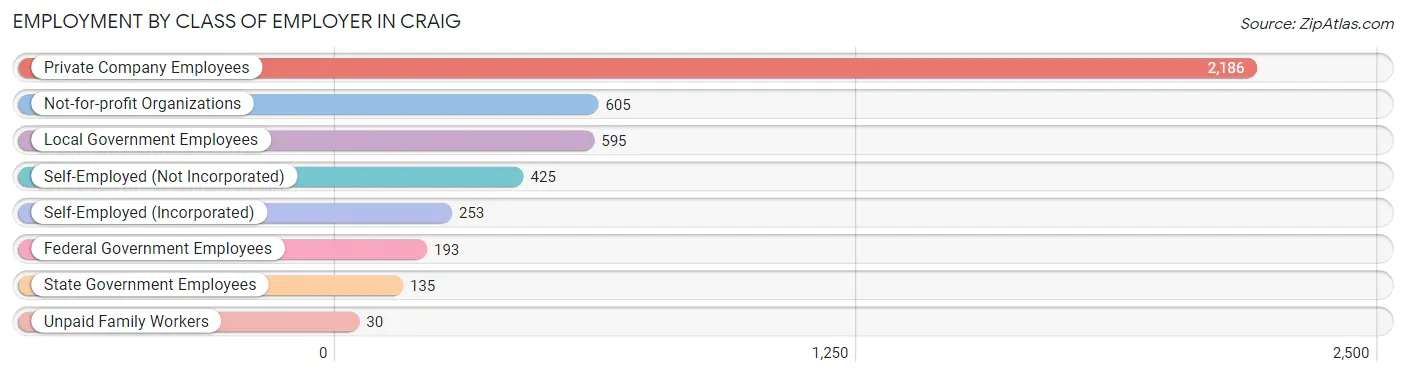
| Employer Class | # Employees | % Employees |
| Private Company Employees | 2,186 | 49.4% |
| Self-Employed (Incorporated) | 253 | 5.7% |
| Self-Employed (Not Incorporated) | 425 | 9.6% |
| Not-for-profit Organizations | 605 | 13.7% |
| Local Government Employees | 595 | 13.5% |
| State Government Employees | 135 | 3.0% |
| Federal Government Employees | 193 | 4.4% |
| Unpaid Family Workers | 30 | 0.7% |
| Total | 4,422 | 100.0% |
Employment Status by Age in Craig
According to the labor force statistics for Craig, out of the total population over 16 years of age (7,119), 64.9% or 4,620 individuals are in the labor force, with 3.1% or 143 of them unemployed. The age group with the highest labor force participation rate is 45 to 54 years, with 88.7% or 884 individuals in the labor force. Within the labor force, the 16 to 19 years age range has the highest percentage of unemployed individuals, with 28.6% or 53 of them being unemployed.
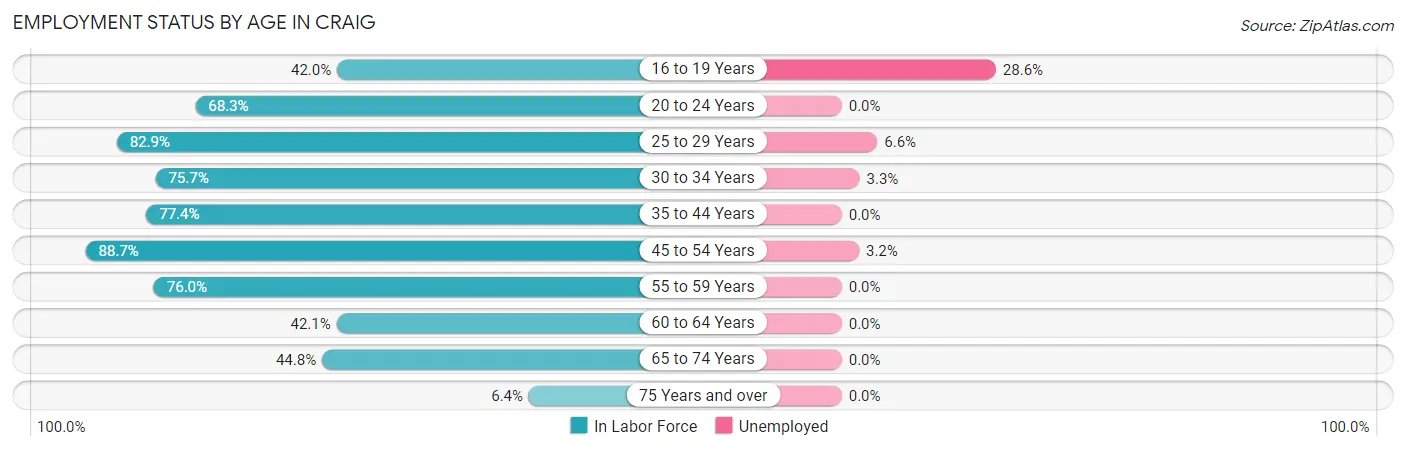
| Age Bracket | In Labor Force | Unemployed |
| 16 to 19 Years | 185 (42.0%) | 53 (28.6%) |
| 20 to 24 Years | 287 (68.3%) | 0 (0.0%) |
| 25 to 29 Years | 638 (82.9%) | 42 (6.6%) |
| 30 to 34 Years | 518 (75.7%) | 17 (3.3%) |
| 35 to 44 Years | 914 (77.4%) | 0 (0.0%) |
| 45 to 54 Years | 884 (88.7%) | 28 (3.2%) |
| 55 to 59 Years | 564 (76.0%) | 0 (0.0%) |
| 60 to 64 Years | 183 (42.1%) | 0 (0.0%) |
| 65 to 74 Years | 411 (44.8%) | 0 (0.0%) |
| 75 Years and over | 34 (6.4%) | 0 (0.0%) |
| Total | 4,620 (64.9%) | 143 (3.1%) |
Employment Status by Educational Attainment in Craig
According to labor force statistics for Craig, 77.0% of individuals (3,703) out of the total population between 25 and 64 years of age (4,809) are in the labor force, with 2.4% or 89 of them being unemployed. The group with the highest labor force participation rate are those with the educational attainment of bachelor's degree or higher, with 89.1% or 811 individuals in the labor force. Within the labor force, individuals with less than high school education have the highest percentage of unemployment, with 8.3% or 23 of them being unemployed.
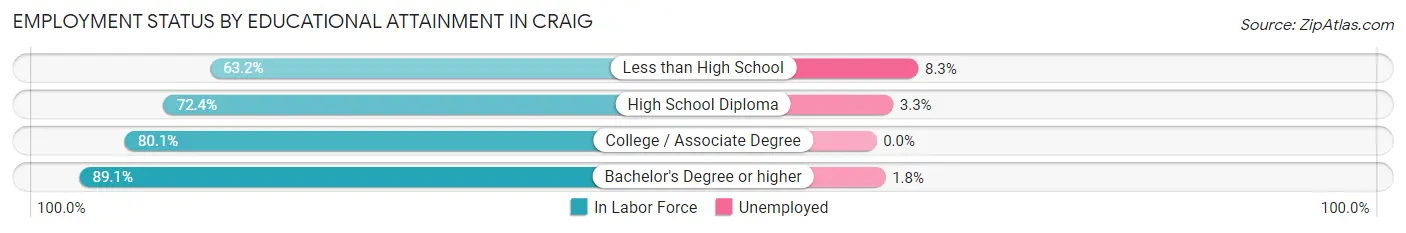
| Educational Attainment | In Labor Force | Unemployed |
| Less than High School | 276 (63.2%) | 36 (8.3%) |
| High School Diploma | 1,496 (72.4%) | 68 (3.3%) |
| College / Associate Degree | 1,118 (80.1%) | 0 (0.0%) |
| Bachelor's Degree or higher | 811 (89.1%) | 16 (1.8%) |
| Total | 3,703 (77.0%) | 115 (2.4%) |
Employment Occupations by Sex in Craig
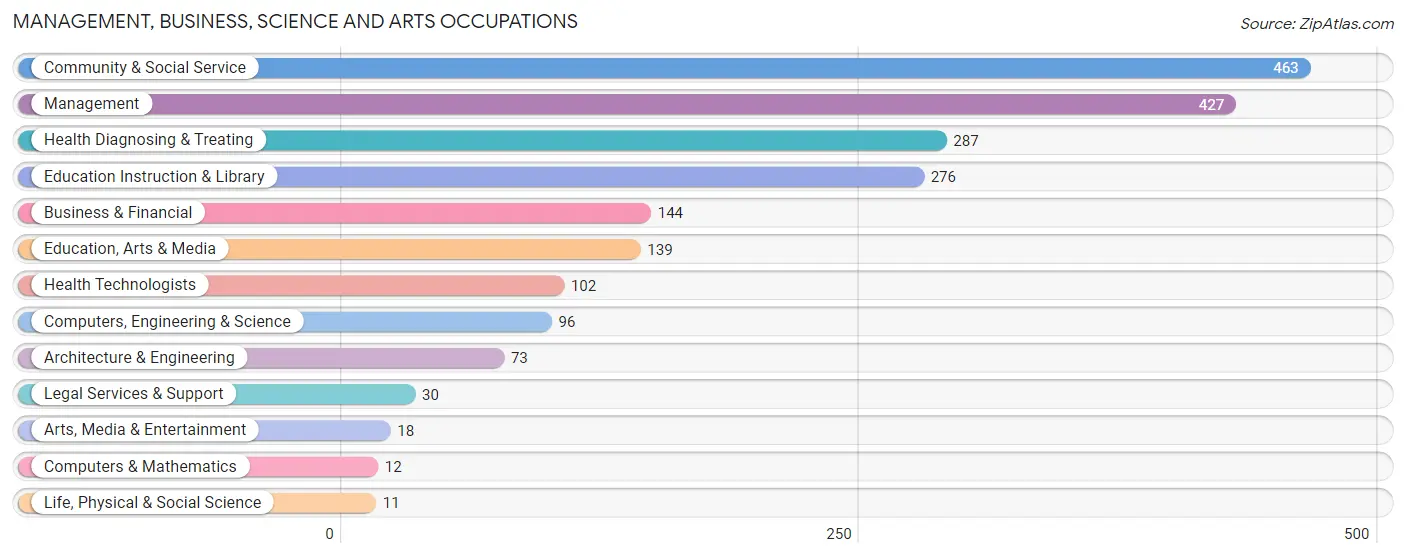
Management, Business, Science and Arts Occupations
The most common Management, Business, Science and Arts occupations in Craig are Community & Social Service (463 | 10.4%), Management (427 | 9.6%), Health Diagnosing & Treating (287 | 6.5%), Education Instruction & Library (276 | 6.2%), and Business & Financial (144 | 3.3%).
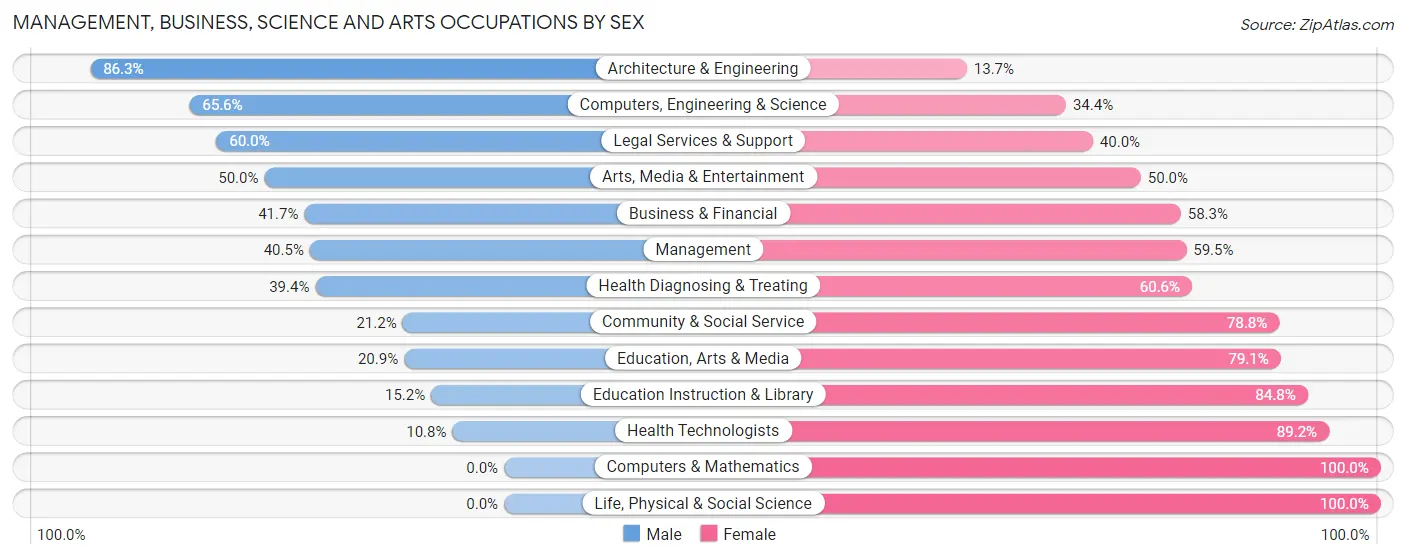
Management, Business, Science and Arts Occupations by Sex
Within the Management, Business, Science and Arts occupations in Craig, the most male-oriented occupations are Architecture & Engineering (86.3%), Computers, Engineering & Science (65.6%), and Legal Services & Support (60.0%), while the most female-oriented occupations are Computers & Mathematics (100.0%), Life, Physical & Social Science (100.0%), and Health Technologists (89.2%).
| Occupation | Male | Female |
| Management | 173 (40.5%) | 254 (59.5%) |
| Business & Financial | 60 (41.7%) | 84 (58.3%) |
| Computers, Engineering & Science | 63 (65.6%) | 33 (34.4%) |
| Computers & Mathematics | 0 (0.0%) | 12 (100.0%) |
| Architecture & Engineering | 63 (86.3%) | 10 (13.7%) |
| Life, Physical & Social Science | 0 (0.0%) | 11 (100.0%) |
| Community & Social Service | 98 (21.2%) | 365 (78.8%) |
| Education, Arts & Media | 29 (20.9%) | 110 (79.1%) |
| Legal Services & Support | 18 (60.0%) | 12 (40.0%) |
| Education Instruction & Library | 42 (15.2%) | 234 (84.8%) |
| Arts, Media & Entertainment | 9 (50.0%) | 9 (50.0%) |
| Health Diagnosing & Treating | 113 (39.4%) | 174 (60.6%) |
| Health Technologists | 11 (10.8%) | 91 (89.2%) |
| Total (Category) | 507 (35.8%) | 910 (64.2%) |
| Total (Overall) | 2,351 (53.0%) | 2,082 (47.0%) |
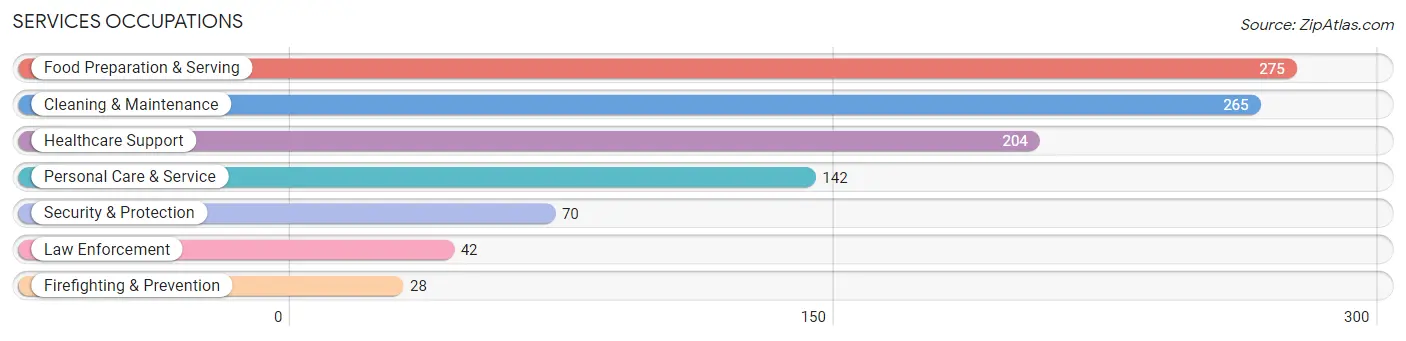
Services Occupations
The most common Services occupations in Craig are Food Preparation & Serving (275 | 6.2%), Cleaning & Maintenance (265 | 6.0%), Healthcare Support (204 | 4.6%), Personal Care & Service (142 | 3.2%), and Security & Protection (70 | 1.6%).
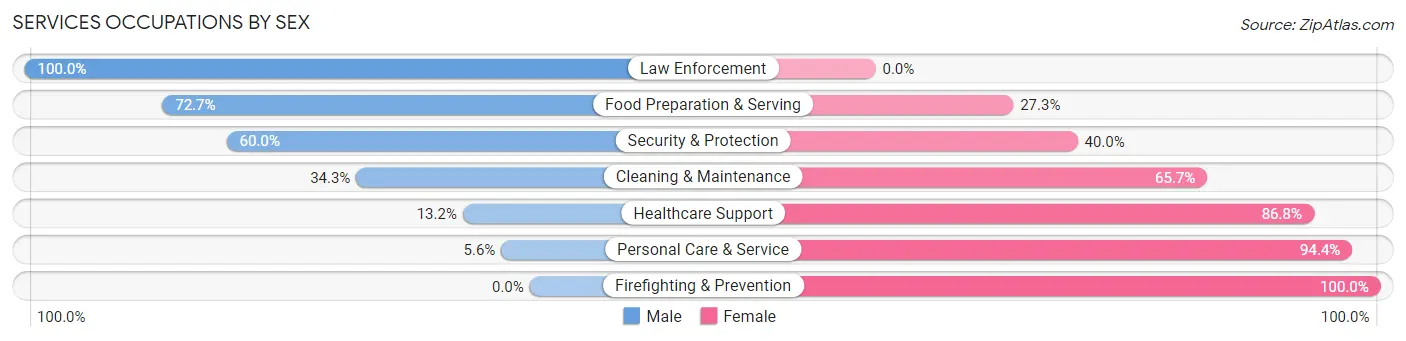
Services Occupations by Sex
Within the Services occupations in Craig, the most male-oriented occupations are Law Enforcement (100.0%), Food Preparation & Serving (72.7%), and Security & Protection (60.0%), while the most female-oriented occupations are Firefighting & Prevention (100.0%), Personal Care & Service (94.4%), and Healthcare Support (86.8%).
| Occupation | Male | Female |
| Healthcare Support | 27 (13.2%) | 177 (86.8%) |
| Security & Protection | 42 (60.0%) | 28 (40.0%) |
| Firefighting & Prevention | 0 (0.0%) | 28 (100.0%) |
| Law Enforcement | 42 (100.0%) | 0 (0.0%) |
| Food Preparation & Serving | 200 (72.7%) | 75 (27.3%) |
| Cleaning & Maintenance | 91 (34.3%) | 174 (65.7%) |
| Personal Care & Service | 8 (5.6%) | 134 (94.4%) |
| Total (Category) | 368 (38.5%) | 588 (61.5%) |
| Total (Overall) | 2,351 (53.0%) | 2,082 (47.0%) |
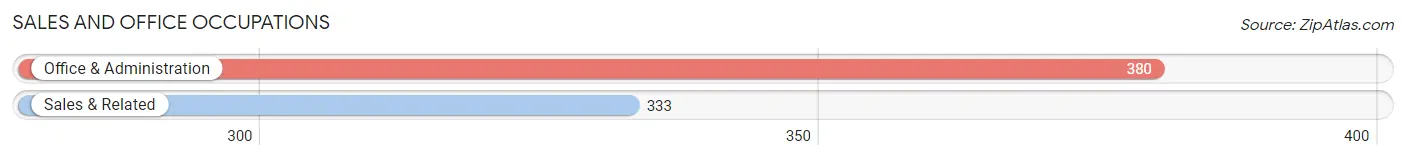
Sales and Office Occupations
The most common Sales and Office occupations in Craig are Office & Administration (380 | 8.6%), and Sales & Related (333 | 7.5%).
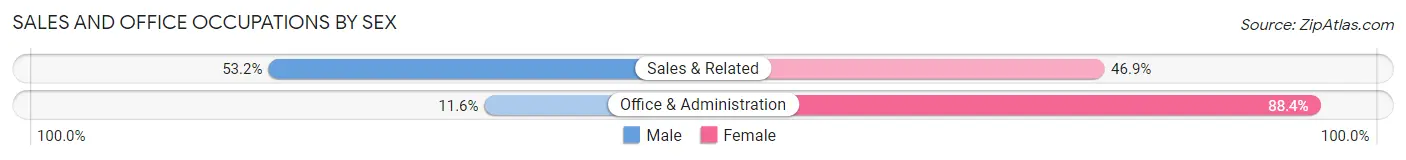
Sales and Office Occupations by Sex
| Occupation | Male | Female |
| Sales & Related | 177 (53.1%) | 156 (46.9%) |
| Office & Administration | 44 (11.6%) | 336 (88.4%) |
| Total (Category) | 221 (31.0%) | 492 (69.0%) |
| Total (Overall) | 2,351 (53.0%) | 2,082 (47.0%) |
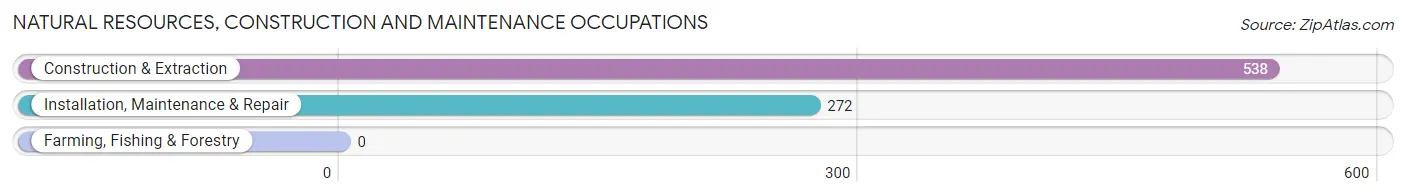
Natural Resources, Construction and Maintenance Occupations
The most common Natural Resources, Construction and Maintenance occupations in Craig are Construction & Extraction (538 | 12.1%), and Installation, Maintenance & Repair (272 | 6.1%).
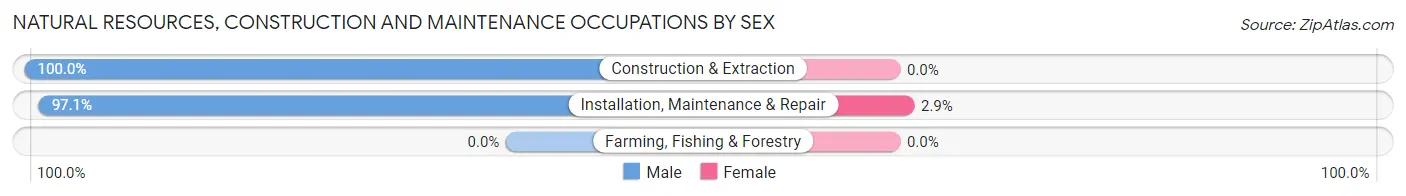
Natural Resources, Construction and Maintenance Occupations by Sex
| Occupation | Male | Female |
| Farming, Fishing & Forestry | 0 (0.0%) | 0 (0.0%) |
| Construction & Extraction | 538 (100.0%) | 0 (0.0%) |
| Installation, Maintenance & Repair | 264 (97.1%) | 8 (2.9%) |
| Total (Category) | 802 (99.0%) | 8 (1.0%) |
| Total (Overall) | 2,351 (53.0%) | 2,082 (47.0%) |
Production, Transportation and Moving Occupations
The most common Production, Transportation and Moving occupations in Craig are Transportation (241 | 5.4%), Production (173 | 3.9%), and Material Moving (123 | 2.8%).
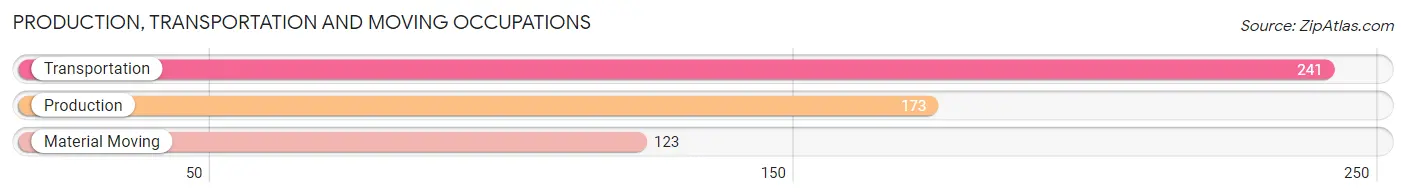
Production, Transportation and Moving Occupations by Sex
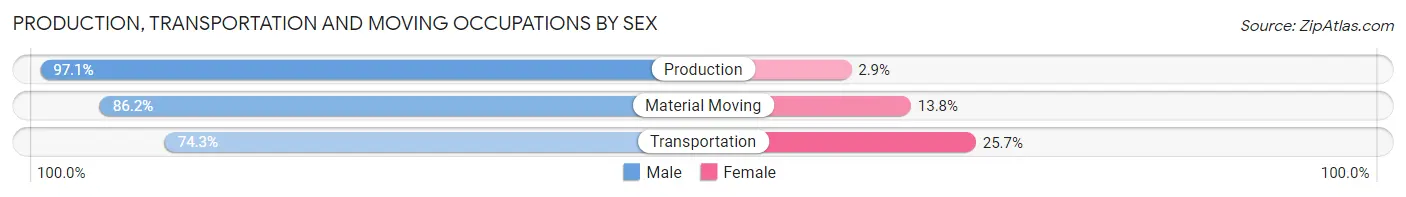
| Occupation | Male | Female |
| Production | 168 (97.1%) | 5 (2.9%) |
| Transportation | 179 (74.3%) | 62 (25.7%) |
| Material Moving | 106 (86.2%) | 17 (13.8%) |
| Total (Category) | 453 (84.4%) | 84 (15.6%) |
| Total (Overall) | 2,351 (53.0%) | 2,082 (47.0%) |
Employment Industries by Sex in Craig
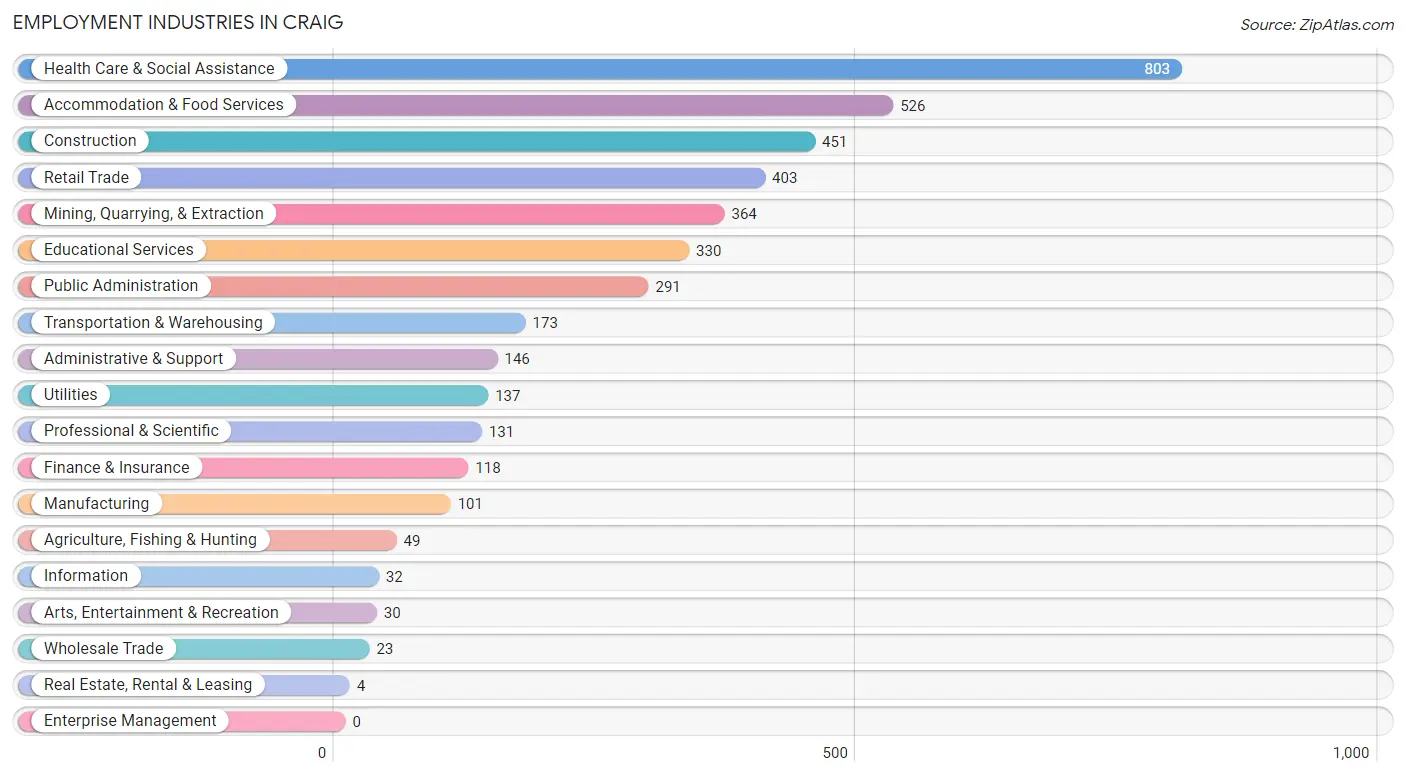
Employment Industries in Craig
The major employment industries in Craig include Health Care & Social Assistance (803 | 18.1%), Accommodation & Food Services (526 | 11.9%), Construction (451 | 10.2%), Retail Trade (403 | 9.1%), and Mining, Quarrying, & Extraction (364 | 8.2%).
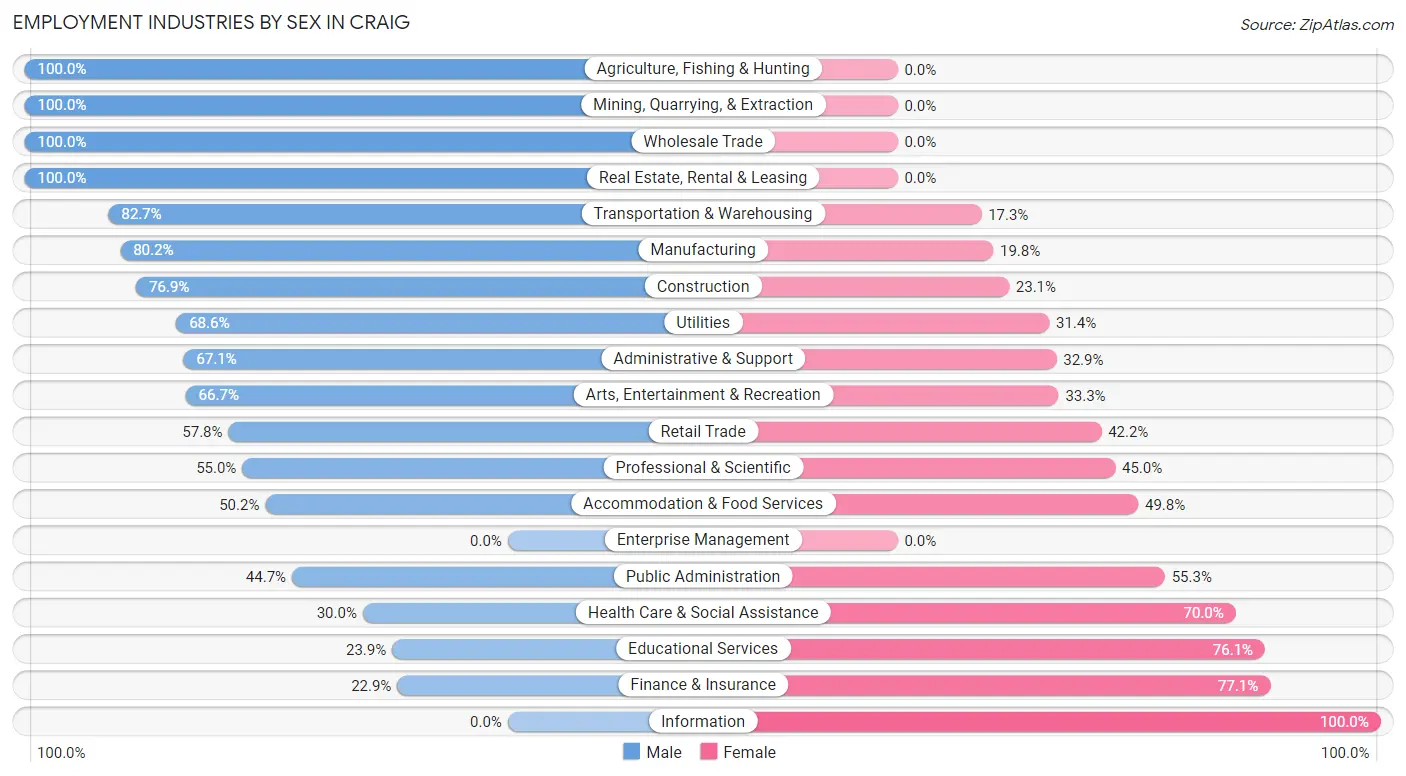
Employment Industries by Sex in Craig
The Craig industries that see more men than women are Agriculture, Fishing & Hunting (100.0%), Mining, Quarrying, & Extraction (100.0%), and Wholesale Trade (100.0%), whereas the industries that tend to have a higher number of women are Information (100.0%), Finance & Insurance (77.1%), and Educational Services (76.1%).
| Industry | Male | Female |
| Agriculture, Fishing & Hunting | 49 (100.0%) | 0 (0.0%) |
| Mining, Quarrying, & Extraction | 364 (100.0%) | 0 (0.0%) |
| Construction | 347 (76.9%) | 104 (23.1%) |
| Manufacturing | 81 (80.2%) | 20 (19.8%) |
| Wholesale Trade | 23 (100.0%) | 0 (0.0%) |
| Retail Trade | 233 (57.8%) | 170 (42.2%) |
| Transportation & Warehousing | 143 (82.7%) | 30 (17.3%) |
| Utilities | 94 (68.6%) | 43 (31.4%) |
| Information | 0 (0.0%) | 32 (100.0%) |
| Finance & Insurance | 27 (22.9%) | 91 (77.1%) |
| Real Estate, Rental & Leasing | 4 (100.0%) | 0 (0.0%) |
| Professional & Scientific | 72 (55.0%) | 59 (45.0%) |
| Enterprise Management | 0 (0.0%) | 0 (0.0%) |
| Administrative & Support | 98 (67.1%) | 48 (32.9%) |
| Educational Services | 79 (23.9%) | 251 (76.1%) |
| Health Care & Social Assistance | 241 (30.0%) | 562 (70.0%) |
| Arts, Entertainment & Recreation | 20 (66.7%) | 10 (33.3%) |
| Accommodation & Food Services | 264 (50.2%) | 262 (49.8%) |
| Public Administration | 130 (44.7%) | 161 (55.3%) |
| Total | 2,351 (53.0%) | 2,082 (47.0%) |
Education in Craig
School Enrollment in Craig
The most common levels of schooling among the 1,938 students in Craig are middle school (562 | 29.0%), high school (445 | 23.0%), and elementary school (378 | 19.5%).
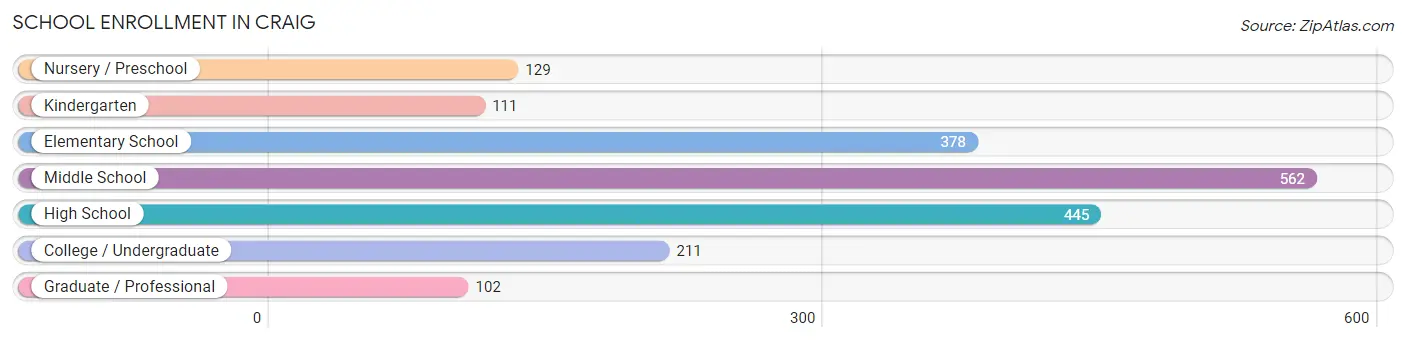
| School Level | # Students | % Students |
| Nursery / Preschool | 129 | 6.7% |
| Kindergarten | 111 | 5.7% |
| Elementary School | 378 | 19.5% |
| Middle School | 562 | 29.0% |
| High School | 445 | 23.0% |
| College / Undergraduate | 211 | 10.9% |
| Graduate / Professional | 102 | 5.3% |
| Total | 1,938 | 100.0% |
School Enrollment by Age by Funding Source in Craig
Out of a total of 1,938 students who are enrolled in schools in Craig, 229 (11.8%) attend a private institution, while the remaining 1,709 (88.2%) are enrolled in public schools. The age group of 35 years and over has the highest likelihood of being enrolled in private schools, with 45 (33.6% in the age bracket) enrolled. Conversely, the age group of 3 to 4 year olds has the lowest likelihood of being enrolled in a private school, with 59 (100.0% in the age bracket) attending a public institution.
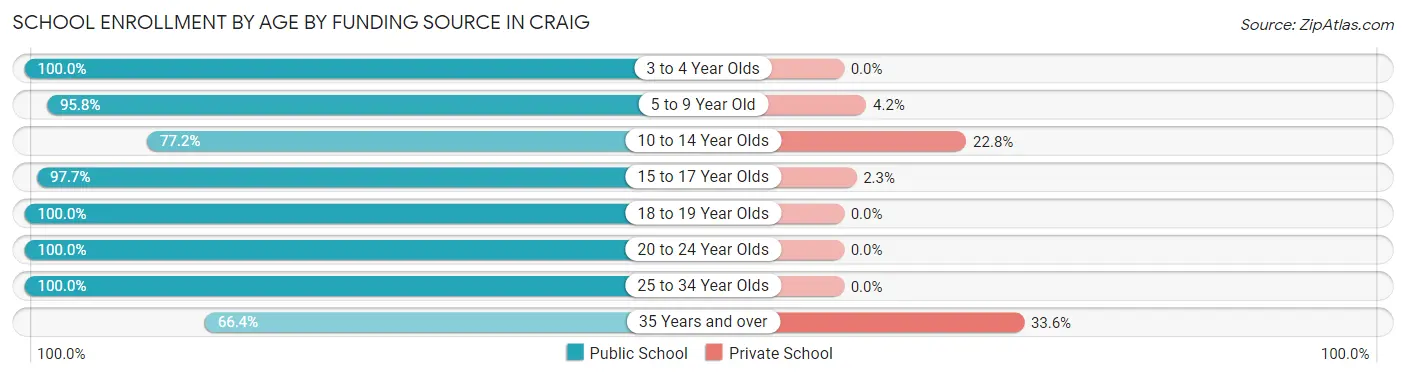
| Age Bracket | Public School | Private School |
| 3 to 4 Year Olds | 59 (100.0%) | 0 (0.0%) |
| 5 to 9 Year Old | 458 (95.8%) | 20 (4.2%) |
| 10 to 14 Year Olds | 521 (77.2%) | 154 (22.8%) |
| 15 to 17 Year Olds | 378 (97.7%) | 9 (2.3%) |
| 18 to 19 Year Olds | 20 (100.0%) | 0 (0.0%) |
| 20 to 24 Year Olds | 63 (100.0%) | 0 (0.0%) |
| 25 to 34 Year Olds | 122 (100.0%) | 0 (0.0%) |
| 35 Years and over | 89 (66.4%) | 45 (33.6%) |
| Total | 1,709 (88.2%) | 229 (11.8%) |
Educational Attainment by Field of Study in Craig
Education (229 | 16.0%), psychology (215 | 15.0%), bio, nature & agricultural (200 | 13.9%), business (183 | 12.7%), and communications (158 | 11.0%) are the most common fields of study among 1,436 individuals in Craig who have obtained a bachelor's degree or higher.
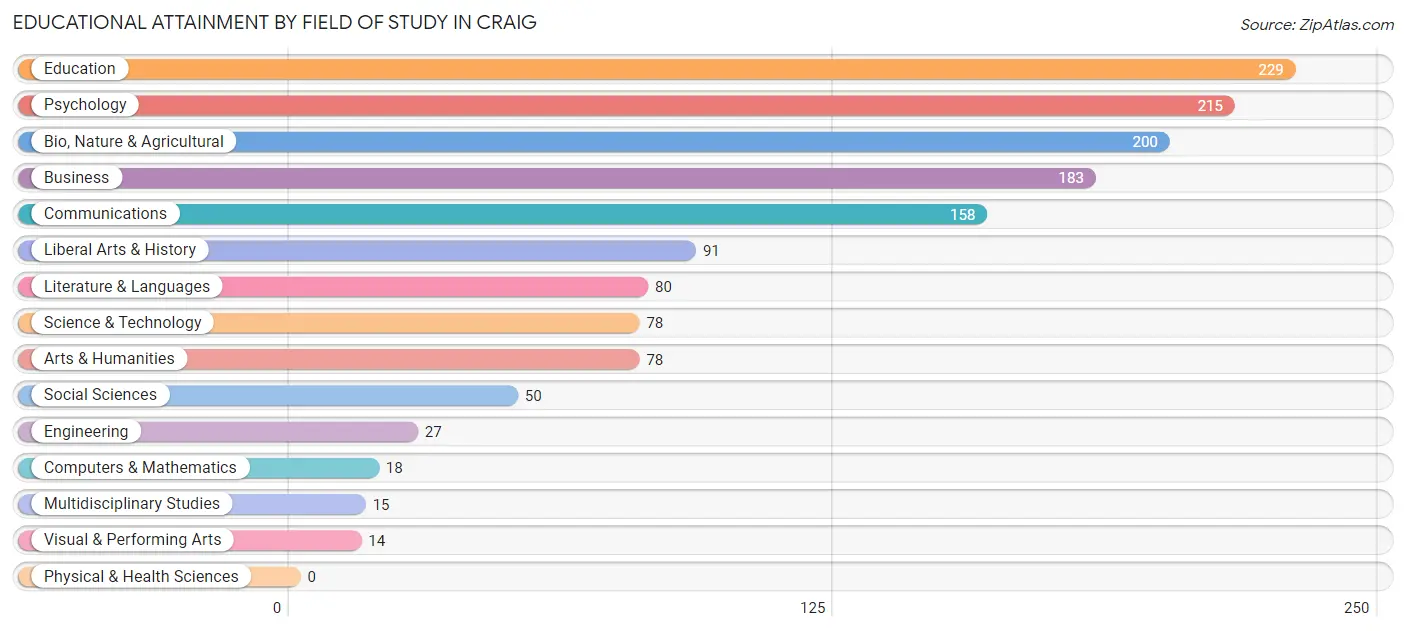
| Field of Study | # Graduates | % Graduates |
| Computers & Mathematics | 18 | 1.3% |
| Bio, Nature & Agricultural | 200 | 13.9% |
| Physical & Health Sciences | 0 | 0.0% |
| Psychology | 215 | 15.0% |
| Social Sciences | 50 | 3.5% |
| Engineering | 27 | 1.9% |
| Multidisciplinary Studies | 15 | 1.0% |
| Science & Technology | 78 | 5.4% |
| Business | 183 | 12.7% |
| Education | 229 | 16.0% |
| Literature & Languages | 80 | 5.6% |
| Liberal Arts & History | 91 | 6.3% |
| Visual & Performing Arts | 14 | 1.0% |
| Communications | 158 | 11.0% |
| Arts & Humanities | 78 | 5.4% |
| Total | 1,436 | 100.0% |
Transportation & Commute in Craig
Vehicle Availability by Sex in Craig
The most prevalent vehicle ownership categories in Craig are males with 2 vehicles (1,068, accounting for 45.6%) and females with 2 vehicles (759, making up 51.6%).
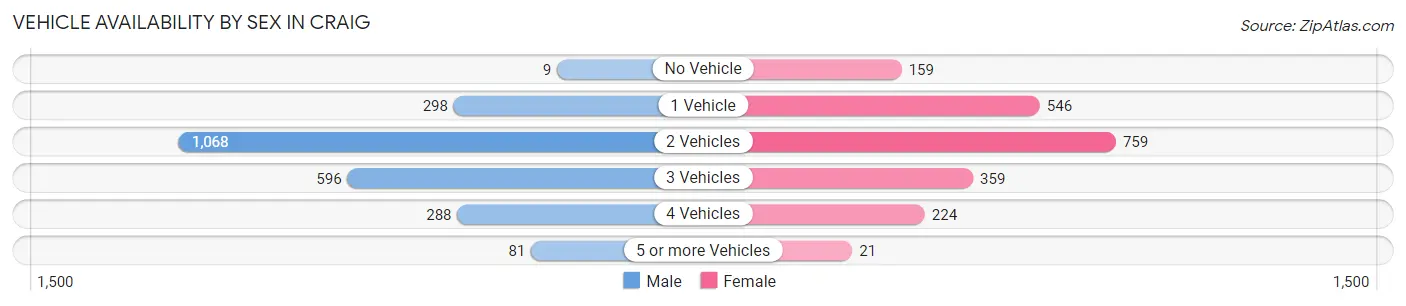
| Vehicles Available | Male | Female |
| No Vehicle | 9 (0.4%) | 159 (7.7%) |
| 1 Vehicle | 298 (12.7%) | 546 (26.4%) |
| 2 Vehicles | 1,068 (45.6%) | 759 (36.7%) |
| 3 Vehicles | 596 (25.5%) | 359 (17.4%) |
| 4 Vehicles | 288 (12.3%) | 224 (10.8%) |
| 5 or more Vehicles | 81 (3.5%) | 21 (1.0%) |
| Total | 2,340 (100.0%) | 2,068 (100.0%) |
Commute Time in Craig
The most frequently occuring commute durations in Craig are 5 to 9 minutes (1,334 commuters, 30.9%), 10 to 14 minutes (650 commuters, 15.0%), and 60 to 89 minutes (647 commuters, 15.0%).
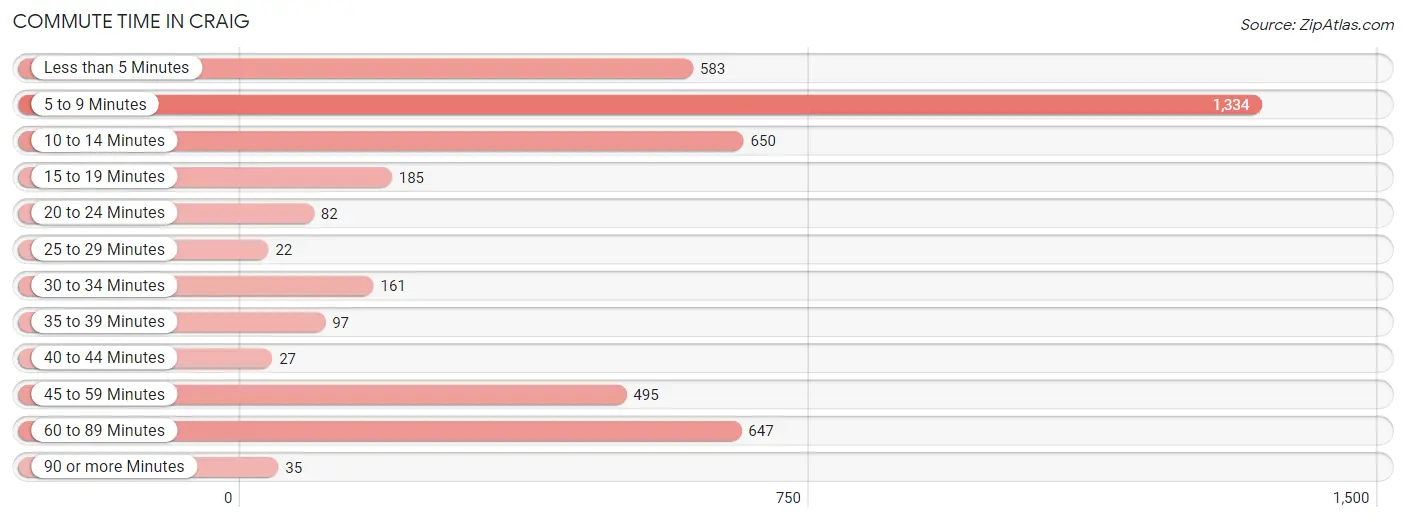
| Commute Time | # Commuters | % Commuters |
| Less than 5 Minutes | 583 | 13.5% |
| 5 to 9 Minutes | 1,334 | 30.9% |
| 10 to 14 Minutes | 650 | 15.0% |
| 15 to 19 Minutes | 185 | 4.3% |
| 20 to 24 Minutes | 82 | 1.9% |
| 25 to 29 Minutes | 22 | 0.5% |
| 30 to 34 Minutes | 161 | 3.7% |
| 35 to 39 Minutes | 97 | 2.2% |
| 40 to 44 Minutes | 27 | 0.6% |
| 45 to 59 Minutes | 495 | 11.5% |
| 60 to 89 Minutes | 647 | 15.0% |
| 90 or more Minutes | 35 | 0.8% |
Commute Time by Sex in Craig
The most common commute times in Craig are 5 to 9 minutes (670 commuters, 28.7%) for males and 5 to 9 minutes (664 commuters, 33.4%) for females.
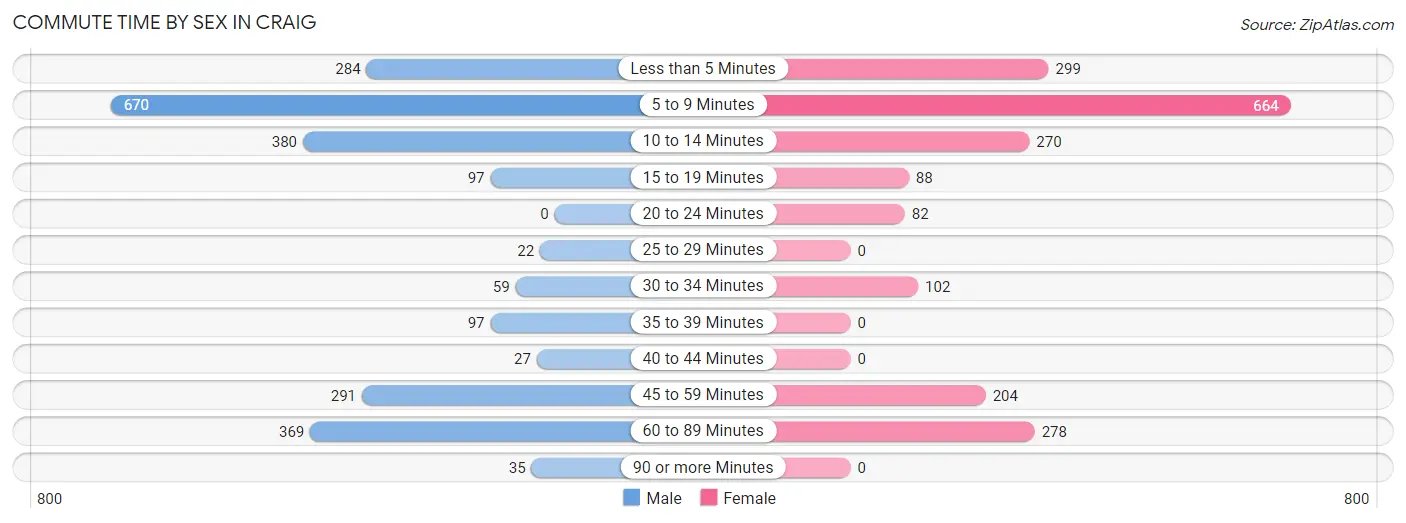
| Commute Time | Male | Female |
| Less than 5 Minutes | 284 (12.2%) | 299 (15.0%) |
| 5 to 9 Minutes | 670 (28.7%) | 664 (33.4%) |
| 10 to 14 Minutes | 380 (16.3%) | 270 (13.6%) |
| 15 to 19 Minutes | 97 (4.2%) | 88 (4.4%) |
| 20 to 24 Minutes | 0 (0.0%) | 82 (4.1%) |
| 25 to 29 Minutes | 22 (0.9%) | 0 (0.0%) |
| 30 to 34 Minutes | 59 (2.5%) | 102 (5.1%) |
| 35 to 39 Minutes | 97 (4.2%) | 0 (0.0%) |
| 40 to 44 Minutes | 27 (1.2%) | 0 (0.0%) |
| 45 to 59 Minutes | 291 (12.5%) | 204 (10.3%) |
| 60 to 89 Minutes | 369 (15.8%) | 278 (14.0%) |
| 90 or more Minutes | 35 (1.5%) | 0 (0.0%) |
Time of Departure to Work by Sex in Craig
The most frequent times of departure to work in Craig are 7:00 AM to 7:29 AM (348, 14.9%) for males and 7:00 AM to 7:29 AM (393, 19.8%) for females.
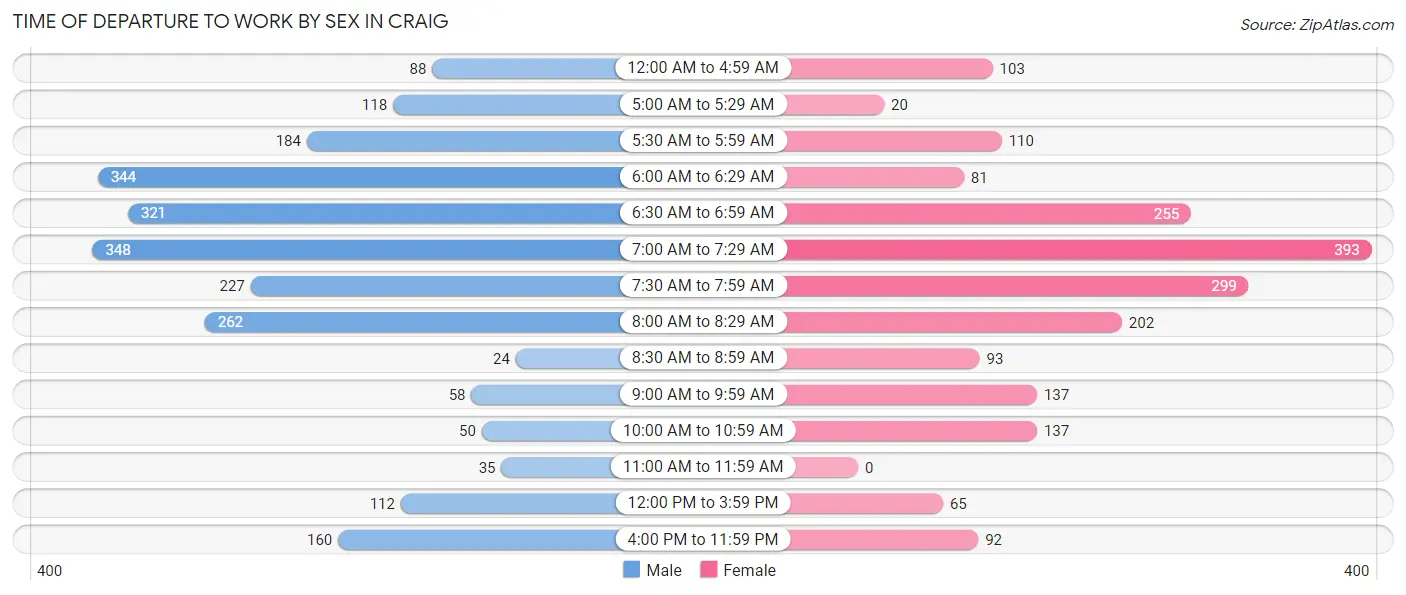
| Time of Departure | Male | Female |
| 12:00 AM to 4:59 AM | 88 (3.8%) | 103 (5.2%) |
| 5:00 AM to 5:29 AM | 118 (5.1%) | 20 (1.0%) |
| 5:30 AM to 5:59 AM | 184 (7.9%) | 110 (5.5%) |
| 6:00 AM to 6:29 AM | 344 (14.8%) | 81 (4.1%) |
| 6:30 AM to 6:59 AM | 321 (13.8%) | 255 (12.8%) |
| 7:00 AM to 7:29 AM | 348 (14.9%) | 393 (19.8%) |
| 7:30 AM to 7:59 AM | 227 (9.7%) | 299 (15.0%) |
| 8:00 AM to 8:29 AM | 262 (11.2%) | 202 (10.2%) |
| 8:30 AM to 8:59 AM | 24 (1.0%) | 93 (4.7%) |
| 9:00 AM to 9:59 AM | 58 (2.5%) | 137 (6.9%) |
| 10:00 AM to 10:59 AM | 50 (2.1%) | 137 (6.9%) |
| 11:00 AM to 11:59 AM | 35 (1.5%) | 0 (0.0%) |
| 12:00 PM to 3:59 PM | 112 (4.8%) | 65 (3.3%) |
| 4:00 PM to 11:59 PM | 160 (6.9%) | 92 (4.6%) |
| Total | 2,331 (100.0%) | 1,987 (100.0%) |
Housing Occupancy in Craig
Occupancy by Ownership in Craig
Of the total 3,806 dwellings in Craig, owner-occupied units account for 2,250 (59.1%), while renter-occupied units make up 1,556 (40.9%).
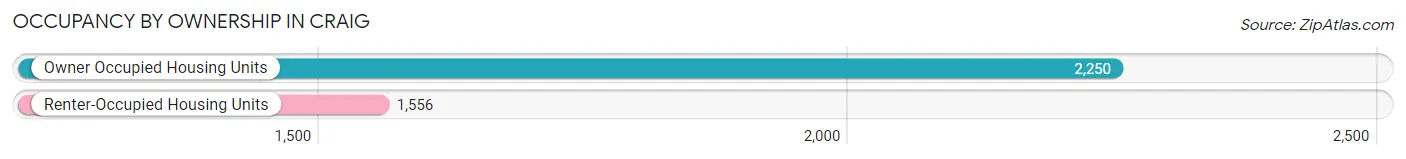
| Occupancy | # Housing Units | % Housing Units |
| Owner Occupied Housing Units | 2,250 | 59.1% |
| Renter-Occupied Housing Units | 1,556 | 40.9% |
| Total Occupied Housing Units | 3,806 | 100.0% |
Occupancy by Household Size in Craig
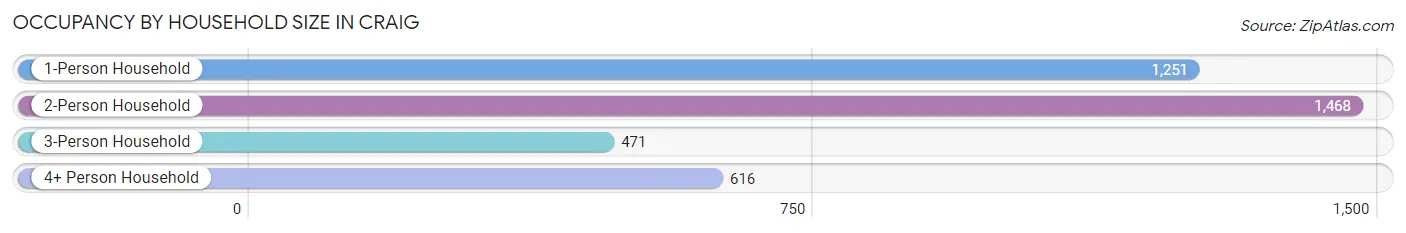
| Household Size | # Housing Units | % Housing Units |
| 1-Person Household | 1,251 | 32.9% |
| 2-Person Household | 1,468 | 38.6% |
| 3-Person Household | 471 | 12.4% |
| 4+ Person Household | 616 | 16.2% |
| Total Housing Units | 3,806 | 100.0% |
Occupancy by Ownership by Household Size in Craig
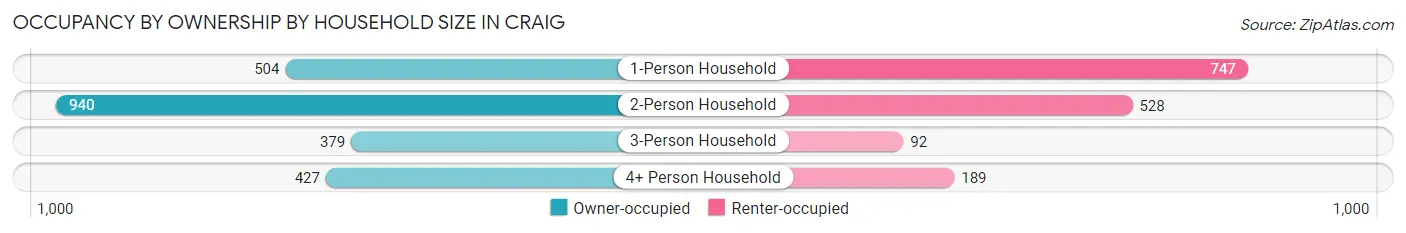
| Household Size | Owner-occupied | Renter-occupied |
| 1-Person Household | 504 (40.3%) | 747 (59.7%) |
| 2-Person Household | 940 (64.0%) | 528 (36.0%) |
| 3-Person Household | 379 (80.5%) | 92 (19.5%) |
| 4+ Person Household | 427 (69.3%) | 189 (30.7%) |
| Total Housing Units | 2,250 (59.1%) | 1,556 (40.9%) |
Occupancy by Educational Attainment in Craig
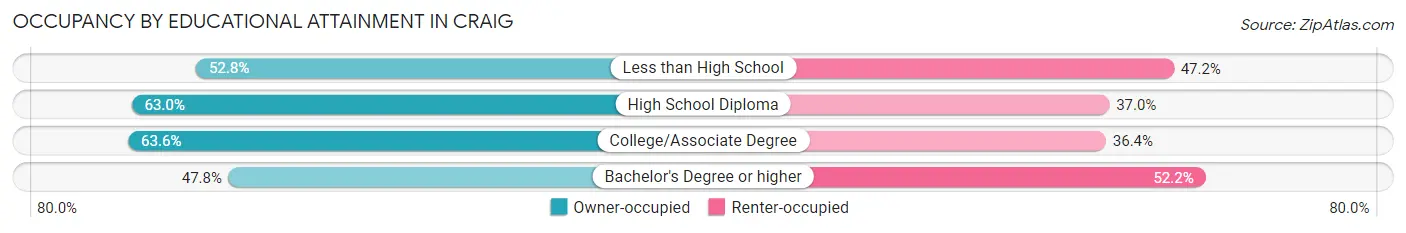
| Household Size | Owner-occupied | Renter-occupied |
| Less than High School | 94 (52.8%) | 84 (47.2%) |
| High School Diploma | 1,001 (63.0%) | 587 (37.0%) |
| College/Associate Degree | 726 (63.6%) | 416 (36.4%) |
| Bachelor's Degree or higher | 429 (47.8%) | 469 (52.2%) |
Occupancy by Age of Householder in Craig
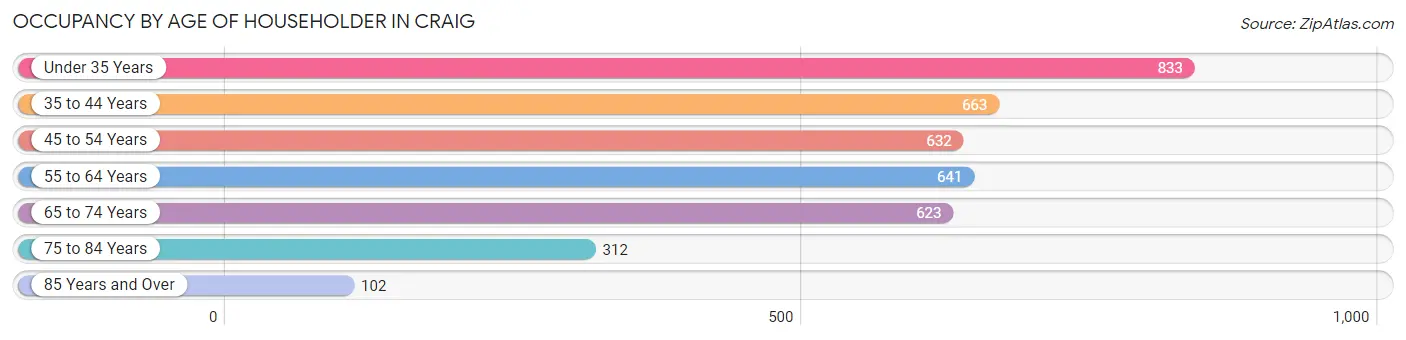
| Age Bracket | # Households | % Households |
| Under 35 Years | 833 | 21.9% |
| 35 to 44 Years | 663 | 17.4% |
| 45 to 54 Years | 632 | 16.6% |
| 55 to 64 Years | 641 | 16.8% |
| 65 to 74 Years | 623 | 16.4% |
| 75 to 84 Years | 312 | 8.2% |
| 85 Years and Over | 102 | 2.7% |
| Total | 3,806 | 100.0% |
Housing Finances in Craig
Median Income by Occupancy in Craig
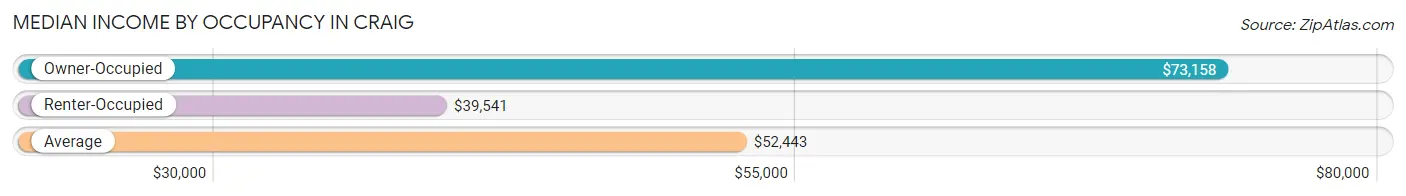
| Occupancy Type | # Households | Median Income |
| Owner-Occupied | 2,250 (59.1%) | $73,158 |
| Renter-Occupied | 1,556 (40.9%) | $39,541 |
| Average | 3,806 (100.0%) | $52,443 |
Occupancy by Householder Income Bracket in Craig
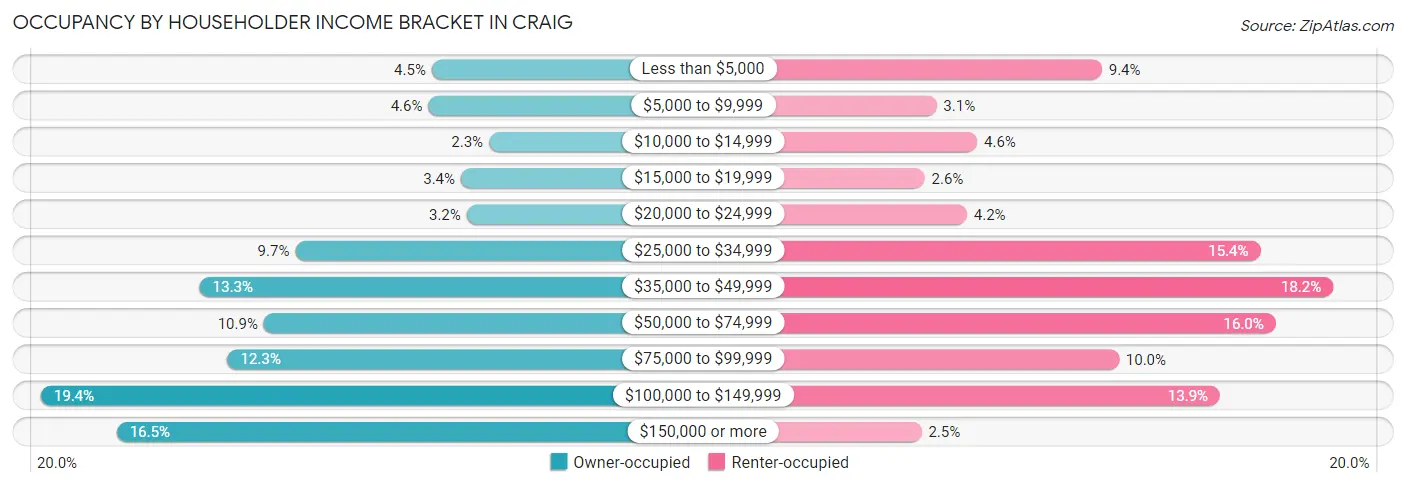
| Income Bracket | Owner-occupied | Renter-occupied |
| Less than $5,000 | 101 (4.5%) | 146 (9.4%) |
| $5,000 to $9,999 | 104 (4.6%) | 48 (3.1%) |
| $10,000 to $14,999 | 52 (2.3%) | 72 (4.6%) |
| $15,000 to $19,999 | 76 (3.4%) | 41 (2.6%) |
| $20,000 to $24,999 | 71 (3.2%) | 66 (4.2%) |
| $25,000 to $34,999 | 218 (9.7%) | 240 (15.4%) |
| $35,000 to $49,999 | 300 (13.3%) | 283 (18.2%) |
| $50,000 to $74,999 | 245 (10.9%) | 249 (16.0%) |
| $75,000 to $99,999 | 276 (12.3%) | 156 (10.0%) |
| $100,000 to $149,999 | 436 (19.4%) | 216 (13.9%) |
| $150,000 or more | 371 (16.5%) | 39 (2.5%) |
| Total | 2,250 (100.0%) | 1,556 (100.0%) |
Monthly Housing Cost Tiers in Craig
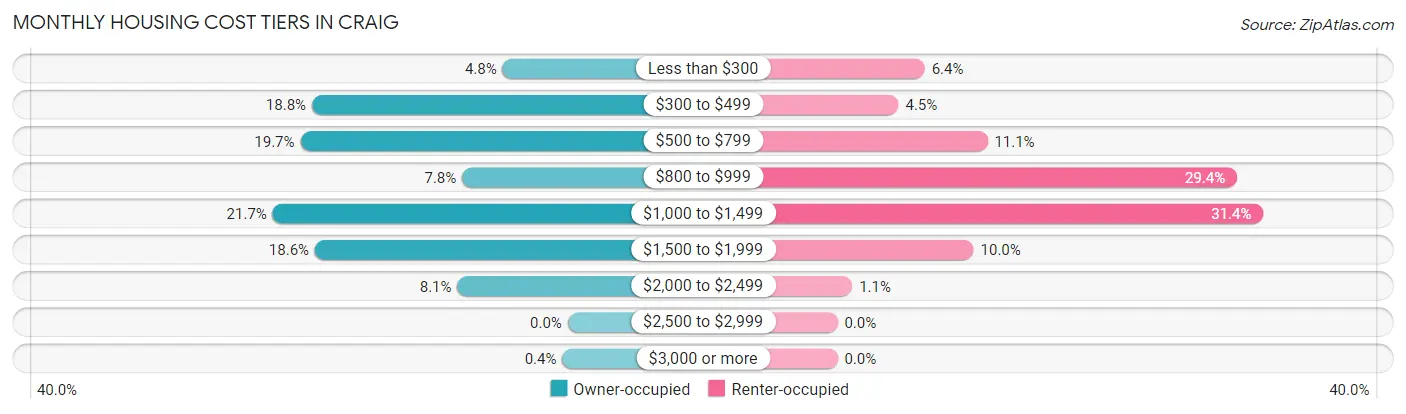
| Monthly Cost | Owner-occupied | Renter-occupied |
| Less than $300 | 108 (4.8%) | 100 (6.4%) |
| $300 to $499 | 424 (18.8%) | 70 (4.5%) |
| $500 to $799 | 443 (19.7%) | 172 (11.1%) |
| $800 to $999 | 175 (7.8%) | 458 (29.4%) |
| $1,000 to $1,499 | 489 (21.7%) | 488 (31.4%) |
| $1,500 to $1,999 | 419 (18.6%) | 156 (10.0%) |
| $2,000 to $2,499 | 183 (8.1%) | 17 (1.1%) |
| $2,500 to $2,999 | 0 (0.0%) | 0 (0.0%) |
| $3,000 or more | 9 (0.4%) | 0 (0.0%) |
| Total | 2,250 (100.0%) | 1,556 (100.0%) |
Physical Housing Characteristics in Craig
Housing Structures in Craig
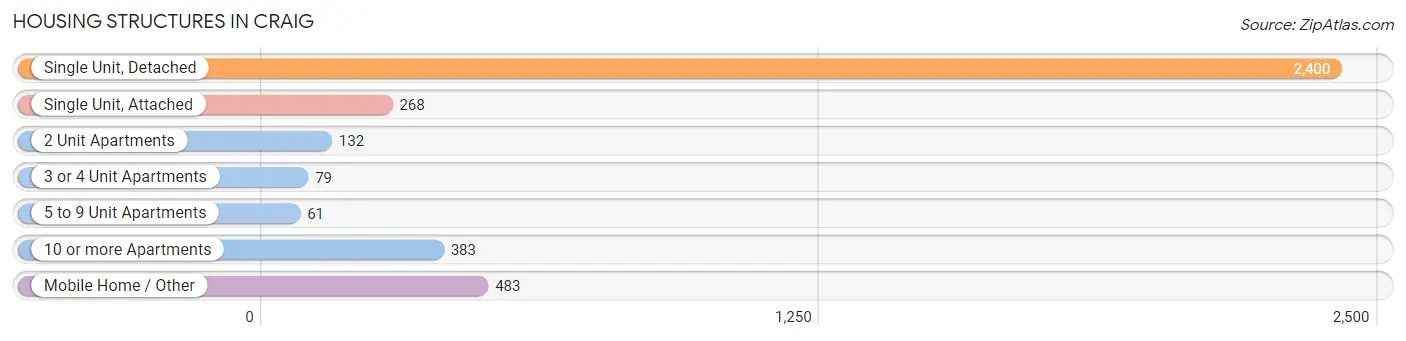
| Structure Type | # Housing Units | % Housing Units |
| Single Unit, Detached | 2,400 | 63.1% |
| Single Unit, Attached | 268 | 7.0% |
| 2 Unit Apartments | 132 | 3.5% |
| 3 or 4 Unit Apartments | 79 | 2.1% |
| 5 to 9 Unit Apartments | 61 | 1.6% |
| 10 or more Apartments | 383 | 10.1% |
| Mobile Home / Other | 483 | 12.7% |
| Total | 3,806 | 100.0% |
Housing Structures by Occupancy in Craig
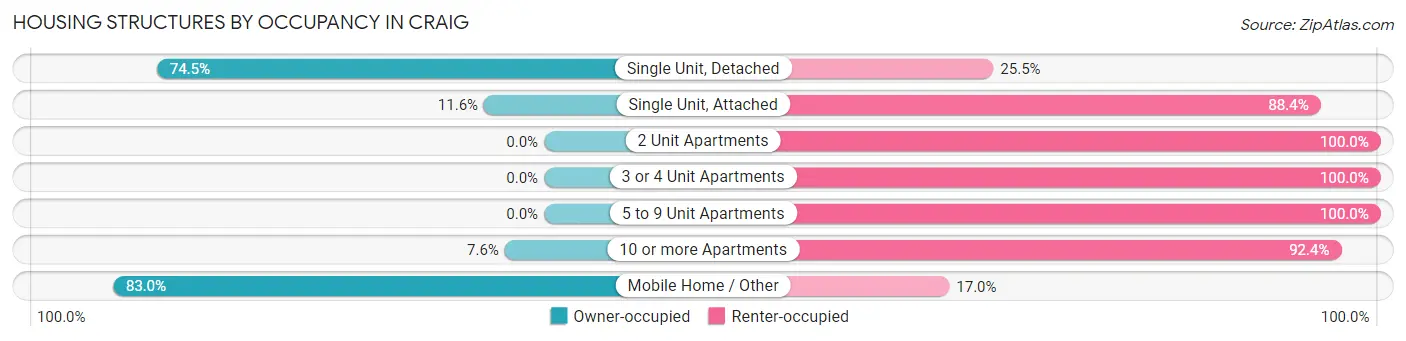
| Structure Type | Owner-occupied | Renter-occupied |
| Single Unit, Detached | 1,789 (74.5%) | 611 (25.5%) |
| Single Unit, Attached | 31 (11.6%) | 237 (88.4%) |
| 2 Unit Apartments | 0 (0.0%) | 132 (100.0%) |
| 3 or 4 Unit Apartments | 0 (0.0%) | 79 (100.0%) |
| 5 to 9 Unit Apartments | 0 (0.0%) | 61 (100.0%) |
| 10 or more Apartments | 29 (7.6%) | 354 (92.4%) |
| Mobile Home / Other | 401 (83.0%) | 82 (17.0%) |
| Total | 2,250 (59.1%) | 1,556 (40.9%) |
Housing Structures by Number of Rooms in Craig
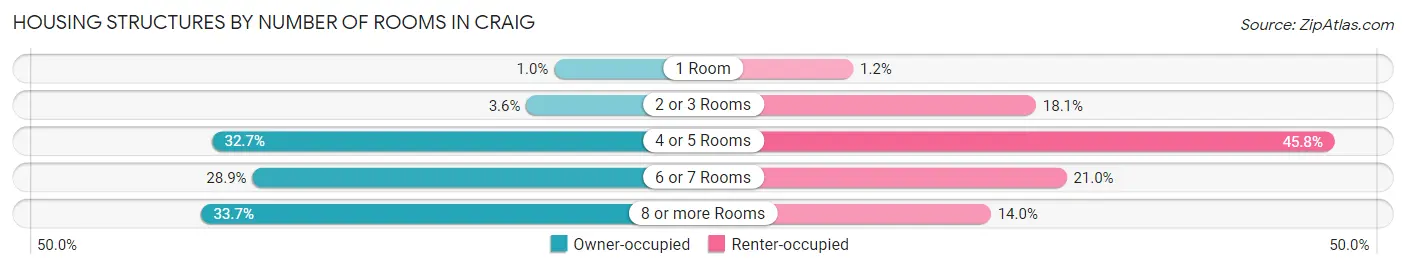
| Number of Rooms | Owner-occupied | Renter-occupied |
| 1 Room | 23 (1.0%) | 19 (1.2%) |
| 2 or 3 Rooms | 81 (3.6%) | 282 (18.1%) |
| 4 or 5 Rooms | 736 (32.7%) | 712 (45.8%) |
| 6 or 7 Rooms | 651 (28.9%) | 326 (20.9%) |
| 8 or more Rooms | 759 (33.7%) | 217 (14.0%) |
| Total | 2,250 (100.0%) | 1,556 (100.0%) |
Housing Structure by Heating Type in Craig
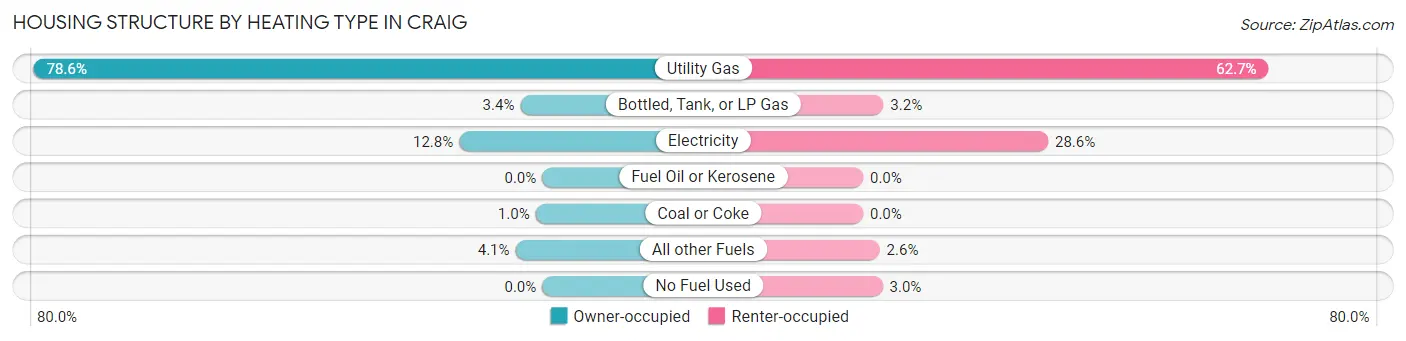
| Heating Type | Owner-occupied | Renter-occupied |
| Utility Gas | 1,769 (78.6%) | 975 (62.7%) |
| Bottled, Tank, or LP Gas | 76 (3.4%) | 49 (3.2%) |
| Electricity | 289 (12.8%) | 445 (28.6%) |
| Fuel Oil or Kerosene | 0 (0.0%) | 0 (0.0%) |
| Coal or Coke | 23 (1.0%) | 0 (0.0%) |
| All other Fuels | 93 (4.1%) | 40 (2.6%) |
| No Fuel Used | 0 (0.0%) | 47 (3.0%) |
| Total | 2,250 (100.0%) | 1,556 (100.0%) |
Household Vehicle Usage in Craig
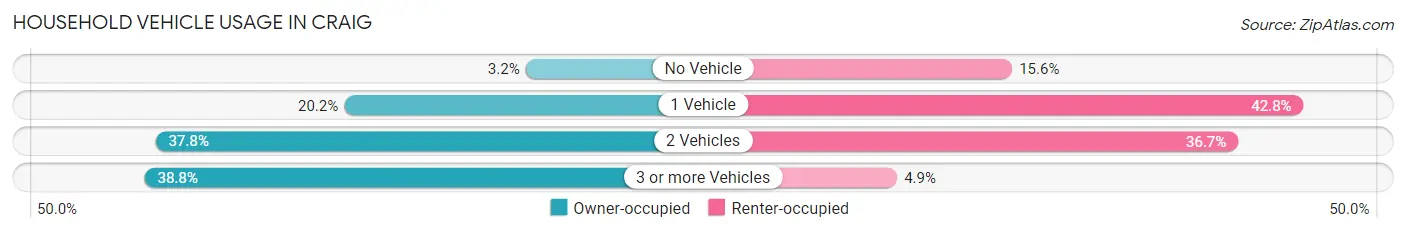
| Vehicles per Household | Owner-occupied | Renter-occupied |
| No Vehicle | 73 (3.2%) | 243 (15.6%) |
| 1 Vehicle | 454 (20.2%) | 666 (42.8%) |
| 2 Vehicles | 850 (37.8%) | 571 (36.7%) |
| 3 or more Vehicles | 873 (38.8%) | 76 (4.9%) |
| Total | 2,250 (100.0%) | 1,556 (100.0%) |
Real Estate & Mortgages in Craig
Real Estate and Mortgage Overview in Craig
| Characteristic | Without Mortgage | With Mortgage |
| Housing Units | 866 | 1,384 |
| Median Property Value | $186,200 | $239,000 |
| Median Household Income | $41,528 | $320 |
| Monthly Housing Costs | $464 | $9 |
| Real Estate Taxes | $906 | $101 |
Property Value by Mortgage Status in Craig
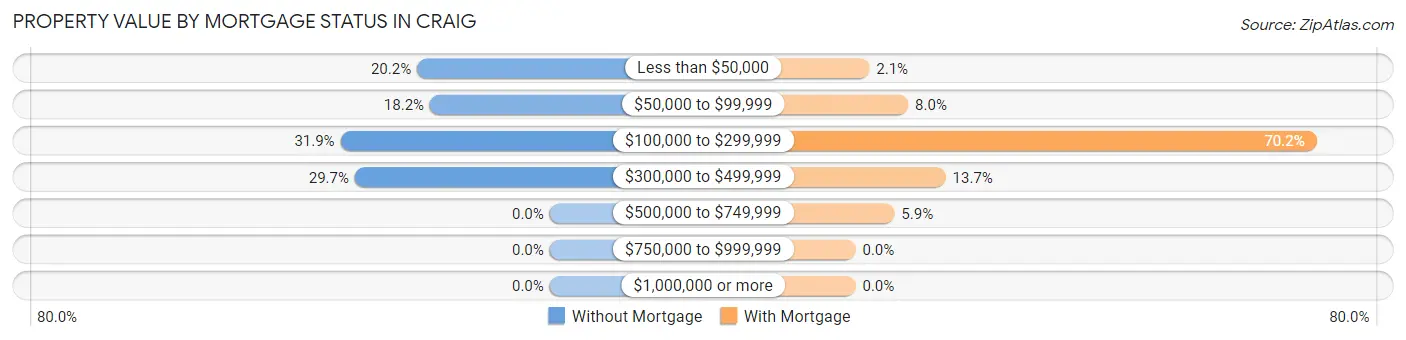
| Property Value | Without Mortgage | With Mortgage |
| Less than $50,000 | 175 (20.2%) | 29 (2.1%) |
| $50,000 to $99,999 | 158 (18.2%) | 111 (8.0%) |
| $100,000 to $299,999 | 276 (31.9%) | 972 (70.2%) |
| $300,000 to $499,999 | 257 (29.7%) | 190 (13.7%) |
| $500,000 to $749,999 | 0 (0.0%) | 82 (5.9%) |
| $750,000 to $999,999 | 0 (0.0%) | 0 (0.0%) |
| $1,000,000 or more | 0 (0.0%) | 0 (0.0%) |
| Total | 866 (100.0%) | 1,384 (100.0%) |
Household Income by Mortgage Status in Craig
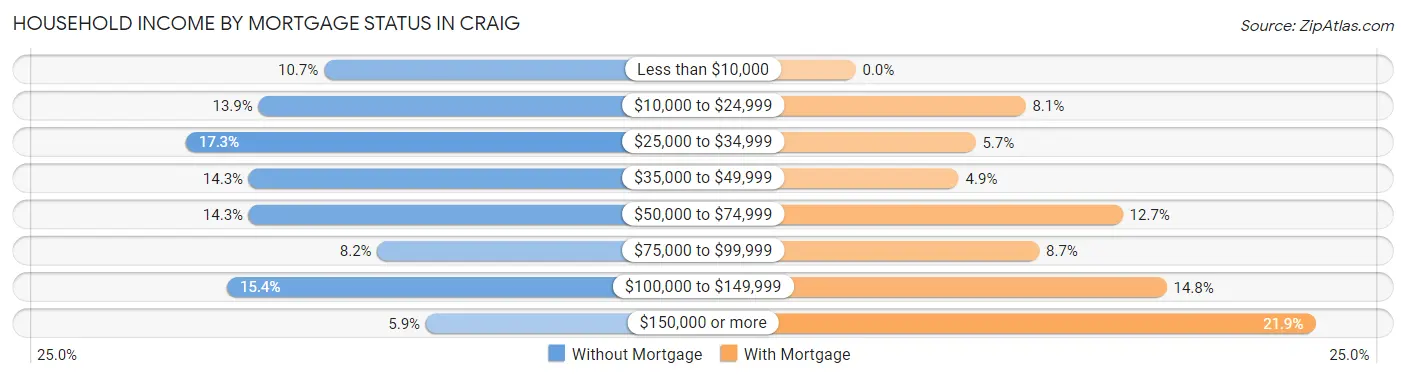
| Household Income | Without Mortgage | With Mortgage |
| Less than $10,000 | 93 (10.7%) | 0 (0.0%) |
| $10,000 to $24,999 | 120 (13.9%) | 112 (8.1%) |
| $25,000 to $34,999 | 150 (17.3%) | 79 (5.7%) |
| $35,000 to $49,999 | 124 (14.3%) | 68 (4.9%) |
| $50,000 to $74,999 | 124 (14.3%) | 176 (12.7%) |
| $75,000 to $99,999 | 71 (8.2%) | 121 (8.7%) |
| $100,000 to $149,999 | 133 (15.4%) | 205 (14.8%) |
| $150,000 or more | 51 (5.9%) | 303 (21.9%) |
| Total | 866 (100.0%) | 1,384 (100.0%) |
Property Value to Household Income Ratio in Craig
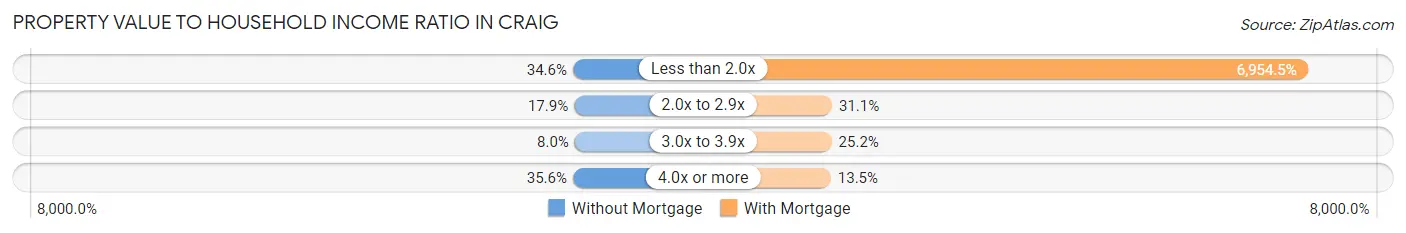
| Value-to-Income Ratio | Without Mortgage | With Mortgage |
| Less than 2.0x | 300 (34.6%) | 96,250 (6,954.5%) |
| 2.0x to 2.9x | 155 (17.9%) | 430 (31.1%) |
| 3.0x to 3.9x | 69 (8.0%) | 349 (25.2%) |
| 4.0x or more | 308 (35.6%) | 187 (13.5%) |
| Total | 866 (100.0%) | 1,384 (100.0%) |
Real Estate Taxes by Mortgage Status in Craig
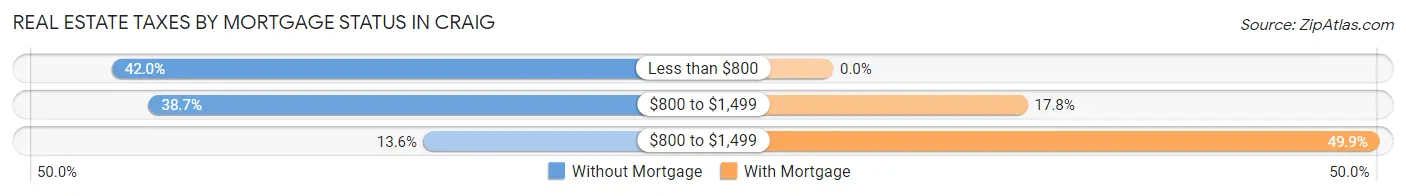
| Property Taxes | Without Mortgage | With Mortgage |
| Less than $800 | 364 (42.0%) | 0 (0.0%) |
| $800 to $1,499 | 335 (38.7%) | 246 (17.8%) |
| $800 to $1,499 | 118 (13.6%) | 691 (49.9%) |
| Total | 866 (100.0%) | 1,384 (100.0%) |
Health & Disability in Craig
Health Insurance Coverage by Age in Craig
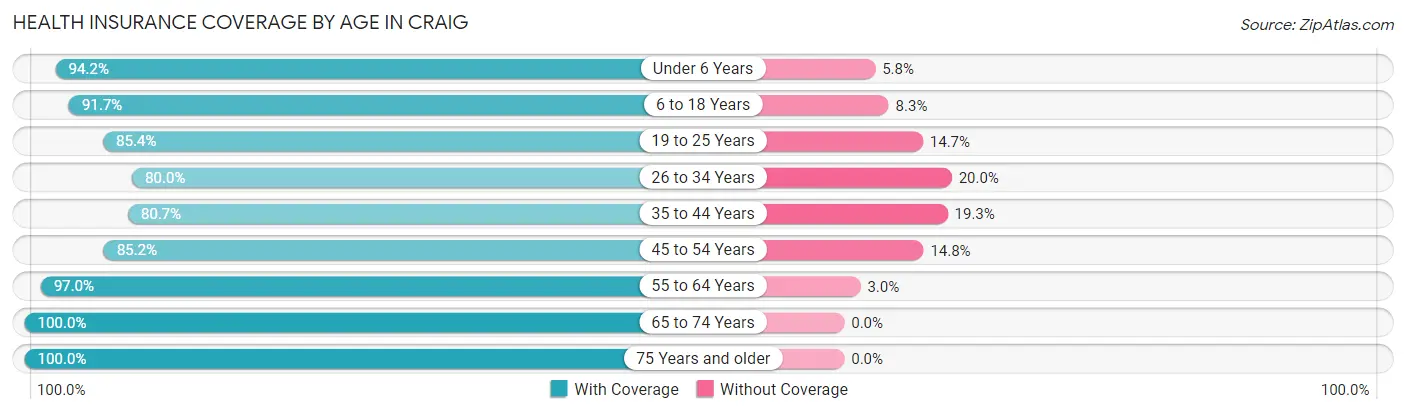
| Age Bracket | With Coverage | Without Coverage |
| Under 6 Years | 670 (94.2%) | 41 (5.8%) |
| 6 to 18 Years | 1,409 (91.7%) | 127 (8.3%) |
| 19 to 25 Years | 600 (85.4%) | 103 (14.6%) |
| 26 to 34 Years | 998 (80.0%) | 250 (20.0%) |
| 35 to 44 Years | 889 (80.7%) | 212 (19.3%) |
| 45 to 54 Years | 843 (85.2%) | 146 (14.8%) |
| 55 to 64 Years | 1,126 (97.0%) | 35 (3.0%) |
| 65 to 74 Years | 898 (100.0%) | 0 (0.0%) |
| 75 Years and older | 508 (100.0%) | 0 (0.0%) |
| Total | 7,941 (89.7%) | 914 (10.3%) |
Health Insurance Coverage by Citizenship Status in Craig
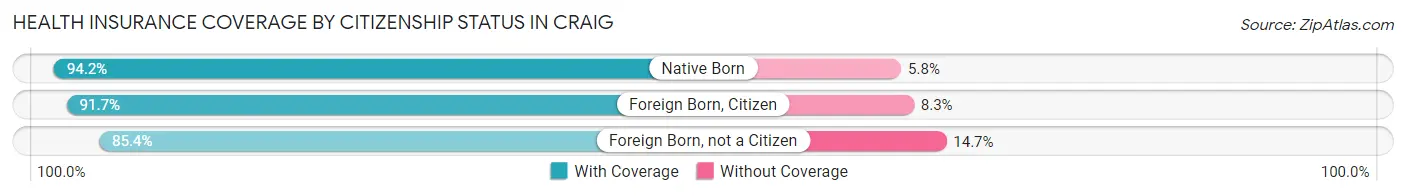
| Citizenship Status | With Coverage | Without Coverage |
| Native Born | 670 (94.2%) | 41 (5.8%) |
| Foreign Born, Citizen | 1,409 (91.7%) | 127 (8.3%) |
| Foreign Born, not a Citizen | 600 (85.4%) | 103 (14.6%) |
Health Insurance Coverage by Household Income in Craig
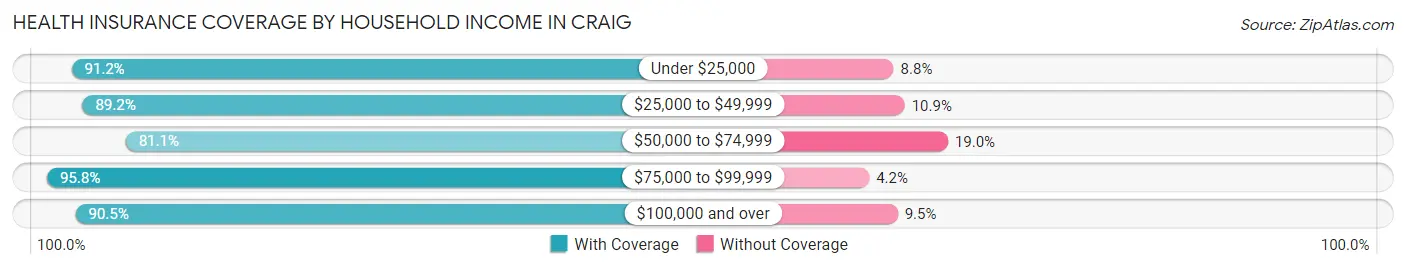
| Household Income | With Coverage | Without Coverage |
| Under $25,000 | 1,153 (91.2%) | 111 (8.8%) |
| $25,000 to $49,999 | 1,676 (89.1%) | 204 (10.8%) |
| $50,000 to $74,999 | 958 (81.0%) | 224 (19.0%) |
| $75,000 to $99,999 | 981 (95.8%) | 43 (4.2%) |
| $100,000 and over | 3,149 (90.5%) | 332 (9.5%) |
Public vs Private Health Insurance Coverage by Age in Craig
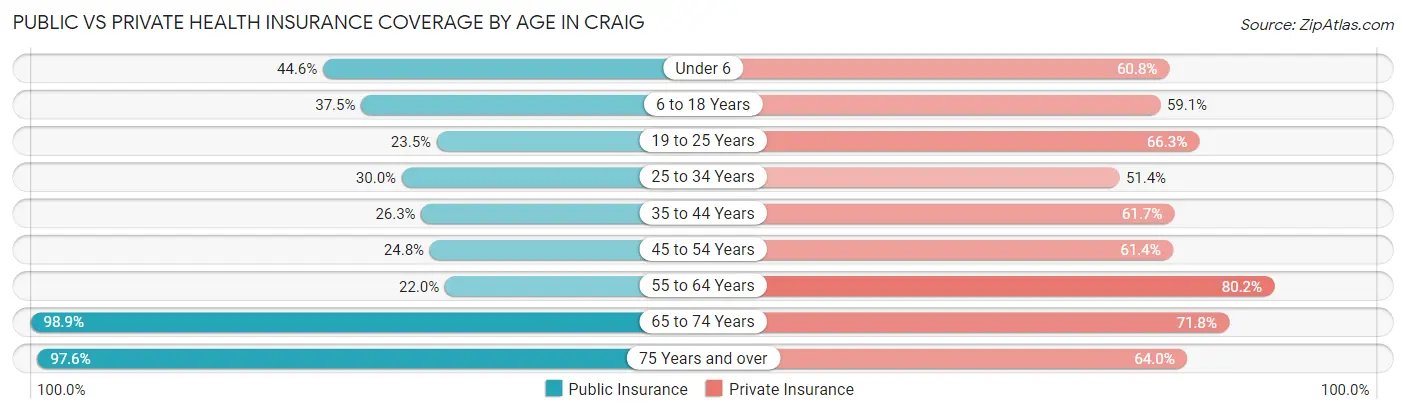
| Age Bracket | Public Insurance | Private Insurance |
| Under 6 | 317 (44.6%) | 432 (60.8%) |
| 6 to 18 Years | 576 (37.5%) | 907 (59.1%) |
| 19 to 25 Years | 165 (23.5%) | 466 (66.3%) |
| 25 to 34 Years | 374 (30.0%) | 642 (51.4%) |
| 35 to 44 Years | 290 (26.3%) | 679 (61.7%) |
| 45 to 54 Years | 245 (24.8%) | 607 (61.4%) |
| 55 to 64 Years | 255 (22.0%) | 931 (80.2%) |
| 65 to 74 Years | 888 (98.9%) | 645 (71.8%) |
| 75 Years and over | 496 (97.6%) | 325 (64.0%) |
| Total | 3,606 (40.7%) | 5,634 (63.6%) |
Disability Status by Sex by Age in Craig
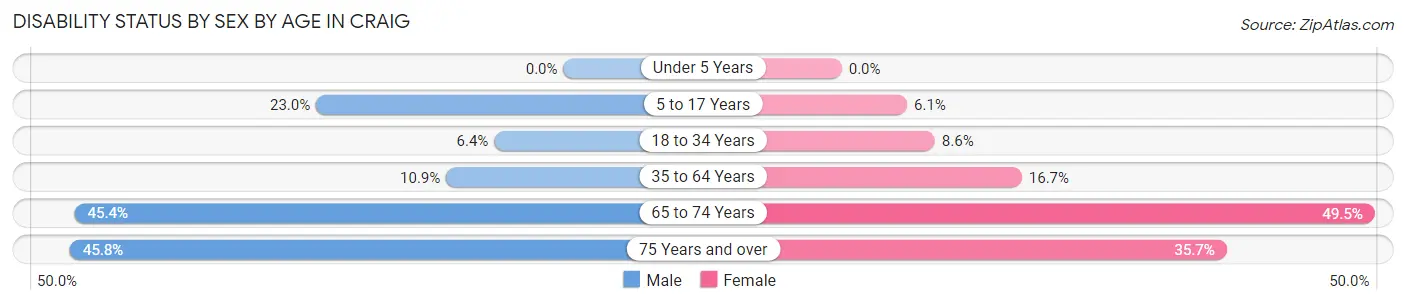
| Age Bracket | Male | Female |
| Under 5 Years | 0 (0.0%) | 0 (0.0%) |
| 5 to 17 Years | 157 (23.0%) | 55 (6.1%) |
| 18 to 34 Years | 66 (6.4%) | 86 (8.6%) |
| 35 to 64 Years | 172 (10.9%) | 279 (16.7%) |
| 65 to 74 Years | 200 (45.4%) | 226 (49.4%) |
| 75 Years and over | 98 (45.8%) | 105 (35.7%) |
Disability Class by Sex by Age in Craig
Disability Class: Hearing Difficulty
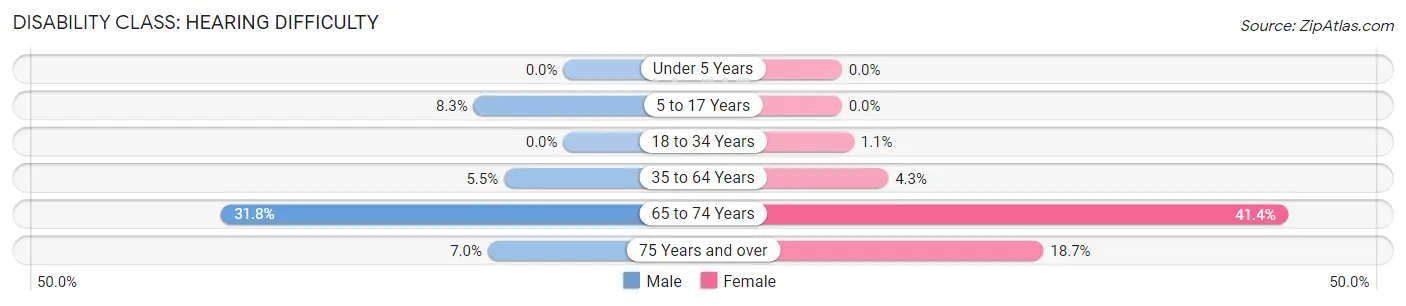
| Age Bracket | Male | Female |
| Under 5 Years | 0 (0.0%) | 0 (0.0%) |
| 5 to 17 Years | 57 (8.3%) | 0 (0.0%) |
| 18 to 34 Years | 0 (0.0%) | 11 (1.1%) |
| 35 to 64 Years | 87 (5.5%) | 72 (4.3%) |
| 65 to 74 Years | 140 (31.8%) | 189 (41.4%) |
| 75 Years and over | 15 (7.0%) | 55 (18.7%) |
Disability Class: Vision Difficulty
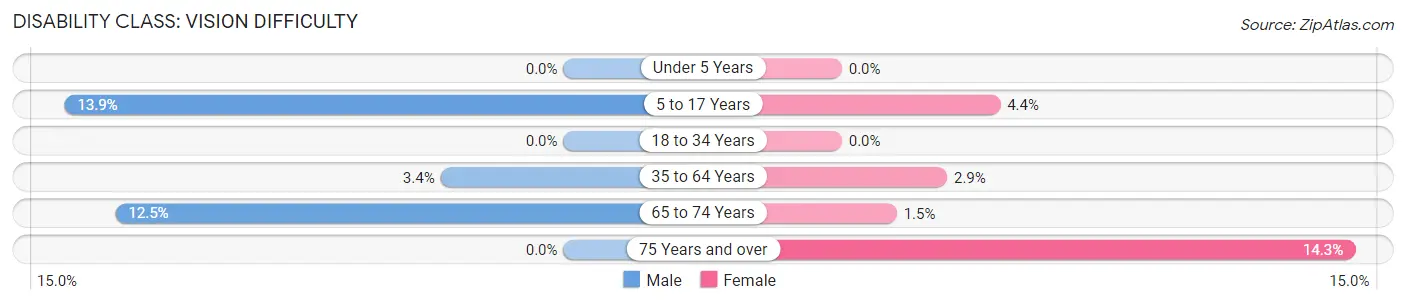
| Age Bracket | Male | Female |
| Under 5 Years | 0 (0.0%) | 0 (0.0%) |
| 5 to 17 Years | 95 (13.9%) | 40 (4.4%) |
| 18 to 34 Years | 0 (0.0%) | 0 (0.0%) |
| 35 to 64 Years | 54 (3.4%) | 49 (2.9%) |
| 65 to 74 Years | 55 (12.5%) | 7 (1.5%) |
| 75 Years and over | 0 (0.0%) | 42 (14.3%) |
Disability Class: Cognitive Difficulty
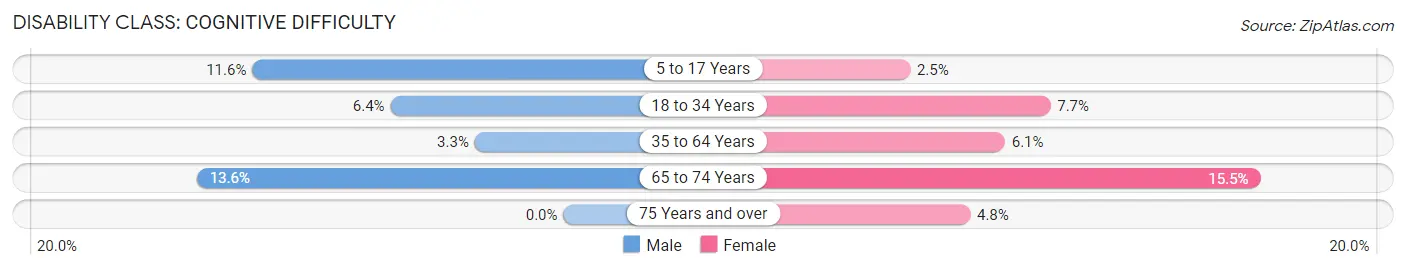
| Age Bracket | Male | Female |
| 5 to 17 Years | 79 (11.6%) | 23 (2.5%) |
| 18 to 34 Years | 66 (6.4%) | 77 (7.7%) |
| 35 to 64 Years | 52 (3.3%) | 101 (6.0%) |
| 65 to 74 Years | 60 (13.6%) | 71 (15.5%) |
| 75 Years and over | 0 (0.0%) | 14 (4.8%) |
Disability Class: Ambulatory Difficulty
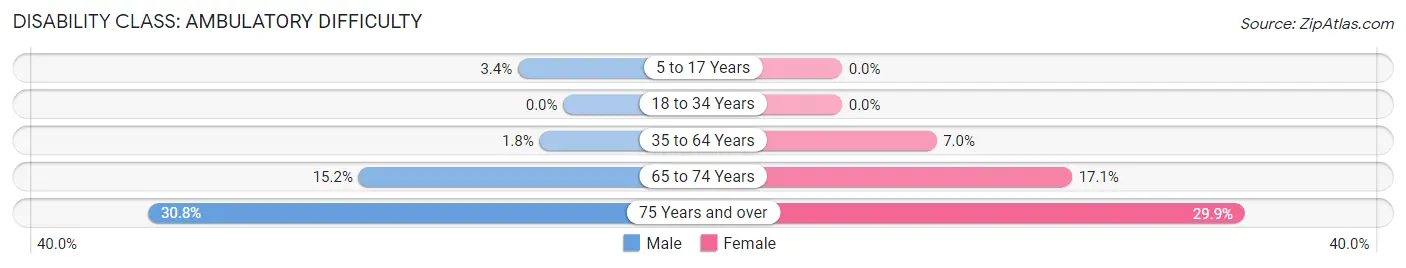
| Age Bracket | Male | Female |
| 5 to 17 Years | 23 (3.4%) | 0 (0.0%) |
| 18 to 34 Years | 0 (0.0%) | 0 (0.0%) |
| 35 to 64 Years | 28 (1.8%) | 117 (7.0%) |
| 65 to 74 Years | 67 (15.2%) | 78 (17.1%) |
| 75 Years and over | 66 (30.8%) | 88 (29.9%) |
Disability Class: Self-Care Difficulty
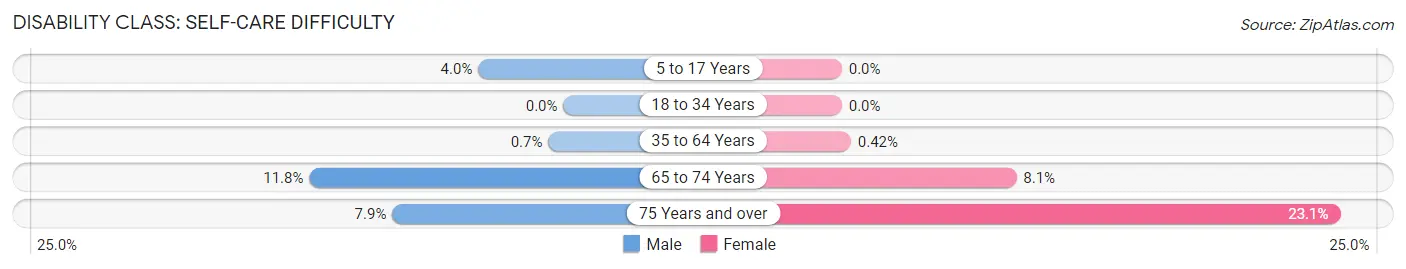
| Age Bracket | Male | Female |
| 5 to 17 Years | 27 (4.0%) | 0 (0.0%) |
| 18 to 34 Years | 0 (0.0%) | 0 (0.0%) |
| 35 to 64 Years | 11 (0.7%) | 7 (0.4%) |
| 65 to 74 Years | 52 (11.8%) | 37 (8.1%) |
| 75 Years and over | 17 (7.9%) | 68 (23.1%) |
Technology Access in Craig
Computing Device Access in Craig
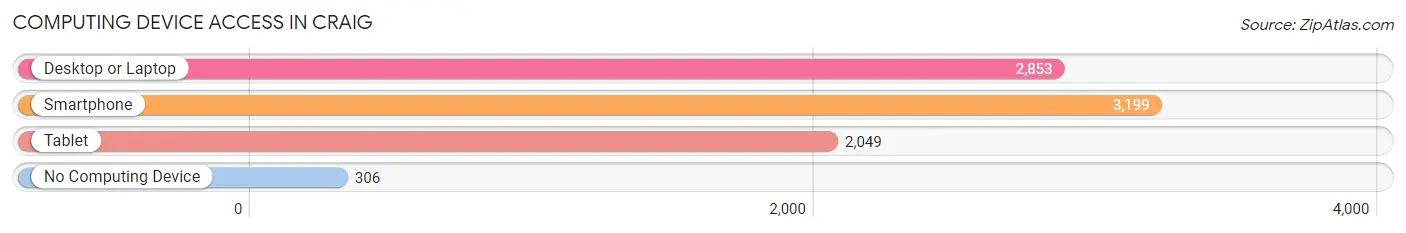
| Device Type | # Households | % Households |
| Desktop or Laptop | 2,853 | 75.0% |
| Smartphone | 3,199 | 84.1% |
| Tablet | 2,049 | 53.8% |
| No Computing Device | 306 | 8.0% |
| Total | 3,806 | 100.0% |
Internet Access in Craig
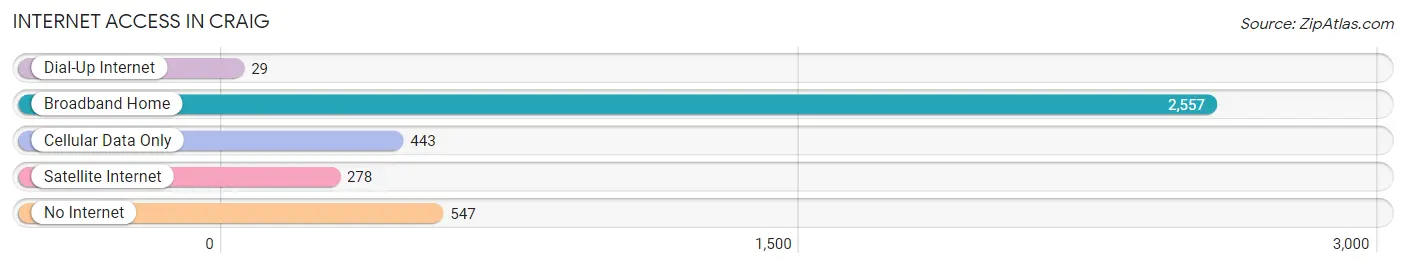
| Internet Type | # Households | % Households |
| Dial-Up Internet | 29 | 0.8% |
| Broadband Home | 2,557 | 67.2% |
| Cellular Data Only | 443 | 11.6% |
| Satellite Internet | 278 | 7.3% |
| No Internet | 547 | 14.4% |
| Total | 3,806 | 100.0% |
Craig Summary
Craig, Colorado is a small city located in Moffat County in the northwest corner of the state. It is the county seat and the largest city in the county. The city was founded in 1889 and has a population of 9,189 as of the 2010 census.
Geography
Craig is located in the Yampa River Valley, at the confluence of the Yampa and Elk Rivers. It is situated at an elevation of 6,000 feet and is surrounded by mountains and mesas. The city is located in the high desert of northwestern Colorado, and is known for its dry climate and wide open spaces. The city is located approximately 40 miles east of the Utah border and is about 200 miles northwest of Denver.
Economy
Craig’s economy is largely based on agriculture, ranching, and energy production. The city is home to several large coal mines, and is the largest producer of coal in the state. The city is also home to several large natural gas fields, and is the largest producer of natural gas in the state. The city is also home to several large agricultural operations, including cattle and sheep ranches, and is the largest producer of hay in the state.
Demographics
As of the 2010 census, Craig had a population of 9,189. The racial makeup of the city was 90.3% White, 0.3% African American, 0.7% Native American, 0.4% Asian, 0.1% Pacific Islander, 6.2% from other races, and 2.0% from two or more races. Hispanic or Latino of any race were 11.3% of the population.
The median income for a household in the city was $41,945, and the median income for a family was $50,945. The per capita income for the city was $20,945. About 11.3% of families and 14.2% of the population were below the poverty line, including 18.2% of those under age 18 and 8.2% of those age 65 or over.
Education
Craig is served by the Moffat County School District, which includes two elementary schools, one middle school, and one high school. The city is also home to Colorado Northwestern Community College, which offers a variety of associate degree and certificate programs.
Conclusion
Craig, Colorado is a small city located in the northwest corner of the state. It is the county seat and the largest city in the county. The city is known for its dry climate and wide open spaces, and its economy is largely based on agriculture, ranching, and energy production. The city has a population of 9,189 as of the 2010 census, and is served by the Moffat County School District and Colorado Northwestern Community College.
Common Questions
What is Per Capita Income in Craig?
Per Capita income in Craig is $32,182.
What is the Median Family Income in Craig?
Median Family Income in Craig is $75,163.
What is the Median Household income in Craig?
Median Household Income in Craig is $52,443.
What is Income or Wage Gap in Craig?
Income or Wage Gap in Craig is 25.3%.
Women in Craig earn 74.7 cents for every dollar earned by a man.
What is Family Income Deficit in Craig?
Family Income Deficit in Craig is $10,611.
Families that are below poverty line in Craig earn $10,611 less on average than the poverty threshold level.
What is Inequality or Gini Index in Craig?
Inequality or Gini Index in Craig is 0.45.
What is the Total Population of Craig?
Total Population of Craig is 9,013.
What is the Total Male Population of Craig?
Total Male Population of Craig is 4,336.
What is the Total Female Population of Craig?
Total Female Population of Craig is 4,677.
What is the Ratio of Males per 100 Females in Craig?
There are 92.71 Males per 100 Females in Craig.
What is the Ratio of Females per 100 Males in Craig?
There are 107.86 Females per 100 Males in Craig.
What is the Median Population Age in Craig?
Median Population Age in Craig is 37.4 Years.
What is the Average Family Size in Craig
Average Family Size in Craig is 2.9 People.
What is the Average Household Size in Craig
Average Household Size in Craig is 2.3 People.
How Large is the Labor Force in Craig?
There are 4,620 People in the Labor Forcein in Craig.
What is the Percentage of People in the Labor Force in Craig?
64.9% of People are in the Labor Force in Craig.
What is the Unemployment Rate in Craig?
Unemployment Rate in Craig is 3.1%.