Commerce City, CO Map & Demographics
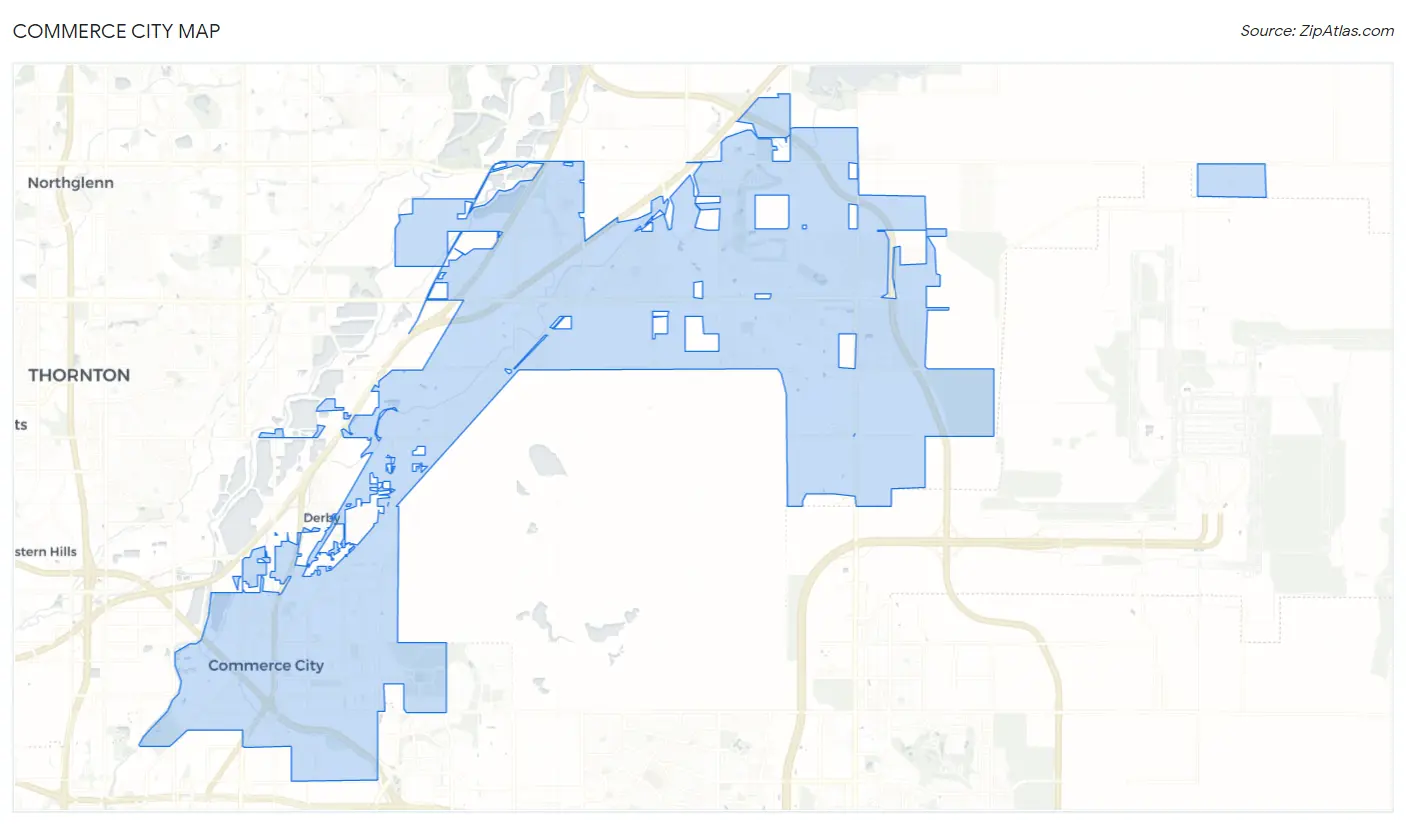
Commerce City Map
Commerce City Overview
$37,932
PER CAPITA INCOME
$111,200
AVG FAMILY INCOME
$96,484
AVG HOUSEHOLD INCOME
27.4%
WAGE / INCOME GAP [ % ]
72.6¢/ $1
WAGE / INCOME GAP [ $ ]
$16,649
FAMILY INCOME DEFICIT
0.39
INEQUALITY / GINI INDEX
63,050
TOTAL POPULATION
31,657
MALE POPULATION
31,393
FEMALE POPULATION
100.84
MALES / 100 FEMALES
99.17
FEMALES / 100 MALES
33.5
MEDIAN AGE
3.5
AVG FAMILY SIZE
3.0
AVG HOUSEHOLD SIZE
33,969
LABOR FORCE [ PEOPLE ]
73.5%
PERCENT IN LABOR FORCE
4.6%
UNEMPLOYMENT RATE
Commerce City Zip Codes
Income in Commerce City
Income Overview in Commerce City
Per Capita Income in Commerce City is $37,932, while median incomes of families and households are $111,200 and $96,484 respectively.
| Characteristic | Number | Measure |
| Per Capita Income | 63,050 | $37,932 |
| Median Family Income | 15,815 | $111,200 |
| Mean Family Income | 15,815 | $122,231 |
| Median Household Income | 20,602 | $96,484 |
| Mean Household Income | 20,602 | $113,965 |
| Income Deficit | 15,815 | $16,649 |
| Wage / Income Gap (%) | 63,050 | 27.38% |
| Wage / Income Gap ($) | 63,050 | 72.62¢ per $1 |
| Gini / Inequality Index | 63,050 | 0.39 |
Earnings by Sex in Commerce City
Average Earnings in Commerce City are $51,224, $58,843 for men and $42,731 for women, a difference of 27.4%.
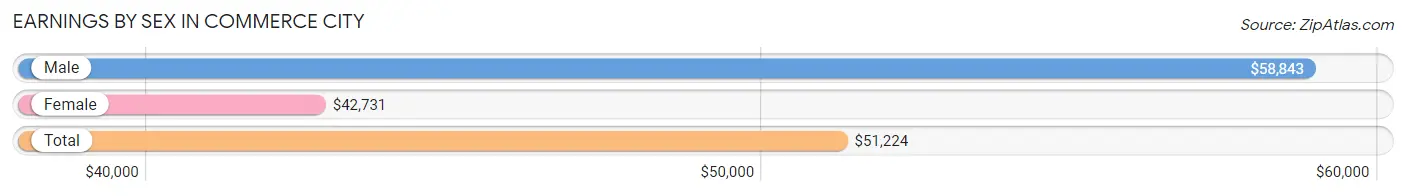
| Sex | Number | Average Earnings |
| Male | 18,317 (53.1%) | $58,843 |
| Female | 16,186 (46.9%) | $42,731 |
| Total | 34,503 (100.0%) | $51,224 |
Earnings by Sex by Income Bracket in Commerce City
The most common earnings brackets in Commerce City are $100,000+ for men (3,146 | 17.2%) and $75,000 to $99,999 for women (1,978 | 12.2%).
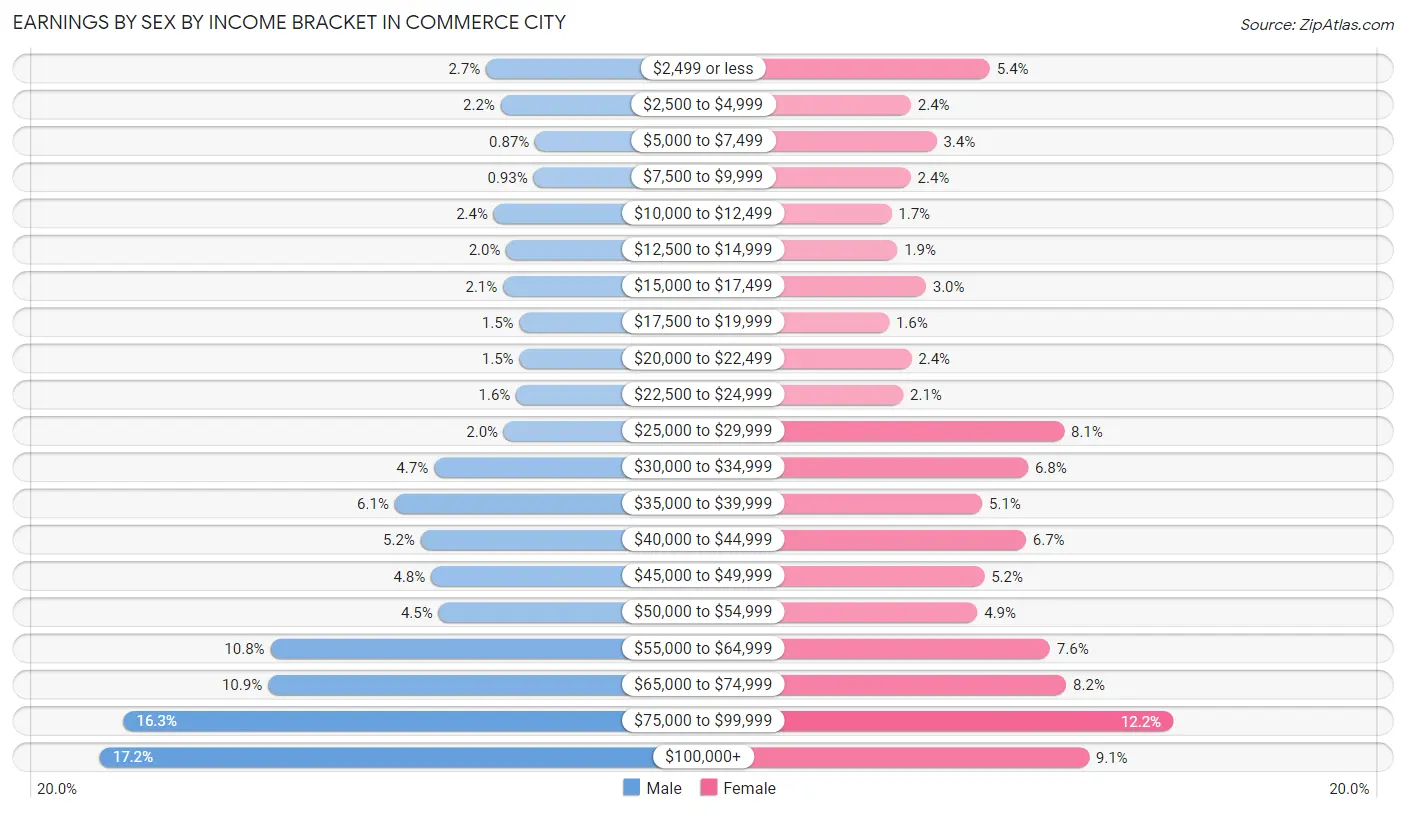
| Income | Male | Female |
| $2,499 or less | 497 (2.7%) | 868 (5.4%) |
| $2,500 to $4,999 | 395 (2.2%) | 388 (2.4%) |
| $5,000 to $7,499 | 160 (0.9%) | 544 (3.4%) |
| $7,500 to $9,999 | 171 (0.9%) | 387 (2.4%) |
| $10,000 to $12,499 | 443 (2.4%) | 271 (1.7%) |
| $12,500 to $14,999 | 358 (1.9%) | 306 (1.9%) |
| $15,000 to $17,499 | 379 (2.1%) | 479 (3.0%) |
| $17,500 to $19,999 | 268 (1.5%) | 255 (1.6%) |
| $20,000 to $22,499 | 268 (1.5%) | 392 (2.4%) |
| $22,500 to $24,999 | 289 (1.6%) | 341 (2.1%) |
| $25,000 to $29,999 | 374 (2.0%) | 1,317 (8.1%) |
| $30,000 to $34,999 | 853 (4.7%) | 1,099 (6.8%) |
| $35,000 to $39,999 | 1,123 (6.1%) | 821 (5.1%) |
| $40,000 to $44,999 | 946 (5.2%) | 1,086 (6.7%) |
| $45,000 to $49,999 | 873 (4.8%) | 833 (5.1%) |
| $50,000 to $54,999 | 822 (4.5%) | 791 (4.9%) |
| $55,000 to $64,999 | 1,976 (10.8%) | 1,231 (7.6%) |
| $65,000 to $74,999 | 1,992 (10.9%) | 1,331 (8.2%) |
| $75,000 to $99,999 | 2,984 (16.3%) | 1,978 (12.2%) |
| $100,000+ | 3,146 (17.2%) | 1,468 (9.1%) |
| Total | 18,317 (100.0%) | 16,186 (100.0%) |
Earnings by Sex by Educational Attainment in Commerce City
Average earnings in Commerce City are $65,379 for men and $48,401 for women, a difference of 26.0%. Men with an educational attainment of graduate degree enjoy the highest average annual earnings of $103,212, while those with less than high school education earn the least with $52,775. Women with an educational attainment of graduate degree earn the most with the average annual earnings of $75,876, while those with less than high school education have the smallest earnings of $27,214.
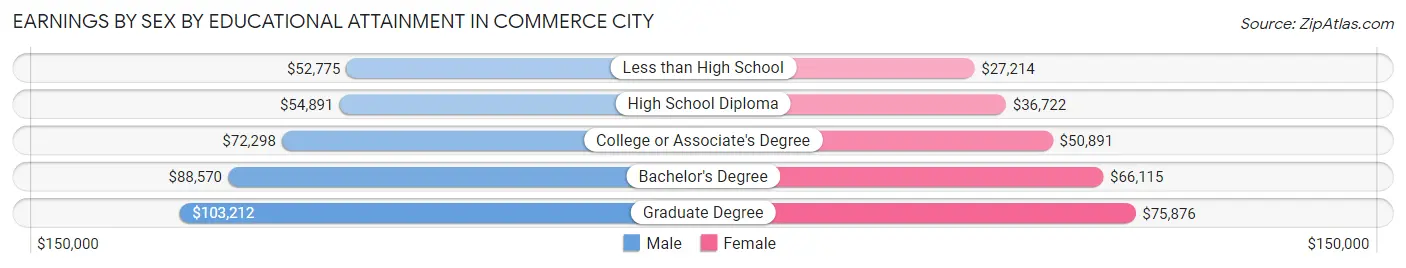
| Educational Attainment | Male Income | Female Income |
| Less than High School | $52,775 | $27,214 |
| High School Diploma | $54,891 | $36,722 |
| College or Associate's Degree | $72,298 | $50,891 |
| Bachelor's Degree | $88,570 | $66,115 |
| Graduate Degree | $103,212 | $75,876 |
| Total | $65,379 | $48,401 |
Family Income in Commerce City
Family Income Brackets in Commerce City
According to the Commerce City family income data, there are 4,017 families falling into the $100,000 to $149,999 income range, which is the most common income bracket and makes up 25.4% of all families. Conversely, the $10,000 to $14,999 income bracket is the least frequent group with only 300 families (1.9%) belonging to this category.
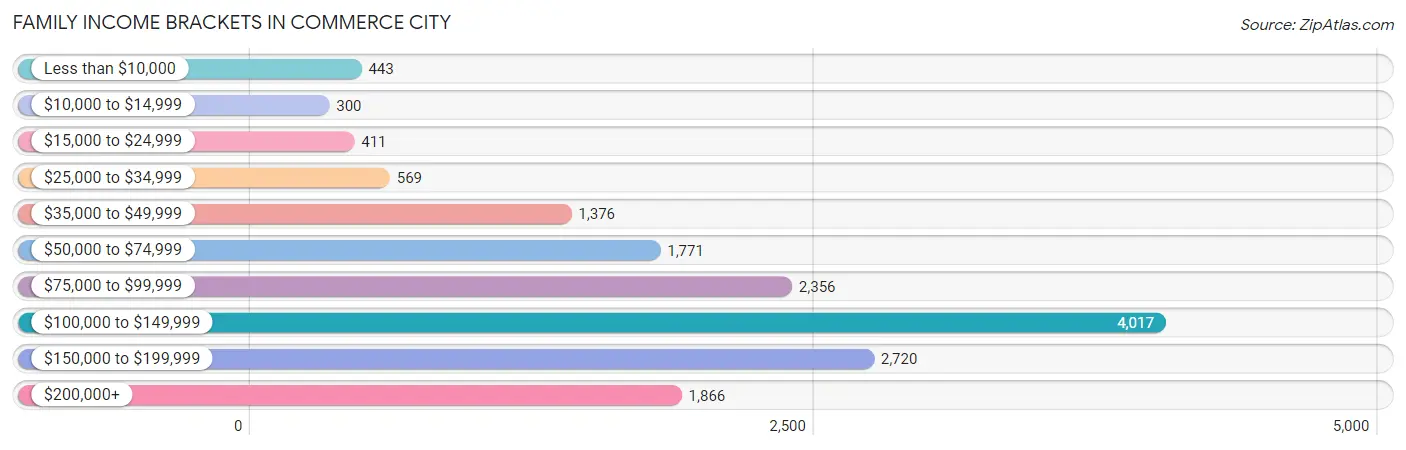
| Income Bracket | # Families | % Families |
| Less than $10,000 | 443 | 2.8% |
| $10,000 to $14,999 | 300 | 1.9% |
| $15,000 to $24,999 | 411 | 2.6% |
| $25,000 to $34,999 | 569 | 3.6% |
| $35,000 to $49,999 | 1,376 | 8.7% |
| $50,000 to $74,999 | 1,771 | 11.2% |
| $75,000 to $99,999 | 2,356 | 14.9% |
| $100,000 to $149,999 | 4,017 | 25.4% |
| $150,000 to $199,999 | 2,720 | 17.2% |
| $200,000+ | 1,866 | 11.8% |
Family Income by Famaliy Size in Commerce City
6-person families (557 | 3.5%) account for the highest median family income in Commerce City with $146,685 per family, while 2-person families (5,746 | 36.3%) have the highest median income of $43,082 per family member.
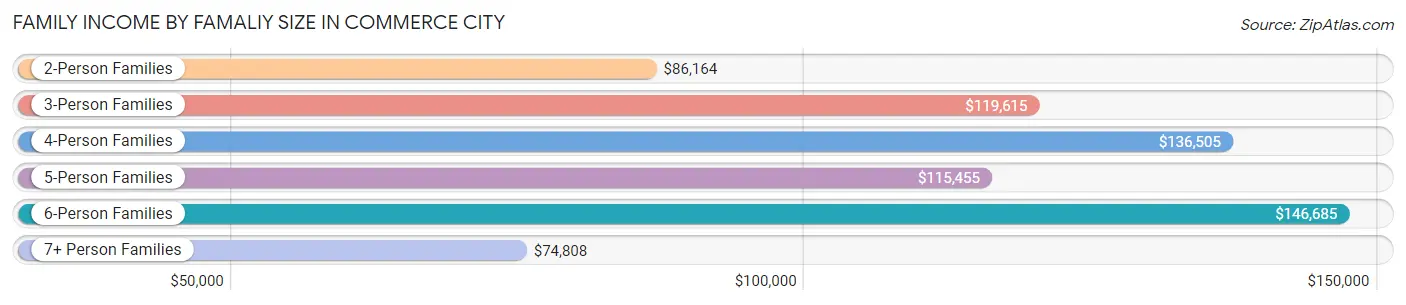
| Income Bracket | # Families | Median Income |
| 2-Person Families | 5,746 (36.3%) | $86,164 |
| 3-Person Families | 3,364 (21.3%) | $119,615 |
| 4-Person Families | 4,136 (26.2%) | $136,505 |
| 5-Person Families | 1,496 (9.5%) | $115,455 |
| 6-Person Families | 557 (3.5%) | $146,685 |
| 7+ Person Families | 516 (3.3%) | $74,808 |
| Total | 15,815 (100.0%) | $111,200 |
Family Income by Number of Earners in Commerce City
The median family income in Commerce City is $111,200, with families comprising 3+ earners (2,138) having the highest median family income of $165,897, while families with no earners (1,103) have the lowest median family income of $37,639, accounting for 13.5% and 7.0% of families, respectively.
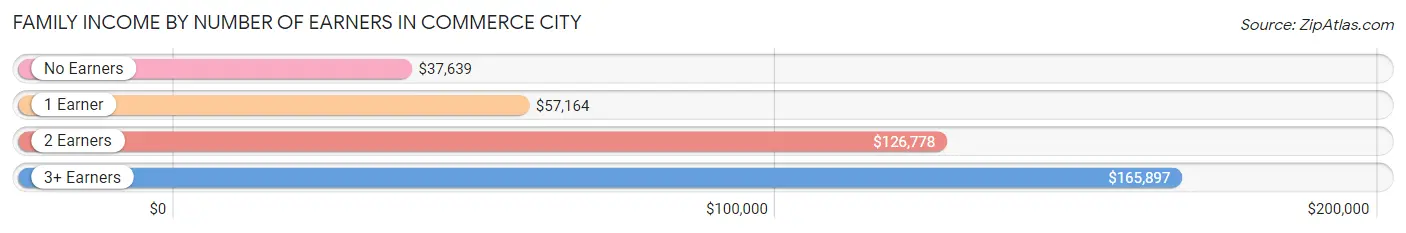
| Number of Earners | # Families | Median Income |
| No Earners | 1,103 (7.0%) | $37,639 |
| 1 Earner | 4,283 (27.1%) | $57,164 |
| 2 Earners | 8,291 (52.4%) | $126,778 |
| 3+ Earners | 2,138 (13.5%) | $165,897 |
| Total | 15,815 (100.0%) | $111,200 |
Household Income in Commerce City
Household Income Brackets in Commerce City
With 4,780 households falling in the category, the $100,000 to $149,999 income range is the most frequent in Commerce City, accounting for 23.2% of all households. In contrast, only 556 households (2.7%) fall into the $10,000 to $14,999 income bracket, making it the least populous group.
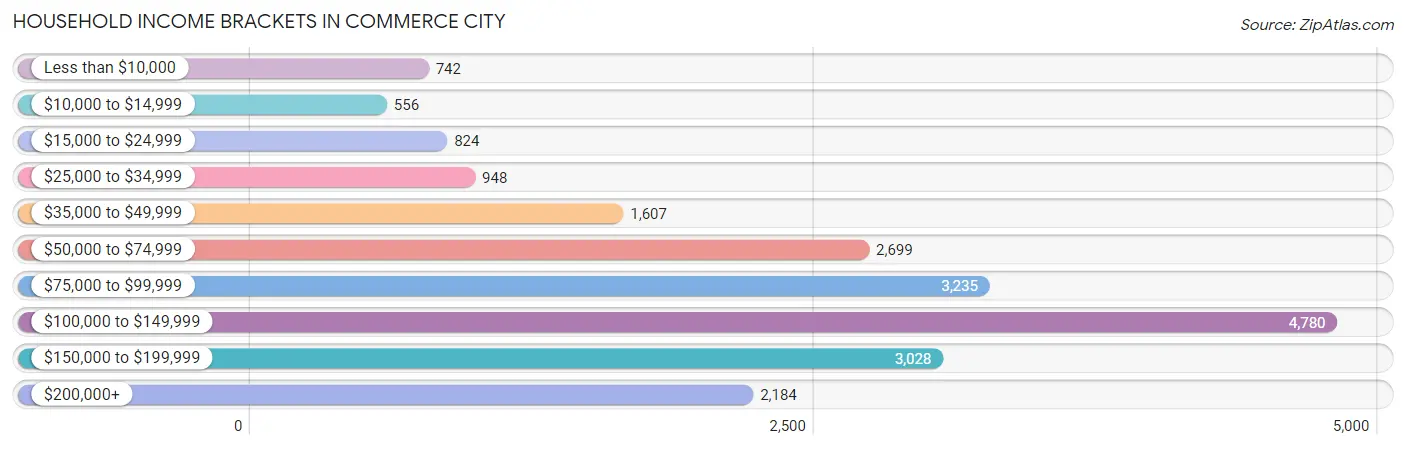
| Income Bracket | # Households | % Households |
| Less than $10,000 | 742 | 3.6% |
| $10,000 to $14,999 | 556 | 2.7% |
| $15,000 to $24,999 | 824 | 4.0% |
| $25,000 to $34,999 | 948 | 4.6% |
| $35,000 to $49,999 | 1,607 | 7.8% |
| $50,000 to $74,999 | 2,699 | 13.1% |
| $75,000 to $99,999 | 3,235 | 15.7% |
| $100,000 to $149,999 | 4,780 | 23.2% |
| $150,000 to $199,999 | 3,028 | 14.7% |
| $200,000+ | 2,184 | 10.6% |
Household Income by Householder Age in Commerce City
The median household income in Commerce City is $96,484, with the highest median household income of $114,000 found in the 25 to 44 years age bracket for the primary householder. A total of 9,214 households (44.7%) fall into this category. Meanwhile, the 65+ years age bracket for the primary householder has the lowest median household income of $67,383, with 2,480 households (12.0%) in this group.
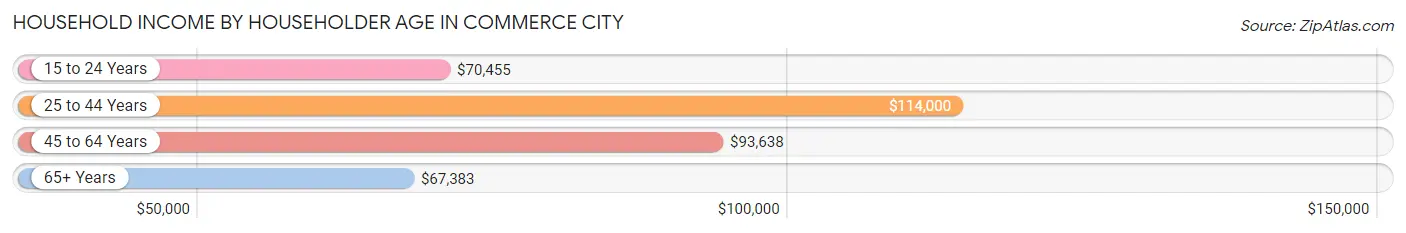
| Income Bracket | # Households | Median Income |
| 15 to 24 Years | 280 (1.4%) | $70,455 |
| 25 to 44 Years | 9,214 (44.7%) | $114,000 |
| 45 to 64 Years | 8,628 (41.9%) | $93,638 |
| 65+ Years | 2,480 (12.0%) | $67,383 |
| Total | 20,602 (100.0%) | $96,484 |
Poverty in Commerce City
Income Below Poverty by Sex and Age in Commerce City
With 11.5% poverty level for males and 11.6% for females among the residents of Commerce City, 15 year old males and 16 and 17 year old females are the most vulnerable to poverty, with 196 males (29.6%) and 515 females (38.1%) in their respective age groups living below the poverty level.
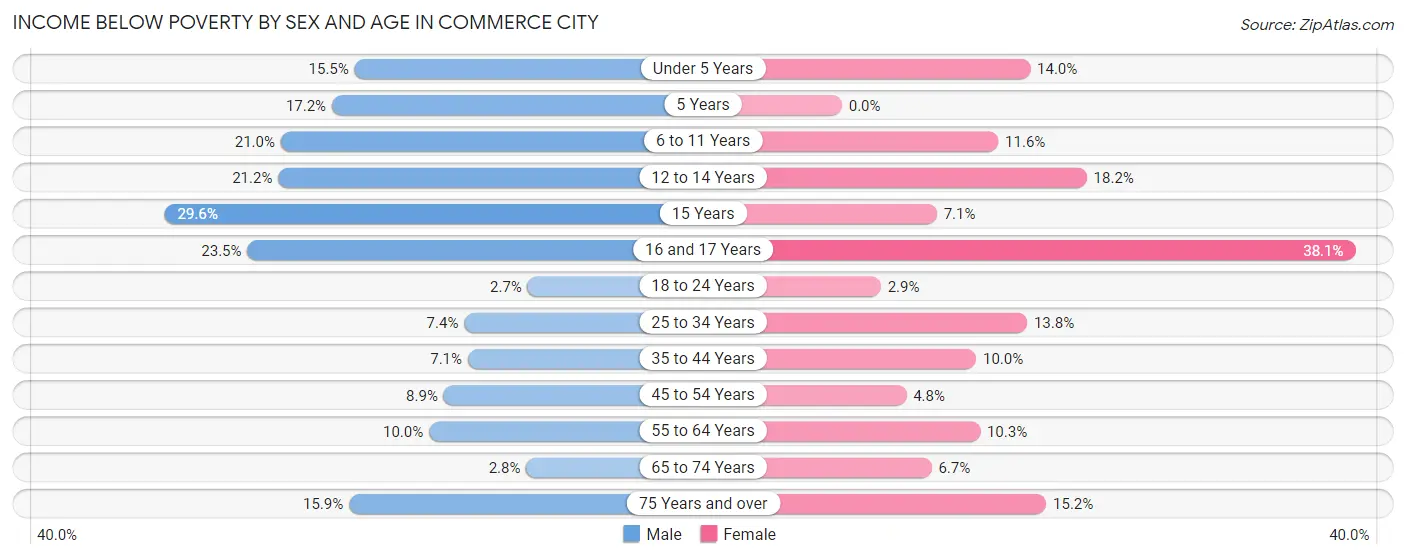
| Age Bracket | Male | Female |
| Under 5 Years | 367 (15.5%) | 352 (14.0%) |
| 5 Years | 101 (17.2%) | 0 (0.0%) |
| 6 to 11 Years | 631 (21.0%) | 323 (11.6%) |
| 12 to 14 Years | 388 (21.2%) | 389 (18.2%) |
| 15 Years | 196 (29.6%) | 37 (7.0%) |
| 16 and 17 Years | 316 (23.5%) | 515 (38.1%) |
| 18 to 24 Years | 58 (2.6%) | 59 (2.9%) |
| 25 to 34 Years | 294 (7.4%) | 687 (13.8%) |
| 35 to 44 Years | 381 (7.1%) | 492 (10.0%) |
| 45 to 54 Years | 400 (8.9%) | 193 (4.8%) |
| 55 to 64 Years | 343 (10.0%) | 307 (10.3%) |
| 65 to 74 Years | 43 (2.8%) | 105 (6.7%) |
| 75 Years and over | 94 (15.9%) | 164 (15.2%) |
| Total | 3,612 (11.5%) | 3,623 (11.6%) |
Income Above Poverty by Sex and Age in Commerce City
According to the poverty statistics in Commerce City, males aged 18 to 24 years and females aged 5 years are the age groups that are most secure financially, with 97.4% of males and 100.0% of females in these age groups living above the poverty line.
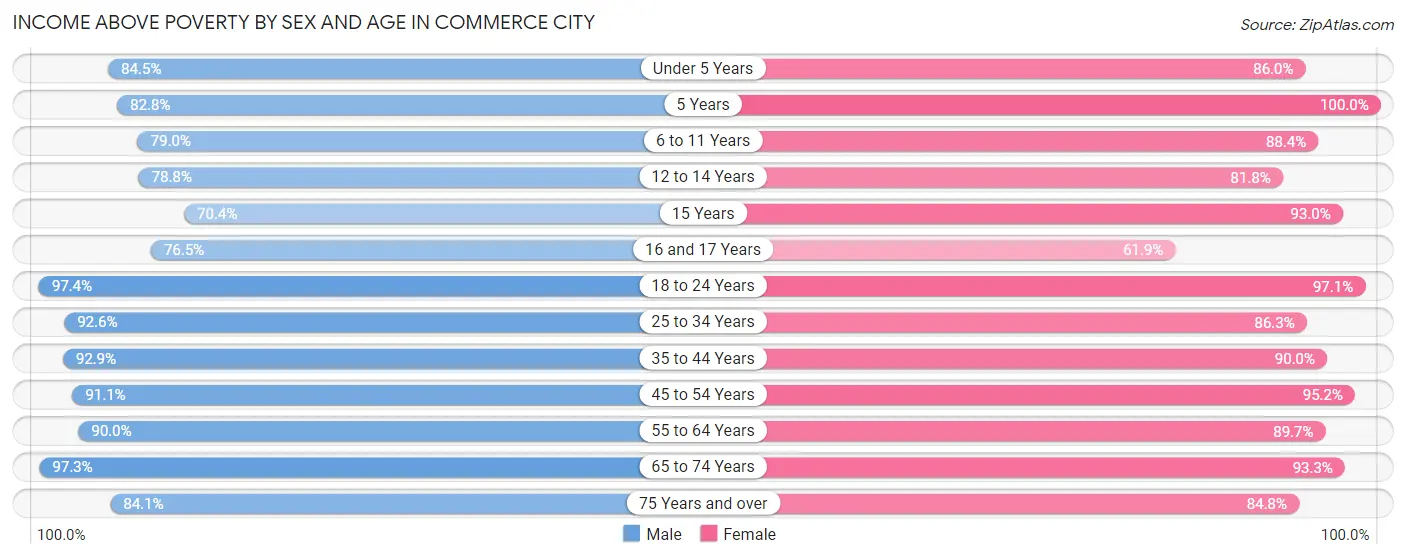
| Age Bracket | Male | Female |
| Under 5 Years | 2,001 (84.5%) | 2,165 (86.0%) |
| 5 Years | 487 (82.8%) | 151 (100.0%) |
| 6 to 11 Years | 2,376 (79.0%) | 2,460 (88.4%) |
| 12 to 14 Years | 1,445 (78.8%) | 1,751 (81.8%) |
| 15 Years | 466 (70.4%) | 488 (92.9%) |
| 16 and 17 Years | 1,031 (76.5%) | 836 (61.9%) |
| 18 to 24 Years | 2,129 (97.4%) | 1,985 (97.1%) |
| 25 to 34 Years | 3,699 (92.6%) | 4,309 (86.3%) |
| 35 to 44 Years | 4,995 (92.9%) | 4,444 (90.0%) |
| 45 to 54 Years | 4,104 (91.1%) | 3,843 (95.2%) |
| 55 to 64 Years | 3,098 (90.0%) | 2,685 (89.7%) |
| 65 to 74 Years | 1,518 (97.3%) | 1,471 (93.3%) |
| 75 Years and over | 497 (84.1%) | 917 (84.8%) |
| Total | 27,846 (88.5%) | 27,505 (88.4%) |
Income Below Poverty Among Married-Couple Families in Commerce City
The poverty statistics for married-couple families in Commerce City show that 4.7% or 566 of the total 12,058 families live below the poverty line. Families with 5 or more children have the highest poverty rate of 57.1%, comprising of 109 families. On the other hand, families with no children have the lowest poverty rate of 1.4%, which includes 76 families.
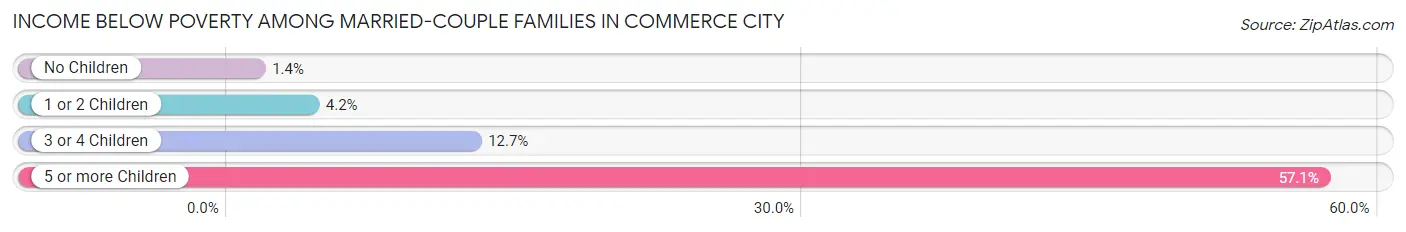
| Children | Above Poverty | Below Poverty |
| No Children | 5,289 (98.6%) | 76 (1.4%) |
| 1 or 2 Children | 5,021 (95.8%) | 221 (4.2%) |
| 3 or 4 Children | 1,100 (87.3%) | 160 (12.7%) |
| 5 or more Children | 82 (42.9%) | 109 (57.1%) |
| Total | 11,492 (95.3%) | 566 (4.7%) |
Income Below Poverty Among Single-Parent Households in Commerce City
According to the poverty data in Commerce City, 12.9% or 148 single-father households and 20.7% or 541 single-mother households are living below the poverty line. Among single-father households, those with 1 or 2 children have the highest poverty rate, with 148 households (21.2%) experiencing poverty. Likewise, among single-mother households, those with 3 or 4 children have the highest poverty rate, with 240 households (63.7%) falling below the poverty line.
| Children | Single Father | Single Mother |
| No Children | 0 (0.0%) | 105 (12.7%) |
| 1 or 2 Children | 148 (21.2%) | 196 (14.4%) |
| 3 or 4 Children | 0 (0.0%) | 240 (63.7%) |
| 5 or more Children | 0 (0.0%) | 0 (0.0%) |
| Total | 148 (12.9%) | 541 (20.7%) |
Income Below Poverty Among Married-Couple vs Single-Parent Households in Commerce City
The poverty data for Commerce City shows that 566 of the married-couple family households (4.7%) and 689 of the single-parent households (18.3%) are living below the poverty level. Within the married-couple family households, those with 5 or more children have the highest poverty rate, with 109 households (57.1%) falling below the poverty line. Among the single-parent households, those with 3 or 4 children have the highest poverty rate, with 240 household (57.0%) living below poverty.
| Children | Married-Couple Families | Single-Parent Households |
| No Children | 76 (1.4%) | 105 (8.5%) |
| 1 or 2 Children | 221 (4.2%) | 344 (16.7%) |
| 3 or 4 Children | 160 (12.7%) | 240 (57.0%) |
| 5 or more Children | 109 (57.1%) | 0 (0.0%) |
| Total | 566 (4.7%) | 689 (18.3%) |
Race in Commerce City
The most populous races in Commerce City are White / Caucasian (42,628 | 67.6%), Hispanic or Latino (30,538 | 48.4%), and Two or more Races (9,249 | 14.7%).
| Race | # Population | % Population |
| Asian | 1,479 | 2.4% |
| Black / African American | 2,450 | 3.9% |
| Hawaiian / Pacific | 98 | 0.2% |
| Hispanic or Latino | 30,538 | 48.4% |
| Native / Alaskan | 1,596 | 2.5% |
| White / Caucasian | 42,628 | 67.6% |
| Two or more Races | 9,249 | 14.7% |
| Some other Race | 5,550 | 8.8% |
| Total | 63,050 | 100.0% |
Ancestry in Commerce City
The most populous ancestries reported in Commerce City are Mexican (26,190 | 41.5%), German (8,279 | 13.1%), Irish (4,528 | 7.2%), English (4,218 | 6.7%), and Italian (2,536 | 4.0%), together accounting for 72.6% of all Commerce City residents.
| Ancestry | # Population | % Population |
| African | 363 | 0.6% |
| Alaska Native | 137 | 0.2% |
| American | 2,228 | 3.5% |
| Apache | 46 | 0.1% |
| Arab | 307 | 0.5% |
| Arapaho | 12 | 0.0% |
| Argentinean | 20 | 0.0% |
| Armenian | 11 | 0.0% |
| Austrian | 139 | 0.2% |
| Bahamian | 2 | 0.0% |
| Bangladeshi | 258 | 0.4% |
| Basque | 23 | 0.0% |
| Belgian | 46 | 0.1% |
| Bhutanese | 257 | 0.4% |
| Blackfeet | 134 | 0.2% |
| Brazilian | 17 | 0.0% |
| British | 384 | 0.6% |
| Burmese | 458 | 0.7% |
| Canadian | 78 | 0.1% |
| Central American | 342 | 0.5% |
| Central American Indian | 46 | 0.1% |
| Cherokee | 124 | 0.2% |
| Cheyenne | 95 | 0.2% |
| Choctaw | 6 | 0.0% |
| Colombian | 341 | 0.5% |
| Comanche | 6 | 0.0% |
| Creek | 30 | 0.1% |
| Croatian | 7 | 0.0% |
| Crow | 28 | 0.0% |
| Cuban | 108 | 0.2% |
| Czech | 262 | 0.4% |
| Czechoslovakian | 71 | 0.1% |
| Danish | 120 | 0.2% |
| Dominican | 57 | 0.1% |
| Dutch | 503 | 0.8% |
| Eastern European | 47 | 0.1% |
| English | 4,218 | 6.7% |
| Ethiopian | 101 | 0.2% |
| European | 1,066 | 1.7% |
| Finnish | 40 | 0.1% |
| French | 1,038 | 1.7% |
| French American Indian | 6 | 0.0% |
| French Canadian | 131 | 0.2% |
| German | 8,279 | 13.1% |
| Ghanaian | 55 | 0.1% |
| Greek | 129 | 0.2% |
| Guamanian / Chamorro | 55 | 0.1% |
| Guatemalan | 78 | 0.1% |
| Hungarian | 150 | 0.2% |
| Indian (Asian) | 417 | 0.7% |
| Irish | 4,528 | 7.2% |
| Italian | 2,536 | 4.0% |
| Jamaican | 179 | 0.3% |
| Japanese | 47 | 0.1% |
| Korean | 464 | 0.7% |
| Laotian | 53 | 0.1% |
| Lebanese | 35 | 0.1% |
| Malaysian | 13 | 0.0% |
| Maltese | 157 | 0.3% |
| Mexican | 26,190 | 41.5% |
| Mexican American Indian | 164 | 0.3% |
| Moroccan | 30 | 0.1% |
| Native Hawaiian | 174 | 0.3% |
| Navajo | 140 | 0.2% |
| Northern European | 348 | 0.5% |
| Norwegian | 1,045 | 1.7% |
| Pakistani | 64 | 0.1% |
| Panamanian | 30 | 0.1% |
| Pennsylvania German | 15 | 0.0% |
| Peruvian | 255 | 0.4% |
| Polish | 880 | 1.4% |
| Portuguese | 130 | 0.2% |
| Potawatomi | 38 | 0.1% |
| Puerto Rican | 472 | 0.7% |
| Romanian | 11 | 0.0% |
| Russian | 505 | 0.8% |
| Salvadoran | 234 | 0.4% |
| Samoan | 26 | 0.0% |
| Scandinavian | 440 | 0.7% |
| Scotch-Irish | 428 | 0.7% |
| Scottish | 652 | 1.0% |
| Serbian | 16 | 0.0% |
| Sioux | 85 | 0.1% |
| Slovak | 16 | 0.0% |
| Slovene | 27 | 0.0% |
| Somali | 124 | 0.2% |
| South African | 39 | 0.1% |
| South American | 792 | 1.3% |
| South American Indian | 27 | 0.0% |
| Spaniard | 838 | 1.3% |
| Spanish | 827 | 1.3% |
| Spanish American | 124 | 0.2% |
| Sri Lankan | 126 | 0.2% |
| Subsaharan African | 709 | 1.1% |
| Swedish | 959 | 1.5% |
| Swiss | 98 | 0.2% |
| Syrian | 12 | 0.0% |
| Thai | 154 | 0.2% |
| Tlingit-Haida | 3 | 0.0% |
| Ukrainian | 190 | 0.3% |
| Ute | 50 | 0.1% |
| Venezuelan | 176 | 0.3% |
| Welsh | 161 | 0.3% |
| West Indian | 53 | 0.1% |
| Yaqui | 6 | 0.0% |
| Yugoslavian | 19 | 0.0% | View All 106 Rows |
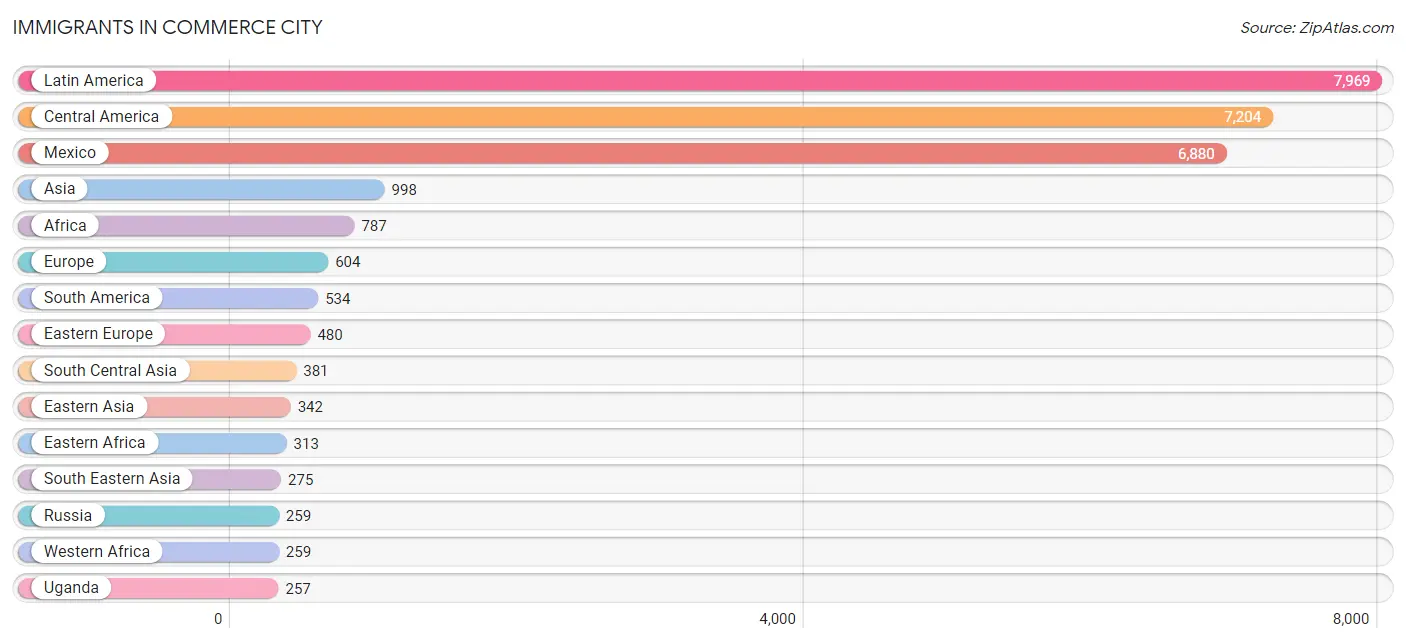
Immigrants in Commerce City
The most numerous immigrant groups reported in Commerce City came from Latin America (7,969 | 12.6%), Central America (7,204 | 11.4%), Mexico (6,880 | 10.9%), Asia (998 | 1.6%), and Africa (787 | 1.3%), together accounting for 37.8% of all Commerce City residents.
| Immigration Origin | # Population | % Population |
| Africa | 787 | 1.3% |
| Argentina | 5 | 0.0% |
| Asia | 998 | 1.6% |
| Bahamas | 2 | 0.0% |
| Brazil | 23 | 0.0% |
| Cambodia | 9 | 0.0% |
| Canada | 95 | 0.2% |
| Caribbean | 231 | 0.4% |
| Central America | 7,204 | 11.4% |
| China | 192 | 0.3% |
| Colombia | 175 | 0.3% |
| Croatia | 21 | 0.0% |
| Cuba | 16 | 0.0% |
| Czechoslovakia | 11 | 0.0% |
| Dominican Republic | 34 | 0.1% |
| Eastern Africa | 313 | 0.5% |
| Eastern Asia | 342 | 0.5% |
| Eastern Europe | 480 | 0.8% |
| El Salvador | 179 | 0.3% |
| England | 18 | 0.0% |
| Europe | 604 | 1.0% |
| France | 19 | 0.0% |
| Germany | 60 | 0.1% |
| Ghana | 55 | 0.1% |
| Guatemala | 90 | 0.1% |
| Honduras | 42 | 0.1% |
| Hong Kong | 45 | 0.1% |
| India | 137 | 0.2% |
| Indonesia | 45 | 0.1% |
| Jamaica | 179 | 0.3% |
| Korea | 150 | 0.2% |
| Laos | 80 | 0.1% |
| Latin America | 7,969 | 12.6% |
| Mexico | 6,880 | 10.9% |
| Middle Africa | 27 | 0.0% |
| Morocco | 109 | 0.2% |
| Nepal | 111 | 0.2% |
| Netherlands | 10 | 0.0% |
| Northern Africa | 149 | 0.2% |
| Northern Europe | 35 | 0.1% |
| Oceania | 12 | 0.0% |
| Pakistan | 121 | 0.2% |
| Panama | 13 | 0.0% |
| Peru | 179 | 0.3% |
| Philippines | 42 | 0.1% |
| Poland | 94 | 0.2% |
| Russia | 259 | 0.4% |
| South Africa | 39 | 0.1% |
| South America | 534 | 0.9% |
| South Central Asia | 381 | 0.6% |
| South Eastern Asia | 275 | 0.4% |
| Sudan | 40 | 0.1% |
| Sweden | 17 | 0.0% |
| Taiwan | 15 | 0.0% |
| Thailand | 28 | 0.0% |
| Uganda | 257 | 0.4% |
| Ukraine | 95 | 0.2% |
| Uzbekistan | 12 | 0.0% |
| Venezuela | 152 | 0.2% |
| Vietnam | 71 | 0.1% |
| Western Africa | 259 | 0.4% |
| Western Europe | 89 | 0.1% |
| Zaire | 27 | 0.0% |
| Zimbabwe | 9 | 0.0% | View All 64 Rows |
Sex and Age in Commerce City
Sex and Age in Commerce City
The most populous age groups in Commerce City are 10 to 14 Years (2,856 | 9.0%) for men and 10 to 14 Years (3,144 | 10.0%) for women.
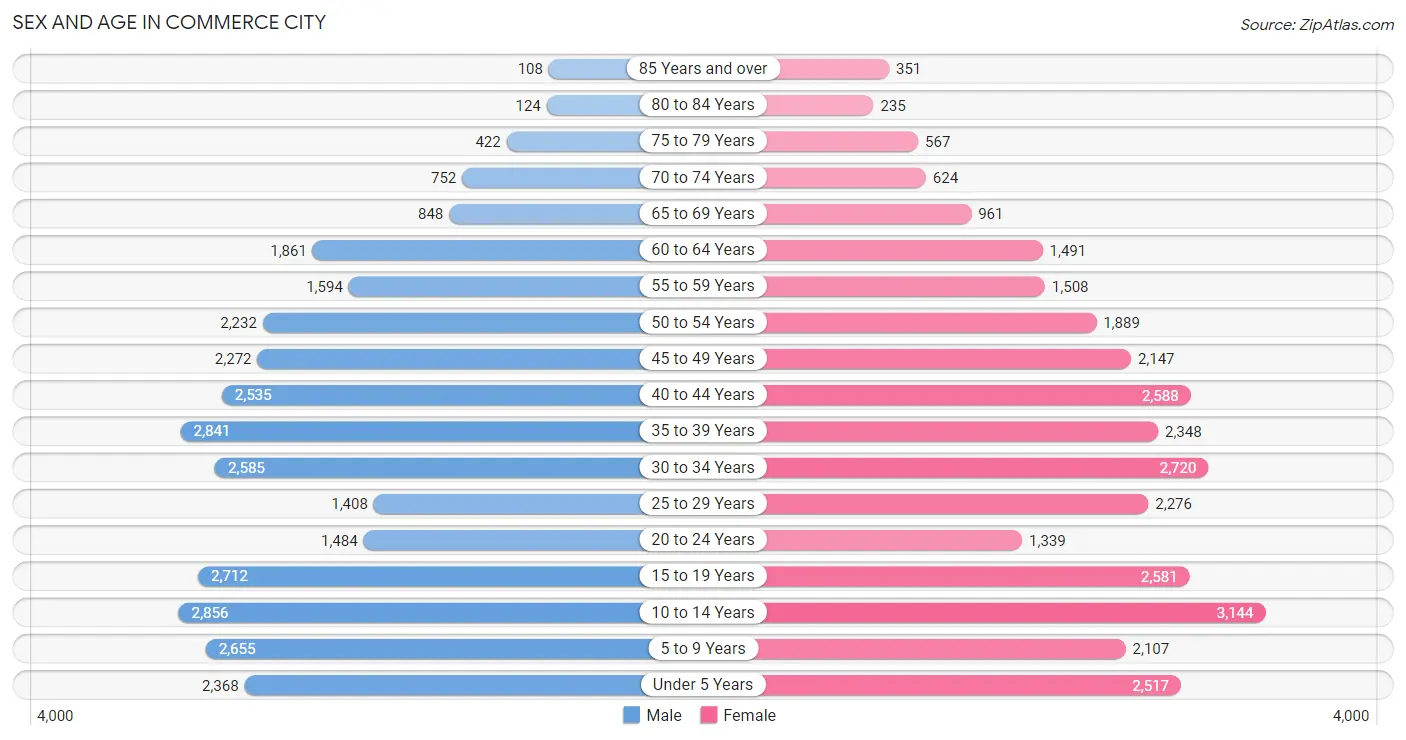
| Age Bracket | Male | Female |
| Under 5 Years | 2,368 (7.5%) | 2,517 (8.0%) |
| 5 to 9 Years | 2,655 (8.4%) | 2,107 (6.7%) |
| 10 to 14 Years | 2,856 (9.0%) | 3,144 (10.0%) |
| 15 to 19 Years | 2,712 (8.6%) | 2,581 (8.2%) |
| 20 to 24 Years | 1,484 (4.7%) | 1,339 (4.3%) |
| 25 to 29 Years | 1,408 (4.4%) | 2,276 (7.2%) |
| 30 to 34 Years | 2,585 (8.2%) | 2,720 (8.7%) |
| 35 to 39 Years | 2,841 (9.0%) | 2,348 (7.5%) |
| 40 to 44 Years | 2,535 (8.0%) | 2,588 (8.2%) |
| 45 to 49 Years | 2,272 (7.2%) | 2,147 (6.8%) |
| 50 to 54 Years | 2,232 (7.0%) | 1,889 (6.0%) |
| 55 to 59 Years | 1,594 (5.0%) | 1,508 (4.8%) |
| 60 to 64 Years | 1,861 (5.9%) | 1,491 (4.8%) |
| 65 to 69 Years | 848 (2.7%) | 961 (3.1%) |
| 70 to 74 Years | 752 (2.4%) | 624 (2.0%) |
| 75 to 79 Years | 422 (1.3%) | 567 (1.8%) |
| 80 to 84 Years | 124 (0.4%) | 235 (0.7%) |
| 85 Years and over | 108 (0.3%) | 351 (1.1%) |
| Total | 31,657 (100.0%) | 31,393 (100.0%) |
Families and Households in Commerce City
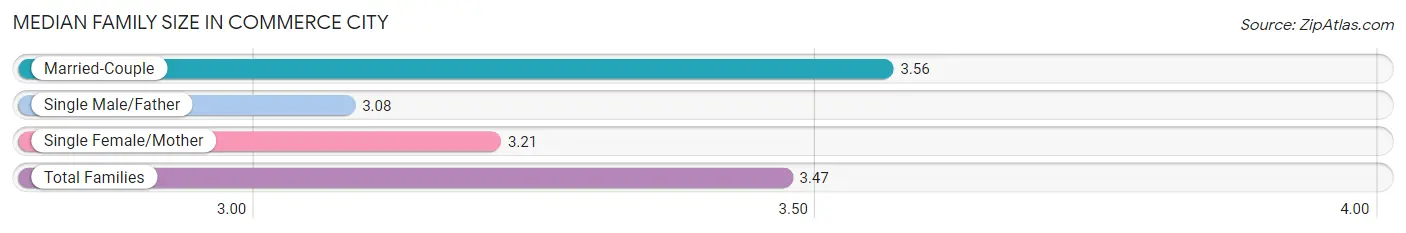
Median Family Size in Commerce City
The median family size in Commerce City is 3.47 persons per family, with married-couple families (12,058 | 76.2%) accounting for the largest median family size of 3.56 persons per family. On the other hand, single male/father families (1,150 | 7.3%) represent the smallest median family size with 3.08 persons per family.
| Family Type | # Families | Family Size |
| Married-Couple | 12,058 (76.2%) | 3.56 |
| Single Male/Father | 1,150 (7.3%) | 3.08 |
| Single Female/Mother | 2,607 (16.5%) | 3.21 |
| Total Families | 15,815 (100.0%) | 3.47 |
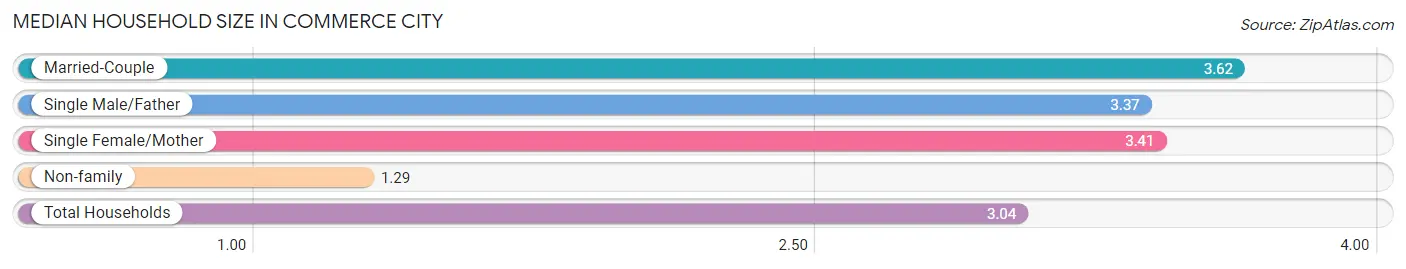
Median Household Size in Commerce City
The median household size in Commerce City is 3.04 persons per household, with married-couple households (12,058 | 58.5%) accounting for the largest median household size of 3.62 persons per household. non-family households (4,787 | 23.2%) represent the smallest median household size with 1.29 persons per household.
| Household Type | # Households | Household Size |
| Married-Couple | 12,058 (58.5%) | 3.62 |
| Single Male/Father | 1,150 (5.6%) | 3.37 |
| Single Female/Mother | 2,607 (12.7%) | 3.41 |
| Non-family | 4,787 (23.2%) | 1.29 |
| Total Households | 20,602 (100.0%) | 3.04 |
Household Size by Marriage Status in Commerce City
Out of a total of 20,602 households in Commerce City, 15,815 (76.8%) are family households, while 4,787 (23.2%) are nonfamily households. The most numerous type of family households are 2-person households, comprising 5,393, and the most common type of nonfamily households are 1-person households, comprising 3,752.
| Household Size | Family Households | Nonfamily Households |
| 1-Person Households | - | 3,752 (18.2%) |
| 2-Person Households | 5,393 (26.2%) | 908 (4.4%) |
| 3-Person Households | 3,351 (16.3%) | 74 (0.4%) |
| 4-Person Households | 4,299 (20.9%) | 0 (0.0%) |
| 5-Person Households | 1,535 (7.4%) | 20 (0.1%) |
| 6-Person Households | 627 (3.0%) | 0 (0.0%) |
| 7+ Person Households | 610 (3.0%) | 33 (0.2%) |
| Total | 15,815 (76.8%) | 4,787 (23.2%) |
Female Fertility in Commerce City
Fertility by Age in Commerce City
Average fertility rate in Commerce City is 54.0 births per 1,000 women. Women in the age bracket of 20 to 34 years have the highest fertility rate with 108.0 births per 1,000 women. Women in the age bracket of 20 to 34 years acount for 76.9% of all women with births.
| Age Bracket | Women with Births | Births / 1,000 Women |
| 15 to 19 years | 57 (6.4%) | 22.0 |
| 20 to 34 years | 682 (76.9%) | 108.0 |
| 35 to 50 years | 148 (16.7%) | 20.0 |
| Total | 887 (100.0%) | 54.0 |
Fertility by Age by Marriage Status in Commerce City
89.0% of women with births (887) in Commerce City are married. The highest percentage of unmarried women with births falls into 15 to 19 years age bracket with 36.8% of them unmarried at the time of birth, while the lowest percentage of unmarried women with births belong to 20 to 34 years age bracket with 6.6% of them unmarried.
| Age Bracket | Married | Unmarried |
| 15 to 19 years | 36 (63.2%) | 21 (36.8%) |
| 20 to 34 years | 637 (93.4%) | 45 (6.6%) |
| 35 to 50 years | 116 (78.4%) | 32 (21.6%) |
| Total | 789 (88.9%) | 98 (11.1%) |
Fertility by Education in Commerce City
Average fertility rate in Commerce City is 54.0 births per 1,000 women. Women with the education attainment of bachelor's degree have the highest fertility rate of 92.0 births per 1,000 women, while women with the education attainment of high school diploma have the lowest fertility at 17.0 births per 1,000 women. Women with the education attainment of college or associate's degree represent 32.1% of all women with births.
| Educational Attainment | Women with Births | Births / 1,000 Women |
| Less than High School | 221 (24.9%) | 64.0 |
| High School Diploma | 74 (8.3%) | 17.0 |
| College or Associate's Degree | 285 (32.1%) | 64.0 |
| Bachelor's Degree | 252 (28.4%) | 92.0 |
| Graduate Degree | 55 (6.2%) | 38.0 |
| Total | 887 (100.0%) | 54.0 |
Fertility by Education by Marriage Status in Commerce City
11.1% of women with births in Commerce City are unmarried. Women with the educational attainment of less than high school are most likely to be married with 100.0% of them married at childbirth, while women with the educational attainment of high school diploma are least likely to be married with 39.2% of them unmarried at childbirth.
| Educational Attainment | Married | Unmarried |
| Less than High School | 221 (100.0%) | 0 (0.0%) |
| High School Diploma | 45 (60.8%) | 29 (39.2%) |
| College or Associate's Degree | 231 (81.0%) | 54 (19.0%) |
| Bachelor's Degree | 237 (94.1%) | 15 (5.9%) |
| Graduate Degree | 55 (100.0%) | 0 (0.0%) |
| Total | 789 (88.9%) | 98 (11.1%) |
Employment Characteristics in Commerce City
Employment by Class of Employer in Commerce City
Among the 31,993 employed individuals in Commerce City, private company employees (21,503 | 67.2%), local government employees (2,957 | 9.2%), and not-for-profit organizations (2,582 | 8.1%) make up the most common classes of employment.
| Employer Class | # Employees | % Employees |
| Private Company Employees | 21,503 | 67.2% |
| Self-Employed (Incorporated) | 1,276 | 4.0% |
| Self-Employed (Not Incorporated) | 1,527 | 4.8% |
| Not-for-profit Organizations | 2,582 | 8.1% |
| Local Government Employees | 2,957 | 9.2% |
| State Government Employees | 913 | 2.9% |
| Federal Government Employees | 1,144 | 3.6% |
| Unpaid Family Workers | 91 | 0.3% |
| Total | 31,993 | 100.0% |
Employment Status by Age in Commerce City
According to the labor force statistics for Commerce City, out of the total population over 16 years of age (46,216), 73.5% or 33,969 individuals are in the labor force, with 4.6% or 1,563 of them unemployed. The age group with the highest labor force participation rate is 20 to 24 years, with 95.3% or 2,690 individuals in the labor force. Within the labor force, the 16 to 19 years age range has the highest percentage of unemployed individuals, with 17.5% or 293 of them being unemployed.
| Age Bracket | In Labor Force | Unemployed |
| 16 to 19 Years | 1,675 (40.8%) | 293 (17.5%) |
| 20 to 24 Years | 2,690 (95.3%) | 110 (4.1%) |
| 25 to 29 Years | 3,375 (91.6%) | 196 (5.8%) |
| 30 to 34 Years | 4,599 (86.7%) | 143 (3.1%) |
| 35 to 44 Years | 8,920 (86.5%) | 357 (4.0%) |
| 45 to 54 Years | 7,379 (86.4%) | 376 (5.1%) |
| 55 to 59 Years | 2,398 (77.3%) | 24 (1.0%) |
| 60 to 64 Years | 2,115 (63.1%) | 57 (2.7%) |
| 65 to 74 Years | 748 (23.5%) | 0 (0.0%) |
| 75 Years and over | 69 (3.8%) | 0 (0.0%) |
| Total | 33,969 (73.5%) | 1,563 (4.6%) |
Employment Status by Educational Attainment in Commerce City
According to labor force statistics for Commerce City, 83.9% of individuals (28,774) out of the total population between 25 and 64 years of age (34,295) are in the labor force, with 4.0% or 1,151 of them being unemployed. The group with the highest labor force participation rate are those with the educational attainment of bachelor's degree or higher, with 93.4% or 8,255 individuals in the labor force. Within the labor force, individuals with less than high school education have the highest percentage of unemployment, with 8.0% or 299 of them being unemployed.
| Educational Attainment | In Labor Force | Unemployed |
| Less than High School | 3,736 (73.5%) | 407 (8.0%) |
| High School Diploma | 8,243 (78.5%) | 525 (5.0%) |
| College / Associate Degree | 8,540 (86.5%) | 237 (2.4%) |
| Bachelor's Degree or higher | 8,255 (93.4%) | 247 (2.8%) |
| Total | 28,774 (83.9%) | 1,372 (4.0%) |
Employment Occupations by Sex in Commerce City
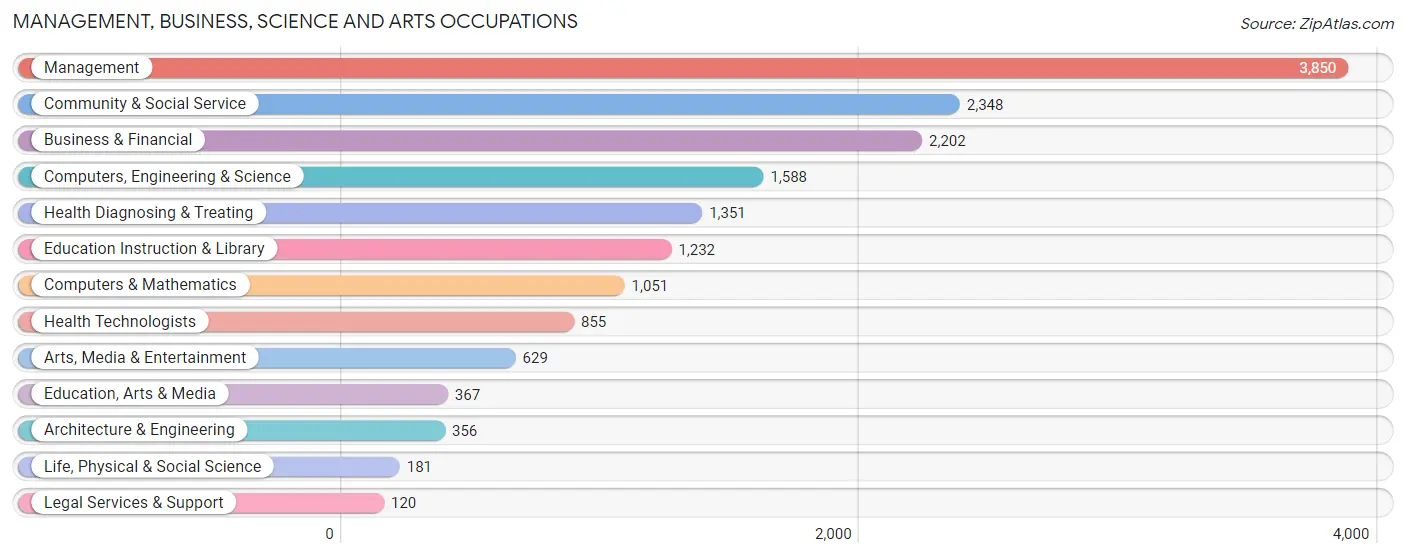
Management, Business, Science and Arts Occupations
The most common Management, Business, Science and Arts occupations in Commerce City are Management (3,850 | 12.0%), Community & Social Service (2,348 | 7.3%), Business & Financial (2,202 | 6.8%), Computers, Engineering & Science (1,588 | 4.9%), and Health Diagnosing & Treating (1,351 | 4.2%).
Management, Business, Science and Arts Occupations by Sex
Within the Management, Business, Science and Arts occupations in Commerce City, the most male-oriented occupations are Architecture & Engineering (82.6%), Computers & Mathematics (81.2%), and Computers, Engineering & Science (80.1%), while the most female-oriented occupations are Health Technologists (86.8%), Education, Arts & Media (85.8%), and Health Diagnosing & Treating (84.1%).
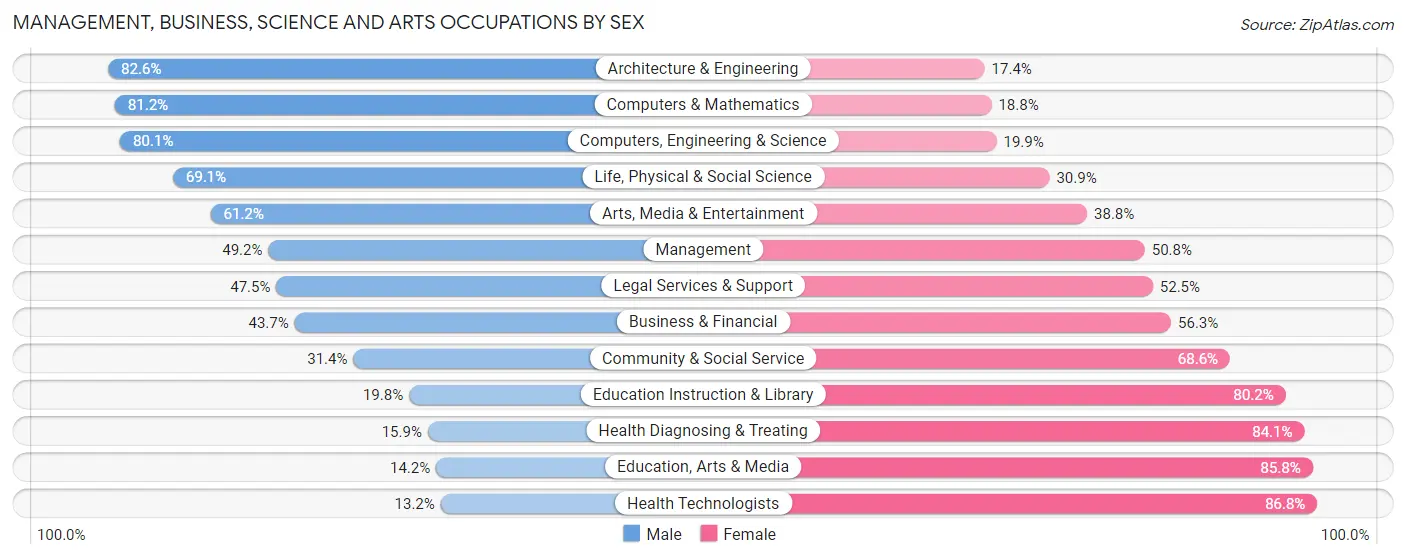
| Occupation | Male | Female |
| Management | 1,893 (49.2%) | 1,957 (50.8%) |
| Business & Financial | 962 (43.7%) | 1,240 (56.3%) |
| Computers, Engineering & Science | 1,272 (80.1%) | 316 (19.9%) |
| Computers & Mathematics | 853 (81.2%) | 198 (18.8%) |
| Architecture & Engineering | 294 (82.6%) | 62 (17.4%) |
| Life, Physical & Social Science | 125 (69.1%) | 56 (30.9%) |
| Community & Social Service | 738 (31.4%) | 1,610 (68.6%) |
| Education, Arts & Media | 52 (14.2%) | 315 (85.8%) |
| Legal Services & Support | 57 (47.5%) | 63 (52.5%) |
| Education Instruction & Library | 244 (19.8%) | 988 (80.2%) |
| Arts, Media & Entertainment | 385 (61.2%) | 244 (38.8%) |
| Health Diagnosing & Treating | 215 (15.9%) | 1,136 (84.1%) |
| Health Technologists | 113 (13.2%) | 742 (86.8%) |
| Total (Category) | 5,080 (44.8%) | 6,259 (55.2%) |
| Total (Overall) | 17,293 (53.7%) | 14,882 (46.3%) |
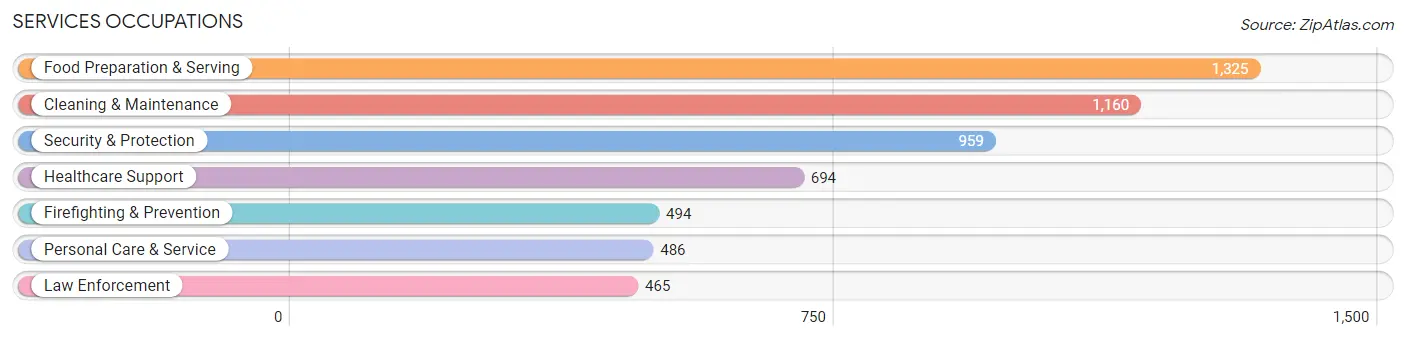
Services Occupations
The most common Services occupations in Commerce City are Food Preparation & Serving (1,325 | 4.1%), Cleaning & Maintenance (1,160 | 3.6%), Security & Protection (959 | 3.0%), Healthcare Support (694 | 2.2%), and Firefighting & Prevention (494 | 1.5%).
Services Occupations by Sex
Within the Services occupations in Commerce City, the most male-oriented occupations are Law Enforcement (86.7%), Security & Protection (67.4%), and Firefighting & Prevention (49.2%), while the most female-oriented occupations are Healthcare Support (97.6%), Personal Care & Service (69.8%), and Cleaning & Maintenance (59.6%).
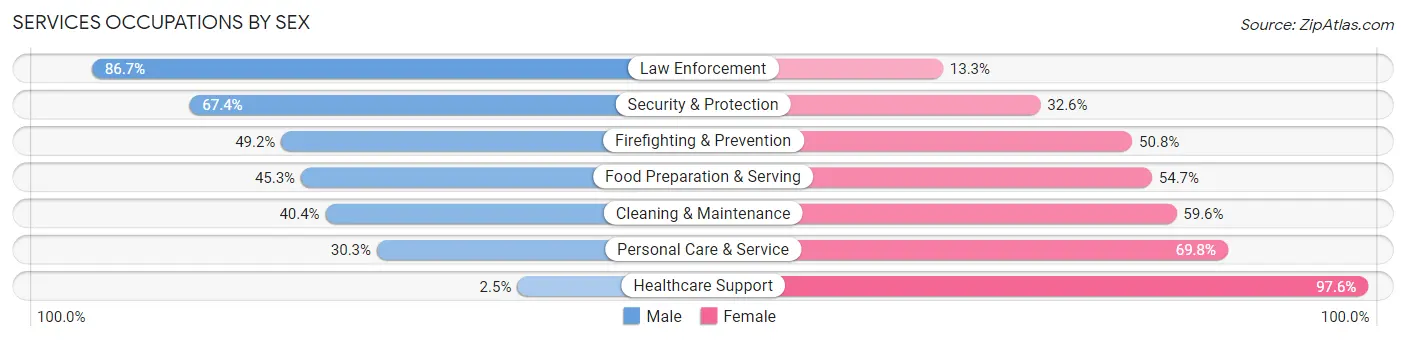
| Occupation | Male | Female |
| Healthcare Support | 17 (2.5%) | 677 (97.6%) |
| Security & Protection | 646 (67.4%) | 313 (32.6%) |
| Firefighting & Prevention | 243 (49.2%) | 251 (50.8%) |
| Law Enforcement | 403 (86.7%) | 62 (13.3%) |
| Food Preparation & Serving | 600 (45.3%) | 725 (54.7%) |
| Cleaning & Maintenance | 469 (40.4%) | 691 (59.6%) |
| Personal Care & Service | 147 (30.2%) | 339 (69.8%) |
| Total (Category) | 1,879 (40.6%) | 2,745 (59.4%) |
| Total (Overall) | 17,293 (53.7%) | 14,882 (46.3%) |
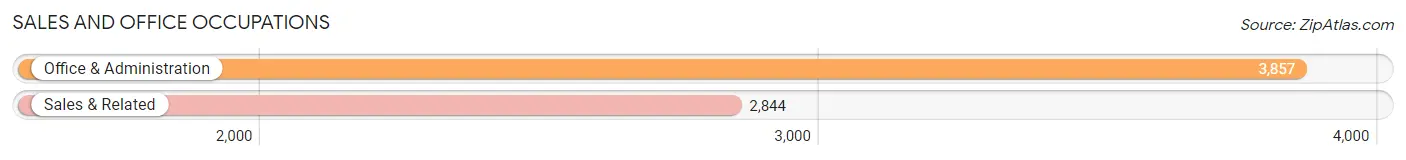
Sales and Office Occupations
The most common Sales and Office occupations in Commerce City are Office & Administration (3,857 | 12.0%), and Sales & Related (2,844 | 8.8%).
Sales and Office Occupations by Sex
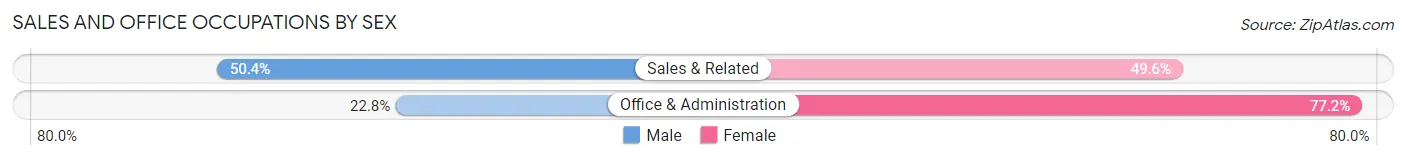
| Occupation | Male | Female |
| Sales & Related | 1,434 (50.4%) | 1,410 (49.6%) |
| Office & Administration | 881 (22.8%) | 2,976 (77.2%) |
| Total (Category) | 2,315 (34.5%) | 4,386 (65.4%) |
| Total (Overall) | 17,293 (53.7%) | 14,882 (46.3%) |
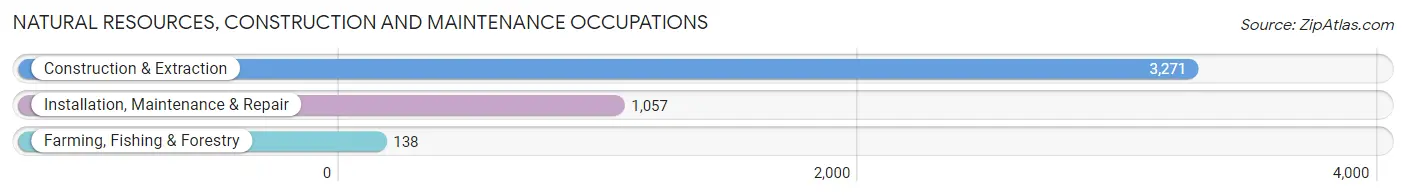
Natural Resources, Construction and Maintenance Occupations
The most common Natural Resources, Construction and Maintenance occupations in Commerce City are Construction & Extraction (3,271 | 10.2%), Installation, Maintenance & Repair (1,057 | 3.3%), and Farming, Fishing & Forestry (138 | 0.4%).
Natural Resources, Construction and Maintenance Occupations by Sex
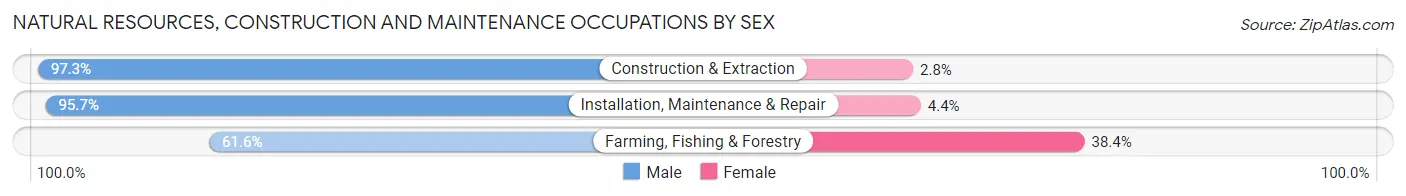
| Occupation | Male | Female |
| Farming, Fishing & Forestry | 85 (61.6%) | 53 (38.4%) |
| Construction & Extraction | 3,181 (97.3%) | 90 (2.8%) |
| Installation, Maintenance & Repair | 1,011 (95.7%) | 46 (4.3%) |
| Total (Category) | 4,277 (95.8%) | 189 (4.2%) |
| Total (Overall) | 17,293 (53.7%) | 14,882 (46.3%) |
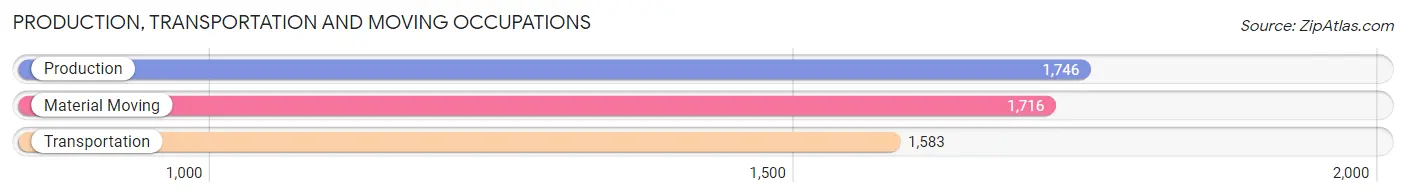
Production, Transportation and Moving Occupations
The most common Production, Transportation and Moving occupations in Commerce City are Production (1,746 | 5.4%), Material Moving (1,716 | 5.3%), and Transportation (1,583 | 4.9%).
Production, Transportation and Moving Occupations by Sex
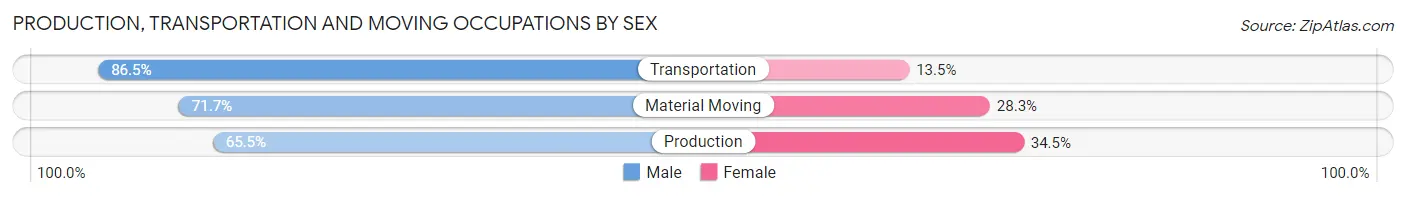
| Occupation | Male | Female |
| Production | 1,143 (65.5%) | 603 (34.5%) |
| Transportation | 1,369 (86.5%) | 214 (13.5%) |
| Material Moving | 1,230 (71.7%) | 486 (28.3%) |
| Total (Category) | 3,742 (74.2%) | 1,303 (25.8%) |
| Total (Overall) | 17,293 (53.7%) | 14,882 (46.3%) |
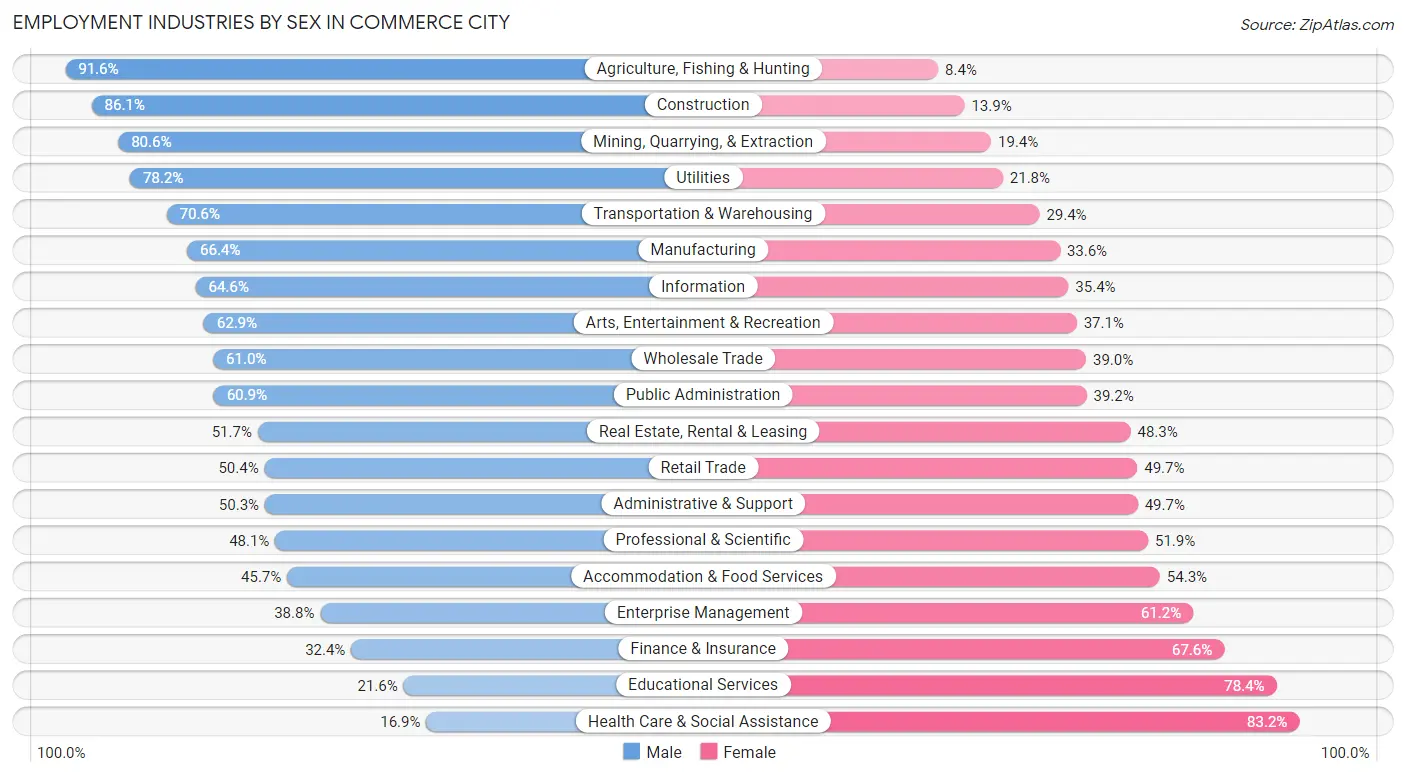
Employment Industries by Sex in Commerce City
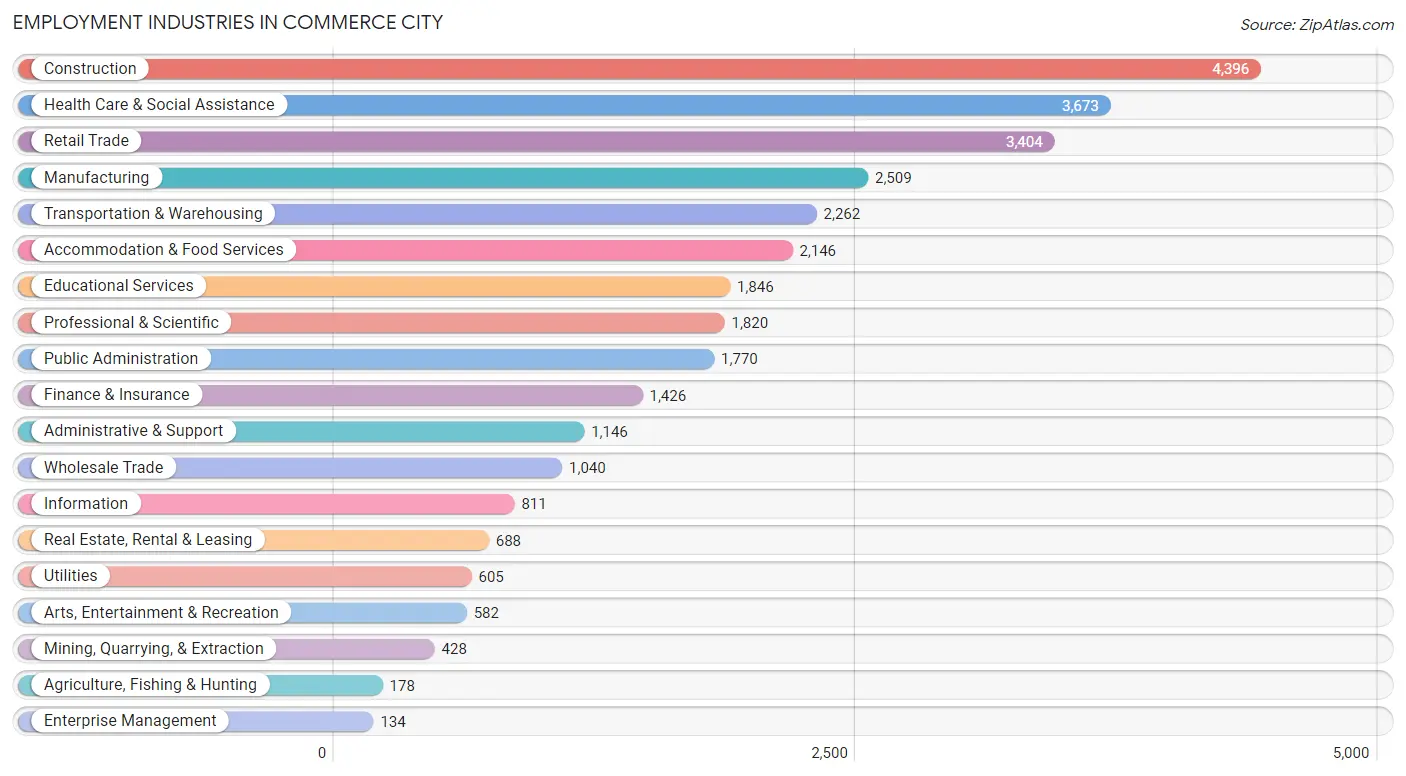
Employment Industries in Commerce City
The major employment industries in Commerce City include Construction (4,396 | 13.7%), Health Care & Social Assistance (3,673 | 11.4%), Retail Trade (3,404 | 10.6%), Manufacturing (2,509 | 7.8%), and Transportation & Warehousing (2,262 | 7.0%).
Employment Industries by Sex in Commerce City
The Commerce City industries that see more men than women are Agriculture, Fishing & Hunting (91.6%), Construction (86.1%), and Mining, Quarrying, & Extraction (80.6%), whereas the industries that tend to have a higher number of women are Health Care & Social Assistance (83.2%), Educational Services (78.4%), and Finance & Insurance (67.6%).
| Industry | Male | Female |
| Agriculture, Fishing & Hunting | 163 (91.6%) | 15 (8.4%) |
| Mining, Quarrying, & Extraction | 345 (80.6%) | 83 (19.4%) |
| Construction | 3,786 (86.1%) | 610 (13.9%) |
| Manufacturing | 1,665 (66.4%) | 844 (33.6%) |
| Wholesale Trade | 634 (61.0%) | 406 (39.0%) |
| Retail Trade | 1,714 (50.3%) | 1,690 (49.6%) |
| Transportation & Warehousing | 1,597 (70.6%) | 665 (29.4%) |
| Utilities | 473 (78.2%) | 132 (21.8%) |
| Information | 524 (64.6%) | 287 (35.4%) |
| Finance & Insurance | 462 (32.4%) | 964 (67.6%) |
| Real Estate, Rental & Leasing | 356 (51.7%) | 332 (48.3%) |
| Professional & Scientific | 876 (48.1%) | 944 (51.9%) |
| Enterprise Management | 52 (38.8%) | 82 (61.2%) |
| Administrative & Support | 576 (50.3%) | 570 (49.7%) |
| Educational Services | 398 (21.6%) | 1,448 (78.4%) |
| Health Care & Social Assistance | 619 (16.9%) | 3,054 (83.2%) |
| Arts, Entertainment & Recreation | 366 (62.9%) | 216 (37.1%) |
| Accommodation & Food Services | 980 (45.7%) | 1,166 (54.3%) |
| Public Administration | 1,077 (60.9%) | 693 (39.2%) |
| Total | 17,293 (53.7%) | 14,882 (46.3%) |
Education in Commerce City
School Enrollment in Commerce City
The most common levels of schooling among the 18,011 students in Commerce City are middle school (5,045 | 28.0%), high school (4,913 | 27.3%), and elementary school (3,569 | 19.8%).
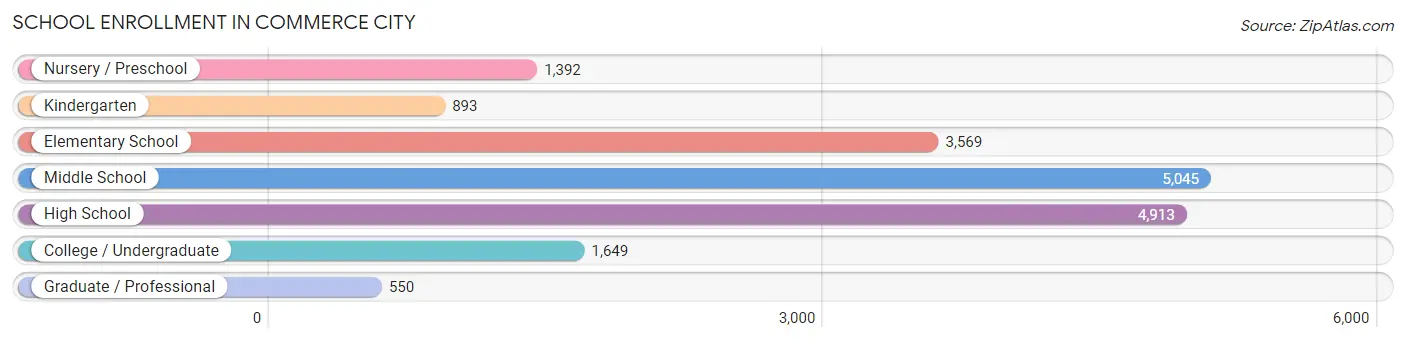
| School Level | # Students | % Students |
| Nursery / Preschool | 1,392 | 7.7% |
| Kindergarten | 893 | 5.0% |
| Elementary School | 3,569 | 19.8% |
| Middle School | 5,045 | 28.0% |
| High School | 4,913 | 27.3% |
| College / Undergraduate | 1,649 | 9.2% |
| Graduate / Professional | 550 | 3.0% |
| Total | 18,011 | 100.0% |
School Enrollment by Age by Funding Source in Commerce City
Out of a total of 18,011 students who are enrolled in schools in Commerce City, 1,711 (9.5%) attend a private institution, while the remaining 16,300 (90.5%) are enrolled in public schools. The age group of 35 years and over has the highest likelihood of being enrolled in private schools, with 198 (29.4% in the age bracket) enrolled. Conversely, the age group of 5 to 9 year old has the lowest likelihood of being enrolled in a private school, with 4,300 (96.1% in the age bracket) attending a public institution.
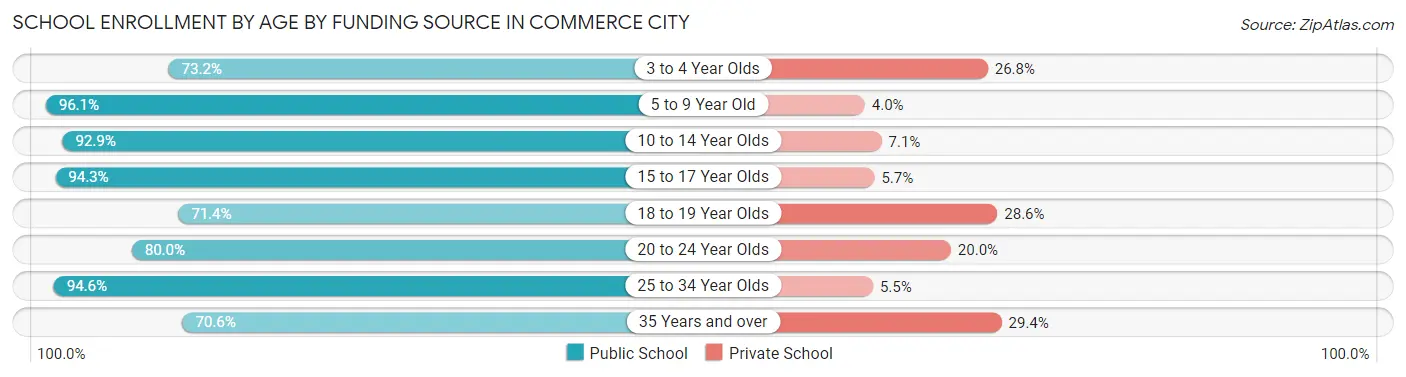
| Age Bracket | Public School | Private School |
| 3 to 4 Year Olds | 845 (73.2%) | 310 (26.8%) |
| 5 to 9 Year Old | 4,300 (96.1%) | 177 (4.0%) |
| 10 to 14 Year Olds | 5,449 (92.9%) | 414 (7.1%) |
| 15 to 17 Year Olds | 3,520 (94.3%) | 214 (5.7%) |
| 18 to 19 Year Olds | 541 (71.4%) | 217 (28.6%) |
| 20 to 24 Year Olds | 597 (80.0%) | 149 (20.0%) |
| 25 to 34 Year Olds | 572 (94.6%) | 33 (5.4%) |
| 35 Years and over | 475 (70.6%) | 198 (29.4%) |
| Total | 16,300 (90.5%) | 1,711 (9.5%) |
Educational Attainment by Field of Study in Commerce City
Business (2,599 | 25.3%), arts & humanities (1,213 | 11.8%), science & technology (1,196 | 11.6%), education (880 | 8.6%), and communications (700 | 6.8%) are the most common fields of study among 10,284 individuals in Commerce City who have obtained a bachelor's degree or higher.
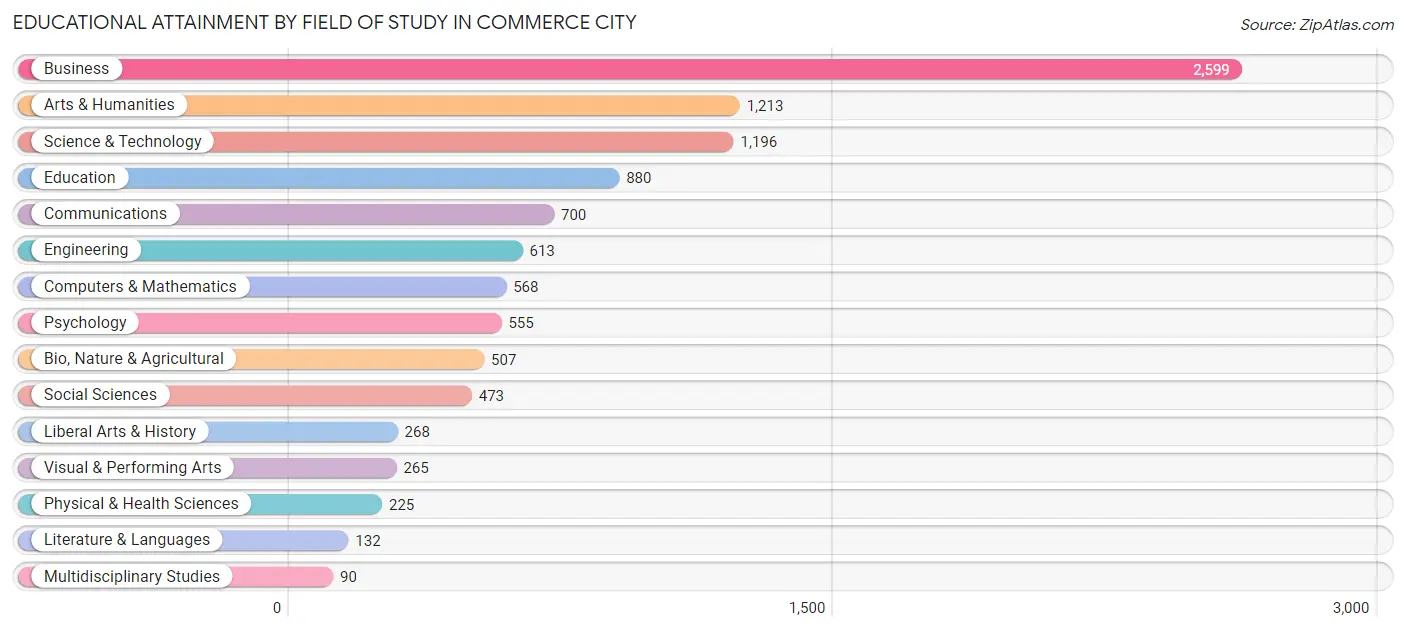
| Field of Study | # Graduates | % Graduates |
| Computers & Mathematics | 568 | 5.5% |
| Bio, Nature & Agricultural | 507 | 4.9% |
| Physical & Health Sciences | 225 | 2.2% |
| Psychology | 555 | 5.4% |
| Social Sciences | 473 | 4.6% |
| Engineering | 613 | 6.0% |
| Multidisciplinary Studies | 90 | 0.9% |
| Science & Technology | 1,196 | 11.6% |
| Business | 2,599 | 25.3% |
| Education | 880 | 8.6% |
| Literature & Languages | 132 | 1.3% |
| Liberal Arts & History | 268 | 2.6% |
| Visual & Performing Arts | 265 | 2.6% |
| Communications | 700 | 6.8% |
| Arts & Humanities | 1,213 | 11.8% |
| Total | 10,284 | 100.0% |
Transportation & Commute in Commerce City
Vehicle Availability by Sex in Commerce City
The most prevalent vehicle ownership categories in Commerce City are males with 2 vehicles (7,942, accounting for 46.1%) and females with 2 vehicles (5,914, making up 53.9%).
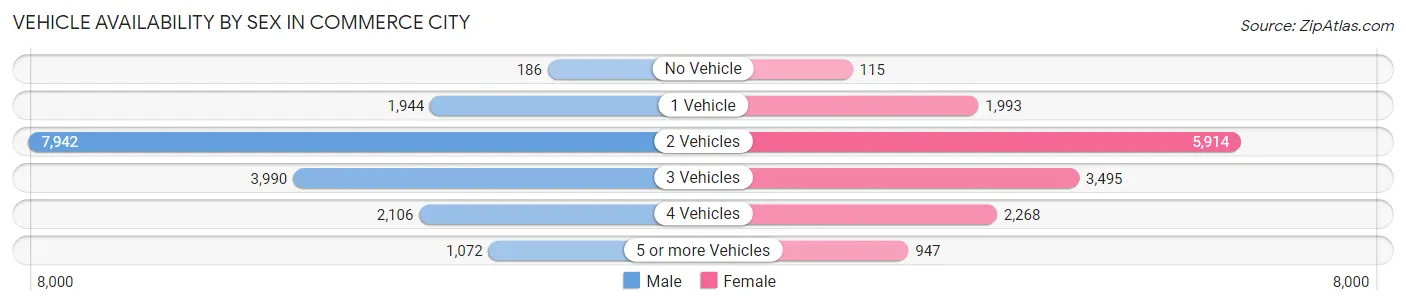
| Vehicles Available | Male | Female |
| No Vehicle | 186 (1.1%) | 115 (0.8%) |
| 1 Vehicle | 1,944 (11.3%) | 1,993 (13.5%) |
| 2 Vehicles | 7,942 (46.1%) | 5,914 (40.1%) |
| 3 Vehicles | 3,990 (23.1%) | 3,495 (23.7%) |
| 4 Vehicles | 2,106 (12.2%) | 2,268 (15.4%) |
| 5 or more Vehicles | 1,072 (6.2%) | 947 (6.4%) |
| Total | 17,240 (100.0%) | 14,732 (100.0%) |
Commute Time in Commerce City
The most frequently occuring commute durations in Commerce City are 30 to 34 minutes (6,442 commuters, 23.1%), 20 to 24 minutes (4,170 commuters, 14.9%), and 15 to 19 minutes (3,170 commuters, 11.4%).
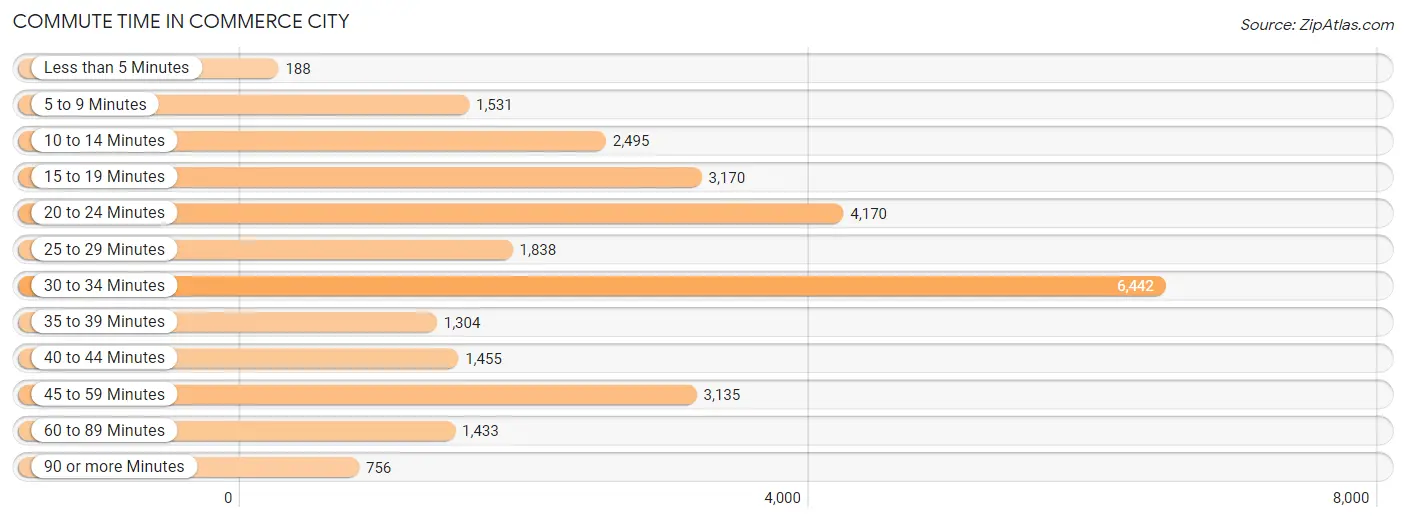
| Commute Time | # Commuters | % Commuters |
| Less than 5 Minutes | 188 | 0.7% |
| 5 to 9 Minutes | 1,531 | 5.5% |
| 10 to 14 Minutes | 2,495 | 8.9% |
| 15 to 19 Minutes | 3,170 | 11.4% |
| 20 to 24 Minutes | 4,170 | 14.9% |
| 25 to 29 Minutes | 1,838 | 6.6% |
| 30 to 34 Minutes | 6,442 | 23.1% |
| 35 to 39 Minutes | 1,304 | 4.7% |
| 40 to 44 Minutes | 1,455 | 5.2% |
| 45 to 59 Minutes | 3,135 | 11.2% |
| 60 to 89 Minutes | 1,433 | 5.1% |
| 90 or more Minutes | 756 | 2.7% |
Commute Time by Sex in Commerce City
The most common commute times in Commerce City are 30 to 34 minutes (3,940 commuters, 24.9%) for males and 30 to 34 minutes (2,502 commuters, 20.6%) for females.
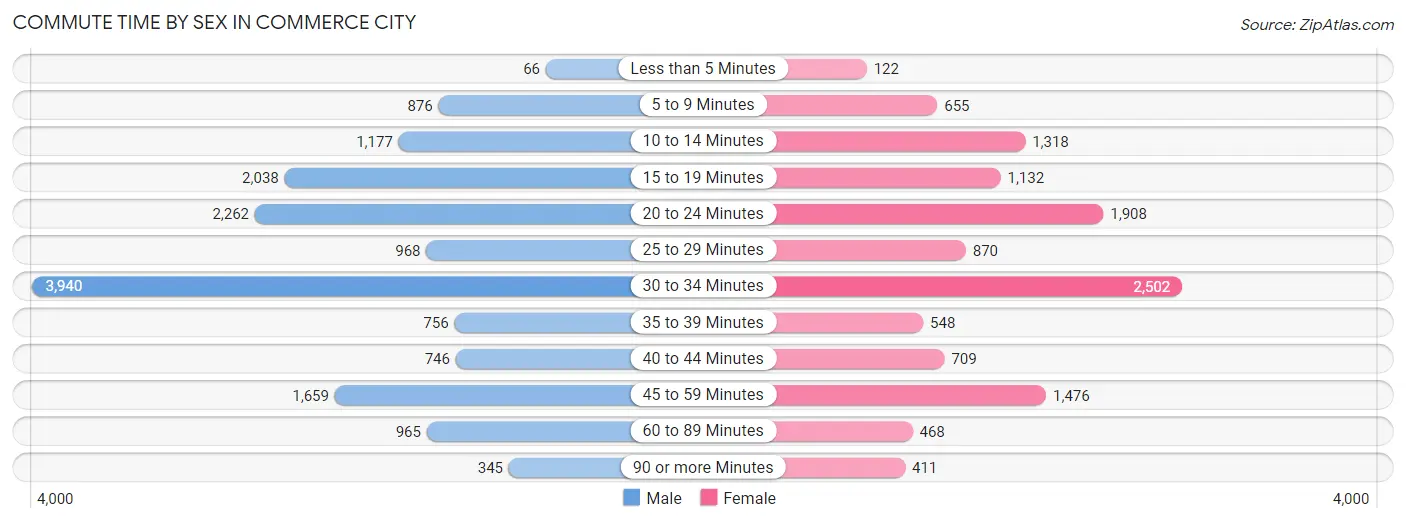
| Commute Time | Male | Female |
| Less than 5 Minutes | 66 (0.4%) | 122 (1.0%) |
| 5 to 9 Minutes | 876 (5.6%) | 655 (5.4%) |
| 10 to 14 Minutes | 1,177 (7.4%) | 1,318 (10.9%) |
| 15 to 19 Minutes | 2,038 (12.9%) | 1,132 (9.3%) |
| 20 to 24 Minutes | 2,262 (14.3%) | 1,908 (15.7%) |
| 25 to 29 Minutes | 968 (6.1%) | 870 (7.2%) |
| 30 to 34 Minutes | 3,940 (24.9%) | 2,502 (20.6%) |
| 35 to 39 Minutes | 756 (4.8%) | 548 (4.5%) |
| 40 to 44 Minutes | 746 (4.7%) | 709 (5.9%) |
| 45 to 59 Minutes | 1,659 (10.5%) | 1,476 (12.2%) |
| 60 to 89 Minutes | 965 (6.1%) | 468 (3.9%) |
| 90 or more Minutes | 345 (2.2%) | 411 (3.4%) |
Time of Departure to Work by Sex in Commerce City
The most frequent times of departure to work in Commerce City are 6:00 AM to 6:29 AM (2,272, 14.4%) for males and 7:00 AM to 7:29 AM (1,811, 14.9%) for females.
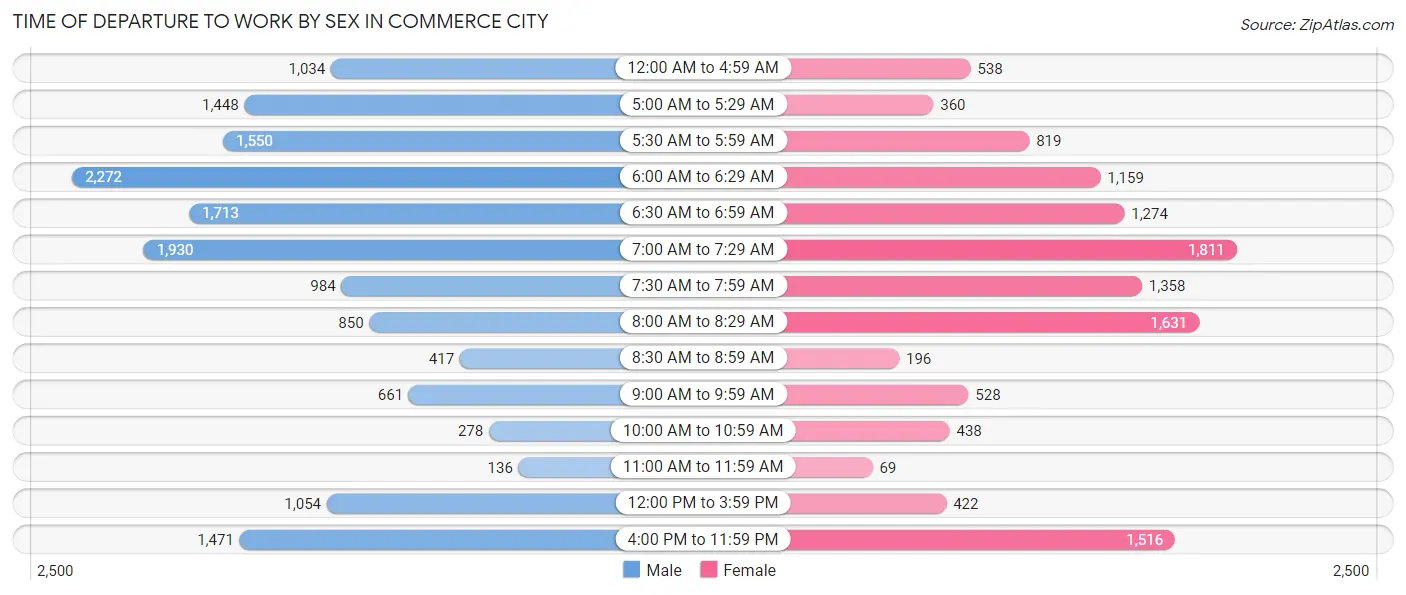
| Time of Departure | Male | Female |
| 12:00 AM to 4:59 AM | 1,034 (6.6%) | 538 (4.4%) |
| 5:00 AM to 5:29 AM | 1,448 (9.2%) | 360 (3.0%) |
| 5:30 AM to 5:59 AM | 1,550 (9.8%) | 819 (6.8%) |
| 6:00 AM to 6:29 AM | 2,272 (14.4%) | 1,159 (9.6%) |
| 6:30 AM to 6:59 AM | 1,713 (10.8%) | 1,274 (10.5%) |
| 7:00 AM to 7:29 AM | 1,930 (12.2%) | 1,811 (14.9%) |
| 7:30 AM to 7:59 AM | 984 (6.2%) | 1,358 (11.2%) |
| 8:00 AM to 8:29 AM | 850 (5.4%) | 1,631 (13.5%) |
| 8:30 AM to 8:59 AM | 417 (2.6%) | 196 (1.6%) |
| 9:00 AM to 9:59 AM | 661 (4.2%) | 528 (4.4%) |
| 10:00 AM to 10:59 AM | 278 (1.8%) | 438 (3.6%) |
| 11:00 AM to 11:59 AM | 136 (0.9%) | 69 (0.6%) |
| 12:00 PM to 3:59 PM | 1,054 (6.7%) | 422 (3.5%) |
| 4:00 PM to 11:59 PM | 1,471 (9.3%) | 1,516 (12.5%) |
| Total | 15,798 (100.0%) | 12,119 (100.0%) |
Housing Occupancy in Commerce City
Occupancy by Ownership in Commerce City
Of the total 20,602 dwellings in Commerce City, owner-occupied units account for 15,854 (76.9%), while renter-occupied units make up 4,748 (23.1%).
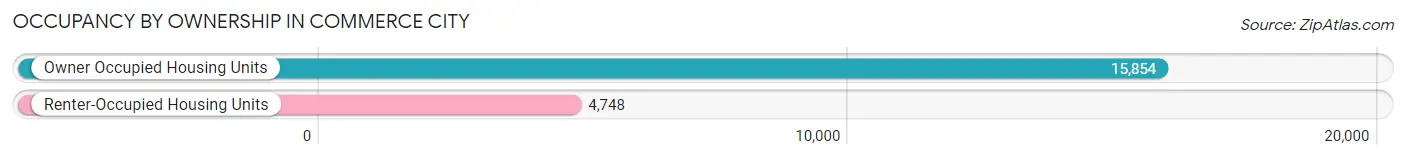
| Occupancy | # Housing Units | % Housing Units |
| Owner Occupied Housing Units | 15,854 | 76.9% |
| Renter-Occupied Housing Units | 4,748 | 23.1% |
| Total Occupied Housing Units | 20,602 | 100.0% |
Occupancy by Household Size in Commerce City
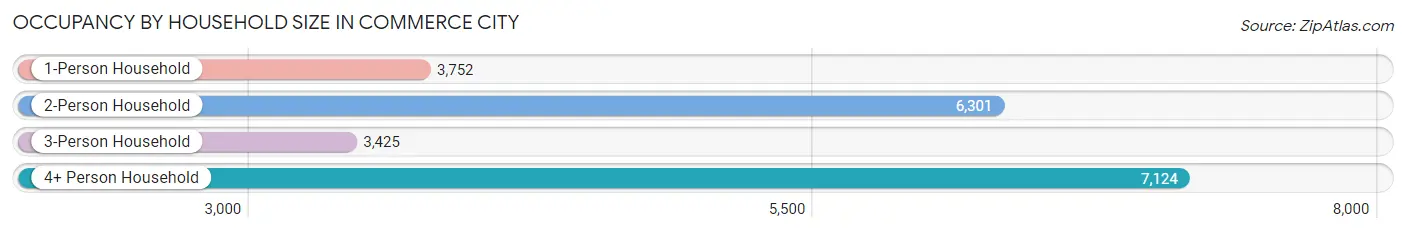
| Household Size | # Housing Units | % Housing Units |
| 1-Person Household | 3,752 | 18.2% |
| 2-Person Household | 6,301 | 30.6% |
| 3-Person Household | 3,425 | 16.6% |
| 4+ Person Household | 7,124 | 34.6% |
| Total Housing Units | 20,602 | 100.0% |
Occupancy by Ownership by Household Size in Commerce City
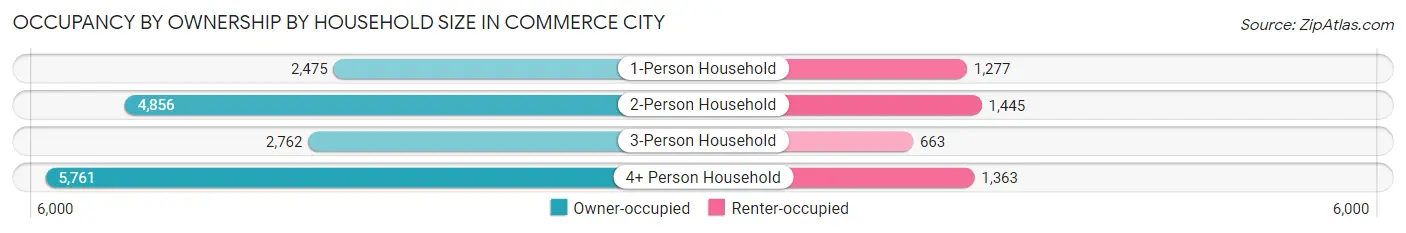
| Household Size | Owner-occupied | Renter-occupied |
| 1-Person Household | 2,475 (66.0%) | 1,277 (34.0%) |
| 2-Person Household | 4,856 (77.1%) | 1,445 (22.9%) |
| 3-Person Household | 2,762 (80.6%) | 663 (19.4%) |
| 4+ Person Household | 5,761 (80.9%) | 1,363 (19.1%) |
| Total Housing Units | 15,854 (76.9%) | 4,748 (23.1%) |
Occupancy by Educational Attainment in Commerce City
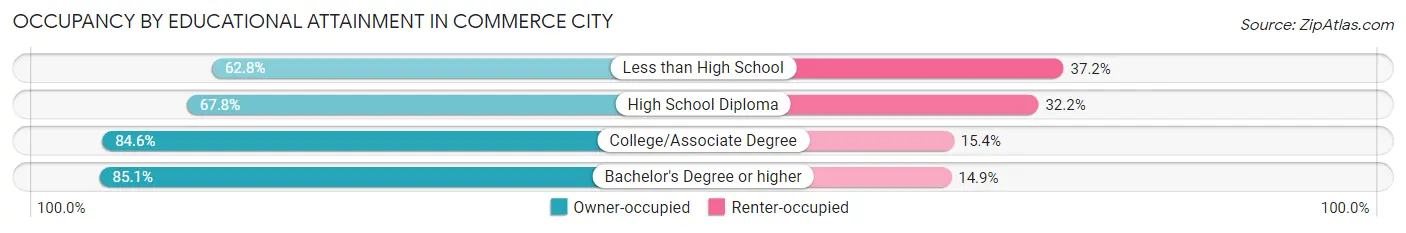
| Household Size | Owner-occupied | Renter-occupied |
| Less than High School | 1,774 (62.8%) | 1,049 (37.2%) |
| High School Diploma | 4,000 (67.8%) | 1,898 (32.2%) |
| College/Associate Degree | 5,309 (84.6%) | 966 (15.4%) |
| Bachelor's Degree or higher | 4,771 (85.1%) | 835 (14.9%) |
Occupancy by Age of Householder in Commerce City
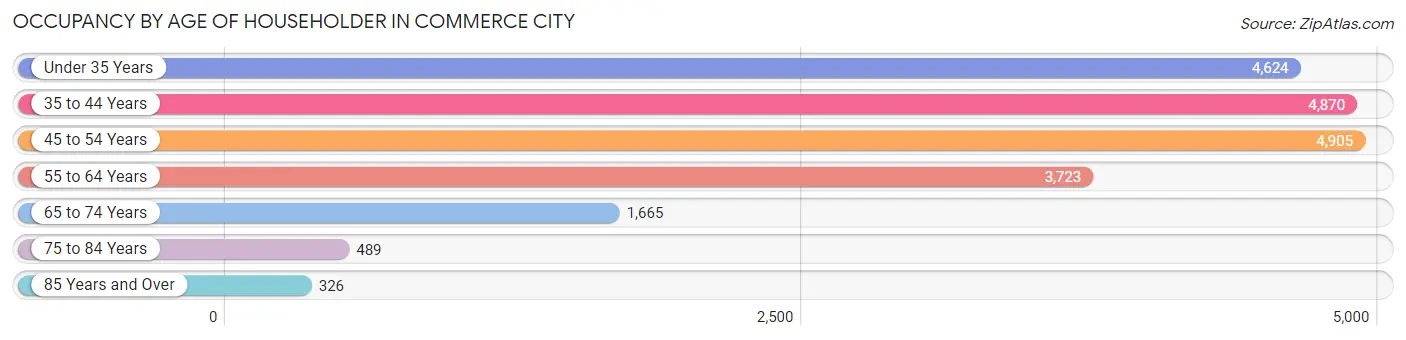
| Age Bracket | # Households | % Households |
| Under 35 Years | 4,624 | 22.4% |
| 35 to 44 Years | 4,870 | 23.6% |
| 45 to 54 Years | 4,905 | 23.8% |
| 55 to 64 Years | 3,723 | 18.1% |
| 65 to 74 Years | 1,665 | 8.1% |
| 75 to 84 Years | 489 | 2.4% |
| 85 Years and Over | 326 | 1.6% |
| Total | 20,602 | 100.0% |
Housing Finances in Commerce City
Median Income by Occupancy in Commerce City
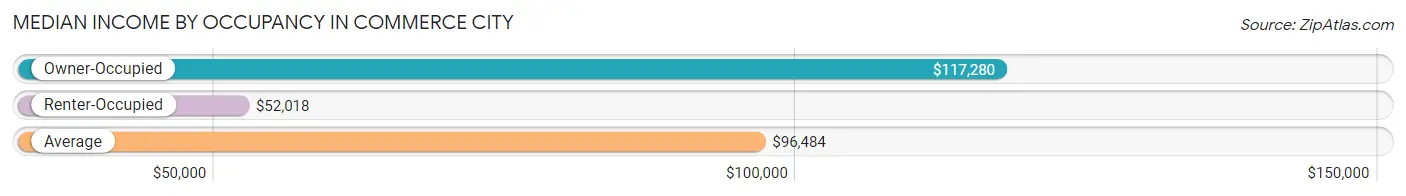
| Occupancy Type | # Households | Median Income |
| Owner-Occupied | 15,854 (76.9%) | $117,280 |
| Renter-Occupied | 4,748 (23.1%) | $52,018 |
| Average | 20,602 (100.0%) | $96,484 |
Occupancy by Householder Income Bracket in Commerce City
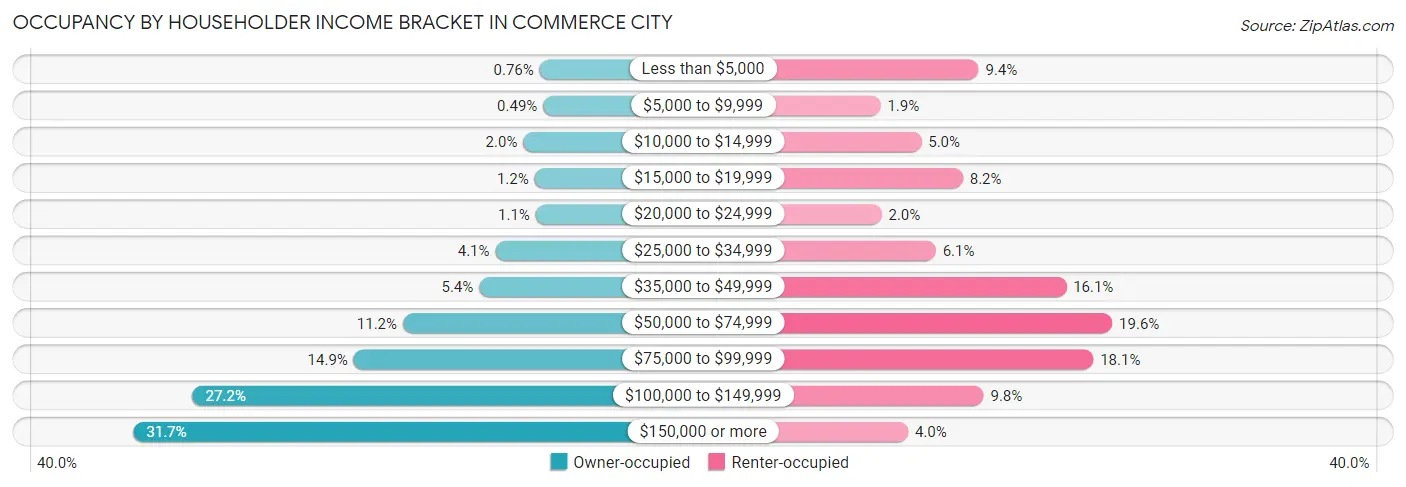
| Income Bracket | Owner-occupied | Renter-occupied |
| Less than $5,000 | 121 (0.8%) | 445 (9.4%) |
| $5,000 to $9,999 | 77 (0.5%) | 90 (1.9%) |
| $10,000 to $14,999 | 319 (2.0%) | 238 (5.0%) |
| $15,000 to $19,999 | 183 (1.1%) | 388 (8.2%) |
| $20,000 to $24,999 | 168 (1.1%) | 94 (2.0%) |
| $25,000 to $34,999 | 655 (4.1%) | 290 (6.1%) |
| $35,000 to $49,999 | 851 (5.4%) | 762 (16.1%) |
| $50,000 to $74,999 | 1,773 (11.2%) | 928 (19.6%) |
| $75,000 to $99,999 | 2,367 (14.9%) | 860 (18.1%) |
| $100,000 to $149,999 | 4,312 (27.2%) | 463 (9.8%) |
| $150,000 or more | 5,028 (31.7%) | 190 (4.0%) |
| Total | 15,854 (100.0%) | 4,748 (100.0%) |
Monthly Housing Cost Tiers in Commerce City
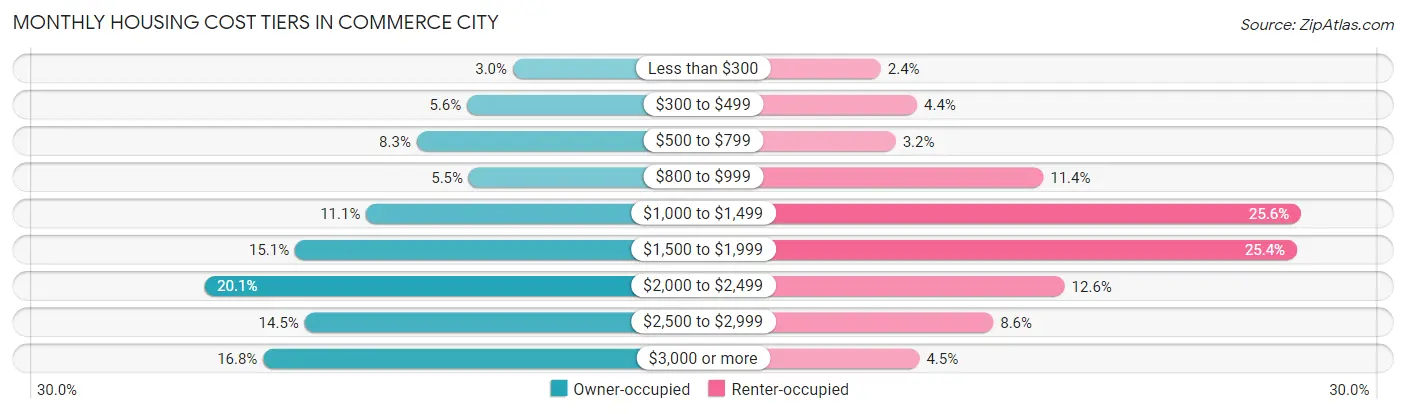
| Monthly Cost | Owner-occupied | Renter-occupied |
| Less than $300 | 481 (3.0%) | 114 (2.4%) |
| $300 to $499 | 882 (5.6%) | 209 (4.4%) |
| $500 to $799 | 1,322 (8.3%) | 153 (3.2%) |
| $800 to $999 | 865 (5.5%) | 540 (11.4%) |
| $1,000 to $1,499 | 1,765 (11.1%) | 1,216 (25.6%) |
| $1,500 to $1,999 | 2,387 (15.1%) | 1,205 (25.4%) |
| $2,000 to $2,499 | 3,183 (20.1%) | 596 (12.6%) |
| $2,500 to $2,999 | 2,303 (14.5%) | 409 (8.6%) |
| $3,000 or more | 2,666 (16.8%) | 215 (4.5%) |
| Total | 15,854 (100.0%) | 4,748 (100.0%) |
Physical Housing Characteristics in Commerce City
Housing Structures in Commerce City
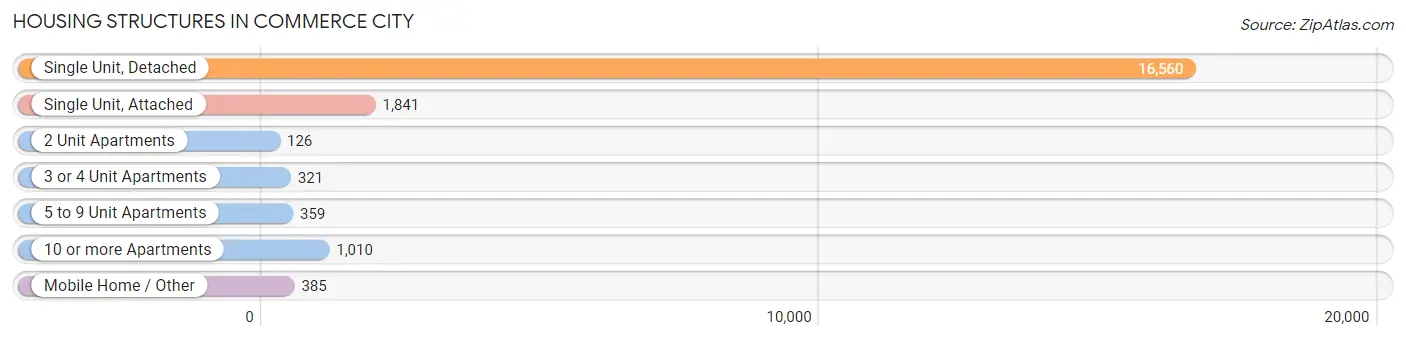
| Structure Type | # Housing Units | % Housing Units |
| Single Unit, Detached | 16,560 | 80.4% |
| Single Unit, Attached | 1,841 | 8.9% |
| 2 Unit Apartments | 126 | 0.6% |
| 3 or 4 Unit Apartments | 321 | 1.6% |
| 5 to 9 Unit Apartments | 359 | 1.7% |
| 10 or more Apartments | 1,010 | 4.9% |
| Mobile Home / Other | 385 | 1.9% |
| Total | 20,602 | 100.0% |
Housing Structures by Occupancy in Commerce City
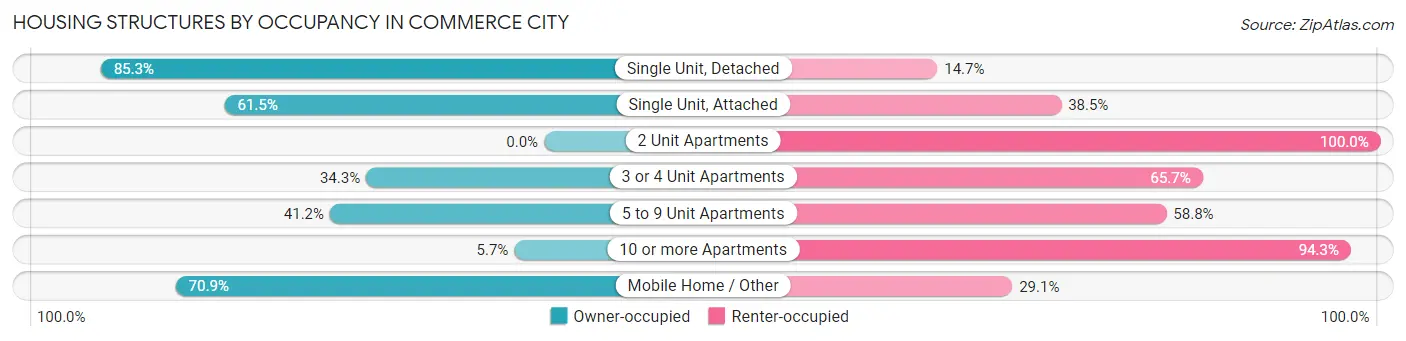
| Structure Type | Owner-occupied | Renter-occupied |
| Single Unit, Detached | 14,133 (85.3%) | 2,427 (14.7%) |
| Single Unit, Attached | 1,132 (61.5%) | 709 (38.5%) |
| 2 Unit Apartments | 0 (0.0%) | 126 (100.0%) |
| 3 or 4 Unit Apartments | 110 (34.3%) | 211 (65.7%) |
| 5 to 9 Unit Apartments | 148 (41.2%) | 211 (58.8%) |
| 10 or more Apartments | 58 (5.7%) | 952 (94.3%) |
| Mobile Home / Other | 273 (70.9%) | 112 (29.1%) |
| Total | 15,854 (76.9%) | 4,748 (23.1%) |
Housing Structures by Number of Rooms in Commerce City
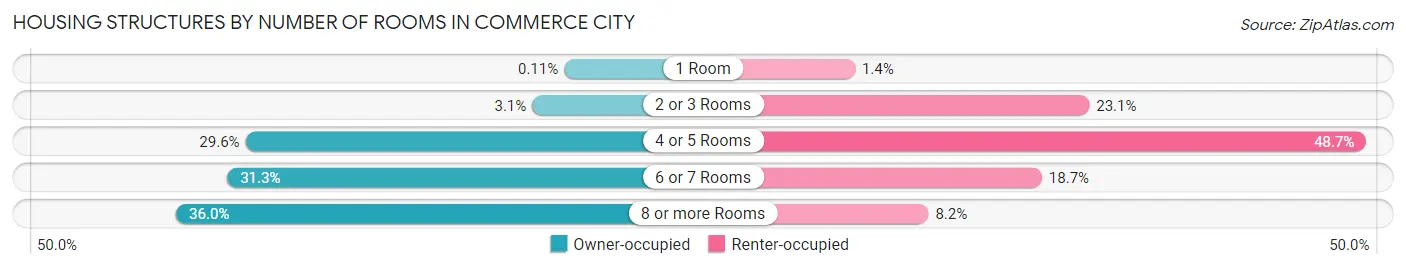
| Number of Rooms | Owner-occupied | Renter-occupied |
| 1 Room | 18 (0.1%) | 66 (1.4%) |
| 2 or 3 Rooms | 485 (3.1%) | 1,095 (23.1%) |
| 4 or 5 Rooms | 4,690 (29.6%) | 2,311 (48.7%) |
| 6 or 7 Rooms | 4,956 (31.3%) | 887 (18.7%) |
| 8 or more Rooms | 5,705 (36.0%) | 389 (8.2%) |
| Total | 15,854 (100.0%) | 4,748 (100.0%) |
Housing Structure by Heating Type in Commerce City
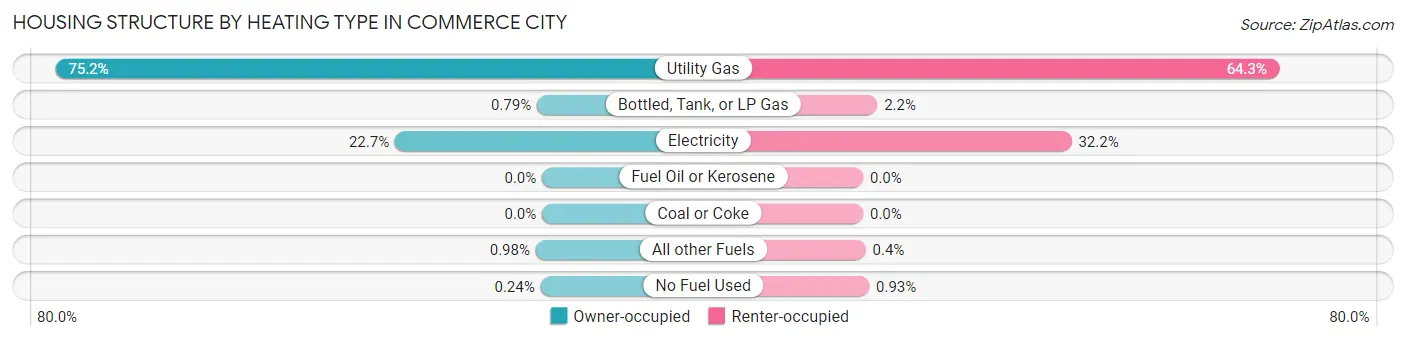
| Heating Type | Owner-occupied | Renter-occupied |
| Utility Gas | 11,929 (75.2%) | 3,051 (64.3%) |
| Bottled, Tank, or LP Gas | 126 (0.8%) | 104 (2.2%) |
| Electricity | 3,605 (22.7%) | 1,530 (32.2%) |
| Fuel Oil or Kerosene | 0 (0.0%) | 0 (0.0%) |
| Coal or Coke | 0 (0.0%) | 0 (0.0%) |
| All other Fuels | 156 (1.0%) | 19 (0.4%) |
| No Fuel Used | 38 (0.2%) | 44 (0.9%) |
| Total | 15,854 (100.0%) | 4,748 (100.0%) |
Household Vehicle Usage in Commerce City
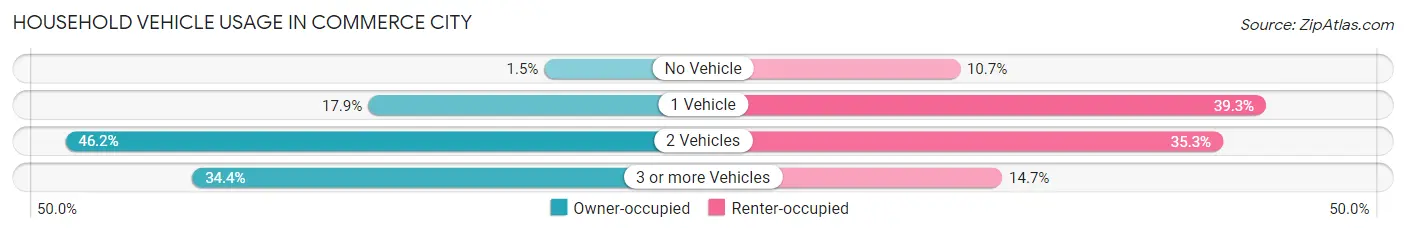
| Vehicles per Household | Owner-occupied | Renter-occupied |
| No Vehicle | 238 (1.5%) | 510 (10.7%) |
| 1 Vehicle | 2,845 (17.9%) | 1,866 (39.3%) |
| 2 Vehicles | 7,325 (46.2%) | 1,675 (35.3%) |
| 3 or more Vehicles | 5,446 (34.4%) | 697 (14.7%) |
| Total | 15,854 (100.0%) | 4,748 (100.0%) |
Real Estate & Mortgages in Commerce City
Real Estate and Mortgage Overview in Commerce City
| Characteristic | Without Mortgage | With Mortgage |
| Housing Units | 3,458 | 12,396 |
| Median Property Value | $387,400 | $446,500 |
| Median Household Income | $79,438 | $4,245 |
| Monthly Housing Costs | $565 | $2,648 |
| Real Estate Taxes | $1,929 | $264 |
Property Value by Mortgage Status in Commerce City
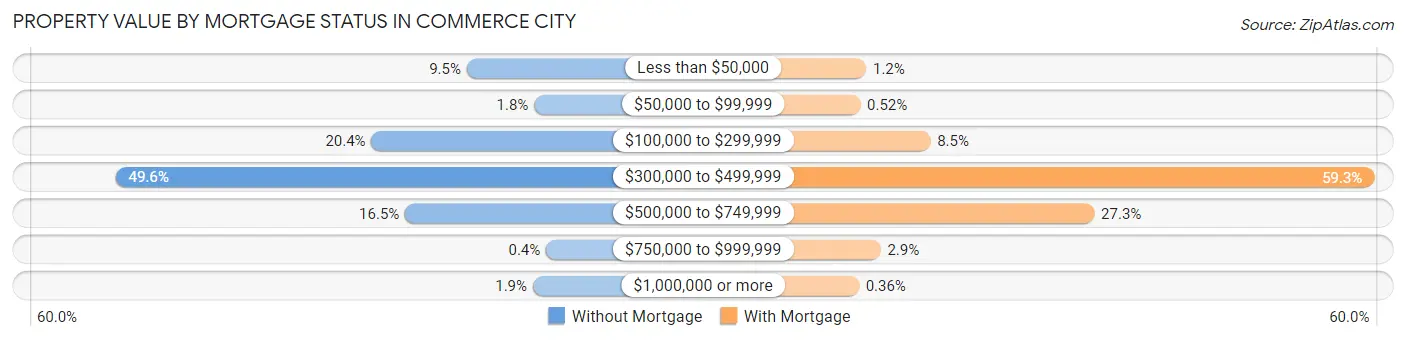
| Property Value | Without Mortgage | With Mortgage |
| Less than $50,000 | 327 (9.5%) | 149 (1.2%) |
| $50,000 to $99,999 | 61 (1.8%) | 64 (0.5%) |
| $100,000 to $299,999 | 704 (20.4%) | 1,057 (8.5%) |
| $300,000 to $499,999 | 1,715 (49.6%) | 7,347 (59.3%) |
| $500,000 to $749,999 | 571 (16.5%) | 3,381 (27.3%) |
| $750,000 to $999,999 | 14 (0.4%) | 353 (2.9%) |
| $1,000,000 or more | 66 (1.9%) | 45 (0.4%) |
| Total | 3,458 (100.0%) | 12,396 (100.0%) |
Household Income by Mortgage Status in Commerce City
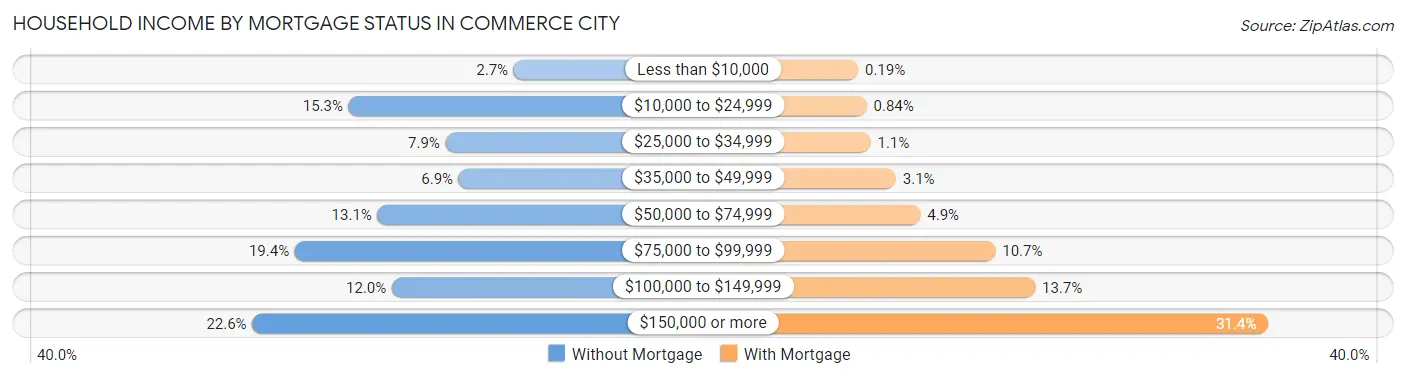
| Household Income | Without Mortgage | With Mortgage |
| Less than $10,000 | 94 (2.7%) | 23 (0.2%) |
| $10,000 to $24,999 | 529 (15.3%) | 104 (0.8%) |
| $25,000 to $34,999 | 274 (7.9%) | 141 (1.1%) |
| $35,000 to $49,999 | 239 (6.9%) | 381 (3.1%) |
| $50,000 to $74,999 | 453 (13.1%) | 612 (4.9%) |
| $75,000 to $99,999 | 671 (19.4%) | 1,320 (10.6%) |
| $100,000 to $149,999 | 415 (12.0%) | 1,696 (13.7%) |
| $150,000 or more | 783 (22.6%) | 3,897 (31.4%) |
| Total | 3,458 (100.0%) | 12,396 (100.0%) |
Property Value to Household Income Ratio in Commerce City
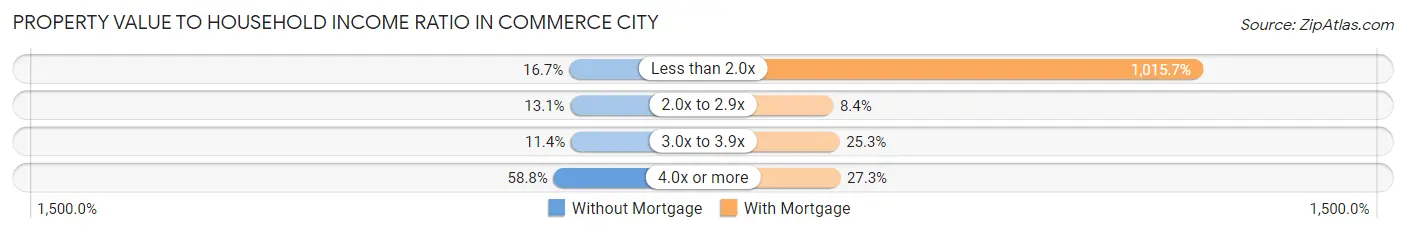
| Value-to-Income Ratio | Without Mortgage | With Mortgage |
| Less than 2.0x | 578 (16.7%) | 125,905 (1,015.7%) |
| 2.0x to 2.9x | 453 (13.1%) | 1,040 (8.4%) |
| 3.0x to 3.9x | 393 (11.4%) | 3,139 (25.3%) |
| 4.0x or more | 2,034 (58.8%) | 3,388 (27.3%) |
| Total | 3,458 (100.0%) | 12,396 (100.0%) |
Real Estate Taxes by Mortgage Status in Commerce City
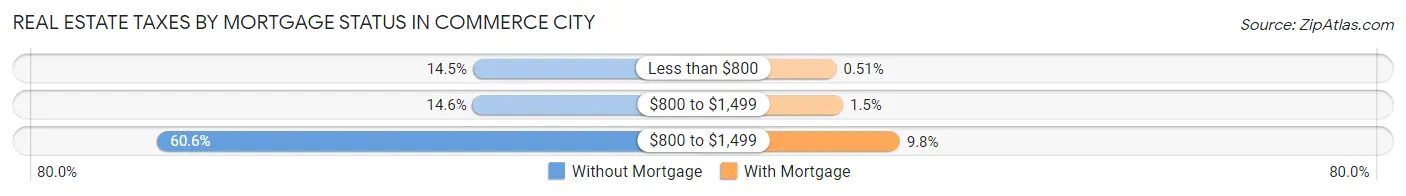
| Property Taxes | Without Mortgage | With Mortgage |
| Less than $800 | 502 (14.5%) | 63 (0.5%) |
| $800 to $1,499 | 503 (14.5%) | 182 (1.5%) |
| $800 to $1,499 | 2,096 (60.6%) | 1,208 (9.8%) |
| Total | 3,458 (100.0%) | 12,396 (100.0%) |
Health & Disability in Commerce City
Health Insurance Coverage by Age in Commerce City
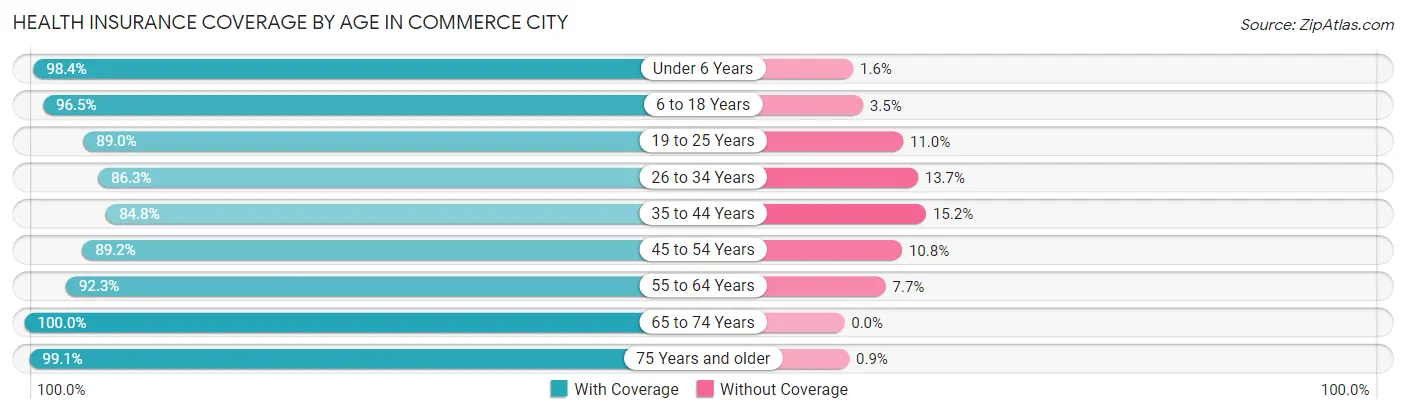
| Age Bracket | With Coverage | Without Coverage |
| Under 6 Years | 5,564 (98.4%) | 93 (1.6%) |
| 6 to 18 Years | 14,180 (96.5%) | 509 (3.5%) |
| 19 to 25 Years | 3,706 (89.0%) | 456 (11.0%) |
| 26 to 34 Years | 6,935 (86.3%) | 1,102 (13.7%) |
| 35 to 44 Years | 8,730 (84.8%) | 1,568 (15.2%) |
| 45 to 54 Years | 7,603 (89.2%) | 917 (10.8%) |
| 55 to 64 Years | 5,937 (92.3%) | 496 (7.7%) |
| 65 to 74 Years | 3,137 (100.0%) | 0 (0.0%) |
| 75 Years and older | 1,657 (99.1%) | 15 (0.9%) |
| Total | 57,449 (91.8%) | 5,156 (8.2%) |
Health Insurance Coverage by Citizenship Status in Commerce City
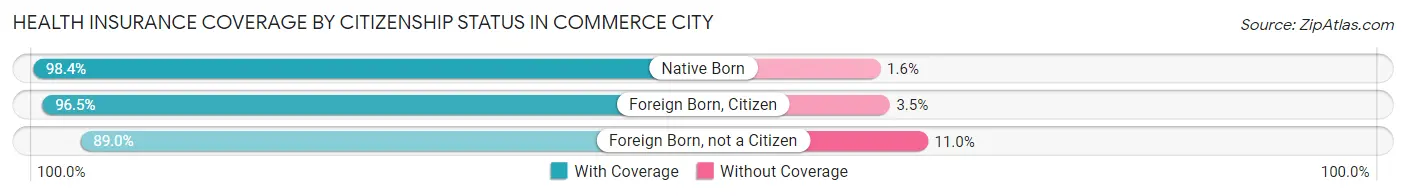
| Citizenship Status | With Coverage | Without Coverage |
| Native Born | 5,564 (98.4%) | 93 (1.6%) |
| Foreign Born, Citizen | 14,180 (96.5%) | 509 (3.5%) |
| Foreign Born, not a Citizen | 3,706 (89.0%) | 456 (11.0%) |
Health Insurance Coverage by Household Income in Commerce City
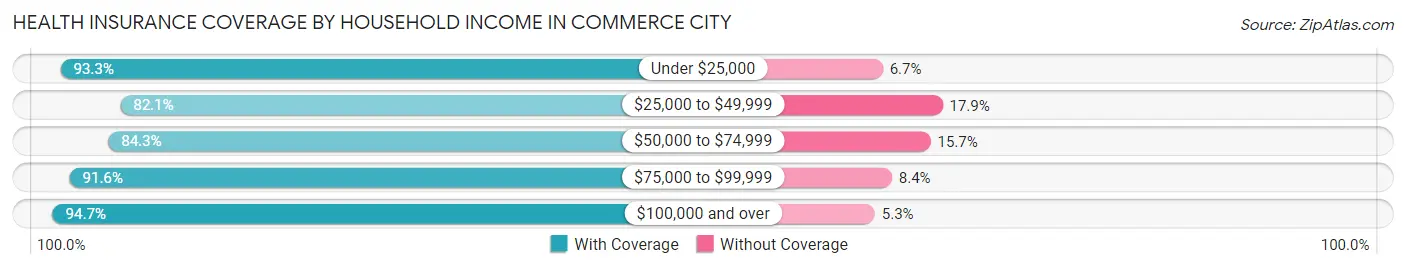
| Household Income | With Coverage | Without Coverage |
| Under $25,000 | 5,374 (93.3%) | 388 (6.7%) |
| $25,000 to $49,999 | 5,078 (82.1%) | 1,110 (17.9%) |
| $50,000 to $74,999 | 5,818 (84.3%) | 1,083 (15.7%) |
| $75,000 to $99,999 | 8,200 (91.6%) | 756 (8.4%) |
| $100,000 and over | 32,753 (94.7%) | 1,819 (5.3%) |
Public vs Private Health Insurance Coverage by Age in Commerce City
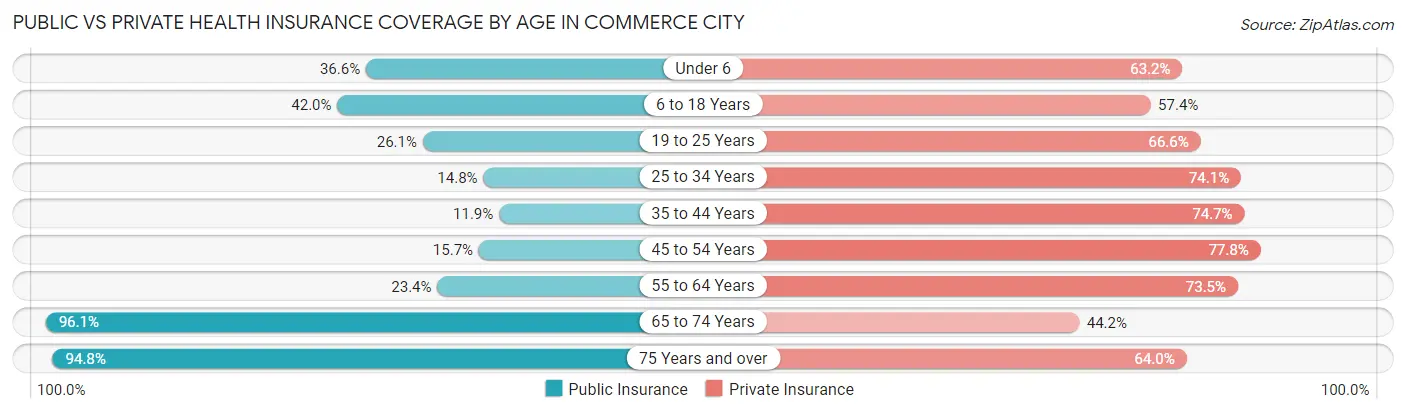
| Age Bracket | Public Insurance | Private Insurance |
| Under 6 | 2,072 (36.6%) | 3,576 (63.2%) |
| 6 to 18 Years | 6,162 (41.9%) | 8,435 (57.4%) |
| 19 to 25 Years | 1,086 (26.1%) | 2,771 (66.6%) |
| 25 to 34 Years | 1,193 (14.8%) | 5,955 (74.1%) |
| 35 to 44 Years | 1,228 (11.9%) | 7,696 (74.7%) |
| 45 to 54 Years | 1,335 (15.7%) | 6,624 (77.7%) |
| 55 to 64 Years | 1,504 (23.4%) | 4,729 (73.5%) |
| 65 to 74 Years | 3,014 (96.1%) | 1,386 (44.2%) |
| 75 Years and over | 1,585 (94.8%) | 1,070 (64.0%) |
| Total | 19,179 (30.6%) | 42,242 (67.5%) |
Disability Status by Sex by Age in Commerce City
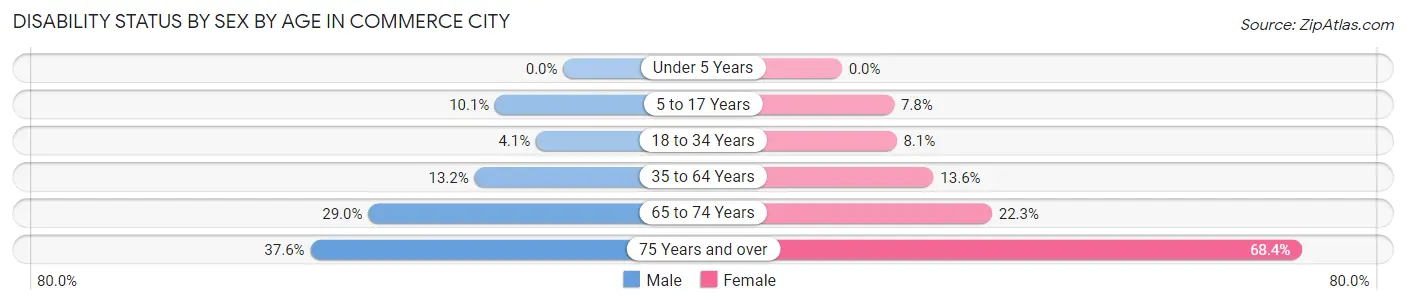
| Age Bracket | Male | Female |
| Under 5 Years | 0 (0.0%) | 0 (0.0%) |
| 5 to 17 Years | 761 (10.1%) | 552 (7.7%) |
| 18 to 34 Years | 245 (4.1%) | 565 (8.1%) |
| 35 to 64 Years | 1,753 (13.2%) | 1,627 (13.6%) |
| 65 to 74 Years | 452 (29.0%) | 351 (22.3%) |
| 75 Years and over | 222 (37.6%) | 739 (68.4%) |
Disability Class by Sex by Age in Commerce City
Disability Class: Hearing Difficulty
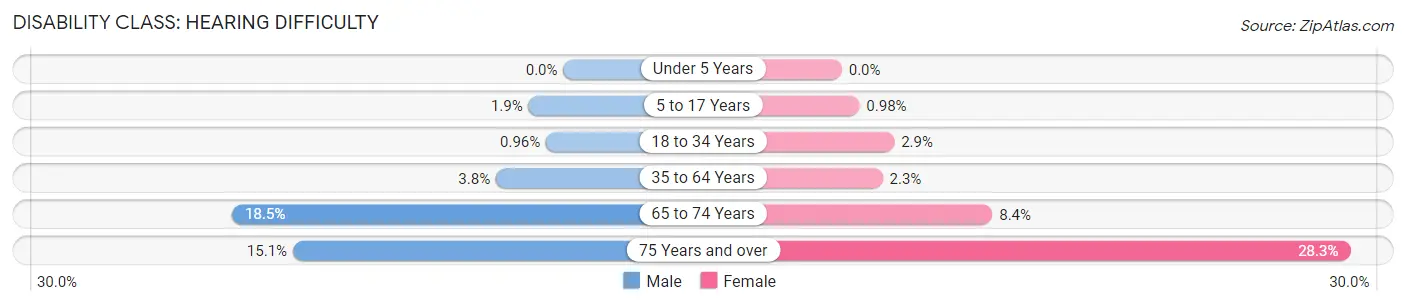
| Age Bracket | Male | Female |
| Under 5 Years | 0 (0.0%) | 0 (0.0%) |
| 5 to 17 Years | 146 (1.9%) | 70 (1.0%) |
| 18 to 34 Years | 58 (1.0%) | 203 (2.9%) |
| 35 to 64 Years | 498 (3.7%) | 272 (2.3%) |
| 65 to 74 Years | 288 (18.4%) | 132 (8.4%) |
| 75 Years and over | 89 (15.1%) | 306 (28.3%) |
Disability Class: Vision Difficulty
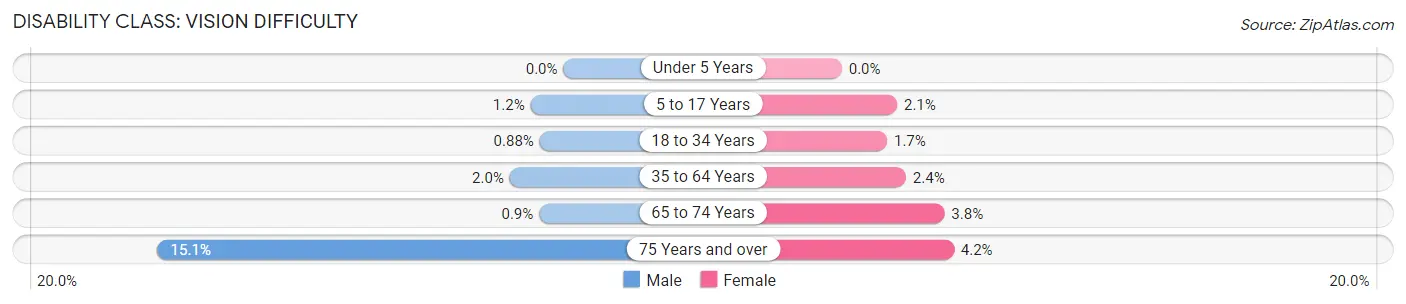
| Age Bracket | Male | Female |
| Under 5 Years | 0 (0.0%) | 0 (0.0%) |
| 5 to 17 Years | 92 (1.2%) | 146 (2.1%) |
| 18 to 34 Years | 53 (0.9%) | 117 (1.7%) |
| 35 to 64 Years | 265 (2.0%) | 285 (2.4%) |
| 65 to 74 Years | 14 (0.9%) | 60 (3.8%) |
| 75 Years and over | 89 (15.1%) | 45 (4.2%) |
Disability Class: Cognitive Difficulty
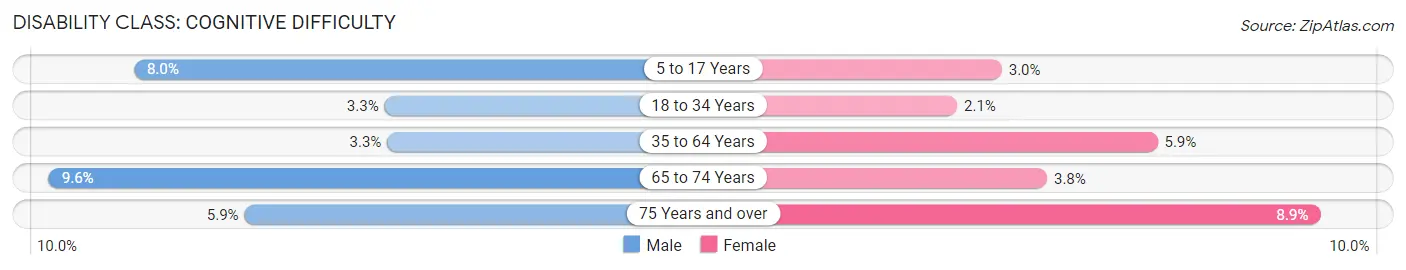
| Age Bracket | Male | Female |
| 5 to 17 Years | 599 (8.0%) | 212 (3.0%) |
| 18 to 34 Years | 201 (3.3%) | 149 (2.1%) |
| 35 to 64 Years | 434 (3.3%) | 701 (5.9%) |
| 65 to 74 Years | 149 (9.6%) | 60 (3.8%) |
| 75 Years and over | 35 (5.9%) | 96 (8.9%) |
Disability Class: Ambulatory Difficulty
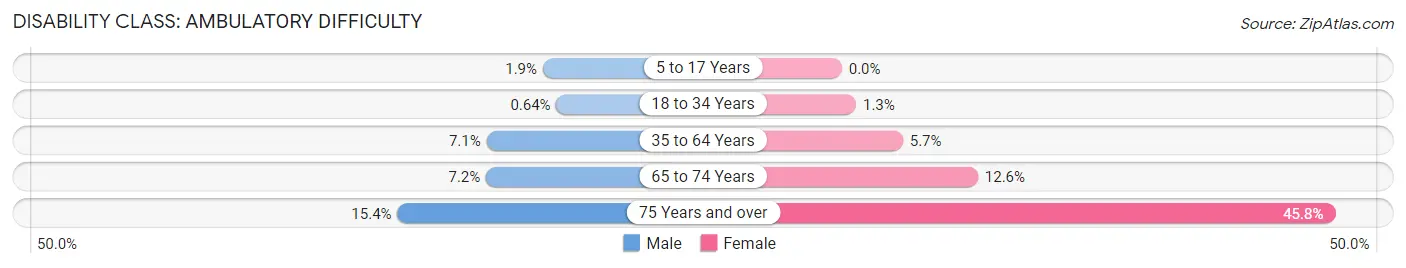
| Age Bracket | Male | Female |
| 5 to 17 Years | 143 (1.9%) | 0 (0.0%) |
| 18 to 34 Years | 39 (0.6%) | 92 (1.3%) |
| 35 to 64 Years | 948 (7.1%) | 677 (5.7%) |
| 65 to 74 Years | 112 (7.2%) | 199 (12.6%) |
| 75 Years and over | 91 (15.4%) | 495 (45.8%) |
Disability Class: Self-Care Difficulty
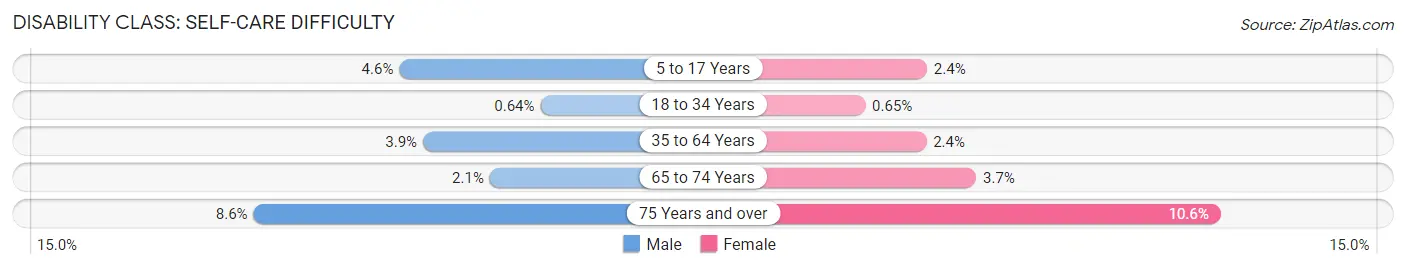
| Age Bracket | Male | Female |
| 5 to 17 Years | 344 (4.6%) | 169 (2.4%) |
| 18 to 34 Years | 39 (0.6%) | 45 (0.6%) |
| 35 to 64 Years | 519 (3.9%) | 281 (2.4%) |
| 65 to 74 Years | 32 (2.1%) | 59 (3.7%) |
| 75 Years and over | 51 (8.6%) | 114 (10.5%) |
Technology Access in Commerce City
Computing Device Access in Commerce City
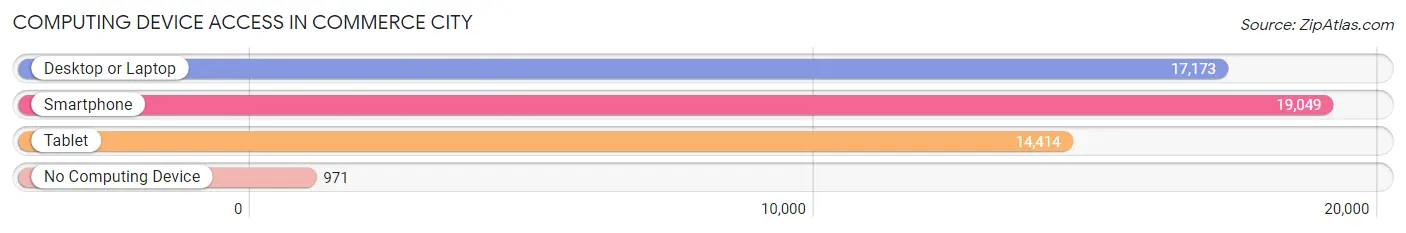
| Device Type | # Households | % Households |
| Desktop or Laptop | 17,173 | 83.4% |
| Smartphone | 19,049 | 92.5% |
| Tablet | 14,414 | 70.0% |
| No Computing Device | 971 | 4.7% |
| Total | 20,602 | 100.0% |
Internet Access in Commerce City
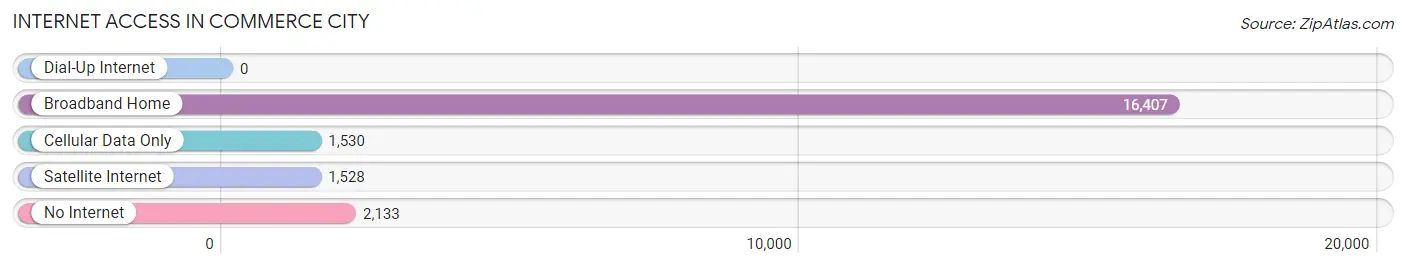
| Internet Type | # Households | % Households |
| Dial-Up Internet | 0 | 0.0% |
| Broadband Home | 16,407 | 79.6% |
| Cellular Data Only | 1,530 | 7.4% |
| Satellite Internet | 1,528 | 7.4% |
| No Internet | 2,133 | 10.3% |
| Total | 20,602 | 100.0% |
Commerce City Summary
City of Commerce City Colorado
Commerce City, Colorado is a city located in Adams County, Colorado, United States. It is a suburb of Denver and part of the Denver-Aurora-Lakewood Metropolitan Statistical Area. As of the 2010 census, the population of Commerce City was 45,913.
History
Commerce City was founded in the late 19th century as a trading post for settlers in the area. The city was originally known as Derby, but was renamed in 1952 to reflect its location at the intersection of two major highways, U.S. Route 85 and U.S. Route 50.
The city was incorporated in 1952 and has since grown to become one of the largest cities in Adams County. The city is home to the Rocky Mountain Arsenal National Wildlife Refuge, a 15,000-acre wildlife refuge that is home to a variety of wildlife, including bison, deer, coyotes, and bald eagles.
Geography
Commerce City is located in Adams County, Colorado, at 39°48'N 104°53'W (39.80, -104.88). It is situated at the intersection of U.S. Route 85 and U.S. Route 50, approximately 15 miles northeast of downtown Denver.
The city has a total area of 24.2 square miles, of which 24.1 square miles is land and 0.1 square miles is water.
Economy
Commerce City is home to a variety of businesses and industries, including oil and gas, manufacturing, retail, and healthcare. The city is also home to the Rocky Mountain Arsenal National Wildlife Refuge, which is a 15,000-acre wildlife refuge that is home to a variety of wildlife, including bison, deer, coyotes, and bald eagles.
The city is also home to the Denver Broncos' training facility, which is located in the city's Dick's Sporting Goods Park.
Demographics
As of the 2010 census, there were 45,913 people, 16,845 households, and 11,945 families residing in the city. The population density was 1,902.3 people per square mile. The racial makeup of the city was 68.2% White, 8.3% African American, 0.9% Native American, 2.2% Asian, 0.1% Pacific Islander, 16.3% from other races, and 4.0% from two or more races. Hispanic or Latino of any race were 37.2% of the population.
The median income for a household in the city was $50,945, and the median income for a family was $60,945. The per capita income for the city was $23,945. About 11.2% of families and 14.3% of the population were below the poverty line, including 19.2% of those under age 18 and 8.2% of those age 65 or over.
Conclusion
Commerce City, Colorado is a city located in Adams County, Colorado, United States. It is a suburb of Denver and part of the Denver-Aurora-Lakewood Metropolitan Statistical Area. As of the 2010 census, the population of Commerce City was 45,913. The city was founded in the late 19th century as a trading post for settlers in the area and was originally known as Derby. It was renamed in 1952 to reflect its location at the intersection of two major highways, U.S. Route 85 and U.S. Route 50. The city is home to a variety of businesses and industries, including oil and gas, manufacturing, retail, and healthcare. It is also home to the Rocky Mountain Arsenal National Wildlife Refuge, which is a 15,000-acre wildlife refuge that is home to a variety of wildlife, including bison, deer, coyotes, and bald eagles. As of the 2010 census, the population of Commerce City was 45,913, with a median household income of $50,945 and a median family income of $60,945. The city is also home to the Denver Broncos' training facility, which is located in the city's Dick's Sporting Goods Park.
Common Questions
What is Per Capita Income in Commerce City?
Per Capita income in Commerce City is $37,932.
What is the Median Family Income in Commerce City?
Median Family Income in Commerce City is $111,200.
What is the Median Household income in Commerce City?
Median Household Income in Commerce City is $96,484.
What is Income or Wage Gap in Commerce City?
Income or Wage Gap in Commerce City is 27.4%.
Women in Commerce City earn 72.6 cents for every dollar earned by a man.
What is Family Income Deficit in Commerce City?
Family Income Deficit in Commerce City is $16,649.
Families that are below poverty line in Commerce City earn $16,649 less on average than the poverty threshold level.
What is Inequality or Gini Index in Commerce City?
Inequality or Gini Index in Commerce City is 0.39.
What is the Total Population of Commerce City?
Total Population of Commerce City is 63,050.
What is the Total Male Population of Commerce City?
Total Male Population of Commerce City is 31,657.
What is the Total Female Population of Commerce City?
Total Female Population of Commerce City is 31,393.
What is the Ratio of Males per 100 Females in Commerce City?
There are 100.84 Males per 100 Females in Commerce City.
What is the Ratio of Females per 100 Males in Commerce City?
There are 99.17 Females per 100 Males in Commerce City.
What is the Median Population Age in Commerce City?
Median Population Age in Commerce City is 33.5 Years.
What is the Average Family Size in Commerce City
Average Family Size in Commerce City is 3.5 People.
What is the Average Household Size in Commerce City
Average Household Size in Commerce City is 3.0 People.
How Large is the Labor Force in Commerce City?
There are 33,969 People in the Labor Forcein in Commerce City.
What is the Percentage of People in the Labor Force in Commerce City?
73.5% of People are in the Labor Force in Commerce City.
What is the Unemployment Rate in Commerce City?
Unemployment Rate in Commerce City is 4.6%.