Collbran, CO Map & Demographics
Collbran Map
Collbran Overview
$18,194
PER CAPITA INCOME
$83,036
AVG FAMILY INCOME
$43,750
AVG HOUSEHOLD INCOME
0.38
INEQUALITY / GINI INDEX
647
TOTAL POPULATION
387
MALE POPULATION
260
FEMALE POPULATION
148.85
MALES / 100 FEMALES
67.18
FEMALES / 100 MALES
24.1
MEDIAN AGE
2.7
AVG FAMILY SIZE
2.0
AVG HOUSEHOLD SIZE
239
LABOR FORCE [ PEOPLE ]
40.1%
PERCENT IN LABOR FORCE
36.4%
UNEMPLOYMENT RATE
Collbran Zip Codes
Collbran Area Codes
Income in Collbran
Income Overview in Collbran
Per Capita Income in Collbran is $18,194, while median incomes of families and households are $83,036 and $43,750 respectively.
| Characteristic | Number | Measure |
| Per Capita Income | 647 | $18,194 |
| Median Family Income | 79 | $83,036 |
| Mean Family Income | 79 | $70,065 |
| Median Household Income | 147 | $43,750 |
| Mean Household Income | 147 | $57,686 |
| Income Deficit | 79 | $0 |
| Wage / Income Gap (%) | 647 | 0.00% |
| Wage / Income Gap ($) | 647 | 100.00¢ per $1 |
| Gini / Inequality Index | 647 | 0.38 |
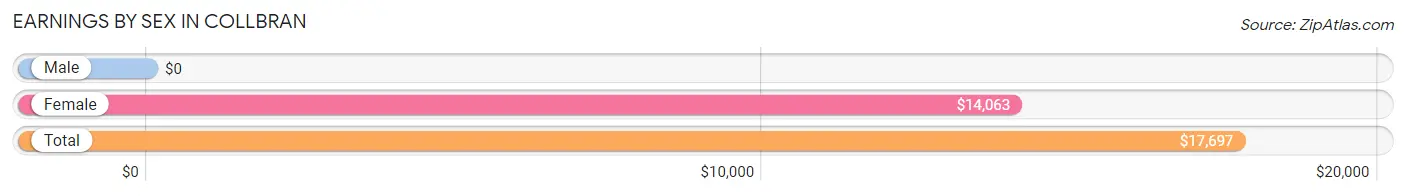
Earnings by Sex in Collbran
| Sex | Number | Average Earnings |
| Male | 221 (64.4%) | $0 |
| Female | 122 (35.6%) | $14,063 |
| Total | 343 (100.0%) | $17,697 |
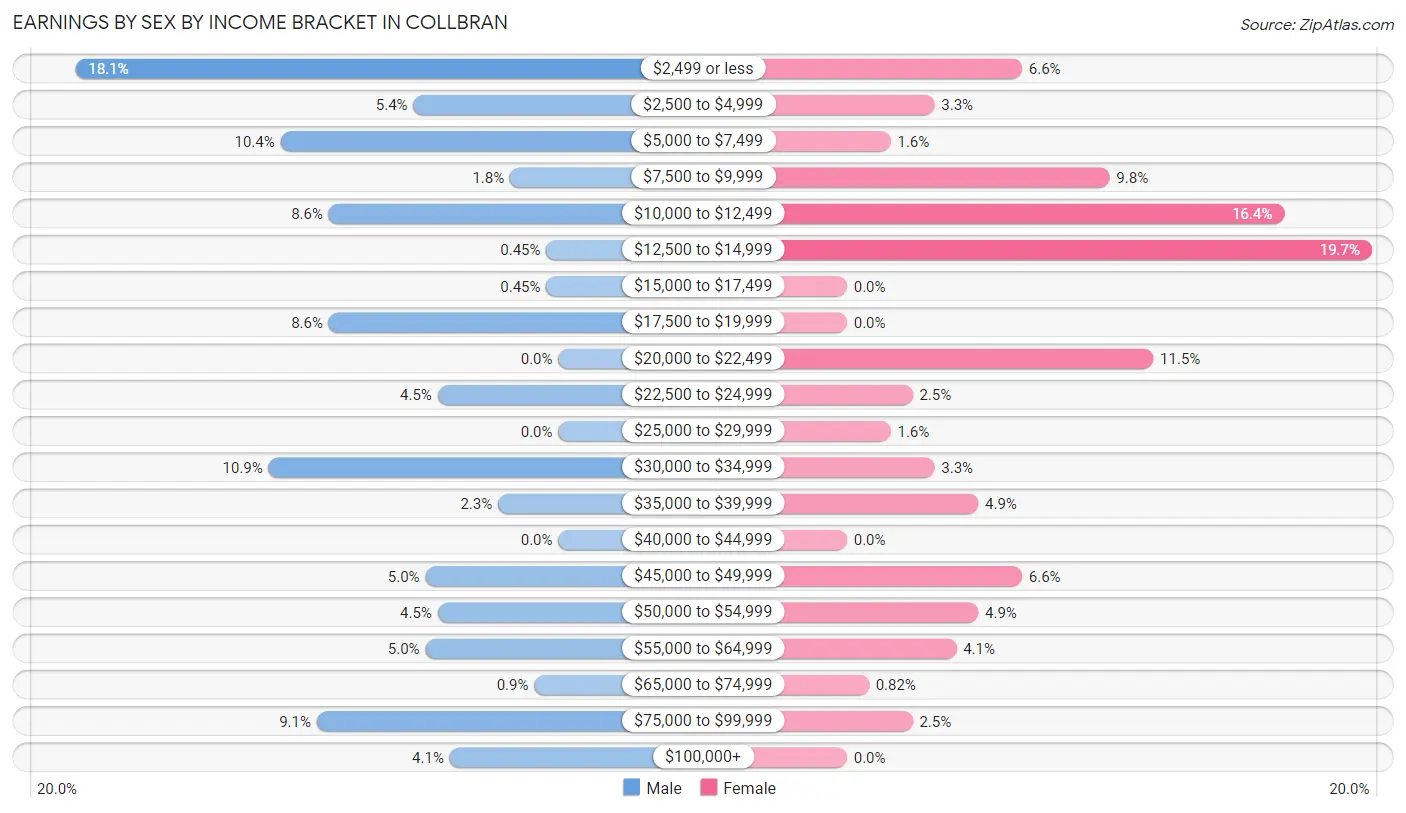
Earnings by Sex by Income Bracket in Collbran
The most common earnings brackets in Collbran are $2,499 or less for men (40 | 18.1%) and $12,500 to $14,999 for women (24 | 19.7%).
| Income | Male | Female |
| $2,499 or less | 40 (18.1%) | 8 (6.6%) |
| $2,500 to $4,999 | 12 (5.4%) | 4 (3.3%) |
| $5,000 to $7,499 | 23 (10.4%) | 2 (1.6%) |
| $7,500 to $9,999 | 4 (1.8%) | 12 (9.8%) |
| $10,000 to $12,499 | 19 (8.6%) | 20 (16.4%) |
| $12,500 to $14,999 | 1 (0.4%) | 24 (19.7%) |
| $15,000 to $17,499 | 1 (0.4%) | 0 (0.0%) |
| $17,500 to $19,999 | 19 (8.6%) | 0 (0.0%) |
| $20,000 to $22,499 | 0 (0.0%) | 14 (11.5%) |
| $22,500 to $24,999 | 10 (4.5%) | 3 (2.5%) |
| $25,000 to $29,999 | 0 (0.0%) | 2 (1.6%) |
| $30,000 to $34,999 | 24 (10.9%) | 4 (3.3%) |
| $35,000 to $39,999 | 5 (2.3%) | 6 (4.9%) |
| $40,000 to $44,999 | 0 (0.0%) | 0 (0.0%) |
| $45,000 to $49,999 | 11 (5.0%) | 8 (6.6%) |
| $50,000 to $54,999 | 10 (4.5%) | 6 (4.9%) |
| $55,000 to $64,999 | 11 (5.0%) | 5 (4.1%) |
| $65,000 to $74,999 | 2 (0.9%) | 1 (0.8%) |
| $75,000 to $99,999 | 20 (9.0%) | 3 (2.5%) |
| $100,000+ | 9 (4.1%) | 0 (0.0%) |
| Total | 221 (100.0%) | 122 (100.0%) |
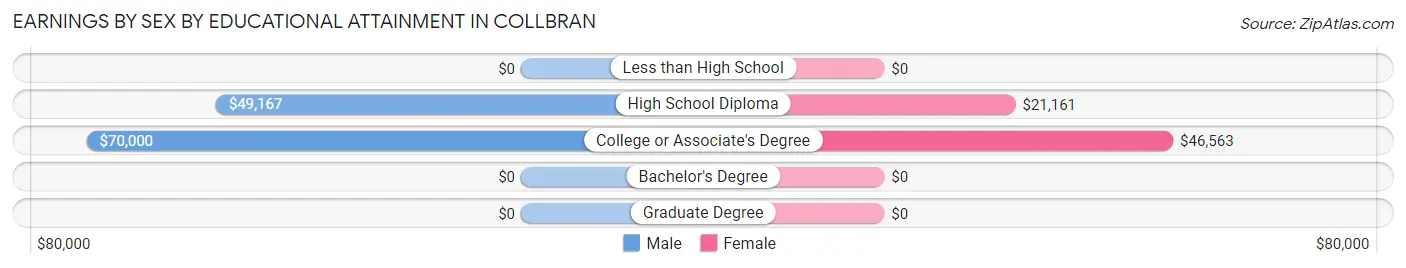
Earnings by Sex by Educational Attainment in Collbran
Average earnings in Collbran are $51,750 for men and $22,500 for women, a difference of 56.5%. Men with an educational attainment of college or associate's degree enjoy the highest average annual earnings of $70,000, while those with high school diploma education earn the least with $49,167. Women with an educational attainment of college or associate's degree earn the most with the average annual earnings of $46,563, while those with high school diploma education have the smallest earnings of $21,161.
| Educational Attainment | Male Income | Female Income |
| Less than High School | - | - |
| High School Diploma | $49,167 | $21,161 |
| College or Associate's Degree | $70,000 | $46,563 |
| Bachelor's Degree | - | - |
| Graduate Degree | - | - |
| Total | $51,750 | $22,500 |
Family Income in Collbran
Family Income Brackets in Collbran
According to the Collbran family income data, there are 25 families falling into the $100,000 to $149,999 income range, which is the most common income bracket and makes up 31.7% of all families.
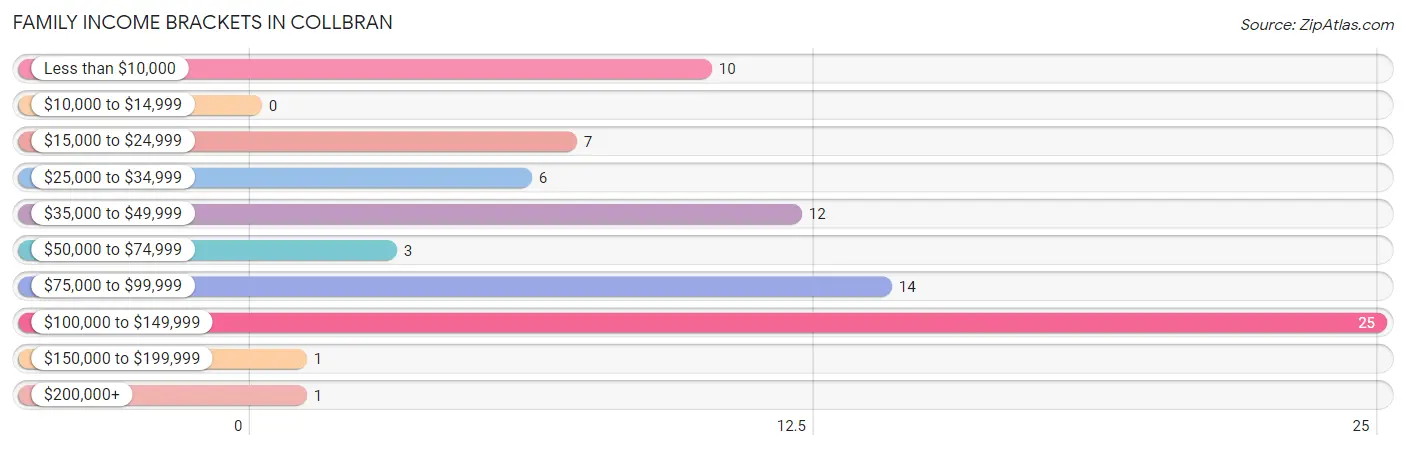
| Income Bracket | # Families | % Families |
| Less than $10,000 | 10 | 12.7% |
| $10,000 to $14,999 | 0 | 0.0% |
| $15,000 to $24,999 | 7 | 8.9% |
| $25,000 to $34,999 | 6 | 7.6% |
| $35,000 to $49,999 | 12 | 15.2% |
| $50,000 to $74,999 | 3 | 3.8% |
| $75,000 to $99,999 | 14 | 17.7% |
| $100,000 to $149,999 | 25 | 31.6% |
| $150,000 to $199,999 | 1 | 1.3% |
| $200,000+ | 1 | 1.3% |
Family Income by Famaliy Size in Collbran
5-person families (10 | 12.7%) account for the highest median family income in Collbran with $92,500 per family, while 2-person families (49 | 62.0%) have the highest median income of $23,125 per family member.
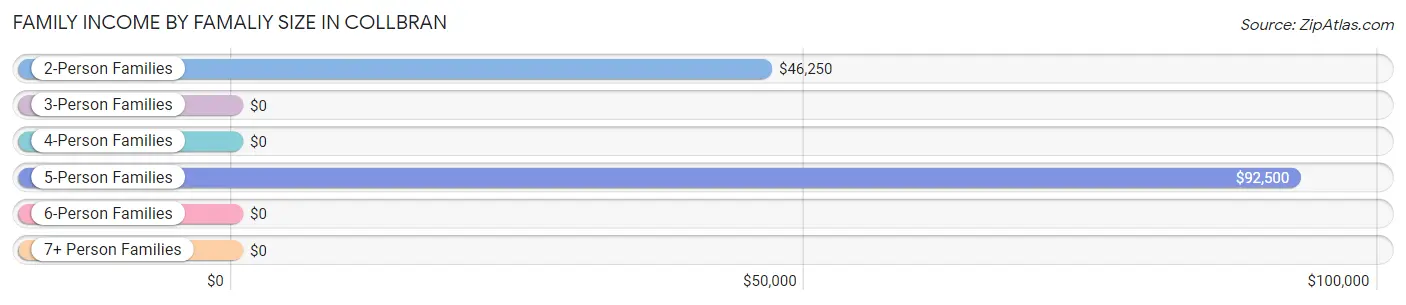
| Income Bracket | # Families | Median Income |
| 2-Person Families | 49 (62.0%) | $46,250 |
| 3-Person Families | 15 (19.0%) | $0 |
| 4-Person Families | 5 (6.3%) | $0 |
| 5-Person Families | 10 (12.7%) | $92,500 |
| 6-Person Families | 0 (0.0%) | $0 |
| 7+ Person Families | 0 (0.0%) | $0 |
| Total | 79 (100.0%) | $83,036 |
Family Income by Number of Earners in Collbran
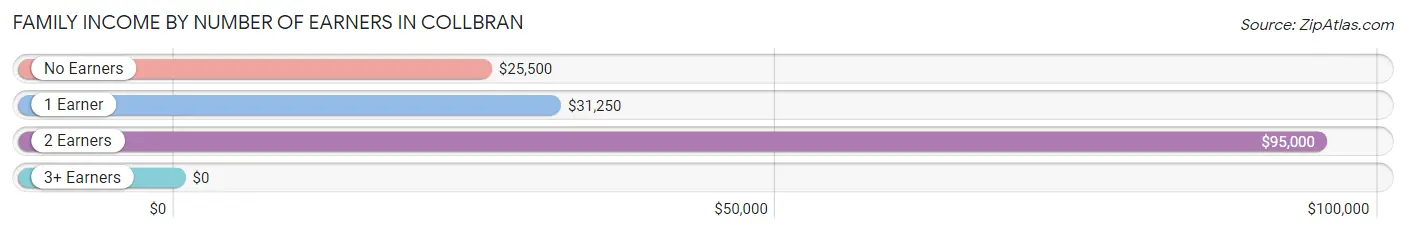
| Number of Earners | # Families | Median Income |
| No Earners | 22 (27.9%) | $25,500 |
| 1 Earner | 15 (19.0%) | $31,250 |
| 2 Earners | 36 (45.6%) | $95,000 |
| 3+ Earners | 6 (7.6%) | $0 |
| Total | 79 (100.0%) | $83,036 |
Household Income in Collbran
Household Income Brackets in Collbran
With 36 households falling in the category, the $35,000 to $49,999 income range is the most frequent in Collbran, accounting for 24.5% of all households.
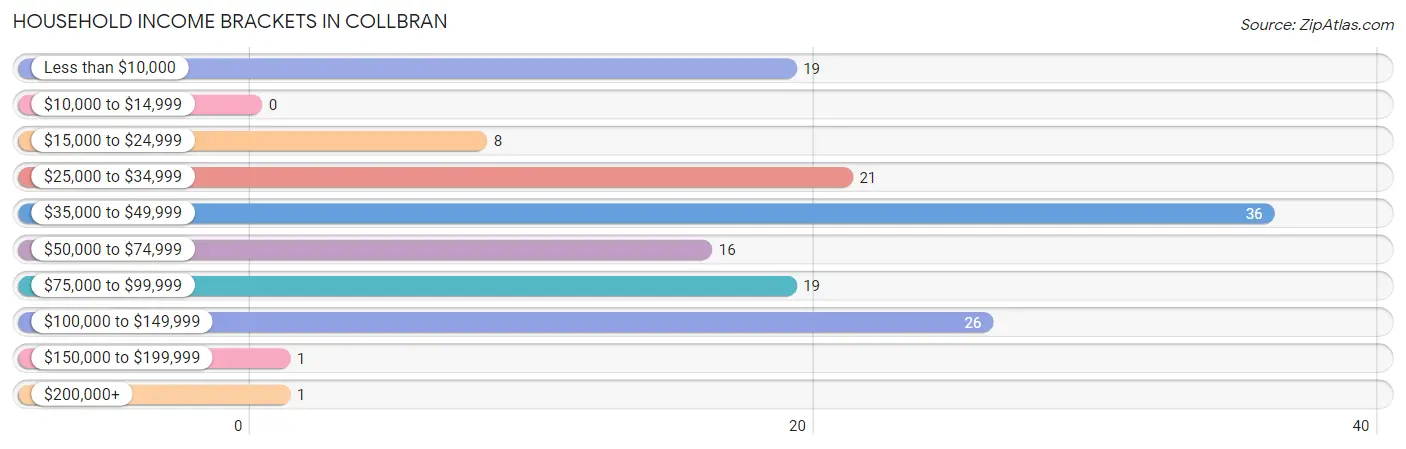
| Income Bracket | # Households | % Households |
| Less than $10,000 | 19 | 12.9% |
| $10,000 to $14,999 | 0 | 0.0% |
| $15,000 to $24,999 | 8 | 5.4% |
| $25,000 to $34,999 | 21 | 14.3% |
| $35,000 to $49,999 | 36 | 24.5% |
| $50,000 to $74,999 | 16 | 10.9% |
| $75,000 to $99,999 | 19 | 12.9% |
| $100,000 to $149,999 | 26 | 17.7% |
| $150,000 to $199,999 | 1 | 0.7% |
| $200,000+ | 1 | 0.7% |
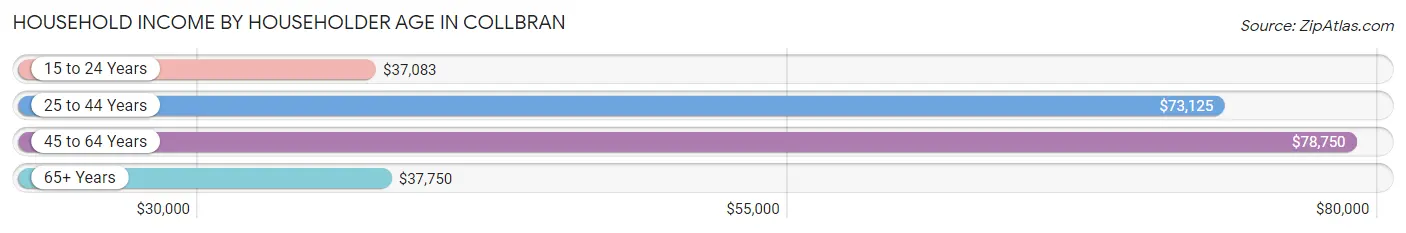
Household Income by Householder Age in Collbran
The median household income in Collbran is $43,750, with the highest median household income of $78,750 found in the 45 to 64 years age bracket for the primary householder. A total of 58 households (39.5%) fall into this category. Meanwhile, the 15 to 24 years age bracket for the primary householder has the lowest median household income of $37,083, with 7 households (4.8%) in this group.
| Income Bracket | # Households | Median Income |
| 15 to 24 Years | 7 (4.8%) | $37,083 |
| 25 to 44 Years | 29 (19.7%) | $73,125 |
| 45 to 64 Years | 58 (39.5%) | $78,750 |
| 65+ Years | 53 (36.0%) | $37,750 |
| Total | 147 (100.0%) | $43,750 |
Poverty in Collbran
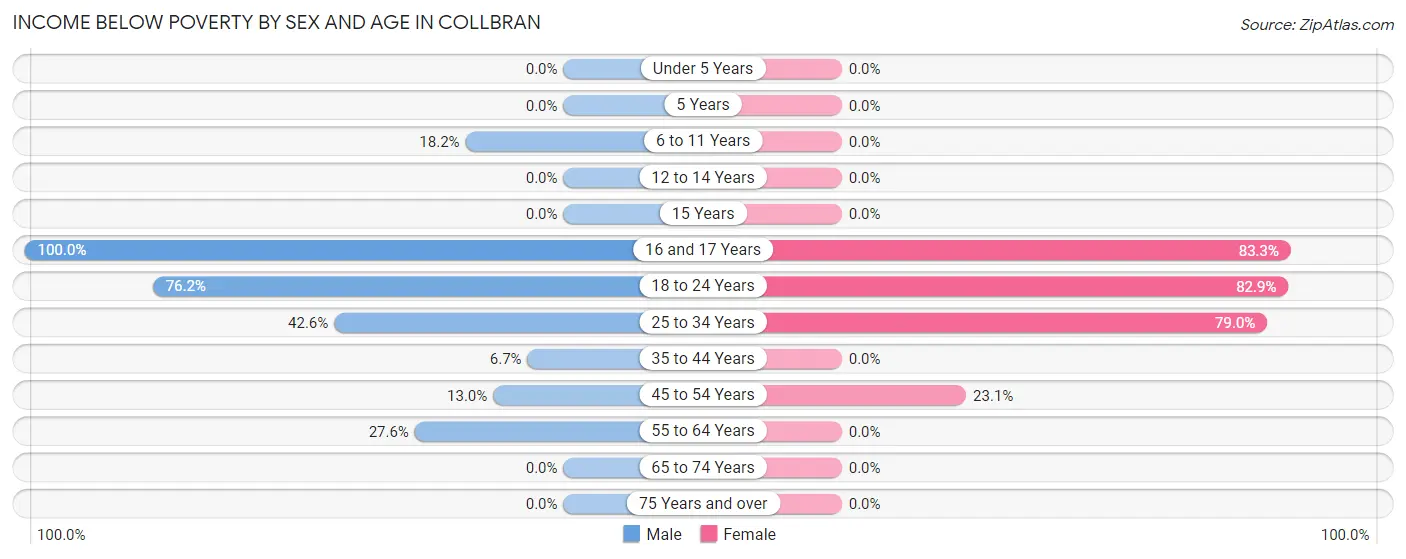
Income Below Poverty by Sex and Age in Collbran
With 51.7% poverty level for males and 46.2% for females among the residents of Collbran, 16 and 17 year old males and 16 and 17 year old females are the most vulnerable to poverty, with 19 males (100.0%) and 20 females (83.3%) in their respective age groups living below the poverty level.
| Age Bracket | Male | Female |
| Under 5 Years | 0 (0.0%) | 0 (0.0%) |
| 5 Years | 0 (0.0%) | 0 (0.0%) |
| 6 to 11 Years | 2 (18.2%) | 0 (0.0%) |
| 12 to 14 Years | 0 (0.0%) | 0 (0.0%) |
| 15 Years | 0 (0.0%) | 0 (0.0%) |
| 16 and 17 Years | 19 (100.0%) | 20 (83.3%) |
| 18 to 24 Years | 141 (76.2%) | 58 (82.9%) |
| 25 to 34 Years | 20 (42.5%) | 30 (78.9%) |
| 35 to 44 Years | 1 (6.7%) | 0 (0.0%) |
| 45 to 54 Years | 3 (13.0%) | 12 (23.1%) |
| 55 to 64 Years | 8 (27.6%) | 0 (0.0%) |
| 65 to 74 Years | 0 (0.0%) | 0 (0.0%) |
| 75 Years and over | 0 (0.0%) | 0 (0.0%) |
| Total | 194 (51.7%) | 120 (46.2%) |
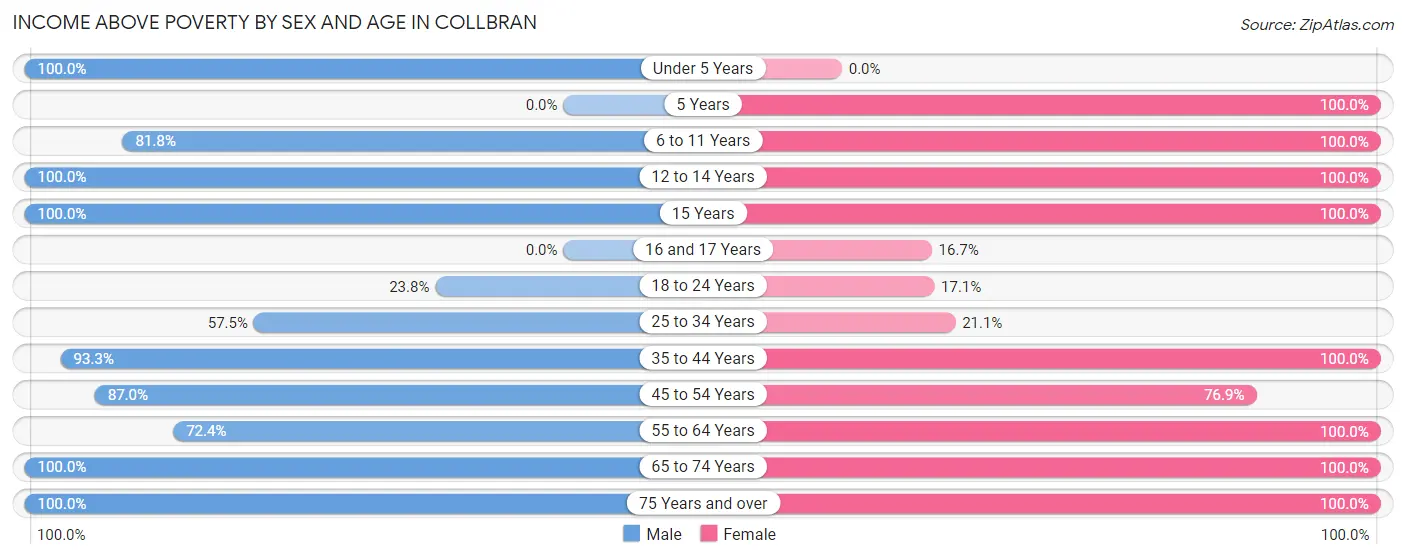
Income Above Poverty by Sex and Age in Collbran
According to the poverty statistics in Collbran, males aged under 5 years and females aged 5 years are the age groups that are most secure financially, with 100.0% of males and 100.0% of females in these age groups living above the poverty line.
| Age Bracket | Male | Female |
| Under 5 Years | 4 (100.0%) | 0 (0.0%) |
| 5 Years | 0 (0.0%) | 3 (100.0%) |
| 6 to 11 Years | 9 (81.8%) | 4 (100.0%) |
| 12 to 14 Years | 3 (100.0%) | 10 (100.0%) |
| 15 Years | 3 (100.0%) | 1 (100.0%) |
| 16 and 17 Years | 0 (0.0%) | 4 (16.7%) |
| 18 to 24 Years | 44 (23.8%) | 12 (17.1%) |
| 25 to 34 Years | 27 (57.5%) | 8 (21.0%) |
| 35 to 44 Years | 14 (93.3%) | 14 (100.0%) |
| 45 to 54 Years | 20 (87.0%) | 40 (76.9%) |
| 55 to 64 Years | 21 (72.4%) | 16 (100.0%) |
| 65 to 74 Years | 29 (100.0%) | 16 (100.0%) |
| 75 Years and over | 7 (100.0%) | 12 (100.0%) |
| Total | 181 (48.3%) | 140 (53.8%) |
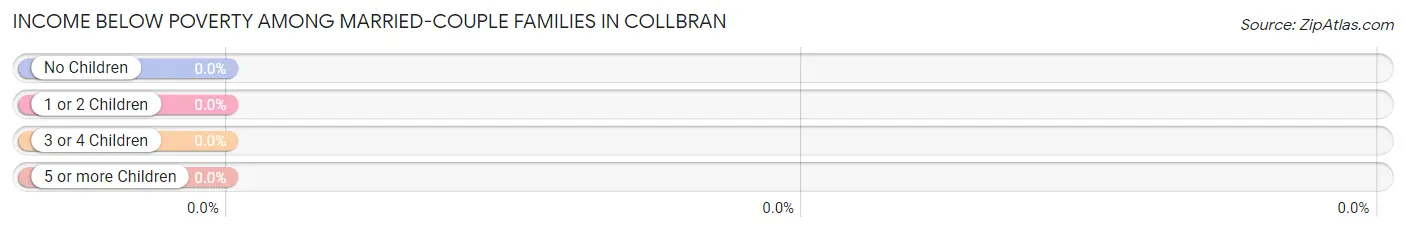
Income Below Poverty Among Married-Couple Families in Collbran
| Children | Above Poverty | Below Poverty |
| No Children | 40 (100.0%) | 0 (0.0%) |
| 1 or 2 Children | 10 (100.0%) | 0 (0.0%) |
| 3 or 4 Children | 9 (100.0%) | 0 (0.0%) |
| 5 or more Children | 0 (0.0%) | 0 (0.0%) |
| Total | 59 (100.0%) | 0 (0.0%) |
Income Below Poverty Among Single-Parent Households in Collbran
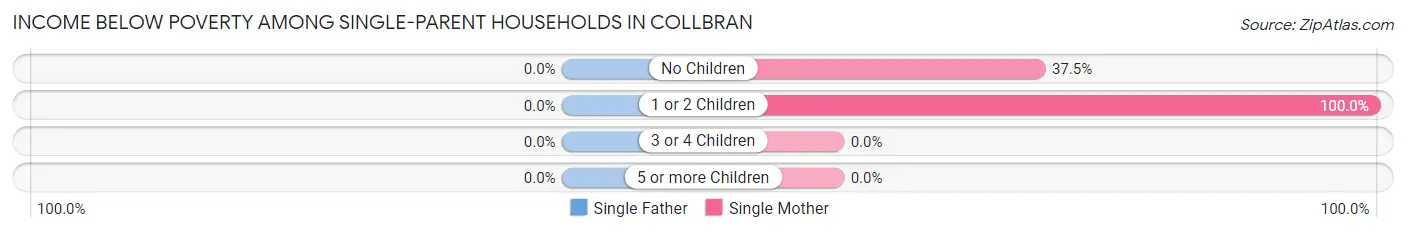
| Children | Single Father | Single Mother |
| No Children | 0 (0.0%) | 6 (37.5%) |
| 1 or 2 Children | 0 (0.0%) | 4 (100.0%) |
| 3 or 4 Children | 0 (0.0%) | 0 (0.0%) |
| 5 or more Children | 0 (0.0%) | 0 (0.0%) |
| Total | 0 (0.0%) | 10 (50.0%) |
Income Below Poverty Among Married-Couple vs Single-Parent Households in Collbran
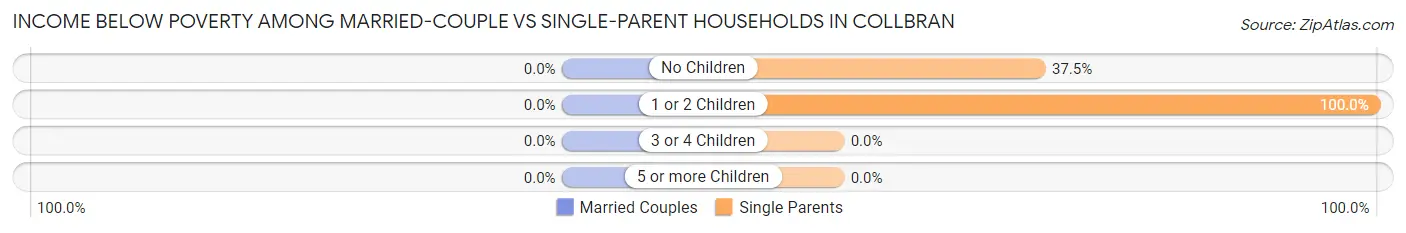
| Children | Married-Couple Families | Single-Parent Households |
| No Children | 0 (0.0%) | 6 (37.5%) |
| 1 or 2 Children | 0 (0.0%) | 4 (100.0%) |
| 3 or 4 Children | 0 (0.0%) | 0 (0.0%) |
| 5 or more Children | 0 (0.0%) | 0 (0.0%) |
| Total | 0 (0.0%) | 10 (50.0%) |
Race in Collbran
The most populous races in Collbran are White / Caucasian (554 | 85.6%), Hispanic or Latino (59 | 9.1%), and Two or more Races (42 | 6.5%).
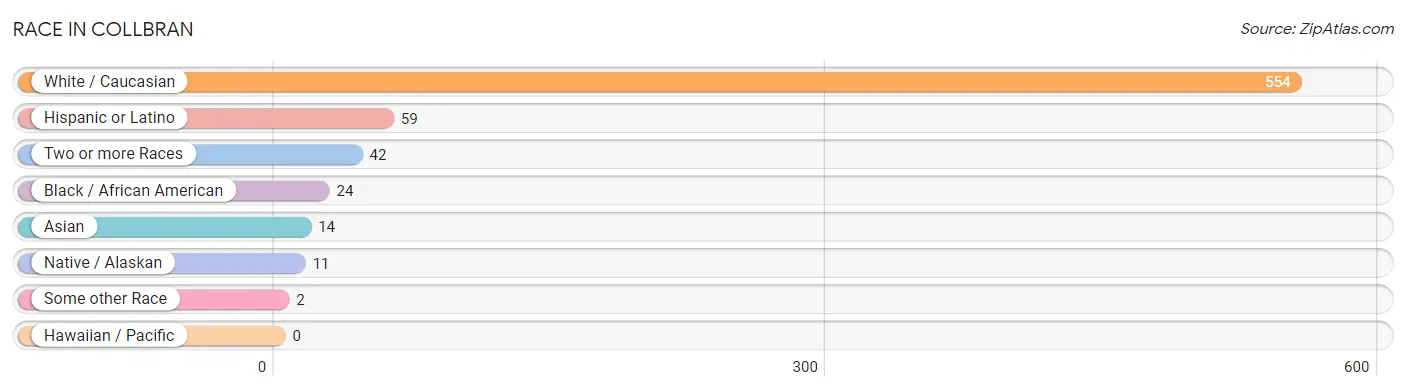
| Race | # Population | % Population |
| Asian | 14 | 2.2% |
| Black / African American | 24 | 3.7% |
| Hawaiian / Pacific | 0 | 0.0% |
| Hispanic or Latino | 59 | 9.1% |
| Native / Alaskan | 11 | 1.7% |
| White / Caucasian | 554 | 85.6% |
| Two or more Races | 42 | 6.5% |
| Some other Race | 2 | 0.3% |
| Total | 647 | 100.0% |
Ancestry in Collbran
The most populous ancestries reported in Collbran are German (169 | 26.1%), Irish (142 | 22.0%), French (40 | 6.2%), English (36 | 5.6%), and Italian (36 | 5.6%), together accounting for 65.4% of all Collbran residents.
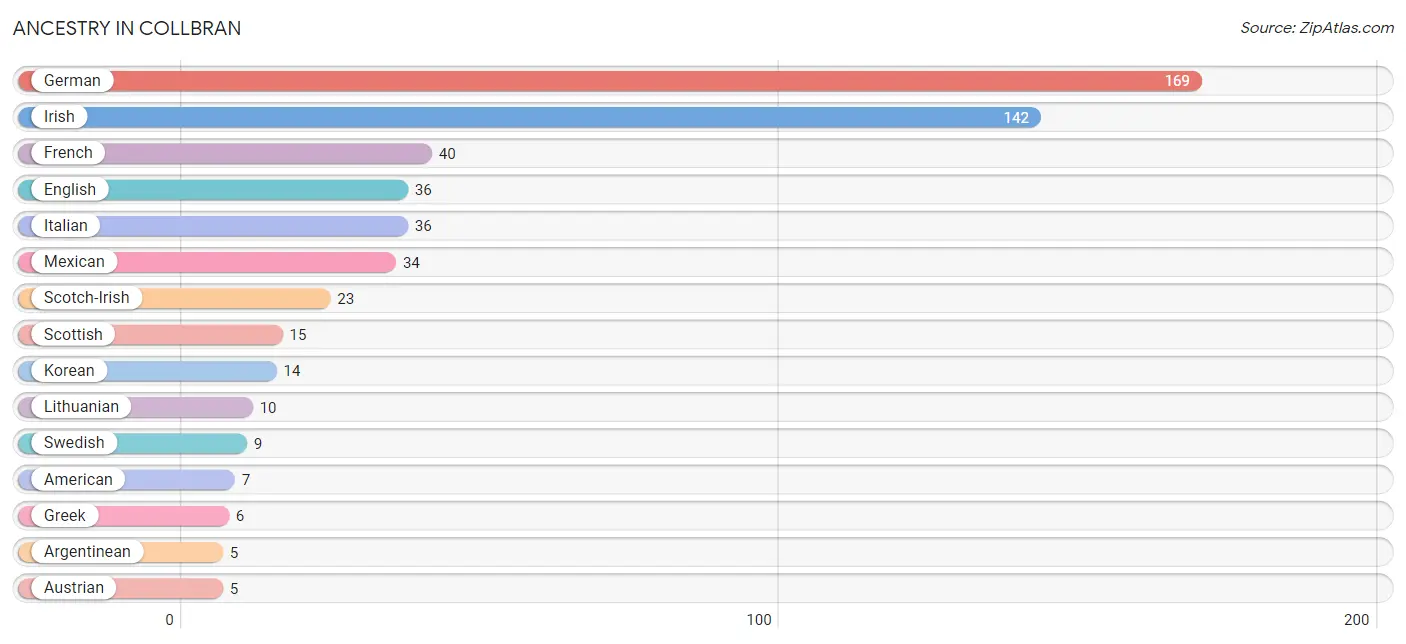
| Ancestry | # Population | % Population |
| American | 7 | 1.1% |
| Apache | 2 | 0.3% |
| Argentinean | 5 | 0.8% |
| Austrian | 5 | 0.8% |
| Belgian | 1 | 0.2% |
| Dutch | 4 | 0.6% |
| English | 36 | 5.6% |
| Estonian | 1 | 0.2% |
| French | 40 | 6.2% |
| German | 169 | 26.1% |
| Greek | 6 | 0.9% |
| Irish | 142 | 22.0% |
| Iroquois | 1 | 0.2% |
| Italian | 36 | 5.6% |
| Korean | 14 | 2.2% |
| Lithuanian | 10 | 1.5% |
| Mexican | 34 | 5.3% |
| Norwegian | 5 | 0.8% |
| Polish | 4 | 0.6% |
| Scandinavian | 3 | 0.5% |
| Scotch-Irish | 23 | 3.5% |
| Scottish | 15 | 2.3% |
| Shoshone | 5 | 0.8% |
| South American | 5 | 0.8% |
| Swedish | 9 | 1.4% |
| Welsh | 3 | 0.5% | View All 26 Rows |
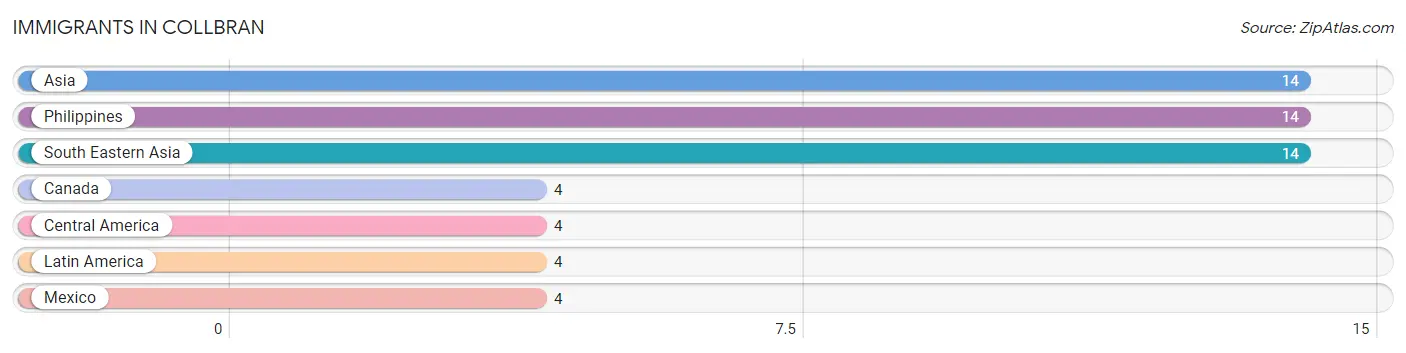
Immigrants in Collbran
The most numerous immigrant groups reported in Collbran came from Asia (14 | 2.2%), Philippines (14 | 2.2%), South Eastern Asia (14 | 2.2%), Canada (4 | 0.6%), and Central America (4 | 0.6%), together accounting for 7.7% of all Collbran residents.
| Immigration Origin | # Population | % Population |
| Asia | 14 | 2.2% |
| Canada | 4 | 0.6% |
| Central America | 4 | 0.6% |
| Latin America | 4 | 0.6% |
| Mexico | 4 | 0.6% |
| Philippines | 14 | 2.2% |
| South Eastern Asia | 14 | 2.2% | View All 7 Rows |
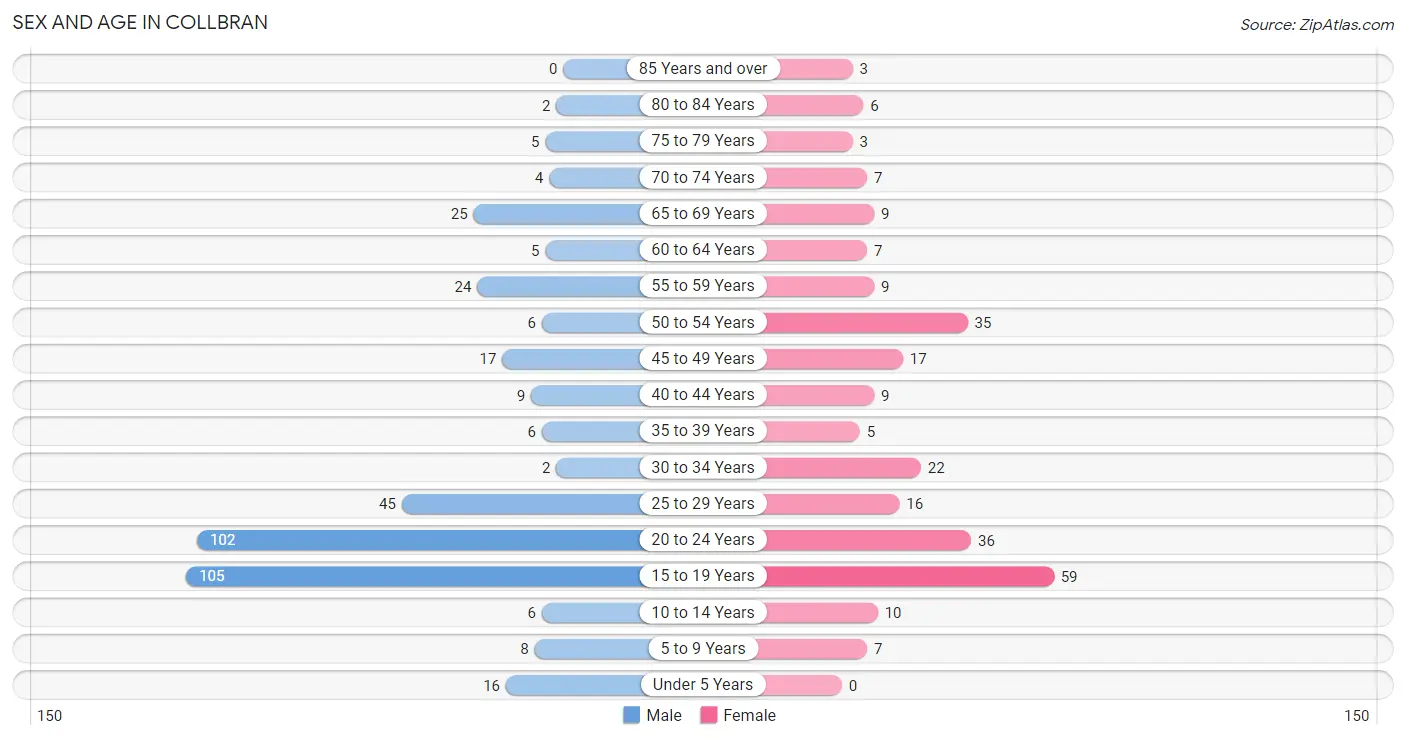
Sex and Age in Collbran
Sex and Age in Collbran
The most populous age groups in Collbran are 15 to 19 Years (105 | 27.1%) for men and 15 to 19 Years (59 | 22.7%) for women.
| Age Bracket | Male | Female |
| Under 5 Years | 16 (4.1%) | 0 (0.0%) |
| 5 to 9 Years | 8 (2.1%) | 7 (2.7%) |
| 10 to 14 Years | 6 (1.5%) | 10 (3.8%) |
| 15 to 19 Years | 105 (27.1%) | 59 (22.7%) |
| 20 to 24 Years | 102 (26.4%) | 36 (13.9%) |
| 25 to 29 Years | 45 (11.6%) | 16 (6.1%) |
| 30 to 34 Years | 2 (0.5%) | 22 (8.5%) |
| 35 to 39 Years | 6 (1.5%) | 5 (1.9%) |
| 40 to 44 Years | 9 (2.3%) | 9 (3.5%) |
| 45 to 49 Years | 17 (4.4%) | 17 (6.5%) |
| 50 to 54 Years | 6 (1.5%) | 35 (13.5%) |
| 55 to 59 Years | 24 (6.2%) | 9 (3.5%) |
| 60 to 64 Years | 5 (1.3%) | 7 (2.7%) |
| 65 to 69 Years | 25 (6.5%) | 9 (3.5%) |
| 70 to 74 Years | 4 (1.0%) | 7 (2.7%) |
| 75 to 79 Years | 5 (1.3%) | 3 (1.1%) |
| 80 to 84 Years | 2 (0.5%) | 6 (2.3%) |
| 85 Years and over | 0 (0.0%) | 3 (1.1%) |
| Total | 387 (100.0%) | 260 (100.0%) |
Families and Households in Collbran
Median Family Size in Collbran
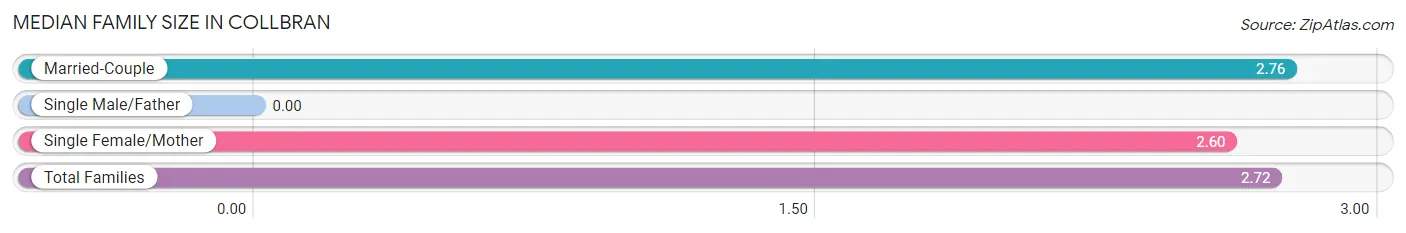
| Family Type | # Families | Family Size |
| Married-Couple | 59 (74.7%) | 2.76 |
| Single Male/Father | 0 (0.0%) | - |
| Single Female/Mother | 20 (25.3%) | 2.60 |
| Total Families | 79 (100.0%) | 2.72 |
Median Household Size in Collbran
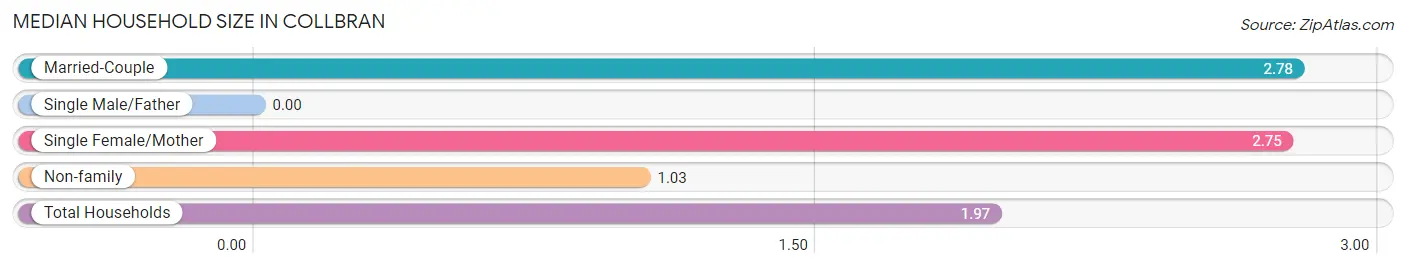
| Household Type | # Households | Household Size |
| Married-Couple | 59 (40.1%) | 2.78 |
| Single Male/Father | 0 (0.0%) | - |
| Single Female/Mother | 20 (13.6%) | 2.75 |
| Non-family | 68 (46.3%) | 1.03 |
| Total Households | 147 (100.0%) | 1.97 |
Household Size by Marriage Status in Collbran
Out of a total of 147 households in Collbran, 79 (53.7%) are family households, while 68 (46.3%) are nonfamily households. The most numerous type of family households are 2-person households, comprising 46, and the most common type of nonfamily households are 1-person households, comprising 66.
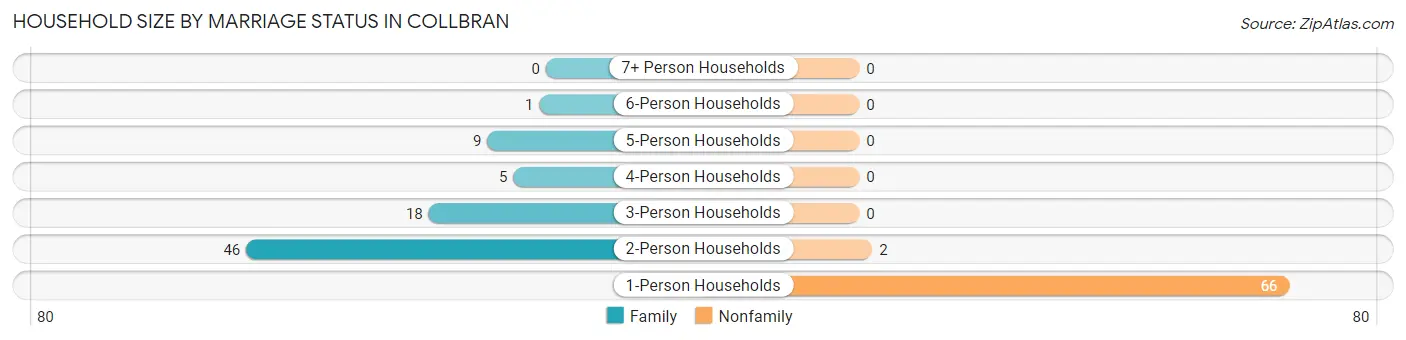
| Household Size | Family Households | Nonfamily Households |
| 1-Person Households | - | 66 (44.9%) |
| 2-Person Households | 46 (31.3%) | 2 (1.4%) |
| 3-Person Households | 18 (12.2%) | 0 (0.0%) |
| 4-Person Households | 5 (3.4%) | 0 (0.0%) |
| 5-Person Households | 9 (6.1%) | 0 (0.0%) |
| 6-Person Households | 1 (0.7%) | 0 (0.0%) |
| 7+ Person Households | 0 (0.0%) | 0 (0.0%) |
| Total | 79 (53.7%) | 68 (46.3%) |
Female Fertility in Collbran
Fertility by Age in Collbran
| Age Bracket | Women with Births | Births / 1,000 Women |
| 15 to 19 years | 0 (0.0%) | 0.0 |
| 20 to 34 years | 0 (0.0%) | 0.0 |
| 35 to 50 years | 0 (0.0%) | 0.0 |
| Total | 0 (0.0%) | 0.0 |
Fertility by Age by Marriage Status in Collbran
| Age Bracket | Married | Unmarried |
| 15 to 19 years | 0 (0.0%) | 0 (0.0%) |
| 20 to 34 years | 0 (0.0%) | 0 (0.0%) |
| 35 to 50 years | 0 (0.0%) | 0 (0.0%) |
| Total | 0 (0.0%) | 0 (0.0%) |
Fertility by Education in Collbran
| Educational Attainment | Women with Births | Births / 1,000 Women |
| Less than High School | 0 (0.0%) | 0.0 |
| High School Diploma | 0 (0.0%) | 0.0 |
| College or Associate's Degree | 0 (0.0%) | 0.0 |
| Bachelor's Degree | 0 (0.0%) | 0.0 |
| Graduate Degree | 0 (0.0%) | 0.0 |
| Total | 0 (0.0%) | 0.0 |
Fertility by Education by Marriage Status in Collbran
| Educational Attainment | Married | Unmarried |
| Less than High School | 0 (0.0%) | 0 (0.0%) |
| High School Diploma | 0 (0.0%) | 0 (0.0%) |
| College or Associate's Degree | 0 (0.0%) | 0 (0.0%) |
| Bachelor's Degree | 0 (0.0%) | 0 (0.0%) |
| Graduate Degree | 0 (0.0%) | 0 (0.0%) |
| Total | 0 (0.0%) | 0 (0.0%) |
Employment Characteristics in Collbran
Employment by Class of Employer in Collbran
Among the 152 employed individuals in Collbran, private company employees (63 | 41.4%), federal government employees (38 | 25.0%), and state government employees (24 | 15.8%) make up the most common classes of employment.
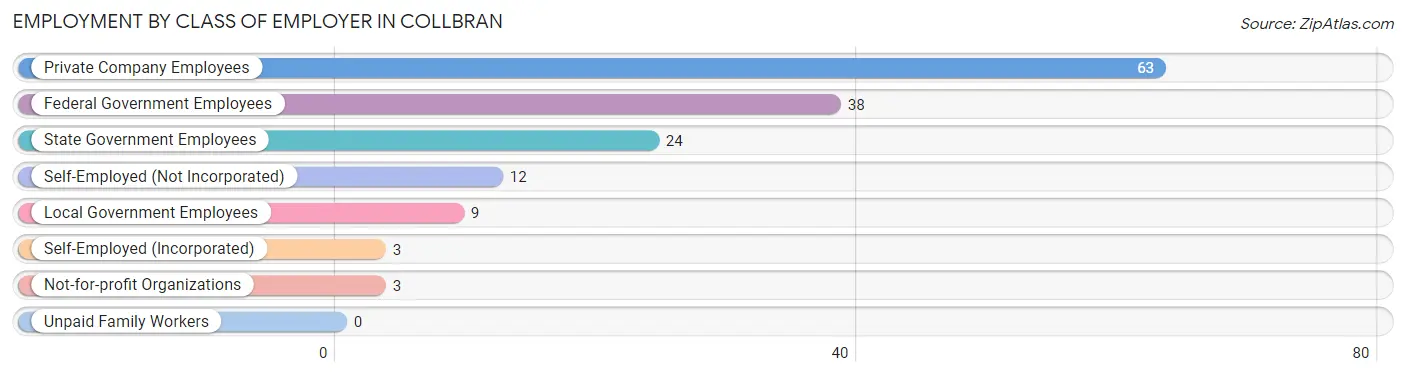
| Employer Class | # Employees | % Employees |
| Private Company Employees | 63 | 41.4% |
| Self-Employed (Incorporated) | 3 | 2.0% |
| Self-Employed (Not Incorporated) | 12 | 7.9% |
| Not-for-profit Organizations | 3 | 2.0% |
| Local Government Employees | 9 | 5.9% |
| State Government Employees | 24 | 15.8% |
| Federal Government Employees | 38 | 25.0% |
| Unpaid Family Workers | 0 | 0.0% |
| Total | 152 | 100.0% |
Employment Status by Age in Collbran
According to the labor force statistics for Collbran, out of the total population over 16 years of age (596), 40.1% or 239 individuals are in the labor force, with 36.4% or 87 of them unemployed. The age group with the highest labor force participation rate is 30 to 34 years, with 87.5% or 21 individuals in the labor force. Within the labor force, the 16 to 19 years age range has the highest percentage of unemployed individuals, with 82.6% or 19 of them being unemployed.
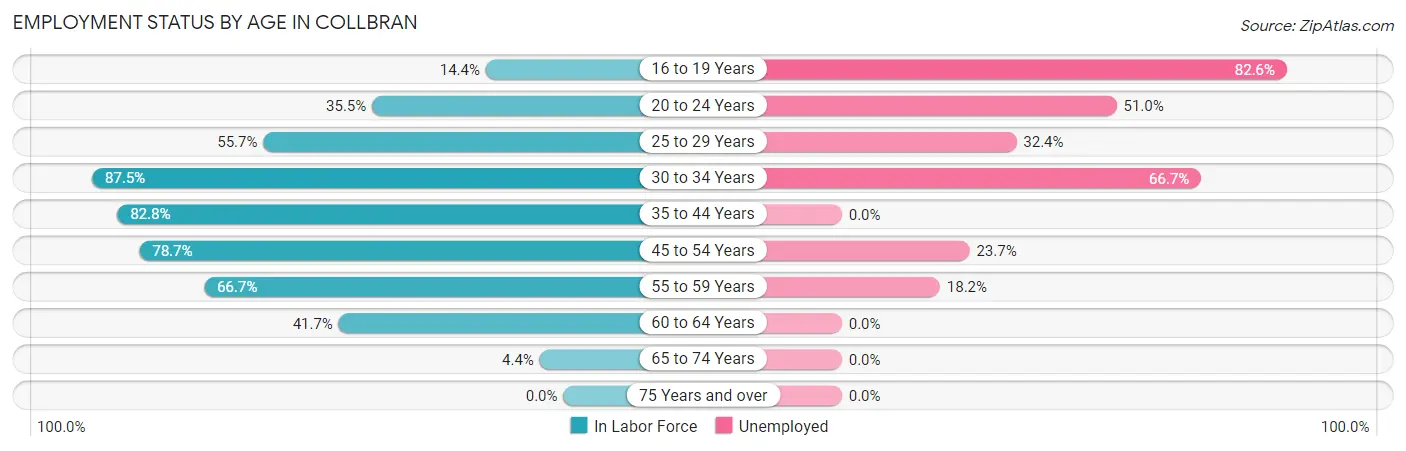
| Age Bracket | In Labor Force | Unemployed |
| 16 to 19 Years | 23 (14.4%) | 19 (82.6%) |
| 20 to 24 Years | 49 (35.5%) | 25 (51.0%) |
| 25 to 29 Years | 34 (55.7%) | 11 (32.4%) |
| 30 to 34 Years | 21 (87.5%) | 14 (66.7%) |
| 35 to 44 Years | 24 (82.8%) | 0 (0.0%) |
| 45 to 54 Years | 59 (78.7%) | 14 (23.7%) |
| 55 to 59 Years | 22 (66.7%) | 4 (18.2%) |
| 60 to 64 Years | 5 (41.7%) | 0 (0.0%) |
| 65 to 74 Years | 2 (4.4%) | 0 (0.0%) |
| 75 Years and over | 0 (0.0%) | 0 (0.0%) |
| Total | 239 (40.1%) | 87 (36.4%) |
Employment Status by Educational Attainment in Collbran
According to labor force statistics for Collbran, 70.5% of individuals (165) out of the total population between 25 and 64 years of age (234) are in the labor force, with 26.1% or 43 of them being unemployed. The group with the highest labor force participation rate are those with the educational attainment of bachelor's degree or higher, with 100.0% or 18 individuals in the labor force. Within the labor force, individuals with college / associate degree education have the highest percentage of unemployment, with 39.1% or 18 of them being unemployed.
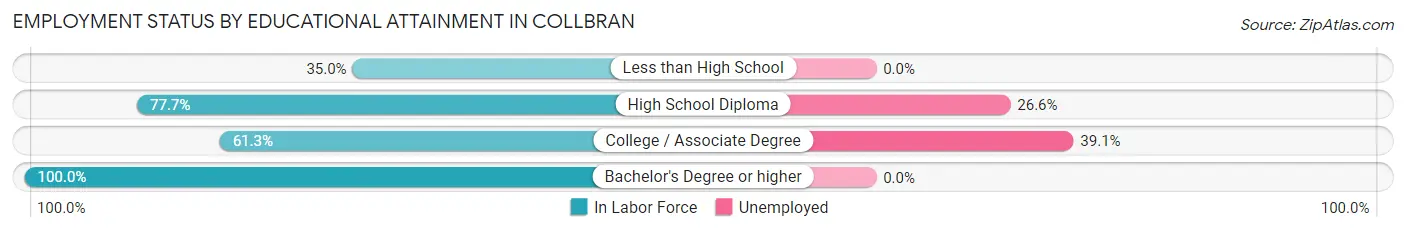
| Educational Attainment | In Labor Force | Unemployed |
| Less than High School | 7 (35.0%) | 0 (0.0%) |
| High School Diploma | 94 (77.7%) | 32 (26.6%) |
| College / Associate Degree | 46 (61.3%) | 29 (39.1%) |
| Bachelor's Degree or higher | 18 (100.0%) | 0 (0.0%) |
| Total | 165 (70.5%) | 61 (26.1%) |
Employment Occupations by Sex in Collbran
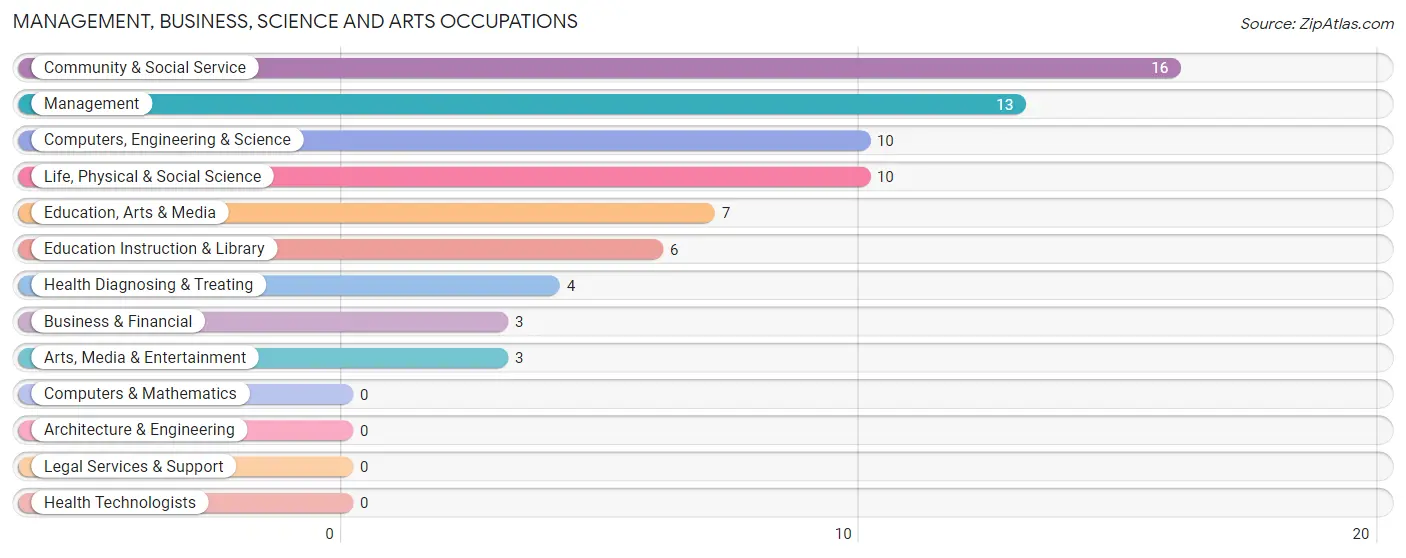
Management, Business, Science and Arts Occupations
The most common Management, Business, Science and Arts occupations in Collbran are Community & Social Service (16 | 10.5%), Management (13 | 8.6%), Computers, Engineering & Science (10 | 6.6%), Life, Physical & Social Science (10 | 6.6%), and Education, Arts & Media (7 | 4.6%).
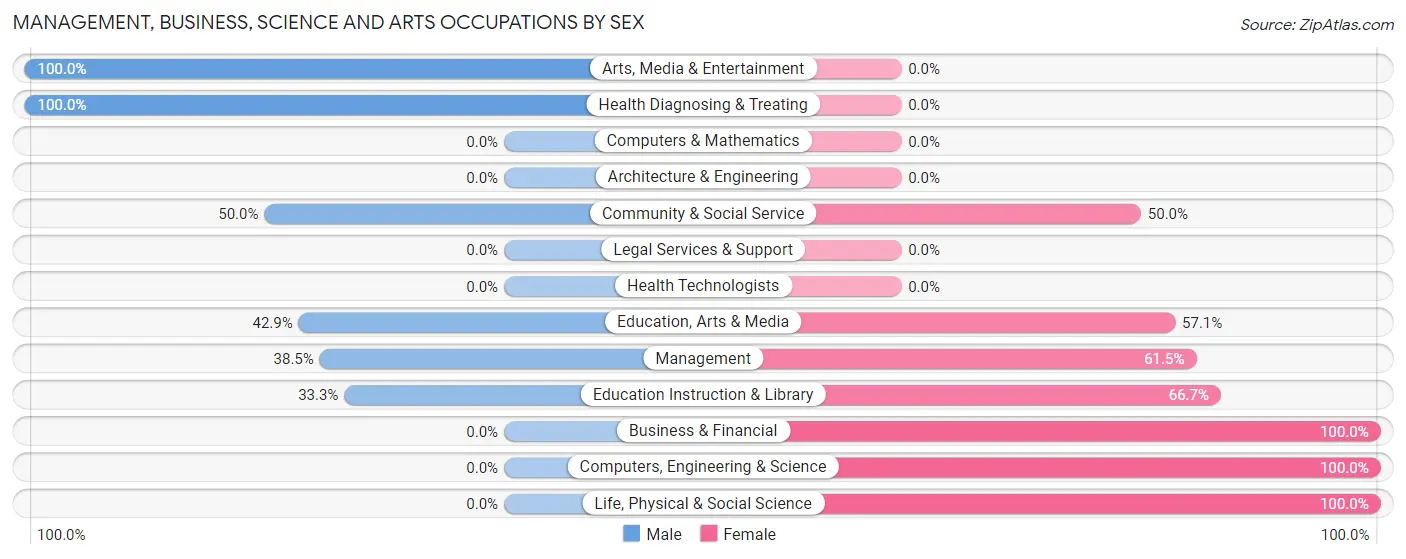
Management, Business, Science and Arts Occupations by Sex
Within the Management, Business, Science and Arts occupations in Collbran, the most male-oriented occupations are Arts, Media & Entertainment (100.0%), Health Diagnosing & Treating (100.0%), and Community & Social Service (50.0%), while the most female-oriented occupations are Business & Financial (100.0%), Computers, Engineering & Science (100.0%), and Life, Physical & Social Science (100.0%).
| Occupation | Male | Female |
| Management | 5 (38.5%) | 8 (61.5%) |
| Business & Financial | 0 (0.0%) | 3 (100.0%) |
| Computers, Engineering & Science | 0 (0.0%) | 10 (100.0%) |
| Computers & Mathematics | 0 (0.0%) | 0 (0.0%) |
| Architecture & Engineering | 0 (0.0%) | 0 (0.0%) |
| Life, Physical & Social Science | 0 (0.0%) | 10 (100.0%) |
| Community & Social Service | 8 (50.0%) | 8 (50.0%) |
| Education, Arts & Media | 3 (42.9%) | 4 (57.1%) |
| Legal Services & Support | 0 (0.0%) | 0 (0.0%) |
| Education Instruction & Library | 2 (33.3%) | 4 (66.7%) |
| Arts, Media & Entertainment | 3 (100.0%) | 0 (0.0%) |
| Health Diagnosing & Treating | 4 (100.0%) | 0 (0.0%) |
| Health Technologists | 0 (0.0%) | 0 (0.0%) |
| Total (Category) | 17 (37.0%) | 29 (63.0%) |
| Total (Overall) | 76 (50.0%) | 76 (50.0%) |
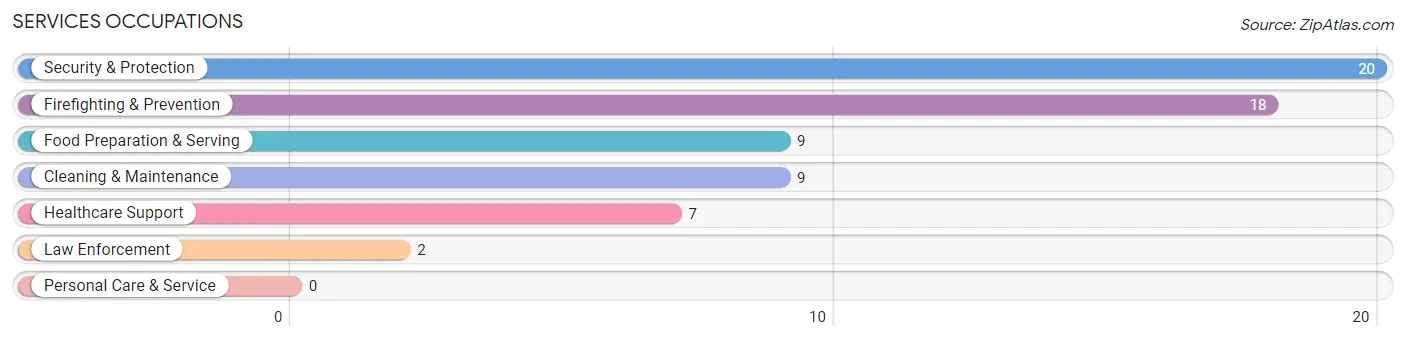
Services Occupations
The most common Services occupations in Collbran are Security & Protection (20 | 13.2%), Firefighting & Prevention (18 | 11.8%), Food Preparation & Serving (9 | 5.9%), Cleaning & Maintenance (9 | 5.9%), and Healthcare Support (7 | 4.6%).
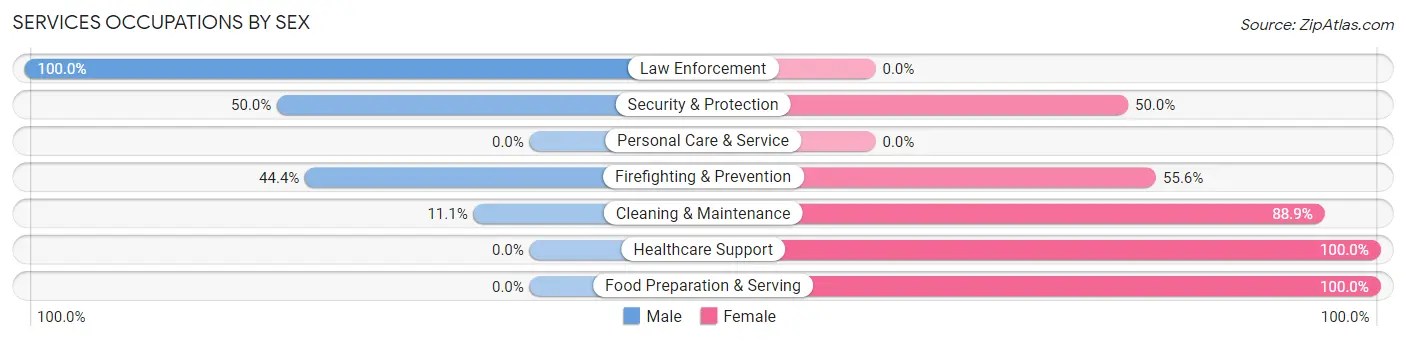
Services Occupations by Sex
Within the Services occupations in Collbran, the most male-oriented occupations are Law Enforcement (100.0%), Security & Protection (50.0%), and Firefighting & Prevention (44.4%), while the most female-oriented occupations are Healthcare Support (100.0%), Food Preparation & Serving (100.0%), and Cleaning & Maintenance (88.9%).
| Occupation | Male | Female |
| Healthcare Support | 0 (0.0%) | 7 (100.0%) |
| Security & Protection | 10 (50.0%) | 10 (50.0%) |
| Firefighting & Prevention | 8 (44.4%) | 10 (55.6%) |
| Law Enforcement | 2 (100.0%) | 0 (0.0%) |
| Food Preparation & Serving | 0 (0.0%) | 9 (100.0%) |
| Cleaning & Maintenance | 1 (11.1%) | 8 (88.9%) |
| Personal Care & Service | 0 (0.0%) | 0 (0.0%) |
| Total (Category) | 11 (24.4%) | 34 (75.6%) |
| Total (Overall) | 76 (50.0%) | 76 (50.0%) |
Sales and Office Occupations
The most common Sales and Office occupations in Collbran are Office & Administration (19 | 12.5%), and Sales & Related (6 | 4.0%).
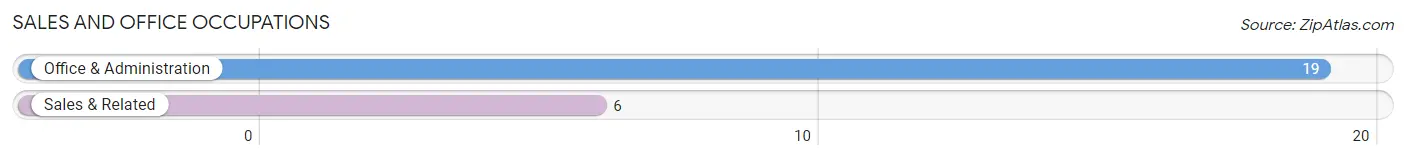
Sales and Office Occupations by Sex
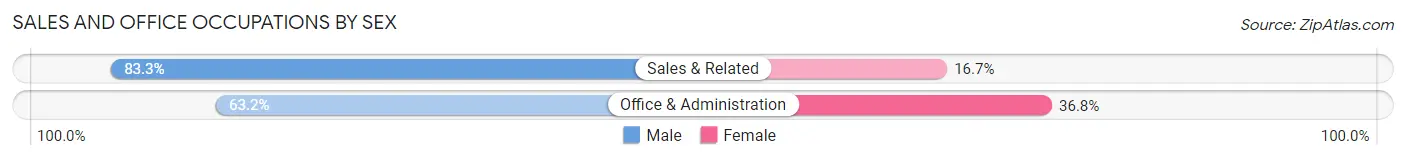
| Occupation | Male | Female |
| Sales & Related | 5 (83.3%) | 1 (16.7%) |
| Office & Administration | 12 (63.2%) | 7 (36.8%) |
| Total (Category) | 17 (68.0%) | 8 (32.0%) |
| Total (Overall) | 76 (50.0%) | 76 (50.0%) |
Natural Resources, Construction and Maintenance Occupations
The most common Natural Resources, Construction and Maintenance occupations in Collbran are Installation, Maintenance & Repair (11 | 7.2%), Construction & Extraction (8 | 5.3%), and Farming, Fishing & Forestry (4 | 2.6%).
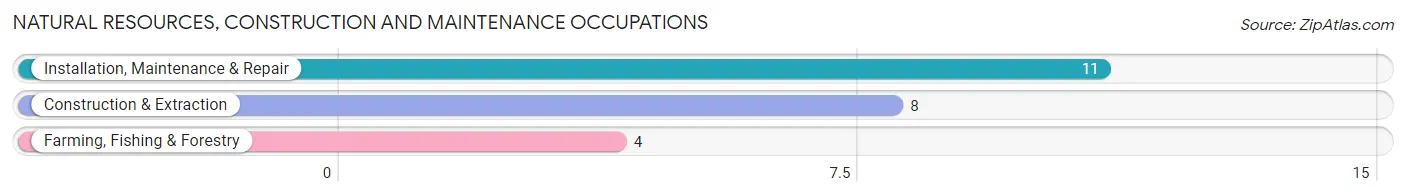
Natural Resources, Construction and Maintenance Occupations by Sex
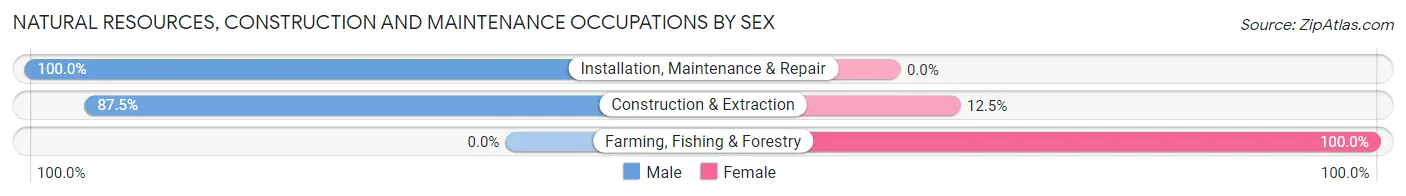
| Occupation | Male | Female |
| Farming, Fishing & Forestry | 0 (0.0%) | 4 (100.0%) |
| Construction & Extraction | 7 (87.5%) | 1 (12.5%) |
| Installation, Maintenance & Repair | 11 (100.0%) | 0 (0.0%) |
| Total (Category) | 18 (78.3%) | 5 (21.7%) |
| Total (Overall) | 76 (50.0%) | 76 (50.0%) |
Production, Transportation and Moving Occupations
The most common Production, Transportation and Moving occupations in Collbran are Production (8 | 5.3%), and Transportation (5 | 3.3%).
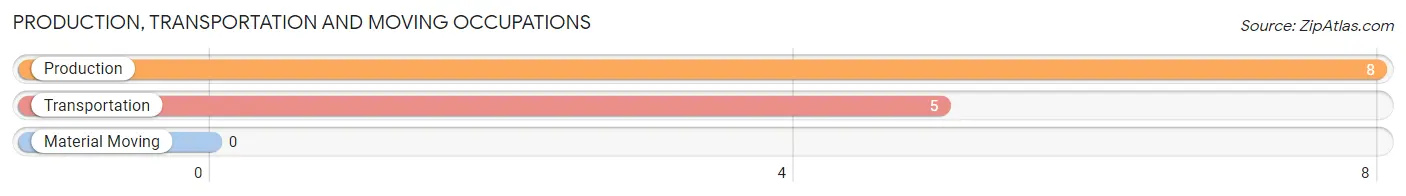
Production, Transportation and Moving Occupations by Sex
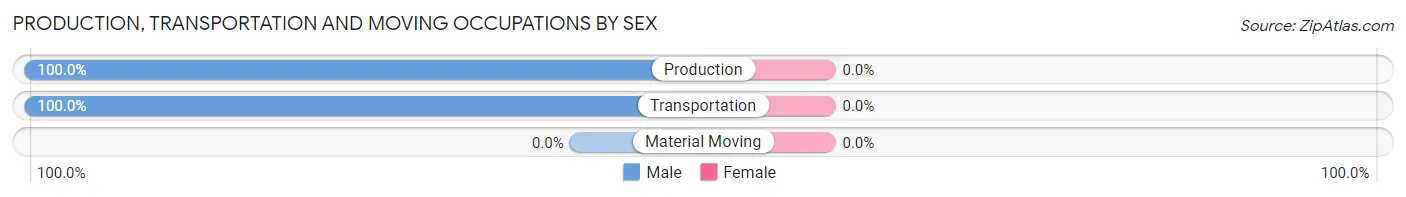
| Occupation | Male | Female |
| Production | 8 (100.0%) | 0 (0.0%) |
| Transportation | 5 (100.0%) | 0 (0.0%) |
| Material Moving | 0 (0.0%) | 0 (0.0%) |
| Total (Category) | 13 (100.0%) | 0 (0.0%) |
| Total (Overall) | 76 (50.0%) | 76 (50.0%) |
Employment Industries by Sex in Collbran
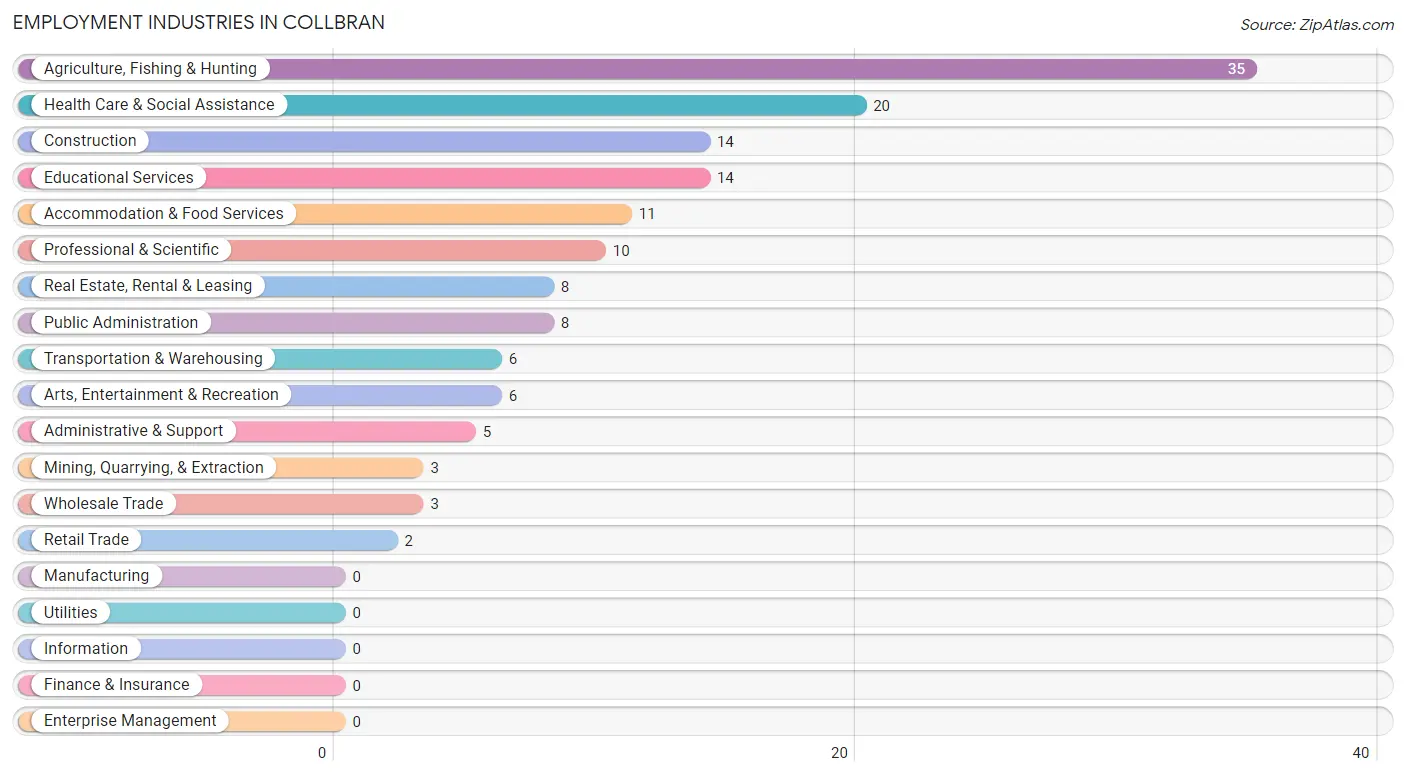
Employment Industries in Collbran
The major employment industries in Collbran include Agriculture, Fishing & Hunting (35 | 23.0%), Health Care & Social Assistance (20 | 13.2%), Construction (14 | 9.2%), Educational Services (14 | 9.2%), and Accommodation & Food Services (11 | 7.2%).
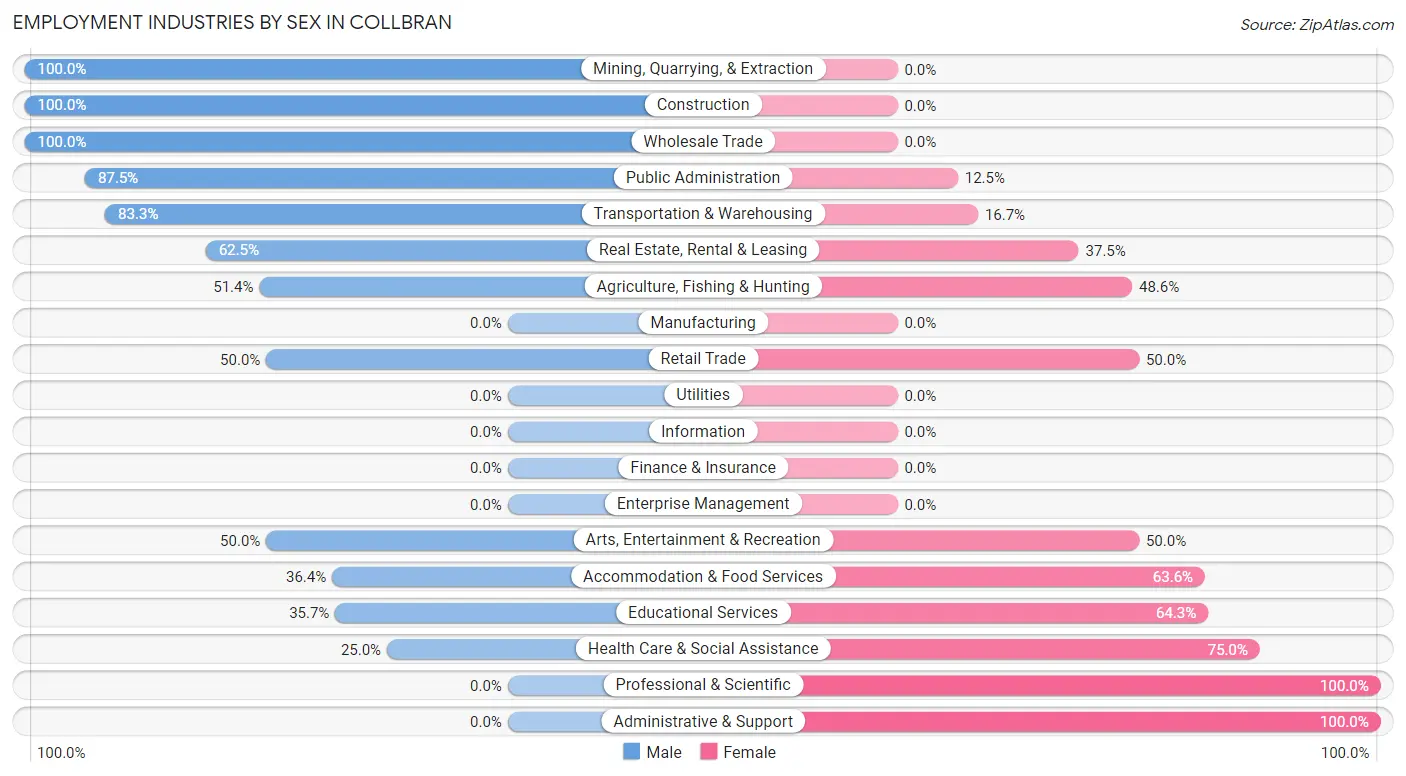
Employment Industries by Sex in Collbran
The Collbran industries that see more men than women are Mining, Quarrying, & Extraction (100.0%), Construction (100.0%), and Wholesale Trade (100.0%), whereas the industries that tend to have a higher number of women are Professional & Scientific (100.0%), Administrative & Support (100.0%), and Health Care & Social Assistance (75.0%).
| Industry | Male | Female |
| Agriculture, Fishing & Hunting | 18 (51.4%) | 17 (48.6%) |
| Mining, Quarrying, & Extraction | 3 (100.0%) | 0 (0.0%) |
| Construction | 14 (100.0%) | 0 (0.0%) |
| Manufacturing | 0 (0.0%) | 0 (0.0%) |
| Wholesale Trade | 3 (100.0%) | 0 (0.0%) |
| Retail Trade | 1 (50.0%) | 1 (50.0%) |
| Transportation & Warehousing | 5 (83.3%) | 1 (16.7%) |
| Utilities | 0 (0.0%) | 0 (0.0%) |
| Information | 0 (0.0%) | 0 (0.0%) |
| Finance & Insurance | 0 (0.0%) | 0 (0.0%) |
| Real Estate, Rental & Leasing | 5 (62.5%) | 3 (37.5%) |
| Professional & Scientific | 0 (0.0%) | 10 (100.0%) |
| Enterprise Management | 0 (0.0%) | 0 (0.0%) |
| Administrative & Support | 0 (0.0%) | 5 (100.0%) |
| Educational Services | 5 (35.7%) | 9 (64.3%) |
| Health Care & Social Assistance | 5 (25.0%) | 15 (75.0%) |
| Arts, Entertainment & Recreation | 3 (50.0%) | 3 (50.0%) |
| Accommodation & Food Services | 4 (36.4%) | 7 (63.6%) |
| Public Administration | 7 (87.5%) | 1 (12.5%) |
| Total | 76 (50.0%) | 76 (50.0%) |
Education in Collbran
School Enrollment in Collbran
The most common levels of schooling among the 219 students in Collbran are high school (139 | 63.5%), college / undergraduate (50 | 22.8%), and middle school (13 | 5.9%).
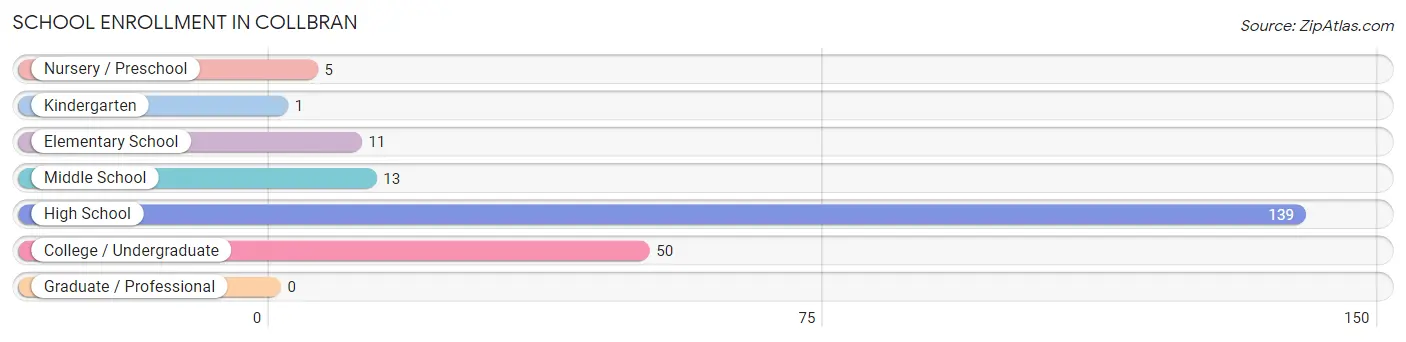
| School Level | # Students | % Students |
| Nursery / Preschool | 5 | 2.3% |
| Kindergarten | 1 | 0.5% |
| Elementary School | 11 | 5.0% |
| Middle School | 13 | 5.9% |
| High School | 139 | 63.5% |
| College / Undergraduate | 50 | 22.8% |
| Graduate / Professional | 0 | 0.0% |
| Total | 219 | 100.0% |
School Enrollment by Age by Funding Source in Collbran
Out of a total of 219 students who are enrolled in schools in Collbran, 59 (26.9%) attend a private institution, while the remaining 160 (73.1%) are enrolled in public schools. The age group of 25 to 34 year olds has the highest likelihood of being enrolled in private schools, with 5 (45.5% in the age bracket) enrolled. Conversely, the age group of 3 to 4 year olds has the lowest likelihood of being enrolled in a private school, with 2 (100.0% in the age bracket) attending a public institution.
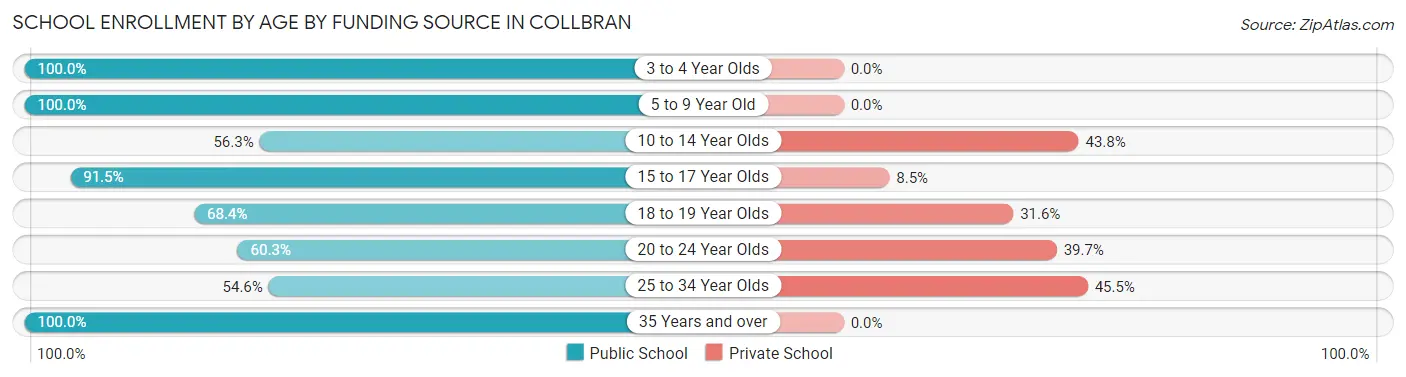
| Age Bracket | Public School | Private School |
| 3 to 4 Year Olds | 2 (100.0%) | 0 (0.0%) |
| 5 to 9 Year Old | 15 (100.0%) | 0 (0.0%) |
| 10 to 14 Year Olds | 9 (56.2%) | 7 (43.8%) |
| 15 to 17 Year Olds | 43 (91.5%) | 4 (8.5%) |
| 18 to 19 Year Olds | 39 (68.4%) | 18 (31.6%) |
| 20 to 24 Year Olds | 38 (60.3%) | 25 (39.7%) |
| 25 to 34 Year Olds | 6 (54.5%) | 5 (45.5%) |
| 35 Years and over | 8 (100.0%) | 0 (0.0%) |
| Total | 160 (73.1%) | 59 (26.9%) |
Educational Attainment by Field of Study in Collbran
Bio, nature & agricultural (10 | 27.8%), education (8 | 22.2%), liberal arts & history (6 | 16.7%), multidisciplinary studies (4 | 11.1%), and business (3 | 8.3%) are the most common fields of study among 36 individuals in Collbran who have obtained a bachelor's degree or higher.
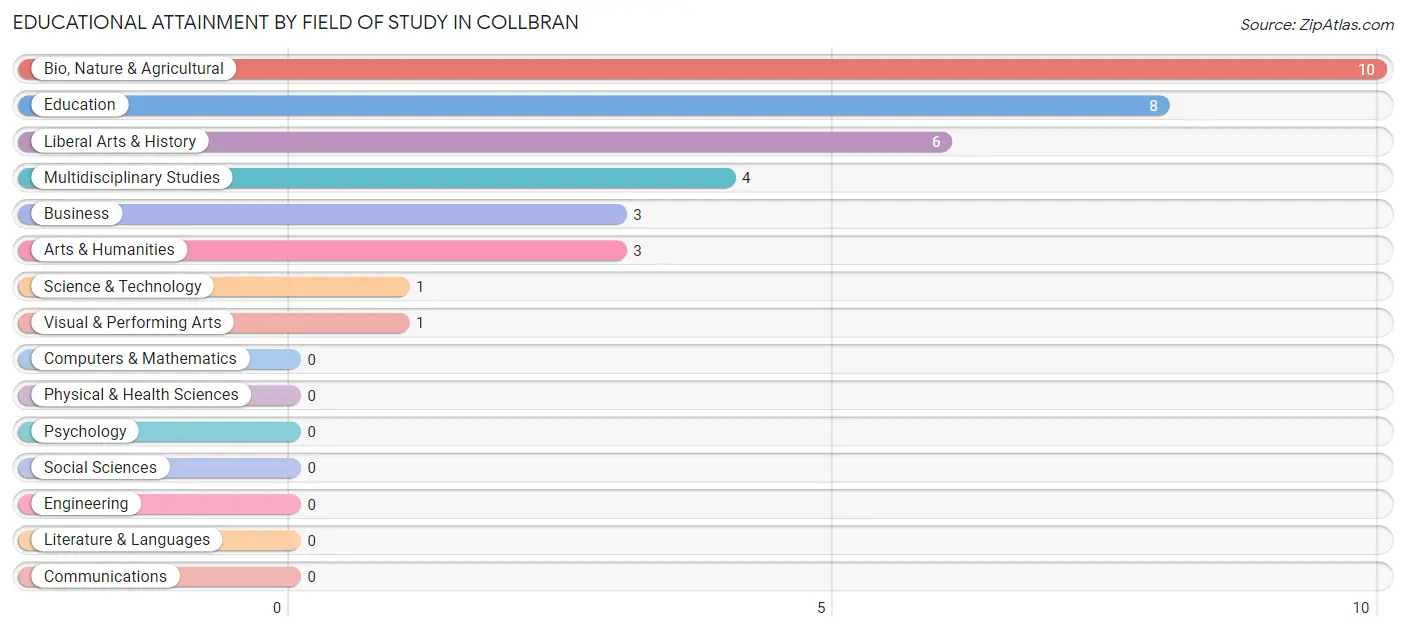
| Field of Study | # Graduates | % Graduates |
| Computers & Mathematics | 0 | 0.0% |
| Bio, Nature & Agricultural | 10 | 27.8% |
| Physical & Health Sciences | 0 | 0.0% |
| Psychology | 0 | 0.0% |
| Social Sciences | 0 | 0.0% |
| Engineering | 0 | 0.0% |
| Multidisciplinary Studies | 4 | 11.1% |
| Science & Technology | 1 | 2.8% |
| Business | 3 | 8.3% |
| Education | 8 | 22.2% |
| Literature & Languages | 0 | 0.0% |
| Liberal Arts & History | 6 | 16.7% |
| Visual & Performing Arts | 1 | 2.8% |
| Communications | 0 | 0.0% |
| Arts & Humanities | 3 | 8.3% |
| Total | 36 | 100.0% |
Transportation & Commute in Collbran
Vehicle Availability by Sex in Collbran
The most prevalent vehicle ownership categories in Collbran are males with 2 vehicles (33, accounting for 54.1%) and females with 2 vehicles (25, making up 58.9%).
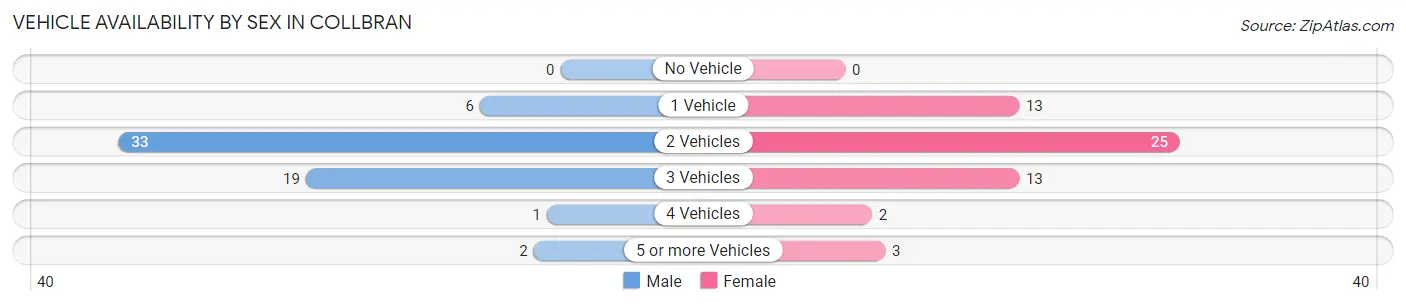
| Vehicles Available | Male | Female |
| No Vehicle | 0 (0.0%) | 0 (0.0%) |
| 1 Vehicle | 6 (9.8%) | 13 (23.2%) |
| 2 Vehicles | 33 (54.1%) | 25 (44.6%) |
| 3 Vehicles | 19 (31.1%) | 13 (23.2%) |
| 4 Vehicles | 1 (1.6%) | 2 (3.6%) |
| 5 or more Vehicles | 2 (3.3%) | 3 (5.4%) |
| Total | 61 (100.0%) | 56 (100.0%) |
Commute Time in Collbran
The most frequently occuring commute durations in Collbran are 5 to 9 minutes (48 commuters, 31.8%), 45 to 59 minutes (25 commuters, 16.6%), and 15 to 19 minutes (24 commuters, 15.9%).
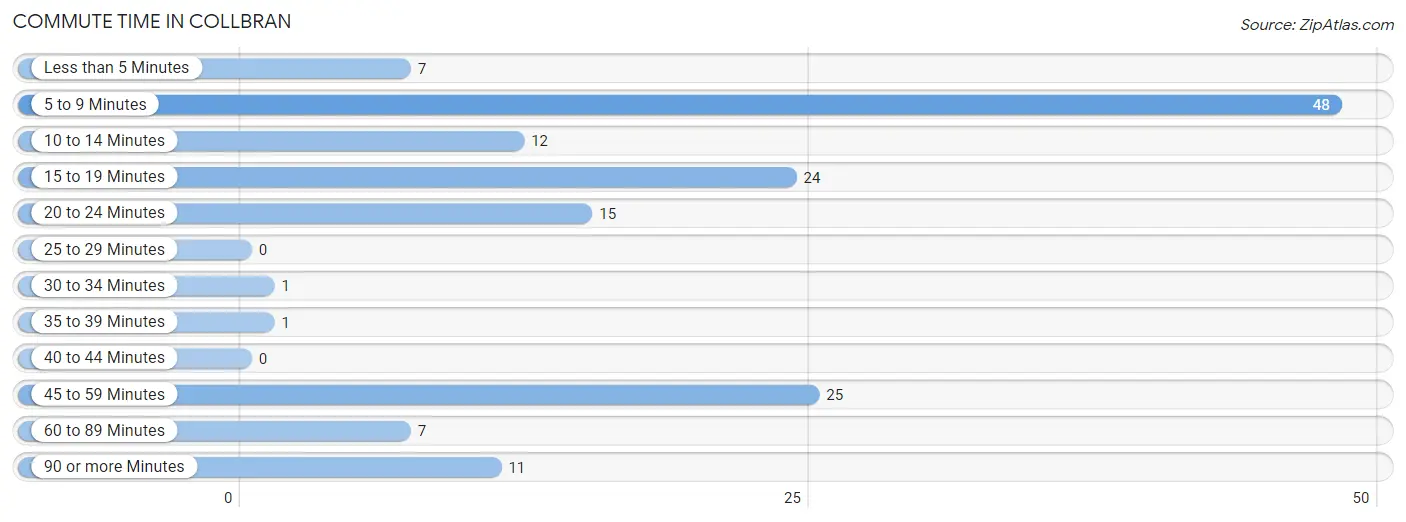
| Commute Time | # Commuters | % Commuters |
| Less than 5 Minutes | 7 | 4.6% |
| 5 to 9 Minutes | 48 | 31.8% |
| 10 to 14 Minutes | 12 | 8.0% |
| 15 to 19 Minutes | 24 | 15.9% |
| 20 to 24 Minutes | 15 | 9.9% |
| 25 to 29 Minutes | 0 | 0.0% |
| 30 to 34 Minutes | 1 | 0.7% |
| 35 to 39 Minutes | 1 | 0.7% |
| 40 to 44 Minutes | 0 | 0.0% |
| 45 to 59 Minutes | 25 | 16.6% |
| 60 to 89 Minutes | 7 | 4.6% |
| 90 or more Minutes | 11 | 7.3% |
Commute Time by Sex in Collbran
The most common commute times in Collbran are 5 to 9 minutes (19 commuters, 25.0%) for males and 5 to 9 minutes (29 commuters, 38.7%) for females.
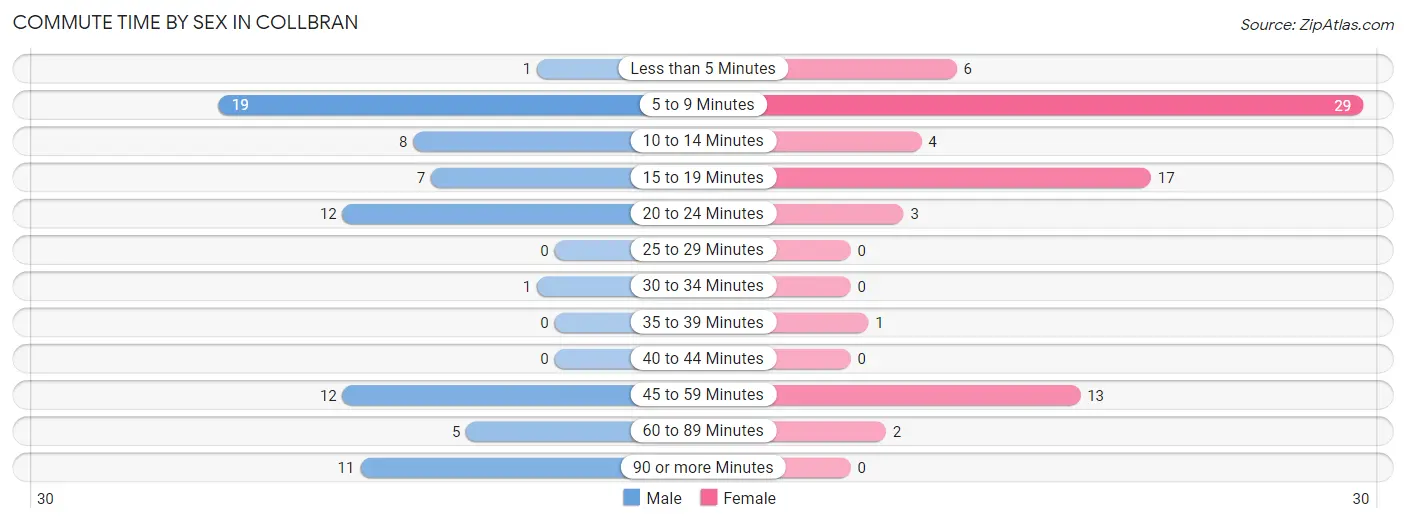
| Commute Time | Male | Female |
| Less than 5 Minutes | 1 (1.3%) | 6 (8.0%) |
| 5 to 9 Minutes | 19 (25.0%) | 29 (38.7%) |
| 10 to 14 Minutes | 8 (10.5%) | 4 (5.3%) |
| 15 to 19 Minutes | 7 (9.2%) | 17 (22.7%) |
| 20 to 24 Minutes | 12 (15.8%) | 3 (4.0%) |
| 25 to 29 Minutes | 0 (0.0%) | 0 (0.0%) |
| 30 to 34 Minutes | 1 (1.3%) | 0 (0.0%) |
| 35 to 39 Minutes | 0 (0.0%) | 1 (1.3%) |
| 40 to 44 Minutes | 0 (0.0%) | 0 (0.0%) |
| 45 to 59 Minutes | 12 (15.8%) | 13 (17.3%) |
| 60 to 89 Minutes | 5 (6.6%) | 2 (2.7%) |
| 90 or more Minutes | 11 (14.5%) | 0 (0.0%) |
Time of Departure to Work by Sex in Collbran
The most frequent times of departure to work in Collbran are 7:00 AM to 7:29 AM (20, 26.3%) for males and 7:30 AM to 7:59 AM (22, 29.3%) for females.
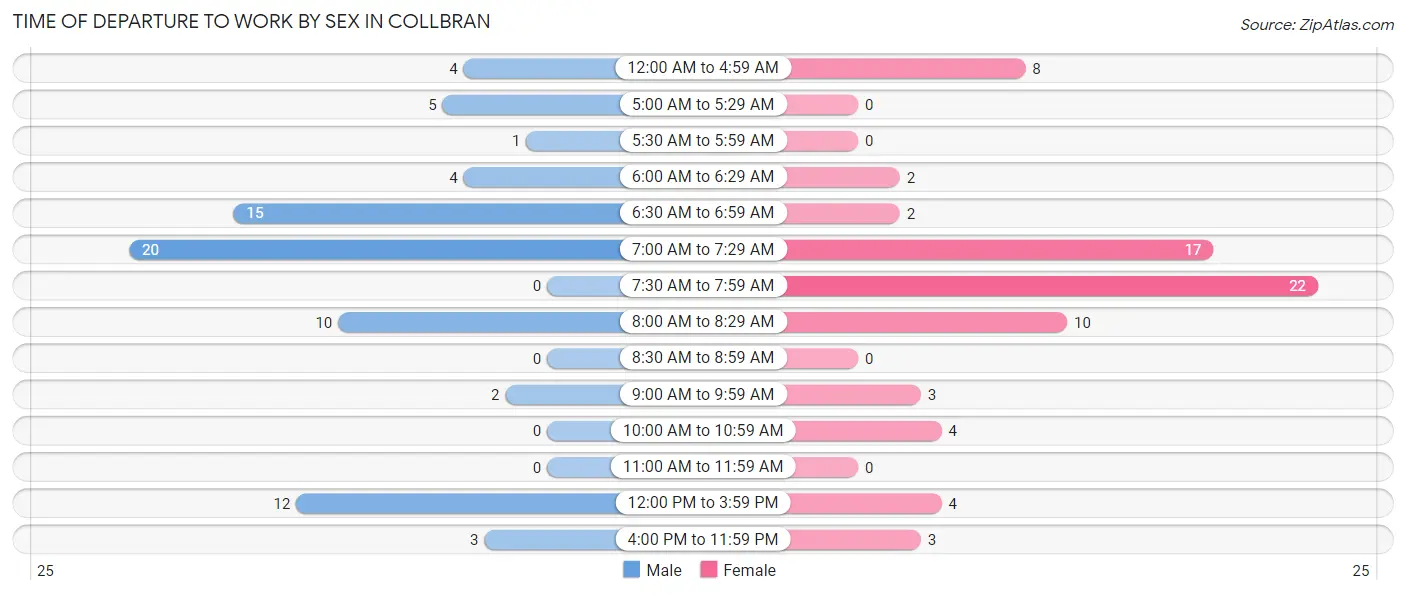
| Time of Departure | Male | Female |
| 12:00 AM to 4:59 AM | 4 (5.3%) | 8 (10.7%) |
| 5:00 AM to 5:29 AM | 5 (6.6%) | 0 (0.0%) |
| 5:30 AM to 5:59 AM | 1 (1.3%) | 0 (0.0%) |
| 6:00 AM to 6:29 AM | 4 (5.3%) | 2 (2.7%) |
| 6:30 AM to 6:59 AM | 15 (19.7%) | 2 (2.7%) |
| 7:00 AM to 7:29 AM | 20 (26.3%) | 17 (22.7%) |
| 7:30 AM to 7:59 AM | 0 (0.0%) | 22 (29.3%) |
| 8:00 AM to 8:29 AM | 10 (13.2%) | 10 (13.3%) |
| 8:30 AM to 8:59 AM | 0 (0.0%) | 0 (0.0%) |
| 9:00 AM to 9:59 AM | 2 (2.6%) | 3 (4.0%) |
| 10:00 AM to 10:59 AM | 0 (0.0%) | 4 (5.3%) |
| 11:00 AM to 11:59 AM | 0 (0.0%) | 0 (0.0%) |
| 12:00 PM to 3:59 PM | 12 (15.8%) | 4 (5.3%) |
| 4:00 PM to 11:59 PM | 3 (4.0%) | 3 (4.0%) |
| Total | 76 (100.0%) | 75 (100.0%) |
Housing Occupancy in Collbran
Occupancy by Ownership in Collbran
Of the total 147 dwellings in Collbran, owner-occupied units account for 120 (81.6%), while renter-occupied units make up 27 (18.4%).
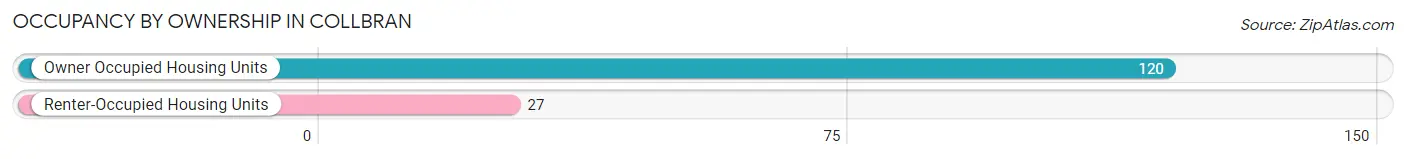
| Occupancy | # Housing Units | % Housing Units |
| Owner Occupied Housing Units | 120 | 81.6% |
| Renter-Occupied Housing Units | 27 | 18.4% |
| Total Occupied Housing Units | 147 | 100.0% |
Occupancy by Household Size in Collbran
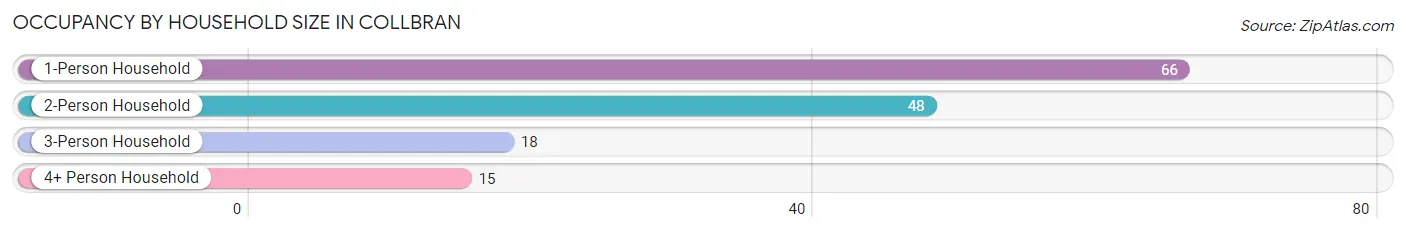
| Household Size | # Housing Units | % Housing Units |
| 1-Person Household | 66 | 44.9% |
| 2-Person Household | 48 | 32.7% |
| 3-Person Household | 18 | 12.2% |
| 4+ Person Household | 15 | 10.2% |
| Total Housing Units | 147 | 100.0% |
Occupancy by Ownership by Household Size in Collbran
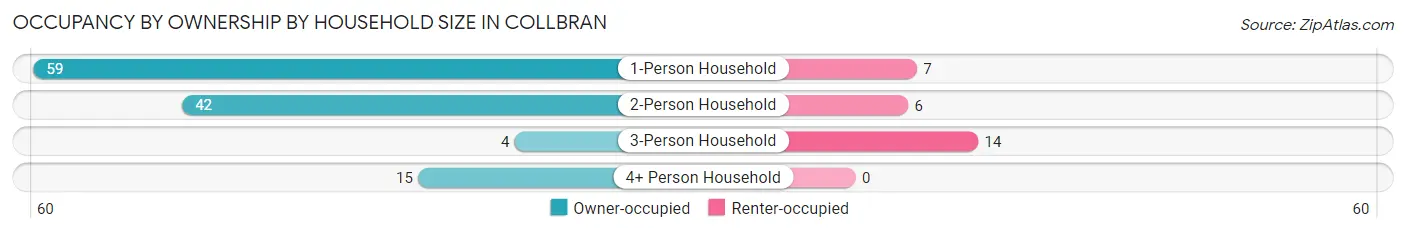
| Household Size | Owner-occupied | Renter-occupied |
| 1-Person Household | 59 (89.4%) | 7 (10.6%) |
| 2-Person Household | 42 (87.5%) | 6 (12.5%) |
| 3-Person Household | 4 (22.2%) | 14 (77.8%) |
| 4+ Person Household | 15 (100.0%) | 0 (0.0%) |
| Total Housing Units | 120 (81.6%) | 27 (18.4%) |
Occupancy by Educational Attainment in Collbran
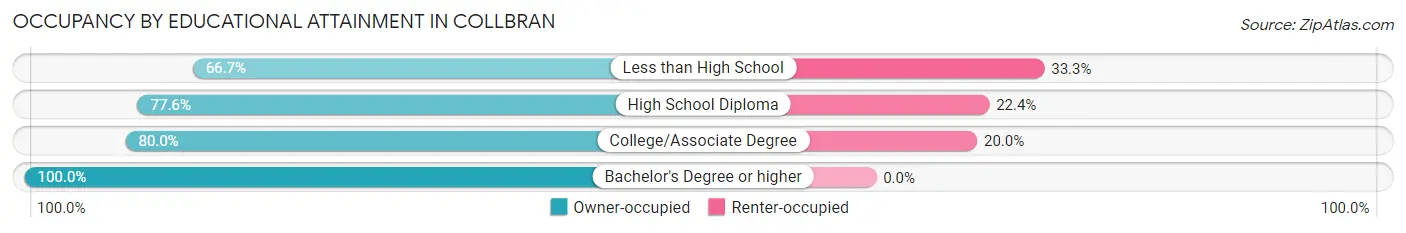
| Household Size | Owner-occupied | Renter-occupied |
| Less than High School | 4 (66.7%) | 2 (33.3%) |
| High School Diploma | 45 (77.6%) | 13 (22.4%) |
| College/Associate Degree | 48 (80.0%) | 12 (20.0%) |
| Bachelor's Degree or higher | 23 (100.0%) | 0 (0.0%) |
Occupancy by Age of Householder in Collbran
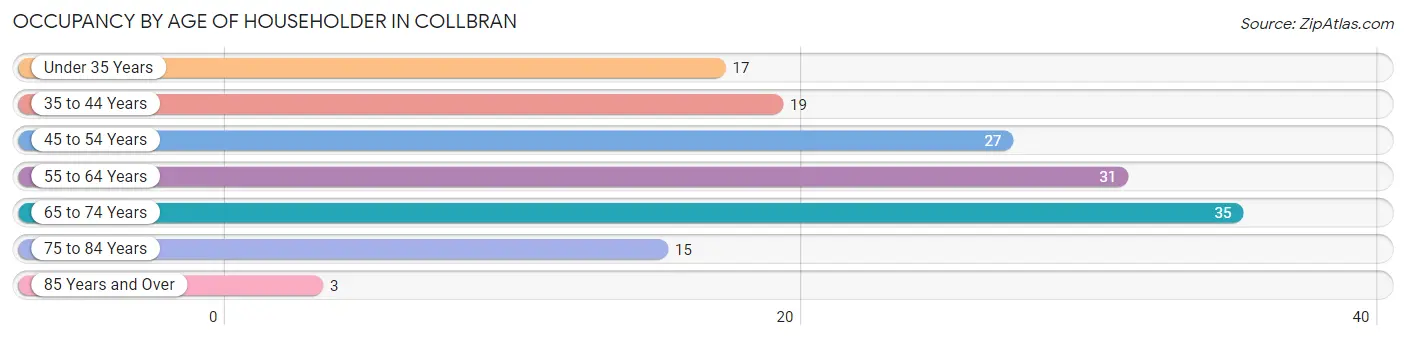
| Age Bracket | # Households | % Households |
| Under 35 Years | 17 | 11.6% |
| 35 to 44 Years | 19 | 12.9% |
| 45 to 54 Years | 27 | 18.4% |
| 55 to 64 Years | 31 | 21.1% |
| 65 to 74 Years | 35 | 23.8% |
| 75 to 84 Years | 15 | 10.2% |
| 85 Years and Over | 3 | 2.0% |
| Total | 147 | 100.0% |
Housing Finances in Collbran
Median Income by Occupancy in Collbran
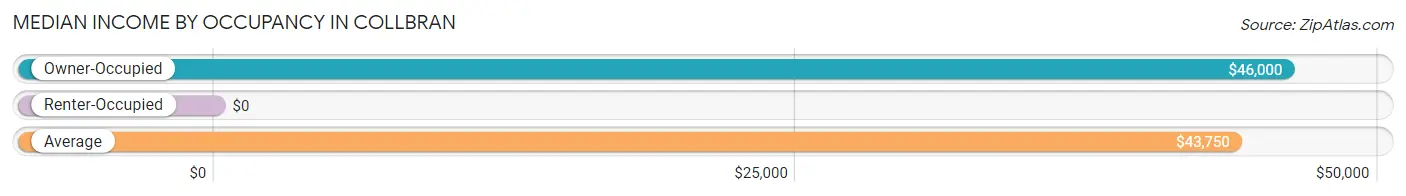
| Occupancy Type | # Households | Median Income |
| Owner-Occupied | 120 (81.6%) | $46,000 |
| Renter-Occupied | 27 (18.4%) | $0 |
| Average | 147 (100.0%) | $43,750 |
Occupancy by Householder Income Bracket in Collbran
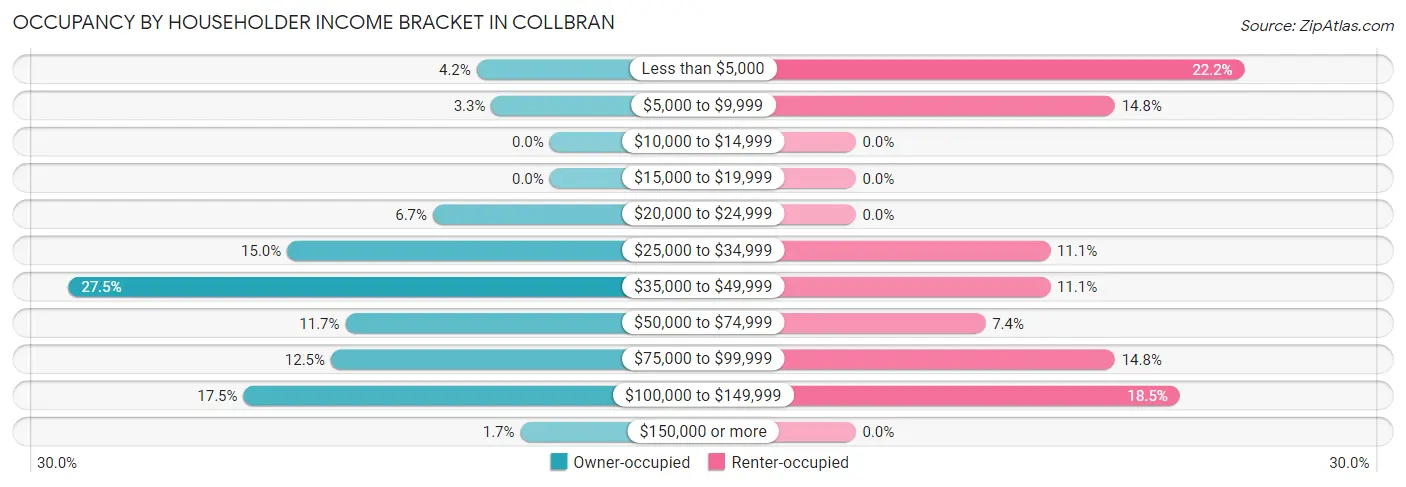
| Income Bracket | Owner-occupied | Renter-occupied |
| Less than $5,000 | 5 (4.2%) | 6 (22.2%) |
| $5,000 to $9,999 | 4 (3.3%) | 4 (14.8%) |
| $10,000 to $14,999 | 0 (0.0%) | 0 (0.0%) |
| $15,000 to $19,999 | 0 (0.0%) | 0 (0.0%) |
| $20,000 to $24,999 | 8 (6.7%) | 0 (0.0%) |
| $25,000 to $34,999 | 18 (15.0%) | 3 (11.1%) |
| $35,000 to $49,999 | 33 (27.5%) | 3 (11.1%) |
| $50,000 to $74,999 | 14 (11.7%) | 2 (7.4%) |
| $75,000 to $99,999 | 15 (12.5%) | 4 (14.8%) |
| $100,000 to $149,999 | 21 (17.5%) | 5 (18.5%) |
| $150,000 or more | 2 (1.7%) | 0 (0.0%) |
| Total | 120 (100.0%) | 27 (100.0%) |
Monthly Housing Cost Tiers in Collbran
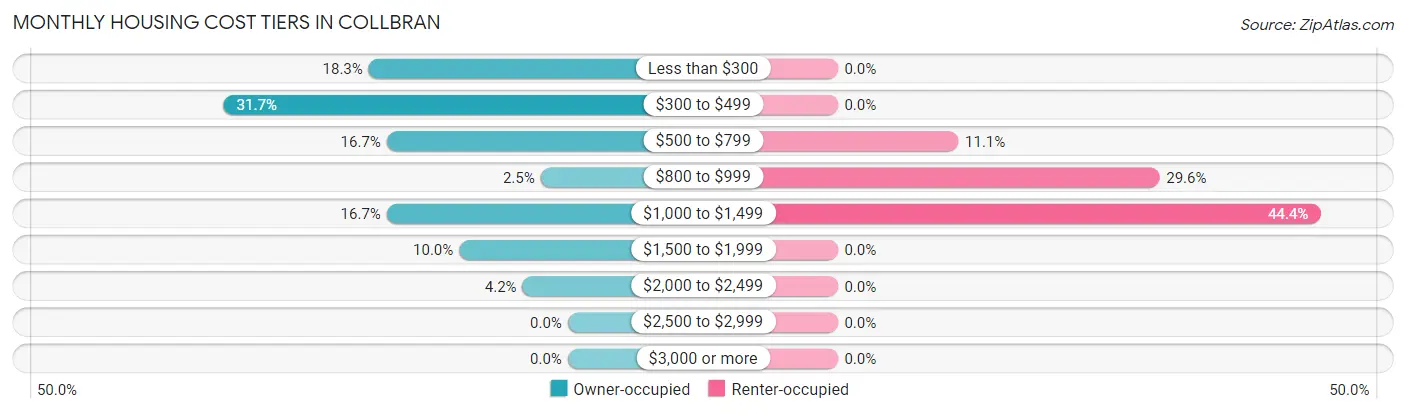
| Monthly Cost | Owner-occupied | Renter-occupied |
| Less than $300 | 22 (18.3%) | 0 (0.0%) |
| $300 to $499 | 38 (31.7%) | 0 (0.0%) |
| $500 to $799 | 20 (16.7%) | 3 (11.1%) |
| $800 to $999 | 3 (2.5%) | 8 (29.6%) |
| $1,000 to $1,499 | 20 (16.7%) | 12 (44.4%) |
| $1,500 to $1,999 | 12 (10.0%) | 0 (0.0%) |
| $2,000 to $2,499 | 5 (4.2%) | 0 (0.0%) |
| $2,500 to $2,999 | 0 (0.0%) | 0 (0.0%) |
| $3,000 or more | 0 (0.0%) | 0 (0.0%) |
| Total | 120 (100.0%) | 27 (100.0%) |
Physical Housing Characteristics in Collbran
Housing Structures in Collbran
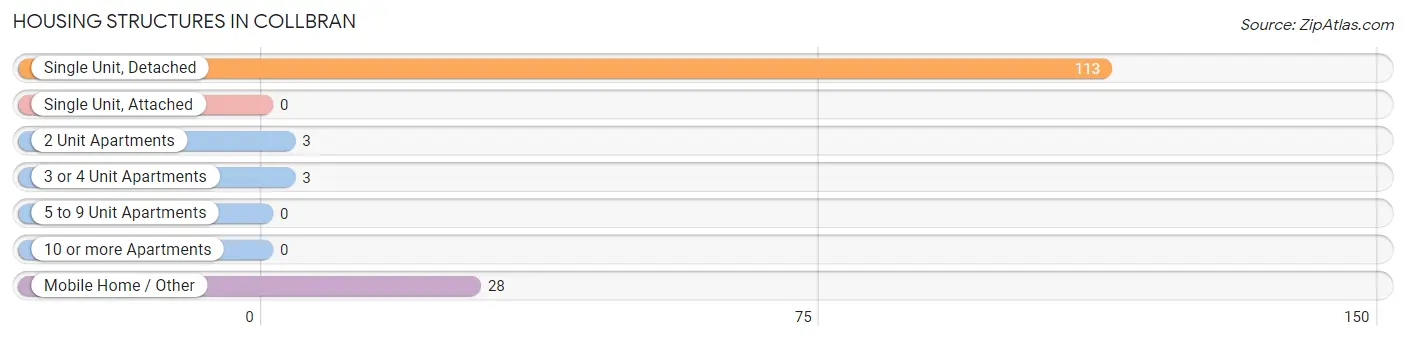
| Structure Type | # Housing Units | % Housing Units |
| Single Unit, Detached | 113 | 76.9% |
| Single Unit, Attached | 0 | 0.0% |
| 2 Unit Apartments | 3 | 2.0% |
| 3 or 4 Unit Apartments | 3 | 2.0% |
| 5 to 9 Unit Apartments | 0 | 0.0% |
| 10 or more Apartments | 0 | 0.0% |
| Mobile Home / Other | 28 | 19.1% |
| Total | 147 | 100.0% |
Housing Structures by Occupancy in Collbran
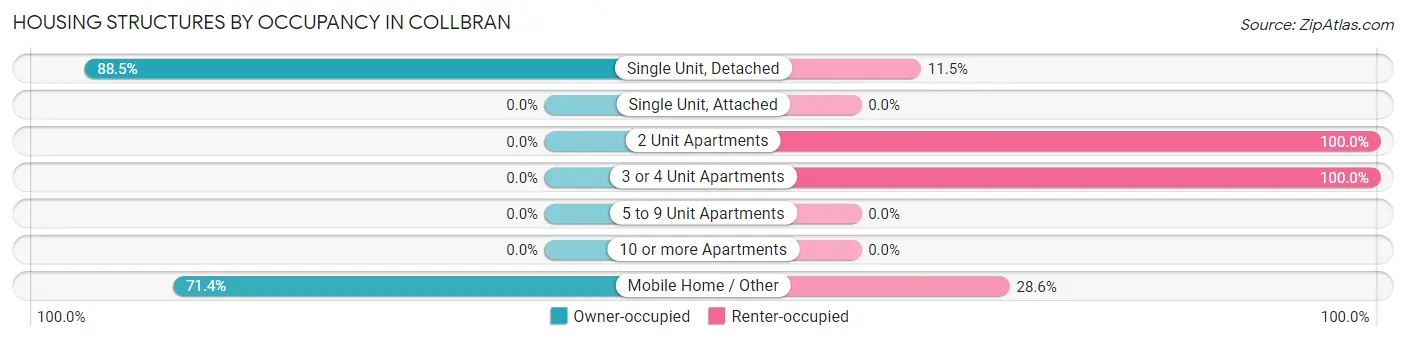
| Structure Type | Owner-occupied | Renter-occupied |
| Single Unit, Detached | 100 (88.5%) | 13 (11.5%) |
| Single Unit, Attached | 0 (0.0%) | 0 (0.0%) |
| 2 Unit Apartments | 0 (0.0%) | 3 (100.0%) |
| 3 or 4 Unit Apartments | 0 (0.0%) | 3 (100.0%) |
| 5 to 9 Unit Apartments | 0 (0.0%) | 0 (0.0%) |
| 10 or more Apartments | 0 (0.0%) | 0 (0.0%) |
| Mobile Home / Other | 20 (71.4%) | 8 (28.6%) |
| Total | 120 (81.6%) | 27 (18.4%) |
Housing Structures by Number of Rooms in Collbran
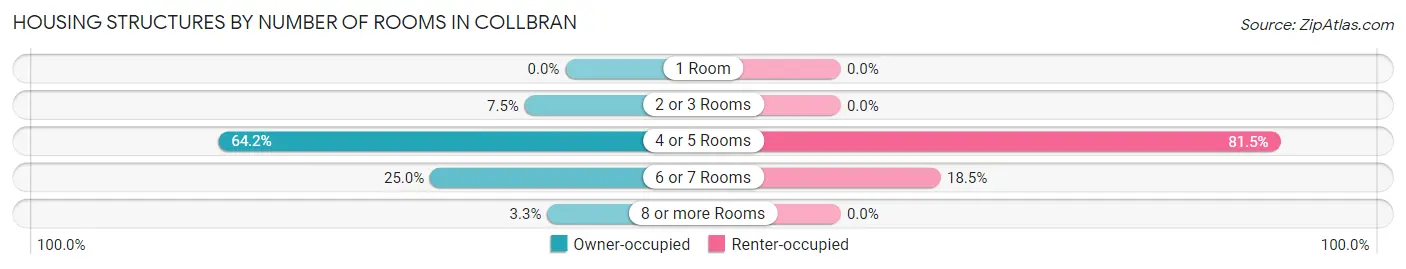
| Number of Rooms | Owner-occupied | Renter-occupied |
| 1 Room | 0 (0.0%) | 0 (0.0%) |
| 2 or 3 Rooms | 9 (7.5%) | 0 (0.0%) |
| 4 or 5 Rooms | 77 (64.2%) | 22 (81.5%) |
| 6 or 7 Rooms | 30 (25.0%) | 5 (18.5%) |
| 8 or more Rooms | 4 (3.3%) | 0 (0.0%) |
| Total | 120 (100.0%) | 27 (100.0%) |
Housing Structure by Heating Type in Collbran
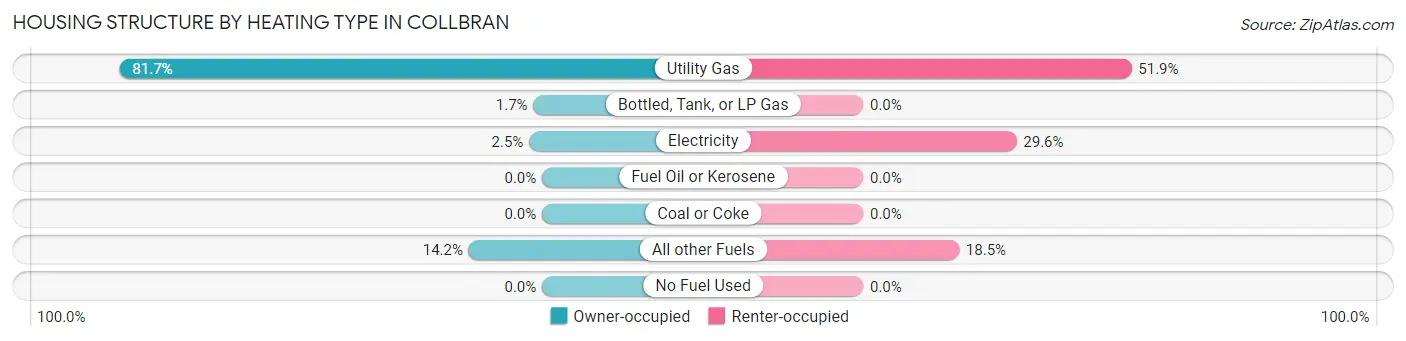
| Heating Type | Owner-occupied | Renter-occupied |
| Utility Gas | 98 (81.7%) | 14 (51.8%) |
| Bottled, Tank, or LP Gas | 2 (1.7%) | 0 (0.0%) |
| Electricity | 3 (2.5%) | 8 (29.6%) |
| Fuel Oil or Kerosene | 0 (0.0%) | 0 (0.0%) |
| Coal or Coke | 0 (0.0%) | 0 (0.0%) |
| All other Fuels | 17 (14.2%) | 5 (18.5%) |
| No Fuel Used | 0 (0.0%) | 0 (0.0%) |
| Total | 120 (100.0%) | 27 (100.0%) |
Household Vehicle Usage in Collbran
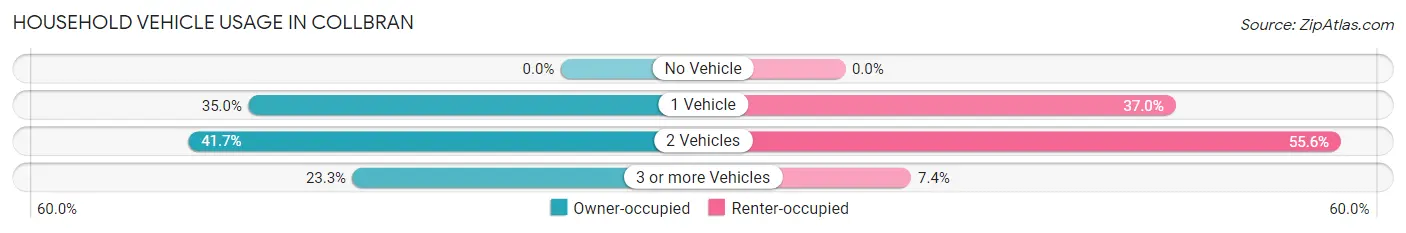
| Vehicles per Household | Owner-occupied | Renter-occupied |
| No Vehicle | 0 (0.0%) | 0 (0.0%) |
| 1 Vehicle | 42 (35.0%) | 10 (37.0%) |
| 2 Vehicles | 50 (41.7%) | 15 (55.6%) |
| 3 or more Vehicles | 28 (23.3%) | 2 (7.4%) |
| Total | 120 (100.0%) | 27 (100.0%) |
Real Estate & Mortgages in Collbran
Real Estate and Mortgage Overview in Collbran
| Characteristic | Without Mortgage | With Mortgage |
| Housing Units | 66 | 54 |
| Median Property Value | $189,300 | $185,000 |
| Median Household Income | $39,500 | $1 |
| Monthly Housing Costs | $366 | $0 |
| Real Estate Taxes | $526 | $2 |
Property Value by Mortgage Status in Collbran
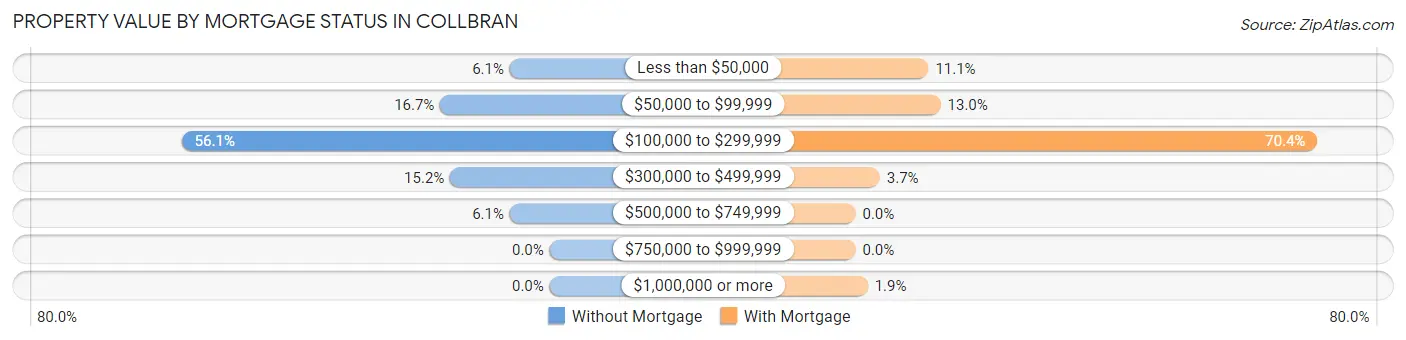
| Property Value | Without Mortgage | With Mortgage |
| Less than $50,000 | 4 (6.1%) | 6 (11.1%) |
| $50,000 to $99,999 | 11 (16.7%) | 7 (13.0%) |
| $100,000 to $299,999 | 37 (56.1%) | 38 (70.4%) |
| $300,000 to $499,999 | 10 (15.1%) | 2 (3.7%) |
| $500,000 to $749,999 | 4 (6.1%) | 0 (0.0%) |
| $750,000 to $999,999 | 0 (0.0%) | 0 (0.0%) |
| $1,000,000 or more | 0 (0.0%) | 1 (1.8%) |
| Total | 66 (100.0%) | 54 (100.0%) |
Household Income by Mortgage Status in Collbran
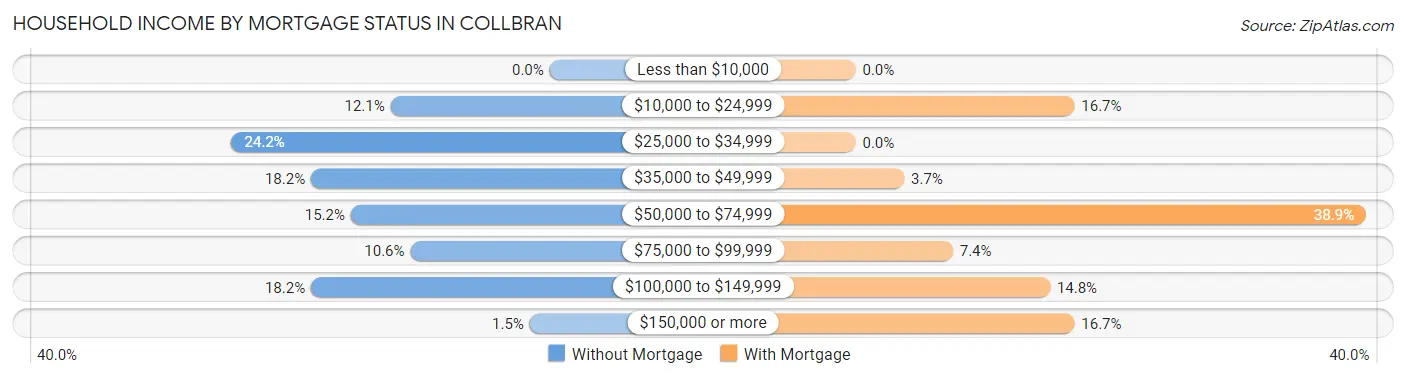
| Household Income | Without Mortgage | With Mortgage |
| Less than $10,000 | 0 (0.0%) | 0 (0.0%) |
| $10,000 to $24,999 | 8 (12.1%) | 9 (16.7%) |
| $25,000 to $34,999 | 16 (24.2%) | 0 (0.0%) |
| $35,000 to $49,999 | 12 (18.2%) | 2 (3.7%) |
| $50,000 to $74,999 | 10 (15.1%) | 21 (38.9%) |
| $75,000 to $99,999 | 7 (10.6%) | 4 (7.4%) |
| $100,000 to $149,999 | 12 (18.2%) | 8 (14.8%) |
| $150,000 or more | 1 (1.5%) | 9 (16.7%) |
| Total | 66 (100.0%) | 54 (100.0%) |
Property Value to Household Income Ratio in Collbran
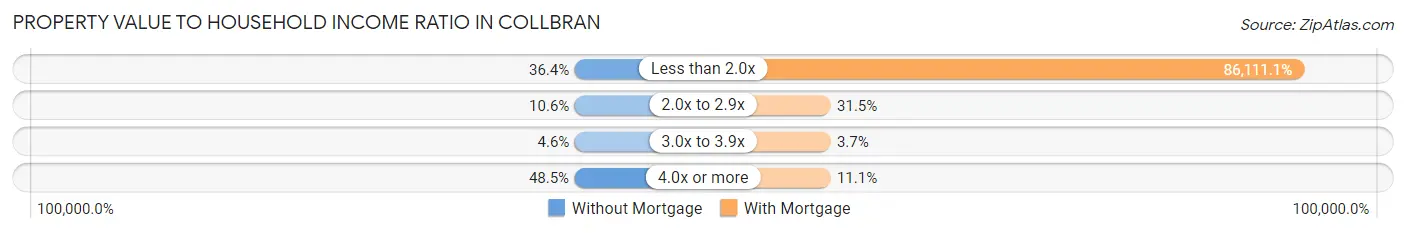
| Value-to-Income Ratio | Without Mortgage | With Mortgage |
| Less than 2.0x | 24 (36.4%) | 46,500 (86,111.1%) |
| 2.0x to 2.9x | 7 (10.6%) | 17 (31.5%) |
| 3.0x to 3.9x | 3 (4.5%) | 2 (3.7%) |
| 4.0x or more | 32 (48.5%) | 6 (11.1%) |
| Total | 66 (100.0%) | 54 (100.0%) |
Real Estate Taxes by Mortgage Status in Collbran
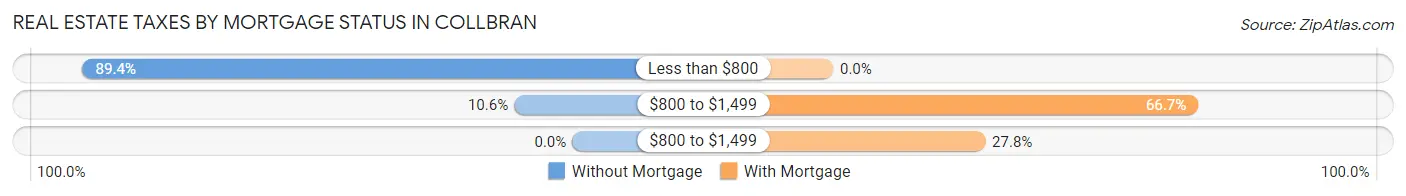
| Property Taxes | Without Mortgage | With Mortgage |
| Less than $800 | 59 (89.4%) | 0 (0.0%) |
| $800 to $1,499 | 7 (10.6%) | 36 (66.7%) |
| $800 to $1,499 | 0 (0.0%) | 15 (27.8%) |
| Total | 66 (100.0%) | 54 (100.0%) |
Health & Disability in Collbran
Health Insurance Coverage by Age in Collbran
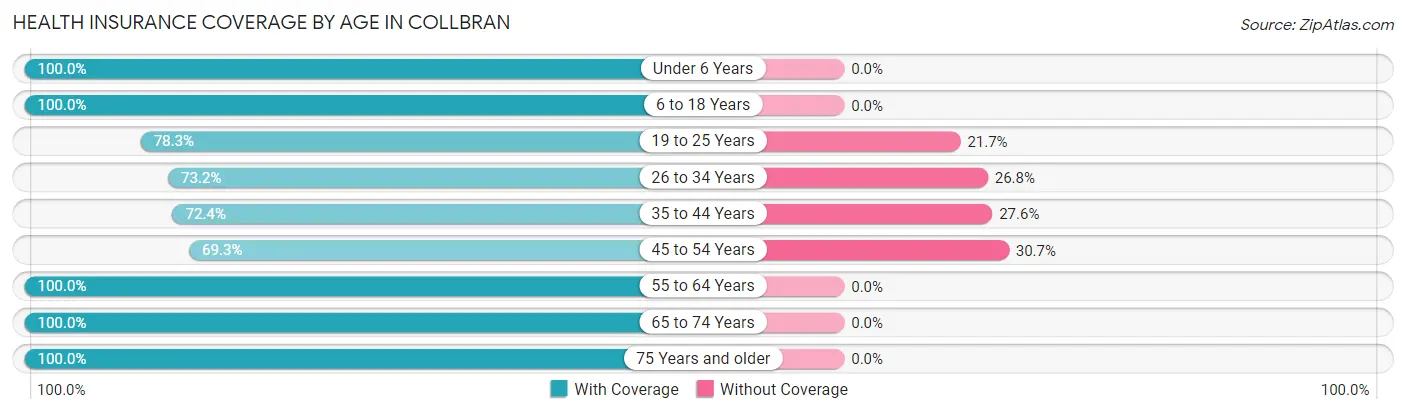
| Age Bracket | With Coverage | Without Coverage |
| Under 6 Years | 19 (100.0%) | 0 (0.0%) |
| 6 to 18 Years | 127 (100.0%) | 0 (0.0%) |
| 19 to 25 Years | 170 (78.3%) | 47 (21.7%) |
| 26 to 34 Years | 52 (73.2%) | 19 (26.8%) |
| 35 to 44 Years | 21 (72.4%) | 8 (27.6%) |
| 45 to 54 Years | 52 (69.3%) | 23 (30.7%) |
| 55 to 64 Years | 45 (100.0%) | 0 (0.0%) |
| 65 to 74 Years | 45 (100.0%) | 0 (0.0%) |
| 75 Years and older | 19 (100.0%) | 0 (0.0%) |
| Total | 550 (85.0%) | 97 (15.0%) |
Health Insurance Coverage by Citizenship Status in Collbran
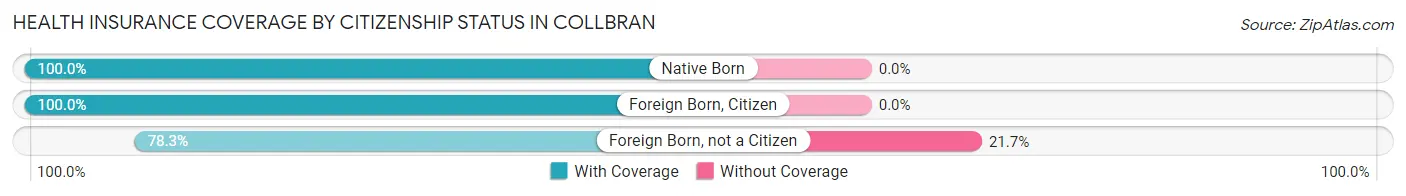
| Citizenship Status | With Coverage | Without Coverage |
| Native Born | 19 (100.0%) | 0 (0.0%) |
| Foreign Born, Citizen | 127 (100.0%) | 0 (0.0%) |
| Foreign Born, not a Citizen | 170 (78.3%) | 47 (21.7%) |
Health Insurance Coverage by Household Income in Collbran
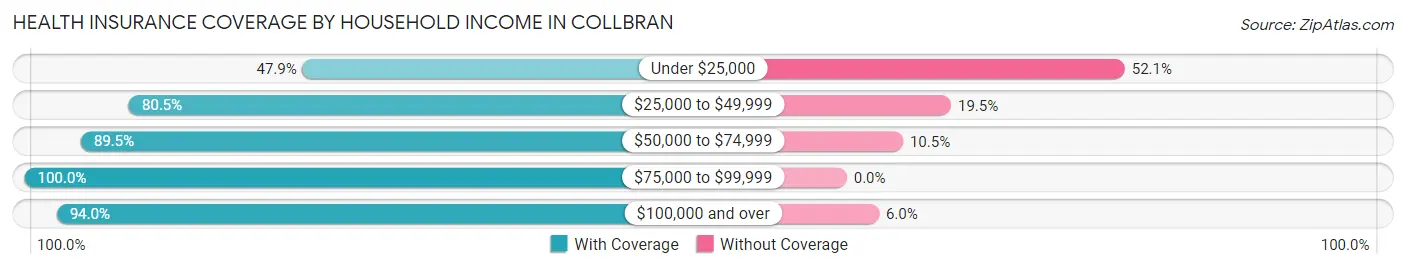
| Household Income | With Coverage | Without Coverage |
| Under $25,000 | 23 (47.9%) | 25 (52.1%) |
| $25,000 to $49,999 | 70 (80.5%) | 17 (19.5%) |
| $50,000 to $74,999 | 17 (89.5%) | 2 (10.5%) |
| $75,000 to $99,999 | 52 (100.0%) | 0 (0.0%) |
| $100,000 and over | 78 (94.0%) | 5 (6.0%) |
Public vs Private Health Insurance Coverage by Age in Collbran
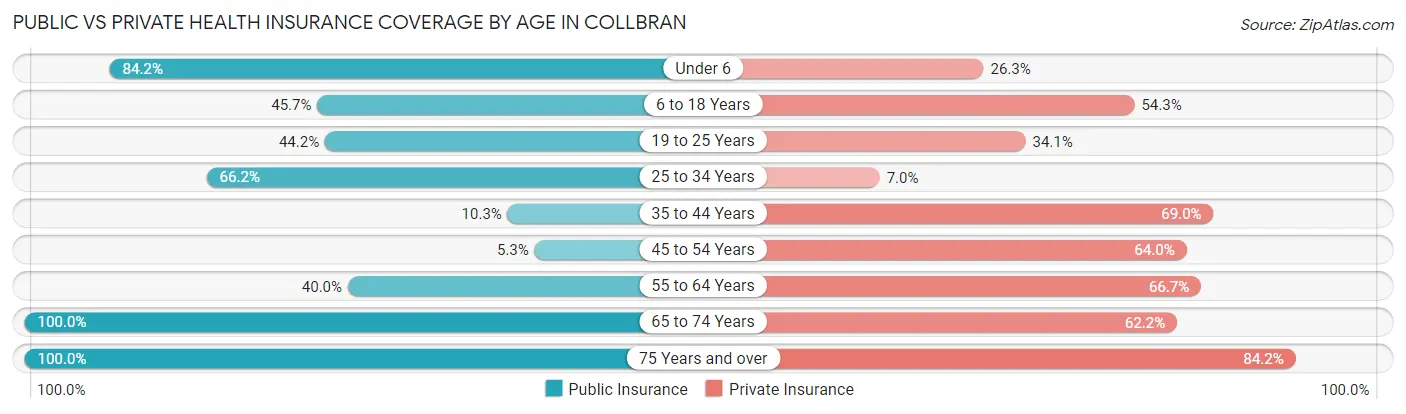
| Age Bracket | Public Insurance | Private Insurance |
| Under 6 | 16 (84.2%) | 5 (26.3%) |
| 6 to 18 Years | 58 (45.7%) | 69 (54.3%) |
| 19 to 25 Years | 96 (44.2%) | 74 (34.1%) |
| 25 to 34 Years | 47 (66.2%) | 5 (7.0%) |
| 35 to 44 Years | 3 (10.3%) | 20 (69.0%) |
| 45 to 54 Years | 4 (5.3%) | 48 (64.0%) |
| 55 to 64 Years | 18 (40.0%) | 30 (66.7%) |
| 65 to 74 Years | 45 (100.0%) | 28 (62.2%) |
| 75 Years and over | 19 (100.0%) | 16 (84.2%) |
| Total | 306 (47.3%) | 295 (45.6%) |
Disability Status by Sex by Age in Collbran
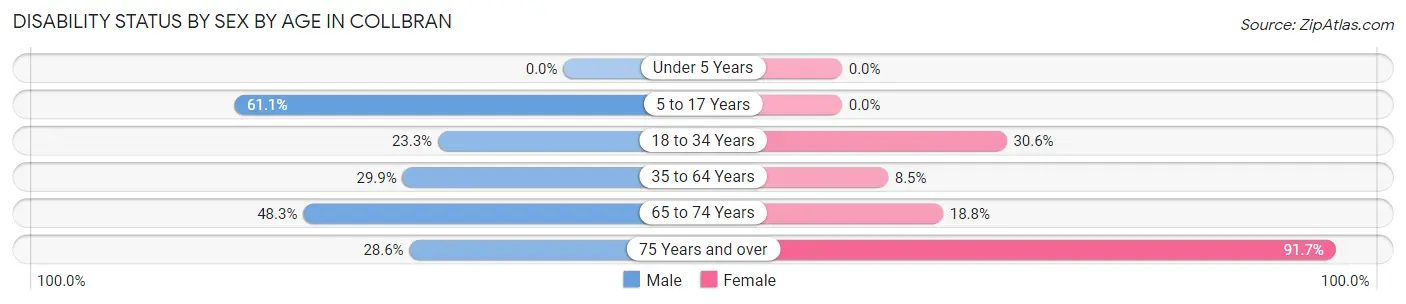
| Age Bracket | Male | Female |
| Under 5 Years | 0 (0.0%) | 0 (0.0%) |
| 5 to 17 Years | 22 (61.1%) | 0 (0.0%) |
| 18 to 34 Years | 54 (23.3%) | 33 (30.6%) |
| 35 to 64 Years | 20 (29.8%) | 7 (8.5%) |
| 65 to 74 Years | 14 (48.3%) | 3 (18.8%) |
| 75 Years and over | 2 (28.6%) | 11 (91.7%) |
Disability Class by Sex by Age in Collbran
Disability Class: Hearing Difficulty
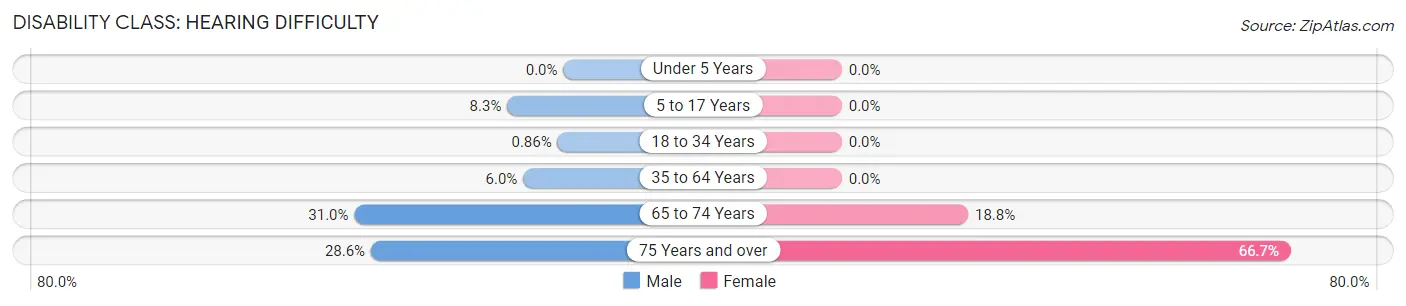
| Age Bracket | Male | Female |
| Under 5 Years | 0 (0.0%) | 0 (0.0%) |
| 5 to 17 Years | 3 (8.3%) | 0 (0.0%) |
| 18 to 34 Years | 2 (0.9%) | 0 (0.0%) |
| 35 to 64 Years | 4 (6.0%) | 0 (0.0%) |
| 65 to 74 Years | 9 (31.0%) | 3 (18.8%) |
| 75 Years and over | 2 (28.6%) | 8 (66.7%) |
Disability Class: Vision Difficulty
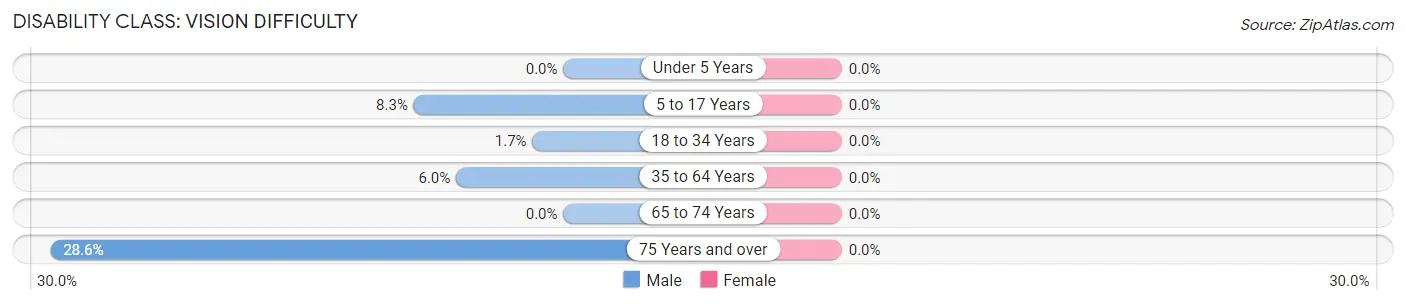
| Age Bracket | Male | Female |
| Under 5 Years | 0 (0.0%) | 0 (0.0%) |
| 5 to 17 Years | 3 (8.3%) | 0 (0.0%) |
| 18 to 34 Years | 4 (1.7%) | 0 (0.0%) |
| 35 to 64 Years | 4 (6.0%) | 0 (0.0%) |
| 65 to 74 Years | 0 (0.0%) | 0 (0.0%) |
| 75 Years and over | 2 (28.6%) | 0 (0.0%) |
Disability Class: Cognitive Difficulty
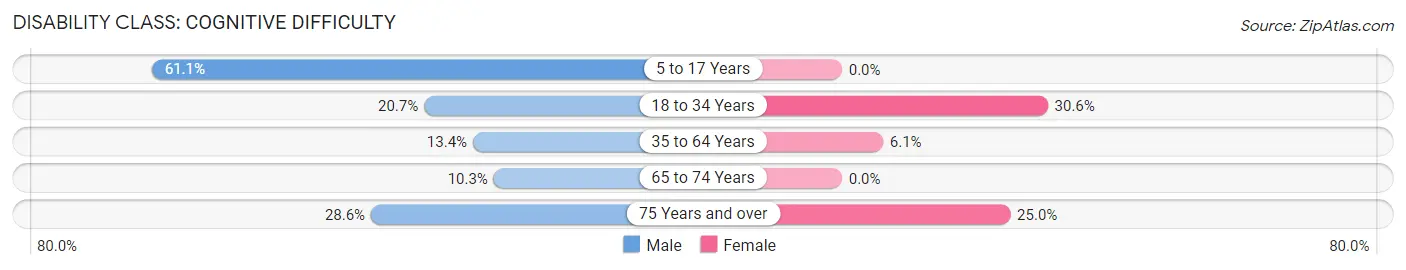
| Age Bracket | Male | Female |
| 5 to 17 Years | 22 (61.1%) | 0 (0.0%) |
| 18 to 34 Years | 48 (20.7%) | 33 (30.6%) |
| 35 to 64 Years | 9 (13.4%) | 5 (6.1%) |
| 65 to 74 Years | 3 (10.3%) | 0 (0.0%) |
| 75 Years and over | 2 (28.6%) | 3 (25.0%) |
Disability Class: Ambulatory Difficulty
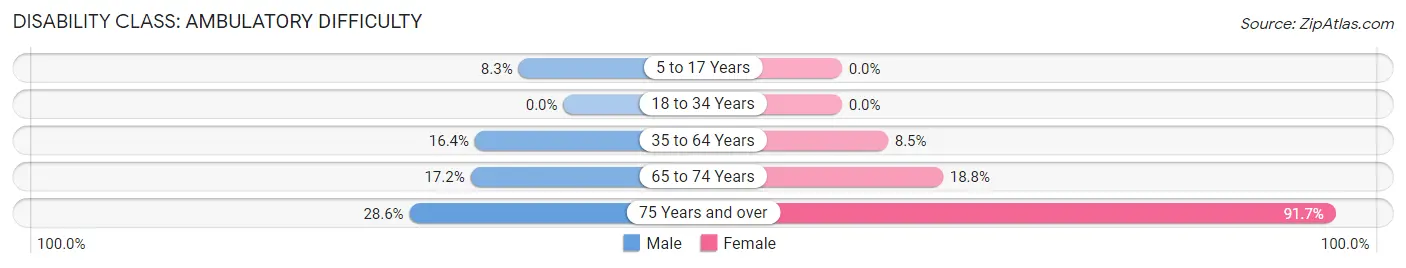
| Age Bracket | Male | Female |
| 5 to 17 Years | 3 (8.3%) | 0 (0.0%) |
| 18 to 34 Years | 0 (0.0%) | 0 (0.0%) |
| 35 to 64 Years | 11 (16.4%) | 7 (8.5%) |
| 65 to 74 Years | 5 (17.2%) | 3 (18.8%) |
| 75 Years and over | 2 (28.6%) | 11 (91.7%) |
Disability Class: Self-Care Difficulty
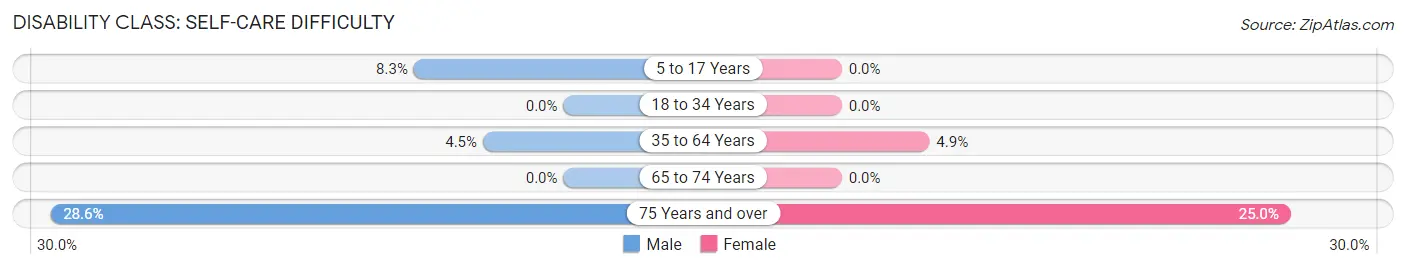
| Age Bracket | Male | Female |
| 5 to 17 Years | 3 (8.3%) | 0 (0.0%) |
| 18 to 34 Years | 0 (0.0%) | 0 (0.0%) |
| 35 to 64 Years | 3 (4.5%) | 4 (4.9%) |
| 65 to 74 Years | 0 (0.0%) | 0 (0.0%) |
| 75 Years and over | 2 (28.6%) | 3 (25.0%) |
Technology Access in Collbran
Computing Device Access in Collbran
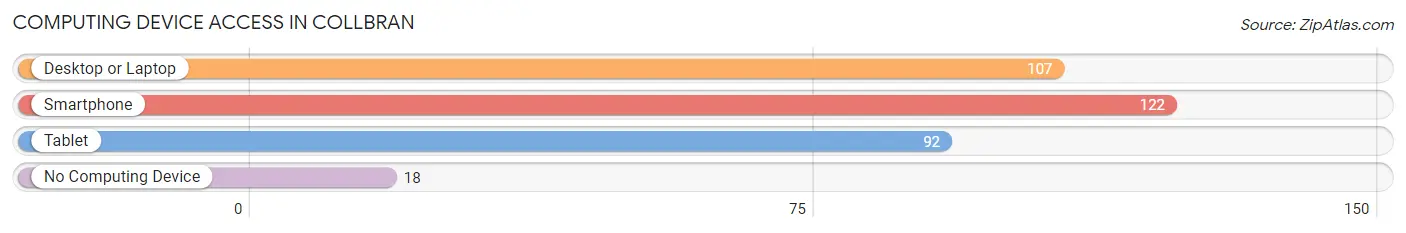
| Device Type | # Households | % Households |
| Desktop or Laptop | 107 | 72.8% |
| Smartphone | 122 | 83.0% |
| Tablet | 92 | 62.6% |
| No Computing Device | 18 | 12.2% |
| Total | 147 | 100.0% |
Internet Access in Collbran
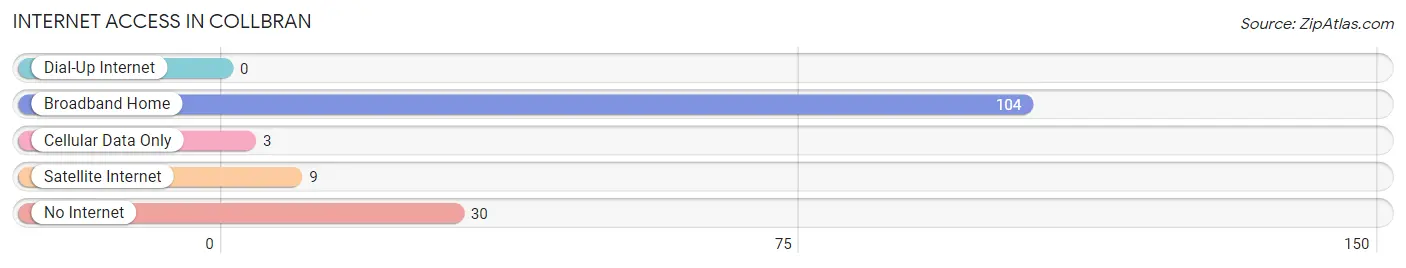
| Internet Type | # Households | % Households |
| Dial-Up Internet | 0 | 0.0% |
| Broadband Home | 104 | 70.8% |
| Cellular Data Only | 3 | 2.0% |
| Satellite Internet | 9 | 6.1% |
| No Internet | 30 | 20.4% |
| Total | 147 | 100.0% |
Collbran Summary
Collbran is a small town located in Mesa County, Colorado, United States. It is situated in the Grand Valley, at the base of the Grand Mesa, and is surrounded by the Plateau Creek and the Gunnison River. The town was founded in 1883 and has a population of approximately 500 people.
Geography
Collbran is located in the Grand Valley of western Colorado, at the base of the Grand Mesa. The town is situated at an elevation of 5,845 feet (1,782 m) and is surrounded by the Plateau Creek and the Gunnison River. The town is located in a semi-arid climate, with hot summers and cold winters. The average annual precipitation is approximately 11 inches (279 mm).
The town is located in Mesa County, which is the largest county in Colorado. The county is home to several national parks and monuments, including the Colorado National Monument, the Black Canyon of the Gunnison National Park, and the Curecanti National Recreation Area.
History
Collbran was founded in 1883 by a group of settlers from the nearby town of Grand Junction. The town was named after the Collbran family, who were among the first settlers in the area. The town was originally a farming and ranching community, and the local economy was largely based on agriculture.
In the early 1900s, the town began to experience a period of growth and development. The town was incorporated in 1909, and the first school was built in 1910. The town also had a post office, a bank, and a newspaper.
In the 1920s, the town experienced a period of decline due to the Great Depression. However, the town began to experience a resurgence in the 1940s, when the local economy began to diversify. The town was home to several businesses, including a sawmill, a lumberyard, and a dairy.
Economy
The economy of Collbran is largely based on agriculture and tourism. The town is home to several farms and ranches, and the local economy is supported by the production of hay, alfalfa, and other crops. The town is also home to several tourist attractions, including the Grand Mesa National Forest, the Colorado National Monument, and the Curecanti National Recreation Area.
The town is also home to several businesses, including a sawmill, a lumberyard, and a dairy. The town is also home to several restaurants, bars, and other businesses.
Demographics
As of the 2010 census, the population of Collbran was 498. The racial makeup of the town was 97.2% White, 0.2% African American, 0.2% Native American, 0.2% Asian, 0.2% from other races, and 1.8% from two or more races. Hispanic or Latino of any race were 1.2% of the population.
The median income for a household in the town was $37,500, and the median income for a family was $41,250. The per capita income for the town was $17,845. About 11.2% of families and 13.2% of the population were below the poverty line, including 16.7% of those under age 18 and 8.3% of those age 65 or over.
Common Questions
What is Per Capita Income in Collbran?
Per Capita income in Collbran is $18,194.
What is the Median Family Income in Collbran?
Median Family Income in Collbran is $83,036.
What is the Median Household income in Collbran?
Median Household Income in Collbran is $43,750.
What is Inequality or Gini Index in Collbran?
Inequality or Gini Index in Collbran is 0.38.
What is the Total Population of Collbran?
Total Population of Collbran is 647.
What is the Total Male Population of Collbran?
Total Male Population of Collbran is 387.
What is the Total Female Population of Collbran?
Total Female Population of Collbran is 260.
What is the Ratio of Males per 100 Females in Collbran?
There are 148.85 Males per 100 Females in Collbran.
What is the Ratio of Females per 100 Males in Collbran?
There are 67.18 Females per 100 Males in Collbran.
What is the Median Population Age in Collbran?
Median Population Age in Collbran is 24.1 Years.
What is the Average Family Size in Collbran
Average Family Size in Collbran is 2.7 People.
What is the Average Household Size in Collbran
Average Household Size in Collbran is 2.0 People.
How Large is the Labor Force in Collbran?
There are 239 People in the Labor Forcein in Collbran.
What is the Percentage of People in the Labor Force in Collbran?
40.1% of People are in the Labor Force in Collbran.
What is the Unemployment Rate in Collbran?
Unemployment Rate in Collbran is 36.4%.