Cedaredge, CO Map & Demographics
Cedaredge Map
Cedaredge Overview
$27,104
PER CAPITA INCOME
$51,657
AVG FAMILY INCOME
$40,395
AVG HOUSEHOLD INCOME
50.5%
WAGE / INCOME GAP [ % ]
49.5¢/ $1
WAGE / INCOME GAP [ $ ]
0.43
INEQUALITY / GINI INDEX
2,572
TOTAL POPULATION
1,186
MALE POPULATION
1,386
FEMALE POPULATION
85.57
MALES / 100 FEMALES
116.86
FEMALES / 100 MALES
51.3
MEDIAN AGE
2.9
AVG FAMILY SIZE
2.1
AVG HOUSEHOLD SIZE
1,082
LABOR FORCE [ PEOPLE ]
51.1%
PERCENT IN LABOR FORCE
12.8%
UNEMPLOYMENT RATE
Cedaredge Zip Codes
Cedaredge Area Codes
Income in Cedaredge
Income Overview in Cedaredge
Per Capita Income in Cedaredge is $27,104, while median incomes of families and households are $51,657 and $40,395 respectively.
| Characteristic | Number | Measure |
| Per Capita Income | 2,572 | $27,104 |
| Median Family Income | 621 | $51,657 |
| Mean Family Income | 621 | $67,385 |
| Median Household Income | 1,214 | $40,395 |
| Mean Household Income | 1,214 | $57,382 |
| Income Deficit | 621 | $0 |
| Wage / Income Gap (%) | 2,572 | 50.49% |
| Wage / Income Gap ($) | 2,572 | 49.51¢ per $1 |
| Gini / Inequality Index | 2,572 | 0.43 |
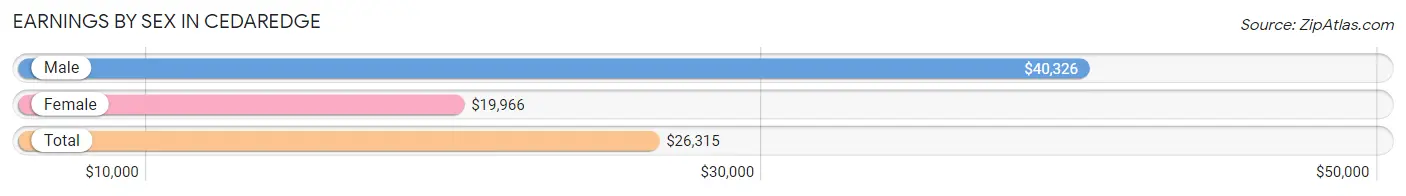
Earnings by Sex in Cedaredge
Average Earnings in Cedaredge are $26,315, $40,326 for men and $19,966 for women, a difference of 50.5%.
| Sex | Number | Average Earnings |
| Male | 584 (51.9%) | $40,326 |
| Female | 541 (48.1%) | $19,966 |
| Total | 1,125 (100.0%) | $26,315 |
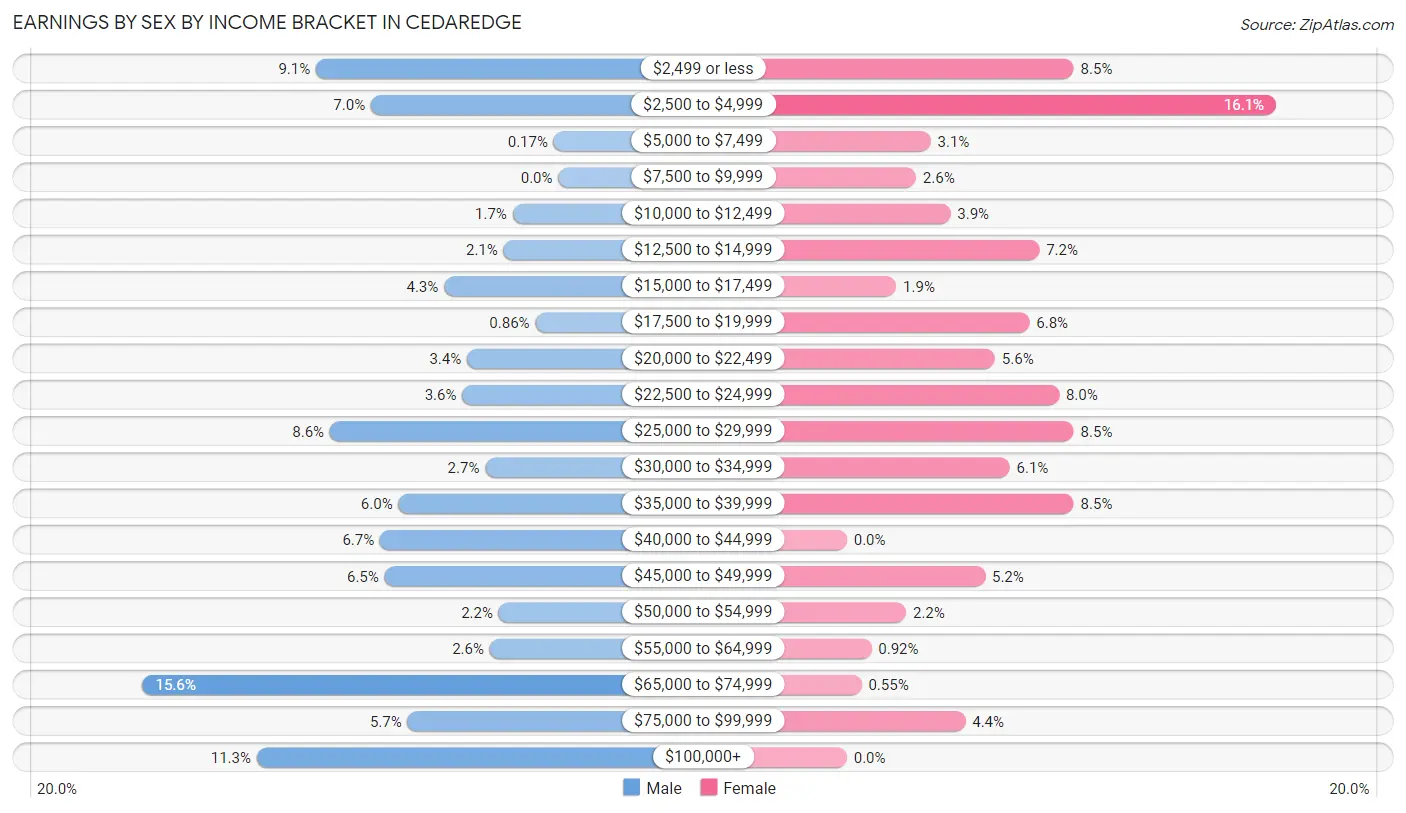
Earnings by Sex by Income Bracket in Cedaredge
The most common earnings brackets in Cedaredge are $65,000 to $74,999 for men (91 | 15.6%) and $2,500 to $4,999 for women (87 | 16.1%).
| Income | Male | Female |
| $2,499 or less | 53 (9.1%) | 46 (8.5%) |
| $2,500 to $4,999 | 41 (7.0%) | 87 (16.1%) |
| $5,000 to $7,499 | 1 (0.2%) | 17 (3.1%) |
| $7,500 to $9,999 | 0 (0.0%) | 14 (2.6%) |
| $10,000 to $12,499 | 10 (1.7%) | 21 (3.9%) |
| $12,500 to $14,999 | 12 (2.1%) | 39 (7.2%) |
| $15,000 to $17,499 | 25 (4.3%) | 10 (1.8%) |
| $17,500 to $19,999 | 5 (0.9%) | 37 (6.8%) |
| $20,000 to $22,499 | 20 (3.4%) | 30 (5.6%) |
| $22,500 to $24,999 | 21 (3.6%) | 43 (8.0%) |
| $25,000 to $29,999 | 50 (8.6%) | 46 (8.5%) |
| $30,000 to $34,999 | 16 (2.7%) | 33 (6.1%) |
| $35,000 to $39,999 | 35 (6.0%) | 46 (8.5%) |
| $40,000 to $44,999 | 39 (6.7%) | 0 (0.0%) |
| $45,000 to $49,999 | 38 (6.5%) | 28 (5.2%) |
| $50,000 to $54,999 | 13 (2.2%) | 12 (2.2%) |
| $55,000 to $64,999 | 15 (2.6%) | 5 (0.9%) |
| $65,000 to $74,999 | 91 (15.6%) | 3 (0.5%) |
| $75,000 to $99,999 | 33 (5.7%) | 24 (4.4%) |
| $100,000+ | 66 (11.3%) | 0 (0.0%) |
| Total | 584 (100.0%) | 541 (100.0%) |
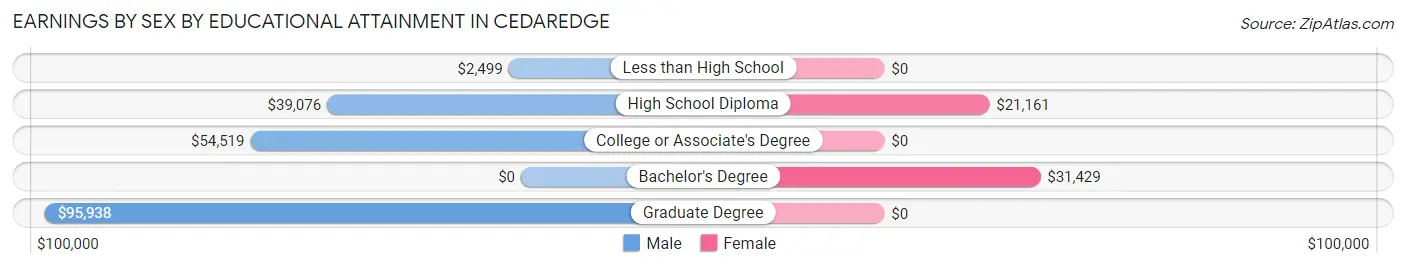
Earnings by Sex by Educational Attainment in Cedaredge
Average earnings in Cedaredge are $42,188 for men and $21,458 for women, a difference of 49.1%. Men with an educational attainment of graduate degree enjoy the highest average annual earnings of $95,938, while those with less than high school education earn the least with $2,499. Women with an educational attainment of bachelor's degree earn the most with the average annual earnings of $31,429, while those with high school diploma education have the smallest earnings of $21,161.
| Educational Attainment | Male Income | Female Income |
| Less than High School | $2,499 | $0 |
| High School Diploma | $39,076 | $21,161 |
| College or Associate's Degree | $54,519 | $0 |
| Bachelor's Degree | - | - |
| Graduate Degree | $95,938 | $0 |
| Total | $42,188 | $21,458 |
Family Income in Cedaredge
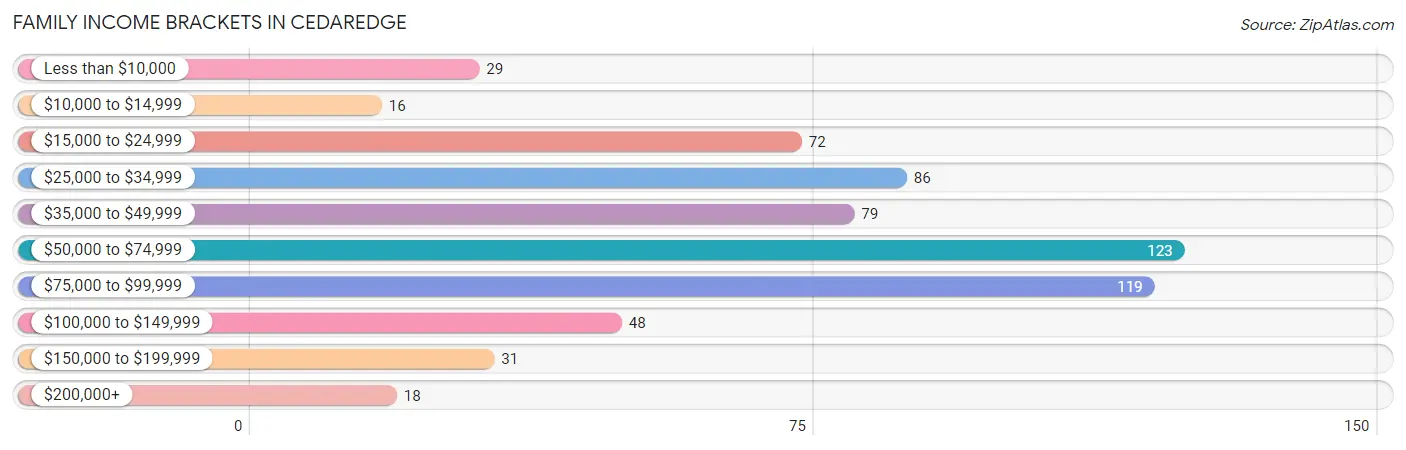
Family Income Brackets in Cedaredge
According to the Cedaredge family income data, there are 123 families falling into the $50,000 to $74,999 income range, which is the most common income bracket and makes up 19.8% of all families. Conversely, the $10,000 to $14,999 income bracket is the least frequent group with only 16 families (2.6%) belonging to this category.
| Income Bracket | # Families | % Families |
| Less than $10,000 | 29 | 4.7% |
| $10,000 to $14,999 | 16 | 2.6% |
| $15,000 to $24,999 | 72 | 11.6% |
| $25,000 to $34,999 | 86 | 13.8% |
| $35,000 to $49,999 | 79 | 12.7% |
| $50,000 to $74,999 | 123 | 19.8% |
| $75,000 to $99,999 | 119 | 19.2% |
| $100,000 to $149,999 | 48 | 7.7% |
| $150,000 to $199,999 | 31 | 5.0% |
| $200,000+ | 18 | 2.9% |
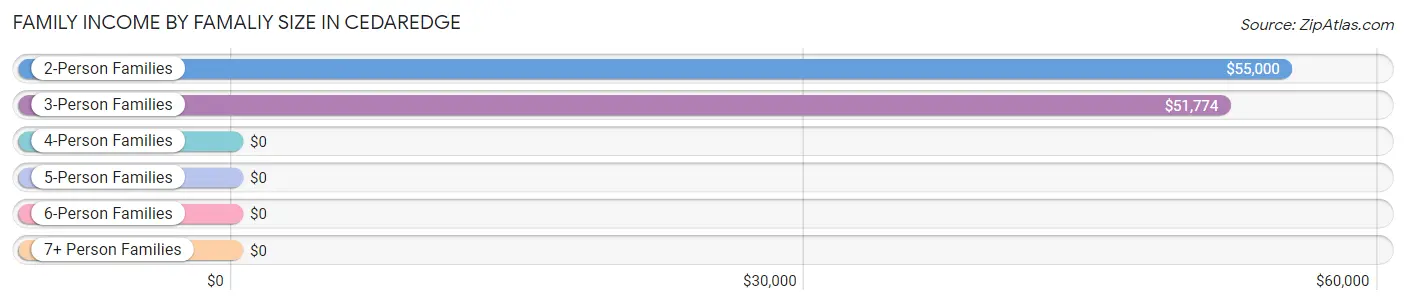
Family Income by Famaliy Size in Cedaredge
2-person families (330 | 53.1%) account for the highest median family income in Cedaredge with $55,000 per family, while 2-person families (330 | 53.1%) have the highest median income of $27,500 per family member.
| Income Bracket | # Families | Median Income |
| 2-Person Families | 330 (53.1%) | $55,000 |
| 3-Person Families | 126 (20.3%) | $51,774 |
| 4-Person Families | 78 (12.6%) | $0 |
| 5-Person Families | 80 (12.9%) | $0 |
| 6-Person Families | 7 (1.1%) | $0 |
| 7+ Person Families | 0 (0.0%) | $0 |
| Total | 621 (100.0%) | $51,657 |
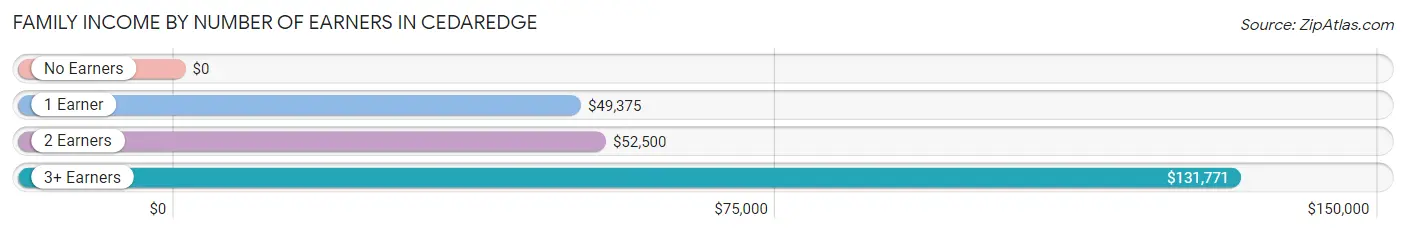
Family Income by Number of Earners in Cedaredge
| Number of Earners | # Families | Median Income |
| No Earners | 162 (26.1%) | $0 |
| 1 Earner | 216 (34.8%) | $49,375 |
| 2 Earners | 212 (34.1%) | $52,500 |
| 3+ Earners | 31 (5.0%) | $131,771 |
| Total | 621 (100.0%) | $51,657 |
Household Income in Cedaredge
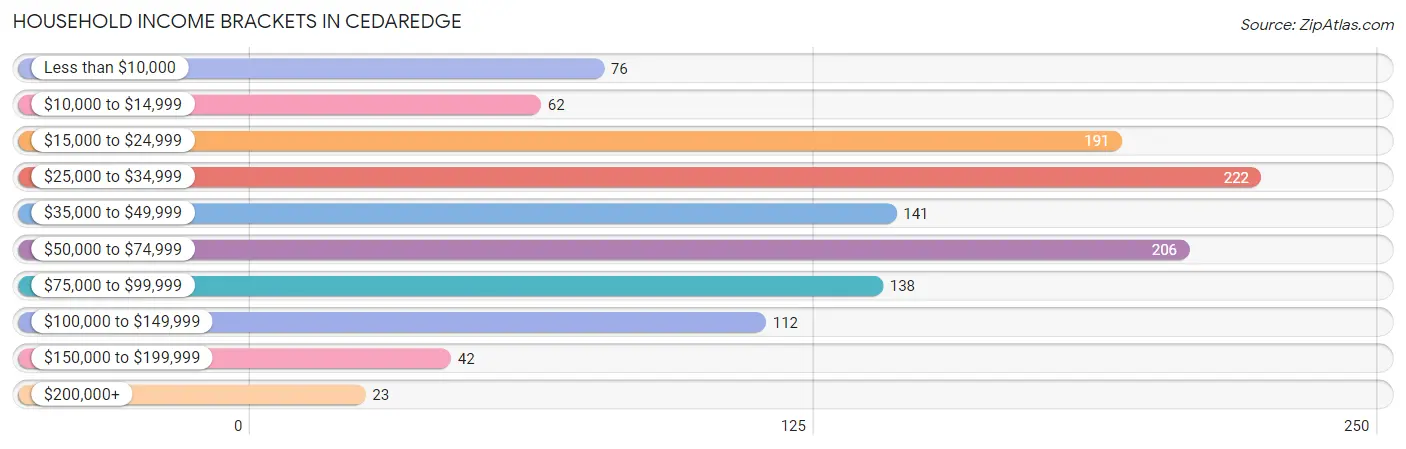
Household Income Brackets in Cedaredge
With 222 households falling in the category, the $25,000 to $34,999 income range is the most frequent in Cedaredge, accounting for 18.3% of all households. In contrast, only 23 households (1.9%) fall into the $200,000+ income bracket, making it the least populous group.
| Income Bracket | # Households | % Households |
| Less than $10,000 | 76 | 6.3% |
| $10,000 to $14,999 | 62 | 5.1% |
| $15,000 to $24,999 | 191 | 15.7% |
| $25,000 to $34,999 | 222 | 18.3% |
| $35,000 to $49,999 | 141 | 11.6% |
| $50,000 to $74,999 | 206 | 17.0% |
| $75,000 to $99,999 | 138 | 11.4% |
| $100,000 to $149,999 | 112 | 9.2% |
| $150,000 to $199,999 | 42 | 3.5% |
| $200,000+ | 23 | 1.9% |
Household Income by Householder Age in Cedaredge
The median household income in Cedaredge is $40,395, with the highest median household income of $50,338 found in the 25 to 44 years age bracket for the primary householder. A total of 242 households (19.9%) fall into this category. Meanwhile, the 45 to 64 years age bracket for the primary householder has the lowest median household income of $34,861, with 423 households (34.8%) in this group.
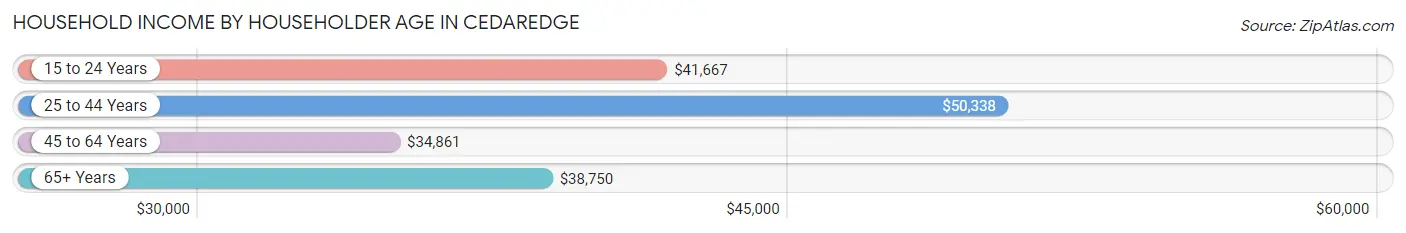
| Income Bracket | # Households | Median Income |
| 15 to 24 Years | 8 (0.7%) | $41,667 |
| 25 to 44 Years | 242 (19.9%) | $50,338 |
| 45 to 64 Years | 423 (34.8%) | $34,861 |
| 65+ Years | 541 (44.6%) | $38,750 |
| Total | 1,214 (100.0%) | $40,395 |
Poverty in Cedaredge
Income Below Poverty by Sex and Age in Cedaredge
With 17.8% poverty level for males and 31.8% for females among the residents of Cedaredge, 5 year old males and 5 year old females are the most vulnerable to poverty, with 18 males (100.0%) and 14 females (100.0%) in their respective age groups living below the poverty level.
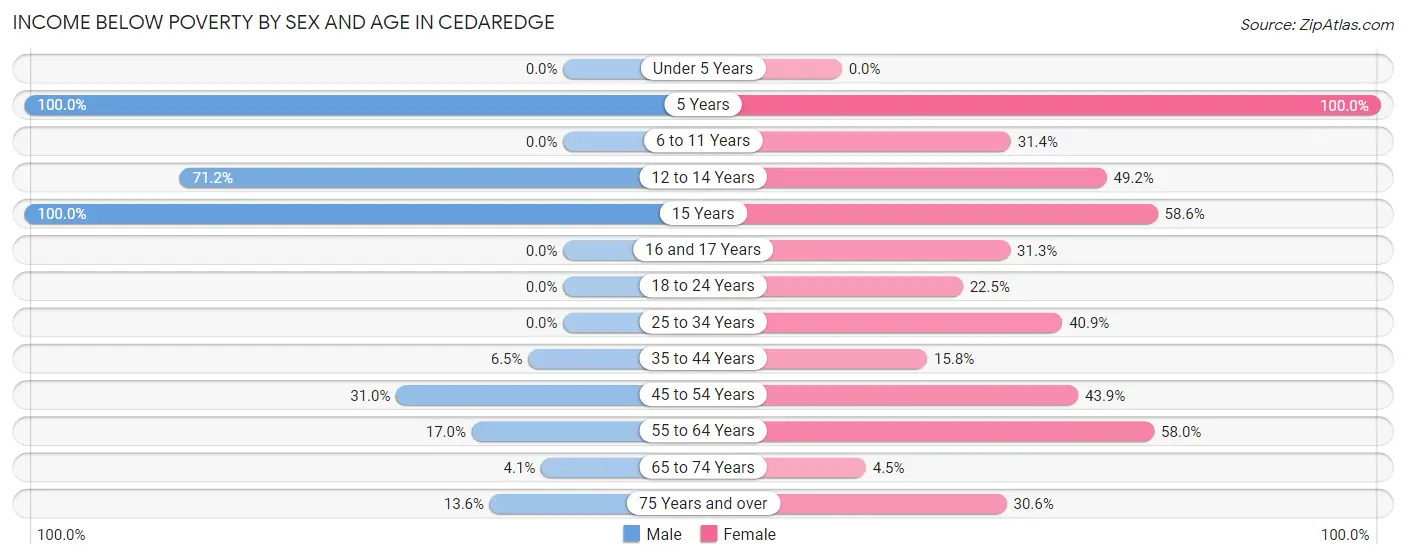
| Age Bracket | Male | Female |
| Under 5 Years | 0 (0.0%) | 0 (0.0%) |
| 5 Years | 18 (100.0%) | 14 (100.0%) |
| 6 to 11 Years | 0 (0.0%) | 16 (31.4%) |
| 12 to 14 Years | 52 (71.2%) | 29 (49.1%) |
| 15 Years | 29 (100.0%) | 17 (58.6%) |
| 16 and 17 Years | 0 (0.0%) | 5 (31.2%) |
| 18 to 24 Years | 0 (0.0%) | 11 (22.5%) |
| 25 to 34 Years | 0 (0.0%) | 63 (40.9%) |
| 35 to 44 Years | 5 (6.5%) | 22 (15.8%) |
| 45 to 54 Years | 49 (31.0%) | 75 (43.9%) |
| 55 to 64 Years | 34 (17.0%) | 138 (58.0%) |
| 65 to 74 Years | 9 (4.1%) | 13 (4.4%) |
| 75 Years and over | 15 (13.6%) | 37 (30.6%) |
| Total | 211 (17.8%) | 440 (31.8%) |
Income Above Poverty by Sex and Age in Cedaredge
According to the poverty statistics in Cedaredge, males aged under 5 years and females aged under 5 years are the age groups that are most secure financially, with 100.0% of males and 100.0% of females in these age groups living above the poverty line.
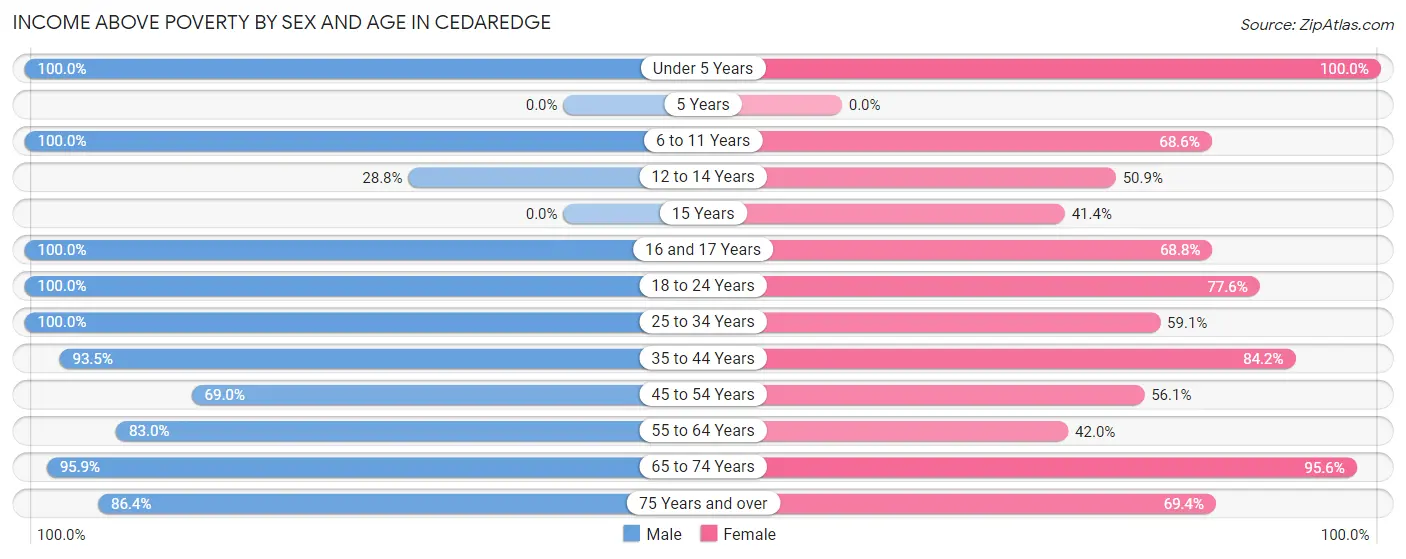
| Age Bracket | Male | Female |
| Under 5 Years | 83 (100.0%) | 53 (100.0%) |
| 5 Years | 0 (0.0%) | 0 (0.0%) |
| 6 to 11 Years | 46 (100.0%) | 35 (68.6%) |
| 12 to 14 Years | 21 (28.8%) | 30 (50.8%) |
| 15 Years | 0 (0.0%) | 12 (41.4%) |
| 16 and 17 Years | 7 (100.0%) | 11 (68.8%) |
| 18 to 24 Years | 83 (100.0%) | 38 (77.5%) |
| 25 to 34 Years | 83 (100.0%) | 91 (59.1%) |
| 35 to 44 Years | 72 (93.5%) | 117 (84.2%) |
| 45 to 54 Years | 109 (69.0%) | 96 (56.1%) |
| 55 to 64 Years | 166 (83.0%) | 100 (42.0%) |
| 65 to 74 Years | 210 (95.9%) | 279 (95.6%) |
| 75 Years and over | 95 (86.4%) | 84 (69.4%) |
| Total | 975 (82.2%) | 946 (68.2%) |
Income Below Poverty Among Married-Couple Families in Cedaredge
The poverty statistics for married-couple families in Cedaredge show that 18.7% or 95 of the total 507 families live below the poverty line. Families with 3 or 4 children have the highest poverty rate of 38.9%, comprising of 21 families. On the other hand, families with no children have the lowest poverty rate of 16.2%, which includes 53 families.
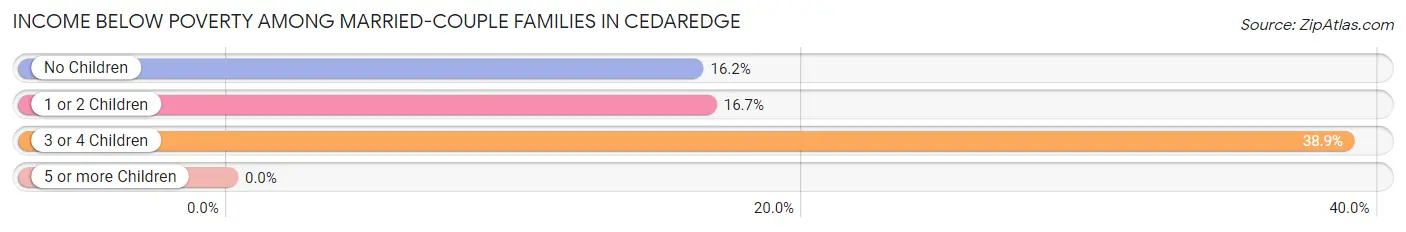
| Children | Above Poverty | Below Poverty |
| No Children | 274 (83.8%) | 53 (16.2%) |
| 1 or 2 Children | 105 (83.3%) | 21 (16.7%) |
| 3 or 4 Children | 33 (61.1%) | 21 (38.9%) |
| 5 or more Children | 0 (0.0%) | 0 (0.0%) |
| Total | 412 (81.3%) | 95 (18.7%) |
Income Below Poverty Among Single-Parent Households in Cedaredge
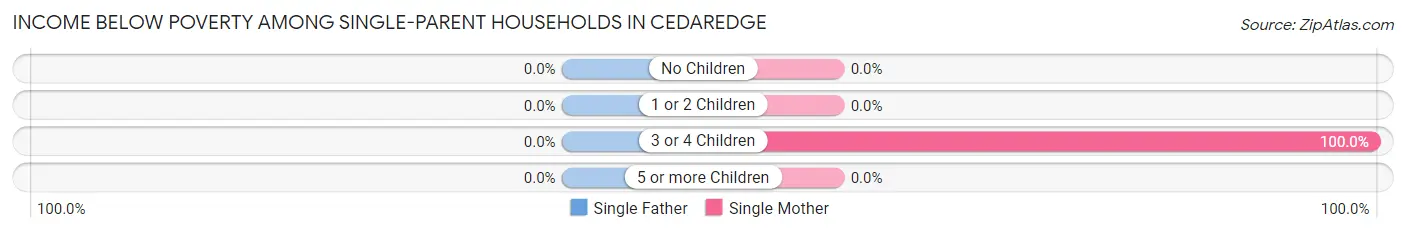
| Children | Single Father | Single Mother |
| No Children | 0 (0.0%) | 0 (0.0%) |
| 1 or 2 Children | 0 (0.0%) | 0 (0.0%) |
| 3 or 4 Children | 0 (0.0%) | 26 (100.0%) |
| 5 or more Children | 0 (0.0%) | 0 (0.0%) |
| Total | 0 (0.0%) | 26 (30.2%) |
Income Below Poverty Among Married-Couple vs Single-Parent Households in Cedaredge
The poverty data for Cedaredge shows that 95 of the married-couple family households (18.7%) and 26 of the single-parent households (22.8%) are living below the poverty level. Within the married-couple family households, those with 3 or 4 children have the highest poverty rate, with 21 households (38.9%) falling below the poverty line. Among the single-parent households, those with 3 or 4 children have the highest poverty rate, with 26 household (100.0%) living below poverty.
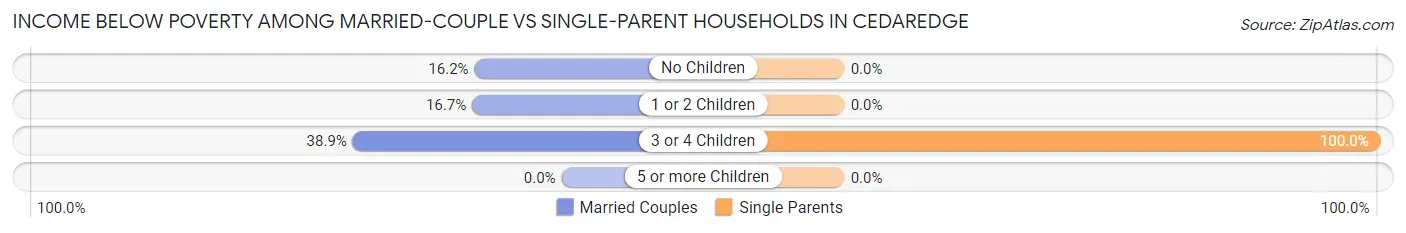
| Children | Married-Couple Families | Single-Parent Households |
| No Children | 53 (16.2%) | 0 (0.0%) |
| 1 or 2 Children | 21 (16.7%) | 0 (0.0%) |
| 3 or 4 Children | 21 (38.9%) | 26 (100.0%) |
| 5 or more Children | 0 (0.0%) | 0 (0.0%) |
| Total | 95 (18.7%) | 26 (22.8%) |
Race in Cedaredge
The most populous races in Cedaredge are White / Caucasian (2,413 | 93.8%), Hispanic or Latino (226 | 8.8%), and Two or more Races (95 | 3.7%).
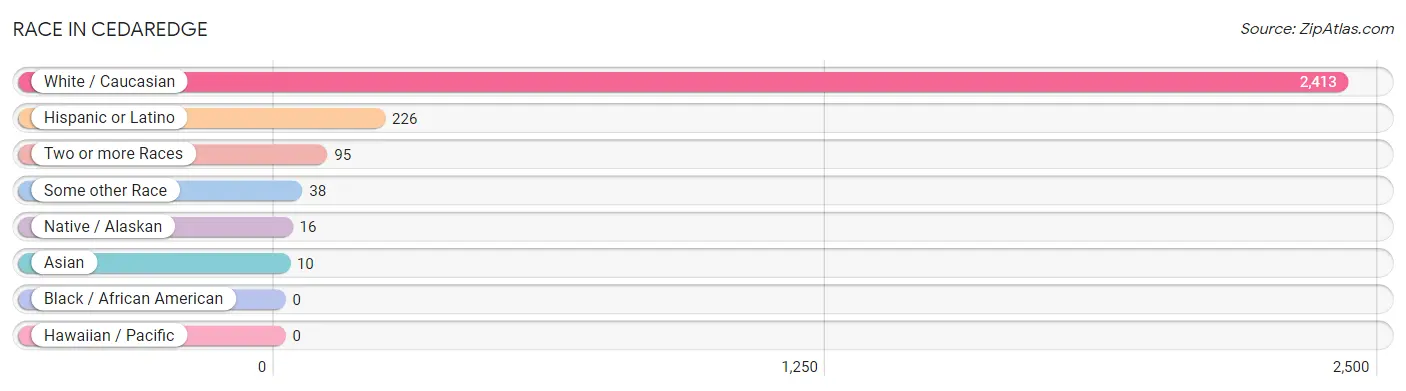
| Race | # Population | % Population |
| Asian | 10 | 0.4% |
| Black / African American | 0 | 0.0% |
| Hawaiian / Pacific | 0 | 0.0% |
| Hispanic or Latino | 226 | 8.8% |
| Native / Alaskan | 16 | 0.6% |
| White / Caucasian | 2,413 | 93.8% |
| Two or more Races | 95 | 3.7% |
| Some other Race | 38 | 1.5% |
| Total | 2,572 | 100.0% |
Ancestry in Cedaredge
The most populous ancestries reported in Cedaredge are English (449 | 17.5%), German (399 | 15.5%), Irish (314 | 12.2%), American (202 | 7.9%), and Scottish (174 | 6.8%), together accounting for 59.8% of all Cedaredge residents.
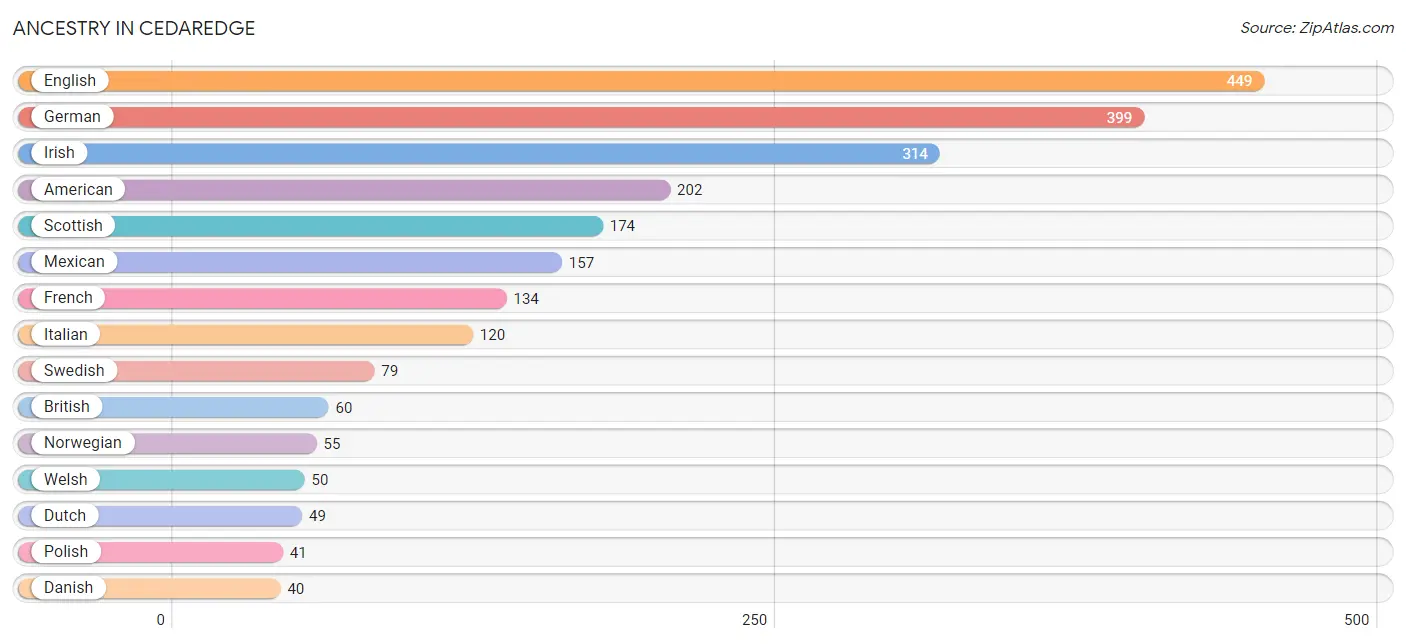
| Ancestry | # Population | % Population |
| American | 202 | 7.9% |
| Arab | 2 | 0.1% |
| Austrian | 2 | 0.1% |
| Belgian | 5 | 0.2% |
| British | 60 | 2.3% |
| Canadian | 15 | 0.6% |
| Central American | 1 | 0.0% |
| Cherokee | 15 | 0.6% |
| Choctaw | 11 | 0.4% |
| Cuban | 10 | 0.4% |
| Danish | 40 | 1.6% |
| Dutch | 49 | 1.9% |
| Eastern European | 5 | 0.2% |
| English | 449 | 17.5% |
| European | 20 | 0.8% |
| Finnish | 16 | 0.6% |
| French | 134 | 5.2% |
| French Canadian | 9 | 0.4% |
| German | 399 | 15.5% |
| Greek | 13 | 0.5% |
| Hungarian | 7 | 0.3% |
| Irish | 314 | 12.2% |
| Italian | 120 | 4.7% |
| Mexican | 157 | 6.1% |
| Northern European | 19 | 0.7% |
| Norwegian | 55 | 2.1% |
| Polish | 41 | 1.6% |
| Portuguese | 17 | 0.7% |
| Puerto Rican | 21 | 0.8% |
| Russian | 14 | 0.5% |
| Salvadoran | 1 | 0.0% |
| Scandinavian | 16 | 0.6% |
| Scotch-Irish | 7 | 0.3% |
| Scottish | 174 | 6.8% |
| Sioux | 12 | 0.5% |
| Slavic | 2 | 0.1% |
| Spaniard | 22 | 0.9% |
| Spanish | 7 | 0.3% |
| Sri Lankan | 10 | 0.4% |
| Swedish | 79 | 3.1% |
| Swiss | 9 | 0.4% |
| Syrian | 2 | 0.1% |
| Welsh | 50 | 1.9% | View All 43 Rows |
Immigrants in Cedaredge
The most numerous immigrant groups reported in Cedaredge came from Europe (35 | 1.4%), Western Europe (28 | 1.1%), Germany (23 | 0.9%), Asia (10 | 0.4%), and Latin America (10 | 0.4%), together accounting for 4.1% of all Cedaredge residents.
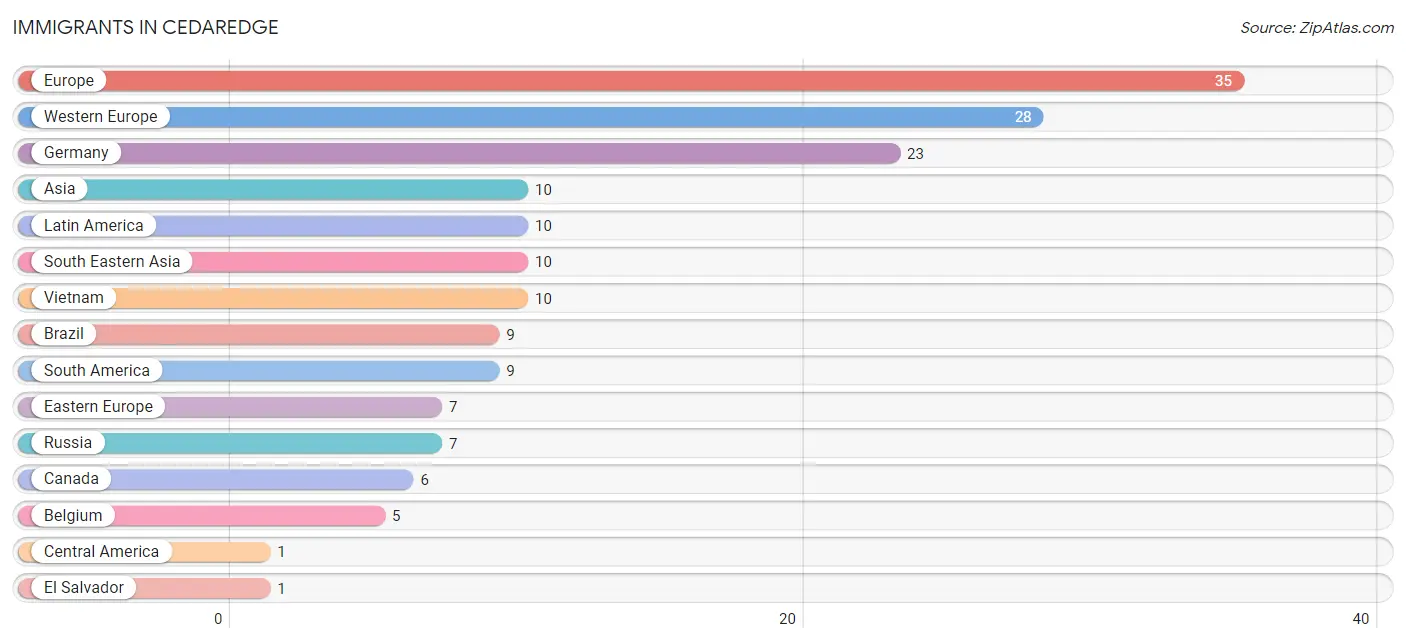
| Immigration Origin | # Population | % Population |
| Asia | 10 | 0.4% |
| Belgium | 5 | 0.2% |
| Brazil | 9 | 0.4% |
| Canada | 6 | 0.2% |
| Central America | 1 | 0.0% |
| Eastern Europe | 7 | 0.3% |
| El Salvador | 1 | 0.0% |
| Europe | 35 | 1.4% |
| Germany | 23 | 0.9% |
| Latin America | 10 | 0.4% |
| Russia | 7 | 0.3% |
| South America | 9 | 0.4% |
| South Eastern Asia | 10 | 0.4% |
| Vietnam | 10 | 0.4% |
| Western Europe | 28 | 1.1% | View All 15 Rows |
Sex and Age in Cedaredge
Sex and Age in Cedaredge
The most populous age groups in Cedaredge are 70 to 74 Years (132 | 11.1%) for men and 65 to 69 Years (156 | 11.3%) for women.
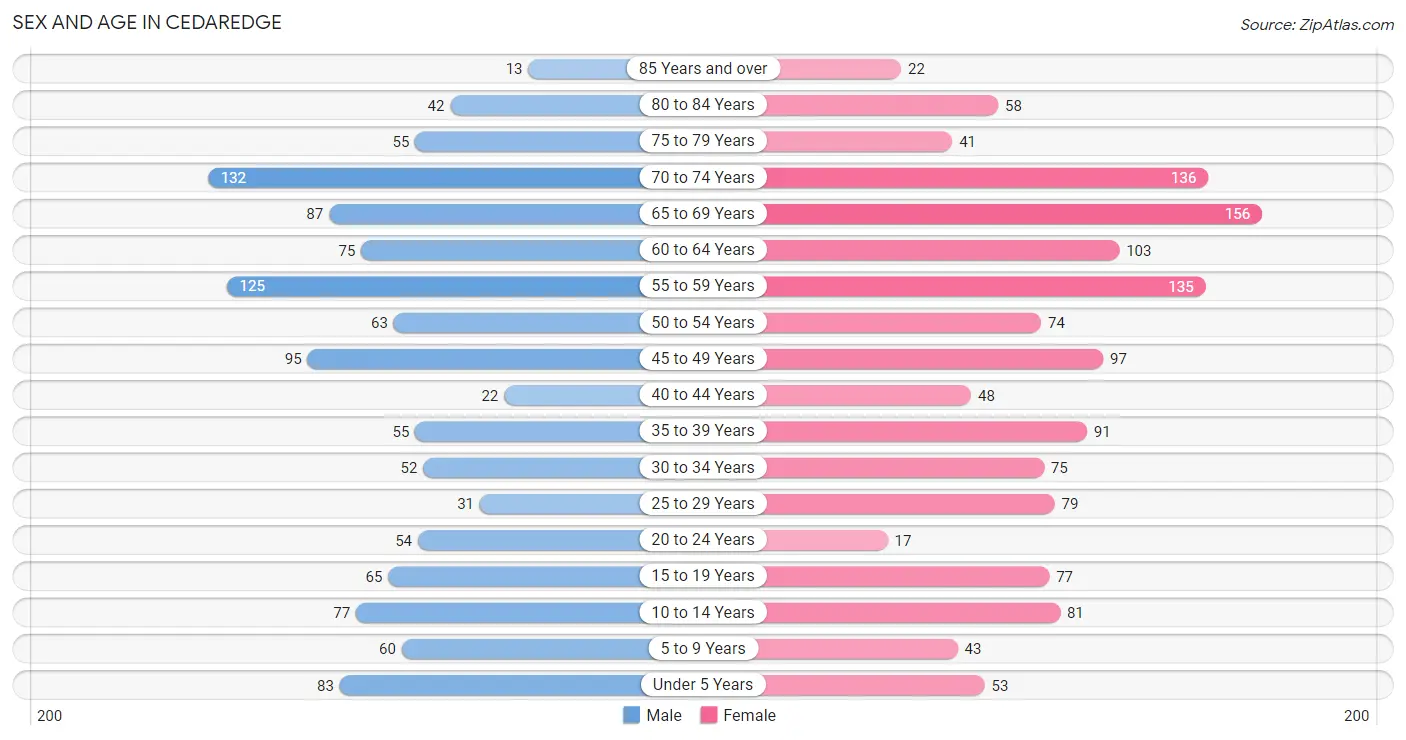
| Age Bracket | Male | Female |
| Under 5 Years | 83 (7.0%) | 53 (3.8%) |
| 5 to 9 Years | 60 (5.1%) | 43 (3.1%) |
| 10 to 14 Years | 77 (6.5%) | 81 (5.8%) |
| 15 to 19 Years | 65 (5.5%) | 77 (5.6%) |
| 20 to 24 Years | 54 (4.5%) | 17 (1.2%) |
| 25 to 29 Years | 31 (2.6%) | 79 (5.7%) |
| 30 to 34 Years | 52 (4.4%) | 75 (5.4%) |
| 35 to 39 Years | 55 (4.6%) | 91 (6.6%) |
| 40 to 44 Years | 22 (1.8%) | 48 (3.5%) |
| 45 to 49 Years | 95 (8.0%) | 97 (7.0%) |
| 50 to 54 Years | 63 (5.3%) | 74 (5.3%) |
| 55 to 59 Years | 125 (10.5%) | 135 (9.7%) |
| 60 to 64 Years | 75 (6.3%) | 103 (7.4%) |
| 65 to 69 Years | 87 (7.3%) | 156 (11.3%) |
| 70 to 74 Years | 132 (11.1%) | 136 (9.8%) |
| 75 to 79 Years | 55 (4.6%) | 41 (3.0%) |
| 80 to 84 Years | 42 (3.5%) | 58 (4.2%) |
| 85 Years and over | 13 (1.1%) | 22 (1.6%) |
| Total | 1,186 (100.0%) | 1,386 (100.0%) |
Families and Households in Cedaredge
Median Family Size in Cedaredge
The median family size in Cedaredge is 2.91 persons per family, with single female/mother families (86 | 13.9%) accounting for the largest median family size of 3.4 persons per family. On the other hand, single male/father families (28 | 4.5%) represent the smallest median family size with 2.32 persons per family.
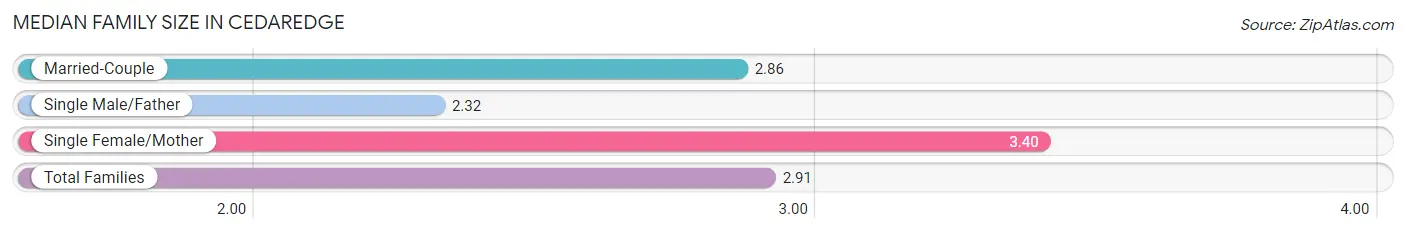
| Family Type | # Families | Family Size |
| Married-Couple | 507 (81.6%) | 2.86 |
| Single Male/Father | 28 (4.5%) | 2.32 |
| Single Female/Mother | 86 (13.9%) | 3.40 |
| Total Families | 621 (100.0%) | 2.91 |
Median Household Size in Cedaredge
The median household size in Cedaredge is 2.12 persons per household, with single female/mother households (86 | 7.1%) accounting for the largest median household size of 3.49 persons per household. non-family households (593 | 48.8%) represent the smallest median household size with 1.22 persons per household.
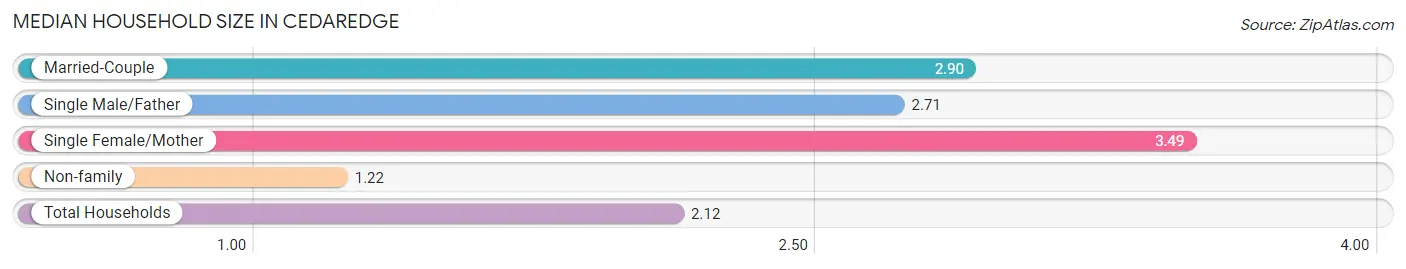
| Household Type | # Households | Household Size |
| Married-Couple | 507 (41.8%) | 2.90 |
| Single Male/Father | 28 (2.3%) | 2.71 |
| Single Female/Mother | 86 (7.1%) | 3.49 |
| Non-family | 593 (48.8%) | 1.22 |
| Total Households | 1,214 (100.0%) | 2.12 |
Household Size by Marriage Status in Cedaredge
Out of a total of 1,214 households in Cedaredge, 621 (51.1%) are family households, while 593 (48.8%) are nonfamily households. The most numerous type of family households are 2-person households, comprising 306, and the most common type of nonfamily households are 1-person households, comprising 494.
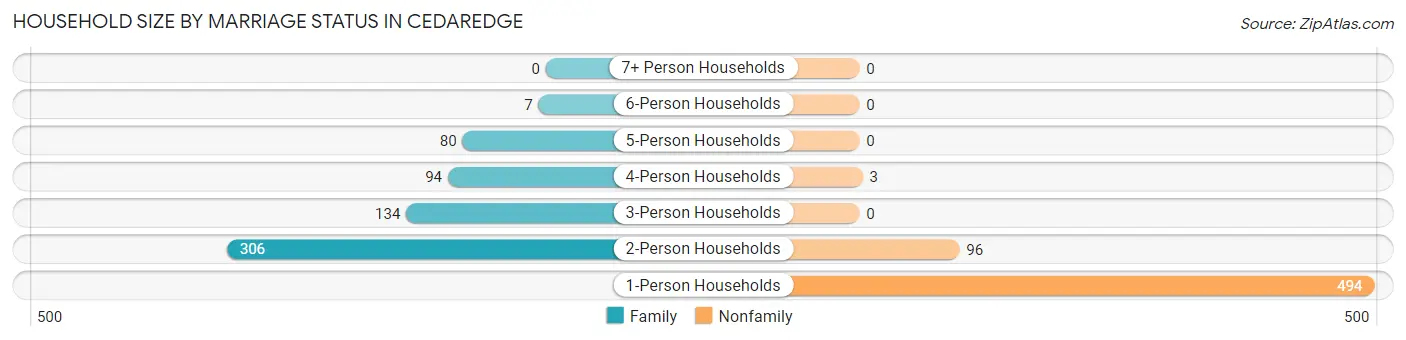
| Household Size | Family Households | Nonfamily Households |
| 1-Person Households | - | 494 (40.7%) |
| 2-Person Households | 306 (25.2%) | 96 (7.9%) |
| 3-Person Households | 134 (11.0%) | 0 (0.0%) |
| 4-Person Households | 94 (7.7%) | 3 (0.3%) |
| 5-Person Households | 80 (6.6%) | 0 (0.0%) |
| 6-Person Households | 7 (0.6%) | 0 (0.0%) |
| 7+ Person Households | 0 (0.0%) | 0 (0.0%) |
| Total | 621 (51.1%) | 593 (48.8%) |
Female Fertility in Cedaredge
Fertility by Age in Cedaredge
Average fertility rate in Cedaredge is 48.0 births per 1,000 women. Women in the age bracket of 20 to 34 years have the highest fertility rate with 135.0 births per 1,000 women. Women in the age bracket of 20 to 34 years acount for 100.0% of all women with births.
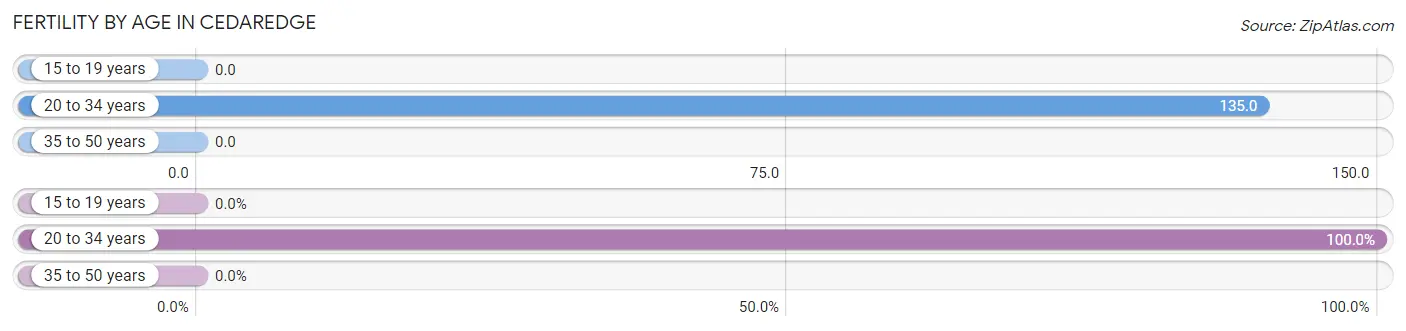
| Age Bracket | Women with Births | Births / 1,000 Women |
| 15 to 19 years | 0 (0.0%) | 0.0 |
| 20 to 34 years | 23 (100.0%) | 135.0 |
| 35 to 50 years | 0 (0.0%) | 0.0 |
| Total | 23 (100.0%) | 48.0 |
Fertility by Age by Marriage Status in Cedaredge
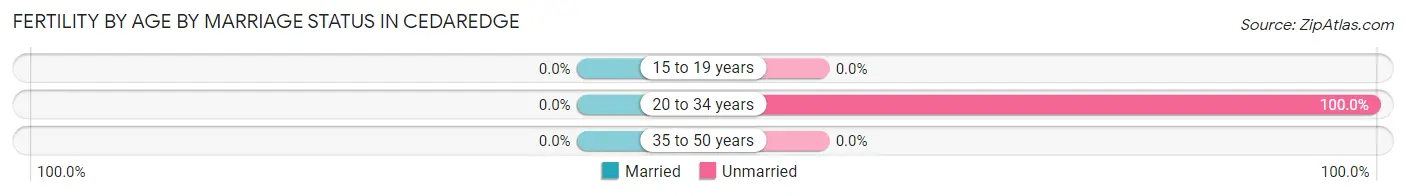
| Age Bracket | Married | Unmarried |
| 15 to 19 years | 0 (0.0%) | 0 (0.0%) |
| 20 to 34 years | 0 (0.0%) | 23 (100.0%) |
| 35 to 50 years | 0 (0.0%) | 0 (0.0%) |
| Total | 0 (0.0%) | 23 (100.0%) |
Fertility by Education in Cedaredge
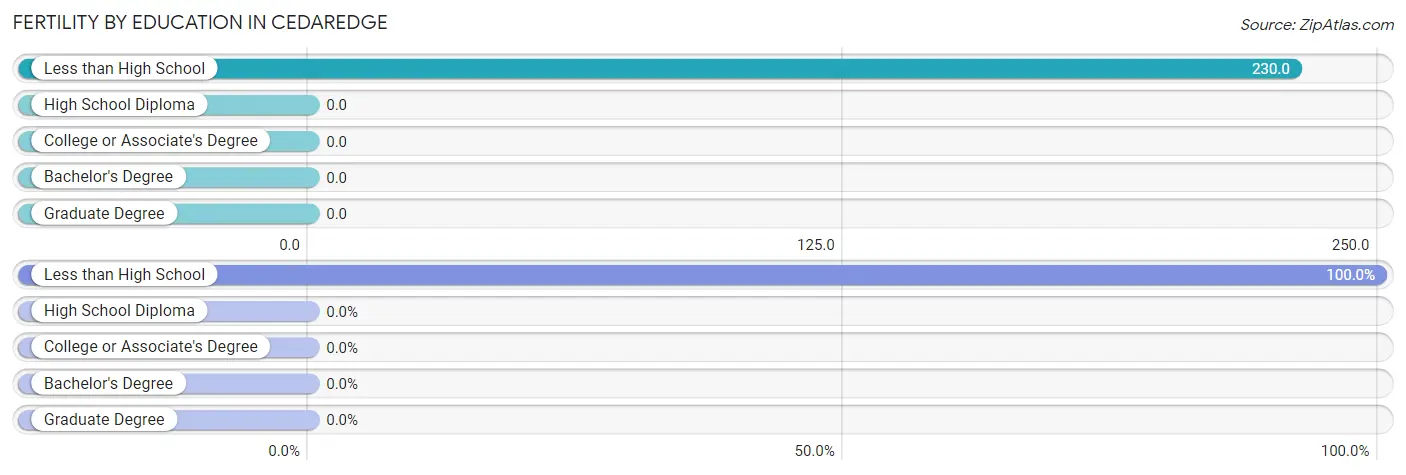
| Educational Attainment | Women with Births | Births / 1,000 Women |
| Less than High School | 23 (100.0%) | 230.0 |
| High School Diploma | 0 (0.0%) | 0.0 |
| College or Associate's Degree | 0 (0.0%) | 0.0 |
| Bachelor's Degree | 0 (0.0%) | 0.0 |
| Graduate Degree | 0 (0.0%) | 0.0 |
| Total | 23 (100.0%) | 48.0 |
Fertility by Education by Marriage Status in Cedaredge
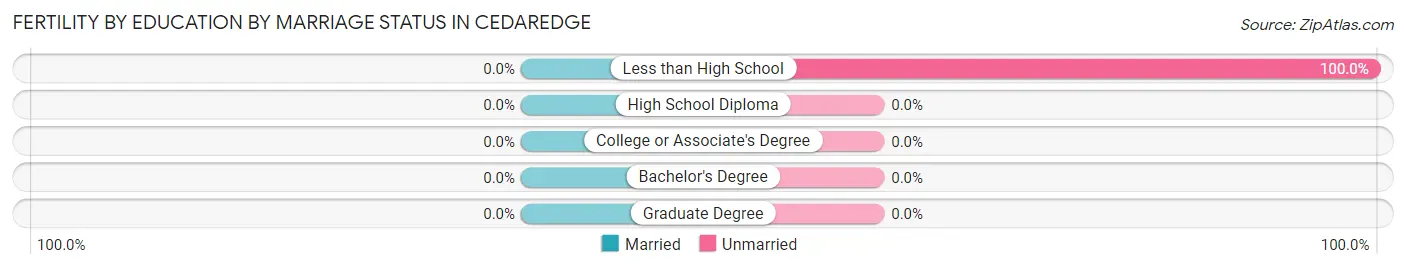
| Educational Attainment | Married | Unmarried |
| Less than High School | 0 (0.0%) | 23 (100.0%) |
| High School Diploma | 0 (0.0%) | 0 (0.0%) |
| College or Associate's Degree | 0 (0.0%) | 0 (0.0%) |
| Bachelor's Degree | 0 (0.0%) | 0 (0.0%) |
| Graduate Degree | 0 (0.0%) | 0 (0.0%) |
| Total | 0 (0.0%) | 23 (100.0%) |
Employment Characteristics in Cedaredge
Employment by Class of Employer in Cedaredge
Among the 914 employed individuals in Cedaredge, private company employees (458 | 50.1%), self-employed (not incorporated) (119 | 13.0%), and local government employees (111 | 12.1%) make up the most common classes of employment.
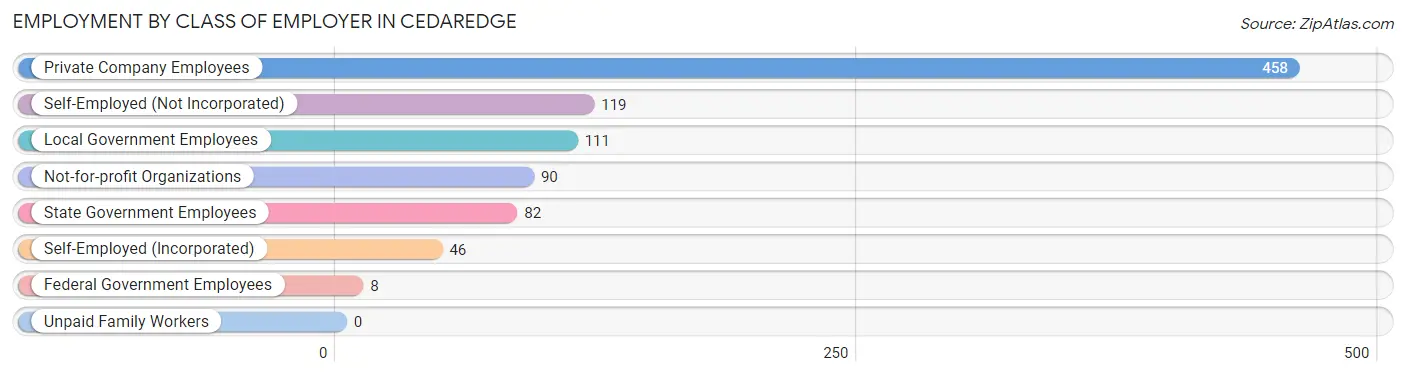
| Employer Class | # Employees | % Employees |
| Private Company Employees | 458 | 50.1% |
| Self-Employed (Incorporated) | 46 | 5.0% |
| Self-Employed (Not Incorporated) | 119 | 13.0% |
| Not-for-profit Organizations | 90 | 9.9% |
| Local Government Employees | 111 | 12.1% |
| State Government Employees | 82 | 9.0% |
| Federal Government Employees | 8 | 0.9% |
| Unpaid Family Workers | 0 | 0.0% |
| Total | 914 | 100.0% |
Employment Status by Age in Cedaredge
According to the labor force statistics for Cedaredge, out of the total population over 16 years of age (2,117), 51.1% or 1,082 individuals are in the labor force, with 12.8% or 138 of them unemployed. The age group with the highest labor force participation rate is 20 to 24 years, with 100.0% or 71 individuals in the labor force. Within the labor force, the 20 to 24 years age range has the highest percentage of unemployed individuals, with 35.2% or 25 of them being unemployed.
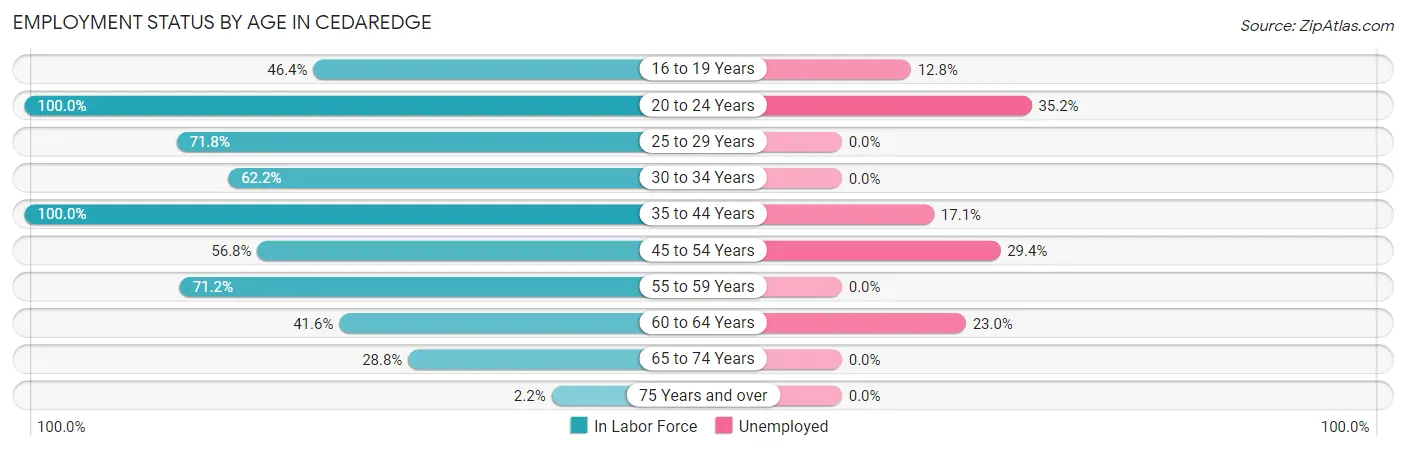
| Age Bracket | In Labor Force | Unemployed |
| 16 to 19 Years | 39 (46.4%) | 5 (12.8%) |
| 20 to 24 Years | 71 (100.0%) | 25 (35.2%) |
| 25 to 29 Years | 79 (71.8%) | 0 (0.0%) |
| 30 to 34 Years | 79 (62.2%) | 0 (0.0%) |
| 35 to 44 Years | 216 (100.0%) | 37 (17.1%) |
| 45 to 54 Years | 187 (56.8%) | 55 (29.4%) |
| 55 to 59 Years | 185 (71.2%) | 0 (0.0%) |
| 60 to 64 Years | 74 (41.6%) | 17 (23.0%) |
| 65 to 74 Years | 147 (28.8%) | 0 (0.0%) |
| 75 Years and over | 5 (2.2%) | 0 (0.0%) |
| Total | 1,082 (51.1%) | 138 (12.8%) |
Employment Status by Educational Attainment in Cedaredge
According to labor force statistics for Cedaredge, 67.2% of individuals (820) out of the total population between 25 and 64 years of age (1,220) are in the labor force, with 13.3% or 109 of them being unemployed. The group with the highest labor force participation rate are those with the educational attainment of college / associate degree, with 75.9% or 308 individuals in the labor force. Within the labor force, individuals with bachelor's degree or higher education have the highest percentage of unemployment, with 34.3% or 61 of them being unemployed.
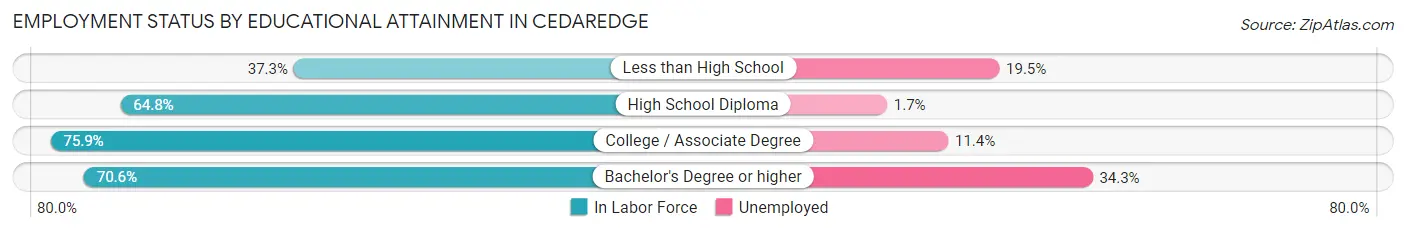
| Educational Attainment | In Labor Force | Unemployed |
| Less than High School | 41 (37.3%) | 21 (19.5%) |
| High School Diploma | 293 (64.8%) | 8 (1.7%) |
| College / Associate Degree | 308 (75.9%) | 46 (11.4%) |
| Bachelor's Degree or higher | 178 (70.6%) | 86 (34.3%) |
| Total | 820 (67.2%) | 162 (13.3%) |
Employment Occupations by Sex in Cedaredge
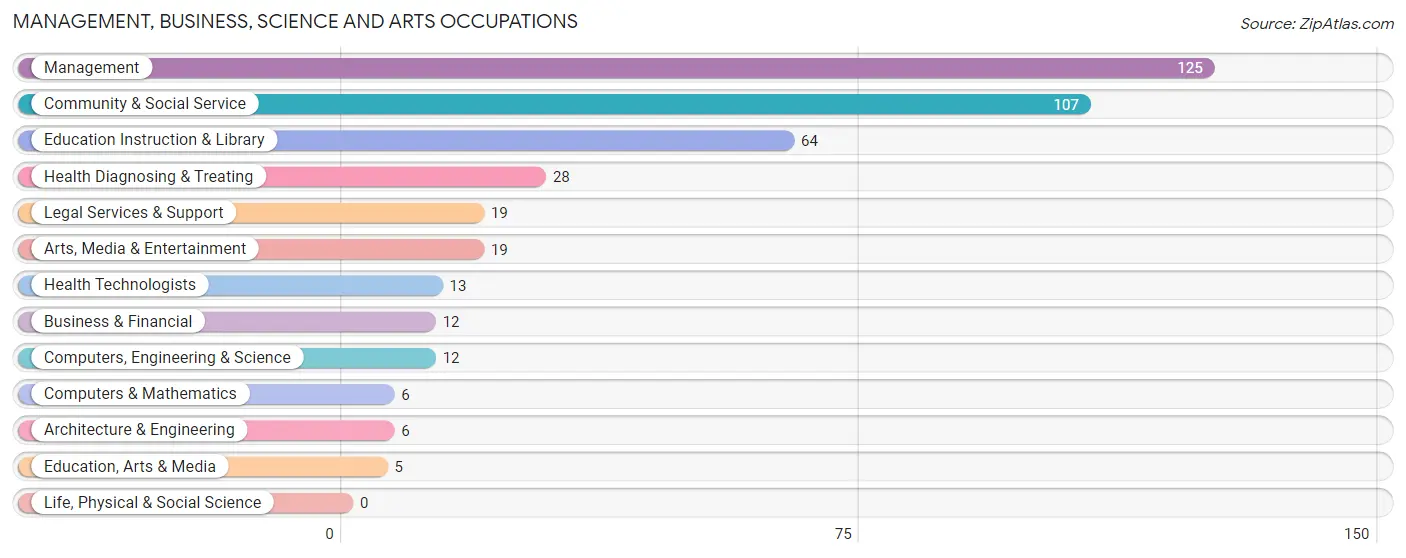
Management, Business, Science and Arts Occupations
The most common Management, Business, Science and Arts occupations in Cedaredge are Management (125 | 13.3%), Community & Social Service (107 | 11.4%), Education Instruction & Library (64 | 6.8%), Health Diagnosing & Treating (28 | 3.0%), and Legal Services & Support (19 | 2.0%).
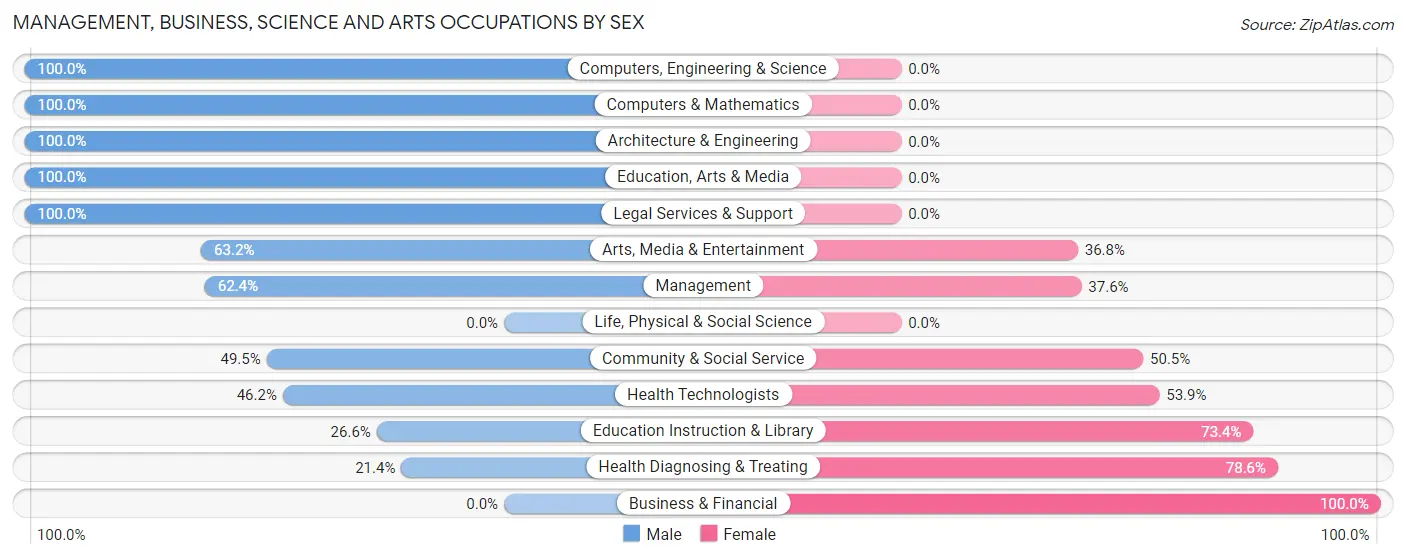
Management, Business, Science and Arts Occupations by Sex
Within the Management, Business, Science and Arts occupations in Cedaredge, the most male-oriented occupations are Computers, Engineering & Science (100.0%), Computers & Mathematics (100.0%), and Architecture & Engineering (100.0%), while the most female-oriented occupations are Business & Financial (100.0%), Health Diagnosing & Treating (78.6%), and Education Instruction & Library (73.4%).
| Occupation | Male | Female |
| Management | 78 (62.4%) | 47 (37.6%) |
| Business & Financial | 0 (0.0%) | 12 (100.0%) |
| Computers, Engineering & Science | 12 (100.0%) | 0 (0.0%) |
| Computers & Mathematics | 6 (100.0%) | 0 (0.0%) |
| Architecture & Engineering | 6 (100.0%) | 0 (0.0%) |
| Life, Physical & Social Science | 0 (0.0%) | 0 (0.0%) |
| Community & Social Service | 53 (49.5%) | 54 (50.5%) |
| Education, Arts & Media | 5 (100.0%) | 0 (0.0%) |
| Legal Services & Support | 19 (100.0%) | 0 (0.0%) |
| Education Instruction & Library | 17 (26.6%) | 47 (73.4%) |
| Arts, Media & Entertainment | 12 (63.2%) | 7 (36.8%) |
| Health Diagnosing & Treating | 6 (21.4%) | 22 (78.6%) |
| Health Technologists | 6 (46.2%) | 7 (53.8%) |
| Total (Category) | 149 (52.5%) | 135 (47.5%) |
| Total (Overall) | 509 (54.0%) | 434 (46.0%) |
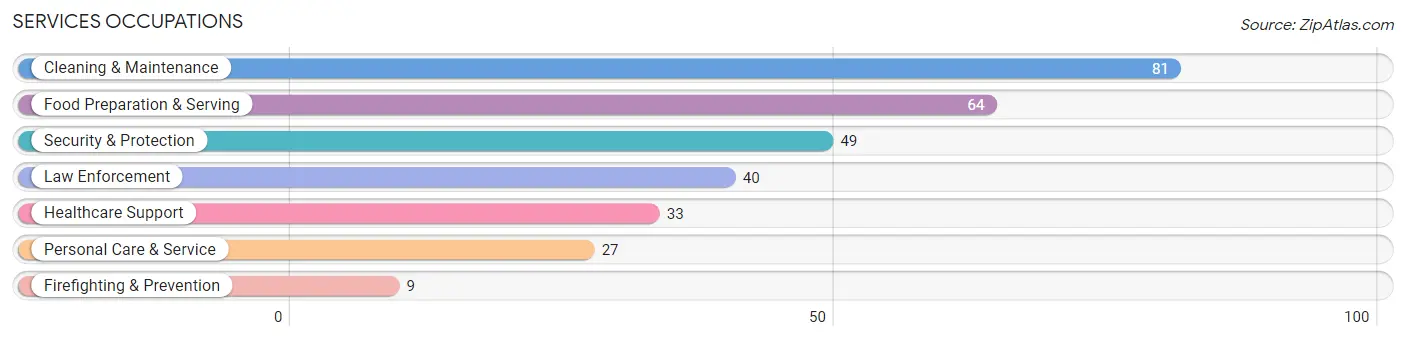
Services Occupations
The most common Services occupations in Cedaredge are Cleaning & Maintenance (81 | 8.6%), Food Preparation & Serving (64 | 6.8%), Security & Protection (49 | 5.2%), Law Enforcement (40 | 4.2%), and Healthcare Support (33 | 3.5%).
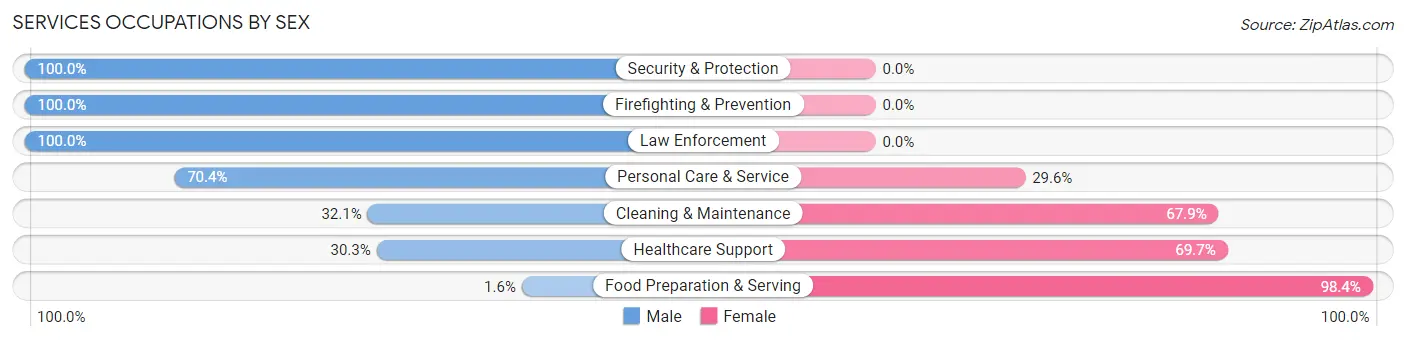
Services Occupations by Sex
Within the Services occupations in Cedaredge, the most male-oriented occupations are Security & Protection (100.0%), Firefighting & Prevention (100.0%), and Law Enforcement (100.0%), while the most female-oriented occupations are Food Preparation & Serving (98.4%), Healthcare Support (69.7%), and Cleaning & Maintenance (67.9%).
| Occupation | Male | Female |
| Healthcare Support | 10 (30.3%) | 23 (69.7%) |
| Security & Protection | 49 (100.0%) | 0 (0.0%) |
| Firefighting & Prevention | 9 (100.0%) | 0 (0.0%) |
| Law Enforcement | 40 (100.0%) | 0 (0.0%) |
| Food Preparation & Serving | 1 (1.6%) | 63 (98.4%) |
| Cleaning & Maintenance | 26 (32.1%) | 55 (67.9%) |
| Personal Care & Service | 19 (70.4%) | 8 (29.6%) |
| Total (Category) | 105 (41.3%) | 149 (58.7%) |
| Total (Overall) | 509 (54.0%) | 434 (46.0%) |
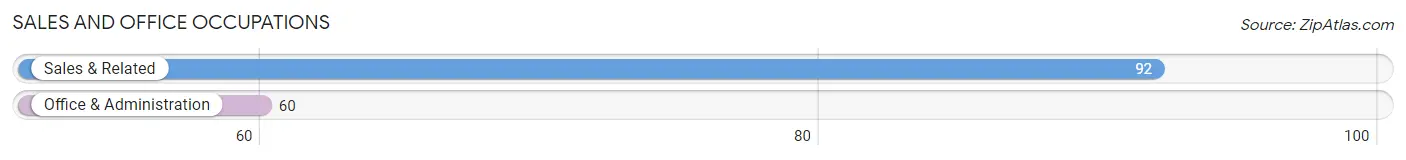
Sales and Office Occupations
The most common Sales and Office occupations in Cedaredge are Sales & Related (92 | 9.8%), and Office & Administration (60 | 6.4%).
Sales and Office Occupations by Sex
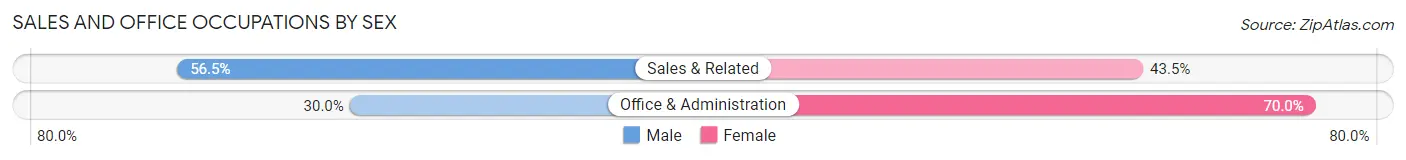
| Occupation | Male | Female |
| Sales & Related | 52 (56.5%) | 40 (43.5%) |
| Office & Administration | 18 (30.0%) | 42 (70.0%) |
| Total (Category) | 70 (46.1%) | 82 (53.9%) |
| Total (Overall) | 509 (54.0%) | 434 (46.0%) |
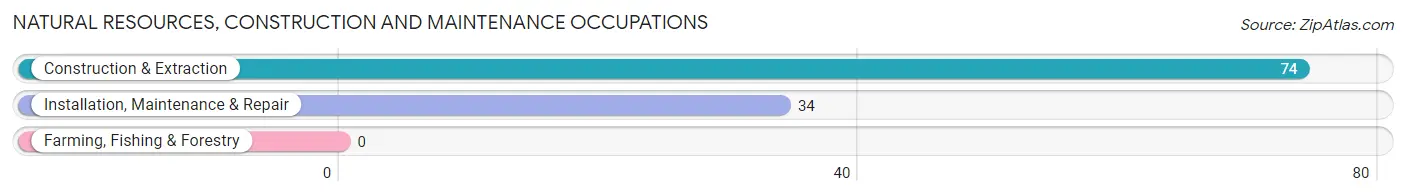
Natural Resources, Construction and Maintenance Occupations
The most common Natural Resources, Construction and Maintenance occupations in Cedaredge are Construction & Extraction (74 | 7.9%), and Installation, Maintenance & Repair (34 | 3.6%).
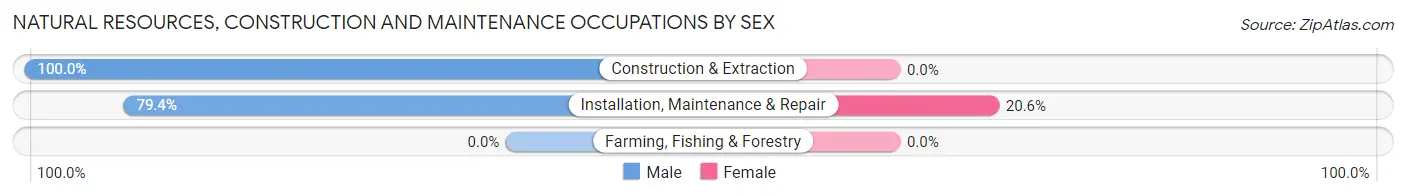
Natural Resources, Construction and Maintenance Occupations by Sex
| Occupation | Male | Female |
| Farming, Fishing & Forestry | 0 (0.0%) | 0 (0.0%) |
| Construction & Extraction | 74 (100.0%) | 0 (0.0%) |
| Installation, Maintenance & Repair | 27 (79.4%) | 7 (20.6%) |
| Total (Category) | 101 (93.5%) | 7 (6.5%) |
| Total (Overall) | 509 (54.0%) | 434 (46.0%) |
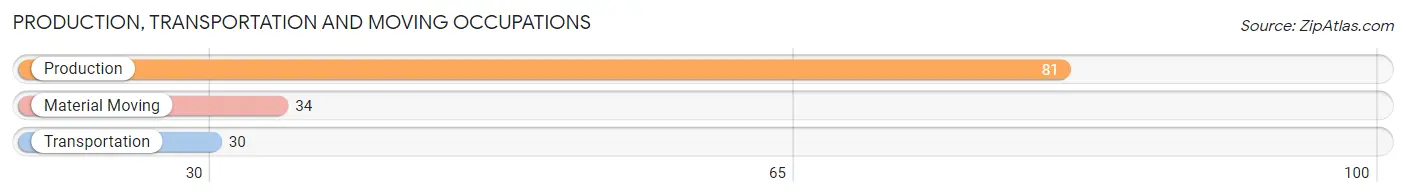
Production, Transportation and Moving Occupations
The most common Production, Transportation and Moving occupations in Cedaredge are Production (81 | 8.6%), Material Moving (34 | 3.6%), and Transportation (30 | 3.2%).
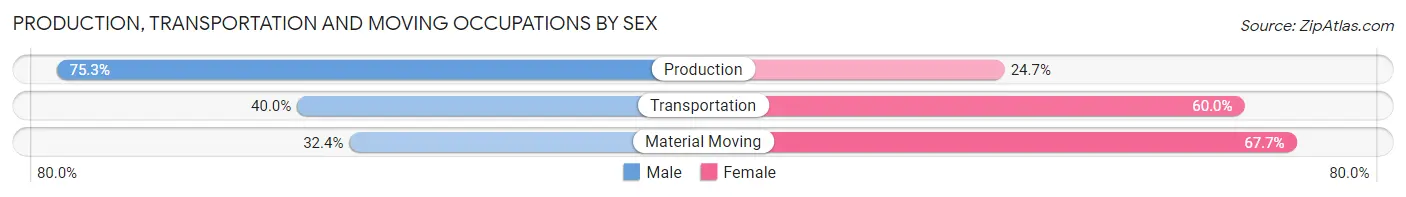
Production, Transportation and Moving Occupations by Sex
| Occupation | Male | Female |
| Production | 61 (75.3%) | 20 (24.7%) |
| Transportation | 12 (40.0%) | 18 (60.0%) |
| Material Moving | 11 (32.4%) | 23 (67.6%) |
| Total (Category) | 84 (57.9%) | 61 (42.1%) |
| Total (Overall) | 509 (54.0%) | 434 (46.0%) |
Employment Industries by Sex in Cedaredge
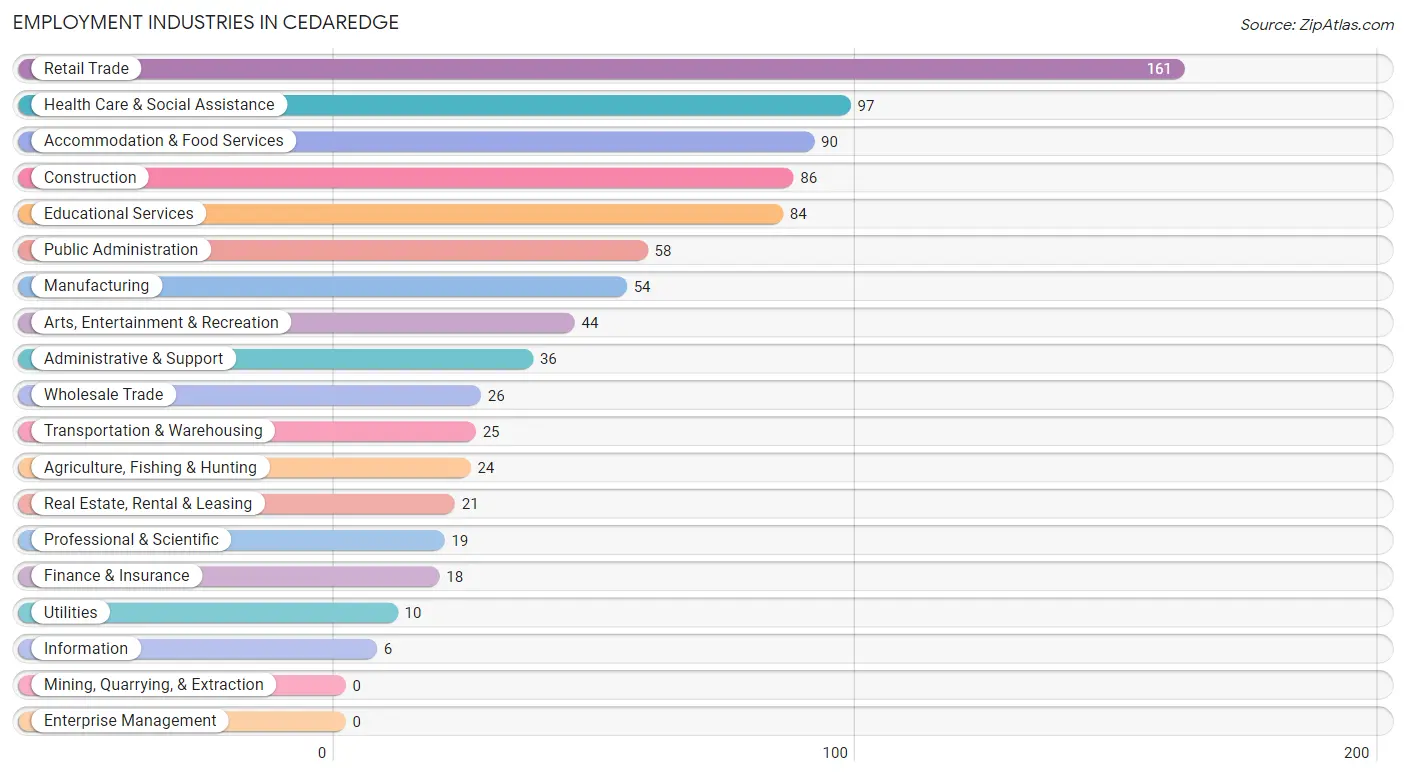
Employment Industries in Cedaredge
The major employment industries in Cedaredge include Retail Trade (161 | 17.1%), Health Care & Social Assistance (97 | 10.3%), Accommodation & Food Services (90 | 9.5%), Construction (86 | 9.1%), and Educational Services (84 | 8.9%).
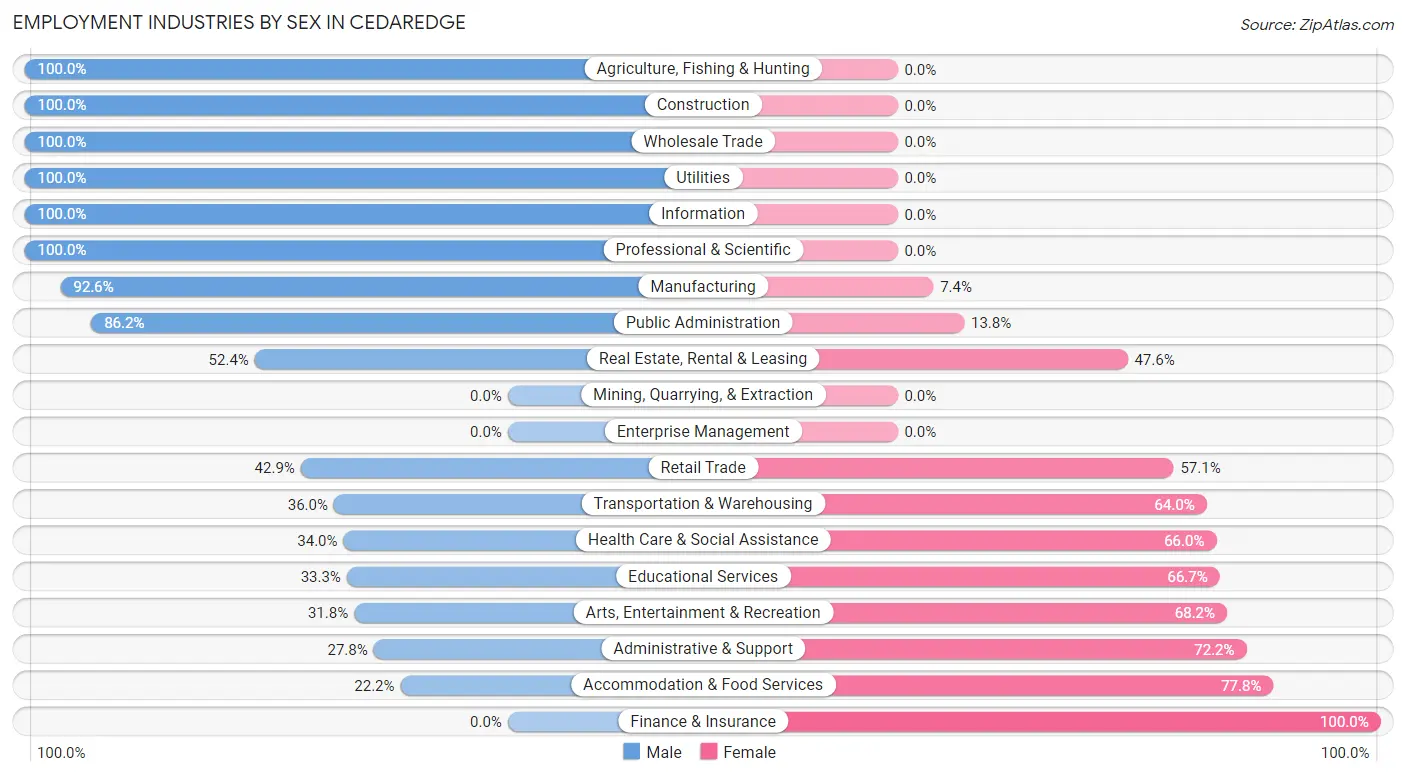
Employment Industries by Sex in Cedaredge
The Cedaredge industries that see more men than women are Agriculture, Fishing & Hunting (100.0%), Construction (100.0%), and Wholesale Trade (100.0%), whereas the industries that tend to have a higher number of women are Finance & Insurance (100.0%), Accommodation & Food Services (77.8%), and Administrative & Support (72.2%).
| Industry | Male | Female |
| Agriculture, Fishing & Hunting | 24 (100.0%) | 0 (0.0%) |
| Mining, Quarrying, & Extraction | 0 (0.0%) | 0 (0.0%) |
| Construction | 86 (100.0%) | 0 (0.0%) |
| Manufacturing | 50 (92.6%) | 4 (7.4%) |
| Wholesale Trade | 26 (100.0%) | 0 (0.0%) |
| Retail Trade | 69 (42.9%) | 92 (57.1%) |
| Transportation & Warehousing | 9 (36.0%) | 16 (64.0%) |
| Utilities | 10 (100.0%) | 0 (0.0%) |
| Information | 6 (100.0%) | 0 (0.0%) |
| Finance & Insurance | 0 (0.0%) | 18 (100.0%) |
| Real Estate, Rental & Leasing | 11 (52.4%) | 10 (47.6%) |
| Professional & Scientific | 19 (100.0%) | 0 (0.0%) |
| Enterprise Management | 0 (0.0%) | 0 (0.0%) |
| Administrative & Support | 10 (27.8%) | 26 (72.2%) |
| Educational Services | 28 (33.3%) | 56 (66.7%) |
| Health Care & Social Assistance | 33 (34.0%) | 64 (66.0%) |
| Arts, Entertainment & Recreation | 14 (31.8%) | 30 (68.2%) |
| Accommodation & Food Services | 20 (22.2%) | 70 (77.8%) |
| Public Administration | 50 (86.2%) | 8 (13.8%) |
| Total | 509 (54.0%) | 434 (46.0%) |
Education in Cedaredge
School Enrollment in Cedaredge
The most common levels of schooling among the 440 students in Cedaredge are middle school (158 | 35.9%), high school (101 | 23.0%), and nursery / preschool (70 | 15.9%).
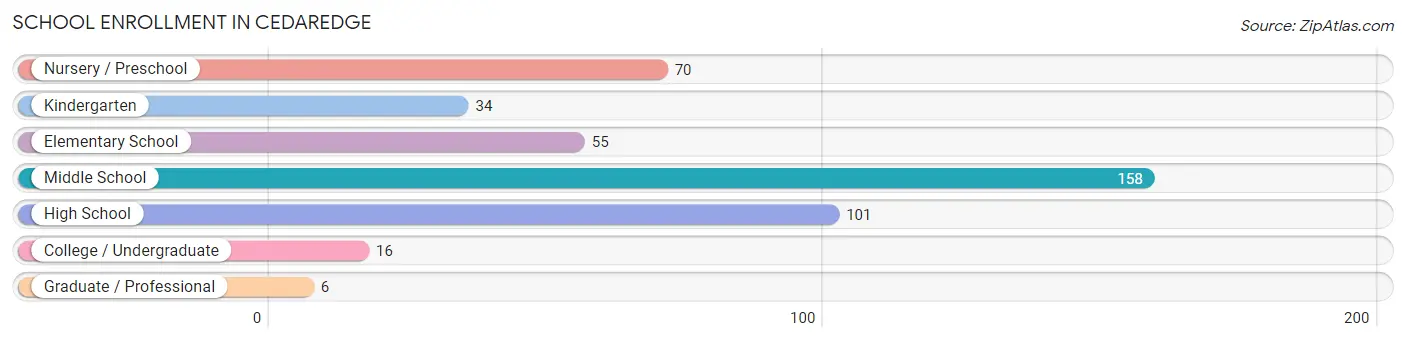
| School Level | # Students | % Students |
| Nursery / Preschool | 70 | 15.9% |
| Kindergarten | 34 | 7.7% |
| Elementary School | 55 | 12.5% |
| Middle School | 158 | 35.9% |
| High School | 101 | 23.0% |
| College / Undergraduate | 16 | 3.6% |
| Graduate / Professional | 6 | 1.4% |
| Total | 440 | 100.0% |
School Enrollment by Age by Funding Source in Cedaredge
Out of a total of 440 students who are enrolled in schools in Cedaredge, 7 (1.6%) attend a private institution, while the remaining 433 (98.4%) are enrolled in public schools. The age group of 20 to 24 year olds has the highest likelihood of being enrolled in private schools, with 5 (100.0% in the age bracket) enrolled. Conversely, the age group of 3 to 4 year olds has the lowest likelihood of being enrolled in a private school, with 56 (100.0% in the age bracket) attending a public institution.
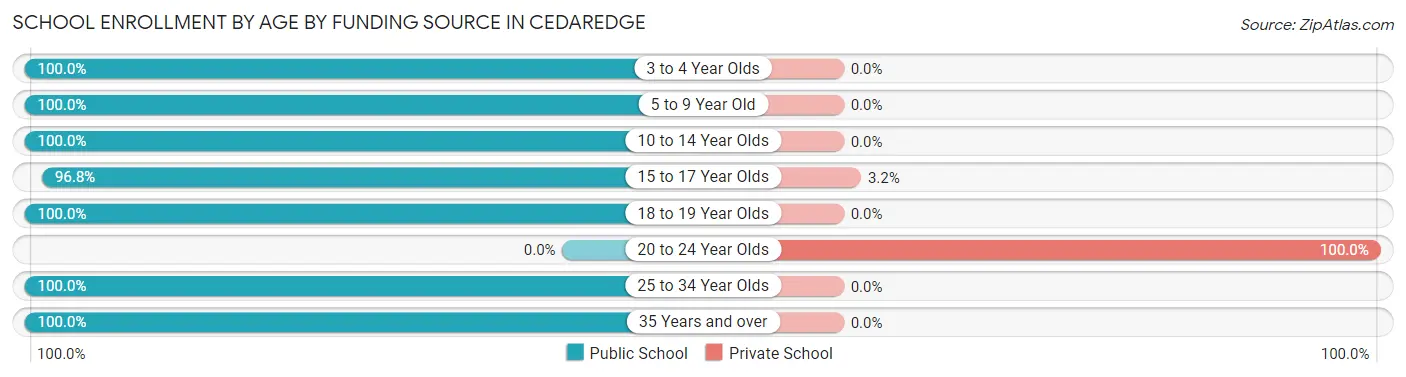
| Age Bracket | Public School | Private School |
| 3 to 4 Year Olds | 56 (100.0%) | 0 (0.0%) |
| 5 to 9 Year Old | 103 (100.0%) | 0 (0.0%) |
| 10 to 14 Year Olds | 158 (100.0%) | 0 (0.0%) |
| 15 to 17 Year Olds | 60 (96.8%) | 2 (3.2%) |
| 18 to 19 Year Olds | 16 (100.0%) | 0 (0.0%) |
| 20 to 24 Year Olds | 0 (0.0%) | 5 (100.0%) |
| 25 to 34 Year Olds | 36 (100.0%) | 0 (0.0%) |
| 35 Years and over | 4 (100.0%) | 0 (0.0%) |
| Total | 433 (98.4%) | 7 (1.6%) |
Educational Attainment by Field of Study in Cedaredge
Education (122 | 22.0%), business (95 | 17.1%), psychology (57 | 10.3%), science & technology (36 | 6.5%), and literature & languages (36 | 6.5%) are the most common fields of study among 555 individuals in Cedaredge who have obtained a bachelor's degree or higher.
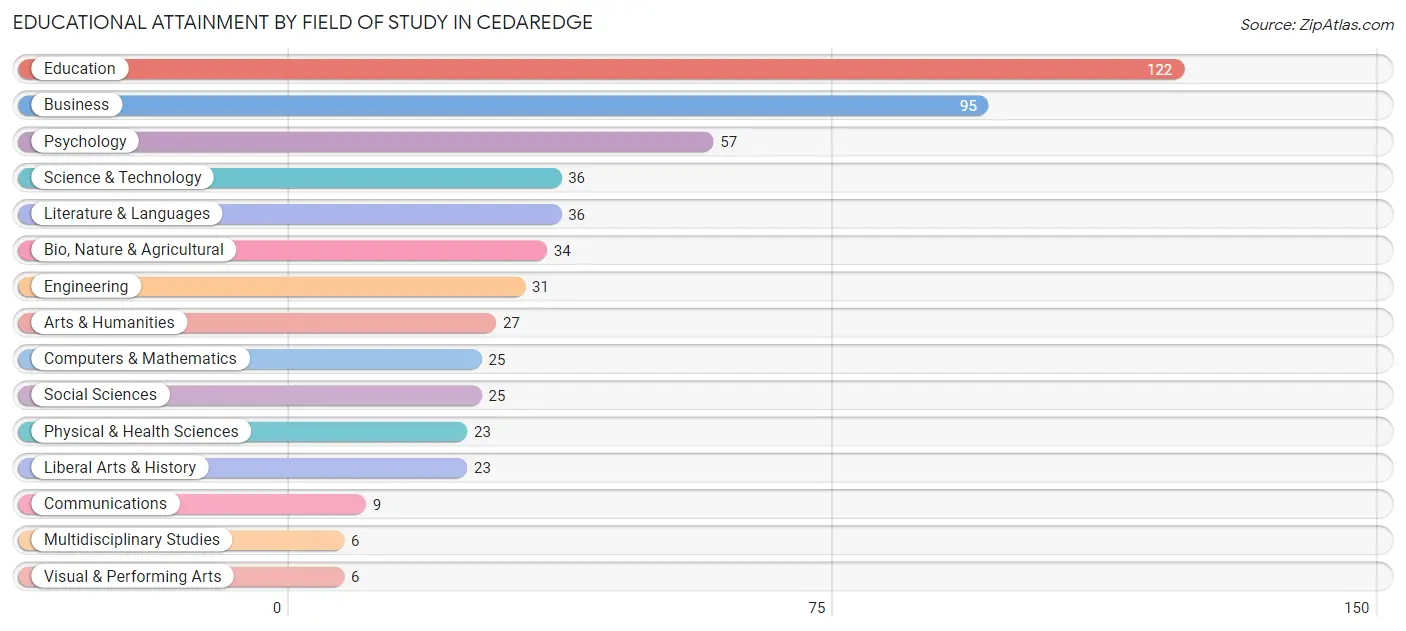
| Field of Study | # Graduates | % Graduates |
| Computers & Mathematics | 25 | 4.5% |
| Bio, Nature & Agricultural | 34 | 6.1% |
| Physical & Health Sciences | 23 | 4.1% |
| Psychology | 57 | 10.3% |
| Social Sciences | 25 | 4.5% |
| Engineering | 31 | 5.6% |
| Multidisciplinary Studies | 6 | 1.1% |
| Science & Technology | 36 | 6.5% |
| Business | 95 | 17.1% |
| Education | 122 | 22.0% |
| Literature & Languages | 36 | 6.5% |
| Liberal Arts & History | 23 | 4.1% |
| Visual & Performing Arts | 6 | 1.1% |
| Communications | 9 | 1.6% |
| Arts & Humanities | 27 | 4.9% |
| Total | 555 | 100.0% |
Transportation & Commute in Cedaredge
Vehicle Availability by Sex in Cedaredge
The most prevalent vehicle ownership categories in Cedaredge are males with 2 vehicles (229, accounting for 45.8%) and females with 2 vehicles (134, making up 55.3%).
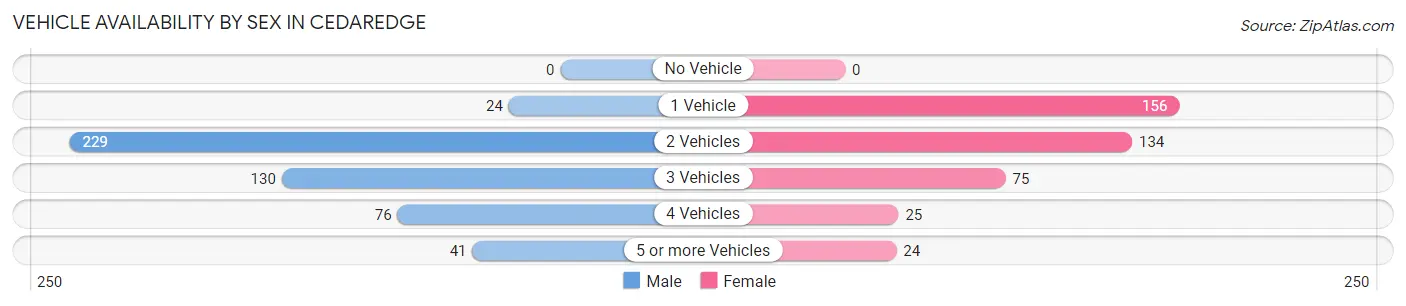
| Vehicles Available | Male | Female |
| No Vehicle | 0 (0.0%) | 0 (0.0%) |
| 1 Vehicle | 24 (4.8%) | 156 (37.7%) |
| 2 Vehicles | 229 (45.8%) | 134 (32.4%) |
| 3 Vehicles | 130 (26.0%) | 75 (18.1%) |
| 4 Vehicles | 76 (15.2%) | 25 (6.0%) |
| 5 or more Vehicles | 41 (8.2%) | 24 (5.8%) |
| Total | 500 (100.0%) | 414 (100.0%) |
Commute Time in Cedaredge
The most frequently occuring commute durations in Cedaredge are 20 to 24 minutes (141 commuters, 17.7%), 30 to 34 minutes (124 commuters, 15.6%), and 5 to 9 minutes (115 commuters, 14.4%).
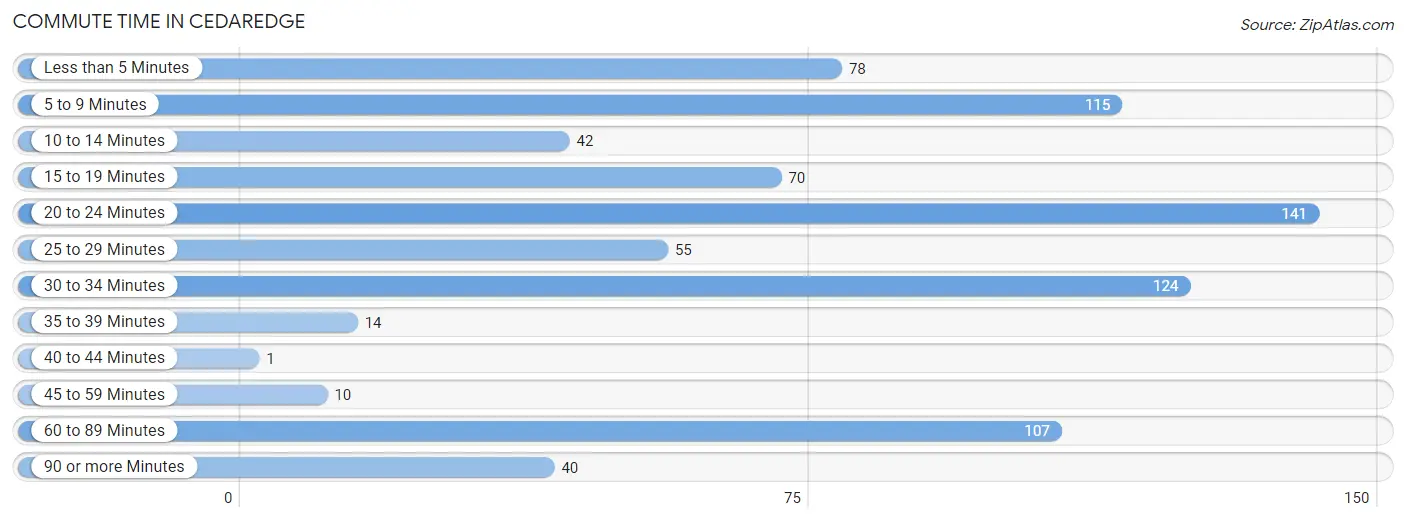
| Commute Time | # Commuters | % Commuters |
| Less than 5 Minutes | 78 | 9.8% |
| 5 to 9 Minutes | 115 | 14.4% |
| 10 to 14 Minutes | 42 | 5.3% |
| 15 to 19 Minutes | 70 | 8.8% |
| 20 to 24 Minutes | 141 | 17.7% |
| 25 to 29 Minutes | 55 | 6.9% |
| 30 to 34 Minutes | 124 | 15.6% |
| 35 to 39 Minutes | 14 | 1.8% |
| 40 to 44 Minutes | 1 | 0.1% |
| 45 to 59 Minutes | 10 | 1.3% |
| 60 to 89 Minutes | 107 | 13.4% |
| 90 or more Minutes | 40 | 5.0% |
Commute Time by Sex in Cedaredge
The most common commute times in Cedaredge are 30 to 34 minutes (104 commuters, 25.7%) for males and 5 to 9 minutes (102 commuters, 26.0%) for females.
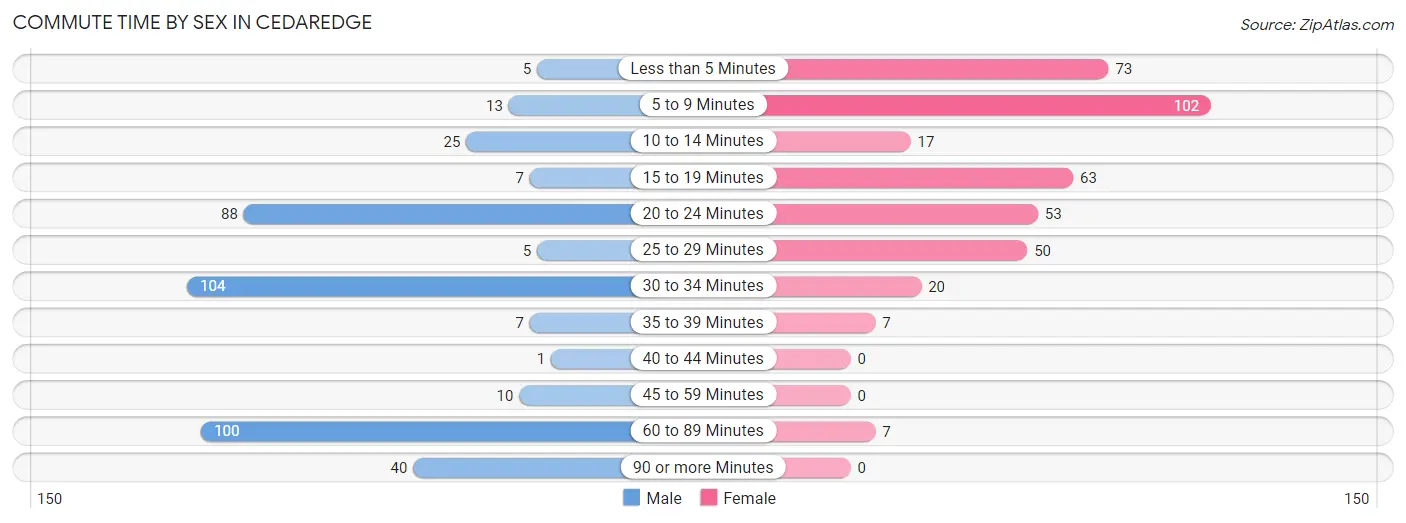
| Commute Time | Male | Female |
| Less than 5 Minutes | 5 (1.2%) | 73 (18.6%) |
| 5 to 9 Minutes | 13 (3.2%) | 102 (26.0%) |
| 10 to 14 Minutes | 25 (6.2%) | 17 (4.3%) |
| 15 to 19 Minutes | 7 (1.7%) | 63 (16.1%) |
| 20 to 24 Minutes | 88 (21.7%) | 53 (13.5%) |
| 25 to 29 Minutes | 5 (1.2%) | 50 (12.8%) |
| 30 to 34 Minutes | 104 (25.7%) | 20 (5.1%) |
| 35 to 39 Minutes | 7 (1.7%) | 7 (1.8%) |
| 40 to 44 Minutes | 1 (0.3%) | 0 (0.0%) |
| 45 to 59 Minutes | 10 (2.5%) | 0 (0.0%) |
| 60 to 89 Minutes | 100 (24.7%) | 7 (1.8%) |
| 90 or more Minutes | 40 (9.9%) | 0 (0.0%) |
Time of Departure to Work by Sex in Cedaredge
The most frequent times of departure to work in Cedaredge are 12:00 PM to 3:59 PM (76, 18.8%) for males and 12:00 PM to 3:59 PM (64, 16.3%) for females.
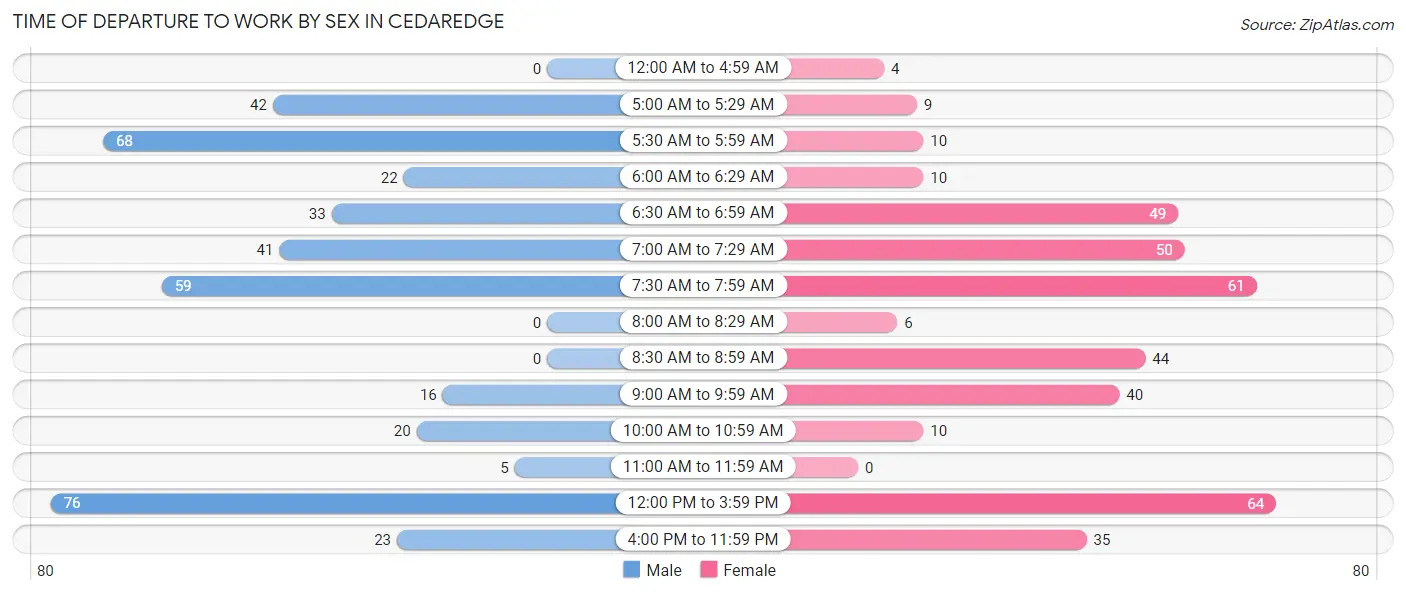
| Time of Departure | Male | Female |
| 12:00 AM to 4:59 AM | 0 (0.0%) | 4 (1.0%) |
| 5:00 AM to 5:29 AM | 42 (10.4%) | 9 (2.3%) |
| 5:30 AM to 5:59 AM | 68 (16.8%) | 10 (2.5%) |
| 6:00 AM to 6:29 AM | 22 (5.4%) | 10 (2.5%) |
| 6:30 AM to 6:59 AM | 33 (8.2%) | 49 (12.5%) |
| 7:00 AM to 7:29 AM | 41 (10.1%) | 50 (12.8%) |
| 7:30 AM to 7:59 AM | 59 (14.6%) | 61 (15.6%) |
| 8:00 AM to 8:29 AM | 0 (0.0%) | 6 (1.5%) |
| 8:30 AM to 8:59 AM | 0 (0.0%) | 44 (11.2%) |
| 9:00 AM to 9:59 AM | 16 (4.0%) | 40 (10.2%) |
| 10:00 AM to 10:59 AM | 20 (4.9%) | 10 (2.5%) |
| 11:00 AM to 11:59 AM | 5 (1.2%) | 0 (0.0%) |
| 12:00 PM to 3:59 PM | 76 (18.8%) | 64 (16.3%) |
| 4:00 PM to 11:59 PM | 23 (5.7%) | 35 (8.9%) |
| Total | 405 (100.0%) | 392 (100.0%) |
Housing Occupancy in Cedaredge
Occupancy by Ownership in Cedaredge
Of the total 1,214 dwellings in Cedaredge, owner-occupied units account for 872 (71.8%), while renter-occupied units make up 342 (28.2%).
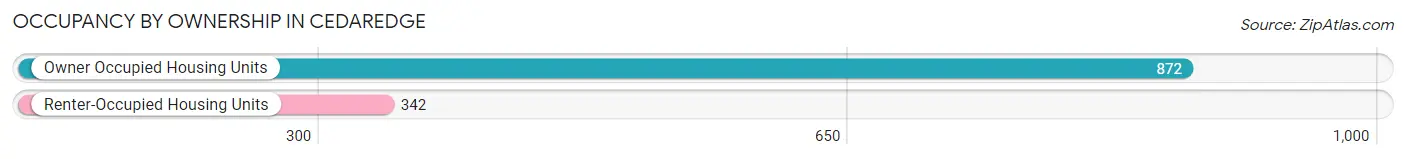
| Occupancy | # Housing Units | % Housing Units |
| Owner Occupied Housing Units | 872 | 71.8% |
| Renter-Occupied Housing Units | 342 | 28.2% |
| Total Occupied Housing Units | 1,214 | 100.0% |
Occupancy by Household Size in Cedaredge
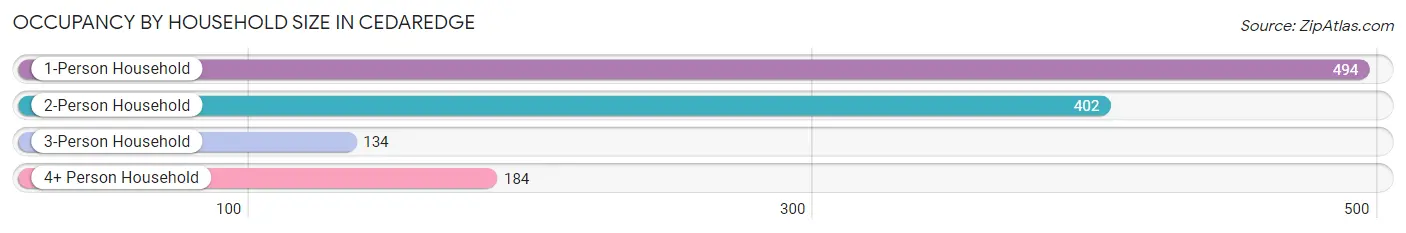
| Household Size | # Housing Units | % Housing Units |
| 1-Person Household | 494 | 40.7% |
| 2-Person Household | 402 | 33.1% |
| 3-Person Household | 134 | 11.0% |
| 4+ Person Household | 184 | 15.2% |
| Total Housing Units | 1,214 | 100.0% |
Occupancy by Ownership by Household Size in Cedaredge
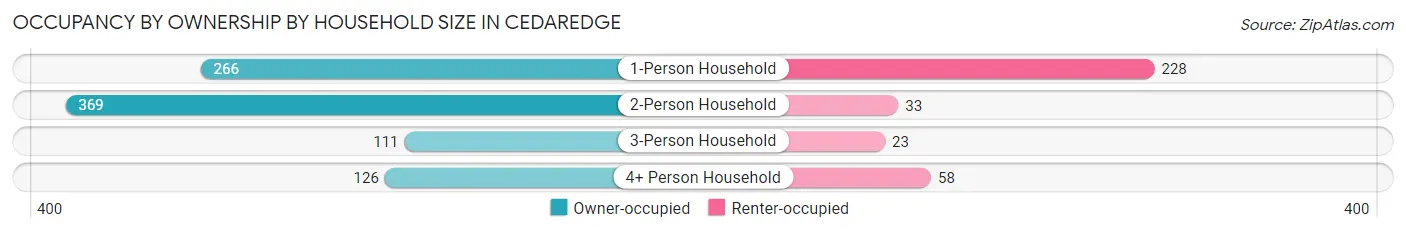
| Household Size | Owner-occupied | Renter-occupied |
| 1-Person Household | 266 (53.8%) | 228 (46.2%) |
| 2-Person Household | 369 (91.8%) | 33 (8.2%) |
| 3-Person Household | 111 (82.8%) | 23 (17.2%) |
| 4+ Person Household | 126 (68.5%) | 58 (31.5%) |
| Total Housing Units | 872 (71.8%) | 342 (28.2%) |
Occupancy by Educational Attainment in Cedaredge
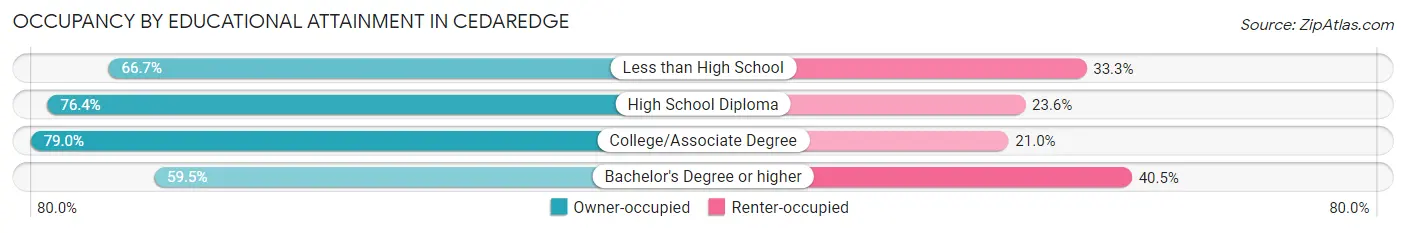
| Household Size | Owner-occupied | Renter-occupied |
| Less than High School | 58 (66.7%) | 29 (33.3%) |
| High School Diploma | 304 (76.4%) | 94 (23.6%) |
| College/Associate Degree | 309 (79.0%) | 82 (21.0%) |
| Bachelor's Degree or higher | 201 (59.5%) | 137 (40.5%) |
Occupancy by Age of Householder in Cedaredge
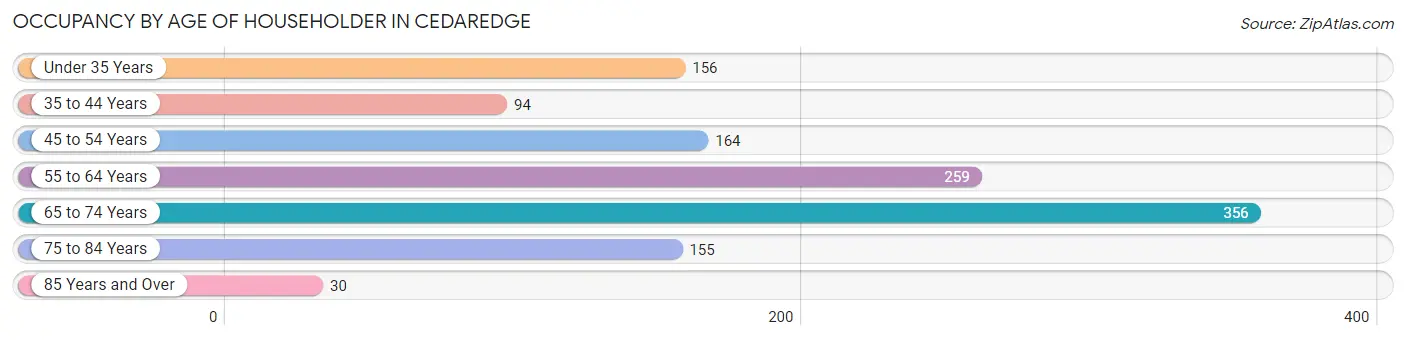
| Age Bracket | # Households | % Households |
| Under 35 Years | 156 | 12.9% |
| 35 to 44 Years | 94 | 7.7% |
| 45 to 54 Years | 164 | 13.5% |
| 55 to 64 Years | 259 | 21.3% |
| 65 to 74 Years | 356 | 29.3% |
| 75 to 84 Years | 155 | 12.8% |
| 85 Years and Over | 30 | 2.5% |
| Total | 1,214 | 100.0% |
Housing Finances in Cedaredge
Median Income by Occupancy in Cedaredge
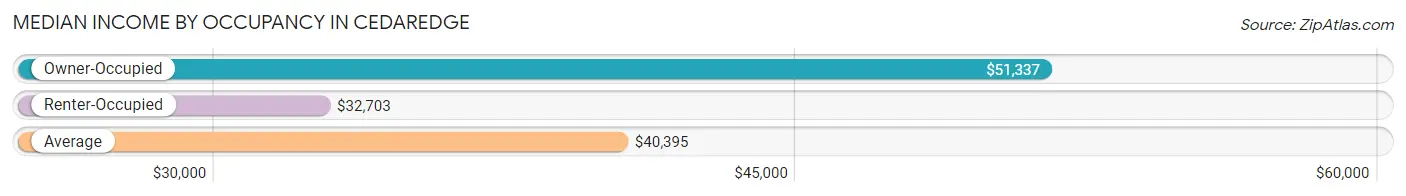
| Occupancy Type | # Households | Median Income |
| Owner-Occupied | 872 (71.8%) | $51,337 |
| Renter-Occupied | 342 (28.2%) | $32,703 |
| Average | 1,214 (100.0%) | $40,395 |
Occupancy by Householder Income Bracket in Cedaredge
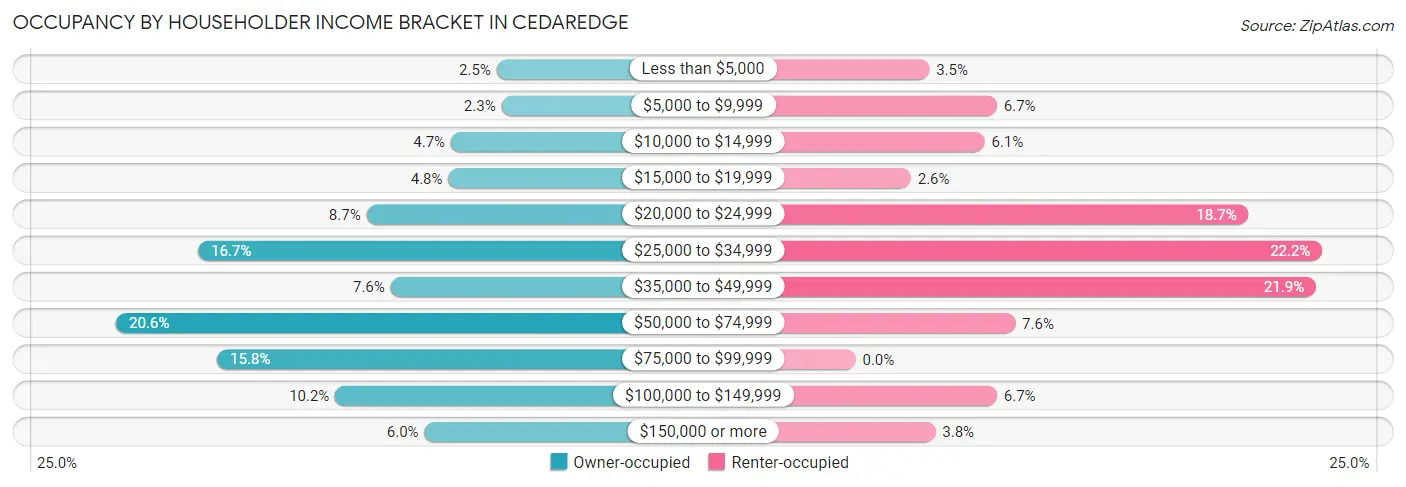
| Income Bracket | Owner-occupied | Renter-occupied |
| Less than $5,000 | 22 (2.5%) | 12 (3.5%) |
| $5,000 to $9,999 | 20 (2.3%) | 23 (6.7%) |
| $10,000 to $14,999 | 41 (4.7%) | 21 (6.1%) |
| $15,000 to $19,999 | 42 (4.8%) | 9 (2.6%) |
| $20,000 to $24,999 | 76 (8.7%) | 64 (18.7%) |
| $25,000 to $34,999 | 146 (16.7%) | 76 (22.2%) |
| $35,000 to $49,999 | 66 (7.6%) | 75 (21.9%) |
| $50,000 to $74,999 | 180 (20.6%) | 26 (7.6%) |
| $75,000 to $99,999 | 138 (15.8%) | 0 (0.0%) |
| $100,000 to $149,999 | 89 (10.2%) | 23 (6.7%) |
| $150,000 or more | 52 (6.0%) | 13 (3.8%) |
| Total | 872 (100.0%) | 342 (100.0%) |
Monthly Housing Cost Tiers in Cedaredge
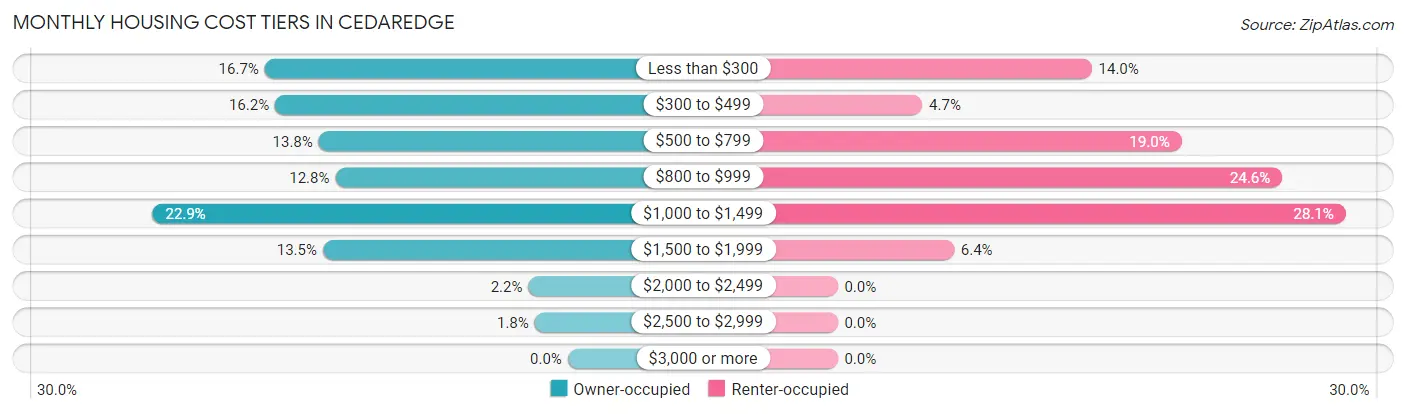
| Monthly Cost | Owner-occupied | Renter-occupied |
| Less than $300 | 146 (16.7%) | 48 (14.0%) |
| $300 to $499 | 141 (16.2%) | 16 (4.7%) |
| $500 to $799 | 120 (13.8%) | 65 (19.0%) |
| $800 to $999 | 112 (12.8%) | 84 (24.6%) |
| $1,000 to $1,499 | 200 (22.9%) | 96 (28.1%) |
| $1,500 to $1,999 | 118 (13.5%) | 22 (6.4%) |
| $2,000 to $2,499 | 19 (2.2%) | 0 (0.0%) |
| $2,500 to $2,999 | 16 (1.8%) | 0 (0.0%) |
| $3,000 or more | 0 (0.0%) | 0 (0.0%) |
| Total | 872 (100.0%) | 342 (100.0%) |
Physical Housing Characteristics in Cedaredge
Housing Structures in Cedaredge
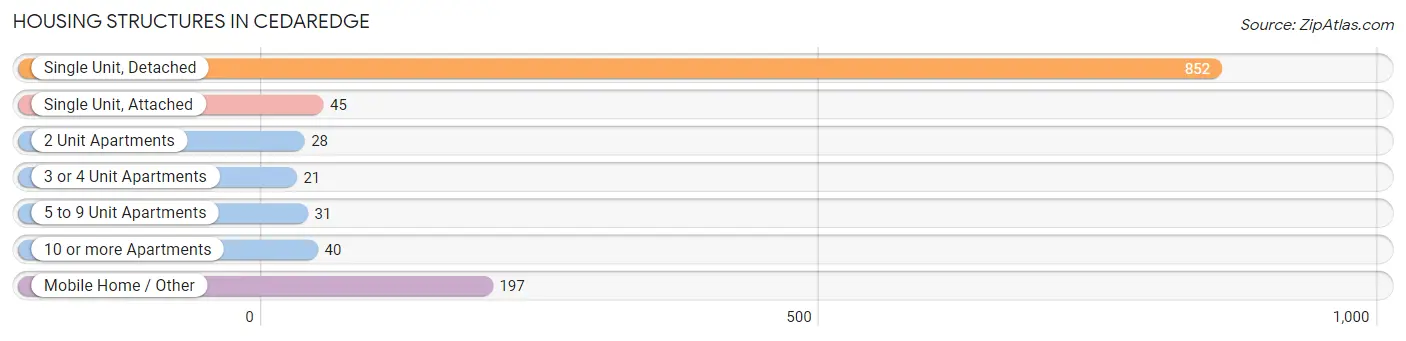
| Structure Type | # Housing Units | % Housing Units |
| Single Unit, Detached | 852 | 70.2% |
| Single Unit, Attached | 45 | 3.7% |
| 2 Unit Apartments | 28 | 2.3% |
| 3 or 4 Unit Apartments | 21 | 1.7% |
| 5 to 9 Unit Apartments | 31 | 2.5% |
| 10 or more Apartments | 40 | 3.3% |
| Mobile Home / Other | 197 | 16.2% |
| Total | 1,214 | 100.0% |
Housing Structures by Occupancy in Cedaredge
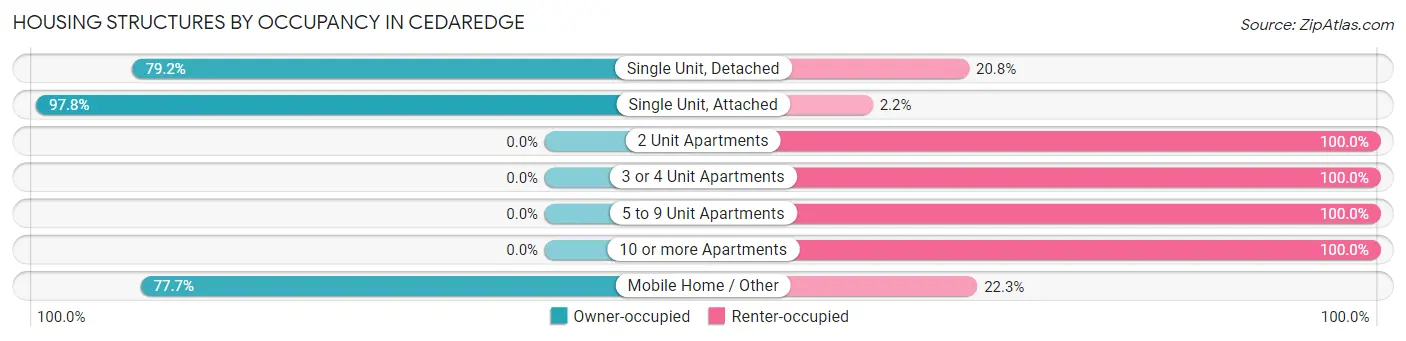
| Structure Type | Owner-occupied | Renter-occupied |
| Single Unit, Detached | 675 (79.2%) | 177 (20.8%) |
| Single Unit, Attached | 44 (97.8%) | 1 (2.2%) |
| 2 Unit Apartments | 0 (0.0%) | 28 (100.0%) |
| 3 or 4 Unit Apartments | 0 (0.0%) | 21 (100.0%) |
| 5 to 9 Unit Apartments | 0 (0.0%) | 31 (100.0%) |
| 10 or more Apartments | 0 (0.0%) | 40 (100.0%) |
| Mobile Home / Other | 153 (77.7%) | 44 (22.3%) |
| Total | 872 (71.8%) | 342 (28.2%) |
Housing Structures by Number of Rooms in Cedaredge
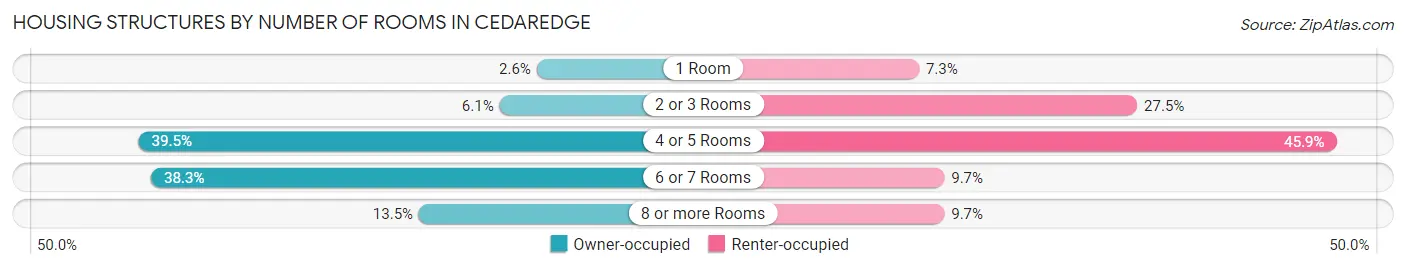
| Number of Rooms | Owner-occupied | Renter-occupied |
| 1 Room | 23 (2.6%) | 25 (7.3%) |
| 2 or 3 Rooms | 53 (6.1%) | 94 (27.5%) |
| 4 or 5 Rooms | 344 (39.5%) | 157 (45.9%) |
| 6 or 7 Rooms | 334 (38.3%) | 33 (9.7%) |
| 8 or more Rooms | 118 (13.5%) | 33 (9.7%) |
| Total | 872 (100.0%) | 342 (100.0%) |
Housing Structure by Heating Type in Cedaredge
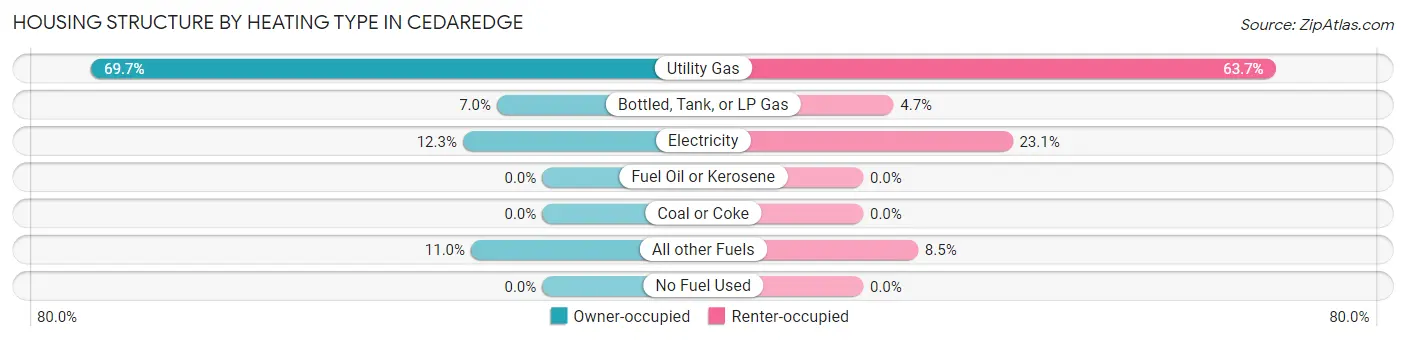
| Heating Type | Owner-occupied | Renter-occupied |
| Utility Gas | 608 (69.7%) | 218 (63.7%) |
| Bottled, Tank, or LP Gas | 61 (7.0%) | 16 (4.7%) |
| Electricity | 107 (12.3%) | 79 (23.1%) |
| Fuel Oil or Kerosene | 0 (0.0%) | 0 (0.0%) |
| Coal or Coke | 0 (0.0%) | 0 (0.0%) |
| All other Fuels | 96 (11.0%) | 29 (8.5%) |
| No Fuel Used | 0 (0.0%) | 0 (0.0%) |
| Total | 872 (100.0%) | 342 (100.0%) |
Household Vehicle Usage in Cedaredge
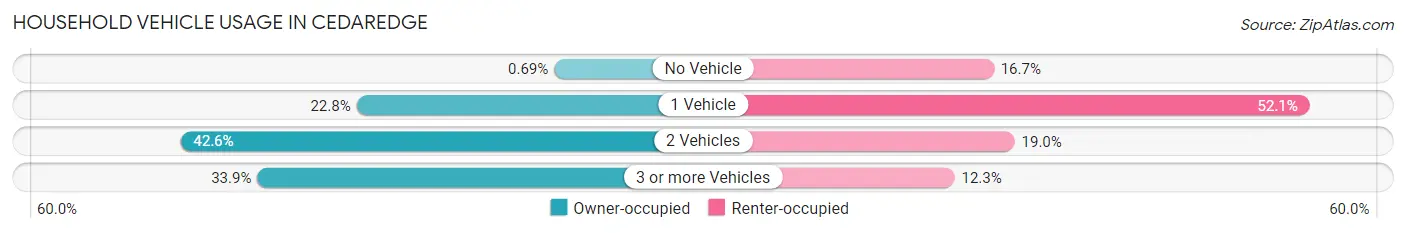
| Vehicles per Household | Owner-occupied | Renter-occupied |
| No Vehicle | 6 (0.7%) | 57 (16.7%) |
| 1 Vehicle | 199 (22.8%) | 178 (52.0%) |
| 2 Vehicles | 371 (42.5%) | 65 (19.0%) |
| 3 or more Vehicles | 296 (33.9%) | 42 (12.3%) |
| Total | 872 (100.0%) | 342 (100.0%) |
Real Estate & Mortgages in Cedaredge
Real Estate and Mortgage Overview in Cedaredge
| Characteristic | Without Mortgage | With Mortgage |
| Housing Units | 366 | 506 |
| Median Property Value | $248,700 | $224,500 |
| Median Household Income | $31,389 | $25 |
| Monthly Housing Costs | $350 | $0 |
| Real Estate Taxes | $711 | $0 |
Property Value by Mortgage Status in Cedaredge
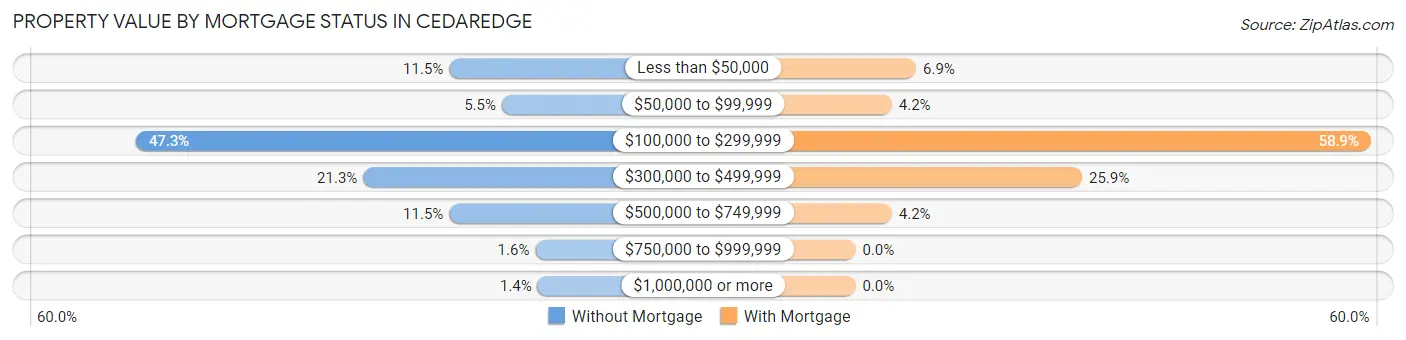
| Property Value | Without Mortgage | With Mortgage |
| Less than $50,000 | 42 (11.5%) | 35 (6.9%) |
| $50,000 to $99,999 | 20 (5.5%) | 21 (4.2%) |
| $100,000 to $299,999 | 173 (47.3%) | 298 (58.9%) |
| $300,000 to $499,999 | 78 (21.3%) | 131 (25.9%) |
| $500,000 to $749,999 | 42 (11.5%) | 21 (4.2%) |
| $750,000 to $999,999 | 6 (1.6%) | 0 (0.0%) |
| $1,000,000 or more | 5 (1.4%) | 0 (0.0%) |
| Total | 366 (100.0%) | 506 (100.0%) |
Household Income by Mortgage Status in Cedaredge
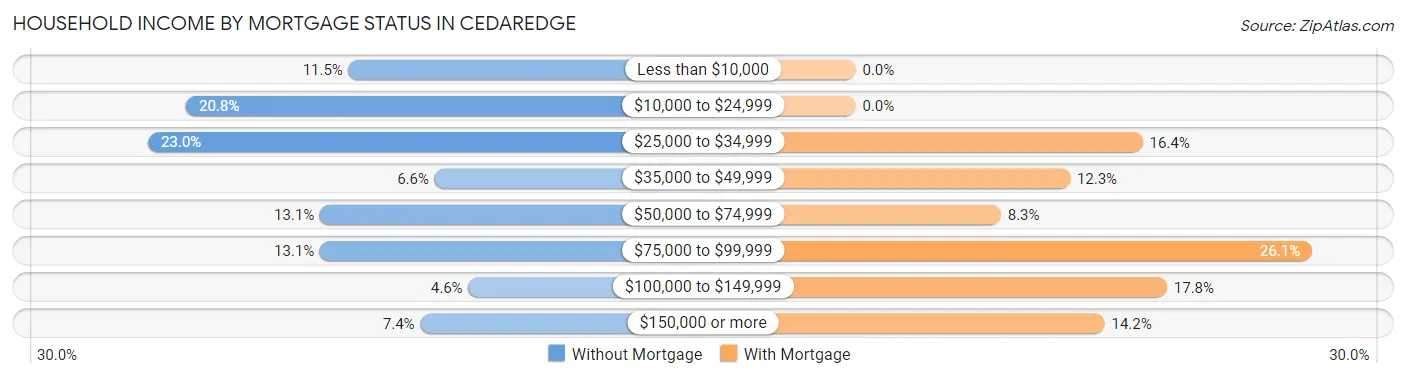
| Household Income | Without Mortgage | With Mortgage |
| Less than $10,000 | 42 (11.5%) | 0 (0.0%) |
| $10,000 to $24,999 | 76 (20.8%) | 0 (0.0%) |
| $25,000 to $34,999 | 84 (23.0%) | 83 (16.4%) |
| $35,000 to $49,999 | 24 (6.6%) | 62 (12.2%) |
| $50,000 to $74,999 | 48 (13.1%) | 42 (8.3%) |
| $75,000 to $99,999 | 48 (13.1%) | 132 (26.1%) |
| $100,000 to $149,999 | 17 (4.6%) | 90 (17.8%) |
| $150,000 or more | 27 (7.4%) | 72 (14.2%) |
| Total | 366 (100.0%) | 506 (100.0%) |
Property Value to Household Income Ratio in Cedaredge
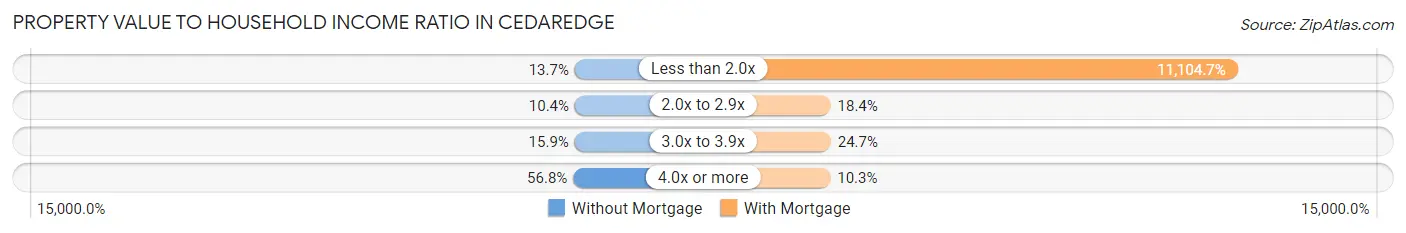
| Value-to-Income Ratio | Without Mortgage | With Mortgage |
| Less than 2.0x | 50 (13.7%) | 56,190 (11,104.7%) |
| 2.0x to 2.9x | 38 (10.4%) | 93 (18.4%) |
| 3.0x to 3.9x | 58 (15.9%) | 125 (24.7%) |
| 4.0x or more | 208 (56.8%) | 52 (10.3%) |
| Total | 366 (100.0%) | 506 (100.0%) |
Real Estate Taxes by Mortgage Status in Cedaredge
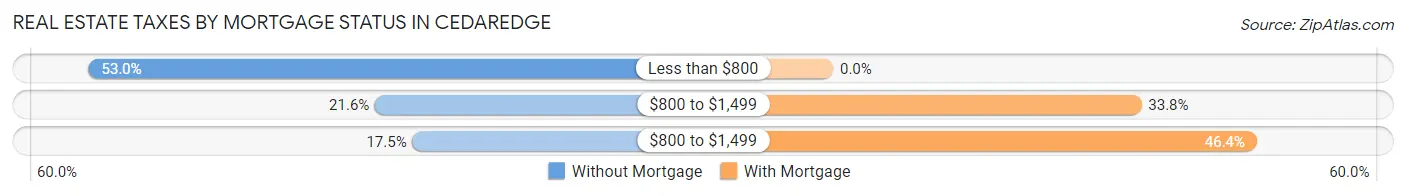
| Property Taxes | Without Mortgage | With Mortgage |
| Less than $800 | 194 (53.0%) | 0 (0.0%) |
| $800 to $1,499 | 79 (21.6%) | 171 (33.8%) |
| $800 to $1,499 | 64 (17.5%) | 235 (46.4%) |
| Total | 366 (100.0%) | 506 (100.0%) |
Health & Disability in Cedaredge
Health Insurance Coverage by Age in Cedaredge
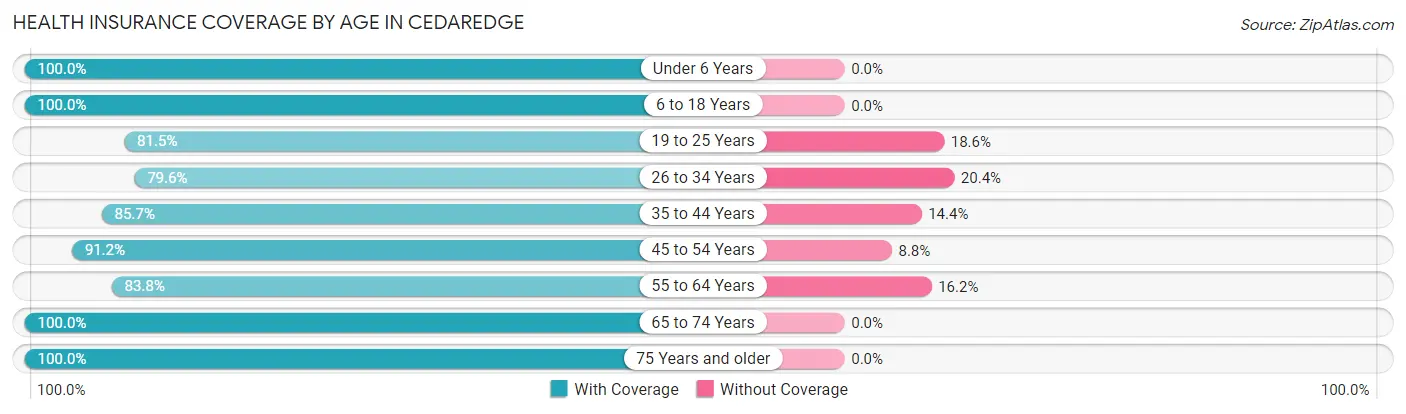
| Age Bracket | With Coverage | Without Coverage |
| Under 6 Years | 168 (100.0%) | 0 (0.0%) |
| 6 to 18 Years | 330 (100.0%) | 0 (0.0%) |
| 19 to 25 Years | 101 (81.5%) | 23 (18.5%) |
| 26 to 34 Years | 179 (79.6%) | 46 (20.4%) |
| 35 to 44 Years | 185 (85.7%) | 31 (14.3%) |
| 45 to 54 Years | 300 (91.2%) | 29 (8.8%) |
| 55 to 64 Years | 367 (83.8%) | 71 (16.2%) |
| 65 to 74 Years | 511 (100.0%) | 0 (0.0%) |
| 75 Years and older | 231 (100.0%) | 0 (0.0%) |
| Total | 2,372 (92.2%) | 200 (7.8%) |
Health Insurance Coverage by Citizenship Status in Cedaredge
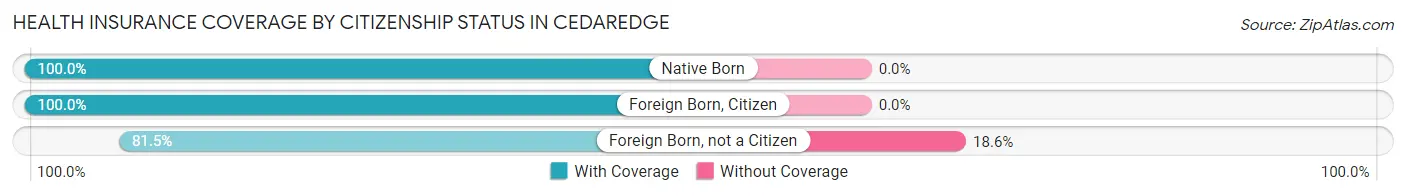
| Citizenship Status | With Coverage | Without Coverage |
| Native Born | 168 (100.0%) | 0 (0.0%) |
| Foreign Born, Citizen | 330 (100.0%) | 0 (0.0%) |
| Foreign Born, not a Citizen | 101 (81.5%) | 23 (18.5%) |
Health Insurance Coverage by Household Income in Cedaredge
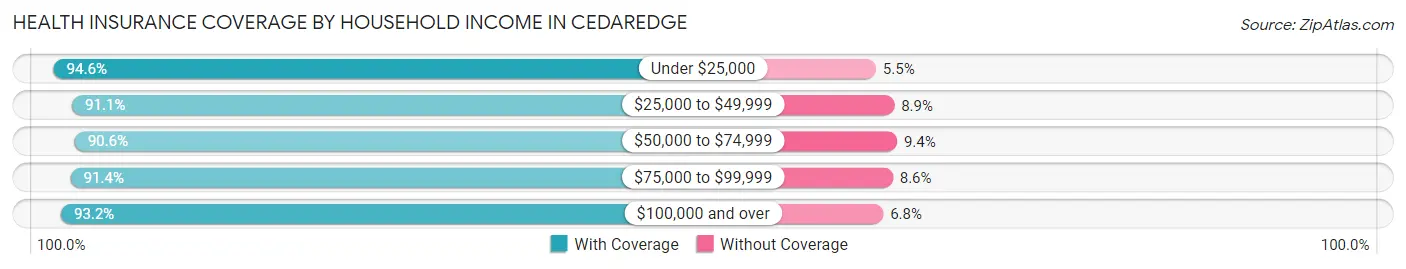
| Household Income | With Coverage | Without Coverage |
| Under $25,000 | 590 (94.6%) | 34 (5.4%) |
| $25,000 to $49,999 | 615 (91.1%) | 60 (8.9%) |
| $50,000 to $74,999 | 453 (90.6%) | 47 (9.4%) |
| $75,000 to $99,999 | 318 (91.4%) | 30 (8.6%) |
| $100,000 and over | 396 (93.2%) | 29 (6.8%) |
Public vs Private Health Insurance Coverage by Age in Cedaredge
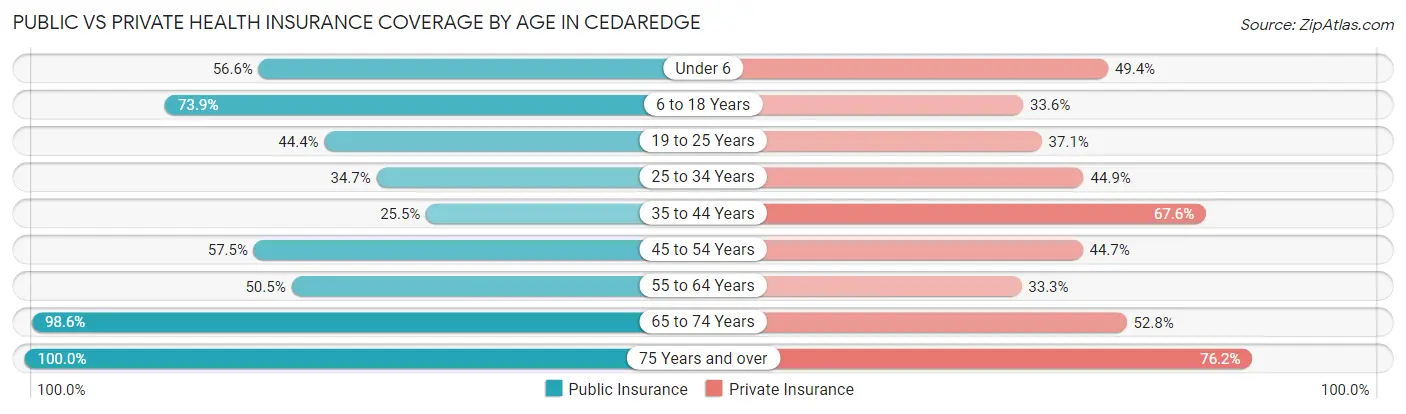
| Age Bracket | Public Insurance | Private Insurance |
| Under 6 | 95 (56.6%) | 83 (49.4%) |
| 6 to 18 Years | 244 (73.9%) | 111 (33.6%) |
| 19 to 25 Years | 55 (44.4%) | 46 (37.1%) |
| 25 to 34 Years | 78 (34.7%) | 101 (44.9%) |
| 35 to 44 Years | 55 (25.5%) | 146 (67.6%) |
| 45 to 54 Years | 189 (57.5%) | 147 (44.7%) |
| 55 to 64 Years | 221 (50.5%) | 146 (33.3%) |
| 65 to 74 Years | 504 (98.6%) | 270 (52.8%) |
| 75 Years and over | 231 (100.0%) | 176 (76.2%) |
| Total | 1,672 (65.0%) | 1,226 (47.7%) |
Disability Status by Sex by Age in Cedaredge
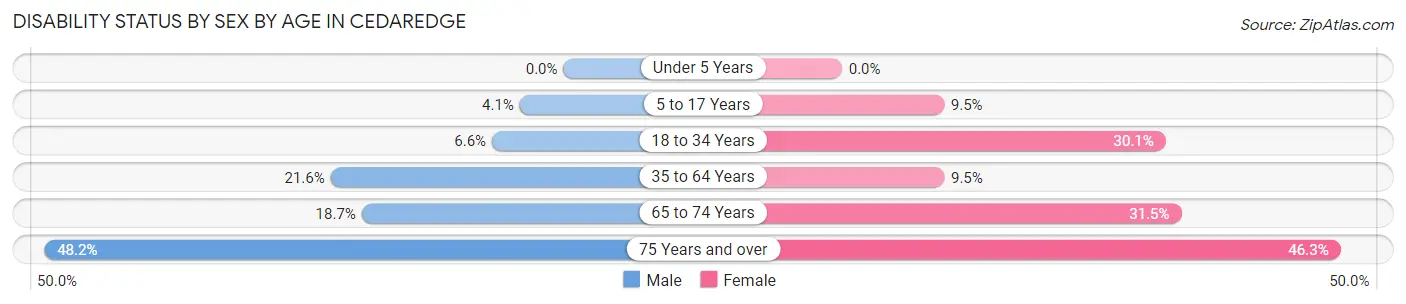
| Age Bracket | Male | Female |
| Under 5 Years | 0 (0.0%) | 0 (0.0%) |
| 5 to 17 Years | 7 (4.1%) | 16 (9.5%) |
| 18 to 34 Years | 11 (6.6%) | 61 (30.0%) |
| 35 to 64 Years | 94 (21.6%) | 52 (9.5%) |
| 65 to 74 Years | 41 (18.7%) | 92 (31.5%) |
| 75 Years and over | 53 (48.2%) | 56 (46.3%) |
Disability Class by Sex by Age in Cedaredge
Disability Class: Hearing Difficulty
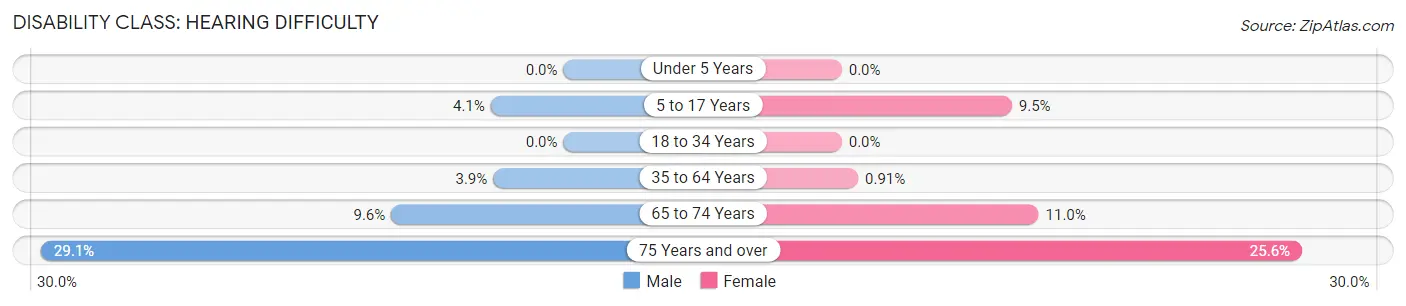
| Age Bracket | Male | Female |
| Under 5 Years | 0 (0.0%) | 0 (0.0%) |
| 5 to 17 Years | 7 (4.1%) | 16 (9.5%) |
| 18 to 34 Years | 0 (0.0%) | 0 (0.0%) |
| 35 to 64 Years | 17 (3.9%) | 5 (0.9%) |
| 65 to 74 Years | 21 (9.6%) | 32 (11.0%) |
| 75 Years and over | 32 (29.1%) | 31 (25.6%) |
Disability Class: Vision Difficulty
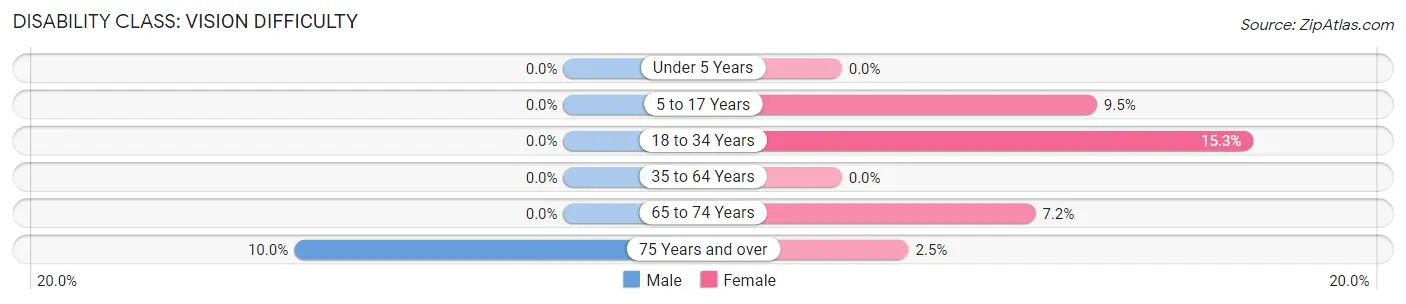
| Age Bracket | Male | Female |
| Under 5 Years | 0 (0.0%) | 0 (0.0%) |
| 5 to 17 Years | 0 (0.0%) | 16 (9.5%) |
| 18 to 34 Years | 0 (0.0%) | 31 (15.3%) |
| 35 to 64 Years | 0 (0.0%) | 0 (0.0%) |
| 65 to 74 Years | 0 (0.0%) | 21 (7.2%) |
| 75 Years and over | 11 (10.0%) | 3 (2.5%) |
Disability Class: Cognitive Difficulty
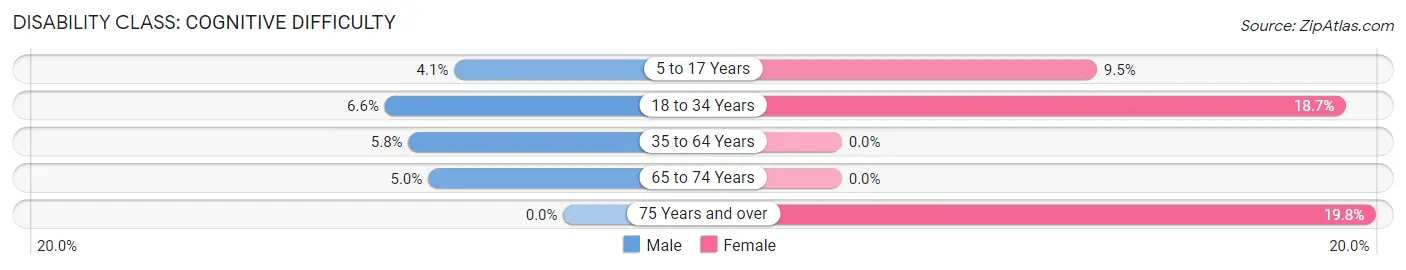
| Age Bracket | Male | Female |
| 5 to 17 Years | 7 (4.1%) | 16 (9.5%) |
| 18 to 34 Years | 11 (6.6%) | 38 (18.7%) |
| 35 to 64 Years | 25 (5.8%) | 0 (0.0%) |
| 65 to 74 Years | 11 (5.0%) | 0 (0.0%) |
| 75 Years and over | 0 (0.0%) | 24 (19.8%) |
Disability Class: Ambulatory Difficulty
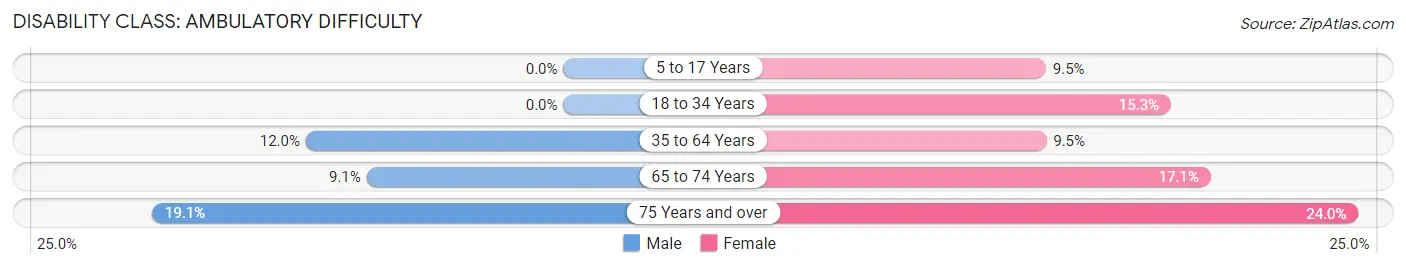
| Age Bracket | Male | Female |
| 5 to 17 Years | 0 (0.0%) | 16 (9.5%) |
| 18 to 34 Years | 0 (0.0%) | 31 (15.3%) |
| 35 to 64 Years | 52 (11.9%) | 52 (9.5%) |
| 65 to 74 Years | 20 (9.1%) | 50 (17.1%) |
| 75 Years and over | 21 (19.1%) | 29 (24.0%) |
Disability Class: Self-Care Difficulty
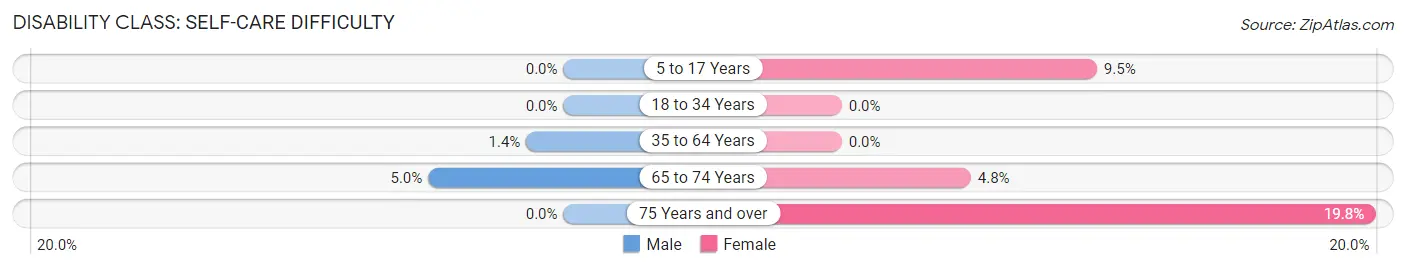
| Age Bracket | Male | Female |
| 5 to 17 Years | 0 (0.0%) | 16 (9.5%) |
| 18 to 34 Years | 0 (0.0%) | 0 (0.0%) |
| 35 to 64 Years | 6 (1.4%) | 0 (0.0%) |
| 65 to 74 Years | 11 (5.0%) | 14 (4.8%) |
| 75 Years and over | 0 (0.0%) | 24 (19.8%) |
Technology Access in Cedaredge
Computing Device Access in Cedaredge
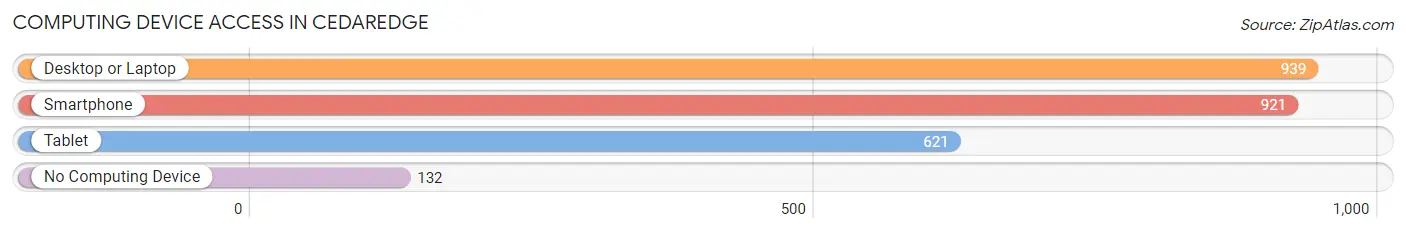
| Device Type | # Households | % Households |
| Desktop or Laptop | 939 | 77.3% |
| Smartphone | 921 | 75.9% |
| Tablet | 621 | 51.1% |
| No Computing Device | 132 | 10.9% |
| Total | 1,214 | 100.0% |
Internet Access in Cedaredge
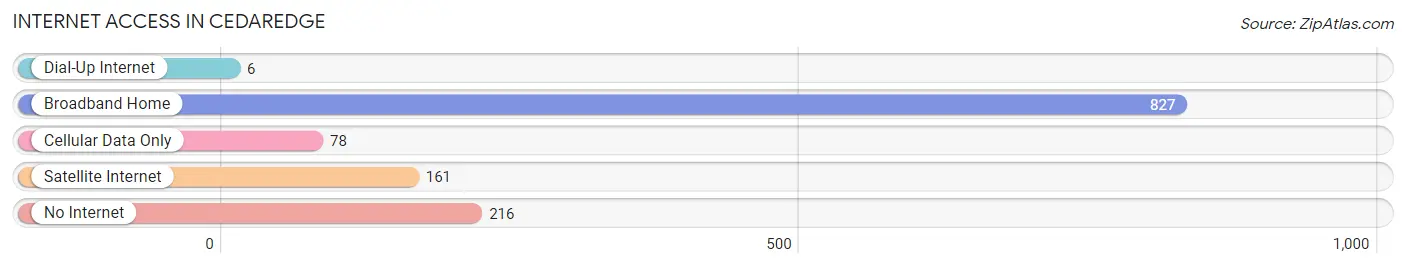
| Internet Type | # Households | % Households |
| Dial-Up Internet | 6 | 0.5% |
| Broadband Home | 827 | 68.1% |
| Cellular Data Only | 78 | 6.4% |
| Satellite Internet | 161 | 13.3% |
| No Internet | 216 | 17.8% |
| Total | 1,214 | 100.0% |
Cedaredge Summary
Cedaredge is a small town located in Delta County, Colorado, United States. It is situated in the Grand Mesa National Forest, at the base of the Grand Mesa, the world’s largest flat-topped mountain. The town was founded in 1882 and incorporated in 1906. As of the 2010 census, the population of Cedaredge was 2,252.
Geography
Cedaredge is located at an elevation of 6,000 feet (1,829 m) in the Grand Mesa National Forest. It is situated at the base of the Grand Mesa, the world’s largest flat-topped mountain. The town is located in the Uncompahgre Valley, which is surrounded by the Grand Mesa to the east, the West Elk Mountains to the west, and the San Juan Mountains to the south. The town is located approximately 30 miles (48 km) east of Grand Junction, Colorado, and is accessible via State Highway 65.
Climate
Cedaredge has a semi-arid climate, with hot summers and cold winters. The average annual temperature is 48.3°F (9.1°C), with an average high of 79.2°F (26.2°C) in July and an average low of 17.2°F (-8.2°C) in January. The average annual precipitation is 11.3 inches (286 mm).
Demographics
As of the 2010 census, there were 2,252 people, 945 households, and 617 families residing in Cedaredge. The population density was 1,072.3 people per square mile (414.7/km2). The racial makeup of the town was 95.2% White, 0.2% African American, 0.7% Native American, 0.4% Asian, 0.1% Pacific Islander, 1.3% from other races, and 2.1% from two or more races. Hispanic or Latino of any race were 4.3% of the population.
Economy
Cedaredge’s economy is largely based on agriculture and tourism. The town is home to several farms and ranches, as well as a number of wineries and breweries. The town is also a popular destination for outdoor recreation, with numerous hiking and biking trails, fishing spots, and camping areas.
History
Cedaredge was founded in 1882 by a group of settlers from the Midwest. The town was named after the cedar trees that grew in the area. In 1906, the town was incorporated and the first mayor was elected.
In the early 20th century, Cedaredge was a major producer of peaches, apples, and other fruits. The town was also home to several coal mines, which provided jobs for many of the town’s residents.
In the 1950s, the town began to decline as the coal mines closed and the fruit industry moved away. However, in recent years, the town has seen a resurgence in tourism and outdoor recreation.
Common Questions
What is Per Capita Income in Cedaredge?
Per Capita income in Cedaredge is $27,104.
What is the Median Family Income in Cedaredge?
Median Family Income in Cedaredge is $51,657.
What is the Median Household income in Cedaredge?
Median Household Income in Cedaredge is $40,395.
What is Income or Wage Gap in Cedaredge?
Income or Wage Gap in Cedaredge is 50.5%.
Women in Cedaredge earn 49.5 cents for every dollar earned by a man.
What is Inequality or Gini Index in Cedaredge?
Inequality or Gini Index in Cedaredge is 0.43.
What is the Total Population of Cedaredge?
Total Population of Cedaredge is 2,572.
What is the Total Male Population of Cedaredge?
Total Male Population of Cedaredge is 1,186.
What is the Total Female Population of Cedaredge?
Total Female Population of Cedaredge is 1,386.
What is the Ratio of Males per 100 Females in Cedaredge?
There are 85.57 Males per 100 Females in Cedaredge.
What is the Ratio of Females per 100 Males in Cedaredge?
There are 116.86 Females per 100 Males in Cedaredge.
What is the Median Population Age in Cedaredge?
Median Population Age in Cedaredge is 51.3 Years.
What is the Average Family Size in Cedaredge
Average Family Size in Cedaredge is 2.9 People.
What is the Average Household Size in Cedaredge
Average Household Size in Cedaredge is 2.1 People.
How Large is the Labor Force in Cedaredge?
There are 1,082 People in the Labor Forcein in Cedaredge.
What is the Percentage of People in the Labor Force in Cedaredge?
51.1% of People are in the Labor Force in Cedaredge.
What is the Unemployment Rate in Cedaredge?
Unemployment Rate in Cedaredge is 12.8%.