Carbondale, CO Map & Demographics
Carbondale Map
Carbondale Overview
$54,323
PER CAPITA INCOME
$117,363
AVG FAMILY INCOME
$92,083
AVG HOUSEHOLD INCOME
15.3%
WAGE / INCOME GAP [ % ]
84.7¢/ $1
WAGE / INCOME GAP [ $ ]
0.46
INEQUALITY / GINI INDEX
6,497
TOTAL POPULATION
3,841
MALE POPULATION
2,656
FEMALE POPULATION
144.62
MALES / 100 FEMALES
69.15
FEMALES / 100 MALES
42.0
MEDIAN AGE
2.6
AVG FAMILY SIZE
2.3
AVG HOUSEHOLD SIZE
4,413
LABOR FORCE [ PEOPLE ]
78.6%
PERCENT IN LABOR FORCE
1.1%
UNEMPLOYMENT RATE
Carbondale Zip Codes
Carbondale Area Codes
Income in Carbondale
Income Overview in Carbondale
Per Capita Income in Carbondale is $54,323, while median incomes of families and households are $117,363 and $92,083 respectively.
| Characteristic | Number | Measure |
| Per Capita Income | 6,497 | $54,323 |
| Median Family Income | 1,536 | $117,363 |
| Mean Family Income | 1,536 | $159,242 |
| Median Household Income | 2,780 | $92,083 |
| Mean Household Income | 2,780 | $123,371 |
| Income Deficit | 1,536 | $0 |
| Wage / Income Gap (%) | 6,497 | 15.33% |
| Wage / Income Gap ($) | 6,497 | 84.67¢ per $1 |
| Gini / Inequality Index | 6,497 | 0.46 |
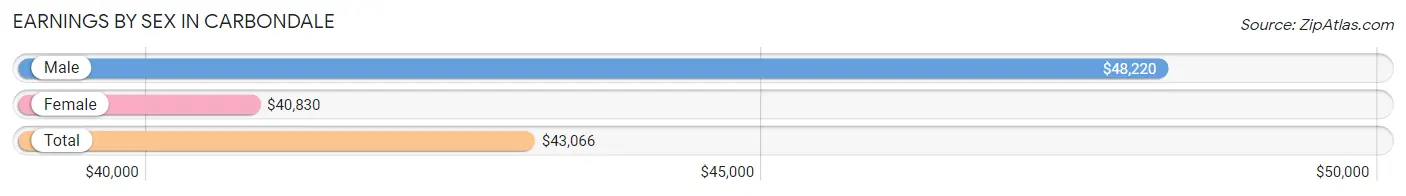
Earnings by Sex in Carbondale
Average Earnings in Carbondale are $43,066, $48,220 for men and $40,830 for women, a difference of 15.3%.
| Sex | Number | Average Earnings |
| Male | 2,863 (61.2%) | $48,220 |
| Female | 1,817 (38.8%) | $40,830 |
| Total | 4,680 (100.0%) | $43,066 |
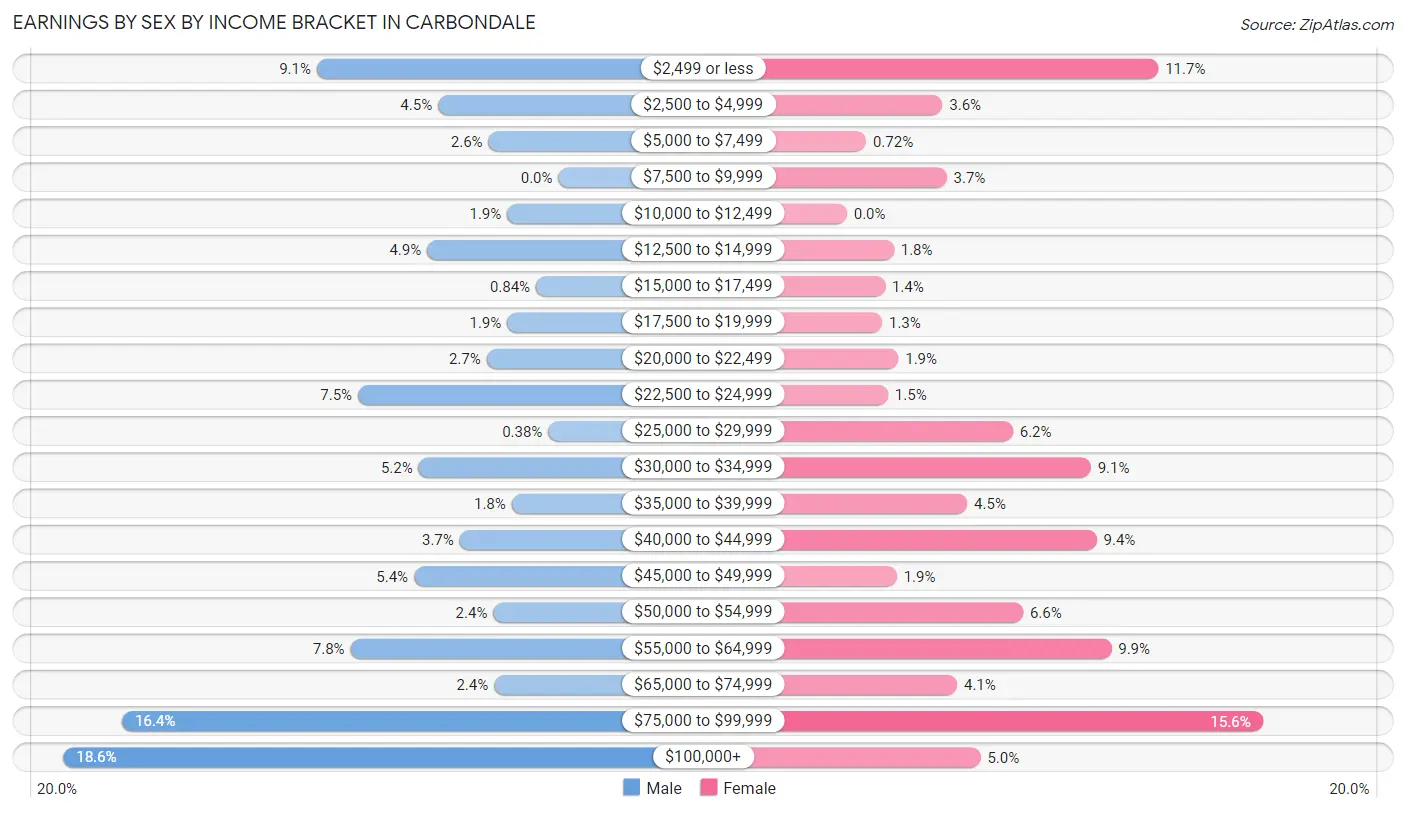
Earnings by Sex by Income Bracket in Carbondale
The most common earnings brackets in Carbondale are $100,000+ for men (531 | 18.5%) and $75,000 to $99,999 for women (283 | 15.6%).
| Income | Male | Female |
| $2,499 or less | 259 (9.0%) | 212 (11.7%) |
| $2,500 to $4,999 | 129 (4.5%) | 65 (3.6%) |
| $5,000 to $7,499 | 75 (2.6%) | 13 (0.7%) |
| $7,500 to $9,999 | 0 (0.0%) | 68 (3.7%) |
| $10,000 to $12,499 | 55 (1.9%) | 0 (0.0%) |
| $12,500 to $14,999 | 141 (4.9%) | 32 (1.8%) |
| $15,000 to $17,499 | 24 (0.8%) | 26 (1.4%) |
| $17,500 to $19,999 | 55 (1.9%) | 24 (1.3%) |
| $20,000 to $22,499 | 77 (2.7%) | 35 (1.9%) |
| $22,500 to $24,999 | 215 (7.5%) | 28 (1.5%) |
| $25,000 to $29,999 | 11 (0.4%) | 113 (6.2%) |
| $30,000 to $34,999 | 150 (5.2%) | 166 (9.1%) |
| $35,000 to $39,999 | 50 (1.8%) | 82 (4.5%) |
| $40,000 to $44,999 | 106 (3.7%) | 170 (9.4%) |
| $45,000 to $49,999 | 155 (5.4%) | 34 (1.9%) |
| $50,000 to $54,999 | 70 (2.4%) | 120 (6.6%) |
| $55,000 to $64,999 | 223 (7.8%) | 180 (9.9%) |
| $65,000 to $74,999 | 69 (2.4%) | 75 (4.1%) |
| $75,000 to $99,999 | 468 (16.4%) | 283 (15.6%) |
| $100,000+ | 531 (18.5%) | 91 (5.0%) |
| Total | 2,863 (100.0%) | 1,817 (100.0%) |
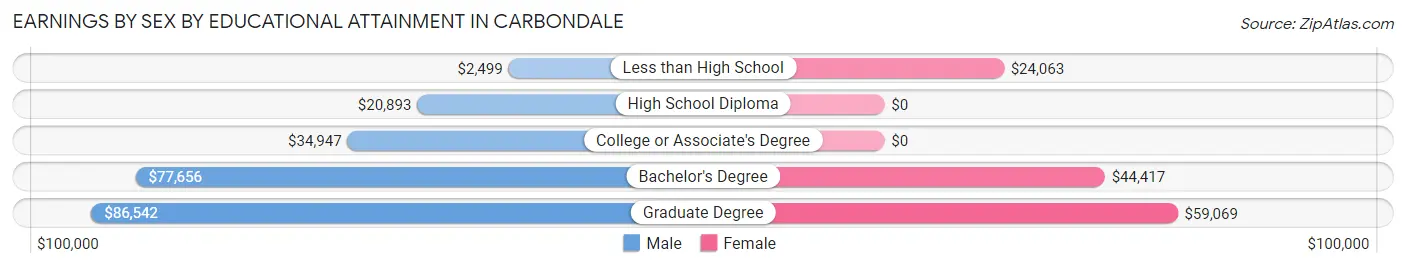
Earnings by Sex by Educational Attainment in Carbondale
Average earnings in Carbondale are $49,558 for men and $43,646 for women, a difference of 11.9%. Men with an educational attainment of graduate degree enjoy the highest average annual earnings of $86,542, while those with less than high school education earn the least with $2,499. Women with an educational attainment of graduate degree earn the most with the average annual earnings of $59,069, while those with less than high school education have the smallest earnings of $24,063.
| Educational Attainment | Male Income | Female Income |
| Less than High School | $2,499 | $24,063 |
| High School Diploma | $20,893 | $0 |
| College or Associate's Degree | $34,947 | $0 |
| Bachelor's Degree | $77,656 | $44,417 |
| Graduate Degree | $86,542 | $59,069 |
| Total | $49,558 | $43,646 |
Family Income in Carbondale
Family Income Brackets in Carbondale
According to the Carbondale family income data, there are 366 families falling into the $200,000+ income range, which is the most common income bracket and makes up 23.8% of all families.
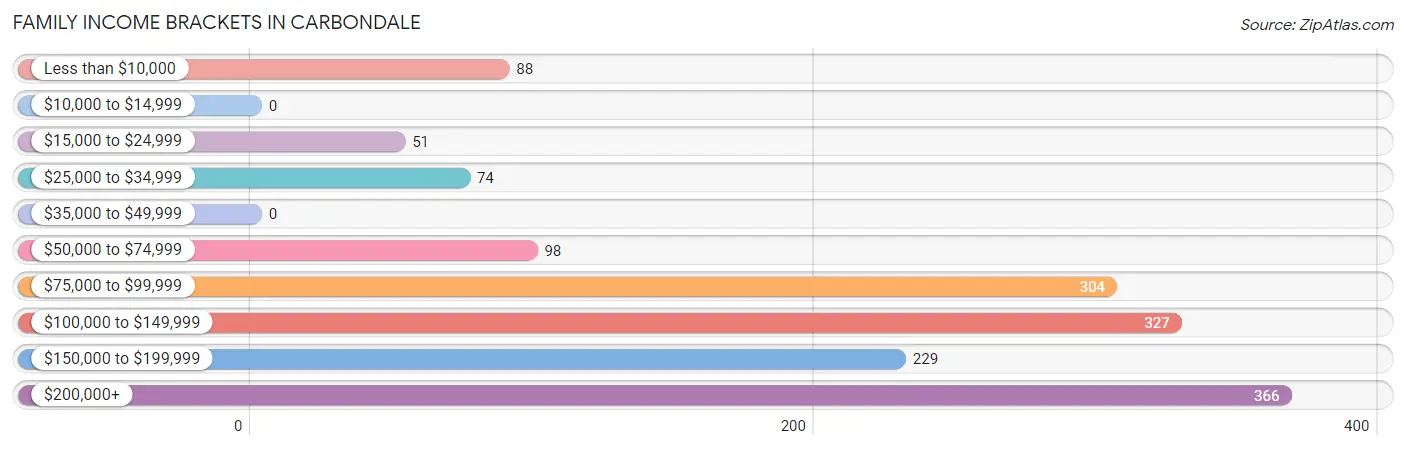
| Income Bracket | # Families | % Families |
| Less than $10,000 | 88 | 5.7% |
| $10,000 to $14,999 | 0 | 0.0% |
| $15,000 to $24,999 | 51 | 3.3% |
| $25,000 to $34,999 | 74 | 4.8% |
| $35,000 to $49,999 | 0 | 0.0% |
| $50,000 to $74,999 | 98 | 6.4% |
| $75,000 to $99,999 | 304 | 19.8% |
| $100,000 to $149,999 | 327 | 21.3% |
| $150,000 to $199,999 | 229 | 14.9% |
| $200,000+ | 366 | 23.8% |
Family Income by Famaliy Size in Carbondale
4-person families (288 | 18.8%) account for the highest median family income in Carbondale with $155,000 per family, while 2-person families (960 | 62.5%) have the highest median income of $58,090 per family member.
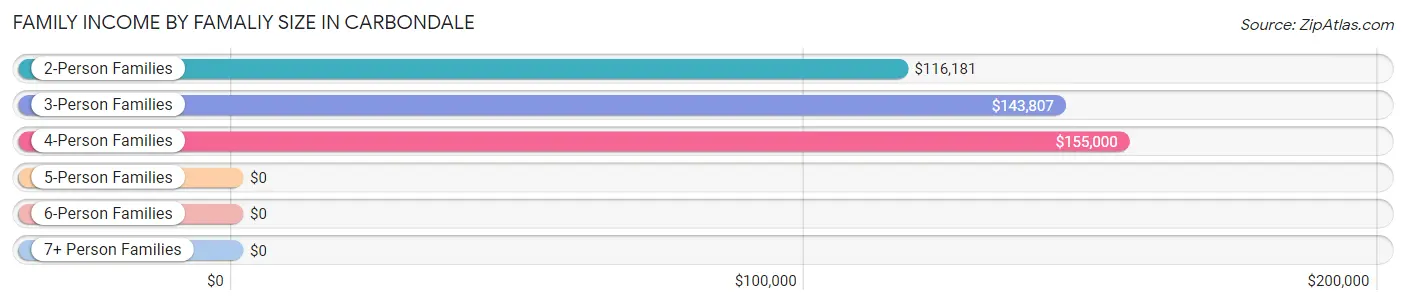
| Income Bracket | # Families | Median Income |
| 2-Person Families | 960 (62.5%) | $116,181 |
| 3-Person Families | 241 (15.7%) | $143,807 |
| 4-Person Families | 288 (18.8%) | $155,000 |
| 5-Person Families | 47 (3.1%) | $0 |
| 6-Person Families | 0 (0.0%) | $0 |
| 7+ Person Families | 0 (0.0%) | $0 |
| Total | 1,536 (100.0%) | $117,363 |
Family Income by Number of Earners in Carbondale
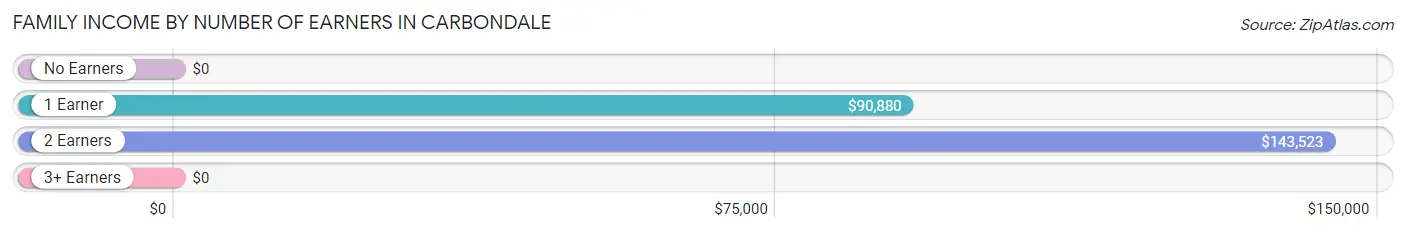
| Number of Earners | # Families | Median Income |
| No Earners | 114 (7.4%) | $0 |
| 1 Earner | 387 (25.2%) | $90,880 |
| 2 Earners | 942 (61.3%) | $143,523 |
| 3+ Earners | 93 (6.0%) | $0 |
| Total | 1,536 (100.0%) | $117,363 |
Household Income in Carbondale
Household Income Brackets in Carbondale
With 450 households falling in the category, the $75,000 to $99,999 income range is the most frequent in Carbondale, accounting for 16.2% of all households. In contrast, only 67 households (2.4%) fall into the $10,000 to $14,999 income bracket, making it the least populous group.
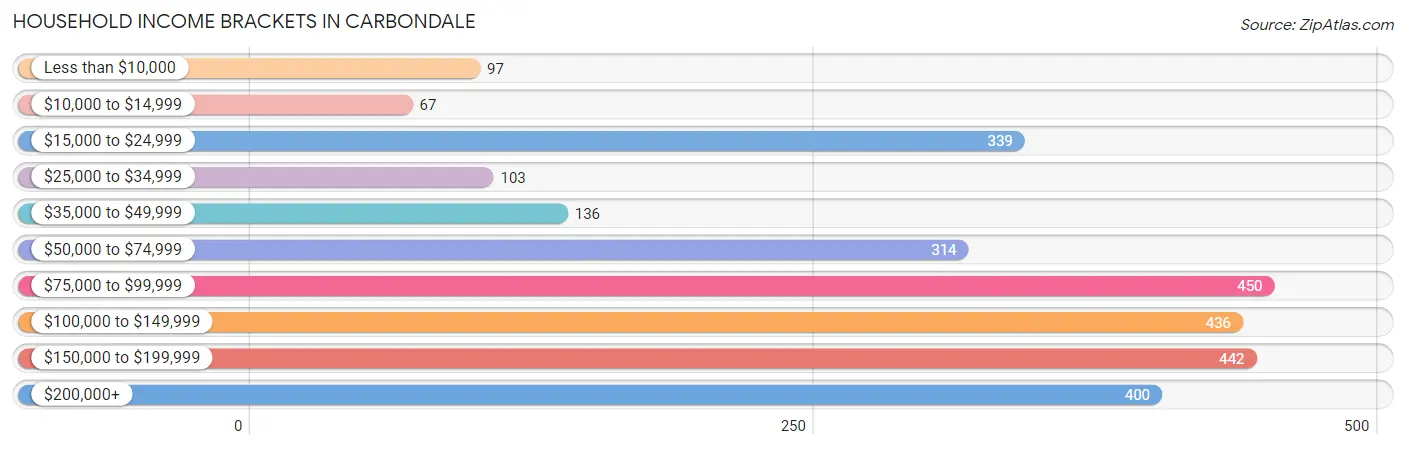
| Income Bracket | # Households | % Households |
| Less than $10,000 | 97 | 3.5% |
| $10,000 to $14,999 | 67 | 2.4% |
| $15,000 to $24,999 | 339 | 12.2% |
| $25,000 to $34,999 | 103 | 3.7% |
| $35,000 to $49,999 | 136 | 4.9% |
| $50,000 to $74,999 | 314 | 11.3% |
| $75,000 to $99,999 | 450 | 16.2% |
| $100,000 to $149,999 | 436 | 15.7% |
| $150,000 to $199,999 | 442 | 15.9% |
| $200,000+ | 400 | 14.4% |
Household Income by Householder Age in Carbondale
The median household income in Carbondale is $92,083, with the highest median household income of $121,648 found in the 25 to 44 years age bracket for the primary householder. A total of 1,081 households (38.9%) fall into this category. Meanwhile, the 15 to 24 years age bracket for the primary householder has the lowest median household income of $0, with 164 households (5.9%) in this group.
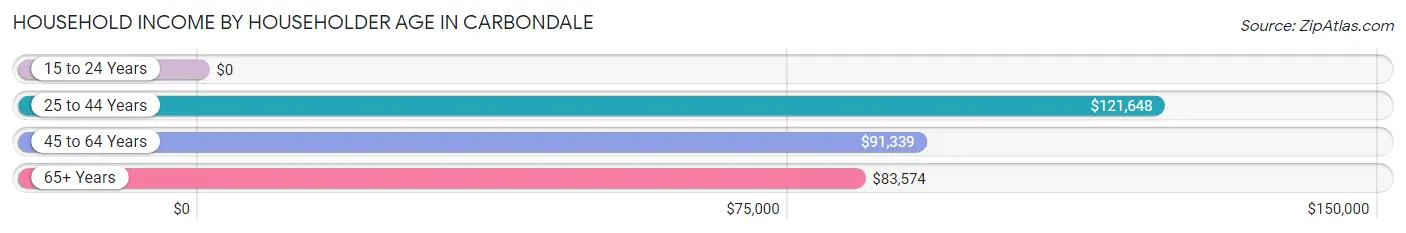
| Income Bracket | # Households | Median Income |
| 15 to 24 Years | 164 (5.9%) | $0 |
| 25 to 44 Years | 1,081 (38.9%) | $121,648 |
| 45 to 64 Years | 802 (28.8%) | $91,339 |
| 65+ Years | 733 (26.4%) | $83,574 |
| Total | 2,780 (100.0%) | $92,083 |
Poverty in Carbondale
Income Below Poverty by Sex and Age in Carbondale
With 14.6% poverty level for males and 11.1% for females among the residents of Carbondale, 18 to 24 year old males and 45 to 54 year old females are the most vulnerable to poverty, with 42 males (39.6%) and 147 females (33.5%) in their respective age groups living below the poverty level.
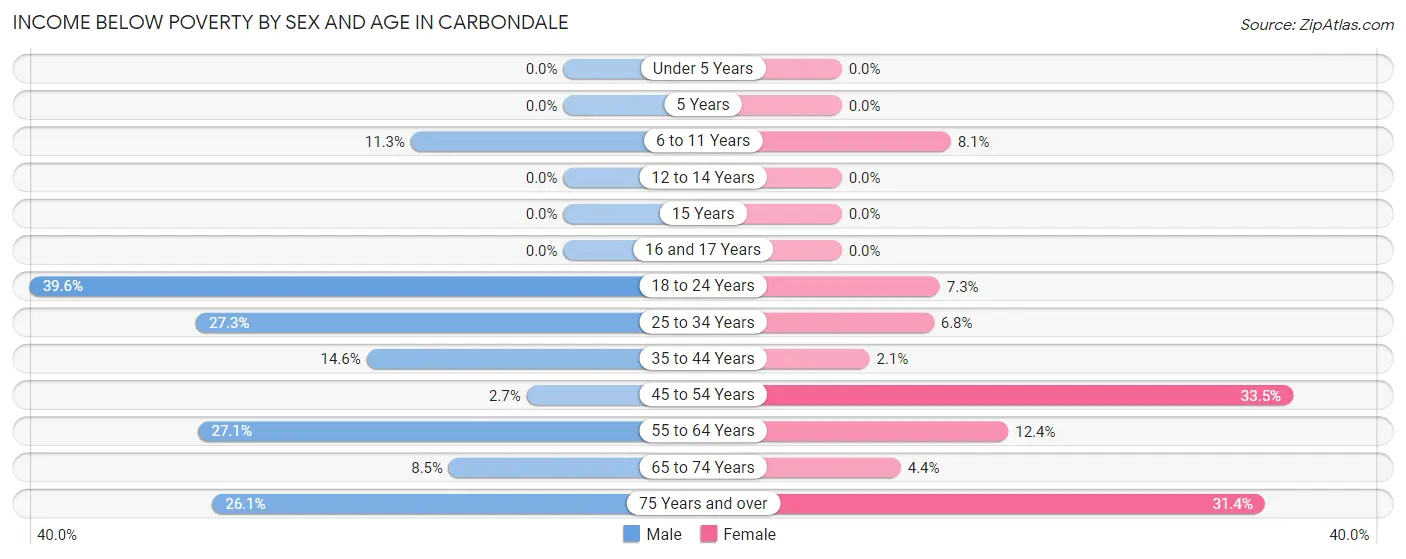
| Age Bracket | Male | Female |
| Under 5 Years | 0 (0.0%) | 0 (0.0%) |
| 5 Years | 0 (0.0%) | 0 (0.0%) |
| 6 to 11 Years | 18 (11.3%) | 14 (8.1%) |
| 12 to 14 Years | 0 (0.0%) | 0 (0.0%) |
| 15 Years | 0 (0.0%) | 0 (0.0%) |
| 16 and 17 Years | 0 (0.0%) | 0 (0.0%) |
| 18 to 24 Years | 42 (39.6%) | 15 (7.3%) |
| 25 to 34 Years | 168 (27.3%) | 25 (6.8%) |
| 35 to 44 Years | 111 (14.6%) | 10 (2.1%) |
| 45 to 54 Years | 19 (2.7%) | 147 (33.5%) |
| 55 to 64 Years | 114 (27.1%) | 32 (12.4%) |
| 65 to 74 Years | 43 (8.5%) | 17 (4.4%) |
| 75 Years and over | 43 (26.1%) | 27 (31.4%) |
| Total | 558 (14.6%) | 287 (11.1%) |
Income Above Poverty by Sex and Age in Carbondale
According to the poverty statistics in Carbondale, males aged under 5 years and females aged under 5 years are the age groups that are most secure financially, with 100.0% of males and 100.0% of females in these age groups living above the poverty line.
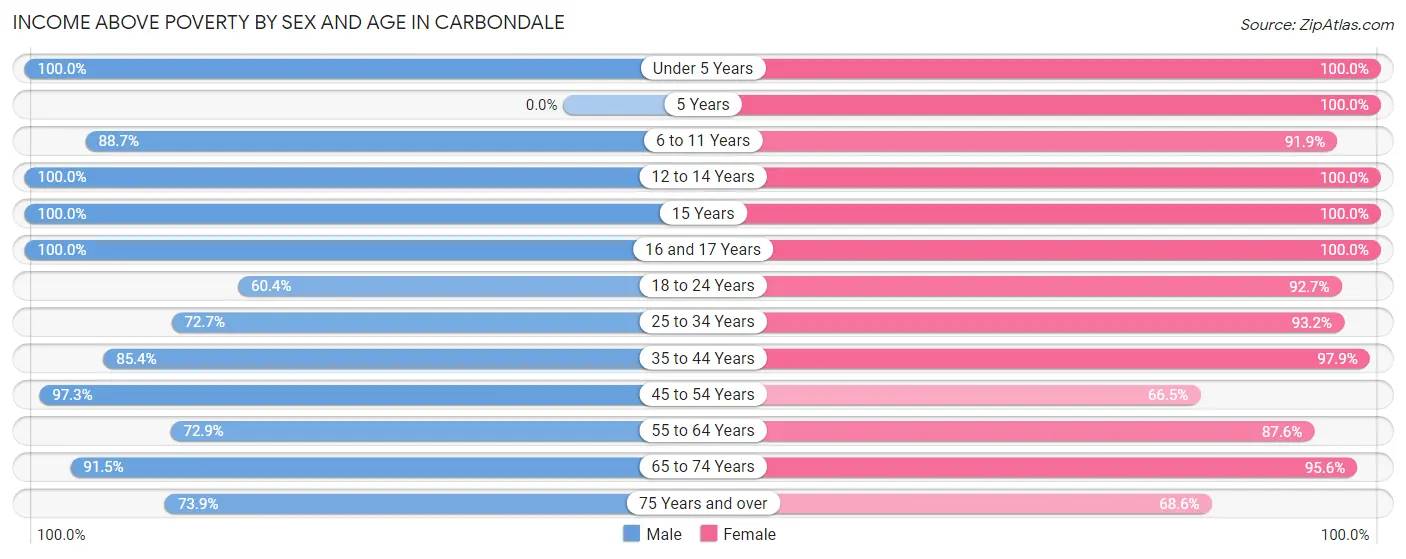
| Age Bracket | Male | Female |
| Under 5 Years | 152 (100.0%) | 70 (100.0%) |
| 5 Years | 0 (0.0%) | 15 (100.0%) |
| 6 to 11 Years | 141 (88.7%) | 159 (91.9%) |
| 12 to 14 Years | 183 (100.0%) | 41 (100.0%) |
| 15 Years | 50 (100.0%) | 40 (100.0%) |
| 16 and 17 Years | 10 (100.0%) | 26 (100.0%) |
| 18 to 24 Years | 64 (60.4%) | 191 (92.7%) |
| 25 to 34 Years | 448 (72.7%) | 341 (93.2%) |
| 35 to 44 Years | 649 (85.4%) | 475 (97.9%) |
| 45 to 54 Years | 676 (97.3%) | 292 (66.5%) |
| 55 to 64 Years | 307 (72.9%) | 227 (87.6%) |
| 65 to 74 Years | 463 (91.5%) | 371 (95.6%) |
| 75 Years and over | 122 (73.9%) | 59 (68.6%) |
| Total | 3,265 (85.4%) | 2,307 (88.9%) |
Income Below Poverty Among Married-Couple Families in Carbondale
The poverty statistics for married-couple families in Carbondale show that 7.8% or 101 of the total 1,295 families live below the poverty line. Families with no children have the highest poverty rate of 11.0%, comprising of 91 families. On the other hand, families with 3 or 4 children have the lowest poverty rate of 0.0%, which includes 0 families.
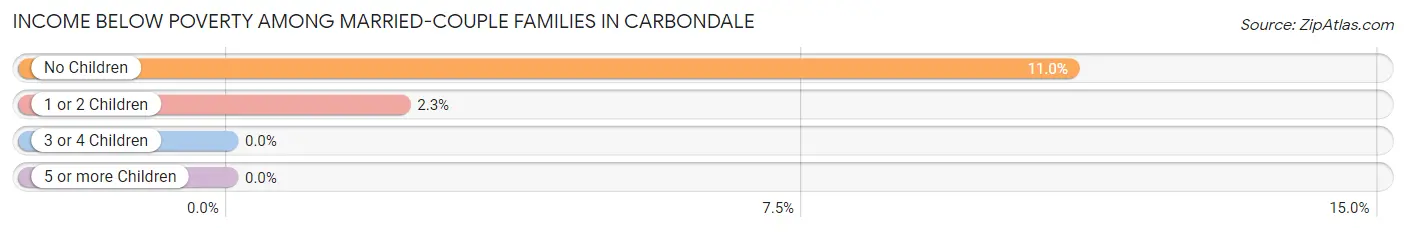
| Children | Above Poverty | Below Poverty |
| No Children | 737 (89.0%) | 91 (11.0%) |
| 1 or 2 Children | 435 (97.8%) | 10 (2.2%) |
| 3 or 4 Children | 22 (100.0%) | 0 (0.0%) |
| 5 or more Children | 0 (0.0%) | 0 (0.0%) |
| Total | 1,194 (92.2%) | 101 (7.8%) |
Income Below Poverty Among Single-Parent Households in Carbondale
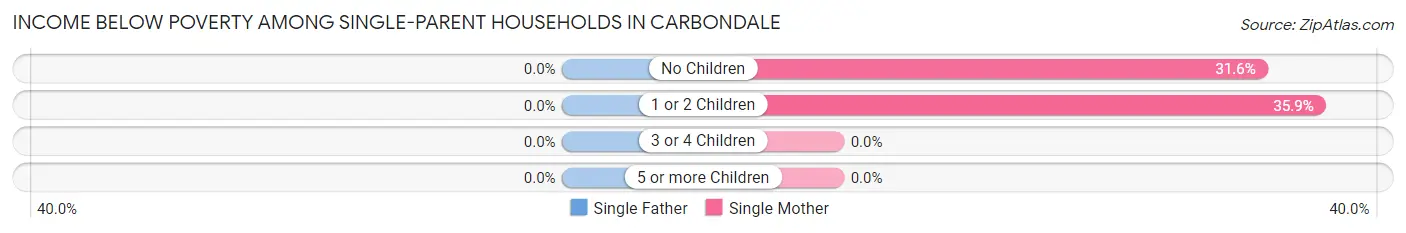
| Children | Single Father | Single Mother |
| No Children | 0 (0.0%) | 18 (31.6%) |
| 1 or 2 Children | 0 (0.0%) | 14 (35.9%) |
| 3 or 4 Children | 0 (0.0%) | 0 (0.0%) |
| 5 or more Children | 0 (0.0%) | 0 (0.0%) |
| Total | 0 (0.0%) | 32 (33.3%) |
Income Below Poverty Among Married-Couple vs Single-Parent Households in Carbondale
The poverty data for Carbondale shows that 101 of the married-couple family households (7.8%) and 32 of the single-parent households (13.3%) are living below the poverty level. Within the married-couple family households, those with no children have the highest poverty rate, with 91 households (11.0%) falling below the poverty line. Among the single-parent households, those with no children have the highest poverty rate, with 18 household (17.3%) living below poverty.
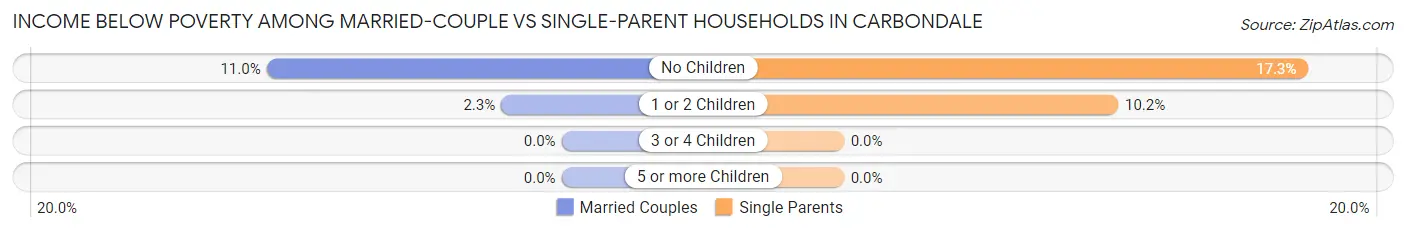
| Children | Married-Couple Families | Single-Parent Households |
| No Children | 91 (11.0%) | 18 (17.3%) |
| 1 or 2 Children | 10 (2.2%) | 14 (10.2%) |
| 3 or 4 Children | 0 (0.0%) | 0 (0.0%) |
| 5 or more Children | 0 (0.0%) | 0 (0.0%) |
| Total | 101 (7.8%) | 32 (13.3%) |
Race in Carbondale
The most populous races in Carbondale are White / Caucasian (5,555 | 85.5%), Hispanic or Latino (1,112 | 17.1%), and Two or more Races (549 | 8.5%).
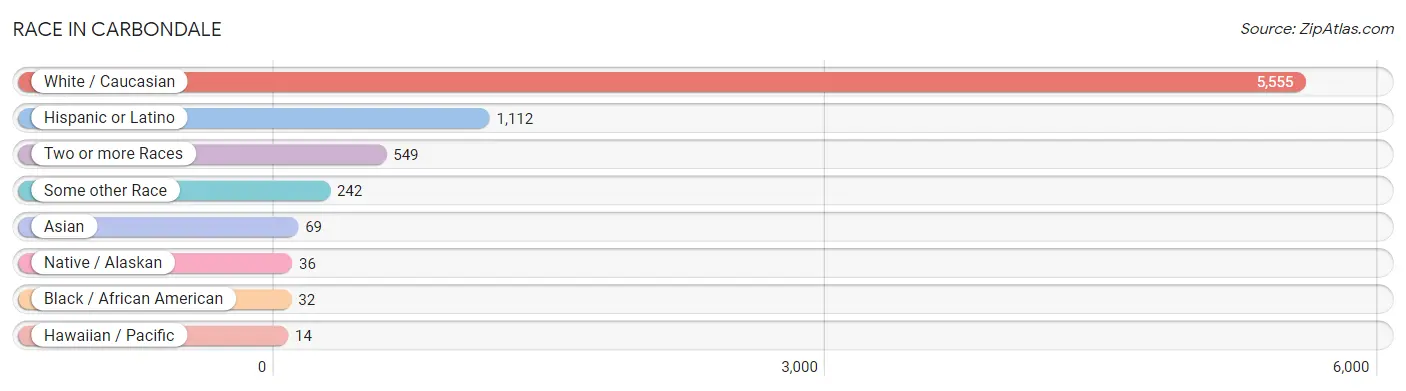
| Race | # Population | % Population |
| Asian | 69 | 1.1% |
| Black / African American | 32 | 0.5% |
| Hawaiian / Pacific | 14 | 0.2% |
| Hispanic or Latino | 1,112 | 17.1% |
| Native / Alaskan | 36 | 0.5% |
| White / Caucasian | 5,555 | 85.5% |
| Two or more Races | 549 | 8.5% |
| Some other Race | 242 | 3.7% |
| Total | 6,497 | 100.0% |
Ancestry in Carbondale
The most populous ancestries reported in Carbondale are Irish (1,082 | 16.7%), German (979 | 15.1%), English (764 | 11.8%), Mexican (742 | 11.4%), and Italian (565 | 8.7%), together accounting for 63.6% of all Carbondale residents.
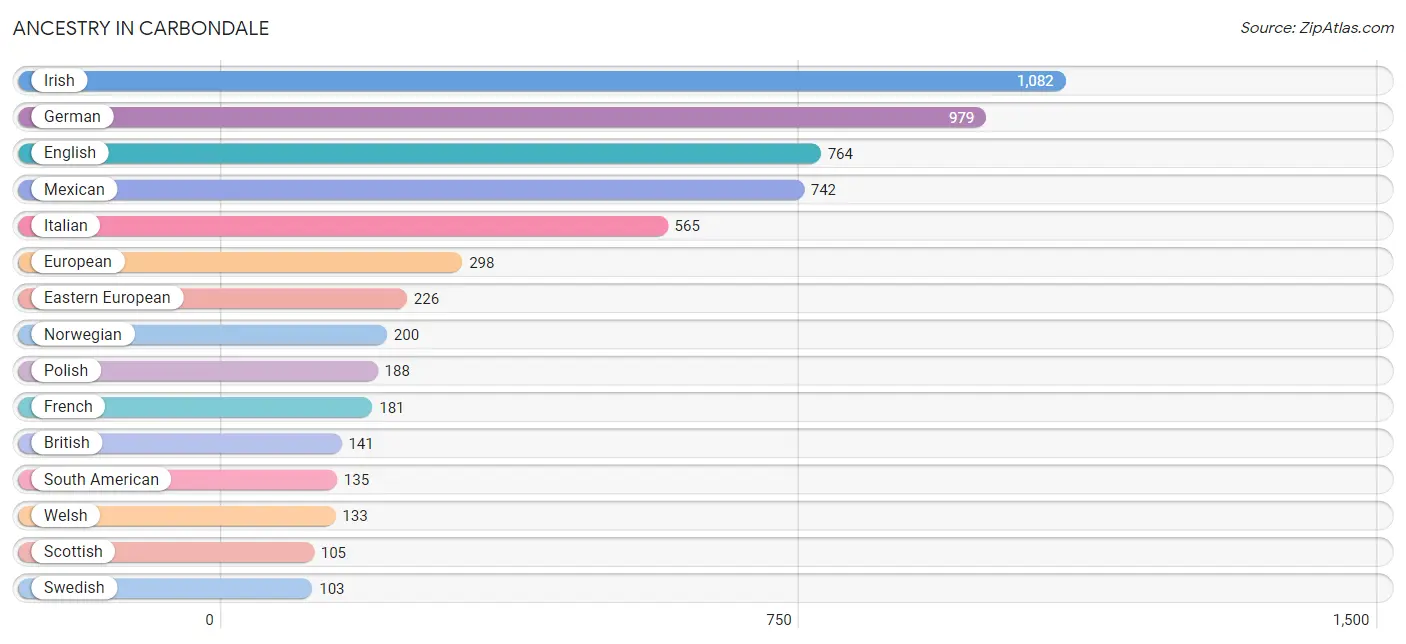
| Ancestry | # Population | % Population |
| American | 92 | 1.4% |
| Arab | 77 | 1.2% |
| Argentinean | 100 | 1.5% |
| Australian | 7 | 0.1% |
| Austrian | 23 | 0.4% |
| Bhutanese | 5 | 0.1% |
| Brazilian | 85 | 1.3% |
| British | 141 | 2.2% |
| Comanche | 50 | 0.8% |
| Croatian | 15 | 0.2% |
| Cuban | 58 | 0.9% |
| Czech | 39 | 0.6% |
| Czechoslovakian | 21 | 0.3% |
| Danish | 12 | 0.2% |
| Delaware | 7 | 0.1% |
| Dutch | 57 | 0.9% |
| Eastern European | 226 | 3.5% |
| English | 764 | 11.8% |
| European | 298 | 4.6% |
| Finnish | 37 | 0.6% |
| French | 181 | 2.8% |
| French Canadian | 93 | 1.4% |
| German | 979 | 15.1% |
| Greek | 69 | 1.1% |
| Hungarian | 52 | 0.8% |
| Indian (Asian) | 67 | 1.0% |
| Iranian | 29 | 0.4% |
| Irish | 1,082 | 16.7% |
| Iroquois | 35 | 0.5% |
| Italian | 565 | 8.7% |
| Korean | 9 | 0.1% |
| Lebanese | 77 | 1.2% |
| Lithuanian | 15 | 0.2% |
| Mexican | 742 | 11.4% |
| Navajo | 1 | 0.0% |
| Northern European | 75 | 1.1% |
| Norwegian | 200 | 3.1% |
| Polish | 188 | 2.9% |
| Puerto Rican | 102 | 1.6% |
| Russian | 53 | 0.8% |
| Scandinavian | 20 | 0.3% |
| Scotch-Irish | 11 | 0.2% |
| Scottish | 105 | 1.6% |
| Sioux | 7 | 0.1% |
| Slovak | 91 | 1.4% |
| South American | 135 | 2.1% |
| Spaniard | 28 | 0.4% |
| Spanish | 17 | 0.3% |
| Spanish American | 15 | 0.2% |
| Subsaharan African | 66 | 1.0% |
| Swedish | 103 | 1.6% |
| Swiss | 86 | 1.3% |
| Venezuelan | 35 | 0.5% |
| Welsh | 133 | 2.1% | View All 54 Rows |
Immigrants in Carbondale
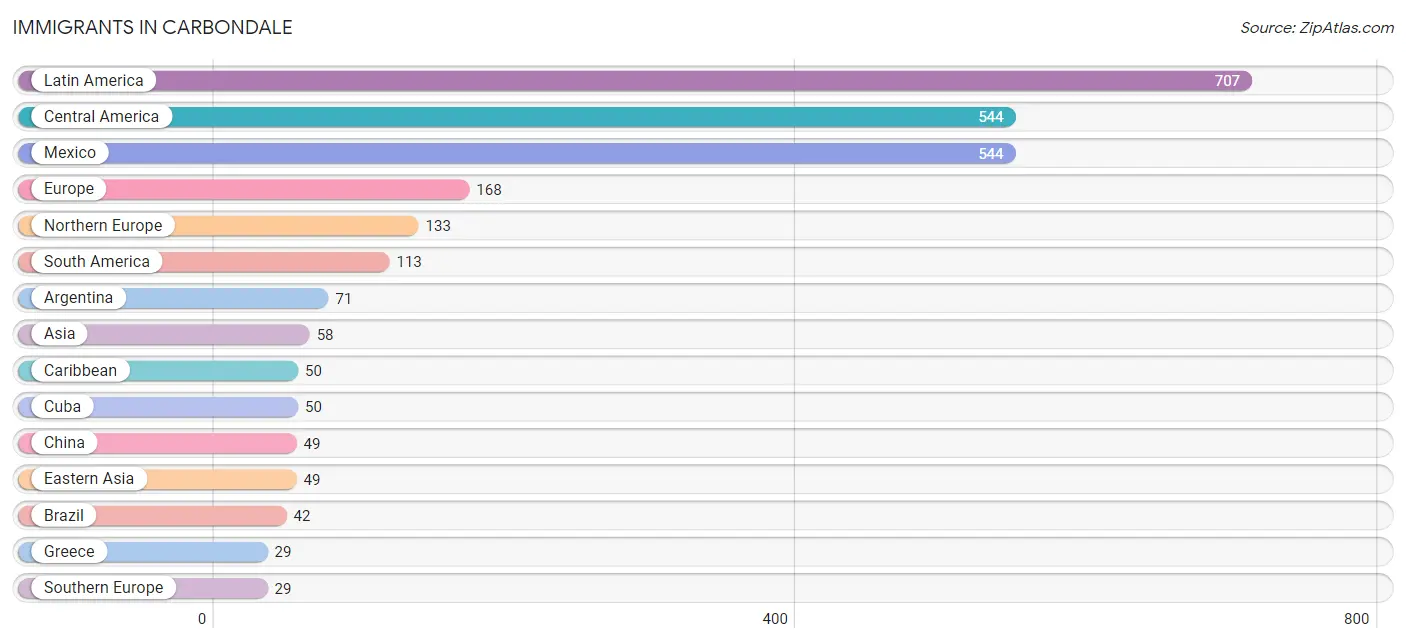
The most numerous immigrant groups reported in Carbondale came from Latin America (707 | 10.9%), Central America (544 | 8.4%), Mexico (544 | 8.4%), Europe (168 | 2.6%), and Northern Europe (133 | 2.1%), together accounting for 32.3% of all Carbondale residents.
| Immigration Origin | # Population | % Population |
| Africa | 24 | 0.4% |
| Argentina | 71 | 1.1% |
| Asia | 58 | 0.9% |
| Brazil | 42 | 0.6% |
| Caribbean | 50 | 0.8% |
| Central America | 544 | 8.4% |
| China | 49 | 0.7% |
| Cuba | 50 | 0.8% |
| Eastern Africa | 24 | 0.4% |
| Eastern Asia | 49 | 0.7% |
| Eastern Europe | 6 | 0.1% |
| England | 11 | 0.2% |
| Europe | 168 | 2.6% |
| Greece | 29 | 0.4% |
| Hungary | 6 | 0.1% |
| Latin America | 707 | 10.9% |
| Mexico | 544 | 8.4% |
| Northern Europe | 133 | 2.1% |
| Oceania | 28 | 0.4% |
| Philippines | 9 | 0.1% |
| South America | 113 | 1.7% |
| South Eastern Asia | 9 | 0.1% |
| Southern Europe | 29 | 0.4% | View All 23 Rows |
Sex and Age in Carbondale
Sex and Age in Carbondale
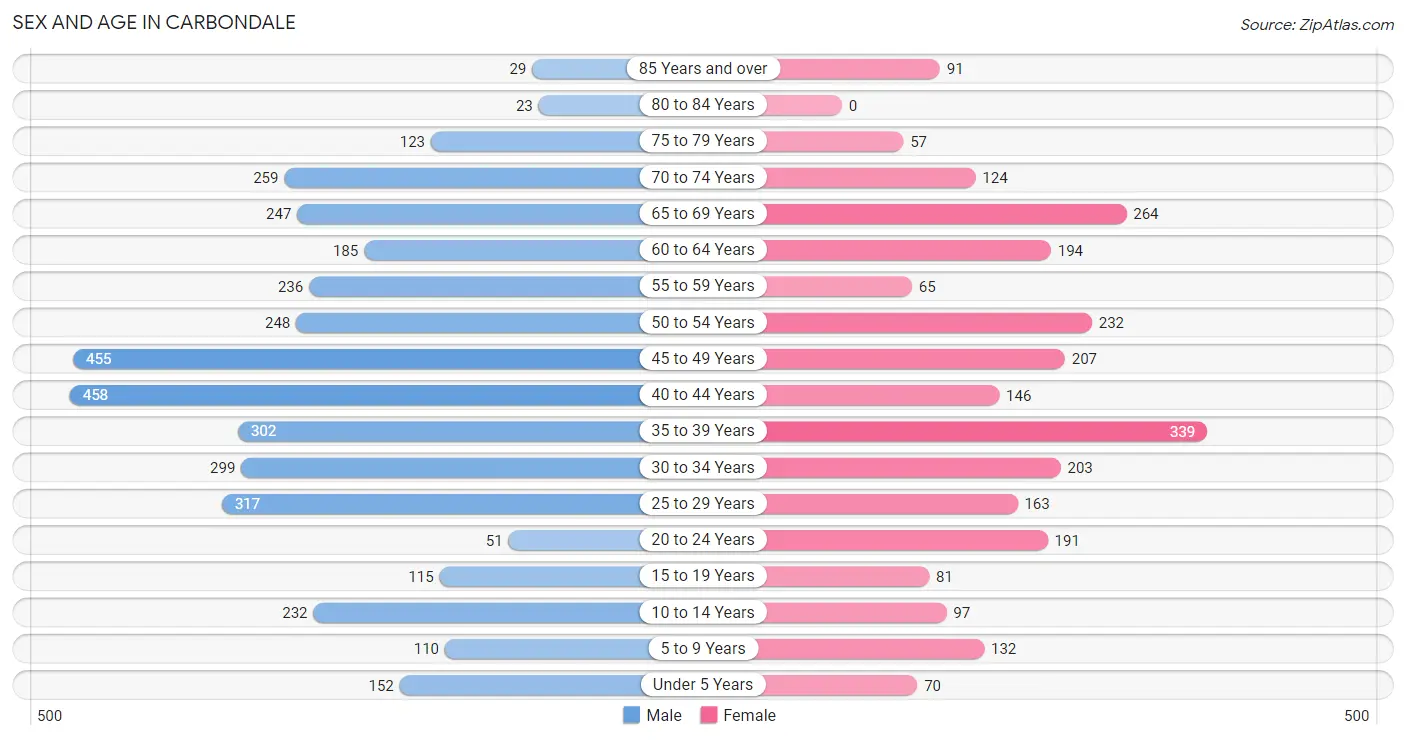
The most populous age groups in Carbondale are 40 to 44 Years (458 | 11.9%) for men and 35 to 39 Years (339 | 12.8%) for women.
| Age Bracket | Male | Female |
| Under 5 Years | 152 (4.0%) | 70 (2.6%) |
| 5 to 9 Years | 110 (2.9%) | 132 (5.0%) |
| 10 to 14 Years | 232 (6.0%) | 97 (3.6%) |
| 15 to 19 Years | 115 (3.0%) | 81 (3.0%) |
| 20 to 24 Years | 51 (1.3%) | 191 (7.2%) |
| 25 to 29 Years | 317 (8.3%) | 163 (6.1%) |
| 30 to 34 Years | 299 (7.8%) | 203 (7.6%) |
| 35 to 39 Years | 302 (7.9%) | 339 (12.8%) |
| 40 to 44 Years | 458 (11.9%) | 146 (5.5%) |
| 45 to 49 Years | 455 (11.8%) | 207 (7.8%) |
| 50 to 54 Years | 248 (6.5%) | 232 (8.7%) |
| 55 to 59 Years | 236 (6.1%) | 65 (2.5%) |
| 60 to 64 Years | 185 (4.8%) | 194 (7.3%) |
| 65 to 69 Years | 247 (6.4%) | 264 (9.9%) |
| 70 to 74 Years | 259 (6.7%) | 124 (4.7%) |
| 75 to 79 Years | 123 (3.2%) | 57 (2.1%) |
| 80 to 84 Years | 23 (0.6%) | 0 (0.0%) |
| 85 Years and over | 29 (0.8%) | 91 (3.4%) |
| Total | 3,841 (100.0%) | 2,656 (100.0%) |
Families and Households in Carbondale
Median Family Size in Carbondale
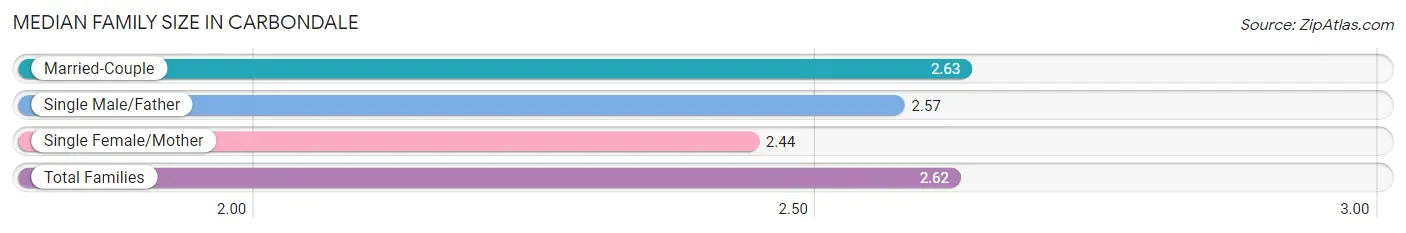
The median family size in Carbondale is 2.62 persons per family, with married-couple families (1,295 | 84.3%) accounting for the largest median family size of 2.63 persons per family. On the other hand, single female/mother families (96 | 6.2%) represent the smallest median family size with 2.44 persons per family.
| Family Type | # Families | Family Size |
| Married-Couple | 1,295 (84.3%) | 2.63 |
| Single Male/Father | 145 (9.4%) | 2.57 |
| Single Female/Mother | 96 (6.2%) | 2.44 |
| Total Families | 1,536 (100.0%) | 2.62 |
Median Household Size in Carbondale
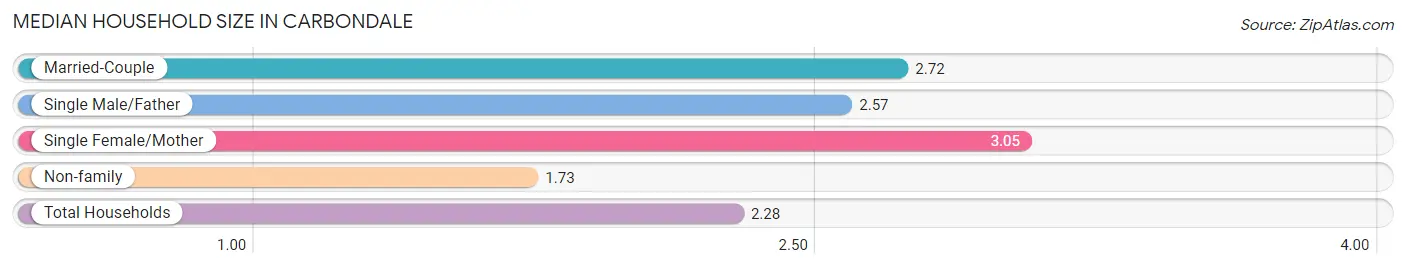
The median household size in Carbondale is 2.28 persons per household, with single female/mother households (96 | 3.5%) accounting for the largest median household size of 3.05 persons per household. non-family households (1,244 | 44.8%) represent the smallest median household size with 1.73 persons per household.
| Household Type | # Households | Household Size |
| Married-Couple | 1,295 (46.6%) | 2.72 |
| Single Male/Father | 145 (5.2%) | 2.57 |
| Single Female/Mother | 96 (3.5%) | 3.05 |
| Non-family | 1,244 (44.8%) | 1.73 |
| Total Households | 2,780 (100.0%) | 2.28 |
Household Size by Marriage Status in Carbondale
Out of a total of 2,780 households in Carbondale, 1,536 (55.2%) are family households, while 1,244 (44.8%) are nonfamily households. The most numerous type of family households are 2-person households, comprising 843, and the most common type of nonfamily households are 1-person households, comprising 696.
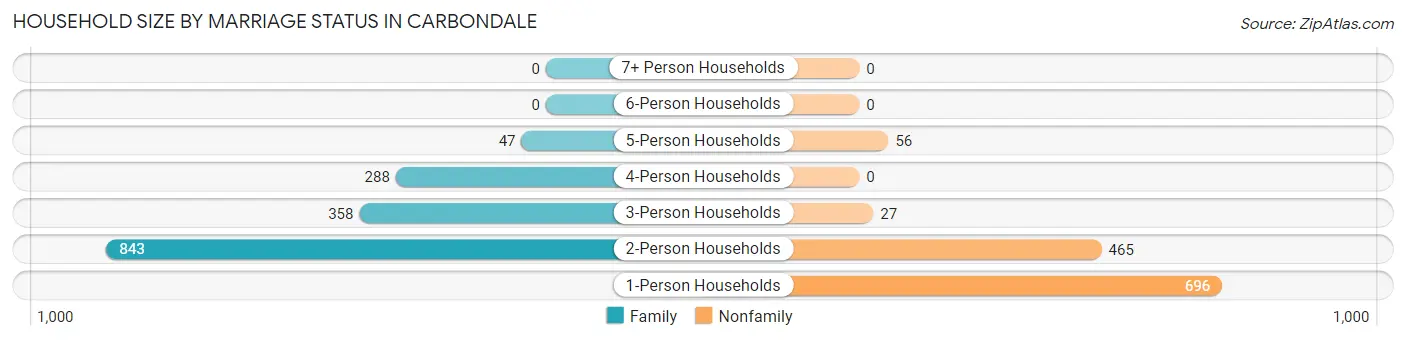
| Household Size | Family Households | Nonfamily Households |
| 1-Person Households | - | 696 (25.0%) |
| 2-Person Households | 843 (30.3%) | 465 (16.7%) |
| 3-Person Households | 358 (12.9%) | 27 (1.0%) |
| 4-Person Households | 288 (10.4%) | 0 (0.0%) |
| 5-Person Households | 47 (1.7%) | 56 (2.0%) |
| 6-Person Households | 0 (0.0%) | 0 (0.0%) |
| 7+ Person Households | 0 (0.0%) | 0 (0.0%) |
| Total | 1,536 (55.2%) | 1,244 (44.8%) |
Female Fertility in Carbondale
Fertility by Age in Carbondale
Average fertility rate in Carbondale is 55.0 births per 1,000 women. Women in the age bracket of 35 to 50 years have the highest fertility rate with 73.0 births per 1,000 women. Women in the age bracket of 35 to 50 years acount for 69.9% of all women with births.
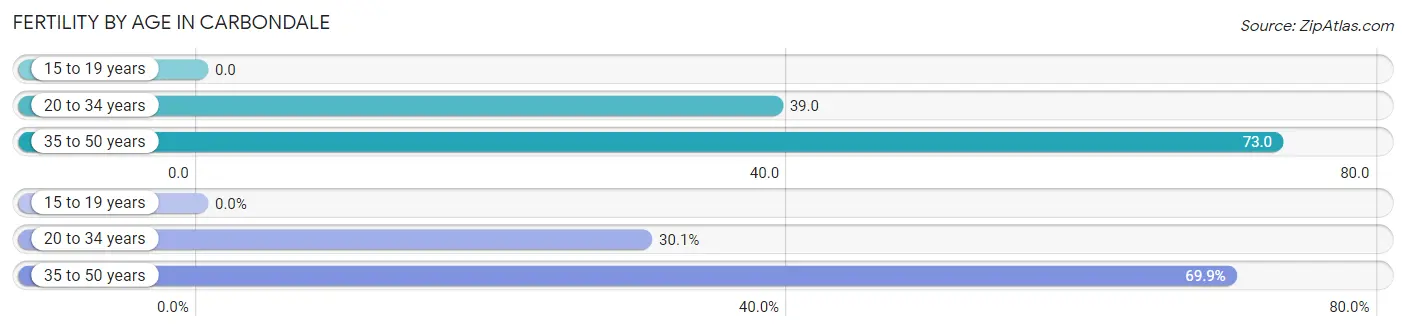
| Age Bracket | Women with Births | Births / 1,000 Women |
| 15 to 19 years | 0 (0.0%) | 0.0 |
| 20 to 34 years | 22 (30.1%) | 39.0 |
| 35 to 50 years | 51 (69.9%) | 73.0 |
| Total | 73 (100.0%) | 55.0 |
Fertility by Age by Marriage Status in Carbondale
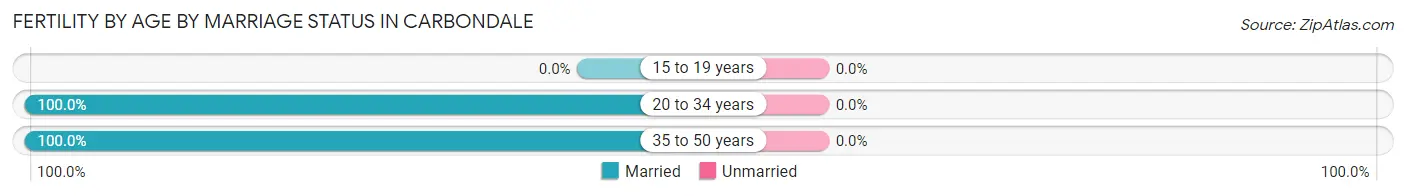
| Age Bracket | Married | Unmarried |
| 15 to 19 years | 0 (0.0%) | 0 (0.0%) |
| 20 to 34 years | 22 (100.0%) | 0 (0.0%) |
| 35 to 50 years | 51 (100.0%) | 0 (0.0%) |
| Total | 73 (100.0%) | 0 (0.0%) |
Fertility by Education in Carbondale
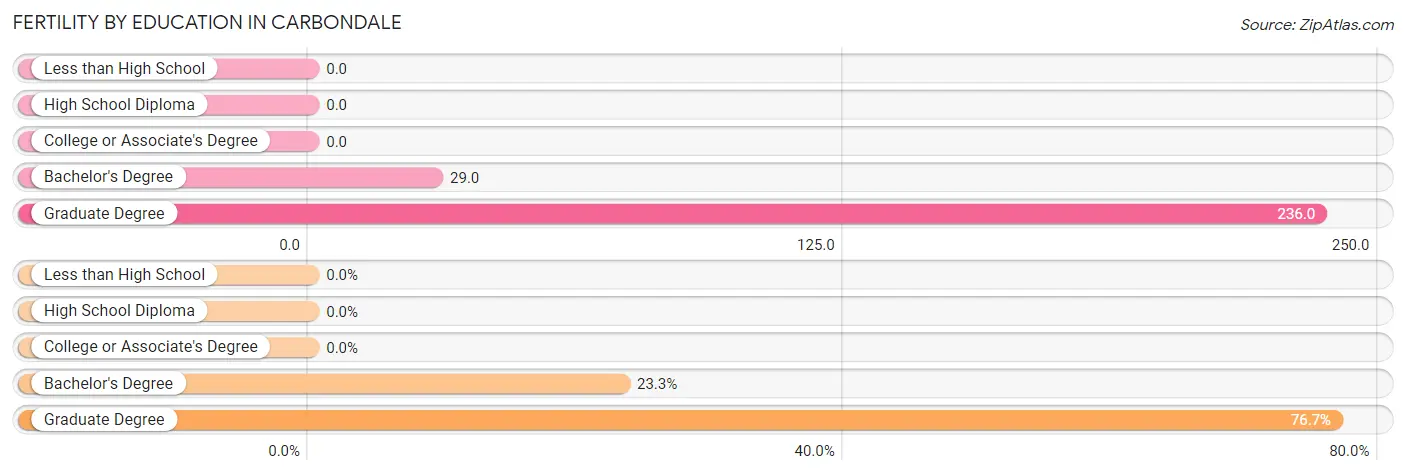
| Educational Attainment | Women with Births | Births / 1,000 Women |
| Less than High School | 0 (0.0%) | 0.0 |
| High School Diploma | 0 (0.0%) | 0.0 |
| College or Associate's Degree | 0 (0.0%) | 0.0 |
| Bachelor's Degree | 17 (23.3%) | 29.0 |
| Graduate Degree | 56 (76.7%) | 236.0 |
| Total | 73 (100.0%) | 55.0 |
Fertility by Education by Marriage Status in Carbondale
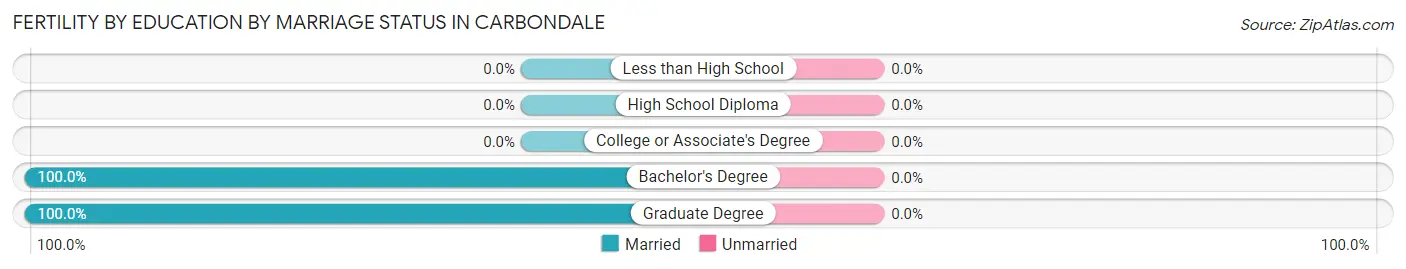
| Educational Attainment | Married | Unmarried |
| Less than High School | 0 (0.0%) | 0 (0.0%) |
| High School Diploma | 0 (0.0%) | 0 (0.0%) |
| College or Associate's Degree | 0 (0.0%) | 0 (0.0%) |
| Bachelor's Degree | 17 (100.0%) | 0 (0.0%) |
| Graduate Degree | 56 (100.0%) | 0 (0.0%) |
| Total | 73 (100.0%) | 0 (0.0%) |
Employment Characteristics in Carbondale
Employment by Class of Employer in Carbondale
Among the 4,285 employed individuals in Carbondale, private company employees (2,438 | 56.9%), self-employed (not incorporated) (593 | 13.8%), and self-employed (incorporated) (517 | 12.1%) make up the most common classes of employment.
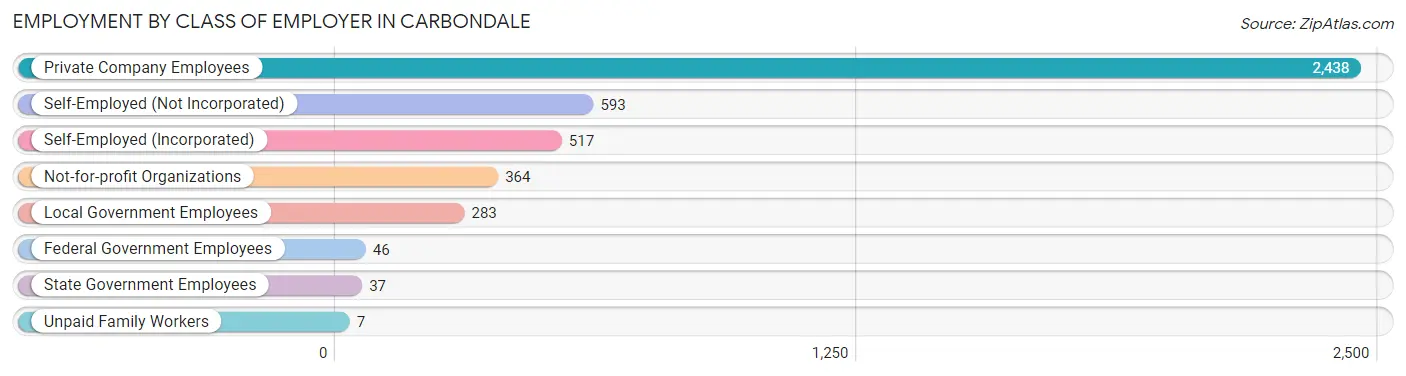
| Employer Class | # Employees | % Employees |
| Private Company Employees | 2,438 | 56.9% |
| Self-Employed (Incorporated) | 517 | 12.1% |
| Self-Employed (Not Incorporated) | 593 | 13.8% |
| Not-for-profit Organizations | 364 | 8.5% |
| Local Government Employees | 283 | 6.6% |
| State Government Employees | 37 | 0.9% |
| Federal Government Employees | 46 | 1.1% |
| Unpaid Family Workers | 7 | 0.2% |
| Total | 4,285 | 100.0% |
Employment Status by Age in Carbondale
According to the labor force statistics for Carbondale, out of the total population over 16 years of age (5,614), 78.6% or 4,413 individuals are in the labor force, with 1.1% or 49 of them unemployed. The age group with the highest labor force participation rate is 45 to 54 years, with 96.9% or 1,107 individuals in the labor force. Within the labor force, the 65 to 74 years age range has the highest percentage of unemployed individuals, with 7.4% or 28 of them being unemployed.
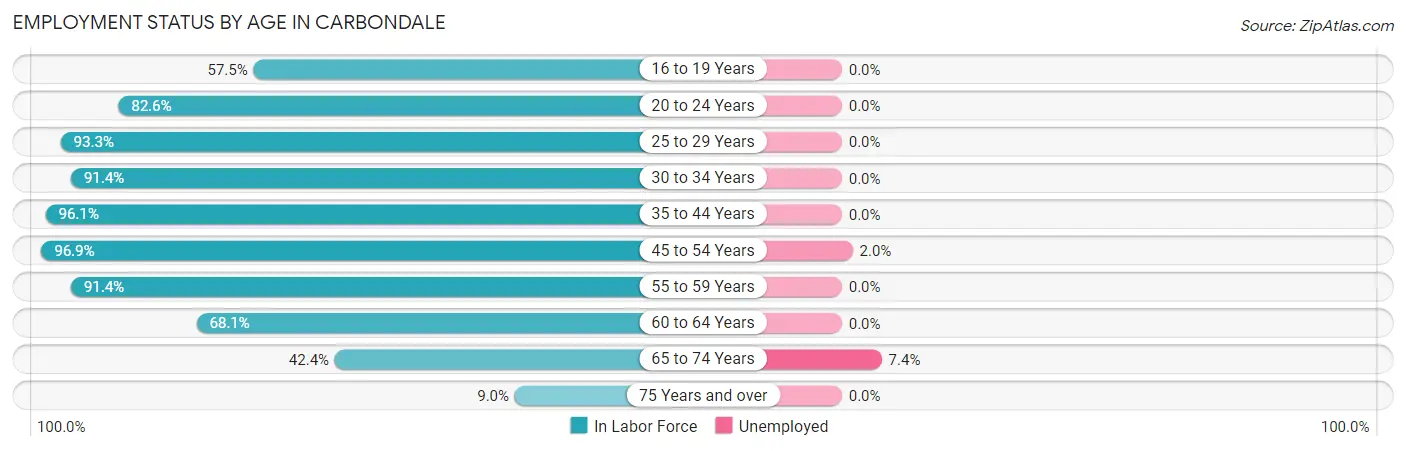
| Age Bracket | In Labor Force | Unemployed |
| 16 to 19 Years | 61 (57.5%) | 0 (0.0%) |
| 20 to 24 Years | 200 (82.6%) | 0 (0.0%) |
| 25 to 29 Years | 448 (93.3%) | 0 (0.0%) |
| 30 to 34 Years | 459 (91.4%) | 0 (0.0%) |
| 35 to 44 Years | 1,196 (96.1%) | 0 (0.0%) |
| 45 to 54 Years | 1,107 (96.9%) | 22 (2.0%) |
| 55 to 59 Years | 275 (91.4%) | 0 (0.0%) |
| 60 to 64 Years | 258 (68.1%) | 0 (0.0%) |
| 65 to 74 Years | 379 (42.4%) | 28 (7.4%) |
| 75 Years and over | 29 (9.0%) | 0 (0.0%) |
| Total | 4,413 (78.6%) | 49 (1.1%) |
Employment Status by Educational Attainment in Carbondale
According to labor force statistics for Carbondale, 92.4% of individuals (3,741) out of the total population between 25 and 64 years of age (4,049) are in the labor force, with 0.6% or 22 of them being unemployed. The group with the highest labor force participation rate are those with the educational attainment of bachelor's degree or higher, with 94.6% or 2,178 individuals in the labor force. Within the labor force, individuals with bachelor's degree or higher education have the highest percentage of unemployment, with 1.0% or 22 of them being unemployed.
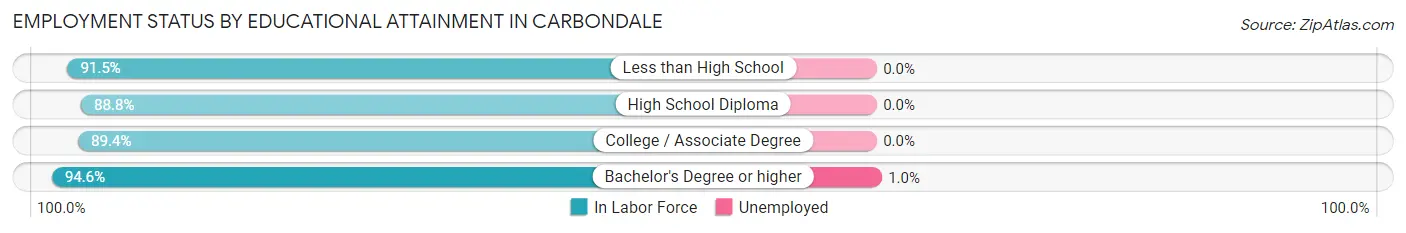
| Educational Attainment | In Labor Force | Unemployed |
| Less than High School | 248 (91.5%) | 0 (0.0%) |
| High School Diploma | 379 (88.8%) | 0 (0.0%) |
| College / Associate Degree | 938 (89.4%) | 0 (0.0%) |
| Bachelor's Degree or higher | 2,178 (94.6%) | 23 (1.0%) |
| Total | 3,741 (92.4%) | 24 (0.6%) |
Employment Occupations by Sex in Carbondale
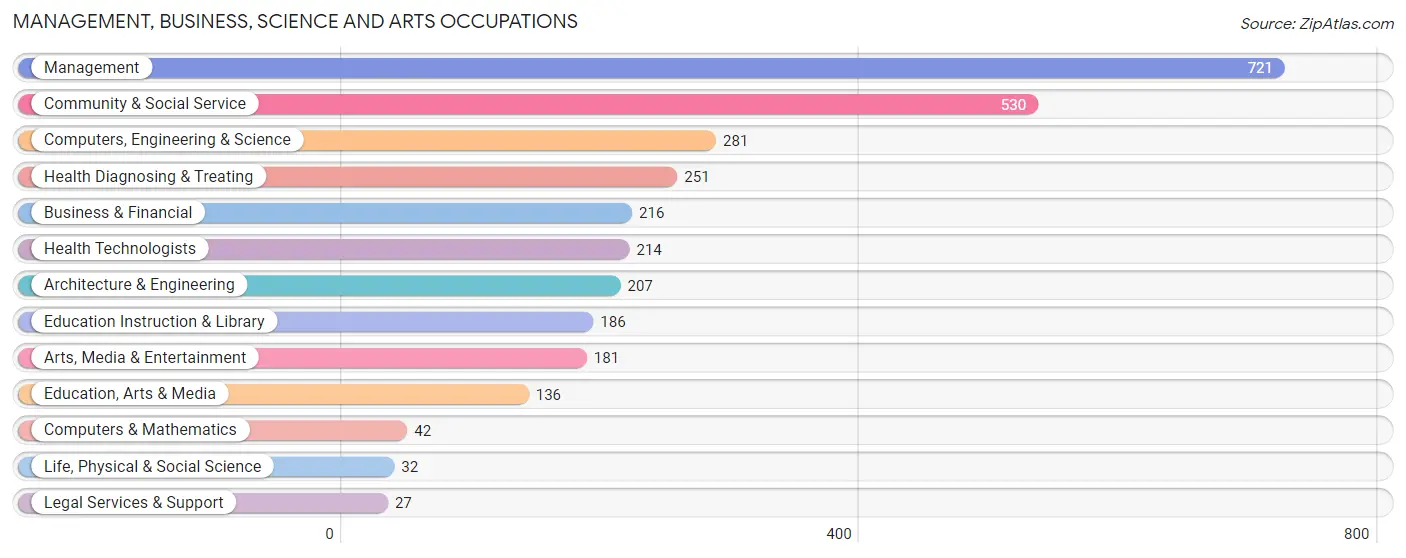
Management, Business, Science and Arts Occupations
The most common Management, Business, Science and Arts occupations in Carbondale are Management (721 | 16.5%), Community & Social Service (530 | 12.1%), Computers, Engineering & Science (281 | 6.4%), Health Diagnosing & Treating (251 | 5.8%), and Business & Financial (216 | 5.0%).
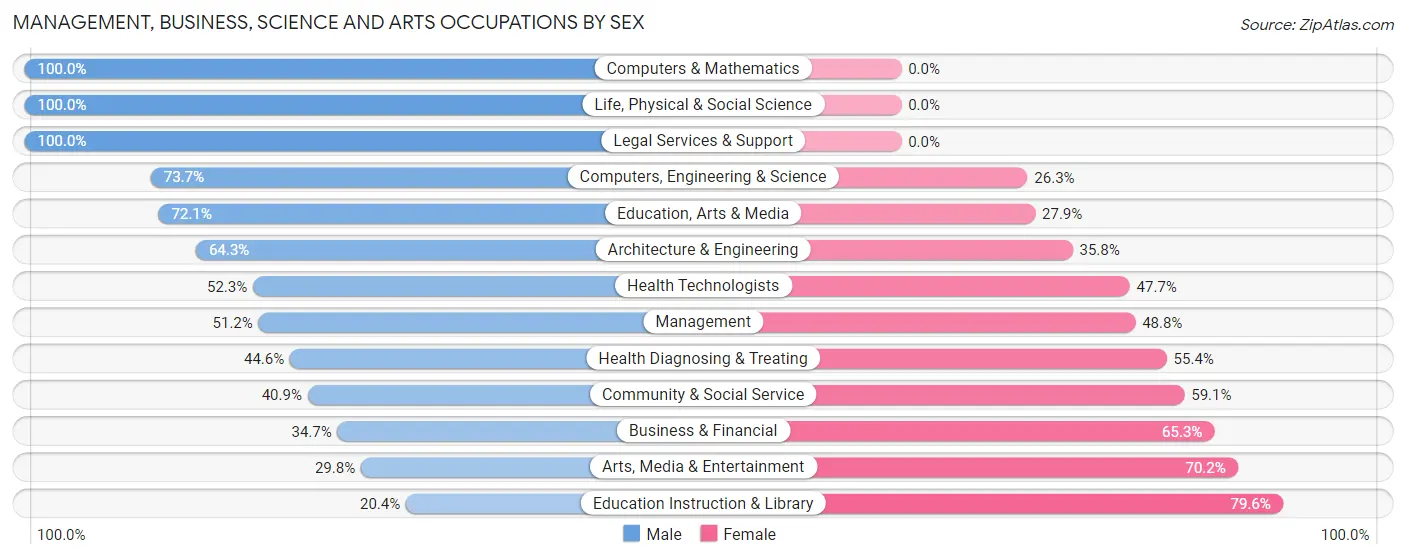
Management, Business, Science and Arts Occupations by Sex
Within the Management, Business, Science and Arts occupations in Carbondale, the most male-oriented occupations are Computers & Mathematics (100.0%), Life, Physical & Social Science (100.0%), and Legal Services & Support (100.0%), while the most female-oriented occupations are Education Instruction & Library (79.6%), Arts, Media & Entertainment (70.2%), and Business & Financial (65.3%).
| Occupation | Male | Female |
| Management | 369 (51.2%) | 352 (48.8%) |
| Business & Financial | 75 (34.7%) | 141 (65.3%) |
| Computers, Engineering & Science | 207 (73.7%) | 74 (26.3%) |
| Computers & Mathematics | 42 (100.0%) | 0 (0.0%) |
| Architecture & Engineering | 133 (64.2%) | 74 (35.7%) |
| Life, Physical & Social Science | 32 (100.0%) | 0 (0.0%) |
| Community & Social Service | 217 (40.9%) | 313 (59.1%) |
| Education, Arts & Media | 98 (72.1%) | 38 (27.9%) |
| Legal Services & Support | 27 (100.0%) | 0 (0.0%) |
| Education Instruction & Library | 38 (20.4%) | 148 (79.6%) |
| Arts, Media & Entertainment | 54 (29.8%) | 127 (70.2%) |
| Health Diagnosing & Treating | 112 (44.6%) | 139 (55.4%) |
| Health Technologists | 112 (52.3%) | 102 (47.7%) |
| Total (Category) | 980 (49.0%) | 1,019 (51.0%) |
| Total (Overall) | 2,638 (60.5%) | 1,724 (39.5%) |
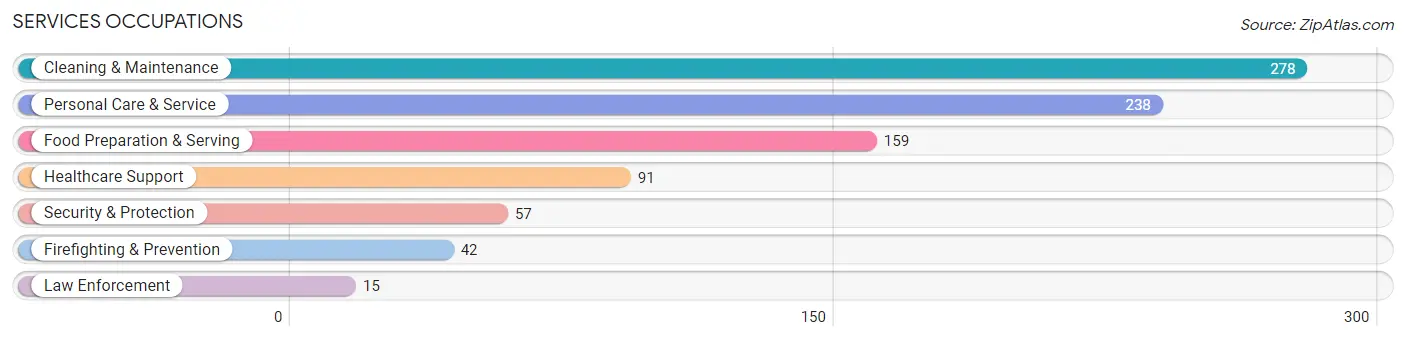
Services Occupations
The most common Services occupations in Carbondale are Cleaning & Maintenance (278 | 6.4%), Personal Care & Service (238 | 5.5%), Food Preparation & Serving (159 | 3.6%), Healthcare Support (91 | 2.1%), and Security & Protection (57 | 1.3%).
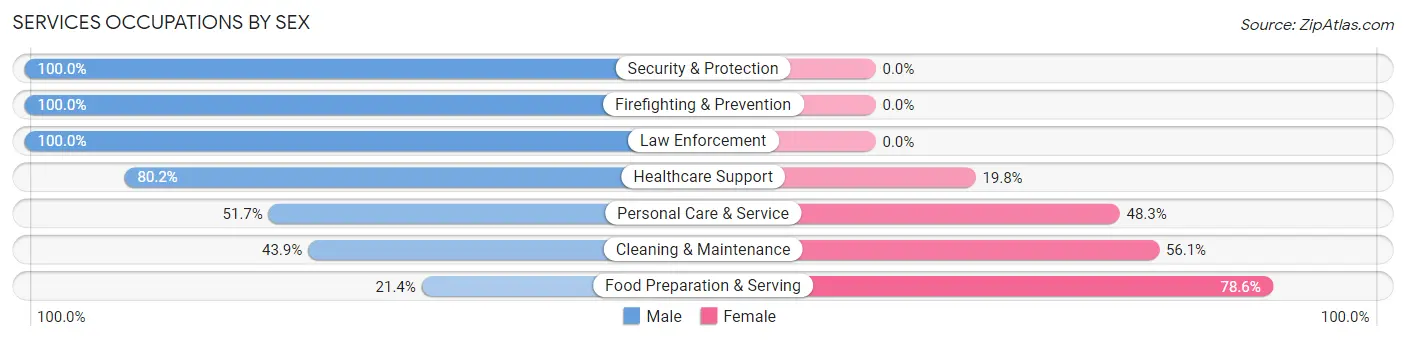
Services Occupations by Sex
Within the Services occupations in Carbondale, the most male-oriented occupations are Security & Protection (100.0%), Firefighting & Prevention (100.0%), and Law Enforcement (100.0%), while the most female-oriented occupations are Food Preparation & Serving (78.6%), Cleaning & Maintenance (56.1%), and Personal Care & Service (48.3%).
| Occupation | Male | Female |
| Healthcare Support | 73 (80.2%) | 18 (19.8%) |
| Security & Protection | 57 (100.0%) | 0 (0.0%) |
| Firefighting & Prevention | 42 (100.0%) | 0 (0.0%) |
| Law Enforcement | 15 (100.0%) | 0 (0.0%) |
| Food Preparation & Serving | 34 (21.4%) | 125 (78.6%) |
| Cleaning & Maintenance | 122 (43.9%) | 156 (56.1%) |
| Personal Care & Service | 123 (51.7%) | 115 (48.3%) |
| Total (Category) | 409 (49.7%) | 414 (50.3%) |
| Total (Overall) | 2,638 (60.5%) | 1,724 (39.5%) |
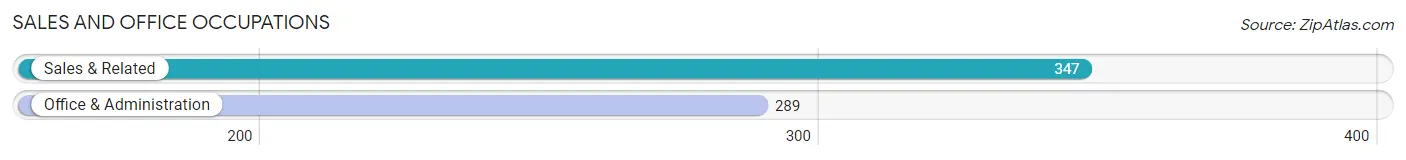
Sales and Office Occupations
The most common Sales and Office occupations in Carbondale are Sales & Related (347 | 8.0%), and Office & Administration (289 | 6.6%).
Sales and Office Occupations by Sex
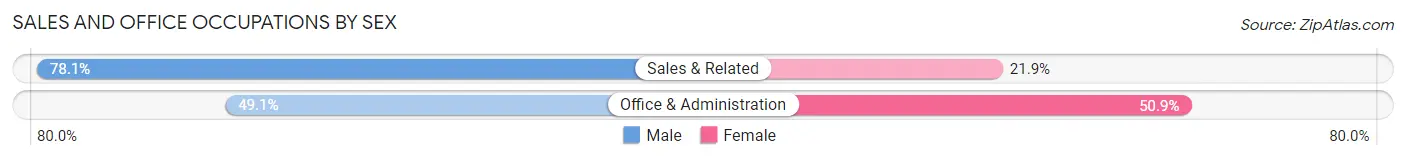
| Occupation | Male | Female |
| Sales & Related | 271 (78.1%) | 76 (21.9%) |
| Office & Administration | 142 (49.1%) | 147 (50.9%) |
| Total (Category) | 413 (64.9%) | 223 (35.1%) |
| Total (Overall) | 2,638 (60.5%) | 1,724 (39.5%) |
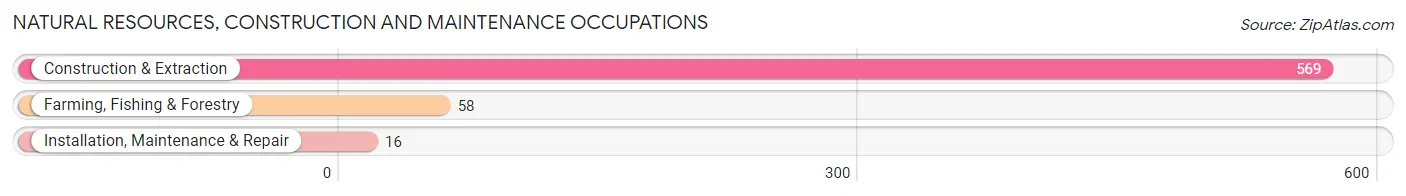
Natural Resources, Construction and Maintenance Occupations
The most common Natural Resources, Construction and Maintenance occupations in Carbondale are Construction & Extraction (569 | 13.0%), Farming, Fishing & Forestry (58 | 1.3%), and Installation, Maintenance & Repair (16 | 0.4%).
Natural Resources, Construction and Maintenance Occupations by Sex
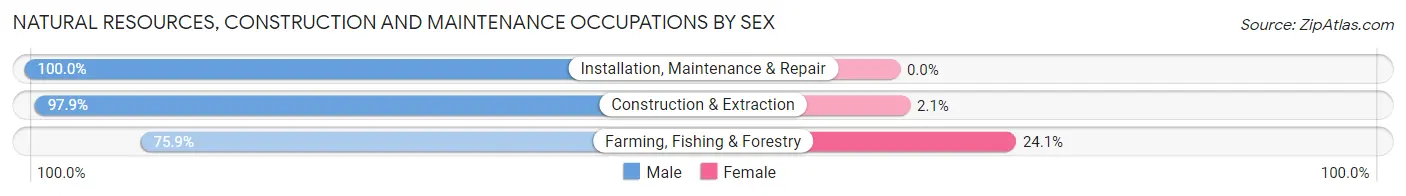
| Occupation | Male | Female |
| Farming, Fishing & Forestry | 44 (75.9%) | 14 (24.1%) |
| Construction & Extraction | 557 (97.9%) | 12 (2.1%) |
| Installation, Maintenance & Repair | 16 (100.0%) | 0 (0.0%) |
| Total (Category) | 617 (96.0%) | 26 (4.0%) |
| Total (Overall) | 2,638 (60.5%) | 1,724 (39.5%) |
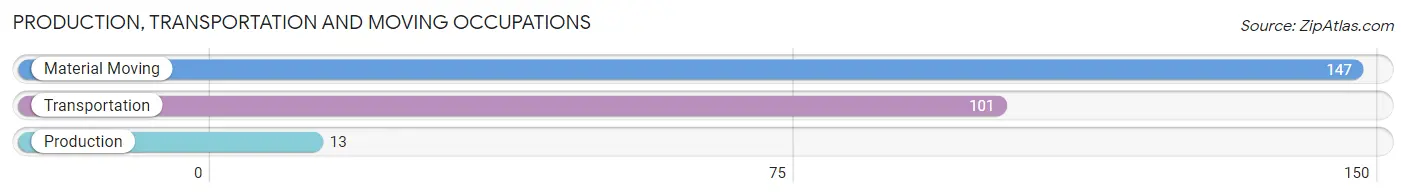
Production, Transportation and Moving Occupations
The most common Production, Transportation and Moving occupations in Carbondale are Material Moving (147 | 3.4%), Transportation (101 | 2.3%), and Production (13 | 0.3%).
Production, Transportation and Moving Occupations by Sex
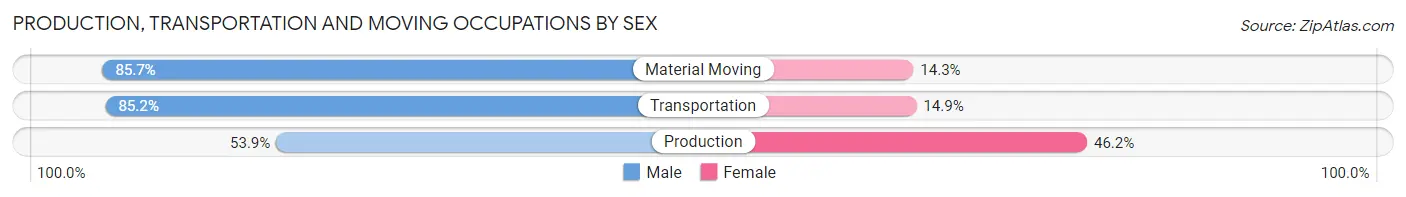
| Occupation | Male | Female |
| Production | 7 (53.8%) | 6 (46.2%) |
| Transportation | 86 (85.2%) | 15 (14.8%) |
| Material Moving | 126 (85.7%) | 21 (14.3%) |
| Total (Category) | 219 (83.9%) | 42 (16.1%) |
| Total (Overall) | 2,638 (60.5%) | 1,724 (39.5%) |
Employment Industries by Sex in Carbondale
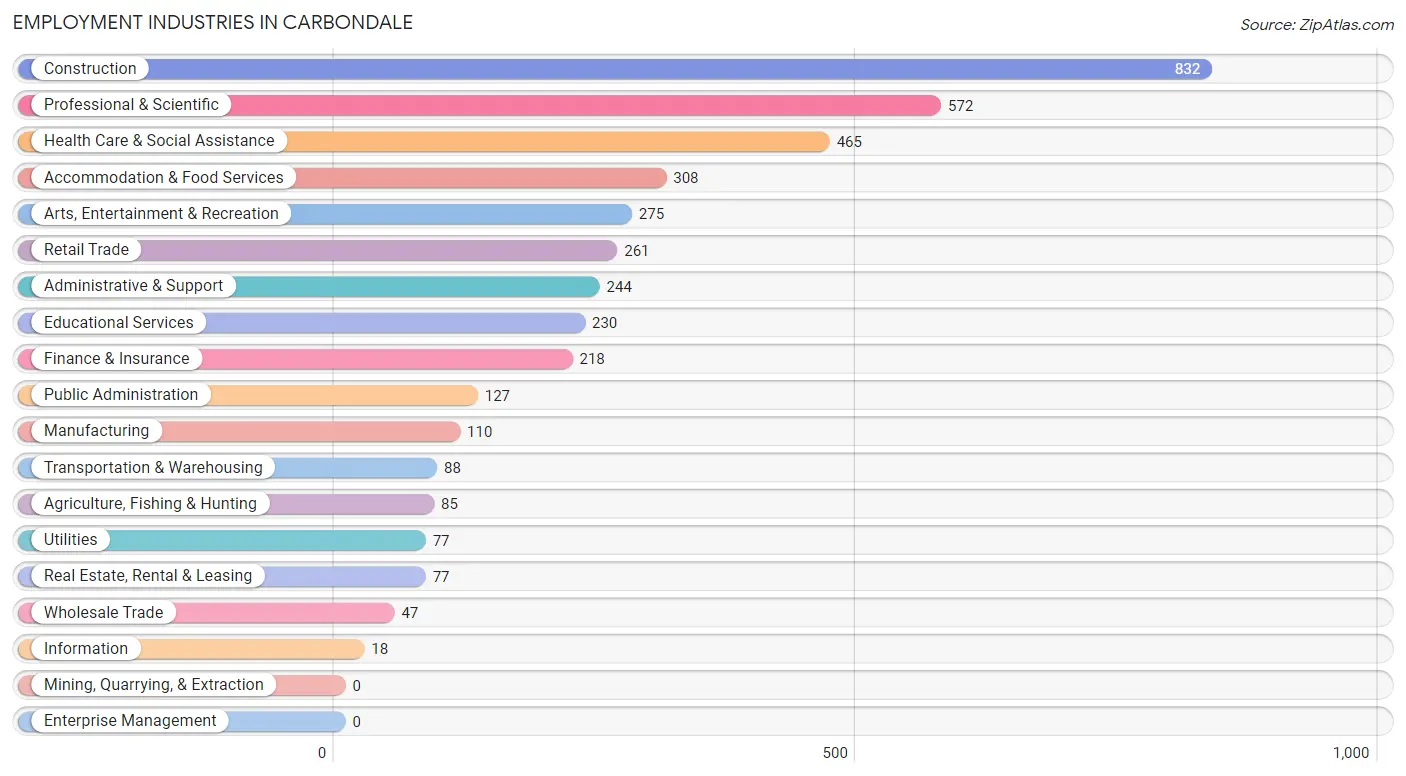
Employment Industries in Carbondale
The major employment industries in Carbondale include Construction (832 | 19.1%), Professional & Scientific (572 | 13.1%), Health Care & Social Assistance (465 | 10.7%), Accommodation & Food Services (308 | 7.1%), and Arts, Entertainment & Recreation (275 | 6.3%).
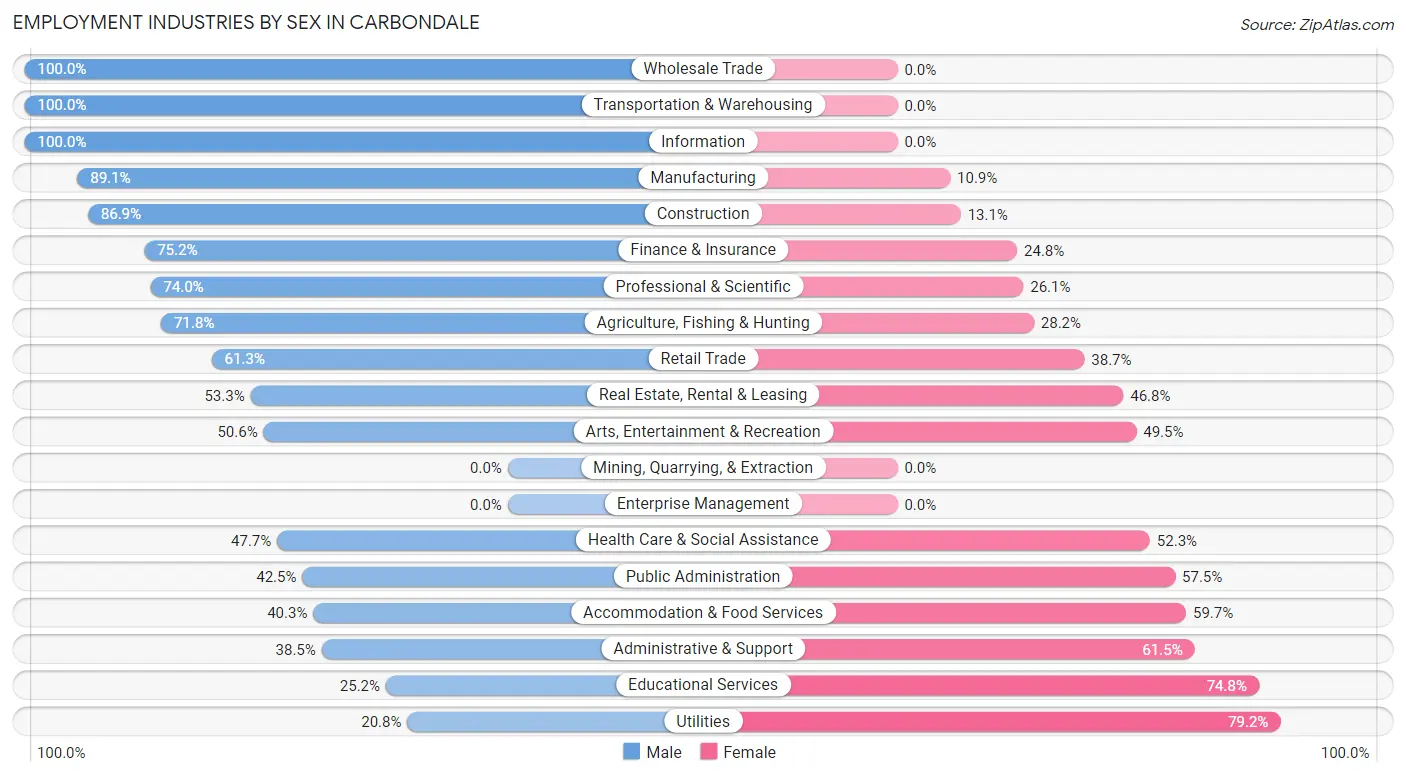
Employment Industries by Sex in Carbondale
The Carbondale industries that see more men than women are Wholesale Trade (100.0%), Transportation & Warehousing (100.0%), and Information (100.0%), whereas the industries that tend to have a higher number of women are Utilities (79.2%), Educational Services (74.8%), and Administrative & Support (61.5%).
| Industry | Male | Female |
| Agriculture, Fishing & Hunting | 61 (71.8%) | 24 (28.2%) |
| Mining, Quarrying, & Extraction | 0 (0.0%) | 0 (0.0%) |
| Construction | 723 (86.9%) | 109 (13.1%) |
| Manufacturing | 98 (89.1%) | 12 (10.9%) |
| Wholesale Trade | 47 (100.0%) | 0 (0.0%) |
| Retail Trade | 160 (61.3%) | 101 (38.7%) |
| Transportation & Warehousing | 88 (100.0%) | 0 (0.0%) |
| Utilities | 16 (20.8%) | 61 (79.2%) |
| Information | 18 (100.0%) | 0 (0.0%) |
| Finance & Insurance | 164 (75.2%) | 54 (24.8%) |
| Real Estate, Rental & Leasing | 41 (53.2%) | 36 (46.8%) |
| Professional & Scientific | 423 (74.0%) | 149 (26.1%) |
| Enterprise Management | 0 (0.0%) | 0 (0.0%) |
| Administrative & Support | 94 (38.5%) | 150 (61.5%) |
| Educational Services | 58 (25.2%) | 172 (74.8%) |
| Health Care & Social Assistance | 222 (47.7%) | 243 (52.3%) |
| Arts, Entertainment & Recreation | 139 (50.5%) | 136 (49.4%) |
| Accommodation & Food Services | 124 (40.3%) | 184 (59.7%) |
| Public Administration | 54 (42.5%) | 73 (57.5%) |
| Total | 2,638 (60.5%) | 1,724 (39.5%) |
Education in Carbondale
School Enrollment in Carbondale
The most common levels of schooling among the 1,108 students in Carbondale are middle school (286 | 25.8%), elementary school (239 | 21.6%), and high school (217 | 19.6%).
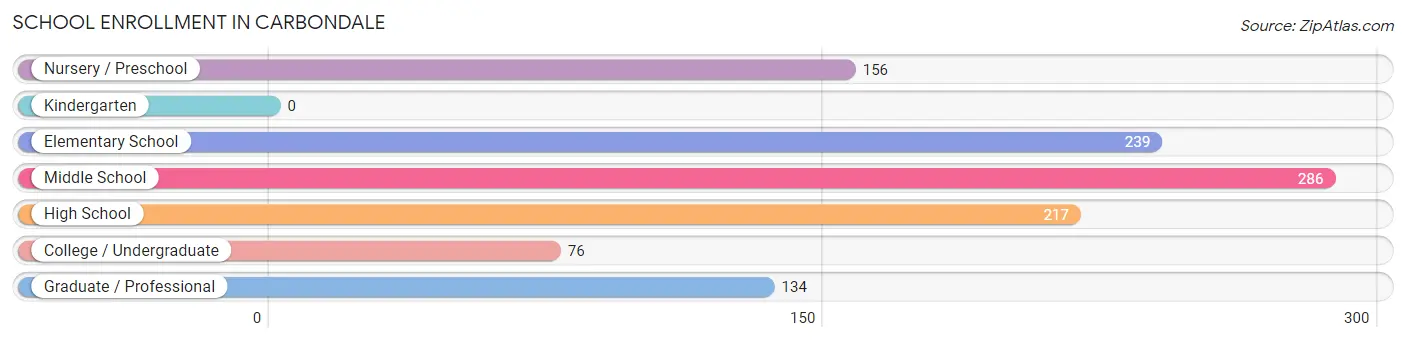
| School Level | # Students | % Students |
| Nursery / Preschool | 156 | 14.1% |
| Kindergarten | 0 | 0.0% |
| Elementary School | 239 | 21.6% |
| Middle School | 286 | 25.8% |
| High School | 217 | 19.6% |
| College / Undergraduate | 76 | 6.9% |
| Graduate / Professional | 134 | 12.1% |
| Total | 1,108 | 100.0% |
School Enrollment by Age by Funding Source in Carbondale
Out of a total of 1,108 students who are enrolled in schools in Carbondale, 342 (30.9%) attend a private institution, while the remaining 766 (69.1%) are enrolled in public schools. The age group of 18 to 19 year olds has the highest likelihood of being enrolled in private schools, with 45 (64.3% in the age bracket) enrolled. Conversely, the age group of 25 to 34 year olds has the lowest likelihood of being enrolled in a private school, with 77 (100.0% in the age bracket) attending a public institution.
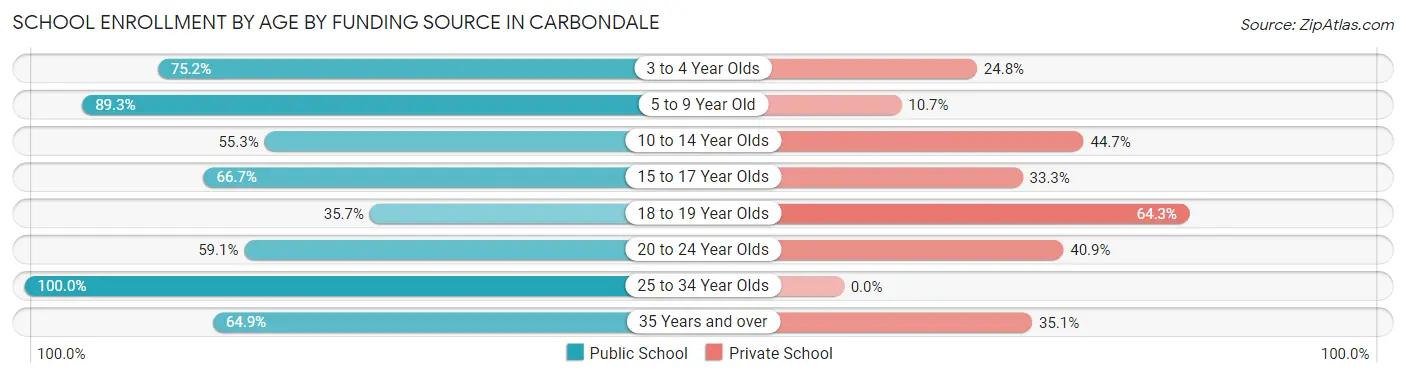
| Age Bracket | Public School | Private School |
| 3 to 4 Year Olds | 106 (75.2%) | 35 (24.8%) |
| 5 to 9 Year Old | 216 (89.3%) | 26 (10.7%) |
| 10 to 14 Year Olds | 182 (55.3%) | 147 (44.7%) |
| 15 to 17 Year Olds | 84 (66.7%) | 42 (33.3%) |
| 18 to 19 Year Olds | 25 (35.7%) | 45 (64.3%) |
| 20 to 24 Year Olds | 39 (59.1%) | 27 (40.9%) |
| 25 to 34 Year Olds | 77 (100.0%) | 0 (0.0%) |
| 35 Years and over | 37 (64.9%) | 20 (35.1%) |
| Total | 766 (69.1%) | 342 (30.9%) |
Educational Attainment by Field of Study in Carbondale
Business (577 | 17.9%), social sciences (364 | 11.3%), science & technology (320 | 9.9%), engineering (277 | 8.6%), and physical & health sciences (235 | 7.3%) are the most common fields of study among 3,223 individuals in Carbondale who have obtained a bachelor's degree or higher.
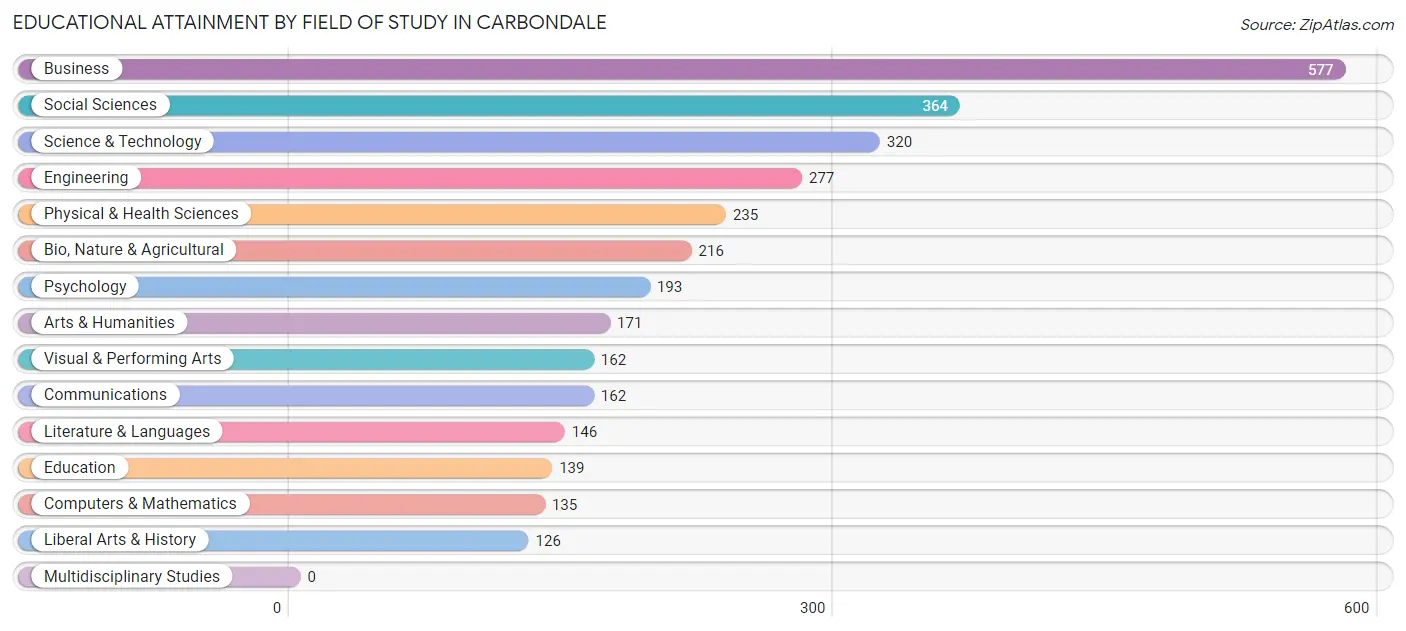
| Field of Study | # Graduates | % Graduates |
| Computers & Mathematics | 135 | 4.2% |
| Bio, Nature & Agricultural | 216 | 6.7% |
| Physical & Health Sciences | 235 | 7.3% |
| Psychology | 193 | 6.0% |
| Social Sciences | 364 | 11.3% |
| Engineering | 277 | 8.6% |
| Multidisciplinary Studies | 0 | 0.0% |
| Science & Technology | 320 | 9.9% |
| Business | 577 | 17.9% |
| Education | 139 | 4.3% |
| Literature & Languages | 146 | 4.5% |
| Liberal Arts & History | 126 | 3.9% |
| Visual & Performing Arts | 162 | 5.0% |
| Communications | 162 | 5.0% |
| Arts & Humanities | 171 | 5.3% |
| Total | 3,223 | 100.0% |
Transportation & Commute in Carbondale
Vehicle Availability by Sex in Carbondale
The most prevalent vehicle ownership categories in Carbondale are males with 2 vehicles (1,251, accounting for 48.8%) and females with 2 vehicles (731, making up 73.9%).
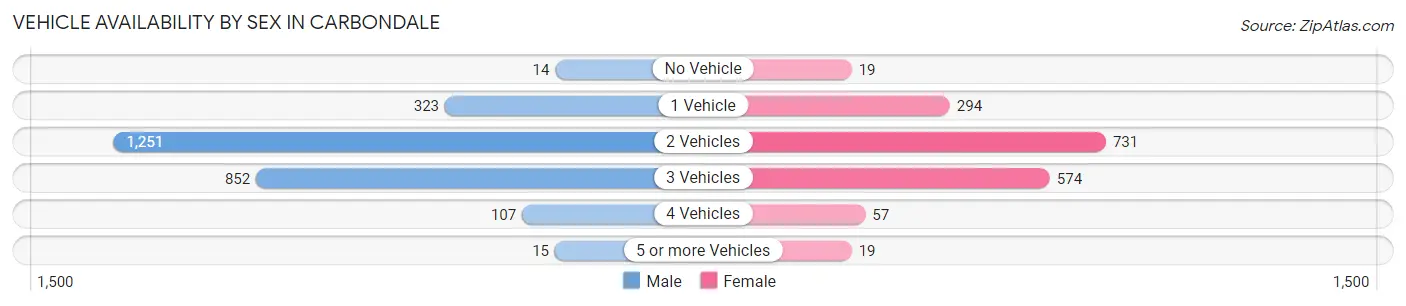
| Vehicles Available | Male | Female |
| No Vehicle | 14 (0.5%) | 19 (1.1%) |
| 1 Vehicle | 323 (12.6%) | 294 (17.4%) |
| 2 Vehicles | 1,251 (48.8%) | 731 (43.1%) |
| 3 Vehicles | 852 (33.3%) | 574 (33.9%) |
| 4 Vehicles | 107 (4.2%) | 57 (3.4%) |
| 5 or more Vehicles | 15 (0.6%) | 19 (1.1%) |
| Total | 2,562 (100.0%) | 1,694 (100.0%) |
Commute Time in Carbondale
The most frequently occuring commute durations in Carbondale are 5 to 9 minutes (898 commuters, 24.9%), 45 to 59 minutes (669 commuters, 18.5%), and 10 to 14 minutes (468 commuters, 13.0%).
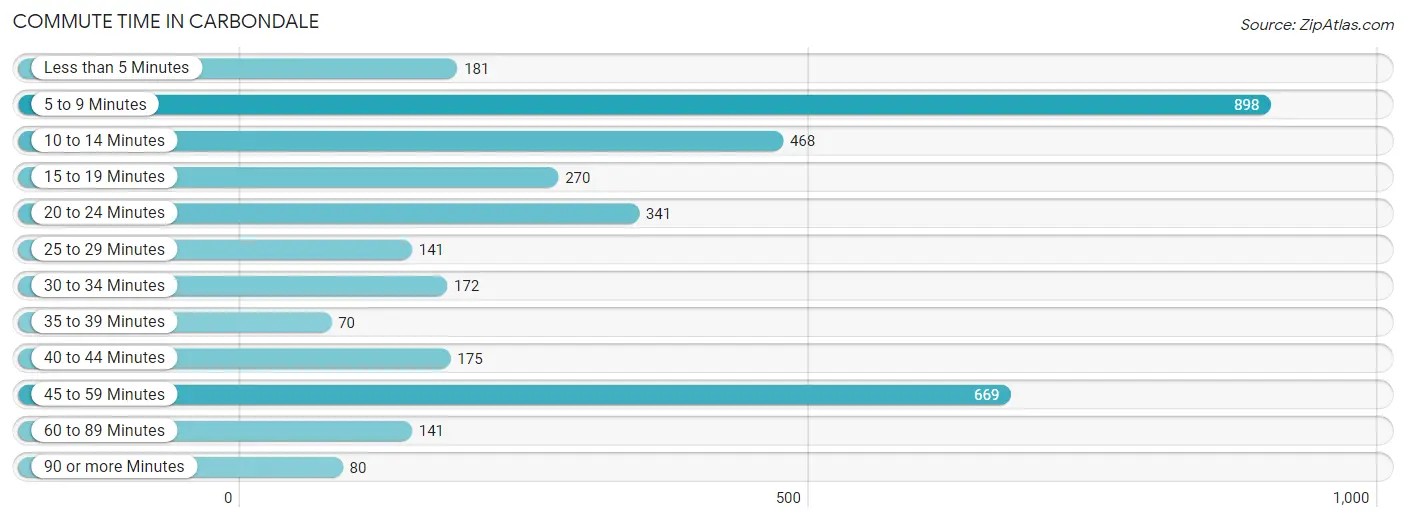
| Commute Time | # Commuters | % Commuters |
| Less than 5 Minutes | 181 | 5.0% |
| 5 to 9 Minutes | 898 | 24.9% |
| 10 to 14 Minutes | 468 | 13.0% |
| 15 to 19 Minutes | 270 | 7.5% |
| 20 to 24 Minutes | 341 | 9.5% |
| 25 to 29 Minutes | 141 | 3.9% |
| 30 to 34 Minutes | 172 | 4.8% |
| 35 to 39 Minutes | 70 | 1.9% |
| 40 to 44 Minutes | 175 | 4.9% |
| 45 to 59 Minutes | 669 | 18.5% |
| 60 to 89 Minutes | 141 | 3.9% |
| 90 or more Minutes | 80 | 2.2% |
Commute Time by Sex in Carbondale
The most common commute times in Carbondale are 45 to 59 minutes (606 commuters, 26.7%) for males and 5 to 9 minutes (317 commuters, 23.8%) for females.
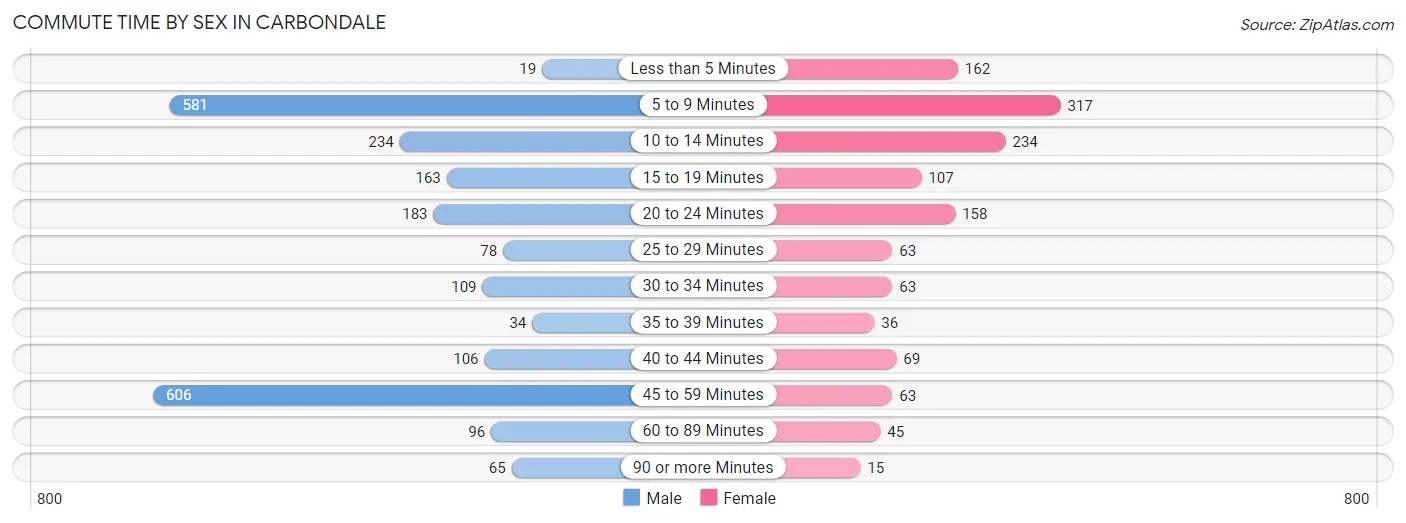
| Commute Time | Male | Female |
| Less than 5 Minutes | 19 (0.8%) | 162 (12.2%) |
| 5 to 9 Minutes | 581 (25.6%) | 317 (23.8%) |
| 10 to 14 Minutes | 234 (10.3%) | 234 (17.6%) |
| 15 to 19 Minutes | 163 (7.2%) | 107 (8.0%) |
| 20 to 24 Minutes | 183 (8.1%) | 158 (11.9%) |
| 25 to 29 Minutes | 78 (3.4%) | 63 (4.7%) |
| 30 to 34 Minutes | 109 (4.8%) | 63 (4.7%) |
| 35 to 39 Minutes | 34 (1.5%) | 36 (2.7%) |
| 40 to 44 Minutes | 106 (4.7%) | 69 (5.2%) |
| 45 to 59 Minutes | 606 (26.7%) | 63 (4.7%) |
| 60 to 89 Minutes | 96 (4.2%) | 45 (3.4%) |
| 90 or more Minutes | 65 (2.9%) | 15 (1.1%) |
Time of Departure to Work by Sex in Carbondale
The most frequent times of departure to work in Carbondale are 7:00 AM to 7:29 AM (692, 30.4%) for males and 8:30 AM to 8:59 AM (268, 20.1%) for females.
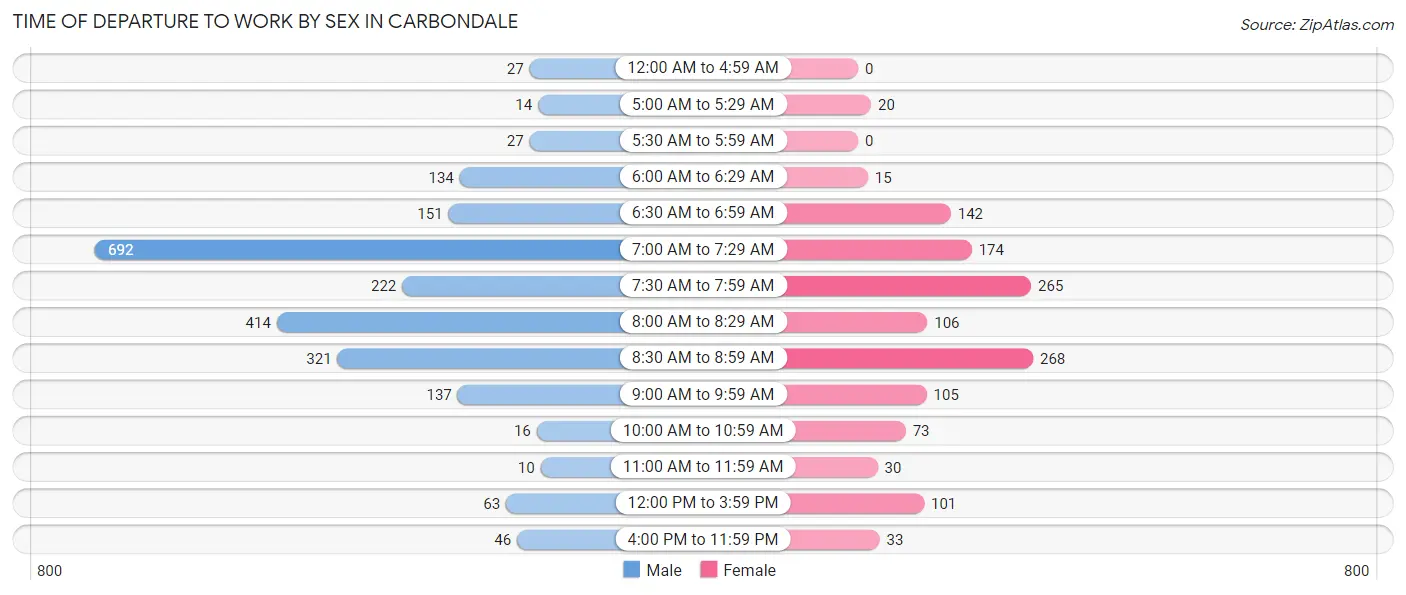
| Time of Departure | Male | Female |
| 12:00 AM to 4:59 AM | 27 (1.2%) | 0 (0.0%) |
| 5:00 AM to 5:29 AM | 14 (0.6%) | 20 (1.5%) |
| 5:30 AM to 5:59 AM | 27 (1.2%) | 0 (0.0%) |
| 6:00 AM to 6:29 AM | 134 (5.9%) | 15 (1.1%) |
| 6:30 AM to 6:59 AM | 151 (6.6%) | 142 (10.7%) |
| 7:00 AM to 7:29 AM | 692 (30.4%) | 174 (13.1%) |
| 7:30 AM to 7:59 AM | 222 (9.8%) | 265 (19.9%) |
| 8:00 AM to 8:29 AM | 414 (18.2%) | 106 (8.0%) |
| 8:30 AM to 8:59 AM | 321 (14.1%) | 268 (20.1%) |
| 9:00 AM to 9:59 AM | 137 (6.0%) | 105 (7.9%) |
| 10:00 AM to 10:59 AM | 16 (0.7%) | 73 (5.5%) |
| 11:00 AM to 11:59 AM | 10 (0.4%) | 30 (2.2%) |
| 12:00 PM to 3:59 PM | 63 (2.8%) | 101 (7.6%) |
| 4:00 PM to 11:59 PM | 46 (2.0%) | 33 (2.5%) |
| Total | 2,274 (100.0%) | 1,332 (100.0%) |
Housing Occupancy in Carbondale
Occupancy by Ownership in Carbondale
Of the total 2,780 dwellings in Carbondale, owner-occupied units account for 1,758 (63.2%), while renter-occupied units make up 1,022 (36.8%).
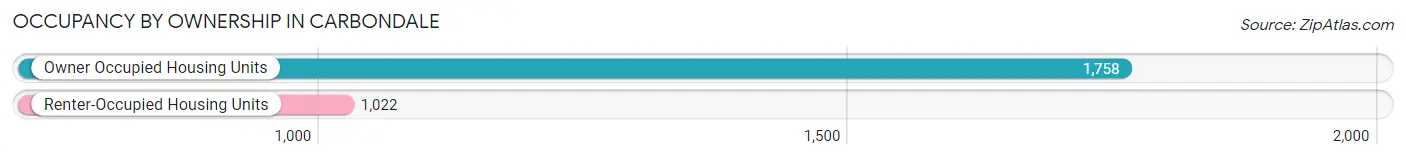
| Occupancy | # Housing Units | % Housing Units |
| Owner Occupied Housing Units | 1,758 | 63.2% |
| Renter-Occupied Housing Units | 1,022 | 36.8% |
| Total Occupied Housing Units | 2,780 | 100.0% |
Occupancy by Household Size in Carbondale
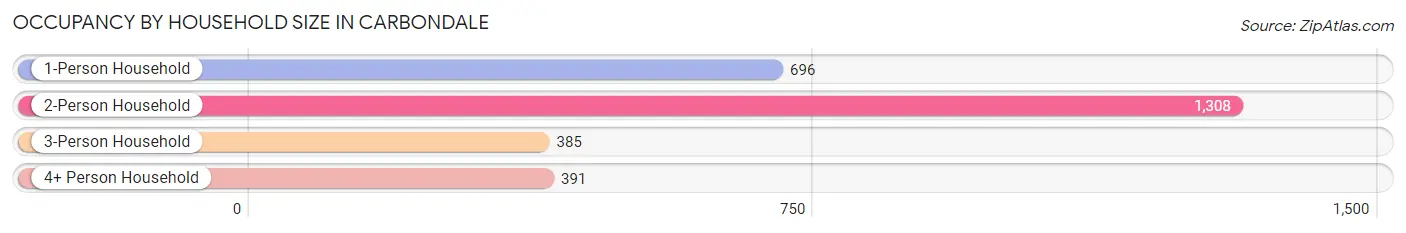
| Household Size | # Housing Units | % Housing Units |
| 1-Person Household | 696 | 25.0% |
| 2-Person Household | 1,308 | 47.0% |
| 3-Person Household | 385 | 13.9% |
| 4+ Person Household | 391 | 14.1% |
| Total Housing Units | 2,780 | 100.0% |
Occupancy by Ownership by Household Size in Carbondale
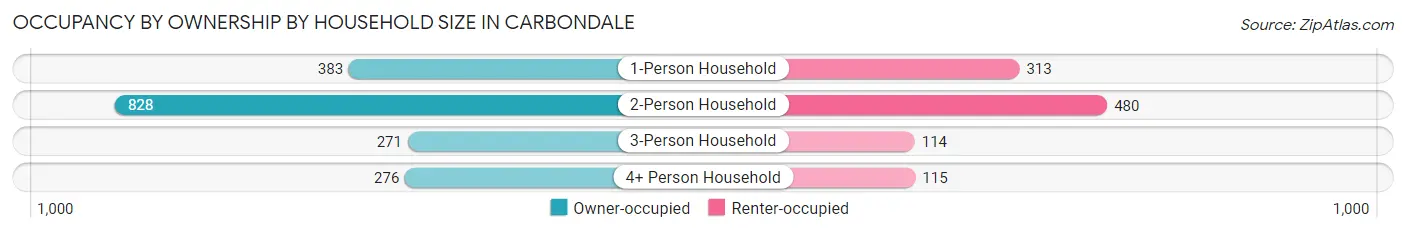
| Household Size | Owner-occupied | Renter-occupied |
| 1-Person Household | 383 (55.0%) | 313 (45.0%) |
| 2-Person Household | 828 (63.3%) | 480 (36.7%) |
| 3-Person Household | 271 (70.4%) | 114 (29.6%) |
| 4+ Person Household | 276 (70.6%) | 115 (29.4%) |
| Total Housing Units | 1,758 (63.2%) | 1,022 (36.8%) |
Occupancy by Educational Attainment in Carbondale
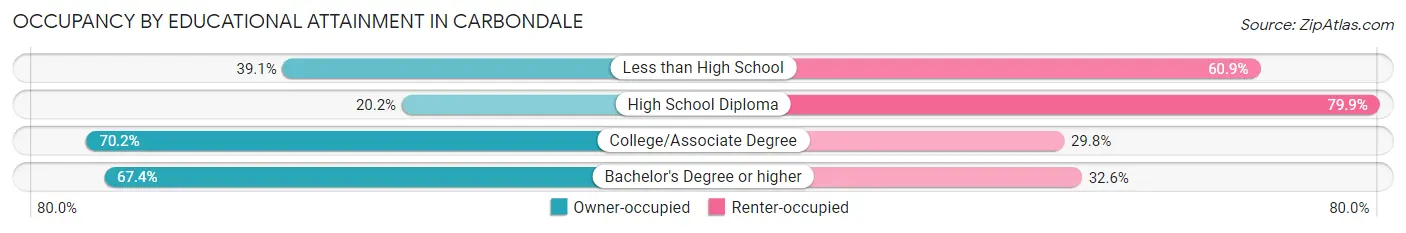
| Household Size | Owner-occupied | Renter-occupied |
| Less than High School | 95 (39.1%) | 148 (60.9%) |
| High School Diploma | 27 (20.2%) | 107 (79.8%) |
| College/Associate Degree | 410 (70.2%) | 174 (29.8%) |
| Bachelor's Degree or higher | 1,226 (67.4%) | 593 (32.6%) |
Occupancy by Age of Householder in Carbondale
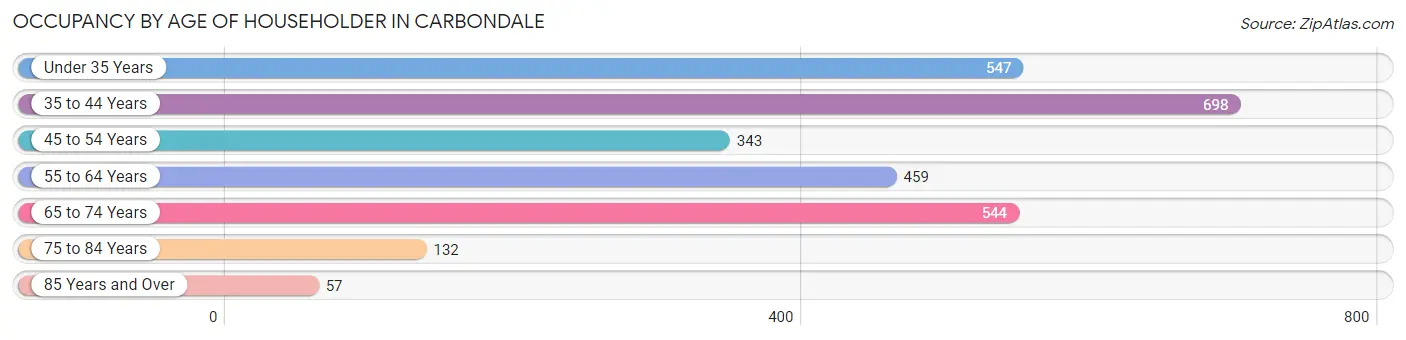
| Age Bracket | # Households | % Households |
| Under 35 Years | 547 | 19.7% |
| 35 to 44 Years | 698 | 25.1% |
| 45 to 54 Years | 343 | 12.3% |
| 55 to 64 Years | 459 | 16.5% |
| 65 to 74 Years | 544 | 19.6% |
| 75 to 84 Years | 132 | 4.8% |
| 85 Years and Over | 57 | 2.1% |
| Total | 2,780 | 100.0% |
Housing Finances in Carbondale
Median Income by Occupancy in Carbondale
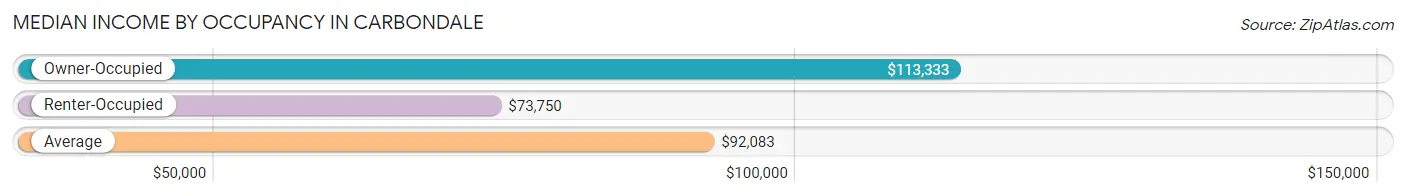
| Occupancy Type | # Households | Median Income |
| Owner-Occupied | 1,758 (63.2%) | $113,333 |
| Renter-Occupied | 1,022 (36.8%) | $73,750 |
| Average | 2,780 (100.0%) | $92,083 |
Occupancy by Householder Income Bracket in Carbondale
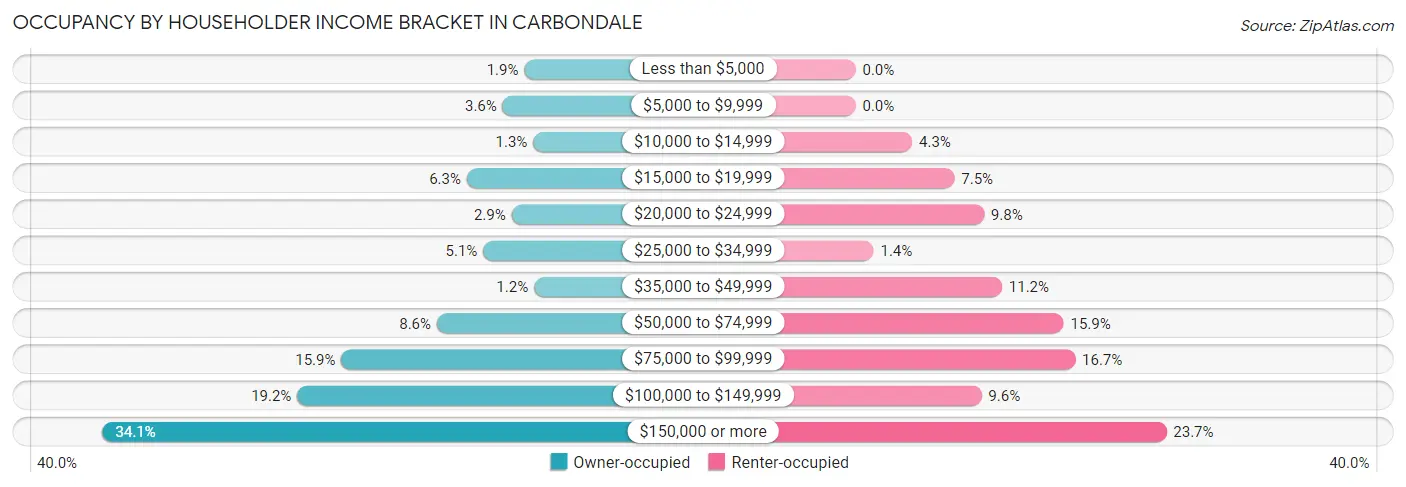
| Income Bracket | Owner-occupied | Renter-occupied |
| Less than $5,000 | 34 (1.9%) | 0 (0.0%) |
| $5,000 to $9,999 | 63 (3.6%) | 0 (0.0%) |
| $10,000 to $14,999 | 22 (1.3%) | 44 (4.3%) |
| $15,000 to $19,999 | 111 (6.3%) | 77 (7.5%) |
| $20,000 to $24,999 | 51 (2.9%) | 100 (9.8%) |
| $25,000 to $34,999 | 89 (5.1%) | 14 (1.4%) |
| $35,000 to $49,999 | 21 (1.2%) | 114 (11.2%) |
| $50,000 to $74,999 | 151 (8.6%) | 162 (15.9%) |
| $75,000 to $99,999 | 279 (15.9%) | 171 (16.7%) |
| $100,000 to $149,999 | 338 (19.2%) | 98 (9.6%) |
| $150,000 or more | 599 (34.1%) | 242 (23.7%) |
| Total | 1,758 (100.0%) | 1,022 (100.0%) |
Monthly Housing Cost Tiers in Carbondale
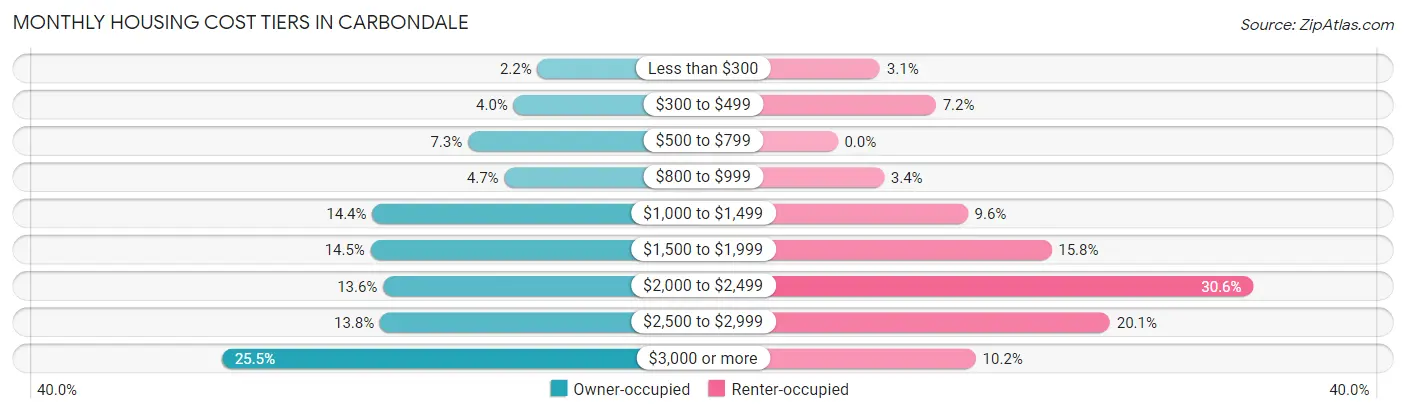
| Monthly Cost | Owner-occupied | Renter-occupied |
| Less than $300 | 39 (2.2%) | 32 (3.1%) |
| $300 to $499 | 70 (4.0%) | 74 (7.2%) |
| $500 to $799 | 129 (7.3%) | 0 (0.0%) |
| $800 to $999 | 82 (4.7%) | 35 (3.4%) |
| $1,000 to $1,499 | 253 (14.4%) | 98 (9.6%) |
| $1,500 to $1,999 | 255 (14.5%) | 161 (15.8%) |
| $2,000 to $2,499 | 239 (13.6%) | 313 (30.6%) |
| $2,500 to $2,999 | 243 (13.8%) | 205 (20.1%) |
| $3,000 or more | 448 (25.5%) | 104 (10.2%) |
| Total | 1,758 (100.0%) | 1,022 (100.0%) |
Physical Housing Characteristics in Carbondale
Housing Structures in Carbondale
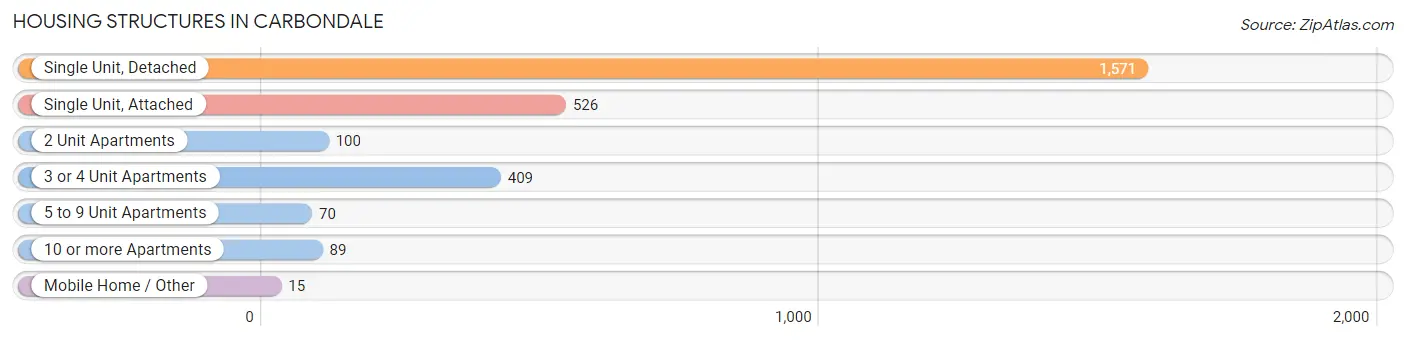
| Structure Type | # Housing Units | % Housing Units |
| Single Unit, Detached | 1,571 | 56.5% |
| Single Unit, Attached | 526 | 18.9% |
| 2 Unit Apartments | 100 | 3.6% |
| 3 or 4 Unit Apartments | 409 | 14.7% |
| 5 to 9 Unit Apartments | 70 | 2.5% |
| 10 or more Apartments | 89 | 3.2% |
| Mobile Home / Other | 15 | 0.5% |
| Total | 2,780 | 100.0% |
Housing Structures by Occupancy in Carbondale
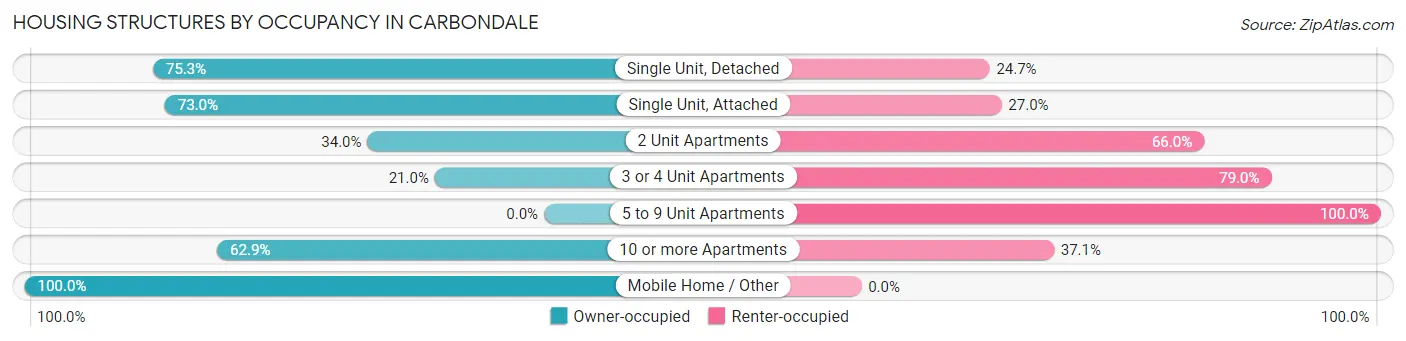
| Structure Type | Owner-occupied | Renter-occupied |
| Single Unit, Detached | 1,183 (75.3%) | 388 (24.7%) |
| Single Unit, Attached | 384 (73.0%) | 142 (27.0%) |
| 2 Unit Apartments | 34 (34.0%) | 66 (66.0%) |
| 3 or 4 Unit Apartments | 86 (21.0%) | 323 (79.0%) |
| 5 to 9 Unit Apartments | 0 (0.0%) | 70 (100.0%) |
| 10 or more Apartments | 56 (62.9%) | 33 (37.1%) |
| Mobile Home / Other | 15 (100.0%) | 0 (0.0%) |
| Total | 1,758 (63.2%) | 1,022 (36.8%) |
Housing Structures by Number of Rooms in Carbondale
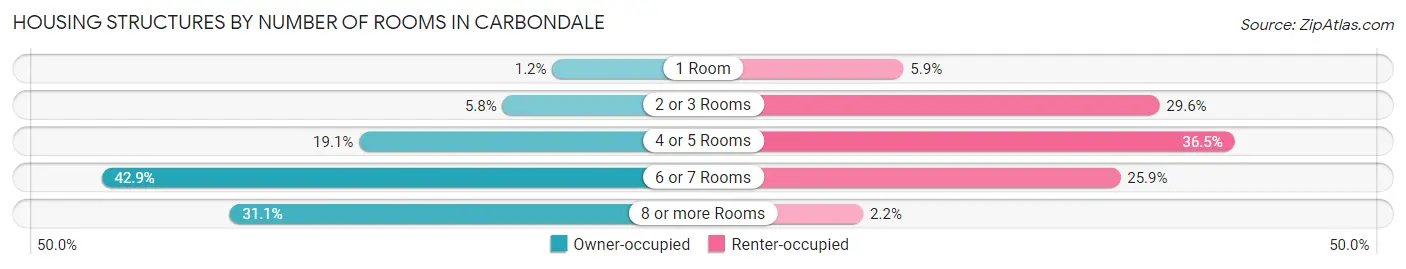
| Number of Rooms | Owner-occupied | Renter-occupied |
| 1 Room | 21 (1.2%) | 60 (5.9%) |
| 2 or 3 Rooms | 102 (5.8%) | 302 (29.5%) |
| 4 or 5 Rooms | 335 (19.1%) | 373 (36.5%) |
| 6 or 7 Rooms | 754 (42.9%) | 265 (25.9%) |
| 8 or more Rooms | 546 (31.1%) | 22 (2.1%) |
| Total | 1,758 (100.0%) | 1,022 (100.0%) |
Housing Structure by Heating Type in Carbondale
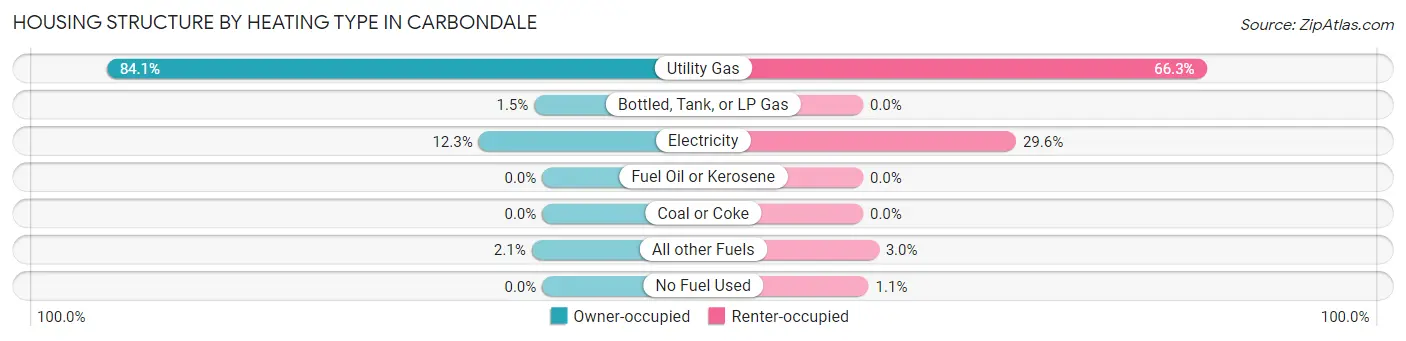
| Heating Type | Owner-occupied | Renter-occupied |
| Utility Gas | 1,479 (84.1%) | 678 (66.3%) |
| Bottled, Tank, or LP Gas | 27 (1.5%) | 0 (0.0%) |
| Electricity | 216 (12.3%) | 302 (29.5%) |
| Fuel Oil or Kerosene | 0 (0.0%) | 0 (0.0%) |
| Coal or Coke | 0 (0.0%) | 0 (0.0%) |
| All other Fuels | 36 (2.1%) | 31 (3.0%) |
| No Fuel Used | 0 (0.0%) | 11 (1.1%) |
| Total | 1,758 (100.0%) | 1,022 (100.0%) |
Household Vehicle Usage in Carbondale
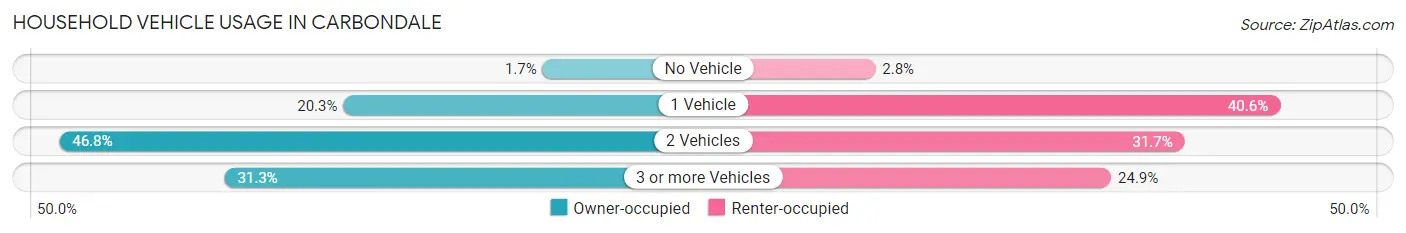
| Vehicles per Household | Owner-occupied | Renter-occupied |
| No Vehicle | 29 (1.7%) | 29 (2.8%) |
| 1 Vehicle | 356 (20.3%) | 415 (40.6%) |
| 2 Vehicles | 822 (46.8%) | 324 (31.7%) |
| 3 or more Vehicles | 551 (31.3%) | 254 (24.8%) |
| Total | 1,758 (100.0%) | 1,022 (100.0%) |
Real Estate & Mortgages in Carbondale
Real Estate and Mortgage Overview in Carbondale
| Characteristic | Without Mortgage | With Mortgage |
| Housing Units | 448 | 1,310 |
| Median Property Value | $766,500 | $745,300 |
| Median Household Income | $86,313 | $460 |
| Monthly Housing Costs | $689 | $448 |
| Real Estate Taxes | $3,858 | $29 |
Property Value by Mortgage Status in Carbondale
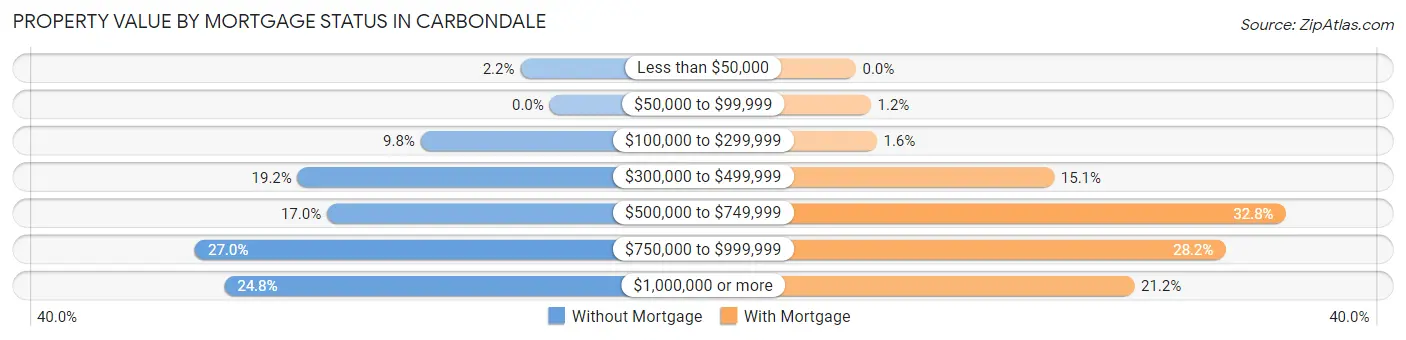
| Property Value | Without Mortgage | With Mortgage |
| Less than $50,000 | 10 (2.2%) | 0 (0.0%) |
| $50,000 to $99,999 | 0 (0.0%) | 15 (1.1%) |
| $100,000 to $299,999 | 44 (9.8%) | 21 (1.6%) |
| $300,000 to $499,999 | 86 (19.2%) | 198 (15.1%) |
| $500,000 to $749,999 | 76 (17.0%) | 429 (32.8%) |
| $750,000 to $999,999 | 121 (27.0%) | 369 (28.2%) |
| $1,000,000 or more | 111 (24.8%) | 278 (21.2%) |
| Total | 448 (100.0%) | 1,310 (100.0%) |
Household Income by Mortgage Status in Carbondale
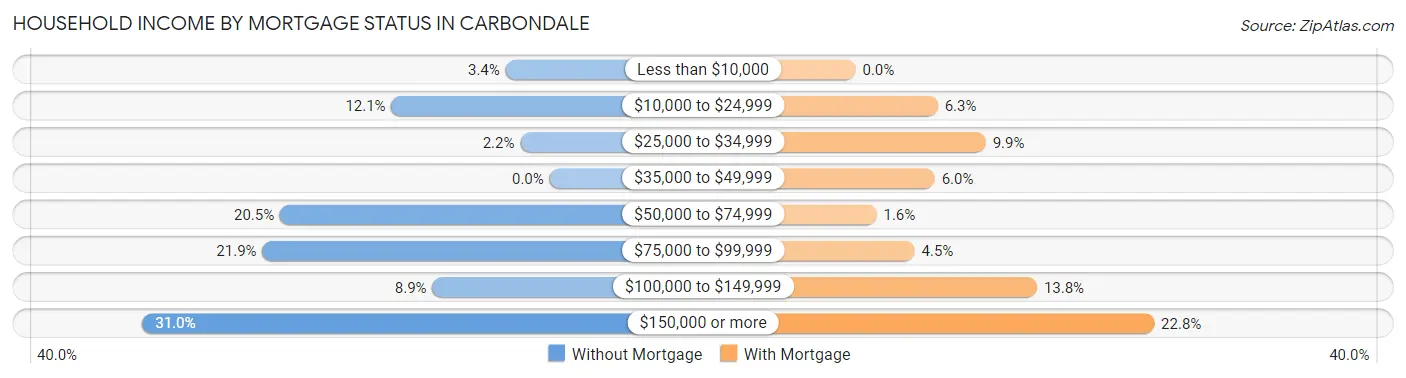
| Household Income | Without Mortgage | With Mortgage |
| Less than $10,000 | 15 (3.4%) | 0 (0.0%) |
| $10,000 to $24,999 | 54 (12.0%) | 82 (6.3%) |
| $25,000 to $34,999 | 10 (2.2%) | 130 (9.9%) |
| $35,000 to $49,999 | 0 (0.0%) | 79 (6.0%) |
| $50,000 to $74,999 | 92 (20.5%) | 21 (1.6%) |
| $75,000 to $99,999 | 98 (21.9%) | 59 (4.5%) |
| $100,000 to $149,999 | 40 (8.9%) | 181 (13.8%) |
| $150,000 or more | 139 (31.0%) | 298 (22.8%) |
| Total | 448 (100.0%) | 1,310 (100.0%) |
Property Value to Household Income Ratio in Carbondale
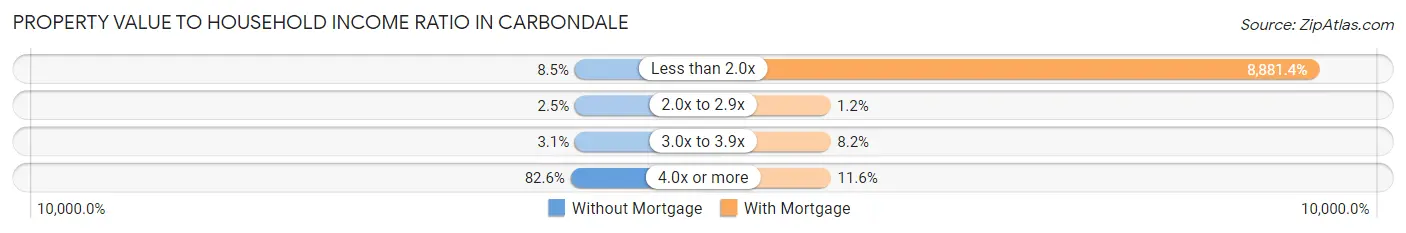
| Value-to-Income Ratio | Without Mortgage | With Mortgage |
| Less than 2.0x | 38 (8.5%) | 116,346 (8,881.4%) |
| 2.0x to 2.9x | 11 (2.5%) | 15 (1.1%) |
| 3.0x to 3.9x | 14 (3.1%) | 108 (8.2%) |
| 4.0x or more | 370 (82.6%) | 152 (11.6%) |
| Total | 448 (100.0%) | 1,310 (100.0%) |
Real Estate Taxes by Mortgage Status in Carbondale
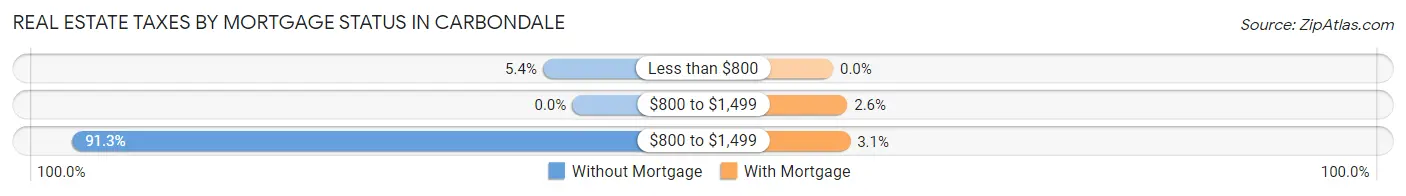
| Property Taxes | Without Mortgage | With Mortgage |
| Less than $800 | 24 (5.4%) | 0 (0.0%) |
| $800 to $1,499 | 0 (0.0%) | 34 (2.6%) |
| $800 to $1,499 | 409 (91.3%) | 41 (3.1%) |
| Total | 448 (100.0%) | 1,310 (100.0%) |
Health & Disability in Carbondale
Health Insurance Coverage by Age in Carbondale
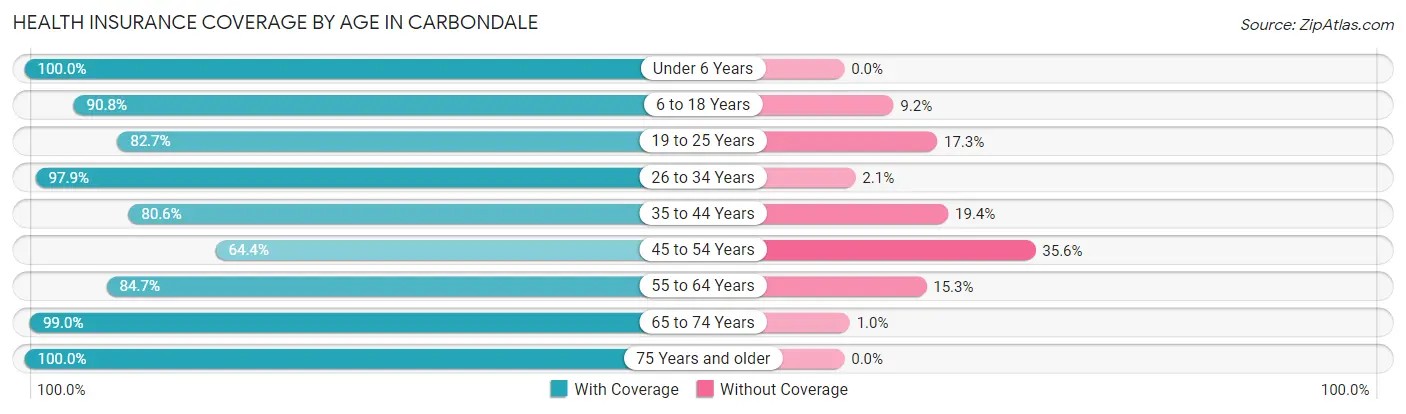
| Age Bracket | With Coverage | Without Coverage |
| Under 6 Years | 237 (100.0%) | 0 (0.0%) |
| 6 to 18 Years | 674 (90.8%) | 68 (9.2%) |
| 19 to 25 Years | 220 (82.7%) | 46 (17.3%) |
| 26 to 34 Years | 948 (97.9%) | 20 (2.1%) |
| 35 to 44 Years | 1,004 (80.6%) | 241 (19.4%) |
| 45 to 54 Years | 730 (64.4%) | 404 (35.6%) |
| 55 to 64 Years | 576 (84.7%) | 104 (15.3%) |
| 65 to 74 Years | 885 (99.0%) | 9 (1.0%) |
| 75 Years and older | 251 (100.0%) | 0 (0.0%) |
| Total | 5,525 (86.1%) | 892 (13.9%) |
Health Insurance Coverage by Citizenship Status in Carbondale
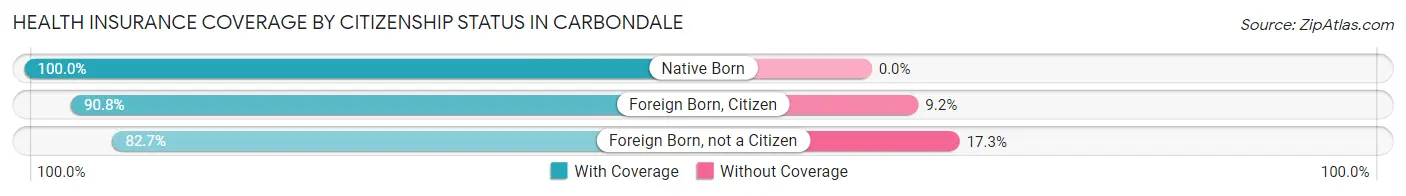
| Citizenship Status | With Coverage | Without Coverage |
| Native Born | 237 (100.0%) | 0 (0.0%) |
| Foreign Born, Citizen | 674 (90.8%) | 68 (9.2%) |
| Foreign Born, not a Citizen | 220 (82.7%) | 46 (17.3%) |
Health Insurance Coverage by Household Income in Carbondale
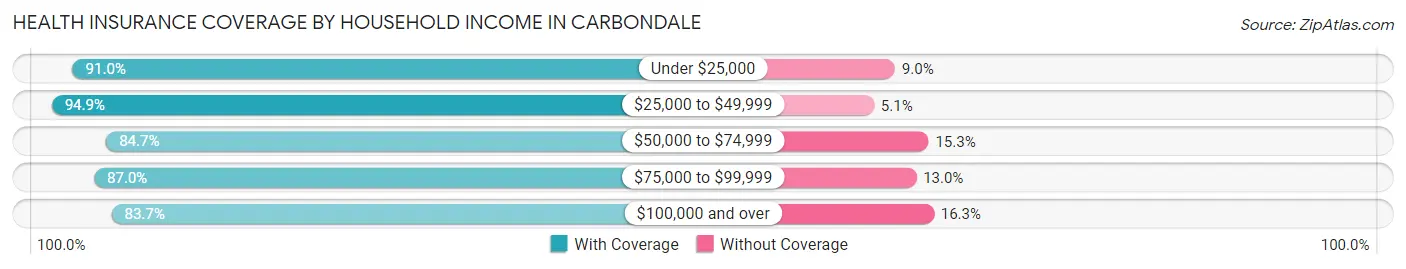
| Household Income | With Coverage | Without Coverage |
| Under $25,000 | 747 (91.0%) | 74 (9.0%) |
| $25,000 to $49,999 | 392 (94.9%) | 21 (5.1%) |
| $50,000 to $74,999 | 570 (84.7%) | 103 (15.3%) |
| $75,000 to $99,999 | 783 (87.0%) | 117 (13.0%) |
| $100,000 and over | 2,962 (83.7%) | 577 (16.3%) |
Public vs Private Health Insurance Coverage by Age in Carbondale
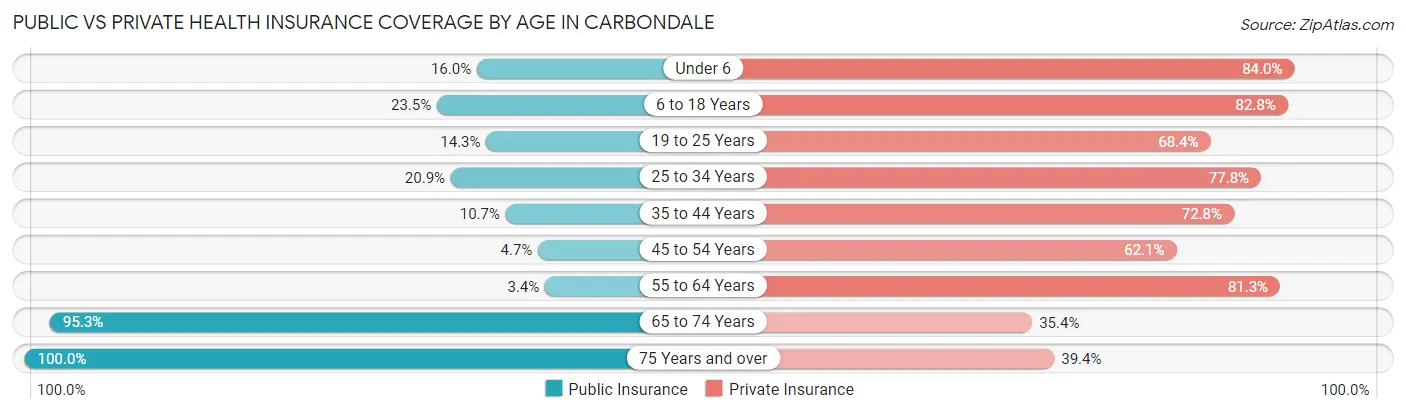
| Age Bracket | Public Insurance | Private Insurance |
| Under 6 | 38 (16.0%) | 199 (84.0%) |
| 6 to 18 Years | 174 (23.4%) | 614 (82.8%) |
| 19 to 25 Years | 38 (14.3%) | 182 (68.4%) |
| 25 to 34 Years | 202 (20.9%) | 753 (77.8%) |
| 35 to 44 Years | 133 (10.7%) | 906 (72.8%) |
| 45 to 54 Years | 53 (4.7%) | 704 (62.1%) |
| 55 to 64 Years | 23 (3.4%) | 553 (81.3%) |
| 65 to 74 Years | 852 (95.3%) | 316 (35.3%) |
| 75 Years and over | 251 (100.0%) | 99 (39.4%) |
| Total | 1,764 (27.5%) | 4,326 (67.4%) |
Disability Status by Sex by Age in Carbondale
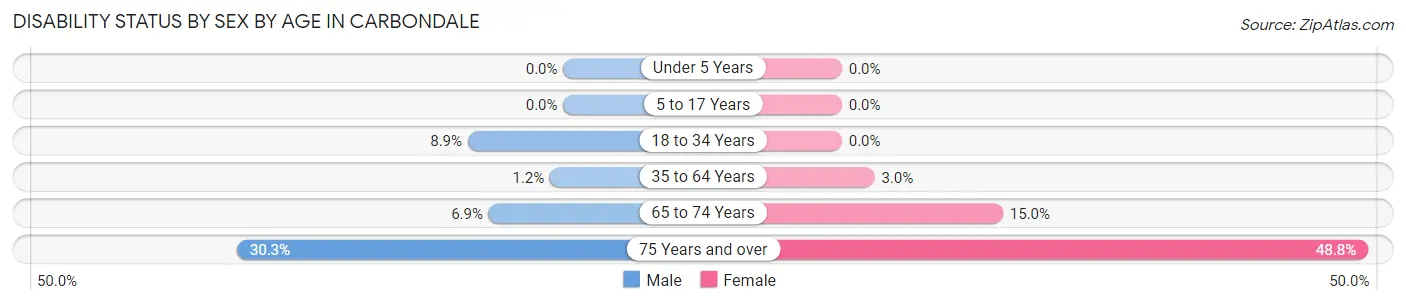
| Age Bracket | Male | Female |
| Under 5 Years | 0 (0.0%) | 0 (0.0%) |
| 5 to 17 Years | 0 (0.0%) | 0 (0.0%) |
| 18 to 34 Years | 64 (8.9%) | 0 (0.0%) |
| 35 to 64 Years | 23 (1.2%) | 36 (3.0%) |
| 65 to 74 Years | 35 (6.9%) | 58 (14.9%) |
| 75 Years and over | 50 (30.3%) | 42 (48.8%) |
Disability Class by Sex by Age in Carbondale
Disability Class: Hearing Difficulty
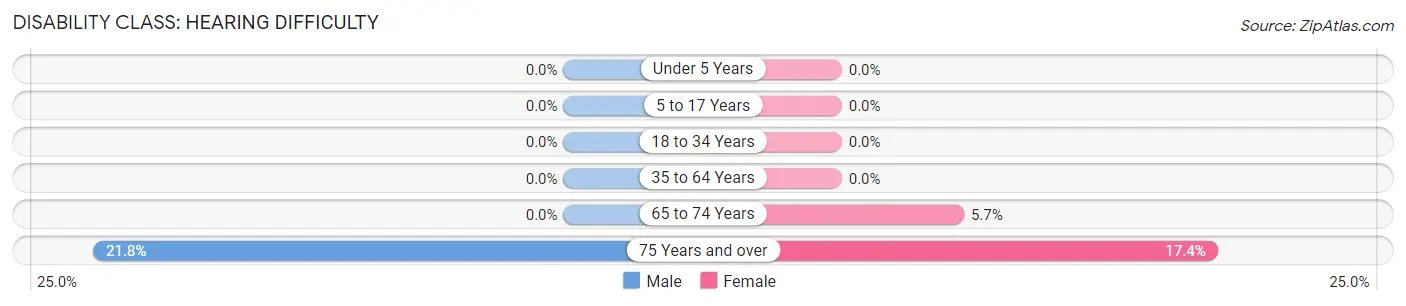
| Age Bracket | Male | Female |
| Under 5 Years | 0 (0.0%) | 0 (0.0%) |
| 5 to 17 Years | 0 (0.0%) | 0 (0.0%) |
| 18 to 34 Years | 0 (0.0%) | 0 (0.0%) |
| 35 to 64 Years | 0 (0.0%) | 0 (0.0%) |
| 65 to 74 Years | 0 (0.0%) | 22 (5.7%) |
| 75 Years and over | 36 (21.8%) | 15 (17.4%) |
Disability Class: Vision Difficulty
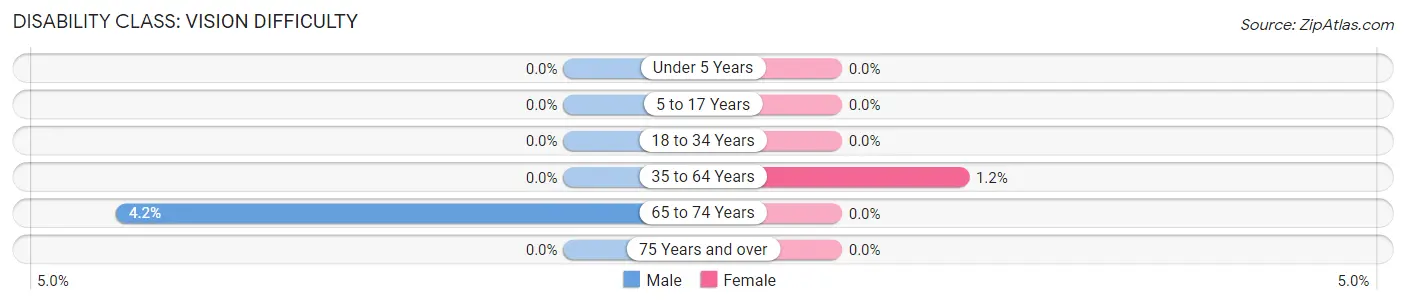
| Age Bracket | Male | Female |
| Under 5 Years | 0 (0.0%) | 0 (0.0%) |
| 5 to 17 Years | 0 (0.0%) | 0 (0.0%) |
| 18 to 34 Years | 0 (0.0%) | 0 (0.0%) |
| 35 to 64 Years | 0 (0.0%) | 14 (1.2%) |
| 65 to 74 Years | 21 (4.2%) | 0 (0.0%) |
| 75 Years and over | 0 (0.0%) | 0 (0.0%) |
Disability Class: Cognitive Difficulty
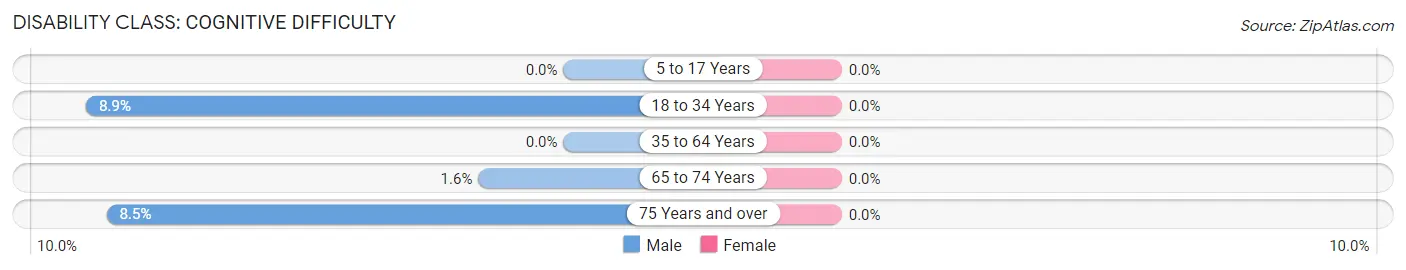
| Age Bracket | Male | Female |
| 5 to 17 Years | 0 (0.0%) | 0 (0.0%) |
| 18 to 34 Years | 64 (8.9%) | 0 (0.0%) |
| 35 to 64 Years | 0 (0.0%) | 0 (0.0%) |
| 65 to 74 Years | 8 (1.6%) | 0 (0.0%) |
| 75 Years and over | 14 (8.5%) | 0 (0.0%) |
Disability Class: Ambulatory Difficulty
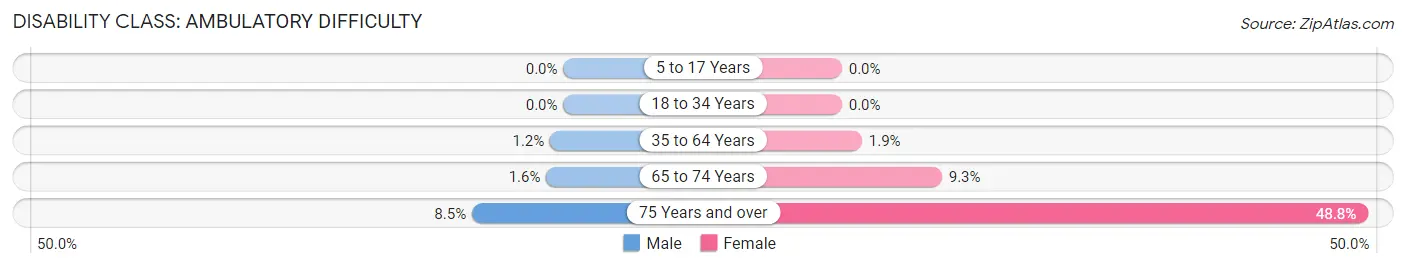
| Age Bracket | Male | Female |
| 5 to 17 Years | 0 (0.0%) | 0 (0.0%) |
| 18 to 34 Years | 0 (0.0%) | 0 (0.0%) |
| 35 to 64 Years | 23 (1.2%) | 22 (1.9%) |
| 65 to 74 Years | 8 (1.6%) | 36 (9.3%) |
| 75 Years and over | 14 (8.5%) | 42 (48.8%) |
Disability Class: Self-Care Difficulty
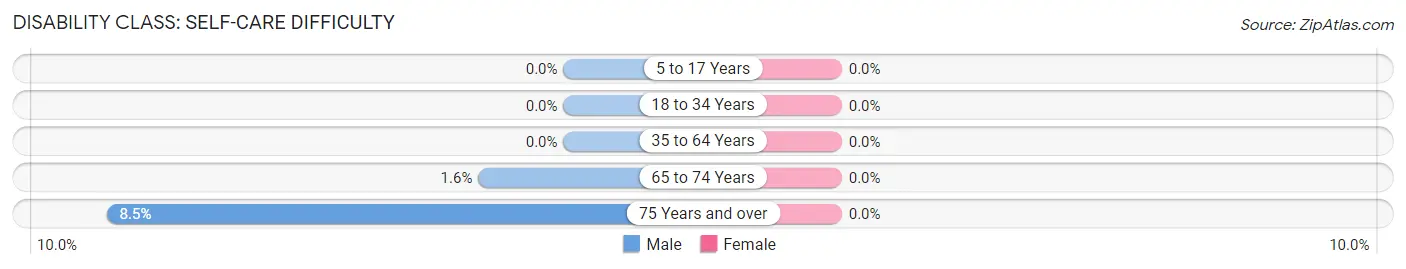
| Age Bracket | Male | Female |
| 5 to 17 Years | 0 (0.0%) | 0 (0.0%) |
| 18 to 34 Years | 0 (0.0%) | 0 (0.0%) |
| 35 to 64 Years | 0 (0.0%) | 0 (0.0%) |
| 65 to 74 Years | 8 (1.6%) | 0 (0.0%) |
| 75 Years and over | 14 (8.5%) | 0 (0.0%) |
Technology Access in Carbondale
Computing Device Access in Carbondale
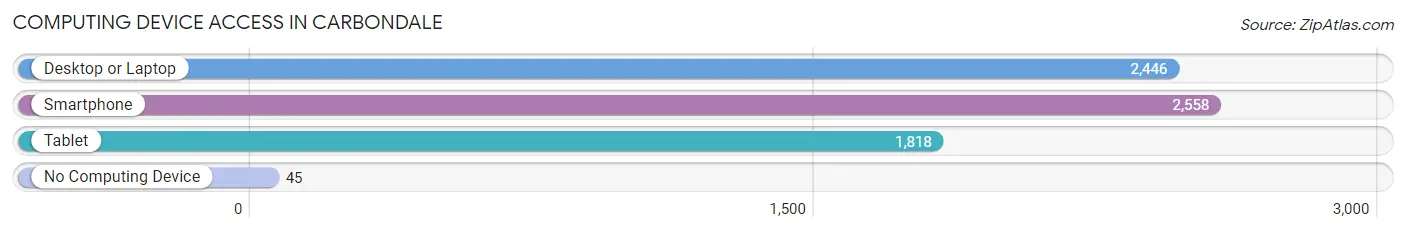
| Device Type | # Households | % Households |
| Desktop or Laptop | 2,446 | 88.0% |
| Smartphone | 2,558 | 92.0% |
| Tablet | 1,818 | 65.4% |
| No Computing Device | 45 | 1.6% |
| Total | 2,780 | 100.0% |
Internet Access in Carbondale
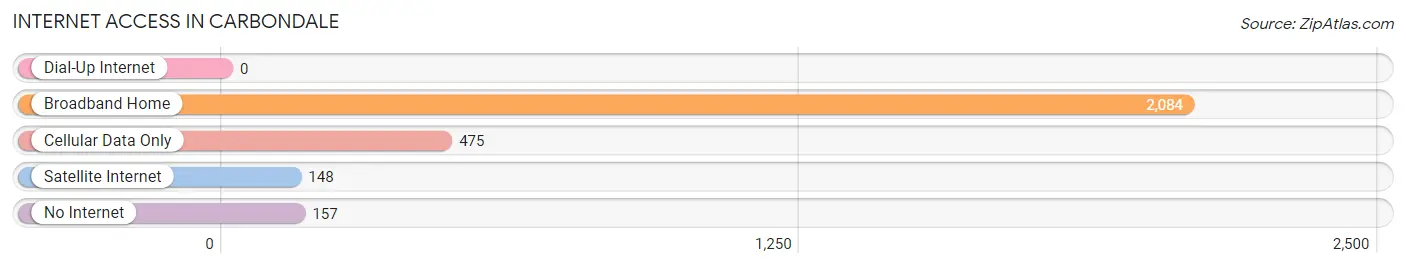
| Internet Type | # Households | % Households |
| Dial-Up Internet | 0 | 0.0% |
| Broadband Home | 2,084 | 75.0% |
| Cellular Data Only | 475 | 17.1% |
| Satellite Internet | 148 | 5.3% |
| No Internet | 157 | 5.7% |
| Total | 2,780 | 100.0% |
Carbondale Summary
Carbondale, Colorado is a small town located in the Roaring Fork Valley of the Rocky Mountains. It is situated at the confluence of the Crystal and Roaring Fork Rivers, and is surrounded by the White River National Forest. The town has a population of 6,912 as of the 2020 census, and is the county seat of Garfield County.
History
Carbondale was founded in 1883 by a group of settlers from Carbondale, Illinois. The town was originally called Crystal City, but the name was changed to Carbondale in 1885. The town was incorporated in 1887 and has since grown to become a popular tourist destination.
The town was originally a mining town, and the first coal mine opened in 1884. The coal industry was the main source of employment for the town until the 1950s, when the mines began to close. The town then shifted to a more tourism-based economy, and today is known for its outdoor recreation opportunities.
Geography
Carbondale is located in the Roaring Fork Valley of the Rocky Mountains, at the confluence of the Crystal and Roaring Fork Rivers. The town is surrounded by the White River National Forest, and is located at an elevation of 6,890 feet. The town is located approximately 30 miles south of Glenwood Springs, and is about a two-hour drive from Denver.
The town is located in a semi-arid climate, with hot summers and cold winters. The average annual precipitation is 16.5 inches, and the average annual snowfall is 81.5 inches.
Economy
Carbondale’s economy is largely based on tourism, with outdoor recreation being the main draw. The town is home to several ski resorts, including Sunlight Mountain Resort and Aspen Snowmass. The town is also home to several restaurants, bars, and shops.
The town is also home to several businesses, including a brewery, a distillery, and a winery. The town is also home to several art galleries, and is a popular destination for art lovers.
Demographics
As of the 2020 census, the population of Carbondale was 6,912. The racial makeup of the town was 91.3% White, 0.7% African American, 0.7% Native American, 0.7% Asian, 0.2% Pacific Islander, 4.2% from other races, and 2.1% from two or more races. Hispanic or Latino of any race were 11.2% of the population.
The median household income in Carbondale was $60,938, and the median family income was $71,917. The per capita income for the town was $31,945. About 8.3% of families and 11.2% of the population were below the poverty line, including 16.2% of those under age 18 and 5.2% of those age 65 or over.
Common Questions
What is Per Capita Income in Carbondale?
Per Capita income in Carbondale is $54,323.
What is the Median Family Income in Carbondale?
Median Family Income in Carbondale is $117,363.
What is the Median Household income in Carbondale?
Median Household Income in Carbondale is $92,083.
What is Income or Wage Gap in Carbondale?
Income or Wage Gap in Carbondale is 15.3%.
Women in Carbondale earn 84.7 cents for every dollar earned by a man.
What is Inequality or Gini Index in Carbondale?
Inequality or Gini Index in Carbondale is 0.46.
What is the Total Population of Carbondale?
Total Population of Carbondale is 6,497.
What is the Total Male Population of Carbondale?
Total Male Population of Carbondale is 3,841.
What is the Total Female Population of Carbondale?
Total Female Population of Carbondale is 2,656.
What is the Ratio of Males per 100 Females in Carbondale?
There are 144.62 Males per 100 Females in Carbondale.
What is the Ratio of Females per 100 Males in Carbondale?
There are 69.15 Females per 100 Males in Carbondale.
What is the Median Population Age in Carbondale?
Median Population Age in Carbondale is 42.0 Years.
What is the Average Family Size in Carbondale
Average Family Size in Carbondale is 2.6 People.
What is the Average Household Size in Carbondale
Average Household Size in Carbondale is 2.3 People.
How Large is the Labor Force in Carbondale?
There are 4,413 People in the Labor Forcein in Carbondale.
What is the Percentage of People in the Labor Force in Carbondale?
78.6% of People are in the Labor Force in Carbondale.
What is the Unemployment Rate in Carbondale?
Unemployment Rate in Carbondale is 1.1%.