Moffat County, CO Map & Demographics
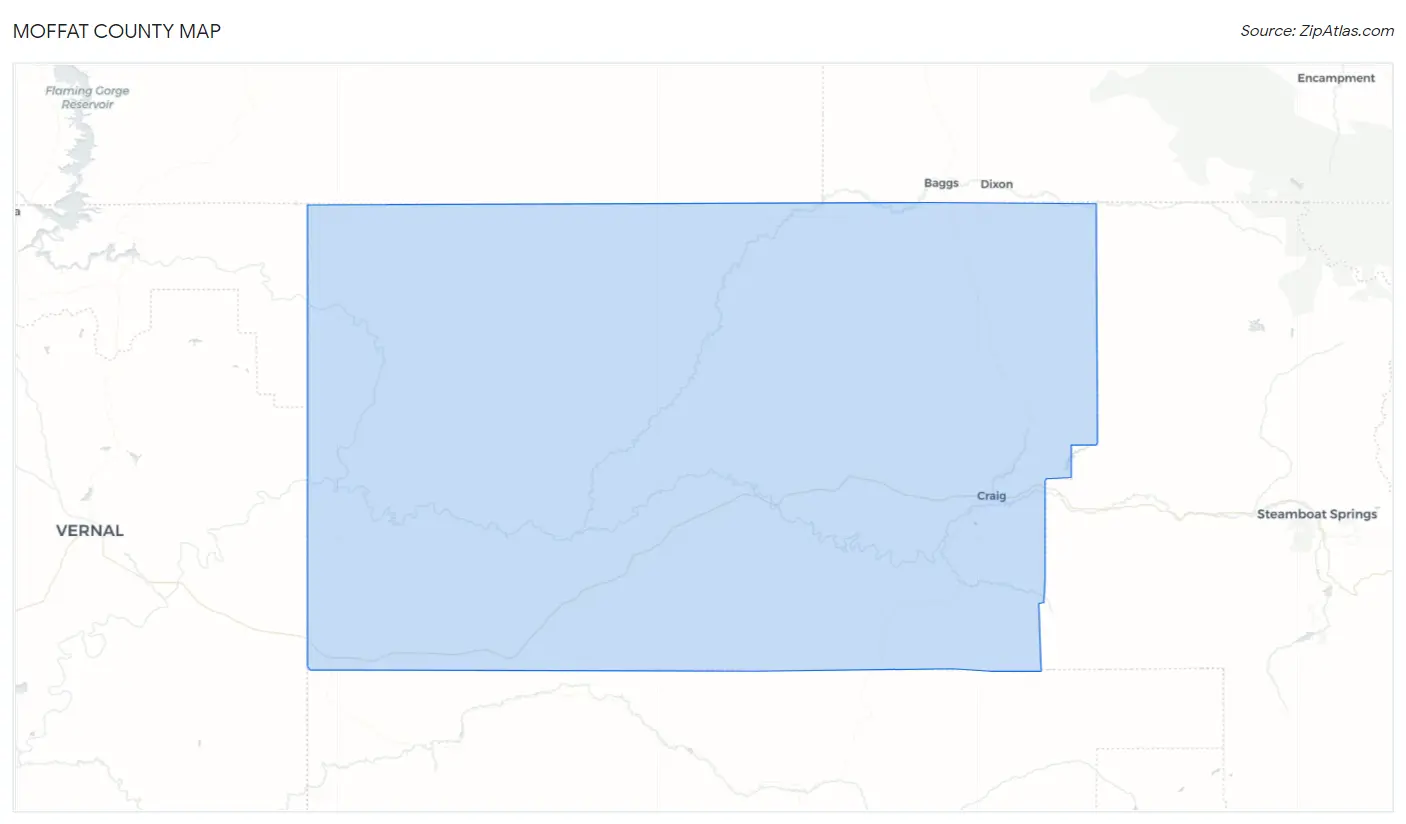
Moffat County Map
Moffat County Overview
$33,019
PER CAPITA INCOME
$79,722
AVG FAMILY INCOME
$63,983
AVG HOUSEHOLD INCOME
29.3%
WAGE / INCOME GAP [ % ]
70.7¢/ $1
WAGE / INCOME GAP [ $ ]
$10,712
FAMILY INCOME DEFICIT
0.44
INEQUALITY / GINI INDEX
13,232
TOTAL POPULATION
6,702
MALE POPULATION
6,530
FEMALE POPULATION
102.63
MALES / 100 FEMALES
97.43
FEMALES / 100 MALES
37.1
MEDIAN AGE
3.0
AVG FAMILY SIZE
2.5
AVG HOUSEHOLD SIZE
6,508
LABOR FORCE [ PEOPLE ]
63.6%
PERCENT IN LABOR FORCE
5.4%
UNEMPLOYMENT RATE
Moffat County Area Codes
Income in Moffat County
Income Overview in Moffat County
Per Capita Income in Moffat County is $33,019, while median incomes of families and households are $79,722 and $63,983 respectively.
| Characteristic | Number | Measure |
| Per Capita Income | 13,232 | $33,019 |
| Median Family Income | 3,434 | $79,722 |
| Mean Family Income | 3,434 | $90,533 |
| Median Household Income | 5,187 | $63,983 |
| Mean Household Income | 5,187 | $79,512 |
| Income Deficit | 3,434 | $10,712 |
| Wage / Income Gap (%) | 13,232 | 29.32% |
| Wage / Income Gap ($) | 13,232 | 70.68¢ per $1 |
| Gini / Inequality Index | 13,232 | 0.44 |
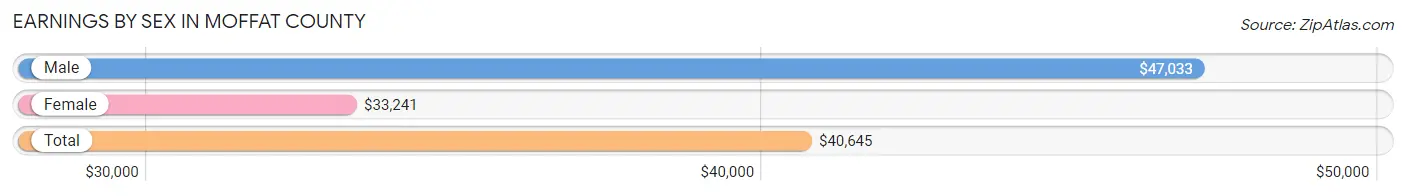
Earnings by Sex in Moffat County
Average Earnings in Moffat County are $40,645, $47,033 for men and $33,241 for women, a difference of 29.3%.
| Sex | Number | Average Earnings |
| Male | 3,948 (56.5%) | $47,033 |
| Female | 3,040 (43.5%) | $33,241 |
| Total | 6,988 (100.0%) | $40,645 |
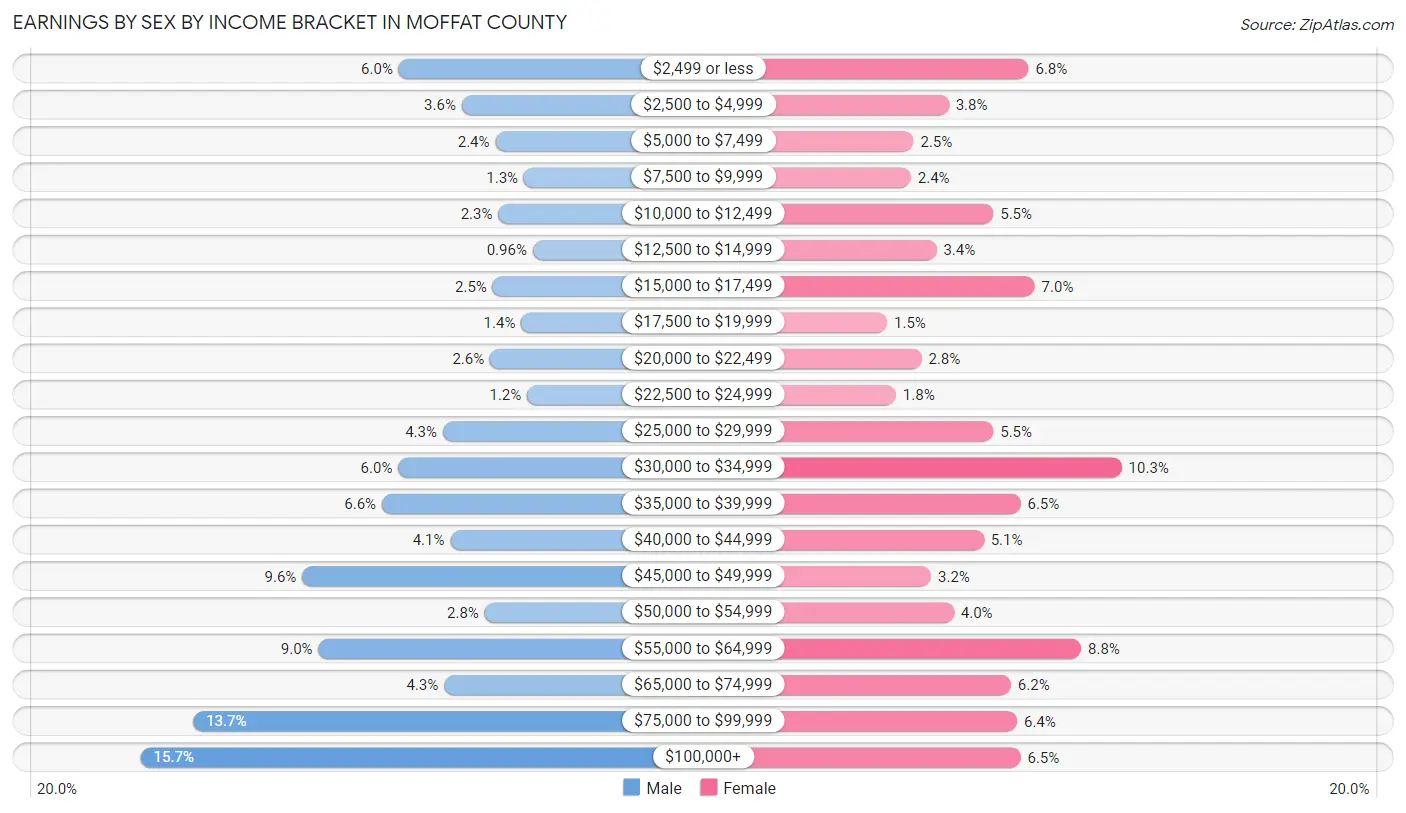
Earnings by Sex by Income Bracket in Moffat County
The most common earnings brackets in Moffat County are $100,000+ for men (618 | 15.7%) and $30,000 to $34,999 for women (313 | 10.3%).
| Income | Male | Female |
| $2,499 or less | 236 (6.0%) | 207 (6.8%) |
| $2,500 to $4,999 | 143 (3.6%) | 116 (3.8%) |
| $5,000 to $7,499 | 93 (2.4%) | 76 (2.5%) |
| $7,500 to $9,999 | 51 (1.3%) | 73 (2.4%) |
| $10,000 to $12,499 | 89 (2.2%) | 167 (5.5%) |
| $12,500 to $14,999 | 38 (1.0%) | 102 (3.4%) |
| $15,000 to $17,499 | 97 (2.5%) | 214 (7.0%) |
| $17,500 to $19,999 | 55 (1.4%) | 46 (1.5%) |
| $20,000 to $22,499 | 101 (2.6%) | 85 (2.8%) |
| $22,500 to $24,999 | 46 (1.2%) | 56 (1.8%) |
| $25,000 to $29,999 | 171 (4.3%) | 167 (5.5%) |
| $30,000 to $34,999 | 237 (6.0%) | 313 (10.3%) |
| $35,000 to $39,999 | 261 (6.6%) | 198 (6.5%) |
| $40,000 to $44,999 | 160 (4.1%) | 156 (5.1%) |
| $45,000 to $49,999 | 379 (9.6%) | 96 (3.2%) |
| $50,000 to $54,999 | 109 (2.8%) | 122 (4.0%) |
| $55,000 to $64,999 | 355 (9.0%) | 267 (8.8%) |
| $65,000 to $74,999 | 169 (4.3%) | 187 (6.1%) |
| $75,000 to $99,999 | 540 (13.7%) | 194 (6.4%) |
| $100,000+ | 618 (15.7%) | 198 (6.5%) |
| Total | 3,948 (100.0%) | 3,040 (100.0%) |
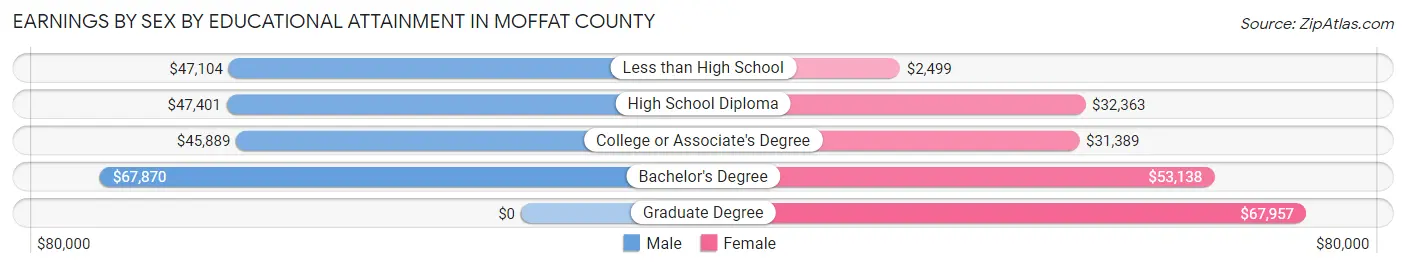
Earnings by Sex by Educational Attainment in Moffat County
Average earnings in Moffat County are $49,212 for men and $33,825 for women, a difference of 31.3%. Men with an educational attainment of bachelor's degree enjoy the highest average annual earnings of $67,870, while those with college or associate's degree education earn the least with $45,889. Women with an educational attainment of graduate degree earn the most with the average annual earnings of $67,957, while those with less than high school education have the smallest earnings of $2,499.
| Educational Attainment | Male Income | Female Income |
| Less than High School | $47,104 | $2,499 |
| High School Diploma | $47,401 | $32,363 |
| College or Associate's Degree | $45,889 | $31,389 |
| Bachelor's Degree | $67,870 | $53,138 |
| Graduate Degree | - | - |
| Total | $49,212 | $33,825 |
Family Income in Moffat County
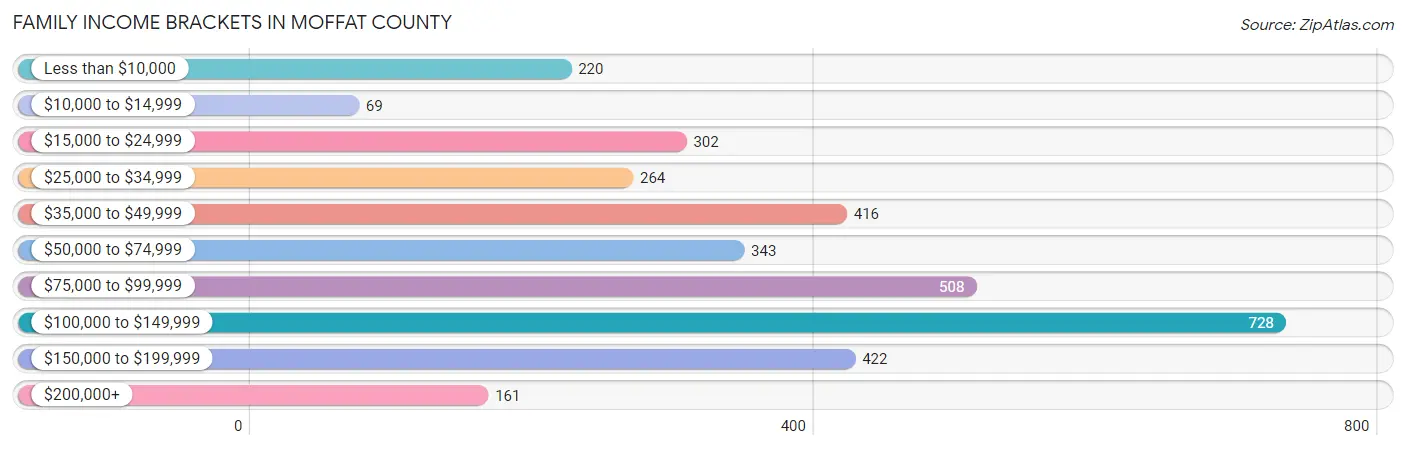
Family Income Brackets in Moffat County
According to the Moffat County family income data, there are 728 families falling into the $100,000 to $149,999 income range, which is the most common income bracket and makes up 21.2% of all families. Conversely, the $10,000 to $14,999 income bracket is the least frequent group with only 69 families (2.0%) belonging to this category.
| Income Bracket | # Families | % Families |
| Less than $10,000 | 220 | 6.4% |
| $10,000 to $14,999 | 69 | 2.0% |
| $15,000 to $24,999 | 302 | 8.8% |
| $25,000 to $34,999 | 264 | 7.7% |
| $35,000 to $49,999 | 416 | 12.1% |
| $50,000 to $74,999 | 343 | 10.0% |
| $75,000 to $99,999 | 508 | 14.8% |
| $100,000 to $149,999 | 728 | 21.2% |
| $150,000 to $199,999 | 422 | 12.3% |
| $200,000+ | 161 | 4.7% |
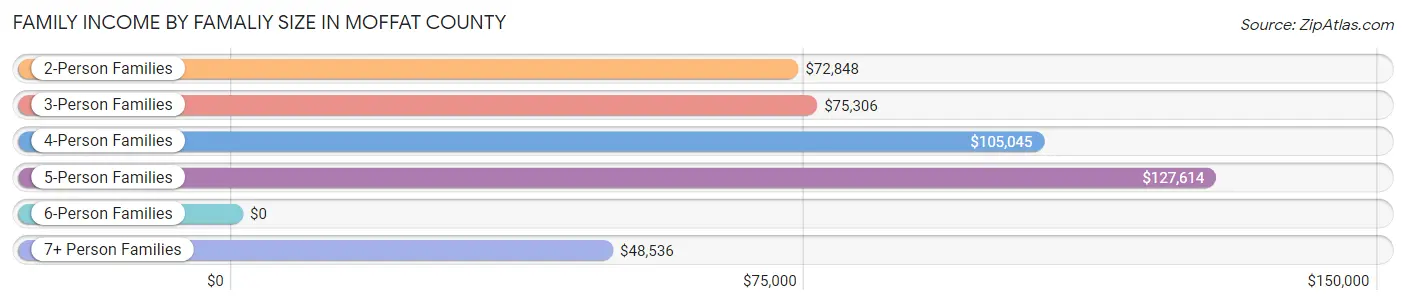
Family Income by Famaliy Size in Moffat County
5-person families (197 | 5.7%) account for the highest median family income in Moffat County with $127,614 per family, while 2-person families (1,893 | 55.1%) have the highest median income of $36,424 per family member.
| Income Bracket | # Families | Median Income |
| 2-Person Families | 1,893 (55.1%) | $72,848 |
| 3-Person Families | 713 (20.8%) | $75,306 |
| 4-Person Families | 499 (14.5%) | $105,045 |
| 5-Person Families | 197 (5.7%) | $127,614 |
| 6-Person Families | 37 (1.1%) | $0 |
| 7+ Person Families | 95 (2.8%) | $48,536 |
| Total | 3,434 (100.0%) | $79,722 |
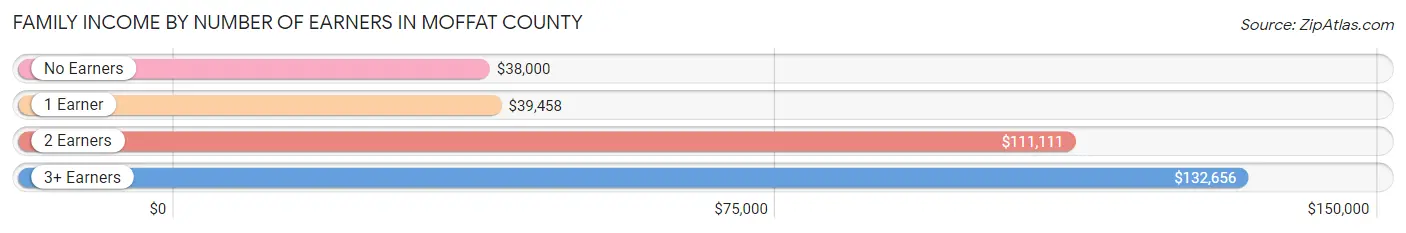
Family Income by Number of Earners in Moffat County
The median family income in Moffat County is $79,722, with families comprising 3+ earners (205) having the highest median family income of $132,656, while families with no earners (594) have the lowest median family income of $38,000, accounting for 6.0% and 17.3% of families, respectively.
| Number of Earners | # Families | Median Income |
| No Earners | 594 (17.3%) | $38,000 |
| 1 Earner | 1,297 (37.8%) | $39,458 |
| 2 Earners | 1,338 (39.0%) | $111,111 |
| 3+ Earners | 205 (6.0%) | $132,656 |
| Total | 3,434 (100.0%) | $79,722 |
Household Income in Moffat County
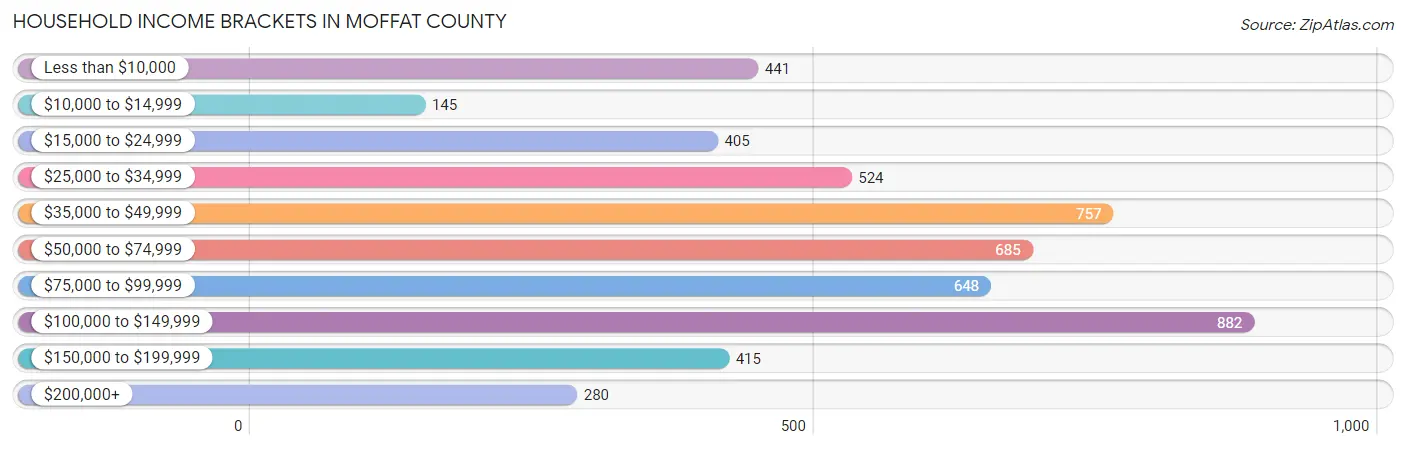
Household Income Brackets in Moffat County
With 882 households falling in the category, the $100,000 to $149,999 income range is the most frequent in Moffat County, accounting for 17.0% of all households. In contrast, only 145 households (2.8%) fall into the $10,000 to $14,999 income bracket, making it the least populous group.
| Income Bracket | # Households | % Households |
| Less than $10,000 | 441 | 8.5% |
| $10,000 to $14,999 | 145 | 2.8% |
| $15,000 to $24,999 | 405 | 7.8% |
| $25,000 to $34,999 | 524 | 10.1% |
| $35,000 to $49,999 | 757 | 14.6% |
| $50,000 to $74,999 | 685 | 13.2% |
| $75,000 to $99,999 | 648 | 12.5% |
| $100,000 to $149,999 | 882 | 17.0% |
| $150,000 to $199,999 | 415 | 8.0% |
| $200,000+ | 280 | 5.4% |
Household Income by Householder Age in Moffat County
The median household income in Moffat County is $63,983, with the highest median household income of $73,802 found in the 45 to 64 years age bracket for the primary householder. A total of 1,959 households (37.8%) fall into this category. Meanwhile, the 15 to 24 years age bracket for the primary householder has the lowest median household income of $0, with 215 households (4.1%) in this group.
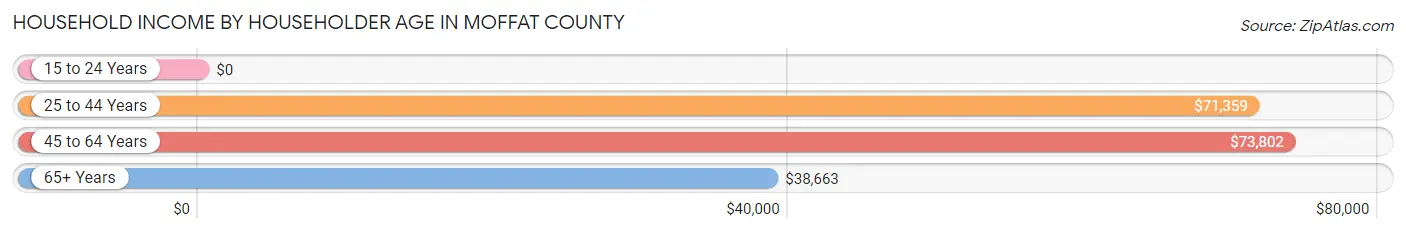
| Income Bracket | # Households | Median Income |
| 15 to 24 Years | 215 (4.1%) | $0 |
| 25 to 44 Years | 1,645 (31.7%) | $71,359 |
| 45 to 64 Years | 1,959 (37.8%) | $73,802 |
| 65+ Years | 1,368 (26.4%) | $38,663 |
| Total | 5,187 (100.0%) | $63,983 |
Poverty in Moffat County
Income Below Poverty by Sex and Age in Moffat County
With 12.7% poverty level for males and 17.0% for females among the residents of Moffat County, 5 year old males and under 5 year old females are the most vulnerable to poverty, with 75 males (45.5%) and 180 females (41.4%) in their respective age groups living below the poverty level.
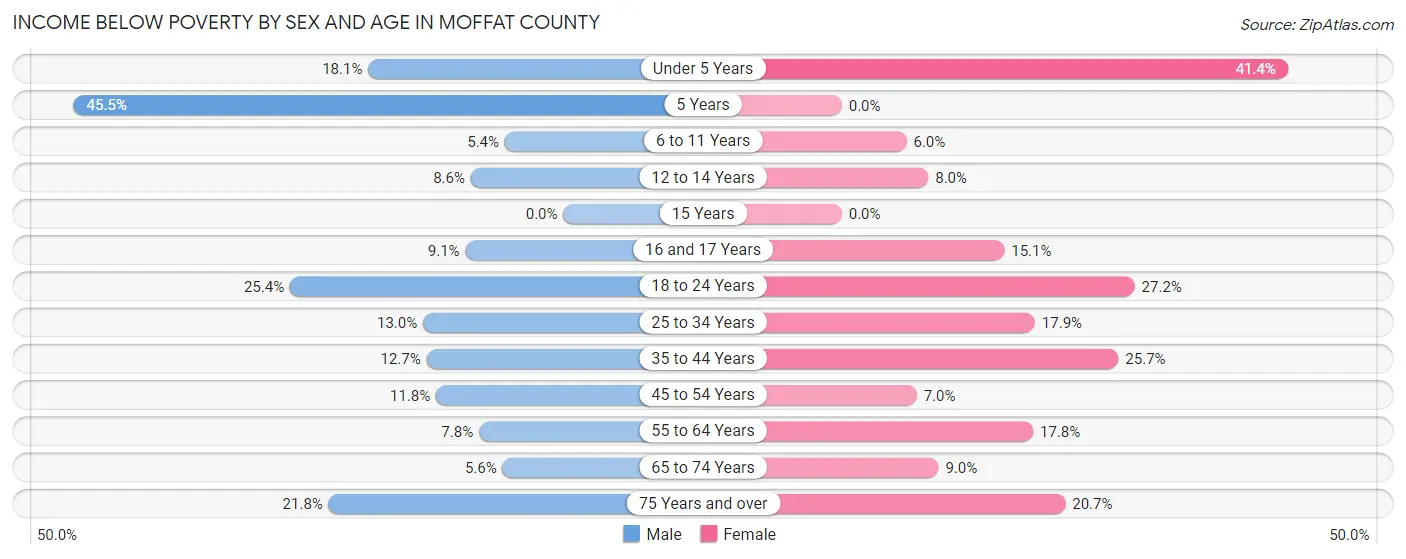
| Age Bracket | Male | Female |
| Under 5 Years | 67 (18.1%) | 180 (41.4%) |
| 5 Years | 75 (45.5%) | 0 (0.0%) |
| 6 to 11 Years | 28 (5.4%) | 29 (6.0%) |
| 12 to 14 Years | 31 (8.6%) | 29 (8.0%) |
| 15 Years | 0 (0.0%) | 0 (0.0%) |
| 16 and 17 Years | 20 (9.1%) | 19 (15.1%) |
| 18 to 24 Years | 119 (25.4%) | 112 (27.2%) |
| 25 to 34 Years | 131 (13.0%) | 172 (17.9%) |
| 35 to 44 Years | 104 (12.7%) | 200 (25.7%) |
| 45 to 54 Years | 90 (11.8%) | 49 (7.0%) |
| 55 to 64 Years | 70 (7.8%) | 177 (17.7%) |
| 65 to 74 Years | 36 (5.6%) | 54 (9.0%) |
| 75 Years and over | 71 (21.8%) | 84 (20.7%) |
| Total | 842 (12.7%) | 1,105 (17.0%) |
Income Above Poverty by Sex and Age in Moffat County
According to the poverty statistics in Moffat County, males aged 15 years and females aged 5 years are the age groups that are most secure financially, with 100.0% of males and 100.0% of females in these age groups living above the poverty line.
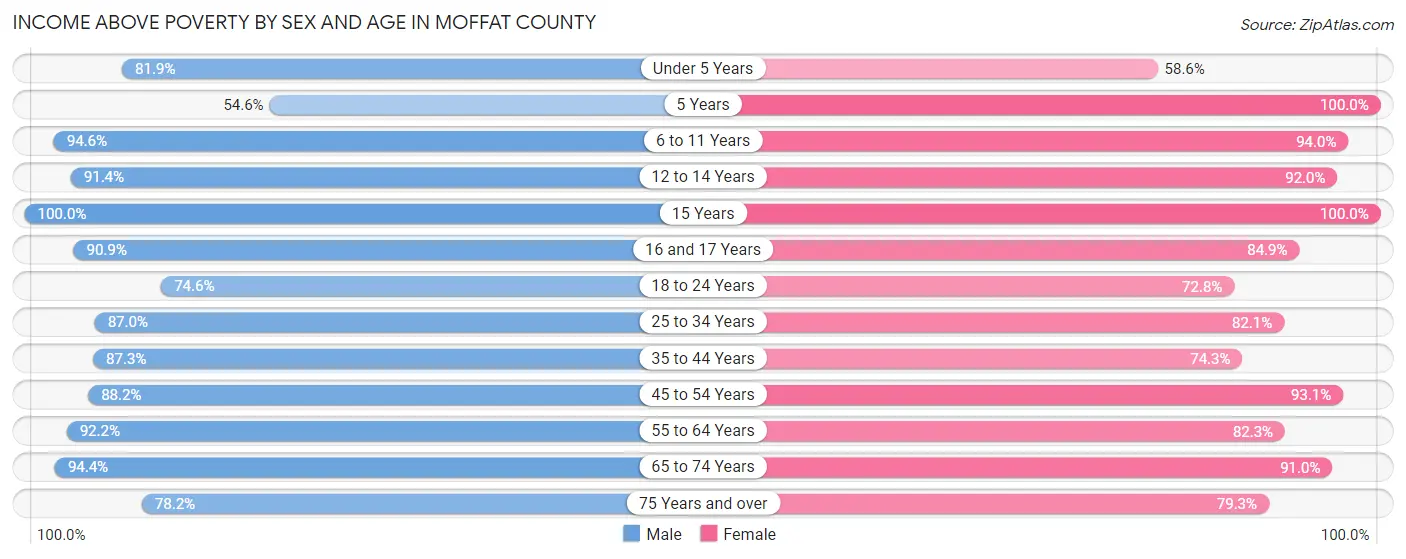
| Age Bracket | Male | Female |
| Under 5 Years | 303 (81.9%) | 255 (58.6%) |
| 5 Years | 90 (54.5%) | 77 (100.0%) |
| 6 to 11 Years | 488 (94.6%) | 454 (94.0%) |
| 12 to 14 Years | 330 (91.4%) | 332 (92.0%) |
| 15 Years | 86 (100.0%) | 145 (100.0%) |
| 16 and 17 Years | 200 (90.9%) | 107 (84.9%) |
| 18 to 24 Years | 350 (74.6%) | 300 (72.8%) |
| 25 to 34 Years | 875 (87.0%) | 788 (82.1%) |
| 35 to 44 Years | 715 (87.3%) | 579 (74.3%) |
| 45 to 54 Years | 672 (88.2%) | 656 (93.0%) |
| 55 to 64 Years | 824 (92.2%) | 820 (82.3%) |
| 65 to 74 Years | 602 (94.4%) | 548 (91.0%) |
| 75 Years and over | 255 (78.2%) | 321 (79.3%) |
| Total | 5,790 (87.3%) | 5,382 (83.0%) |
Income Below Poverty Among Married-Couple Families in Moffat County
The poverty statistics for married-couple families in Moffat County show that 9.7% or 231 of the total 2,389 families live below the poverty line. Families with 1 or 2 children have the highest poverty rate of 12.7%, comprising of 84 families. On the other hand, families with 3 or 4 children have the lowest poverty rate of 0.0%, which includes 0 families.
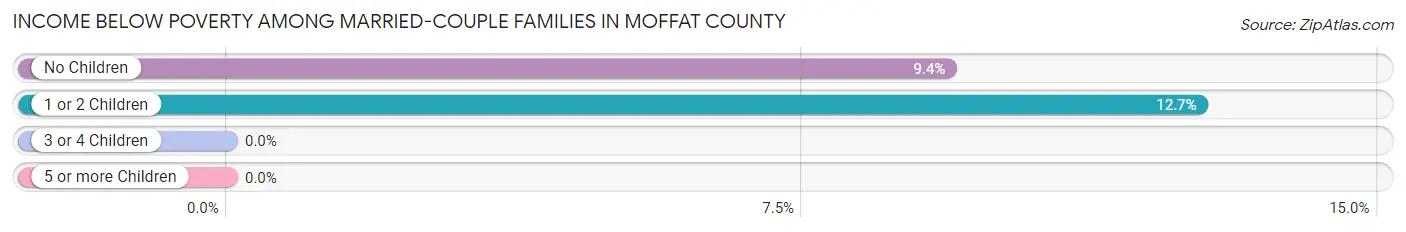
| Children | Above Poverty | Below Poverty |
| No Children | 1,418 (90.6%) | 147 (9.4%) |
| 1 or 2 Children | 579 (87.3%) | 84 (12.7%) |
| 3 or 4 Children | 161 (100.0%) | 0 (0.0%) |
| 5 or more Children | 0 (0.0%) | 0 (0.0%) |
| Total | 2,158 (90.3%) | 231 (9.7%) |
Income Below Poverty Among Single-Parent Households in Moffat County
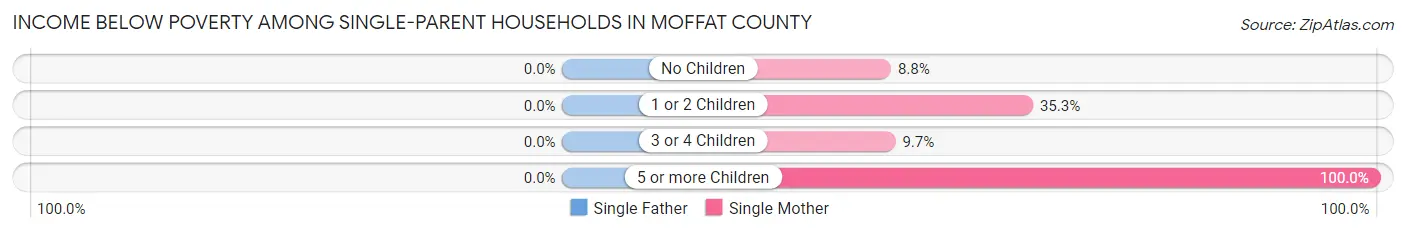
| Children | Single Father | Single Mother |
| No Children | 0 (0.0%) | 14 (8.8%) |
| 1 or 2 Children | 0 (0.0%) | 207 (35.3%) |
| 3 or 4 Children | 0 (0.0%) | 11 (9.7%) |
| 5 or more Children | 0 (0.0%) | 16 (100.0%) |
| Total | 0 (0.0%) | 248 (28.3%) |
Income Below Poverty Among Married-Couple vs Single-Parent Households in Moffat County
The poverty data for Moffat County shows that 231 of the married-couple family households (9.7%) and 248 of the single-parent households (23.7%) are living below the poverty level. Within the married-couple family households, those with 1 or 2 children have the highest poverty rate, with 84 households (12.7%) falling below the poverty line. Among the single-parent households, those with 5 or more children have the highest poverty rate, with 16 household (100.0%) living below poverty.
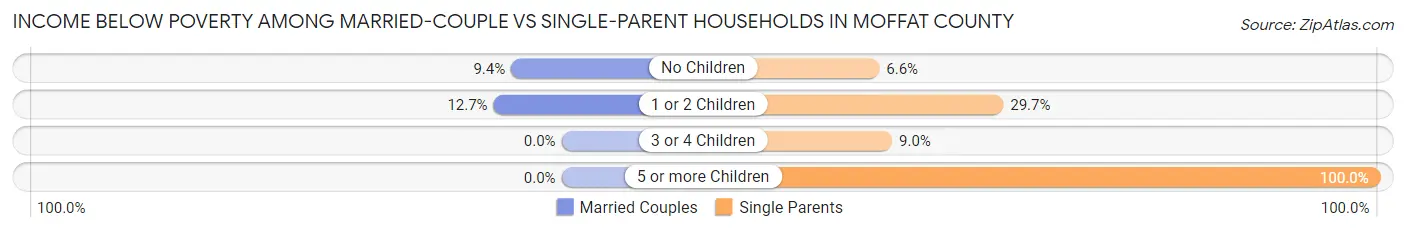
| Children | Married-Couple Families | Single-Parent Households |
| No Children | 147 (9.4%) | 14 (6.6%) |
| 1 or 2 Children | 84 (12.7%) | 207 (29.7%) |
| 3 or 4 Children | 0 (0.0%) | 11 (9.0%) |
| 5 or more Children | 0 (0.0%) | 16 (100.0%) |
| Total | 231 (9.7%) | 248 (23.7%) |
Race in Moffat County
The most populous races in Moffat County are White / Caucasian (11,567 | 87.4%), Hispanic or Latino (2,188 | 16.5%), and Two or more Races (1,138 | 8.6%).
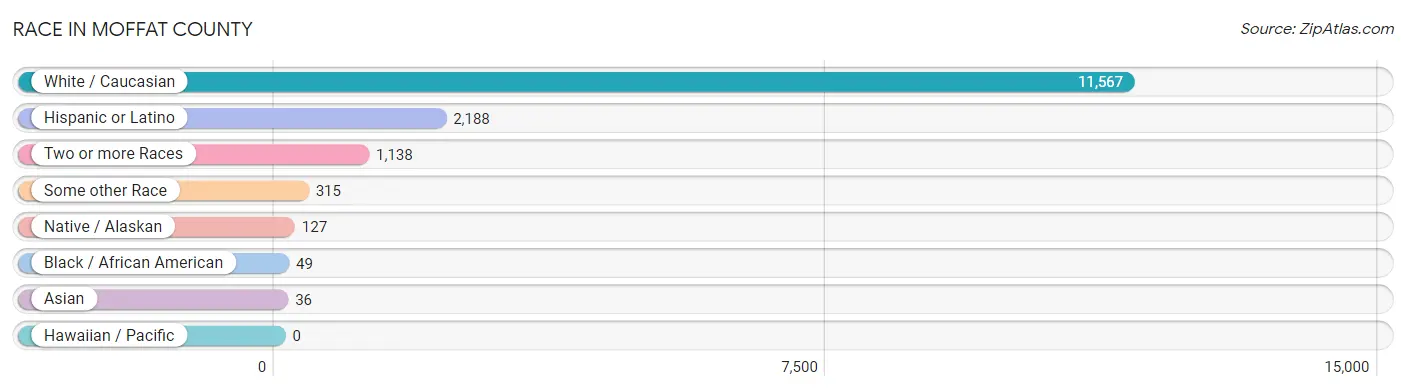
| Race | # Population | % Population |
| Asian | 36 | 0.3% |
| Black / African American | 49 | 0.4% |
| Hawaiian / Pacific | 0 | 0.0% |
| Hispanic or Latino | 2,188 | 16.5% |
| Native / Alaskan | 127 | 1.0% |
| White / Caucasian | 11,567 | 87.4% |
| Two or more Races | 1,138 | 8.6% |
| Some other Race | 315 | 2.4% |
| Total | 13,232 | 100.0% |
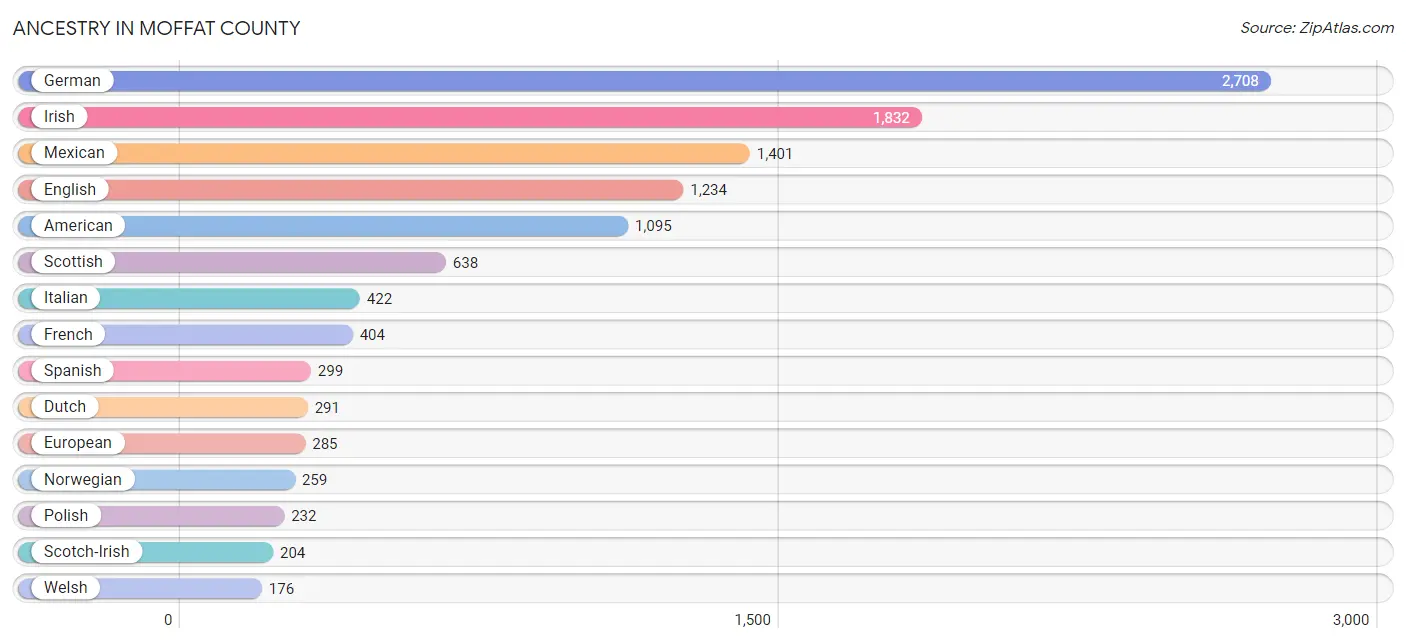
Ancestry in Moffat County
The most populous ancestries reported in Moffat County are German (2,708 | 20.5%), Irish (1,832 | 13.9%), Mexican (1,401 | 10.6%), English (1,234 | 9.3%), and American (1,095 | 8.3%), together accounting for 62.5% of all Moffat County residents.
| Ancestry | # Population | % Population |
| African | 6 | 0.1% |
| American | 1,095 | 8.3% |
| Arab | 29 | 0.2% |
| Austrian | 14 | 0.1% |
| Bahamian | 4 | 0.0% |
| Basque | 11 | 0.1% |
| Belgian | 98 | 0.7% |
| Bhutanese | 15 | 0.1% |
| Blackfeet | 18 | 0.1% |
| British | 82 | 0.6% |
| Burmese | 36 | 0.3% |
| Canadian | 9 | 0.1% |
| Celtic | 78 | 0.6% |
| Cherokee | 134 | 1.0% |
| Chippewa | 2 | 0.0% |
| Choctaw | 36 | 0.3% |
| Czech | 27 | 0.2% |
| Czechoslovakian | 92 | 0.7% |
| Danish | 103 | 0.8% |
| Dutch | 291 | 2.2% |
| Eastern European | 56 | 0.4% |
| English | 1,234 | 9.3% |
| European | 285 | 2.1% |
| Finnish | 40 | 0.3% |
| French | 404 | 3.0% |
| French Canadian | 67 | 0.5% |
| German | 2,708 | 20.5% |
| Greek | 174 | 1.3% |
| Hungarian | 20 | 0.2% |
| Indian (Asian) | 42 | 0.3% |
| Irish | 1,832 | 13.9% |
| Italian | 422 | 3.2% |
| Korean | 95 | 0.7% |
| Lebanese | 29 | 0.2% |
| Mexican | 1,401 | 10.6% |
| Mexican American Indian | 6 | 0.1% |
| Navajo | 13 | 0.1% |
| Northern European | 31 | 0.2% |
| Norwegian | 259 | 2.0% |
| Osage | 40 | 0.3% |
| Pennsylvania German | 7 | 0.1% |
| Peruvian | 36 | 0.3% |
| Polish | 232 | 1.8% |
| Portuguese | 69 | 0.5% |
| Pueblo | 10 | 0.1% |
| Puerto Rican | 109 | 0.8% |
| Russian | 46 | 0.4% |
| Scandinavian | 74 | 0.6% |
| Scotch-Irish | 204 | 1.5% |
| Scottish | 638 | 4.8% |
| Seminole | 14 | 0.1% |
| Sioux | 12 | 0.1% |
| Slovak | 24 | 0.2% |
| South American | 36 | 0.3% |
| Spaniard | 40 | 0.3% |
| Spanish | 299 | 2.3% |
| Subsaharan African | 6 | 0.1% |
| Swedish | 168 | 1.3% |
| Swiss | 31 | 0.2% |
| Thai | 13 | 0.1% |
| Ukrainian | 162 | 1.2% |
| Ute | 45 | 0.3% |
| Welsh | 176 | 1.3% |
| Yugoslavian | 29 | 0.2% | View All 64 Rows |
Immigrants in Moffat County
The most numerous immigrant groups reported in Moffat County came from Latin America (613 | 4.6%), Central America (563 | 4.3%), Mexico (496 | 3.7%), Europe (83 | 0.6%), and Western Europe (77 | 0.6%), together accounting for 13.8% of all Moffat County residents.
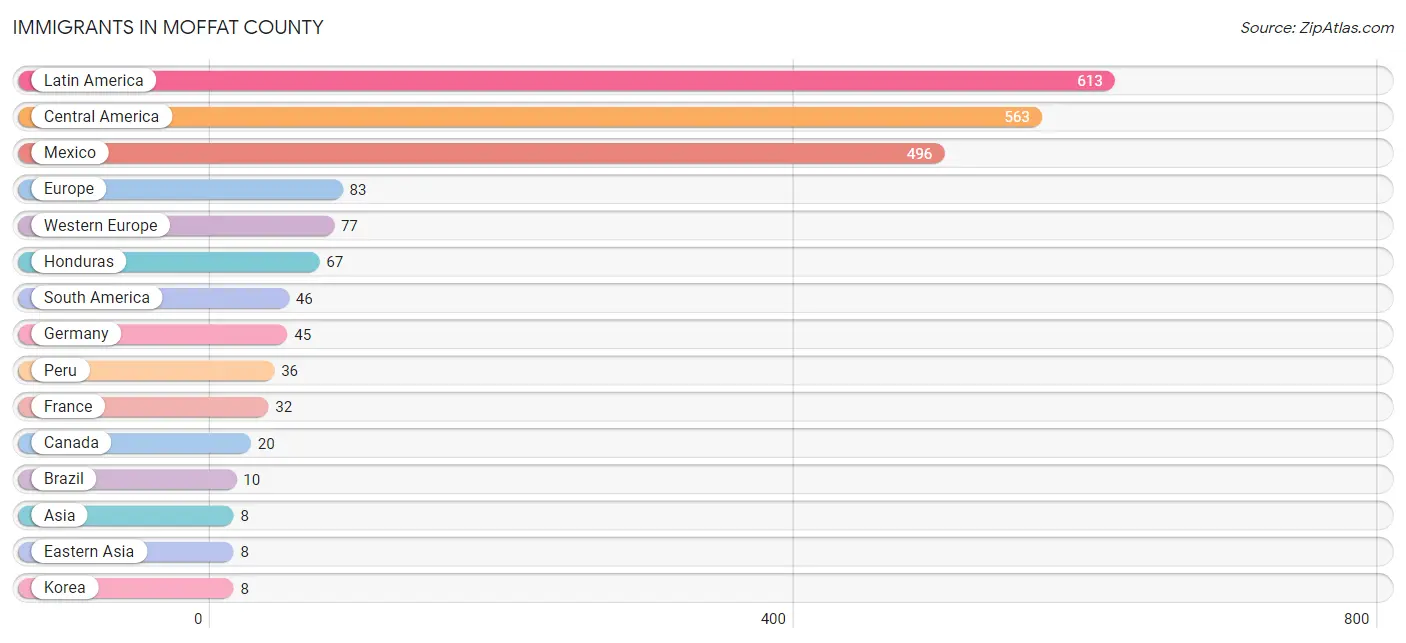
| Immigration Origin | # Population | % Population |
| Asia | 8 | 0.1% |
| Bahamas | 4 | 0.0% |
| Brazil | 10 | 0.1% |
| Canada | 20 | 0.2% |
| Caribbean | 4 | 0.0% |
| Central America | 563 | 4.3% |
| Eastern Asia | 8 | 0.1% |
| Europe | 83 | 0.6% |
| France | 32 | 0.2% |
| Germany | 45 | 0.3% |
| Honduras | 67 | 0.5% |
| Korea | 8 | 0.1% |
| Latin America | 613 | 4.6% |
| Mexico | 496 | 3.7% |
| Northern Europe | 6 | 0.1% |
| Peru | 36 | 0.3% |
| South America | 46 | 0.4% |
| Western Europe | 77 | 0.6% | View All 18 Rows |
Sex and Age in Moffat County
Sex and Age in Moffat County
The most populous age groups in Moffat County are 10 to 14 Years (551 | 8.2%) for men and 55 to 59 Years (579 | 8.9%) for women.
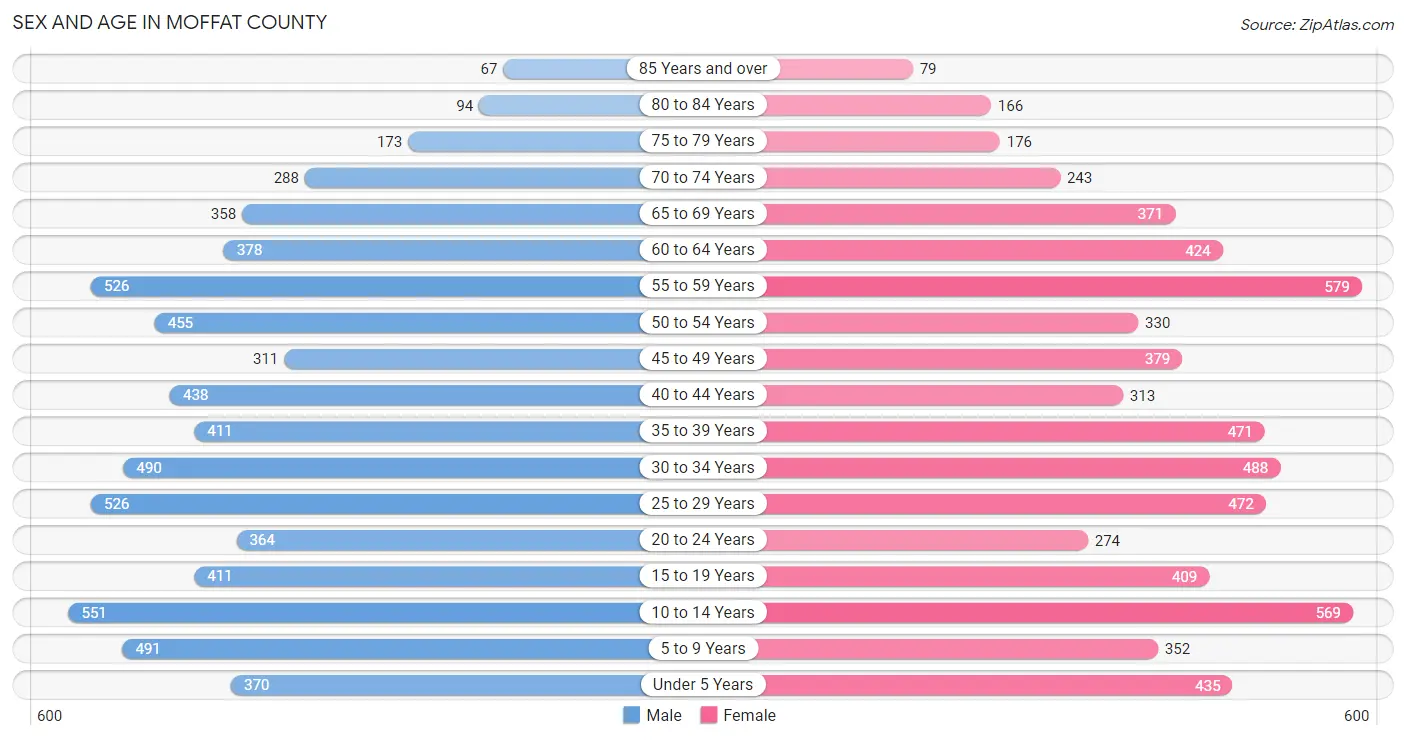
| Age Bracket | Male | Female |
| Under 5 Years | 370 (5.5%) | 435 (6.7%) |
| 5 to 9 Years | 491 (7.3%) | 352 (5.4%) |
| 10 to 14 Years | 551 (8.2%) | 569 (8.7%) |
| 15 to 19 Years | 411 (6.1%) | 409 (6.3%) |
| 20 to 24 Years | 364 (5.4%) | 274 (4.2%) |
| 25 to 29 Years | 526 (7.9%) | 472 (7.2%) |
| 30 to 34 Years | 490 (7.3%) | 488 (7.5%) |
| 35 to 39 Years | 411 (6.1%) | 471 (7.2%) |
| 40 to 44 Years | 438 (6.5%) | 313 (4.8%) |
| 45 to 49 Years | 311 (4.6%) | 379 (5.8%) |
| 50 to 54 Years | 455 (6.8%) | 330 (5.1%) |
| 55 to 59 Years | 526 (7.9%) | 579 (8.9%) |
| 60 to 64 Years | 378 (5.6%) | 424 (6.5%) |
| 65 to 69 Years | 358 (5.3%) | 371 (5.7%) |
| 70 to 74 Years | 288 (4.3%) | 243 (3.7%) |
| 75 to 79 Years | 173 (2.6%) | 176 (2.7%) |
| 80 to 84 Years | 94 (1.4%) | 166 (2.5%) |
| 85 Years and over | 67 (1.0%) | 79 (1.2%) |
| Total | 6,702 (100.0%) | 6,530 (100.0%) |
Families and Households in Moffat County
Median Family Size in Moffat County
The median family size in Moffat County is 3.03 persons per family, with single female/mother families (876 | 25.5%) accounting for the largest median family size of 3.15 persons per family. On the other hand, single male/father families (169 | 4.9%) represent the smallest median family size with 2.95 persons per family.
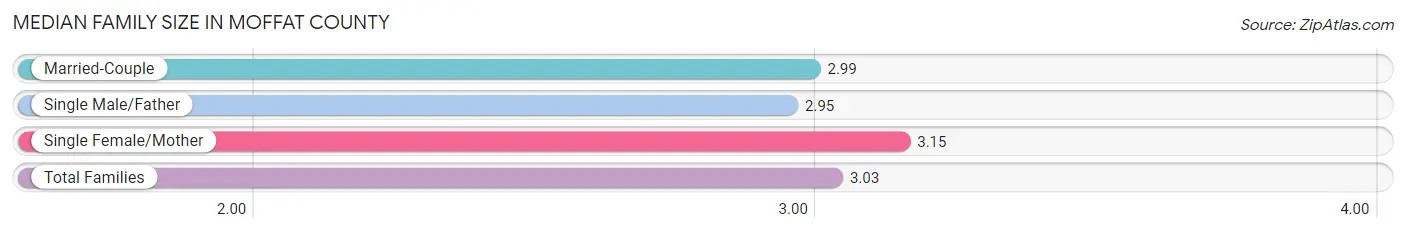
| Family Type | # Families | Family Size |
| Married-Couple | 2,389 (69.6%) | 2.99 |
| Single Male/Father | 169 (4.9%) | 2.95 |
| Single Female/Mother | 876 (25.5%) | 3.15 |
| Total Families | 3,434 (100.0%) | 3.03 |
Median Household Size in Moffat County
The median household size in Moffat County is 2.52 persons per household, with single female/mother households (876 | 16.9%) accounting for the largest median household size of 3.51 persons per household. non-family households (1,753 | 33.8%) represent the smallest median household size with 1.23 persons per household.
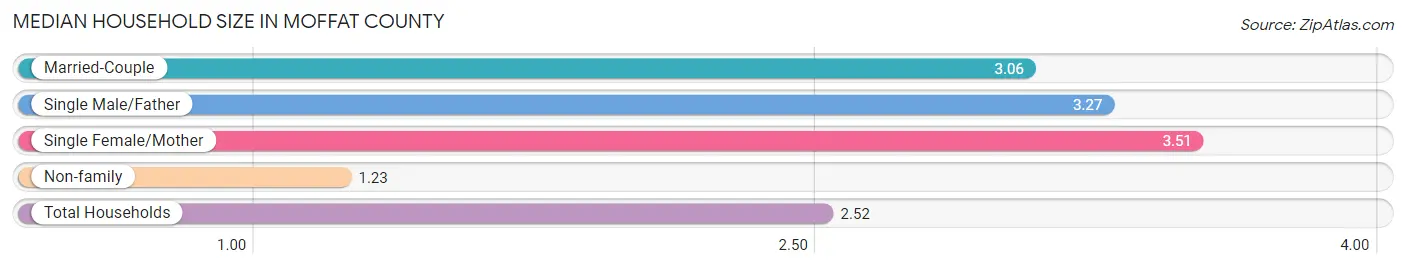
| Household Type | # Households | Household Size |
| Married-Couple | 2,389 (46.1%) | 3.06 |
| Single Male/Father | 169 (3.3%) | 3.27 |
| Single Female/Mother | 876 (16.9%) | 3.51 |
| Non-family | 1,753 (33.8%) | 1.23 |
| Total Households | 5,187 (100.0%) | 2.52 |
Household Size by Marriage Status in Moffat County
Out of a total of 5,187 households in Moffat County, 3,434 (66.2%) are family households, while 1,753 (33.8%) are nonfamily households. The most numerous type of family households are 2-person households, comprising 1,795, and the most common type of nonfamily households are 1-person households, comprising 1,482.
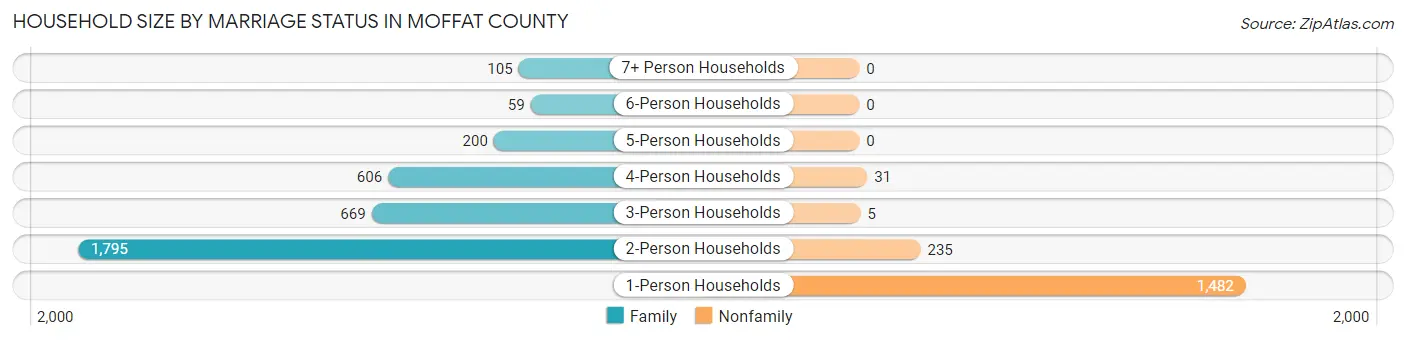
| Household Size | Family Households | Nonfamily Households |
| 1-Person Households | - | 1,482 (28.6%) |
| 2-Person Households | 1,795 (34.6%) | 235 (4.5%) |
| 3-Person Households | 669 (12.9%) | 5 (0.1%) |
| 4-Person Households | 606 (11.7%) | 31 (0.6%) |
| 5-Person Households | 200 (3.9%) | 0 (0.0%) |
| 6-Person Households | 59 (1.1%) | 0 (0.0%) |
| 7+ Person Households | 105 (2.0%) | 0 (0.0%) |
| Total | 3,434 (66.2%) | 1,753 (33.8%) |
Female Fertility in Moffat County
Fertility by Age in Moffat County
Average fertility rate in Moffat County is 66.0 births per 1,000 women. Women in the age bracket of 20 to 34 years have the highest fertility rate with 133.0 births per 1,000 women. Women in the age bracket of 20 to 34 years acount for 88.2% of all women with births.
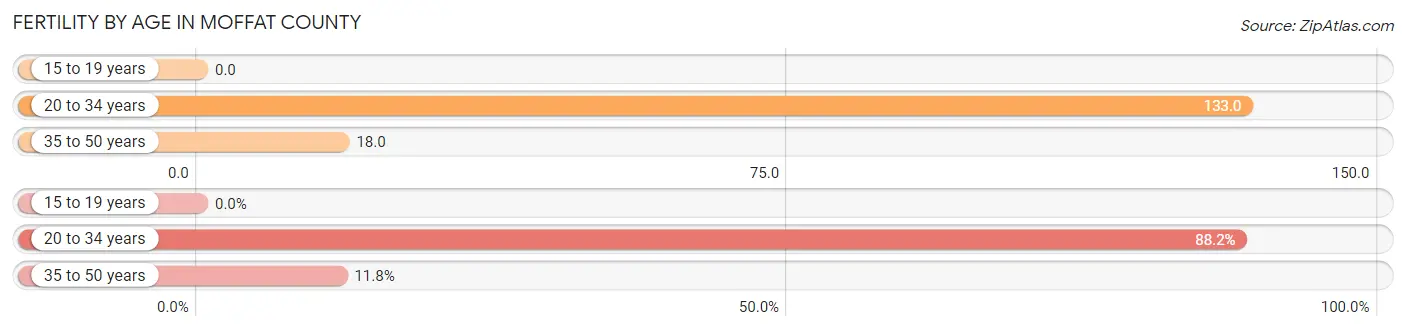
| Age Bracket | Women with Births | Births / 1,000 Women |
| 15 to 19 years | 0 (0.0%) | 0.0 |
| 20 to 34 years | 164 (88.2%) | 133.0 |
| 35 to 50 years | 22 (11.8%) | 18.0 |
| Total | 186 (100.0%) | 66.0 |
Fertility by Age by Marriage Status in Moffat County
65.1% of women with births (186) in Moffat County are married. The highest percentage of unmarried women with births falls into 20 to 34 years age bracket with 39.6% of them unmarried at the time of birth, while the lowest percentage of unmarried women with births belong to 35 to 50 years age bracket with 0.0% of them unmarried.
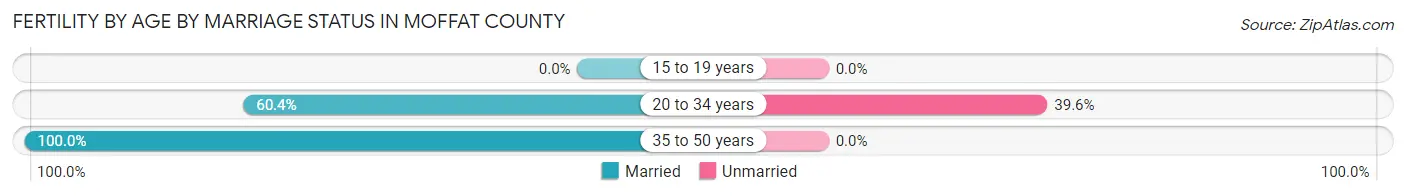
| Age Bracket | Married | Unmarried |
| 15 to 19 years | 0 (0.0%) | 0 (0.0%) |
| 20 to 34 years | 99 (60.4%) | 65 (39.6%) |
| 35 to 50 years | 22 (100.0%) | 0 (0.0%) |
| Total | 121 (65.0%) | 65 (34.9%) |
Fertility by Education in Moffat County
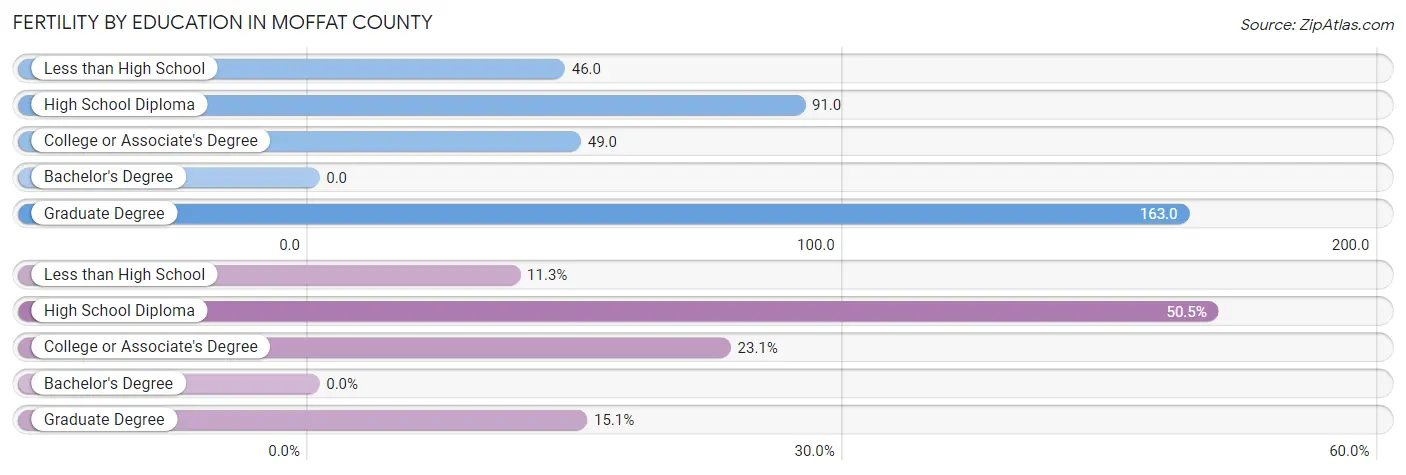
| Educational Attainment | Women with Births | Births / 1,000 Women |
| Less than High School | 21 (11.3%) | 46.0 |
| High School Diploma | 94 (50.5%) | 91.0 |
| College or Associate's Degree | 43 (23.1%) | 49.0 |
| Bachelor's Degree | 0 (0.0%) | 0.0 |
| Graduate Degree | 28 (15.0%) | 163.0 |
| Total | 186 (100.0%) | 66.0 |
Fertility by Education by Marriage Status in Moffat County
34.9% of women with births in Moffat County are unmarried. Women with the educational attainment of less than high school are most likely to be married with 100.0% of them married at childbirth, while women with the educational attainment of high school diploma are least likely to be married with 44.7% of them unmarried at childbirth.
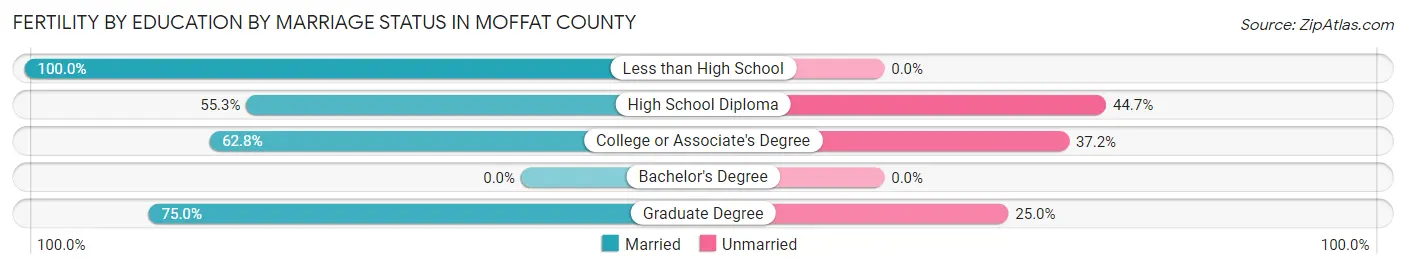
| Educational Attainment | Married | Unmarried |
| Less than High School | 21 (100.0%) | 0 (0.0%) |
| High School Diploma | 52 (55.3%) | 42 (44.7%) |
| College or Associate's Degree | 27 (62.8%) | 16 (37.2%) |
| Bachelor's Degree | 0 (0.0%) | 0 (0.0%) |
| Graduate Degree | 21 (75.0%) | 7 (25.0%) |
| Total | 121 (65.0%) | 65 (34.9%) |
Employment Characteristics in Moffat County
Employment by Class of Employer in Moffat County
Among the 6,062 employed individuals in Moffat County, private company employees (3,041 | 50.2%), not-for-profit organizations (808 | 13.3%), and local government employees (755 | 12.4%) make up the most common classes of employment.
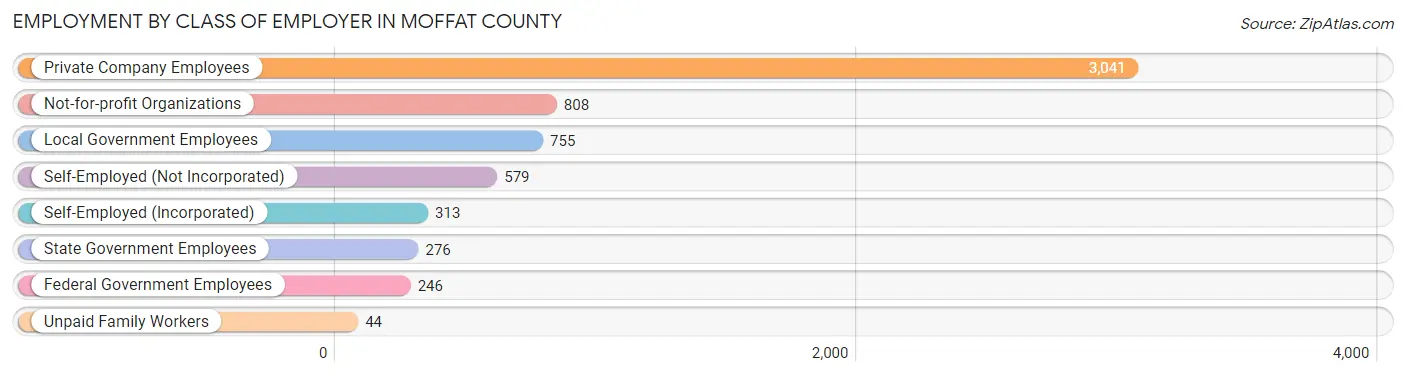
| Employer Class | # Employees | % Employees |
| Private Company Employees | 3,041 | 50.2% |
| Self-Employed (Incorporated) | 313 | 5.2% |
| Self-Employed (Not Incorporated) | 579 | 9.6% |
| Not-for-profit Organizations | 808 | 13.3% |
| Local Government Employees | 755 | 12.4% |
| State Government Employees | 276 | 4.5% |
| Federal Government Employees | 246 | 4.1% |
| Unpaid Family Workers | 44 | 0.7% |
| Total | 6,062 | 100.0% |
Employment Status by Age in Moffat County
According to the labor force statistics for Moffat County, out of the total population over 16 years of age (10,233), 63.6% or 6,508 individuals are in the labor force, with 5.4% or 351 of them unemployed. The age group with the highest labor force participation rate is 45 to 54 years, with 89.8% or 1,325 individuals in the labor force. Within the labor force, the 16 to 19 years age range has the highest percentage of unemployed individuals, with 27.1% or 62 of them being unemployed.
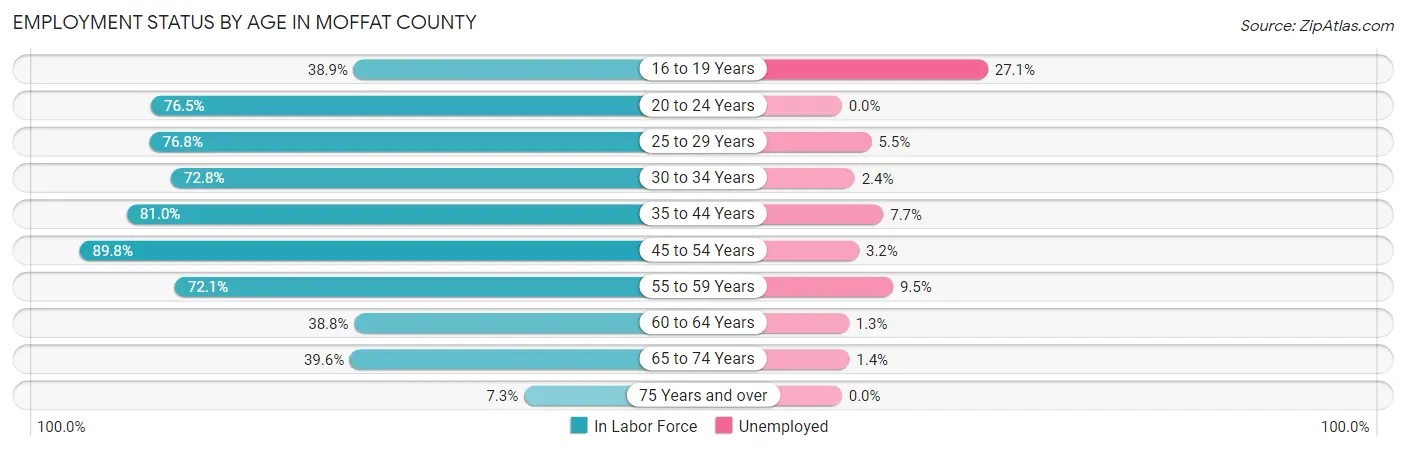
| Age Bracket | In Labor Force | Unemployed |
| 16 to 19 Years | 229 (38.9%) | 62 (27.1%) |
| 20 to 24 Years | 488 (76.5%) | 0 (0.0%) |
| 25 to 29 Years | 766 (76.8%) | 42 (5.5%) |
| 30 to 34 Years | 712 (72.8%) | 17 (2.4%) |
| 35 to 44 Years | 1,323 (81.0%) | 102 (7.7%) |
| 45 to 54 Years | 1,325 (89.8%) | 42 (3.2%) |
| 55 to 59 Years | 797 (72.1%) | 76 (9.5%) |
| 60 to 64 Years | 311 (38.8%) | 4 (1.3%) |
| 65 to 74 Years | 499 (39.6%) | 7 (1.4%) |
| 75 Years and over | 55 (7.3%) | 0 (0.0%) |
| Total | 6,508 (63.6%) | 351 (5.4%) |
Employment Status by Educational Attainment in Moffat County
According to labor force statistics for Moffat County, 74.9% of individuals (5,236) out of the total population between 25 and 64 years of age (6,991) are in the labor force, with 5.4% or 283 of them being unemployed. The group with the highest labor force participation rate are those with the educational attainment of bachelor's degree or higher, with 81.8% or 1,084 individuals in the labor force. Within the labor force, individuals with less than high school education have the highest percentage of unemployment, with 21.5% or 99 of them being unemployed.
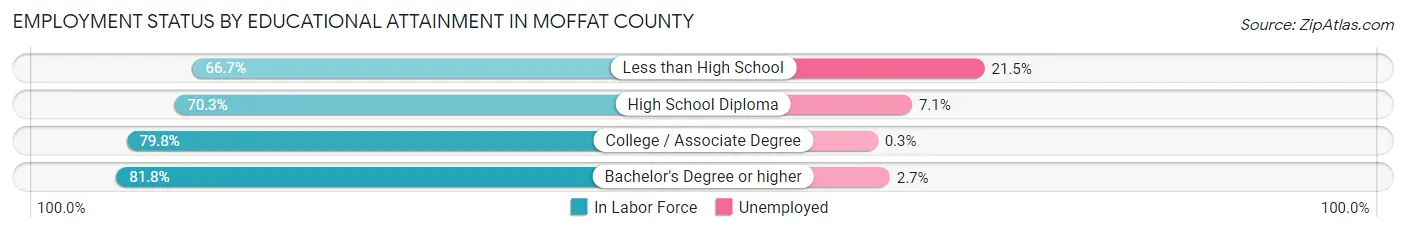
| Educational Attainment | In Labor Force | Unemployed |
| Less than High School | 460 (66.7%) | 148 (21.5%) |
| High School Diploma | 2,094 (70.3%) | 212 (7.1%) |
| College / Associate Degree | 1,594 (79.8%) | 6 (0.3%) |
| Bachelor's Degree or higher | 1,084 (81.8%) | 36 (2.7%) |
| Total | 5,236 (74.9%) | 378 (5.4%) |
Employment Occupations by Sex in Moffat County
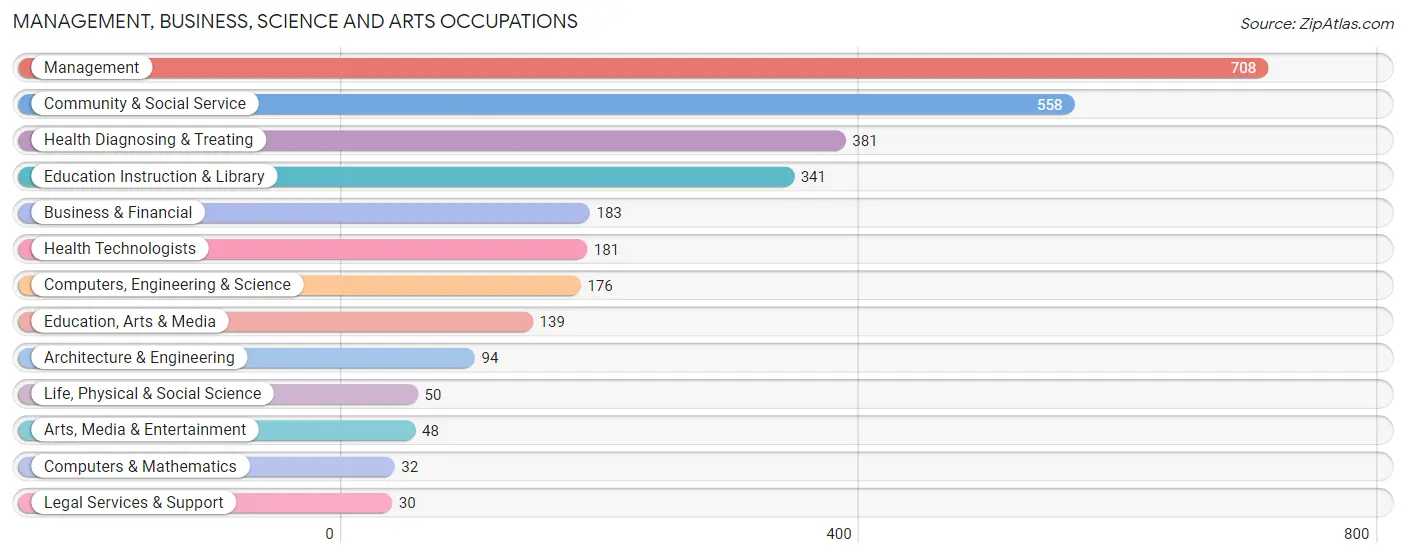
Management, Business, Science and Arts Occupations
The most common Management, Business, Science and Arts occupations in Moffat County are Management (708 | 11.6%), Community & Social Service (558 | 9.1%), Health Diagnosing & Treating (381 | 6.2%), Education Instruction & Library (341 | 5.6%), and Business & Financial (183 | 3.0%).
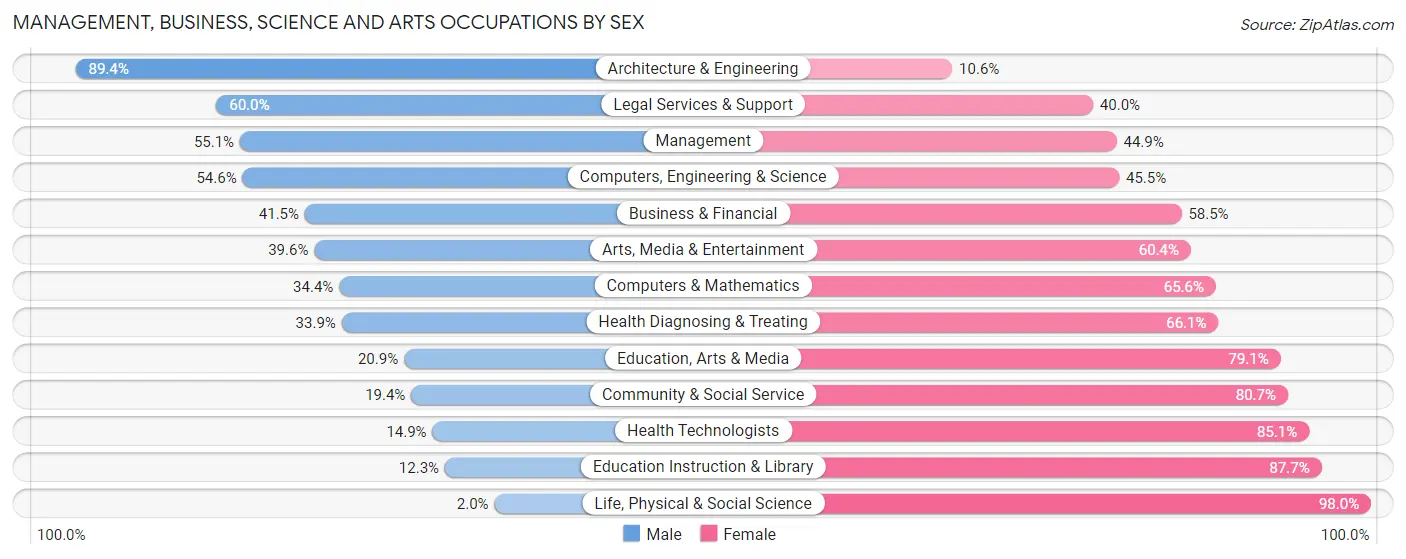
Management, Business, Science and Arts Occupations by Sex
Within the Management, Business, Science and Arts occupations in Moffat County, the most male-oriented occupations are Architecture & Engineering (89.4%), Legal Services & Support (60.0%), and Management (55.1%), while the most female-oriented occupations are Life, Physical & Social Science (98.0%), Education Instruction & Library (87.7%), and Health Technologists (85.1%).
| Occupation | Male | Female |
| Management | 390 (55.1%) | 318 (44.9%) |
| Business & Financial | 76 (41.5%) | 107 (58.5%) |
| Computers, Engineering & Science | 96 (54.5%) | 80 (45.5%) |
| Computers & Mathematics | 11 (34.4%) | 21 (65.6%) |
| Architecture & Engineering | 84 (89.4%) | 10 (10.6%) |
| Life, Physical & Social Science | 1 (2.0%) | 49 (98.0%) |
| Community & Social Service | 108 (19.4%) | 450 (80.6%) |
| Education, Arts & Media | 29 (20.9%) | 110 (79.1%) |
| Legal Services & Support | 18 (60.0%) | 12 (40.0%) |
| Education Instruction & Library | 42 (12.3%) | 299 (87.7%) |
| Arts, Media & Entertainment | 19 (39.6%) | 29 (60.4%) |
| Health Diagnosing & Treating | 129 (33.9%) | 252 (66.1%) |
| Health Technologists | 27 (14.9%) | 154 (85.1%) |
| Total (Category) | 799 (39.8%) | 1,207 (60.2%) |
| Total (Overall) | 3,410 (55.8%) | 2,700 (44.2%) |
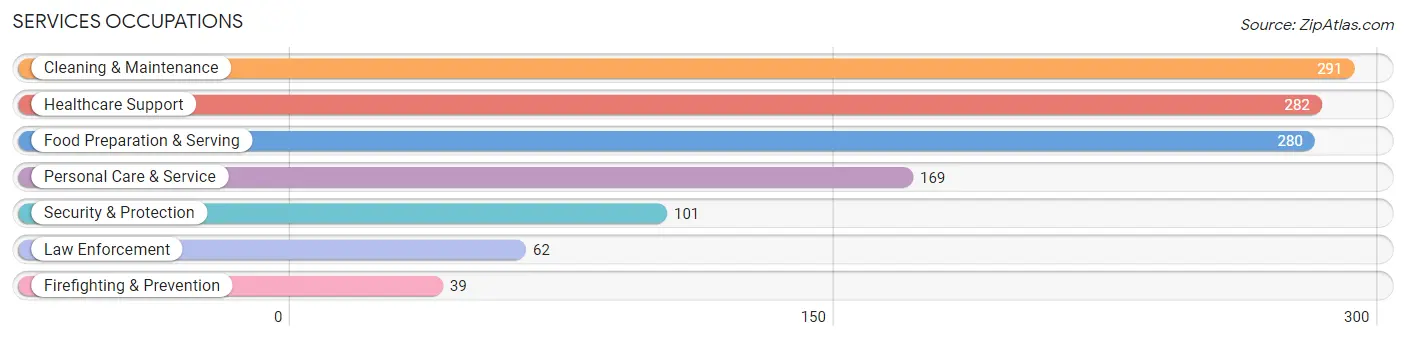
Services Occupations
The most common Services occupations in Moffat County are Cleaning & Maintenance (291 | 4.8%), Healthcare Support (282 | 4.6%), Food Preparation & Serving (280 | 4.6%), Personal Care & Service (169 | 2.8%), and Security & Protection (101 | 1.7%).
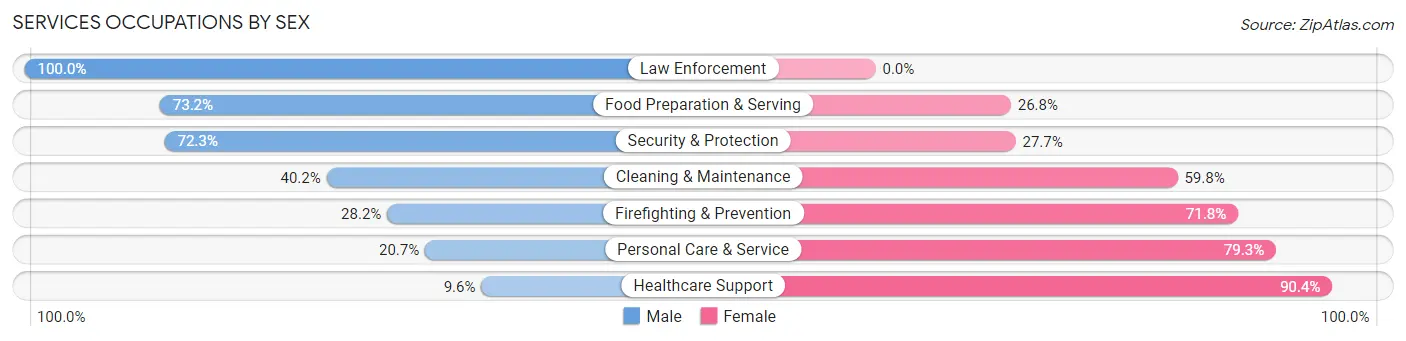
Services Occupations by Sex
Within the Services occupations in Moffat County, the most male-oriented occupations are Law Enforcement (100.0%), Food Preparation & Serving (73.2%), and Security & Protection (72.3%), while the most female-oriented occupations are Healthcare Support (90.4%), Personal Care & Service (79.3%), and Firefighting & Prevention (71.8%).
| Occupation | Male | Female |
| Healthcare Support | 27 (9.6%) | 255 (90.4%) |
| Security & Protection | 73 (72.3%) | 28 (27.7%) |
| Firefighting & Prevention | 11 (28.2%) | 28 (71.8%) |
| Law Enforcement | 62 (100.0%) | 0 (0.0%) |
| Food Preparation & Serving | 205 (73.2%) | 75 (26.8%) |
| Cleaning & Maintenance | 117 (40.2%) | 174 (59.8%) |
| Personal Care & Service | 35 (20.7%) | 134 (79.3%) |
| Total (Category) | 457 (40.7%) | 666 (59.3%) |
| Total (Overall) | 3,410 (55.8%) | 2,700 (44.2%) |
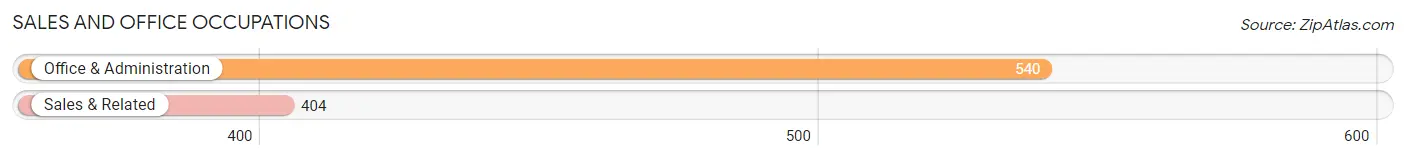
Sales and Office Occupations
The most common Sales and Office occupations in Moffat County are Office & Administration (540 | 8.8%), and Sales & Related (404 | 6.6%).
Sales and Office Occupations by Sex
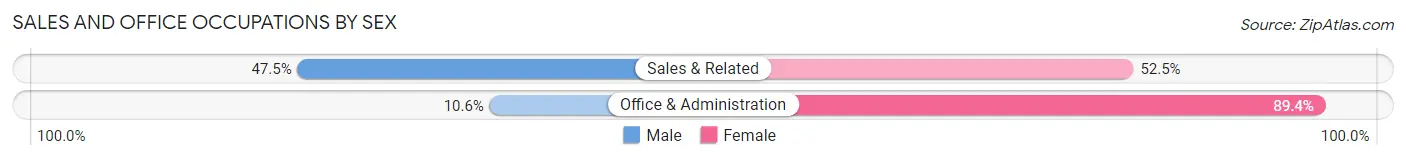
| Occupation | Male | Female |
| Sales & Related | 192 (47.5%) | 212 (52.5%) |
| Office & Administration | 57 (10.6%) | 483 (89.4%) |
| Total (Category) | 249 (26.4%) | 695 (73.6%) |
| Total (Overall) | 3,410 (55.8%) | 2,700 (44.2%) |
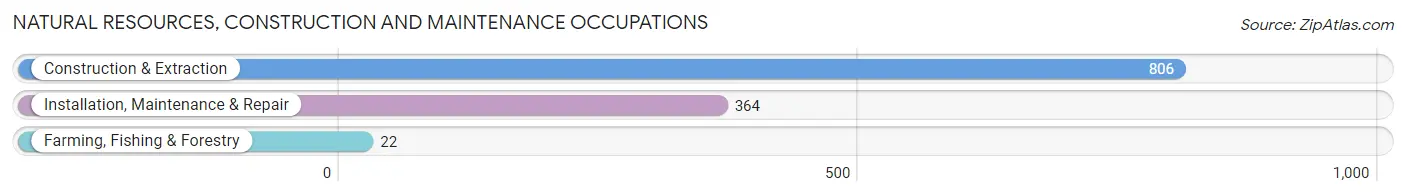
Natural Resources, Construction and Maintenance Occupations
The most common Natural Resources, Construction and Maintenance occupations in Moffat County are Construction & Extraction (806 | 13.2%), Installation, Maintenance & Repair (364 | 6.0%), and Farming, Fishing & Forestry (22 | 0.4%).
Natural Resources, Construction and Maintenance Occupations by Sex
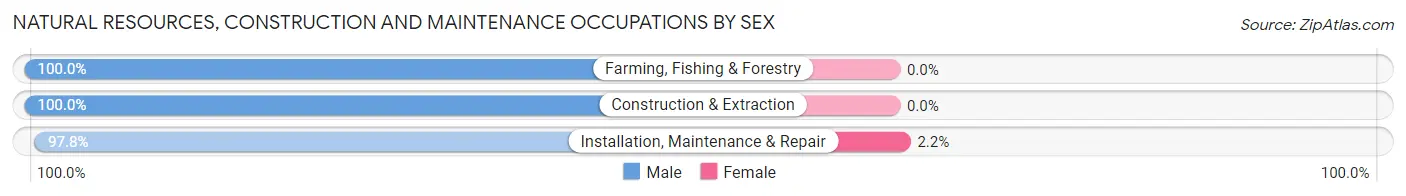
| Occupation | Male | Female |
| Farming, Fishing & Forestry | 22 (100.0%) | 0 (0.0%) |
| Construction & Extraction | 806 (100.0%) | 0 (0.0%) |
| Installation, Maintenance & Repair | 356 (97.8%) | 8 (2.2%) |
| Total (Category) | 1,184 (99.3%) | 8 (0.7%) |
| Total (Overall) | 3,410 (55.8%) | 2,700 (44.2%) |
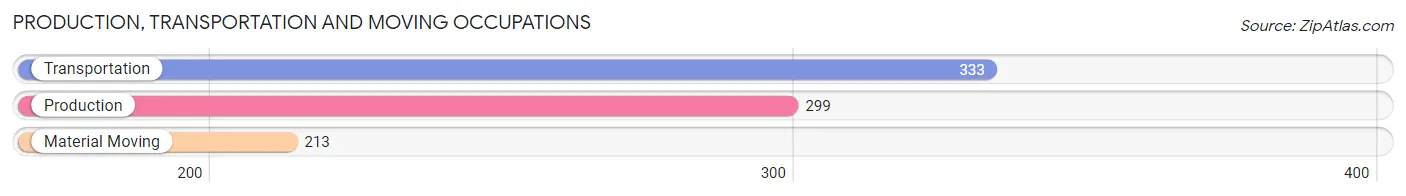
Production, Transportation and Moving Occupations
The most common Production, Transportation and Moving occupations in Moffat County are Transportation (333 | 5.4%), Production (299 | 4.9%), and Material Moving (213 | 3.5%).
Production, Transportation and Moving Occupations by Sex
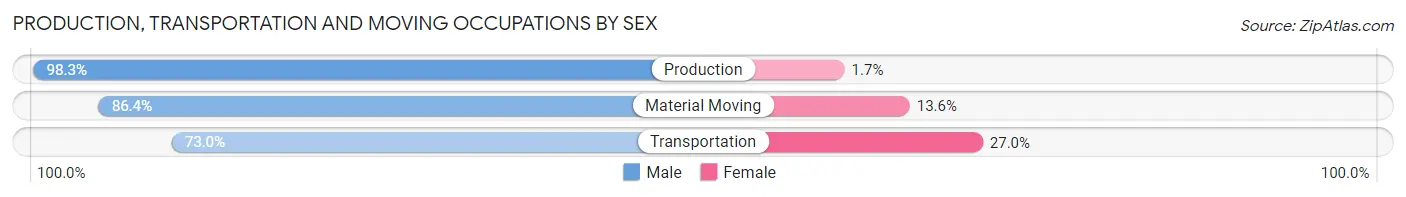
| Occupation | Male | Female |
| Production | 294 (98.3%) | 5 (1.7%) |
| Transportation | 243 (73.0%) | 90 (27.0%) |
| Material Moving | 184 (86.4%) | 29 (13.6%) |
| Total (Category) | 721 (85.3%) | 124 (14.7%) |
| Total (Overall) | 3,410 (55.8%) | 2,700 (44.2%) |
Employment Industries by Sex in Moffat County
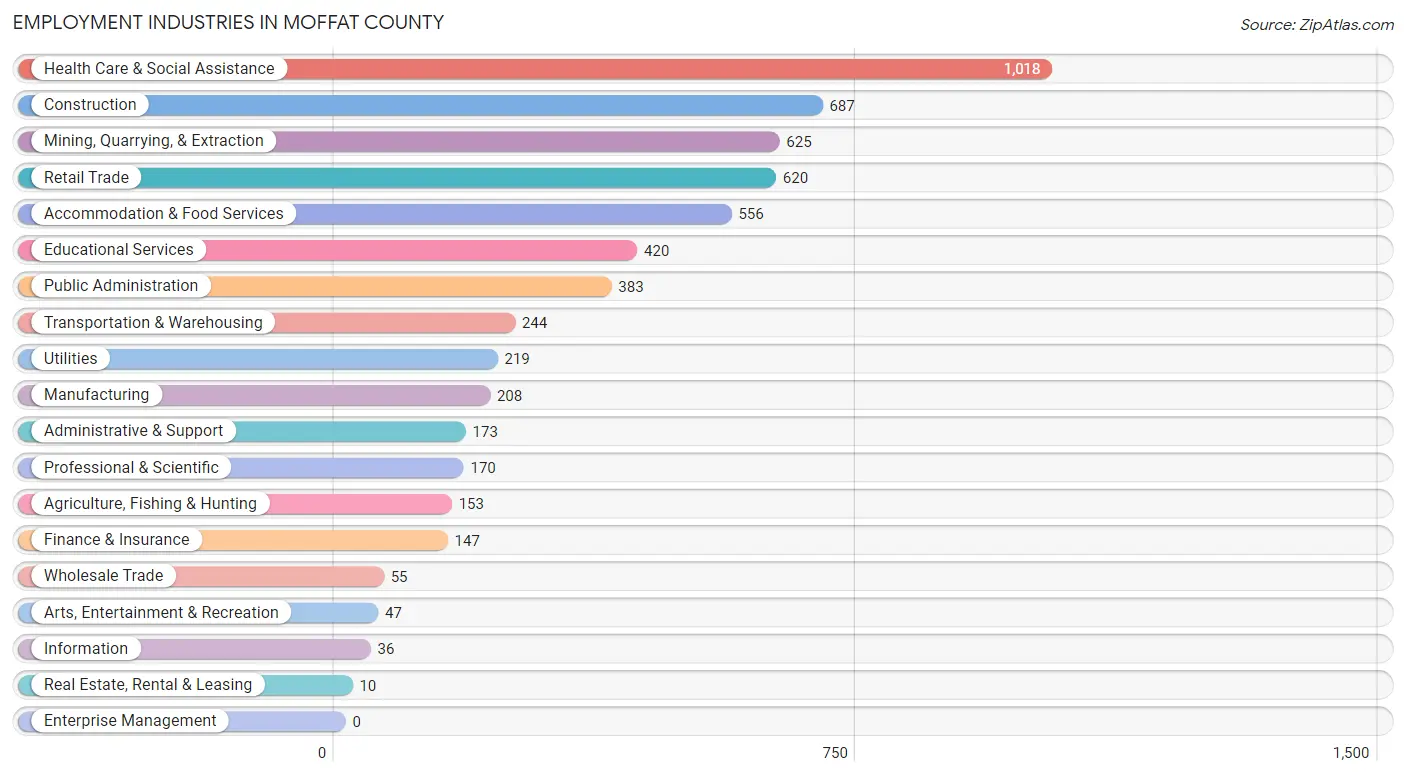
Employment Industries in Moffat County
The major employment industries in Moffat County include Health Care & Social Assistance (1,018 | 16.7%), Construction (687 | 11.2%), Mining, Quarrying, & Extraction (625 | 10.2%), Retail Trade (620 | 10.2%), and Accommodation & Food Services (556 | 9.1%).
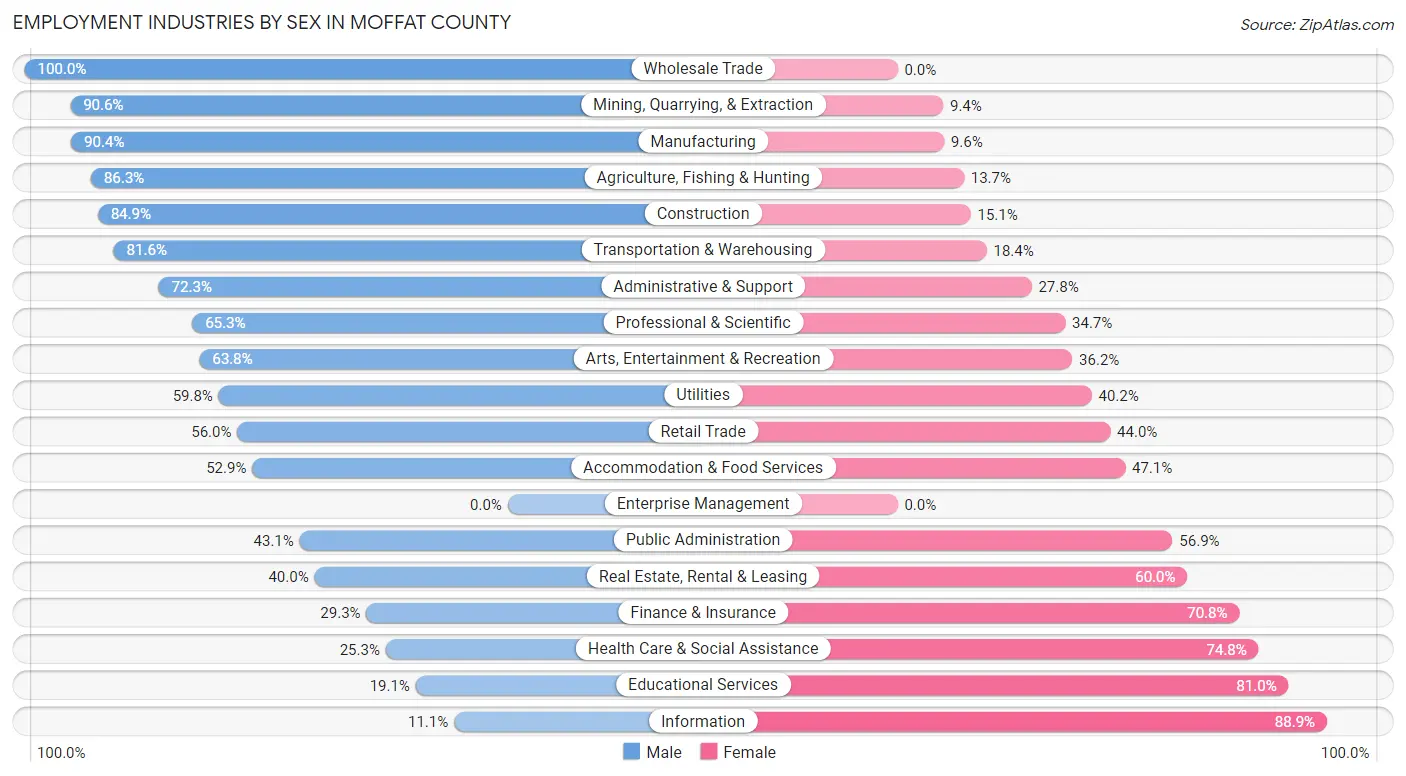
Employment Industries by Sex in Moffat County
The Moffat County industries that see more men than women are Wholesale Trade (100.0%), Mining, Quarrying, & Extraction (90.6%), and Manufacturing (90.4%), whereas the industries that tend to have a higher number of women are Information (88.9%), Educational Services (80.9%), and Health Care & Social Assistance (74.8%).
| Industry | Male | Female |
| Agriculture, Fishing & Hunting | 132 (86.3%) | 21 (13.7%) |
| Mining, Quarrying, & Extraction | 566 (90.6%) | 59 (9.4%) |
| Construction | 583 (84.9%) | 104 (15.1%) |
| Manufacturing | 188 (90.4%) | 20 (9.6%) |
| Wholesale Trade | 55 (100.0%) | 0 (0.0%) |
| Retail Trade | 347 (56.0%) | 273 (44.0%) |
| Transportation & Warehousing | 199 (81.6%) | 45 (18.4%) |
| Utilities | 131 (59.8%) | 88 (40.2%) |
| Information | 4 (11.1%) | 32 (88.9%) |
| Finance & Insurance | 43 (29.2%) | 104 (70.8%) |
| Real Estate, Rental & Leasing | 4 (40.0%) | 6 (60.0%) |
| Professional & Scientific | 111 (65.3%) | 59 (34.7%) |
| Enterprise Management | 0 (0.0%) | 0 (0.0%) |
| Administrative & Support | 125 (72.3%) | 48 (27.8%) |
| Educational Services | 80 (19.1%) | 340 (80.9%) |
| Health Care & Social Assistance | 257 (25.3%) | 761 (74.8%) |
| Arts, Entertainment & Recreation | 30 (63.8%) | 17 (36.2%) |
| Accommodation & Food Services | 294 (52.9%) | 262 (47.1%) |
| Public Administration | 165 (43.1%) | 218 (56.9%) |
| Total | 3,410 (55.8%) | 2,700 (44.2%) |
Education in Moffat County
School Enrollment in Moffat County
The most common levels of schooling among the 2,926 students in Moffat County are middle school (856 | 29.2%), high school (679 | 23.2%), and elementary school (631 | 21.6%).
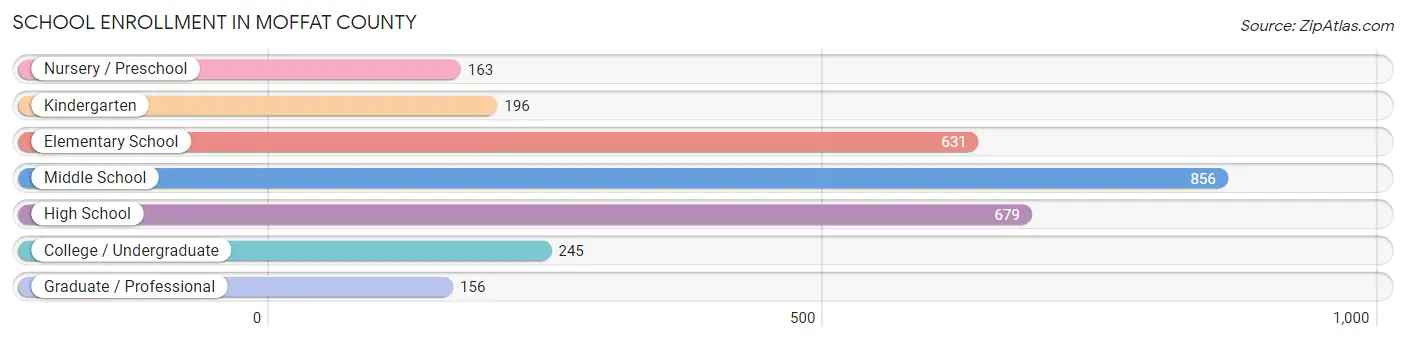
| School Level | # Students | % Students |
| Nursery / Preschool | 163 | 5.6% |
| Kindergarten | 196 | 6.7% |
| Elementary School | 631 | 21.6% |
| Middle School | 856 | 29.2% |
| High School | 679 | 23.2% |
| College / Undergraduate | 245 | 8.4% |
| Graduate / Professional | 156 | 5.3% |
| Total | 2,926 | 100.0% |
School Enrollment by Age by Funding Source in Moffat County
Out of a total of 2,926 students who are enrolled in schools in Moffat County, 415 (14.2%) attend a private institution, while the remaining 2,511 (85.8%) are enrolled in public schools. The age group of 35 years and over has the highest likelihood of being enrolled in private schools, with 45 (28.1% in the age bracket) enrolled. Conversely, the age group of 20 to 24 year olds has the lowest likelihood of being enrolled in a private school, with 63 (98.4% in the age bracket) attending a public institution.
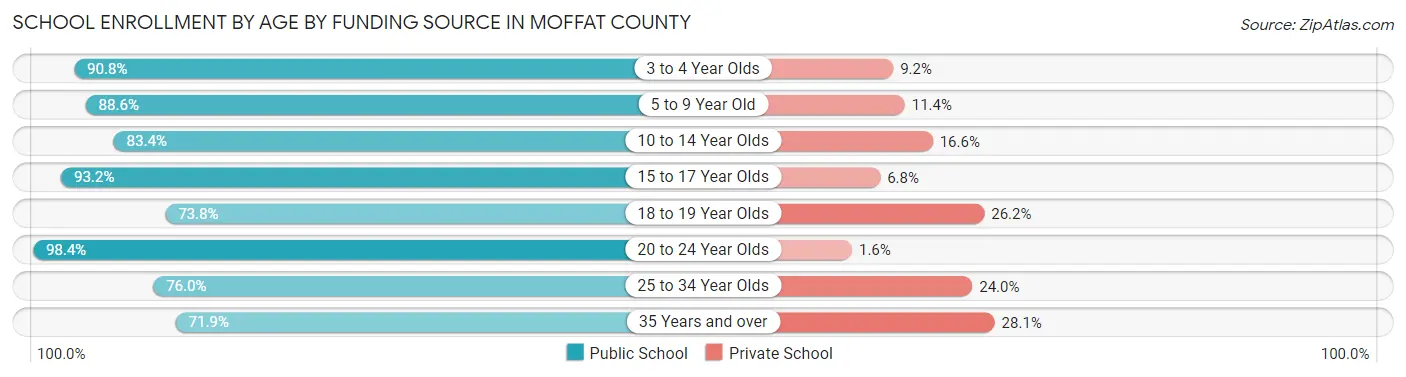
| Age Bracket | Public School | Private School |
| 3 to 4 Year Olds | 59 (90.8%) | 6 (9.2%) |
| 5 to 9 Year Old | 701 (88.6%) | 90 (11.4%) |
| 10 to 14 Year Olds | 915 (83.4%) | 182 (16.6%) |
| 15 to 17 Year Olds | 480 (93.2%) | 35 (6.8%) |
| 18 to 19 Year Olds | 31 (73.8%) | 11 (26.2%) |
| 20 to 24 Year Olds | 63 (98.4%) | 1 (1.6%) |
| 25 to 34 Year Olds | 146 (76.0%) | 46 (24.0%) |
| 35 Years and over | 115 (71.9%) | 45 (28.1%) |
| Total | 2,511 (85.8%) | 415 (14.2%) |
Educational Attainment by Field of Study in Moffat County
Bio, nature & agricultural (303 | 15.0%), education (303 | 15.0%), business (247 | 12.3%), psychology (215 | 10.7%), and communications (158 | 7.9%) are the most common fields of study among 2,013 individuals in Moffat County who have obtained a bachelor's degree or higher.
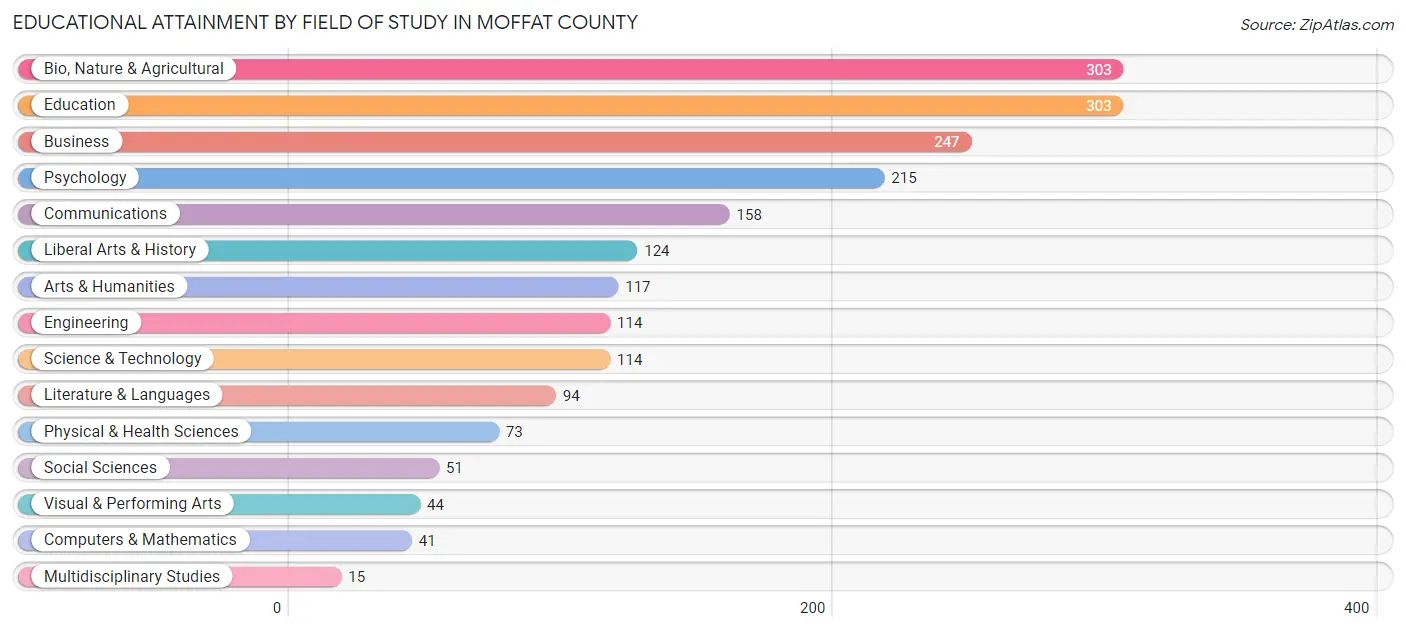
| Field of Study | # Graduates | % Graduates |
| Computers & Mathematics | 41 | 2.0% |
| Bio, Nature & Agricultural | 303 | 15.0% |
| Physical & Health Sciences | 73 | 3.6% |
| Psychology | 215 | 10.7% |
| Social Sciences | 51 | 2.5% |
| Engineering | 114 | 5.7% |
| Multidisciplinary Studies | 15 | 0.7% |
| Science & Technology | 114 | 5.7% |
| Business | 247 | 12.3% |
| Education | 303 | 15.0% |
| Literature & Languages | 94 | 4.7% |
| Liberal Arts & History | 124 | 6.2% |
| Visual & Performing Arts | 44 | 2.2% |
| Communications | 158 | 7.9% |
| Arts & Humanities | 117 | 5.8% |
| Total | 2,013 | 100.0% |
Transportation & Commute in Moffat County
Vehicle Availability by Sex in Moffat County
The most prevalent vehicle ownership categories in Moffat County are males with 2 vehicles (1,349, accounting for 40.0%) and females with 2 vehicles (933, making up 50.4%).
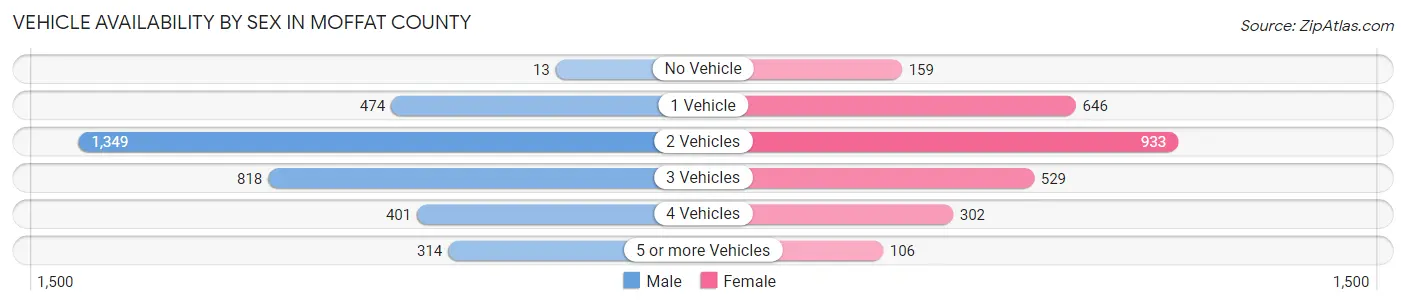
| Vehicles Available | Male | Female |
| No Vehicle | 13 (0.4%) | 159 (5.9%) |
| 1 Vehicle | 474 (14.1%) | 646 (24.1%) |
| 2 Vehicles | 1,349 (40.0%) | 933 (34.9%) |
| 3 Vehicles | 818 (24.3%) | 529 (19.8%) |
| 4 Vehicles | 401 (11.9%) | 302 (11.3%) |
| 5 or more Vehicles | 314 (9.3%) | 106 (4.0%) |
| Total | 3,369 (100.0%) | 2,675 (100.0%) |
Commute Time in Moffat County
The most frequently occuring commute durations in Moffat County are 5 to 9 minutes (1,454 commuters, 25.1%), 60 to 89 minutes (847 commuters, 14.6%), and 10 to 14 minutes (822 commuters, 14.2%).
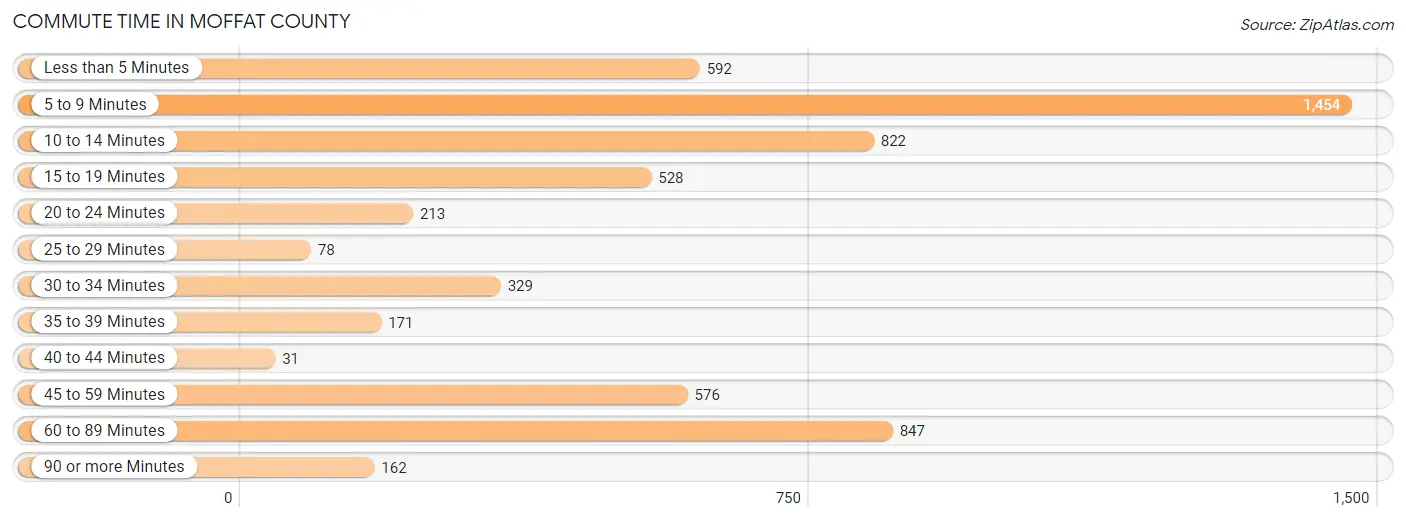
| Commute Time | # Commuters | % Commuters |
| Less than 5 Minutes | 592 | 10.2% |
| 5 to 9 Minutes | 1,454 | 25.1% |
| 10 to 14 Minutes | 822 | 14.2% |
| 15 to 19 Minutes | 528 | 9.1% |
| 20 to 24 Minutes | 213 | 3.7% |
| 25 to 29 Minutes | 78 | 1.3% |
| 30 to 34 Minutes | 329 | 5.7% |
| 35 to 39 Minutes | 171 | 2.9% |
| 40 to 44 Minutes | 31 | 0.5% |
| 45 to 59 Minutes | 576 | 9.9% |
| 60 to 89 Minutes | 847 | 14.6% |
| 90 or more Minutes | 162 | 2.8% |
Commute Time by Sex in Moffat County
The most common commute times in Moffat County are 5 to 9 minutes (770 commuters, 23.6%) for males and 5 to 9 minutes (684 commuters, 26.9%) for females.
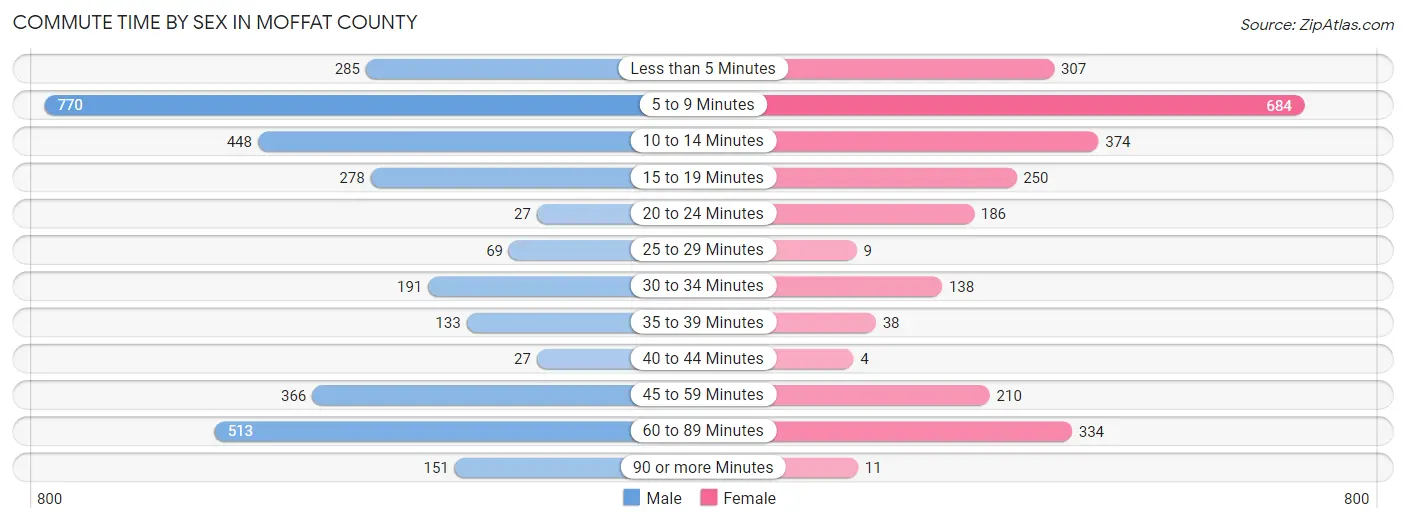
| Commute Time | Male | Female |
| Less than 5 Minutes | 285 (8.7%) | 307 (12.1%) |
| 5 to 9 Minutes | 770 (23.6%) | 684 (26.9%) |
| 10 to 14 Minutes | 448 (13.8%) | 374 (14.7%) |
| 15 to 19 Minutes | 278 (8.5%) | 250 (9.8%) |
| 20 to 24 Minutes | 27 (0.8%) | 186 (7.3%) |
| 25 to 29 Minutes | 69 (2.1%) | 9 (0.4%) |
| 30 to 34 Minutes | 191 (5.9%) | 138 (5.4%) |
| 35 to 39 Minutes | 133 (4.1%) | 38 (1.5%) |
| 40 to 44 Minutes | 27 (0.8%) | 4 (0.2%) |
| 45 to 59 Minutes | 366 (11.2%) | 210 (8.3%) |
| 60 to 89 Minutes | 513 (15.8%) | 334 (13.1%) |
| 90 or more Minutes | 151 (4.6%) | 11 (0.4%) |
Time of Departure to Work by Sex in Moffat County
The most frequent times of departure to work in Moffat County are 7:00 AM to 7:29 AM (520, 16.0%) for males and 7:00 AM to 7:29 AM (525, 20.6%) for females.
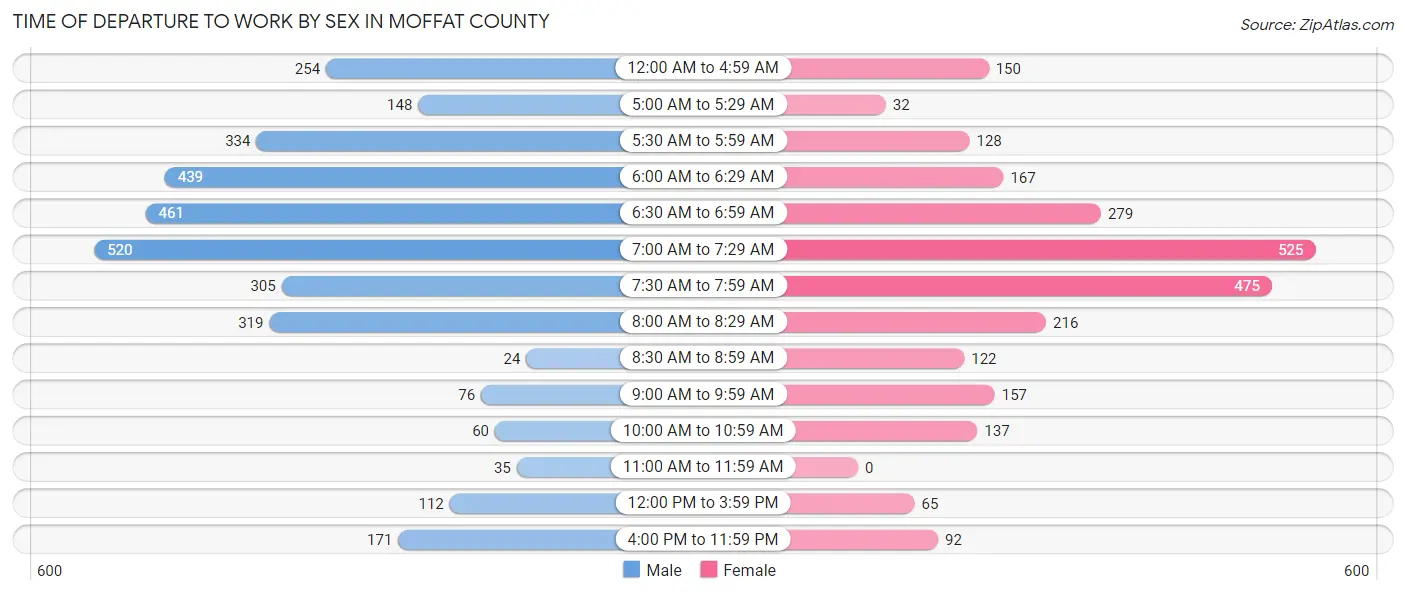
| Time of Departure | Male | Female |
| 12:00 AM to 4:59 AM | 254 (7.8%) | 150 (5.9%) |
| 5:00 AM to 5:29 AM | 148 (4.5%) | 32 (1.3%) |
| 5:30 AM to 5:59 AM | 334 (10.2%) | 128 (5.0%) |
| 6:00 AM to 6:29 AM | 439 (13.5%) | 167 (6.6%) |
| 6:30 AM to 6:59 AM | 461 (14.1%) | 279 (11.0%) |
| 7:00 AM to 7:29 AM | 520 (16.0%) | 525 (20.6%) |
| 7:30 AM to 7:59 AM | 305 (9.4%) | 475 (18.7%) |
| 8:00 AM to 8:29 AM | 319 (9.8%) | 216 (8.5%) |
| 8:30 AM to 8:59 AM | 24 (0.7%) | 122 (4.8%) |
| 9:00 AM to 9:59 AM | 76 (2.3%) | 157 (6.2%) |
| 10:00 AM to 10:59 AM | 60 (1.8%) | 137 (5.4%) |
| 11:00 AM to 11:59 AM | 35 (1.1%) | 0 (0.0%) |
| 12:00 PM to 3:59 PM | 112 (3.4%) | 65 (2.5%) |
| 4:00 PM to 11:59 PM | 171 (5.2%) | 92 (3.6%) |
| Total | 3,258 (100.0%) | 2,545 (100.0%) |
Housing Occupancy in Moffat County
Occupancy by Ownership in Moffat County
Of the total 5,187 dwellings in Moffat County, owner-occupied units account for 3,467 (66.8%), while renter-occupied units make up 1,720 (33.2%).
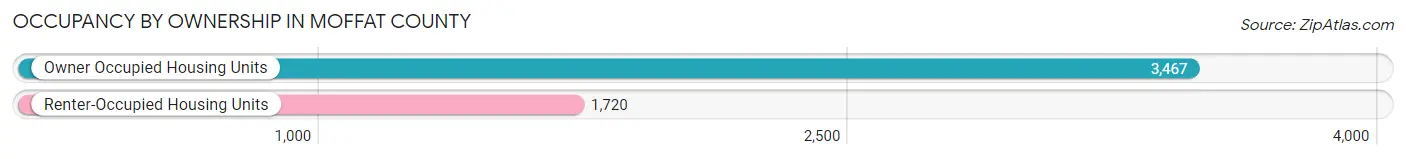
| Occupancy | # Housing Units | % Housing Units |
| Owner Occupied Housing Units | 3,467 | 66.8% |
| Renter-Occupied Housing Units | 1,720 | 33.2% |
| Total Occupied Housing Units | 5,187 | 100.0% |
Occupancy by Household Size in Moffat County
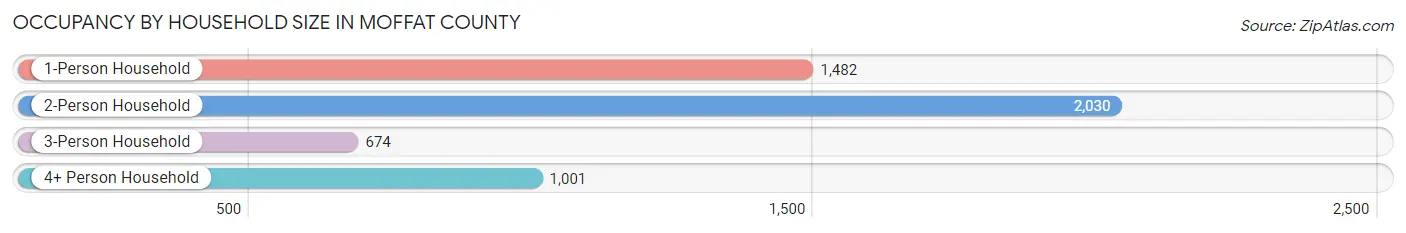
| Household Size | # Housing Units | % Housing Units |
| 1-Person Household | 1,482 | 28.6% |
| 2-Person Household | 2,030 | 39.1% |
| 3-Person Household | 674 | 13.0% |
| 4+ Person Household | 1,001 | 19.3% |
| Total Housing Units | 5,187 | 100.0% |
Occupancy by Ownership by Household Size in Moffat County
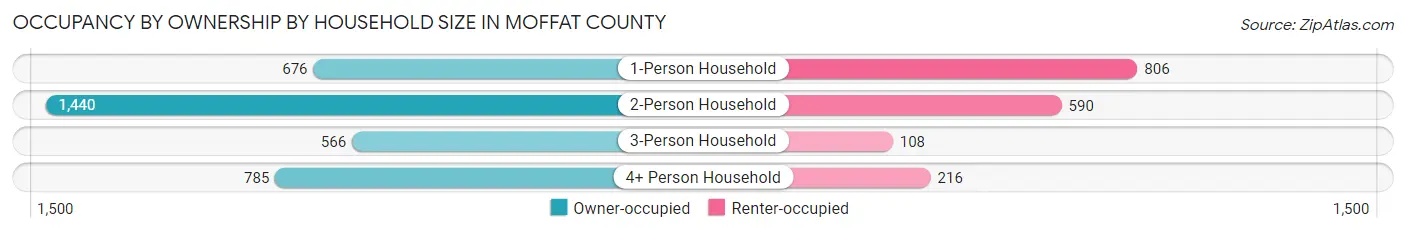
| Household Size | Owner-occupied | Renter-occupied |
| 1-Person Household | 676 (45.6%) | 806 (54.4%) |
| 2-Person Household | 1,440 (70.9%) | 590 (29.1%) |
| 3-Person Household | 566 (84.0%) | 108 (16.0%) |
| 4+ Person Household | 785 (78.4%) | 216 (21.6%) |
| Total Housing Units | 3,467 (66.8%) | 1,720 (33.2%) |
Occupancy by Educational Attainment in Moffat County
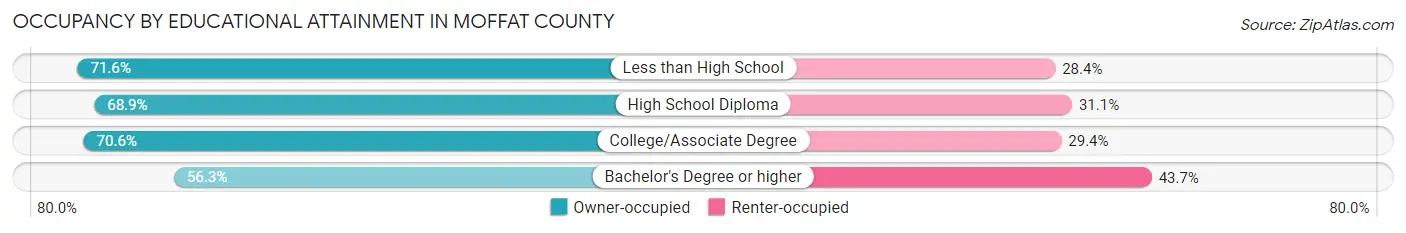
| Household Size | Owner-occupied | Renter-occupied |
| Less than High School | 237 (71.6%) | 94 (28.4%) |
| High School Diploma | 1,476 (68.9%) | 665 (31.1%) |
| College/Associate Degree | 1,111 (70.6%) | 462 (29.4%) |
| Bachelor's Degree or higher | 643 (56.3%) | 499 (43.7%) |
Occupancy by Age of Householder in Moffat County
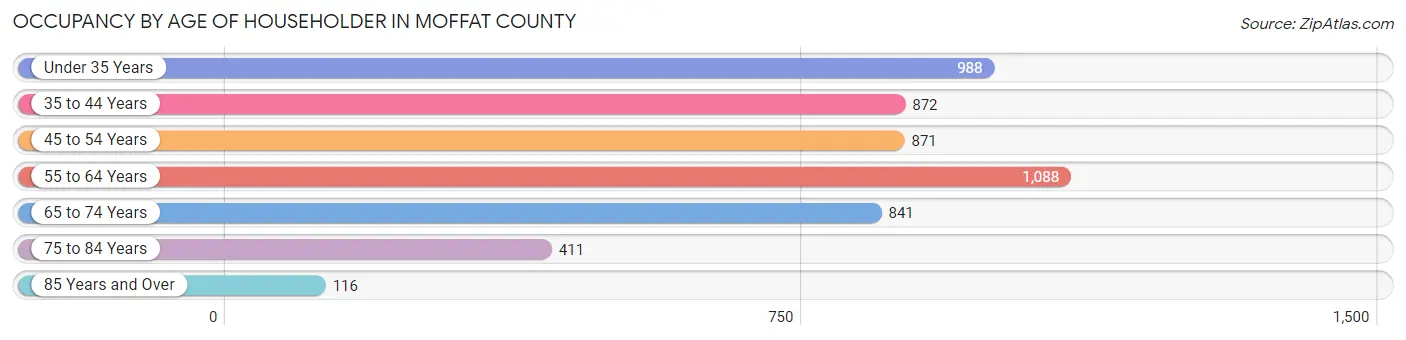
| Age Bracket | # Households | % Households |
| Under 35 Years | 988 | 19.1% |
| 35 to 44 Years | 872 | 16.8% |
| 45 to 54 Years | 871 | 16.8% |
| 55 to 64 Years | 1,088 | 21.0% |
| 65 to 74 Years | 841 | 16.2% |
| 75 to 84 Years | 411 | 7.9% |
| 85 Years and Over | 116 | 2.2% |
| Total | 5,187 | 100.0% |
Housing Finances in Moffat County
Median Income by Occupancy in Moffat County
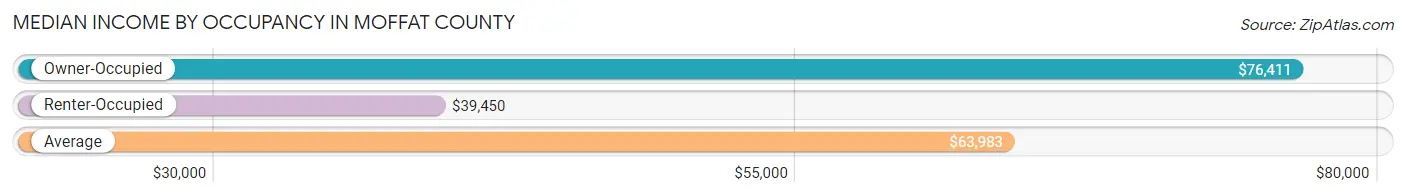
| Occupancy Type | # Households | Median Income |
| Owner-Occupied | 3,467 (66.8%) | $76,411 |
| Renter-Occupied | 1,720 (33.2%) | $39,450 |
| Average | 5,187 (100.0%) | $63,983 |
Occupancy by Householder Income Bracket in Moffat County
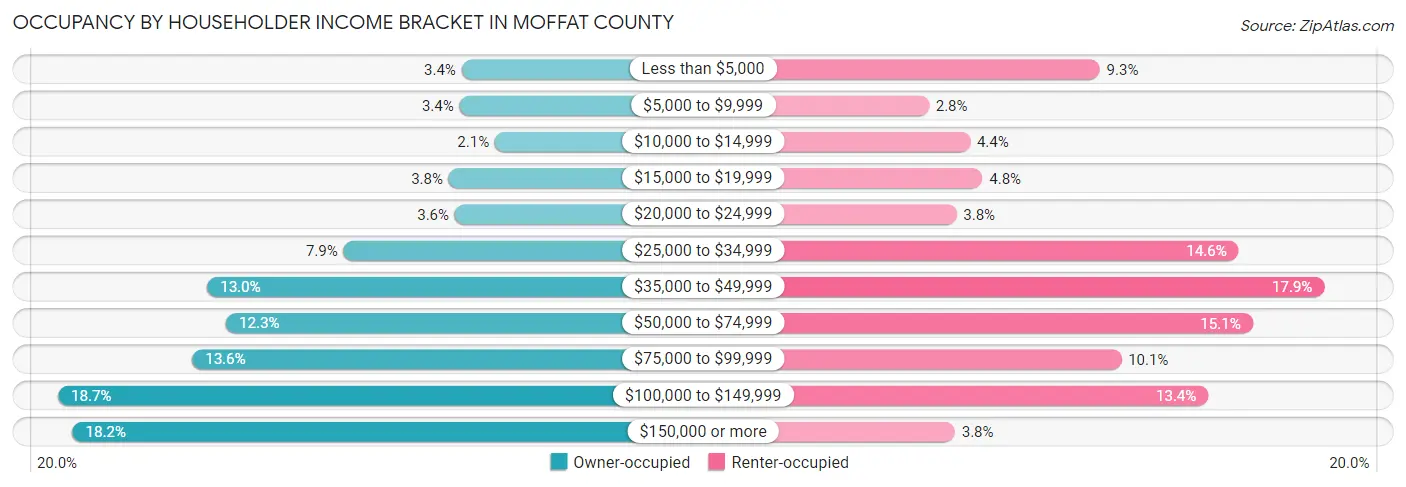
| Income Bracket | Owner-occupied | Renter-occupied |
| Less than $5,000 | 116 (3.4%) | 160 (9.3%) |
| $5,000 to $9,999 | 119 (3.4%) | 48 (2.8%) |
| $10,000 to $14,999 | 72 (2.1%) | 75 (4.4%) |
| $15,000 to $19,999 | 133 (3.8%) | 83 (4.8%) |
| $20,000 to $24,999 | 125 (3.6%) | 66 (3.8%) |
| $25,000 to $34,999 | 272 (7.9%) | 251 (14.6%) |
| $35,000 to $49,999 | 452 (13.0%) | 307 (17.8%) |
| $50,000 to $74,999 | 427 (12.3%) | 260 (15.1%) |
| $75,000 to $99,999 | 472 (13.6%) | 174 (10.1%) |
| $100,000 to $149,999 | 649 (18.7%) | 231 (13.4%) |
| $150,000 or more | 630 (18.2%) | 65 (3.8%) |
| Total | 3,467 (100.0%) | 1,720 (100.0%) |
Monthly Housing Cost Tiers in Moffat County
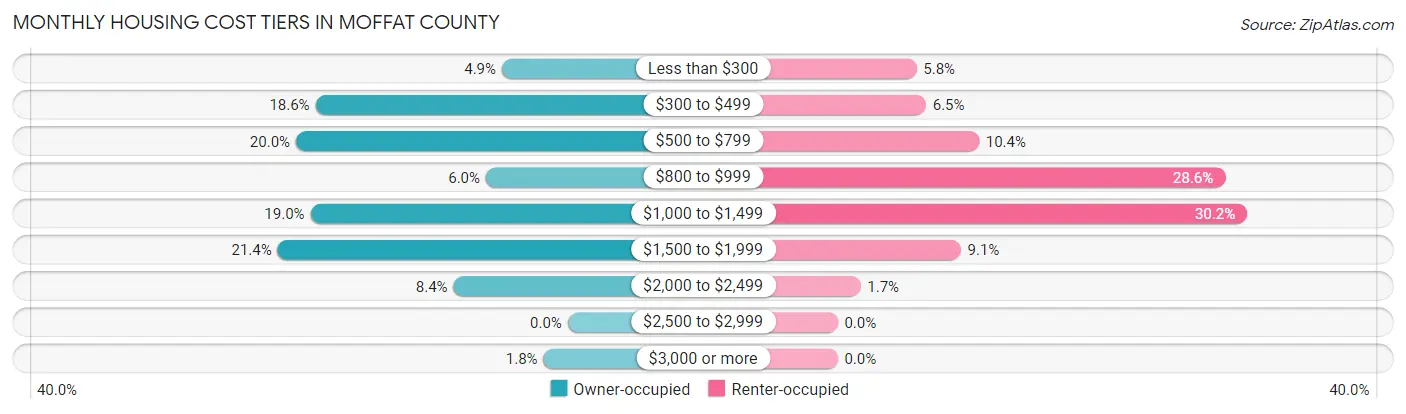
| Monthly Cost | Owner-occupied | Renter-occupied |
| Less than $300 | 168 (4.9%) | 100 (5.8%) |
| $300 to $499 | 644 (18.6%) | 112 (6.5%) |
| $500 to $799 | 694 (20.0%) | 179 (10.4%) |
| $800 to $999 | 209 (6.0%) | 491 (28.5%) |
| $1,000 to $1,499 | 657 (19.0%) | 519 (30.2%) |
| $1,500 to $1,999 | 741 (21.4%) | 156 (9.1%) |
| $2,000 to $2,499 | 292 (8.4%) | 29 (1.7%) |
| $2,500 to $2,999 | 0 (0.0%) | 0 (0.0%) |
| $3,000 or more | 62 (1.8%) | 0 (0.0%) |
| Total | 3,467 (100.0%) | 1,720 (100.0%) |
Physical Housing Characteristics in Moffat County
Housing Structures in Moffat County
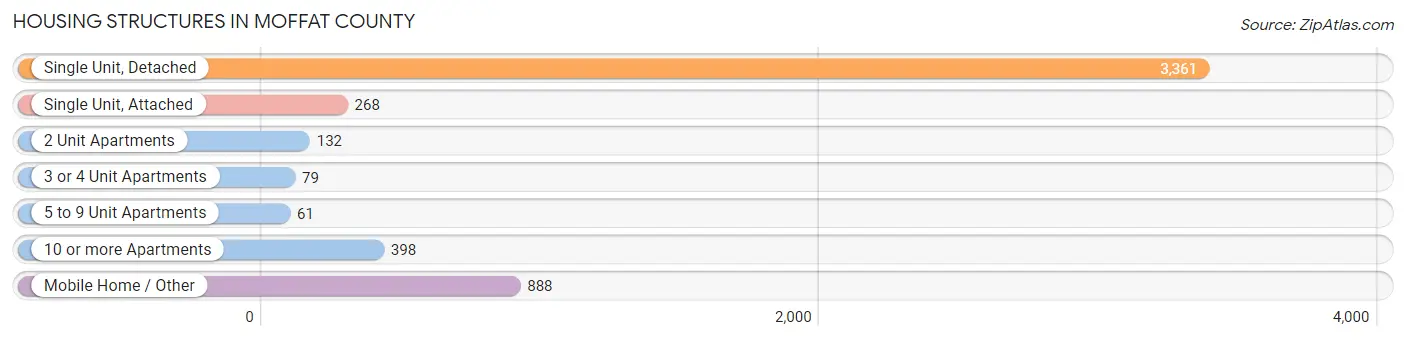
| Structure Type | # Housing Units | % Housing Units |
| Single Unit, Detached | 3,361 | 64.8% |
| Single Unit, Attached | 268 | 5.2% |
| 2 Unit Apartments | 132 | 2.5% |
| 3 or 4 Unit Apartments | 79 | 1.5% |
| 5 to 9 Unit Apartments | 61 | 1.2% |
| 10 or more Apartments | 398 | 7.7% |
| Mobile Home / Other | 888 | 17.1% |
| Total | 5,187 | 100.0% |
Housing Structures by Occupancy in Moffat County
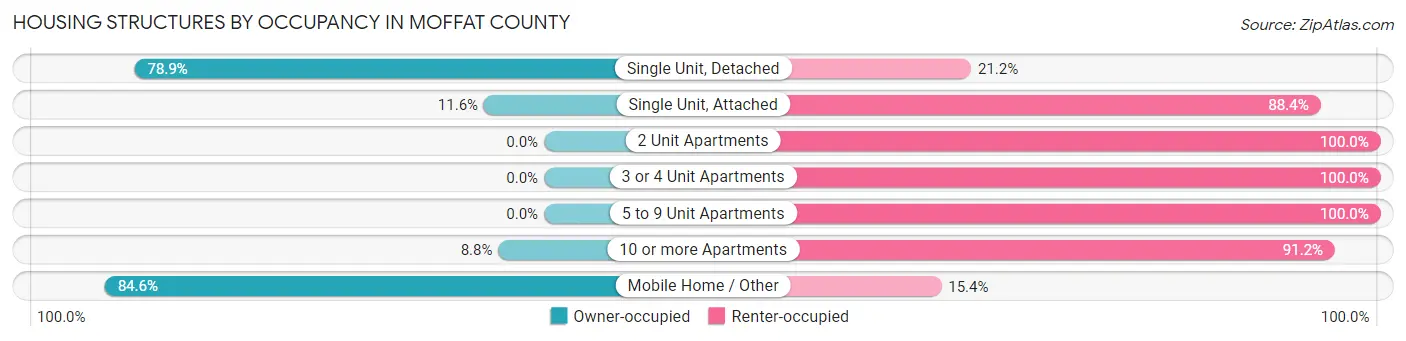
| Structure Type | Owner-occupied | Renter-occupied |
| Single Unit, Detached | 2,650 (78.8%) | 711 (21.1%) |
| Single Unit, Attached | 31 (11.6%) | 237 (88.4%) |
| 2 Unit Apartments | 0 (0.0%) | 132 (100.0%) |
| 3 or 4 Unit Apartments | 0 (0.0%) | 79 (100.0%) |
| 5 to 9 Unit Apartments | 0 (0.0%) | 61 (100.0%) |
| 10 or more Apartments | 35 (8.8%) | 363 (91.2%) |
| Mobile Home / Other | 751 (84.6%) | 137 (15.4%) |
| Total | 3,467 (66.8%) | 1,720 (33.2%) |
Housing Structures by Number of Rooms in Moffat County
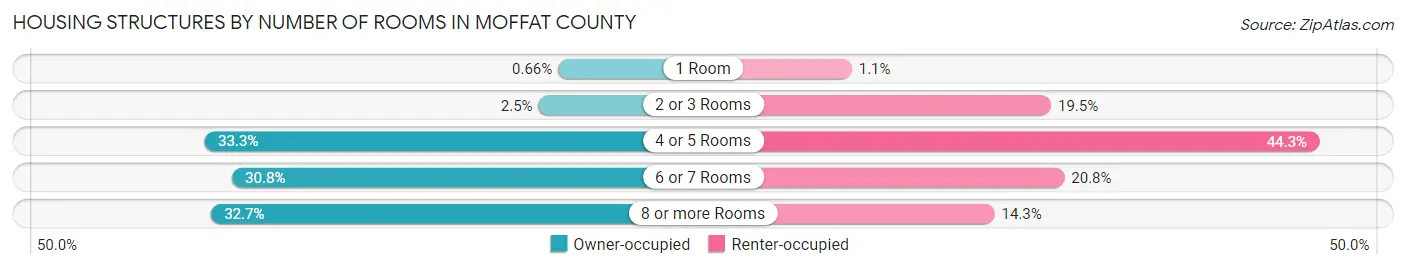
| Number of Rooms | Owner-occupied | Renter-occupied |
| 1 Room | 23 (0.7%) | 19 (1.1%) |
| 2 or 3 Rooms | 86 (2.5%) | 336 (19.5%) |
| 4 or 5 Rooms | 1,155 (33.3%) | 762 (44.3%) |
| 6 or 7 Rooms | 1,068 (30.8%) | 357 (20.8%) |
| 8 or more Rooms | 1,135 (32.7%) | 246 (14.3%) |
| Total | 3,467 (100.0%) | 1,720 (100.0%) |
Housing Structure by Heating Type in Moffat County
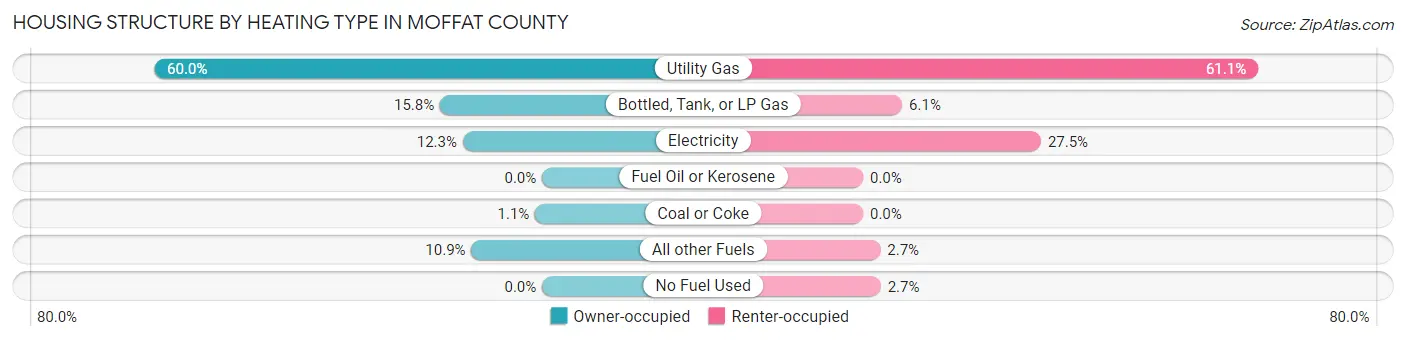
| Heating Type | Owner-occupied | Renter-occupied |
| Utility Gas | 2,079 (60.0%) | 1,050 (61.1%) |
| Bottled, Tank, or LP Gas | 547 (15.8%) | 104 (6.0%) |
| Electricity | 425 (12.3%) | 473 (27.5%) |
| Fuel Oil or Kerosene | 0 (0.0%) | 0 (0.0%) |
| Coal or Coke | 37 (1.1%) | 0 (0.0%) |
| All other Fuels | 379 (10.9%) | 46 (2.7%) |
| No Fuel Used | 0 (0.0%) | 47 (2.7%) |
| Total | 3,467 (100.0%) | 1,720 (100.0%) |
Household Vehicle Usage in Moffat County
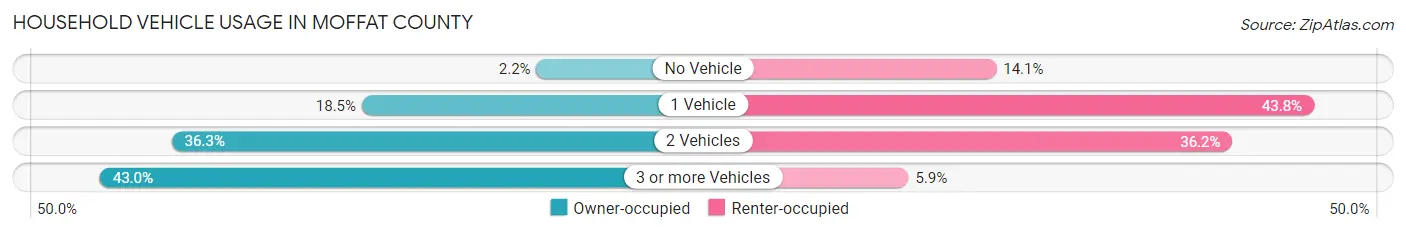
| Vehicles per Household | Owner-occupied | Renter-occupied |
| No Vehicle | 77 (2.2%) | 243 (14.1%) |
| 1 Vehicle | 642 (18.5%) | 753 (43.8%) |
| 2 Vehicles | 1,258 (36.3%) | 622 (36.2%) |
| 3 or more Vehicles | 1,490 (43.0%) | 102 (5.9%) |
| Total | 3,467 (100.0%) | 1,720 (100.0%) |
Real Estate & Mortgages in Moffat County
Real Estate and Mortgage Overview in Moffat County
| Characteristic | Without Mortgage | With Mortgage |
| Housing Units | 1,317 | 2,150 |
| Median Property Value | $201,000 | $256,200 |
| Median Household Income | $53,826 | $504 |
| Monthly Housing Costs | $458 | $62 |
| Real Estate Taxes | $824 | $105 |
Property Value by Mortgage Status in Moffat County
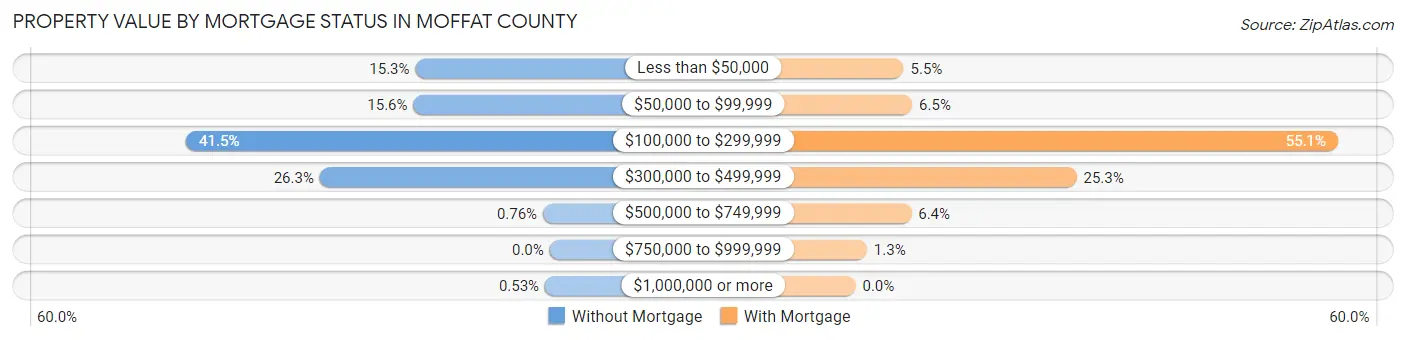
| Property Value | Without Mortgage | With Mortgage |
| Less than $50,000 | 202 (15.3%) | 118 (5.5%) |
| $50,000 to $99,999 | 205 (15.6%) | 139 (6.5%) |
| $100,000 to $299,999 | 547 (41.5%) | 1,185 (55.1%) |
| $300,000 to $499,999 | 346 (26.3%) | 543 (25.3%) |
| $500,000 to $749,999 | 10 (0.8%) | 137 (6.4%) |
| $750,000 to $999,999 | 0 (0.0%) | 28 (1.3%) |
| $1,000,000 or more | 7 (0.5%) | 0 (0.0%) |
| Total | 1,317 (100.0%) | 2,150 (100.0%) |
Household Income by Mortgage Status in Moffat County
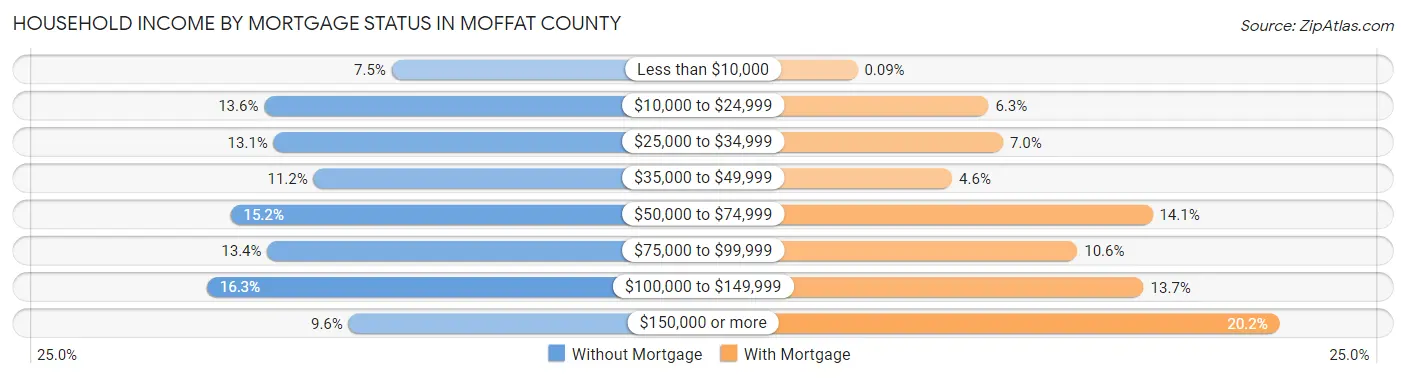
| Household Income | Without Mortgage | With Mortgage |
| Less than $10,000 | 99 (7.5%) | 2 (0.1%) |
| $10,000 to $24,999 | 179 (13.6%) | 136 (6.3%) |
| $25,000 to $34,999 | 173 (13.1%) | 151 (7.0%) |
| $35,000 to $49,999 | 148 (11.2%) | 99 (4.6%) |
| $50,000 to $74,999 | 200 (15.2%) | 304 (14.1%) |
| $75,000 to $99,999 | 177 (13.4%) | 227 (10.6%) |
| $100,000 to $149,999 | 215 (16.3%) | 295 (13.7%) |
| $150,000 or more | 126 (9.6%) | 434 (20.2%) |
| Total | 1,317 (100.0%) | 2,150 (100.0%) |
Property Value to Household Income Ratio in Moffat County
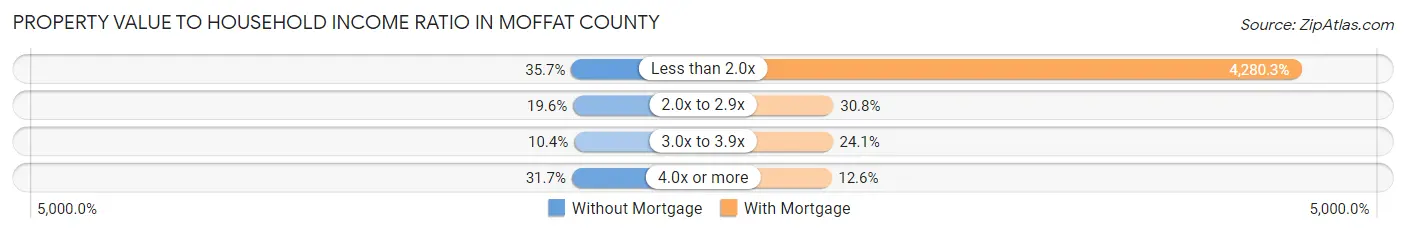
| Value-to-Income Ratio | Without Mortgage | With Mortgage |
| Less than 2.0x | 470 (35.7%) | 92,027 (4,280.3%) |
| 2.0x to 2.9x | 258 (19.6%) | 662 (30.8%) |
| 3.0x to 3.9x | 137 (10.4%) | 519 (24.1%) |
| 4.0x or more | 418 (31.7%) | 271 (12.6%) |
| Total | 1,317 (100.0%) | 2,150 (100.0%) |
Real Estate Taxes by Mortgage Status in Moffat County
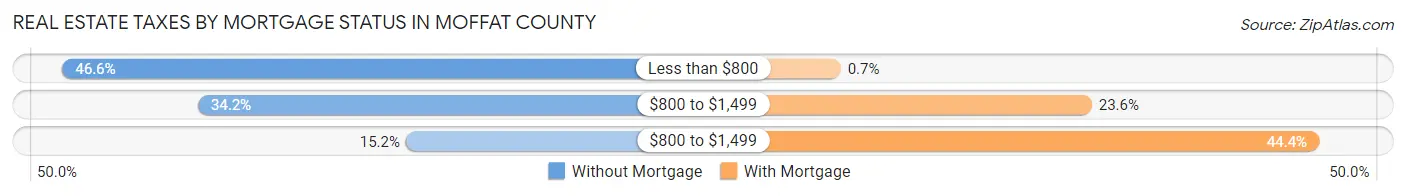
| Property Taxes | Without Mortgage | With Mortgage |
| Less than $800 | 613 (46.6%) | 15 (0.7%) |
| $800 to $1,499 | 450 (34.2%) | 508 (23.6%) |
| $800 to $1,499 | 200 (15.2%) | 954 (44.4%) |
| Total | 1,317 (100.0%) | 2,150 (100.0%) |
Health & Disability in Moffat County
Health Insurance Coverage by Age in Moffat County
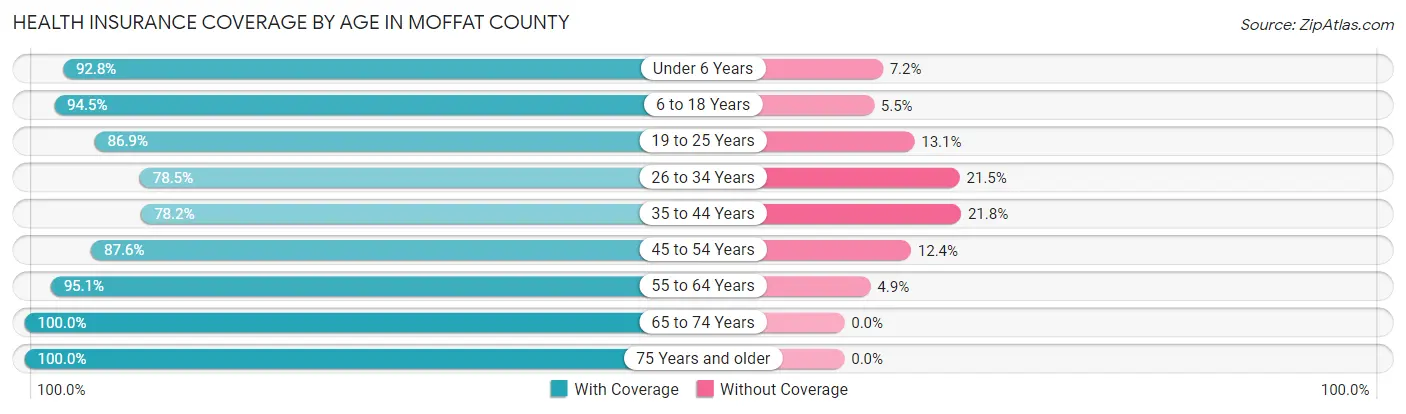
| Age Bracket | With Coverage | Without Coverage |
| Under 6 Years | 972 (92.8%) | 75 (7.2%) |
| 6 to 18 Years | 2,315 (94.5%) | 135 (5.5%) |
| 19 to 25 Years | 879 (86.9%) | 132 (13.1%) |
| 26 to 34 Years | 1,322 (78.5%) | 362 (21.5%) |
| 35 to 44 Years | 1,215 (78.2%) | 338 (21.8%) |
| 45 to 54 Years | 1,285 (87.6%) | 182 (12.4%) |
| 55 to 64 Years | 1,799 (95.1%) | 92 (4.9%) |
| 65 to 74 Years | 1,240 (100.0%) | 0 (0.0%) |
| 75 Years and older | 731 (100.0%) | 0 (0.0%) |
| Total | 11,758 (89.9%) | 1,316 (10.1%) |
Health Insurance Coverage by Citizenship Status in Moffat County
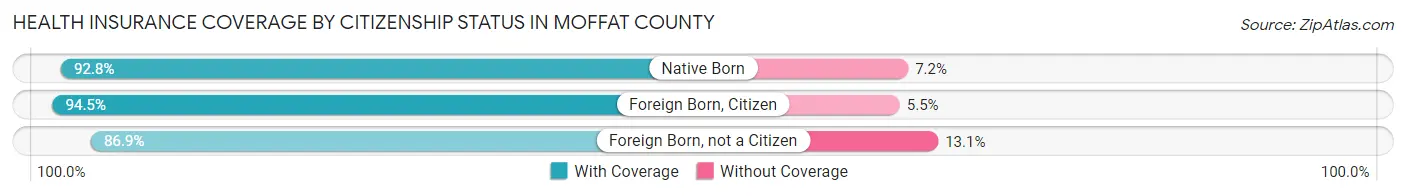
| Citizenship Status | With Coverage | Without Coverage |
| Native Born | 972 (92.8%) | 75 (7.2%) |
| Foreign Born, Citizen | 2,315 (94.5%) | 135 (5.5%) |
| Foreign Born, not a Citizen | 879 (86.9%) | 132 (13.1%) |
Health Insurance Coverage by Household Income in Moffat County
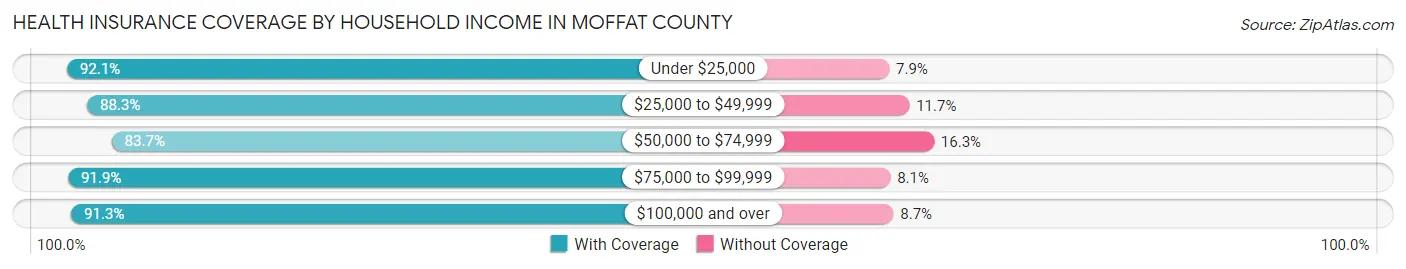
| Household Income | With Coverage | Without Coverage |
| Under $25,000 | 1,683 (92.1%) | 145 (7.9%) |
| $25,000 to $49,999 | 2,346 (88.3%) | 311 (11.7%) |
| $50,000 to $74,999 | 1,364 (83.7%) | 266 (16.3%) |
| $75,000 to $99,999 | 1,603 (91.9%) | 142 (8.1%) |
| $100,000 and over | 4,733 (91.3%) | 452 (8.7%) |
Public vs Private Health Insurance Coverage by Age in Moffat County
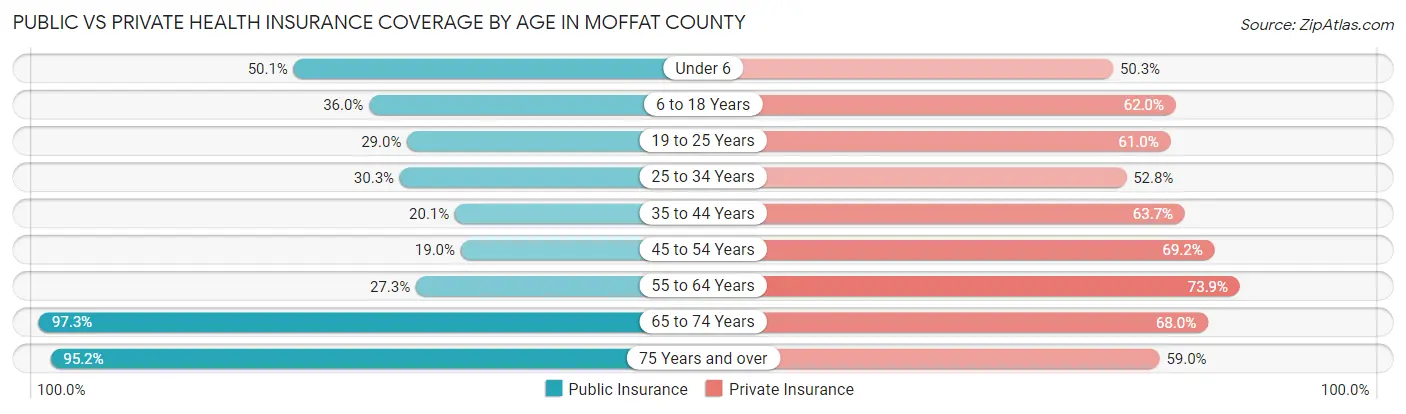
| Age Bracket | Public Insurance | Private Insurance |
| Under 6 | 524 (50.0%) | 527 (50.3%) |
| 6 to 18 Years | 883 (36.0%) | 1,519 (62.0%) |
| 19 to 25 Years | 293 (29.0%) | 617 (61.0%) |
| 25 to 34 Years | 511 (30.3%) | 889 (52.8%) |
| 35 to 44 Years | 312 (20.1%) | 989 (63.7%) |
| 45 to 54 Years | 279 (19.0%) | 1,015 (69.2%) |
| 55 to 64 Years | 517 (27.3%) | 1,397 (73.9%) |
| 65 to 74 Years | 1,207 (97.3%) | 843 (68.0%) |
| 75 Years and over | 696 (95.2%) | 431 (59.0%) |
| Total | 5,222 (39.9%) | 8,227 (62.9%) |
Disability Status by Sex by Age in Moffat County
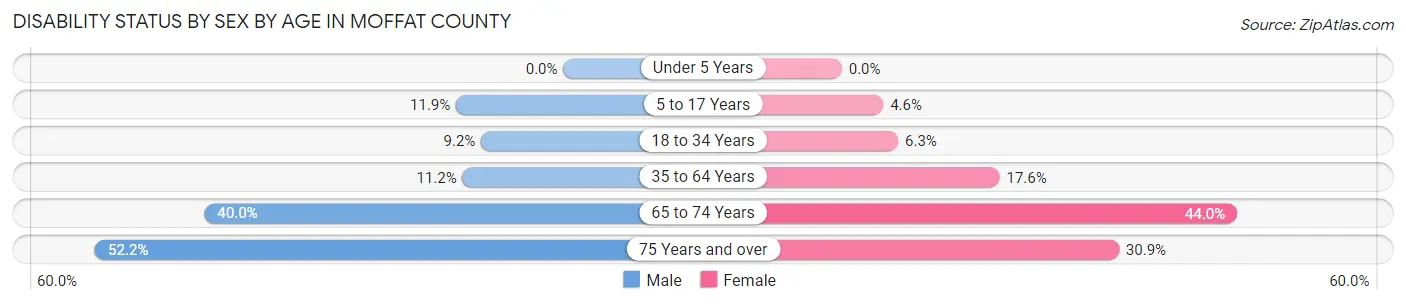
| Age Bracket | Male | Female |
| Under 5 Years | 0 (0.0%) | 0 (0.0%) |
| 5 to 17 Years | 161 (11.9%) | 55 (4.6%) |
| 18 to 34 Years | 135 (9.1%) | 86 (6.3%) |
| 35 to 64 Years | 273 (11.2%) | 436 (17.6%) |
| 65 to 74 Years | 255 (40.0%) | 265 (44.0%) |
| 75 Years and over | 170 (52.1%) | 125 (30.9%) |
Disability Class by Sex by Age in Moffat County
Disability Class: Hearing Difficulty
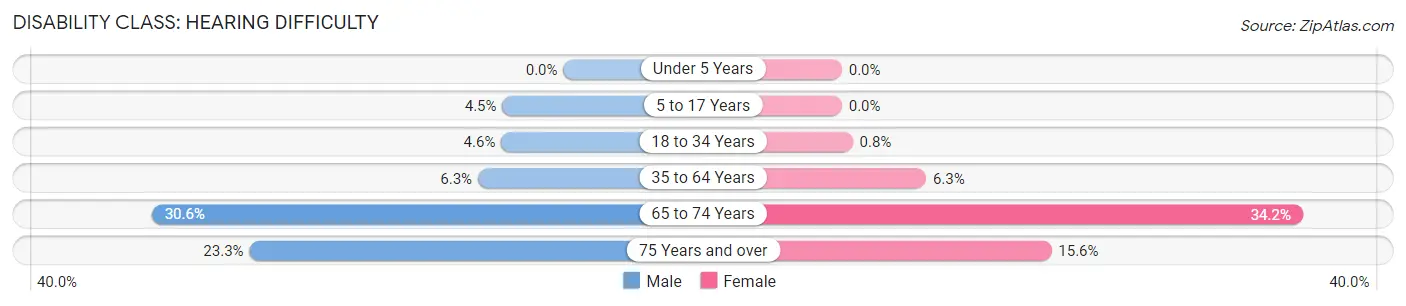
| Age Bracket | Male | Female |
| Under 5 Years | 0 (0.0%) | 0 (0.0%) |
| 5 to 17 Years | 61 (4.5%) | 0 (0.0%) |
| 18 to 34 Years | 68 (4.6%) | 11 (0.8%) |
| 35 to 64 Years | 154 (6.3%) | 155 (6.2%) |
| 65 to 74 Years | 195 (30.6%) | 206 (34.2%) |
| 75 Years and over | 76 (23.3%) | 63 (15.6%) |
Disability Class: Vision Difficulty
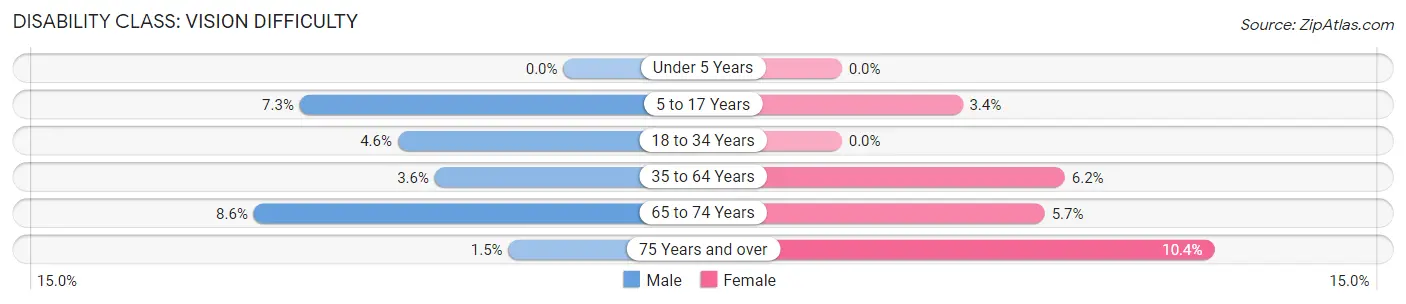
| Age Bracket | Male | Female |
| Under 5 Years | 0 (0.0%) | 0 (0.0%) |
| 5 to 17 Years | 99 (7.3%) | 40 (3.4%) |
| 18 to 34 Years | 68 (4.6%) | 0 (0.0%) |
| 35 to 64 Years | 87 (3.6%) | 154 (6.2%) |
| 65 to 74 Years | 55 (8.6%) | 34 (5.7%) |
| 75 Years and over | 5 (1.5%) | 42 (10.4%) |
Disability Class: Cognitive Difficulty
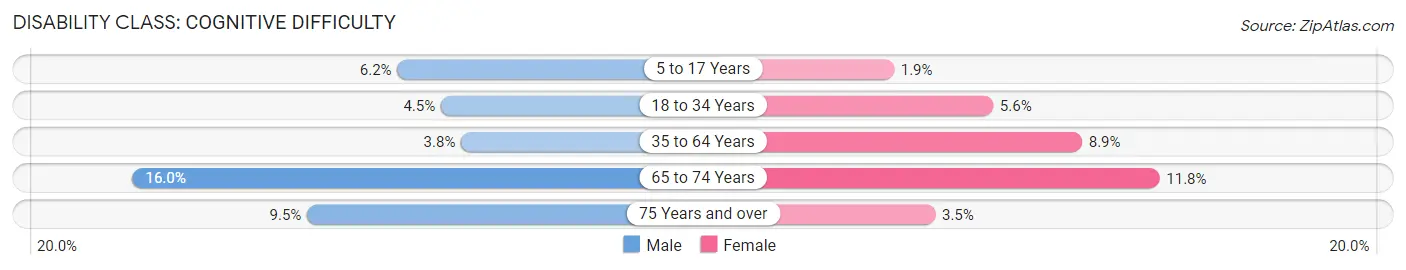
| Age Bracket | Male | Female |
| 5 to 17 Years | 83 (6.2%) | 23 (1.9%) |
| 18 to 34 Years | 67 (4.5%) | 77 (5.6%) |
| 35 to 64 Years | 92 (3.8%) | 221 (8.9%) |
| 65 to 74 Years | 102 (16.0%) | 71 (11.8%) |
| 75 Years and over | 31 (9.5%) | 14 (3.5%) |
Disability Class: Ambulatory Difficulty
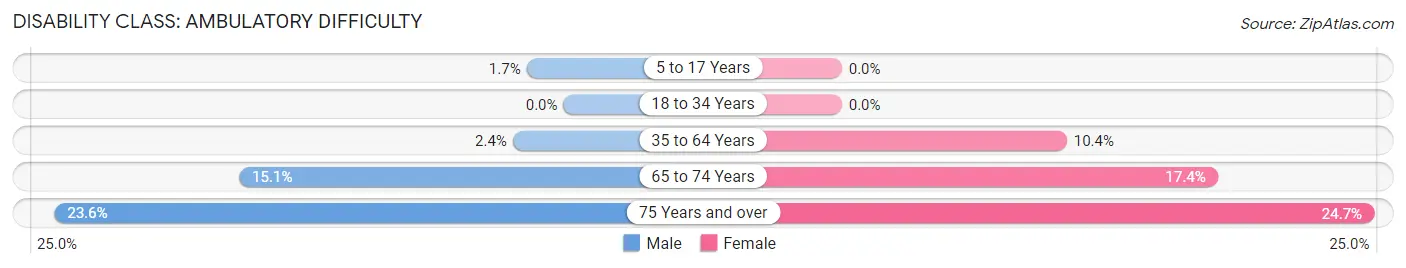
| Age Bracket | Male | Female |
| 5 to 17 Years | 23 (1.7%) | 0 (0.0%) |
| 18 to 34 Years | 0 (0.0%) | 0 (0.0%) |
| 35 to 64 Years | 57 (2.4%) | 259 (10.4%) |
| 65 to 74 Years | 96 (15.0%) | 105 (17.4%) |
| 75 Years and over | 77 (23.6%) | 100 (24.7%) |
Disability Class: Self-Care Difficulty
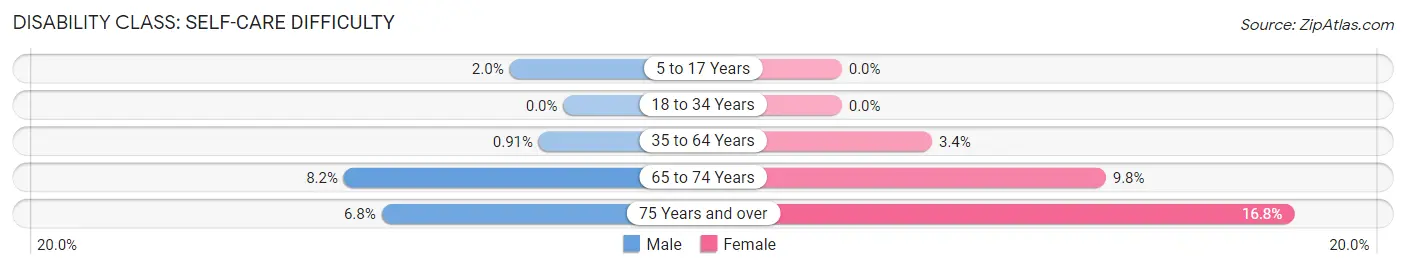
| Age Bracket | Male | Female |
| 5 to 17 Years | 27 (2.0%) | 0 (0.0%) |
| 18 to 34 Years | 0 (0.0%) | 0 (0.0%) |
| 35 to 64 Years | 22 (0.9%) | 83 (3.4%) |
| 65 to 74 Years | 52 (8.2%) | 59 (9.8%) |
| 75 Years and over | 22 (6.8%) | 68 (16.8%) |
Technology Access in Moffat County
Computing Device Access in Moffat County
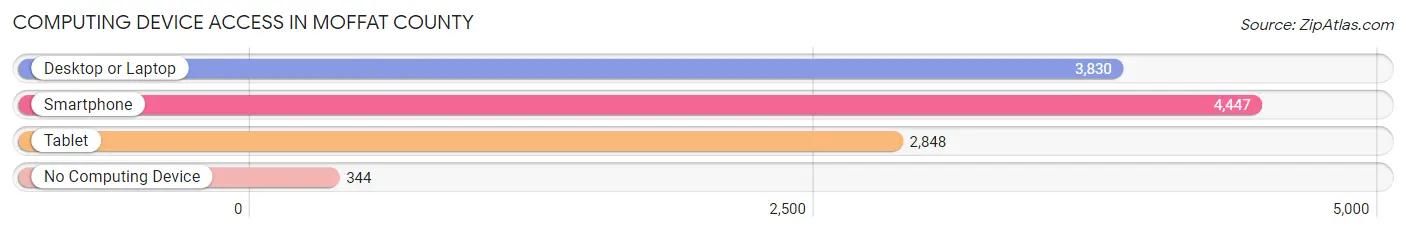
| Device Type | # Households | % Households |
| Desktop or Laptop | 3,830 | 73.8% |
| Smartphone | 4,447 | 85.7% |
| Tablet | 2,848 | 54.9% |
| No Computing Device | 344 | 6.6% |
| Total | 5,187 | 100.0% |
Internet Access in Moffat County
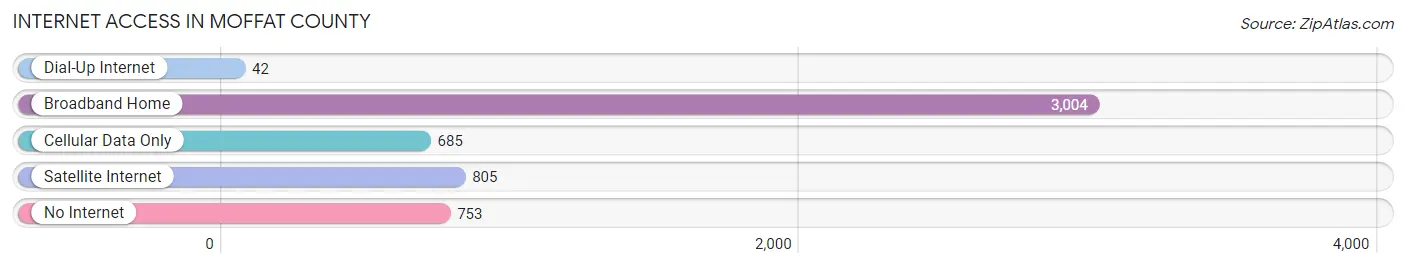
| Internet Type | # Households | % Households |
| Dial-Up Internet | 42 | 0.8% |
| Broadband Home | 3,004 | 57.9% |
| Cellular Data Only | 685 | 13.2% |
| Satellite Internet | 805 | 15.5% |
| No Internet | 753 | 14.5% |
| Total | 5,187 | 100.0% |
Moffat County Summary
Moffat County is a county located in the northwestern corner of the state of Colorado in the United States. It is the seventh-largest county in the state, with an area of 6,743 square miles (17,500 km2). As of the 2010 census, the population was 13,795. The county seat is Craig.
History
Moffat County was created in 1911 from the western half of Routt County. It was named for David H. Moffat, a prominent Colorado banker and railroad builder. The county was originally inhabited by the Ute people, who were later displaced by settlers.
Geography
Moffat County is located in the northwestern corner of Colorado, bordered by Wyoming to the north and Utah to the west. It is the seventh-largest county in the state, with an area of 6,743 square miles (17,500 km2). The county is mostly mountainous, with the Continental Divide running through the northern part of the county. The Yampa River flows through the county, and is the main source of water for the county.
The county has a semi-arid climate, with cold winters and hot summers. The average annual precipitation is 11.5 inches (290 mm).
Economy
Moffat County's economy is largely based on agriculture, mining, and tourism. The county is home to several large coal mines, which provide jobs for many of the county's residents. The county is also home to several large cattle ranches, which provide beef for the local market. Tourism is also an important part of the county's economy, with many visitors coming to the area to enjoy the outdoor activities such as hunting, fishing, and camping.
Demographics
As of the 2010 census, there were 13,795 people, 5,541 households, and 3,717 families residing in the county. The population density was 2.1 people per square mile (0.8/km2). There were 6,541 housing units at an average density of 1.0 per square mile (0.4/km2). The racial makeup of the county was 94.2% White, 0.3% Black or African American, 0.7% Native American, 0.3% Asian, 0.1% Pacific Islander, 2.7% from other races, and 1.7% from two or more races. 8.7% of the population were Hispanic or Latino of any race.
The median income for a household in the county was $41,945, and the median income for a family was $50,945. The per capita income for the county was $20,945. About 11.2% of families and 14.2% of the population were below the poverty line, including 19.2% of those under age 18 and 8.2% of those age 65 or over.
Common Questions
What is Per Capita Income in Moffat County?
Per Capita income in Moffat County is $33,019.
What is the Median Family Income in Moffat County?
Median Family Income in Moffat County is $79,722.
What is the Median Household income in Moffat County?
Median Household Income in Moffat County is $63,983.
What is Income or Wage Gap in Moffat County?
Income or Wage Gap in Moffat County is 29.3%.
Women in Moffat County earn 70.7 cents for every dollar earned by a man.
What is Family Income Deficit in Moffat County?
Family Income Deficit in Moffat County is $10,712.
Families that are below poverty line in Moffat County earn $10,712 less on average than the poverty threshold level.
What is Inequality or Gini Index in Moffat County?
Inequality or Gini Index in Moffat County is 0.44.
What is the Total Population of Moffat County?
Total Population of Moffat County is 13,232.
What is the Total Male Population of Moffat County?
Total Male Population of Moffat County is 6,702.
What is the Total Female Population of Moffat County?
Total Female Population of Moffat County is 6,530.
What is the Ratio of Males per 100 Females in Moffat County?
There are 102.63 Males per 100 Females in Moffat County.
What is the Ratio of Females per 100 Males in Moffat County?
There are 97.43 Females per 100 Males in Moffat County.
What is the Median Population Age in Moffat County?
Median Population Age in Moffat County is 37.1 Years.
What is the Average Family Size in Moffat County
Average Family Size in Moffat County is 3.0 People.
What is the Average Household Size in Moffat County
Average Household Size in Moffat County is 2.5 People.
How Large is the Labor Force in Moffat County?
There are 6,508 People in the Labor Forcein in Moffat County.
What is the Percentage of People in the Labor Force in Moffat County?
63.6% of People are in the Labor Force in Moffat County.
What is the Unemployment Rate in Moffat County?
Unemployment Rate in Moffat County is 5.4%.