Brush, CO Map & Demographics
Brush Map
Brush Overview
$29,272
PER CAPITA INCOME
$78,522
AVG FAMILY INCOME
$64,475
AVG HOUSEHOLD INCOME
53.2%
WAGE / INCOME GAP [ % ]
46.8¢/ $1
WAGE / INCOME GAP [ $ ]
0.48
INEQUALITY / GINI INDEX
5,304
TOTAL POPULATION
2,613
MALE POPULATION
2,691
FEMALE POPULATION
97.10
MALES / 100 FEMALES
102.99
FEMALES / 100 MALES
31.5
MEDIAN AGE
3.2
AVG FAMILY SIZE
2.6
AVG HOUSEHOLD SIZE
2,423
LABOR FORCE [ PEOPLE ]
61.4%
PERCENT IN LABOR FORCE
3.9%
UNEMPLOYMENT RATE
Brush Zip Codes
Brush Area Codes
Income in Brush
Income Overview in Brush
Per Capita Income in Brush is $29,272, while median incomes of families and households are $78,522 and $64,475 respectively.
| Characteristic | Number | Measure |
| Per Capita Income | 5,304 | $29,272 |
| Median Family Income | 1,292 | $78,522 |
| Mean Family Income | 1,292 | $98,864 |
| Median Household Income | 1,917 | $64,475 |
| Mean Household Income | 1,917 | $78,488 |
| Income Deficit | 1,292 | $0 |
| Wage / Income Gap (%) | 5,304 | 53.20% |
| Wage / Income Gap ($) | 5,304 | 46.80¢ per $1 |
| Gini / Inequality Index | 5,304 | 0.48 |
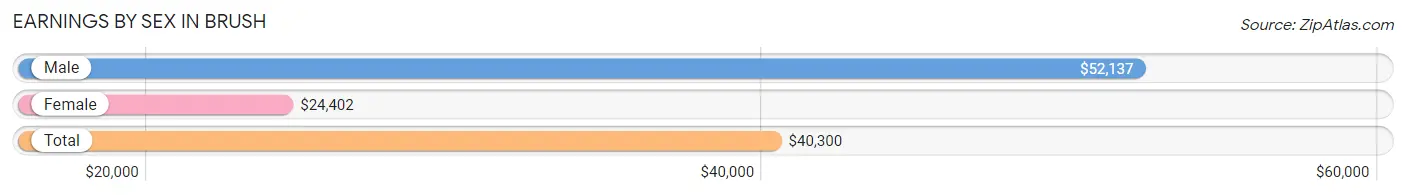
Earnings by Sex in Brush
Average Earnings in Brush are $40,300, $52,137 for men and $24,402 for women, a difference of 53.2%.
| Sex | Number | Average Earnings |
| Male | 1,376 (54.3%) | $52,137 |
| Female | 1,160 (45.7%) | $24,402 |
| Total | 2,536 (100.0%) | $40,300 |
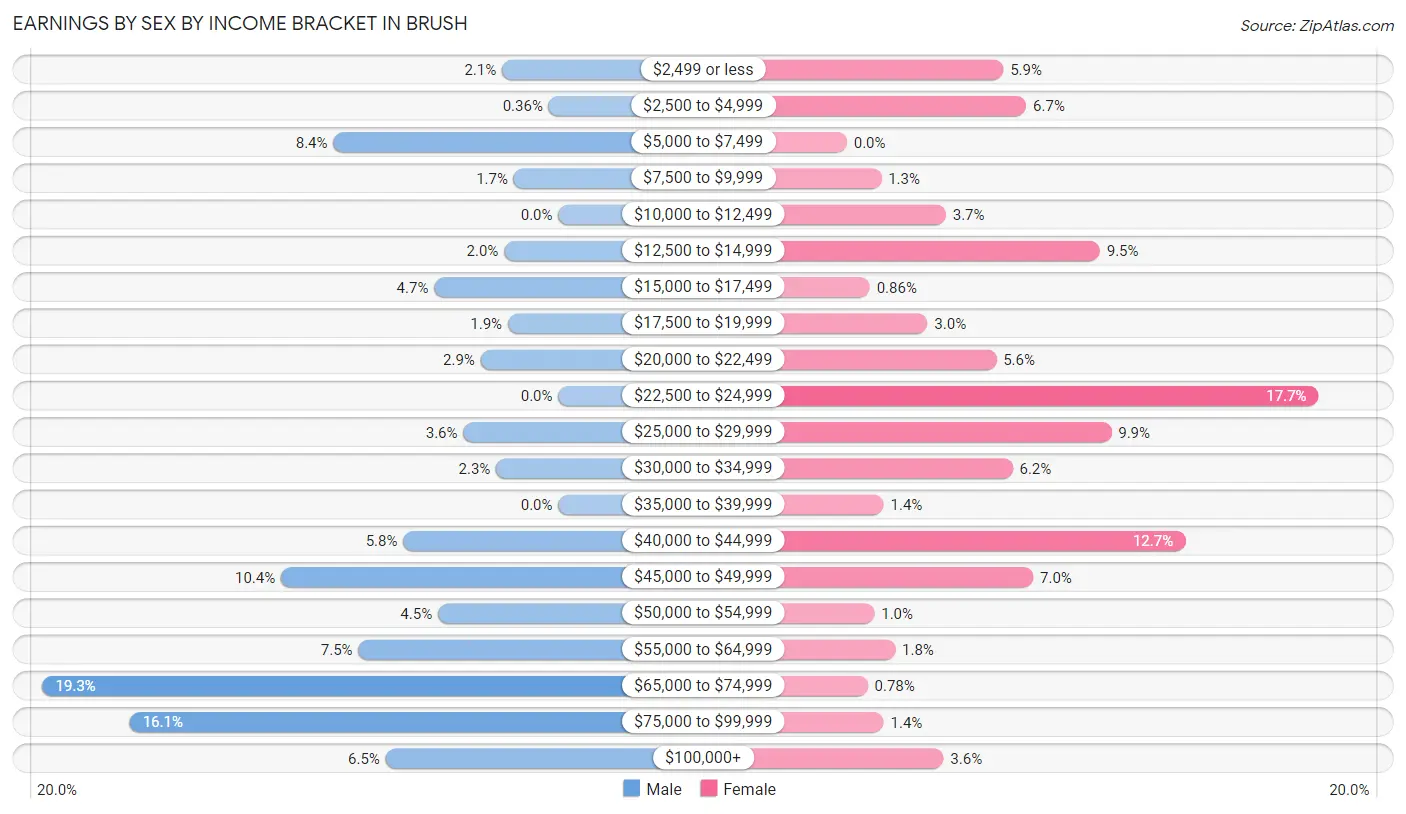
Earnings by Sex by Income Bracket in Brush
The most common earnings brackets in Brush are $65,000 to $74,999 for men (266 | 19.3%) and $22,500 to $24,999 for women (205 | 17.7%).
| Income | Male | Female |
| $2,499 or less | 29 (2.1%) | 68 (5.9%) |
| $2,500 to $4,999 | 5 (0.4%) | 78 (6.7%) |
| $5,000 to $7,499 | 116 (8.4%) | 0 (0.0%) |
| $7,500 to $9,999 | 23 (1.7%) | 15 (1.3%) |
| $10,000 to $12,499 | 0 (0.0%) | 43 (3.7%) |
| $12,500 to $14,999 | 28 (2.0%) | 110 (9.5%) |
| $15,000 to $17,499 | 64 (4.6%) | 10 (0.9%) |
| $17,500 to $19,999 | 26 (1.9%) | 35 (3.0%) |
| $20,000 to $22,499 | 40 (2.9%) | 65 (5.6%) |
| $22,500 to $24,999 | 0 (0.0%) | 205 (17.7%) |
| $25,000 to $29,999 | 49 (3.6%) | 115 (9.9%) |
| $30,000 to $34,999 | 32 (2.3%) | 72 (6.2%) |
| $35,000 to $39,999 | 0 (0.0%) | 16 (1.4%) |
| $40,000 to $44,999 | 80 (5.8%) | 147 (12.7%) |
| $45,000 to $49,999 | 143 (10.4%) | 81 (7.0%) |
| $50,000 to $54,999 | 62 (4.5%) | 12 (1.0%) |
| $55,000 to $64,999 | 103 (7.5%) | 21 (1.8%) |
| $65,000 to $74,999 | 266 (19.3%) | 9 (0.8%) |
| $75,000 to $99,999 | 221 (16.1%) | 16 (1.4%) |
| $100,000+ | 89 (6.5%) | 42 (3.6%) |
| Total | 1,376 (100.0%) | 1,160 (100.0%) |
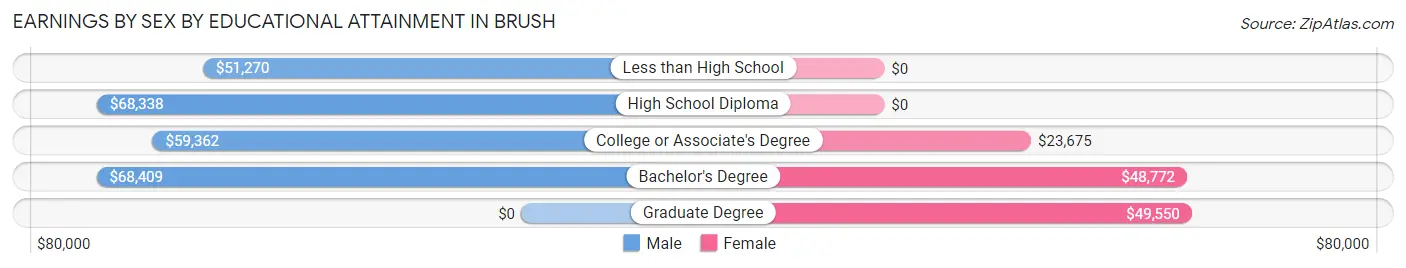
Earnings by Sex by Educational Attainment in Brush
Average earnings in Brush are $61,576 for men and $27,752 for women, a difference of 54.9%. Men with an educational attainment of bachelor's degree enjoy the highest average annual earnings of $68,409, while those with less than high school education earn the least with $51,270. Women with an educational attainment of graduate degree earn the most with the average annual earnings of $49,550, while those with college or associate's degree education have the smallest earnings of $23,675.
| Educational Attainment | Male Income | Female Income |
| Less than High School | $51,270 | $0 |
| High School Diploma | $68,338 | $0 |
| College or Associate's Degree | $59,362 | $23,675 |
| Bachelor's Degree | $68,409 | $48,772 |
| Graduate Degree | - | - |
| Total | $61,576 | $27,752 |
Family Income in Brush
Family Income Brackets in Brush
According to the Brush family income data, there are 339 families falling into the $50,000 to $74,999 income range, which is the most common income bracket and makes up 26.2% of all families. Conversely, the less than $10,000 income bracket is the least frequent group with only 16 families (1.2%) belonging to this category.
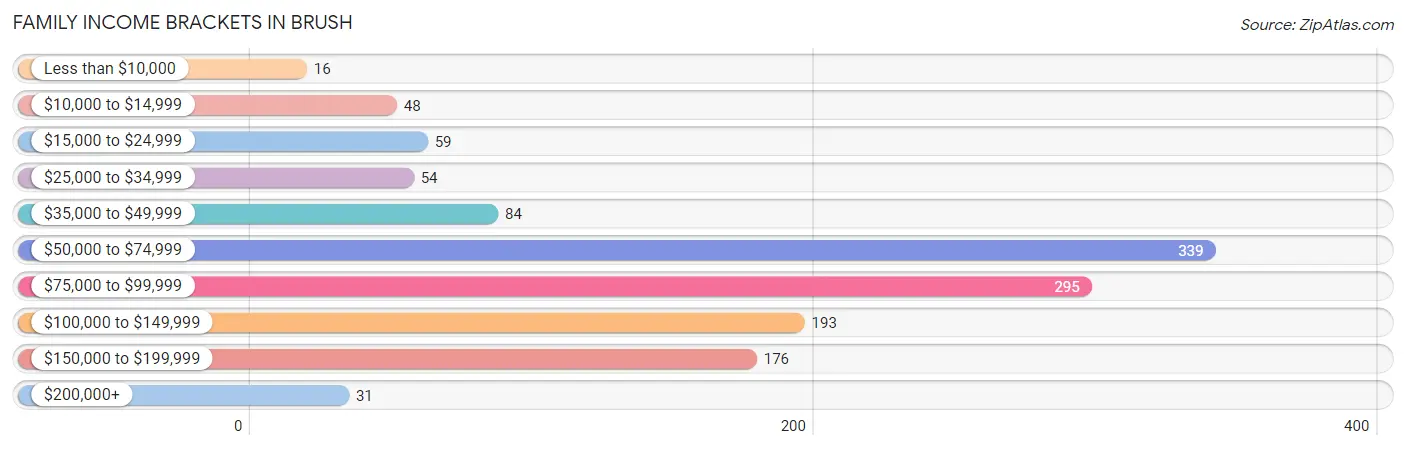
| Income Bracket | # Families | % Families |
| Less than $10,000 | 16 | 1.2% |
| $10,000 to $14,999 | 48 | 3.7% |
| $15,000 to $24,999 | 59 | 4.6% |
| $25,000 to $34,999 | 54 | 4.2% |
| $35,000 to $49,999 | 84 | 6.5% |
| $50,000 to $74,999 | 339 | 26.2% |
| $75,000 to $99,999 | 295 | 22.8% |
| $100,000 to $149,999 | 193 | 14.9% |
| $150,000 to $199,999 | 176 | 13.6% |
| $200,000+ | 31 | 2.4% |
Family Income by Famaliy Size in Brush
4-person families (320 | 24.8%) account for the highest median family income in Brush with $106,250 per family, while 2-person families (415 | 32.1%) have the highest median income of $30,586 per family member.
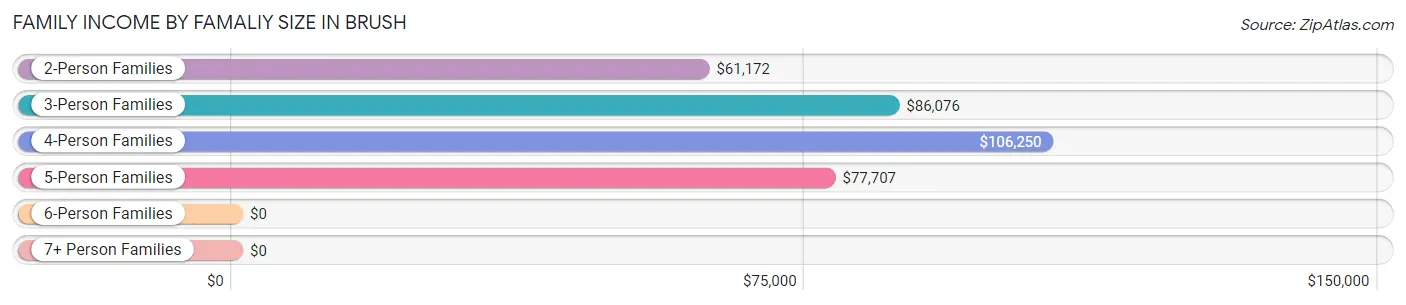
| Income Bracket | # Families | Median Income |
| 2-Person Families | 415 (32.1%) | $61,172 |
| 3-Person Families | 245 (19.0%) | $86,076 |
| 4-Person Families | 320 (24.8%) | $106,250 |
| 5-Person Families | 211 (16.3%) | $77,707 |
| 6-Person Families | 101 (7.8%) | $0 |
| 7+ Person Families | 0 (0.0%) | $0 |
| Total | 1,292 (100.0%) | $78,522 |
Family Income by Number of Earners in Brush
The median family income in Brush is $78,522, with families comprising 3+ earners (236) having the highest median family income of $108,682, while families with no earners (197) have the lowest median family income of $39,089, accounting for 18.3% and 15.2% of families, respectively.
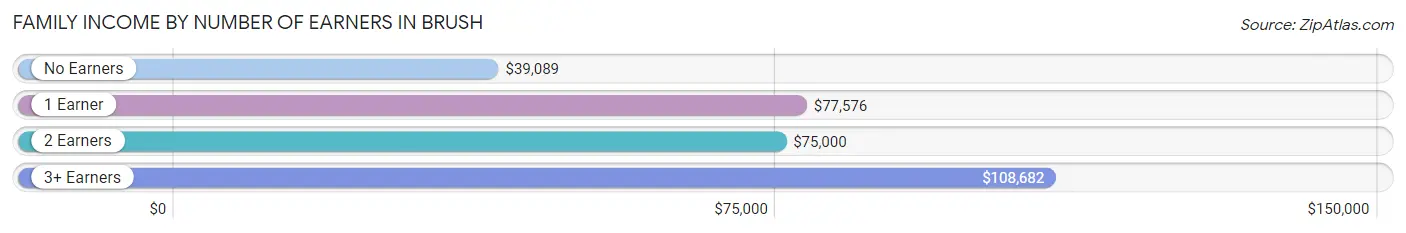
| Number of Earners | # Families | Median Income |
| No Earners | 197 (15.2%) | $39,089 |
| 1 Earner | 327 (25.3%) | $77,576 |
| 2 Earners | 532 (41.2%) | $75,000 |
| 3+ Earners | 236 (18.3%) | $108,682 |
| Total | 1,292 (100.0%) | $78,522 |
Household Income in Brush
Household Income Brackets in Brush
With 330 households falling in the category, the $50,000 to $74,999 income range is the most frequent in Brush, accounting for 17.2% of all households. In contrast, only 42 households (2.2%) fall into the $200,000+ income bracket, making it the least populous group.
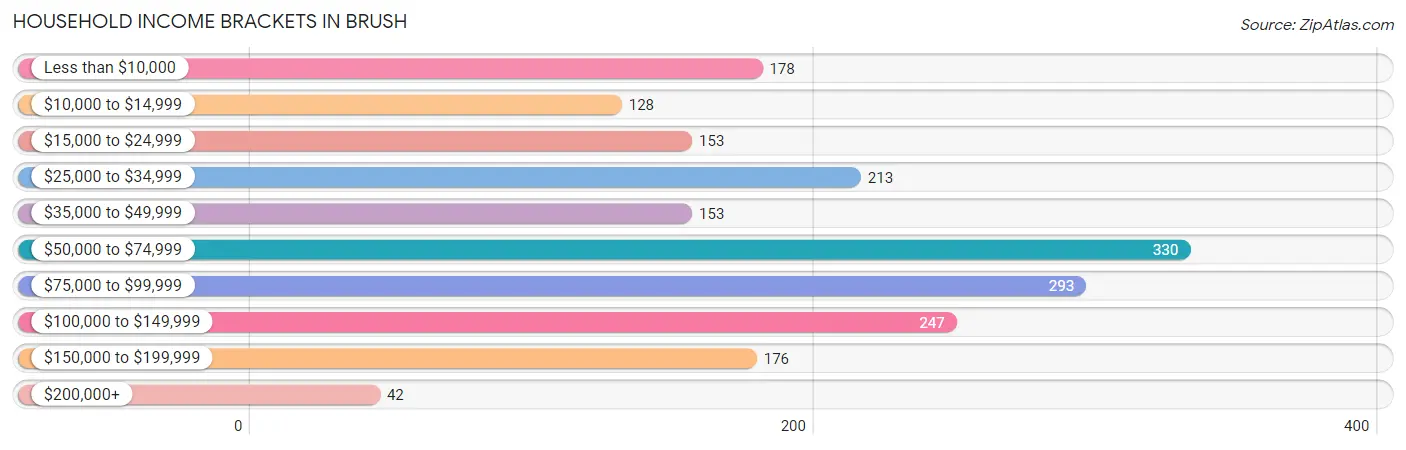
| Income Bracket | # Households | % Households |
| Less than $10,000 | 178 | 9.3% |
| $10,000 to $14,999 | 128 | 6.7% |
| $15,000 to $24,999 | 153 | 8.0% |
| $25,000 to $34,999 | 213 | 11.1% |
| $35,000 to $49,999 | 153 | 8.0% |
| $50,000 to $74,999 | 330 | 17.2% |
| $75,000 to $99,999 | 293 | 15.3% |
| $100,000 to $149,999 | 247 | 12.9% |
| $150,000 to $199,999 | 176 | 9.2% |
| $200,000+ | 42 | 2.2% |
Household Income by Householder Age in Brush
The median household income in Brush is $64,475, with the highest median household income of $99,970 found in the 45 to 64 years age bracket for the primary householder. A total of 599 households (31.2%) fall into this category. Meanwhile, the 15 to 24 years age bracket for the primary householder has the lowest median household income of $0, with 175 households (9.1%) in this group.
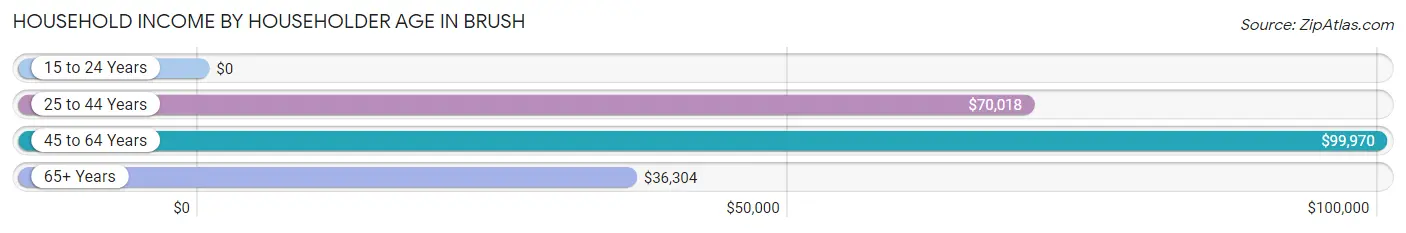
| Income Bracket | # Households | Median Income |
| 15 to 24 Years | 175 (9.1%) | $0 |
| 25 to 44 Years | 659 (34.4%) | $70,018 |
| 45 to 64 Years | 599 (31.2%) | $99,970 |
| 65+ Years | 484 (25.3%) | $36,304 |
| Total | 1,917 (100.0%) | $64,475 |
Poverty in Brush
Income Below Poverty by Sex and Age in Brush
With 10.9% poverty level for males and 21.1% for females among the residents of Brush, 35 to 44 year old males and 5 year old females are the most vulnerable to poverty, with 94 males (29.5%) and 40 females (44.0%) in their respective age groups living below the poverty level.
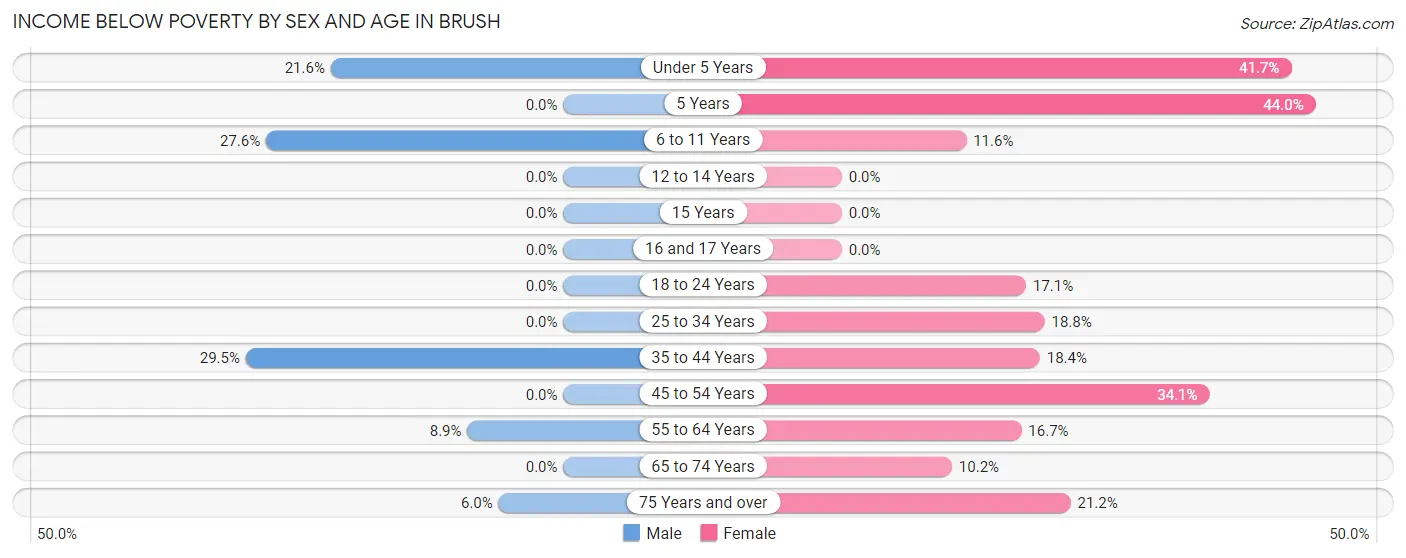
| Age Bracket | Male | Female |
| Under 5 Years | 65 (21.6%) | 68 (41.7%) |
| 5 Years | 0 (0.0%) | 40 (44.0%) |
| 6 to 11 Years | 80 (27.6%) | 35 (11.6%) |
| 12 to 14 Years | 0 (0.0%) | 0 (0.0%) |
| 15 Years | 0 (0.0%) | 0 (0.0%) |
| 16 and 17 Years | 0 (0.0%) | 0 (0.0%) |
| 18 to 24 Years | 0 (0.0%) | 59 (17.1%) |
| 25 to 34 Years | 0 (0.0%) | 83 (18.8%) |
| 35 to 44 Years | 94 (29.5%) | 34 (18.4%) |
| 45 to 54 Years | 0 (0.0%) | 117 (34.1%) |
| 55 to 64 Years | 23 (8.9%) | 31 (16.7%) |
| 65 to 74 Years | 0 (0.0%) | 14 (10.2%) |
| 75 Years and over | 14 (6.0%) | 45 (21.2%) |
| Total | 276 (10.9%) | 526 (21.1%) |
Income Above Poverty by Sex and Age in Brush
According to the poverty statistics in Brush, males aged 5 years and females aged 12 to 14 years are the age groups that are most secure financially, with 100.0% of males and 100.0% of females in these age groups living above the poverty line.
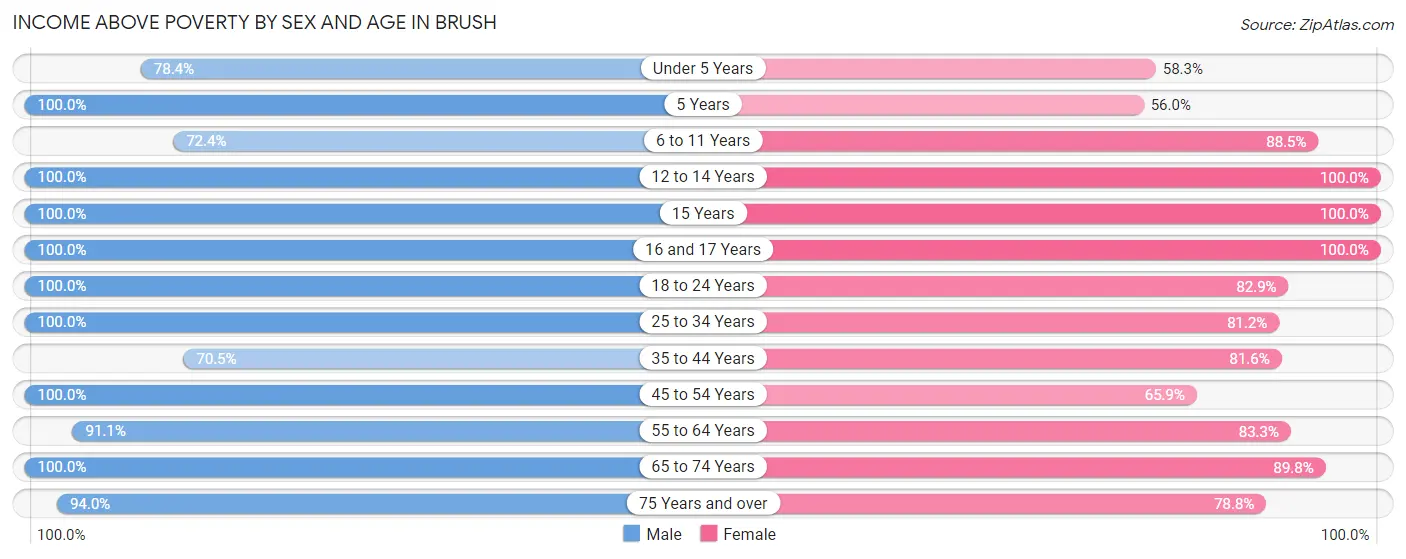
| Age Bracket | Male | Female |
| Under 5 Years | 236 (78.4%) | 95 (58.3%) |
| 5 Years | 22 (100.0%) | 51 (56.0%) |
| 6 to 11 Years | 210 (72.4%) | 268 (88.4%) |
| 12 to 14 Years | 85 (100.0%) | 27 (100.0%) |
| 15 Years | 42 (100.0%) | 33 (100.0%) |
| 16 and 17 Years | 96 (100.0%) | 30 (100.0%) |
| 18 to 24 Years | 262 (100.0%) | 286 (82.9%) |
| 25 to 34 Years | 326 (100.0%) | 358 (81.2%) |
| 35 to 44 Years | 225 (70.5%) | 151 (81.6%) |
| 45 to 54 Years | 194 (100.0%) | 226 (65.9%) |
| 55 to 64 Years | 235 (91.1%) | 155 (83.3%) |
| 65 to 74 Years | 110 (100.0%) | 123 (89.8%) |
| 75 Years and over | 219 (94.0%) | 167 (78.8%) |
| Total | 2,262 (89.1%) | 1,970 (78.9%) |
Income Below Poverty Among Married-Couple Families in Brush
The poverty statistics for married-couple families in Brush show that 2.9% or 28 of the total 970 families live below the poverty line. Families with 3 or 4 children have the highest poverty rate of 9.7%, comprising of 28 families. On the other hand, families with no children have the lowest poverty rate of 0.0%, which includes 0 families.
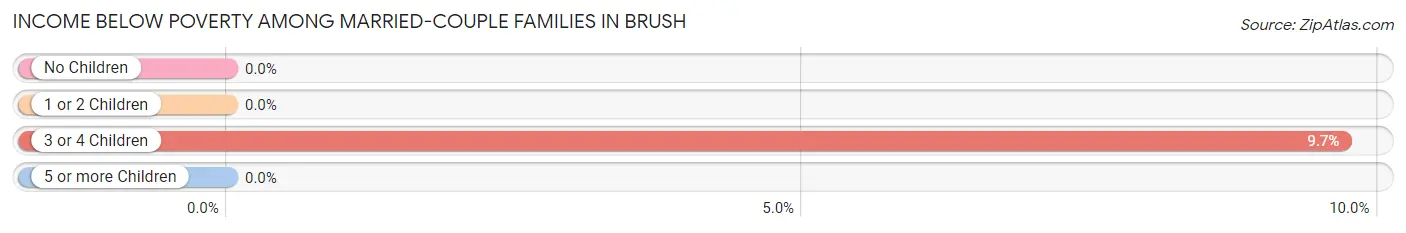
| Children | Above Poverty | Below Poverty |
| No Children | 339 (100.0%) | 0 (0.0%) |
| 1 or 2 Children | 342 (100.0%) | 0 (0.0%) |
| 3 or 4 Children | 261 (90.3%) | 28 (9.7%) |
| 5 or more Children | 0 (0.0%) | 0 (0.0%) |
| Total | 942 (97.1%) | 28 (2.9%) |
Income Below Poverty Among Single-Parent Households in Brush
According to the poverty data in Brush, 9.1% or 14 single-father households and 63.9% or 108 single-mother households are living below the poverty line. Among single-father households, those with no children have the highest poverty rate, with 14 households (20.3%) experiencing poverty. Likewise, among single-mother households, those with 3 or 4 children have the highest poverty rate, with 59 households (100.0%) falling below the poverty line.
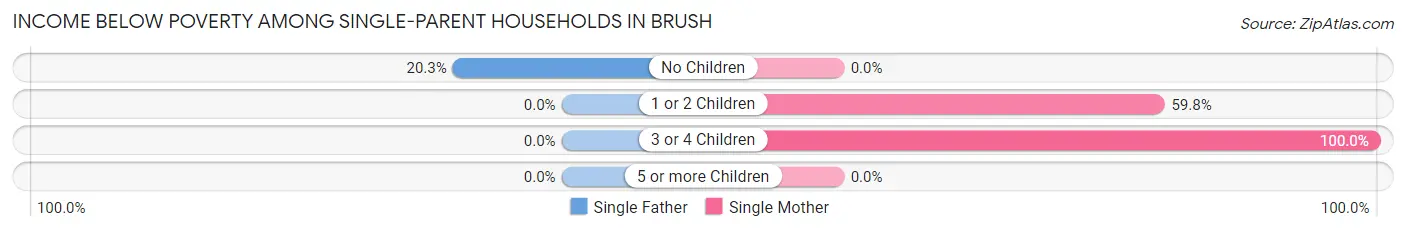
| Children | Single Father | Single Mother |
| No Children | 14 (20.3%) | 0 (0.0%) |
| 1 or 2 Children | 0 (0.0%) | 49 (59.8%) |
| 3 or 4 Children | 0 (0.0%) | 59 (100.0%) |
| 5 or more Children | 0 (0.0%) | 0 (0.0%) |
| Total | 14 (9.1%) | 108 (63.9%) |
Income Below Poverty Among Married-Couple vs Single-Parent Households in Brush
The poverty data for Brush shows that 28 of the married-couple family households (2.9%) and 122 of the single-parent households (37.9%) are living below the poverty level. Within the married-couple family households, those with 3 or 4 children have the highest poverty rate, with 28 households (9.7%) falling below the poverty line. Among the single-parent households, those with 3 or 4 children have the highest poverty rate, with 59 household (100.0%) living below poverty.
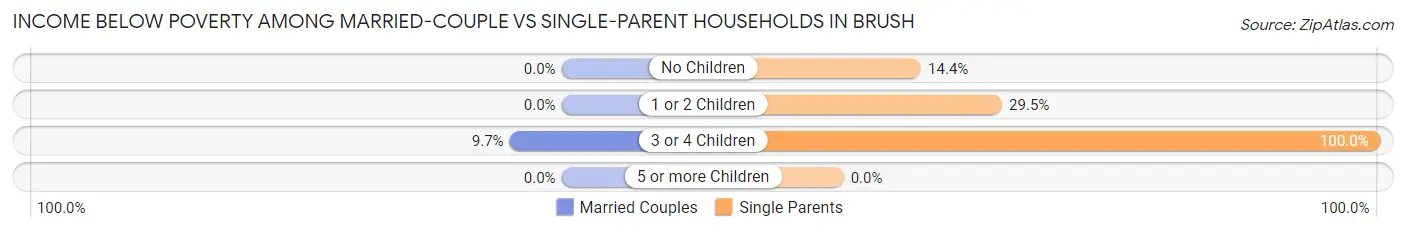
| Children | Married-Couple Families | Single-Parent Households |
| No Children | 0 (0.0%) | 14 (14.4%) |
| 1 or 2 Children | 0 (0.0%) | 49 (29.5%) |
| 3 or 4 Children | 28 (9.7%) | 59 (100.0%) |
| 5 or more Children | 0 (0.0%) | 0 (0.0%) |
| Total | 28 (2.9%) | 122 (37.9%) |
Race in Brush
The most populous races in Brush are White / Caucasian (4,558 | 85.9%), Hispanic or Latino (1,774 | 33.5%), and Two or more Races (631 | 11.9%).
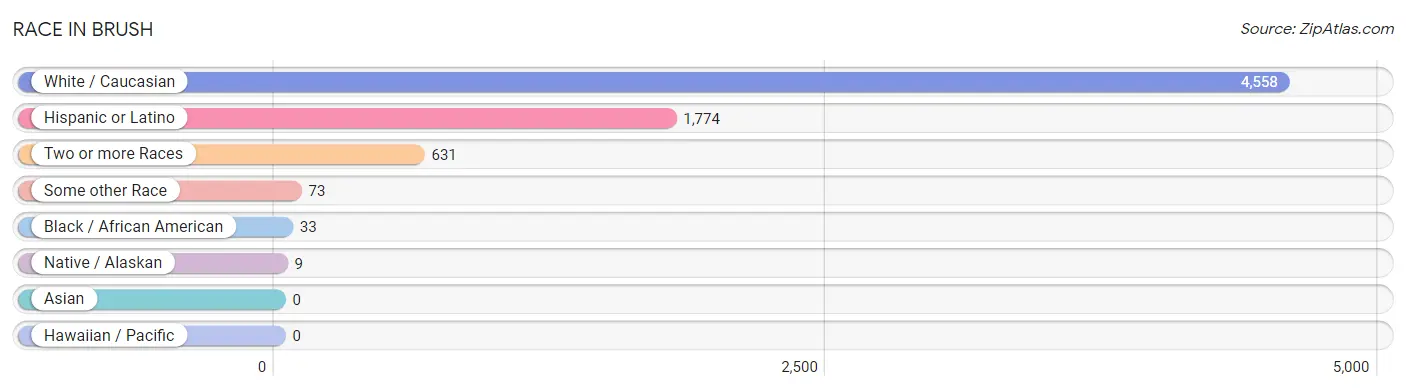
| Race | # Population | % Population |
| Asian | 0 | 0.0% |
| Black / African American | 33 | 0.6% |
| Hawaiian / Pacific | 0 | 0.0% |
| Hispanic or Latino | 1,774 | 33.5% |
| Native / Alaskan | 9 | 0.2% |
| White / Caucasian | 4,558 | 85.9% |
| Two or more Races | 631 | 11.9% |
| Some other Race | 73 | 1.4% |
| Total | 5,304 | 100.0% |
Ancestry in Brush
The most populous ancestries reported in Brush are Mexican (1,541 | 29.0%), German (1,484 | 28.0%), American (681 | 12.8%), Irish (439 | 8.3%), and English (331 | 6.2%), together accounting for 84.4% of all Brush residents.
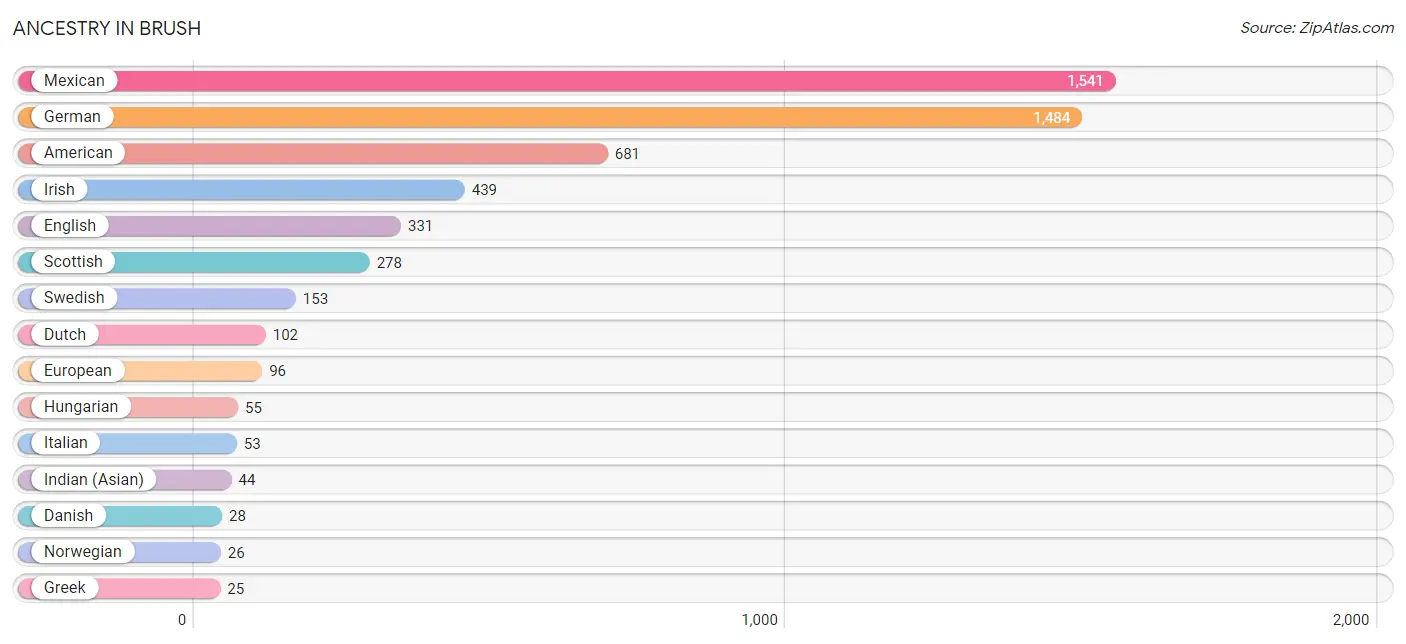
| Ancestry | # Population | % Population |
| American | 681 | 12.8% |
| Belgian | 5 | 0.1% |
| Blackfeet | 12 | 0.2% |
| Central American | 8 | 0.2% |
| Danish | 28 | 0.5% |
| Dutch | 102 | 1.9% |
| English | 331 | 6.2% |
| European | 96 | 1.8% |
| French | 10 | 0.2% |
| German | 1,484 | 28.0% |
| Greek | 25 | 0.5% |
| Guatemalan | 8 | 0.2% |
| Hungarian | 55 | 1.0% |
| Indian (Asian) | 44 | 0.8% |
| Irish | 439 | 8.3% |
| Italian | 53 | 1.0% |
| Luxembourger | 5 | 0.1% |
| Mexican | 1,541 | 29.0% |
| Northern European | 13 | 0.3% |
| Norwegian | 26 | 0.5% |
| Polish | 25 | 0.5% |
| Russian | 12 | 0.2% |
| Scottish | 278 | 5.2% |
| Swedish | 153 | 2.9% |
| Welsh | 10 | 0.2% | View All 25 Rows |
Immigrants in Brush
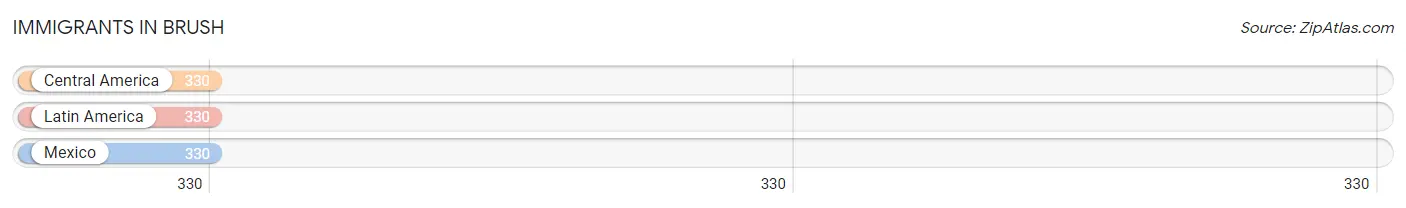
The most numerous immigrant groups reported in Brush came from Central America (330 | 6.2%), Latin America (330 | 6.2%), and Mexico (330 | 6.2%), together accounting for 18.7% of all Brush residents.
| Immigration Origin | # Population | % Population |
| Central America | 330 | 6.2% |
| Latin America | 330 | 6.2% |
| Mexico | 330 | 6.2% | View All 3 Rows |
Sex and Age in Brush
Sex and Age in Brush
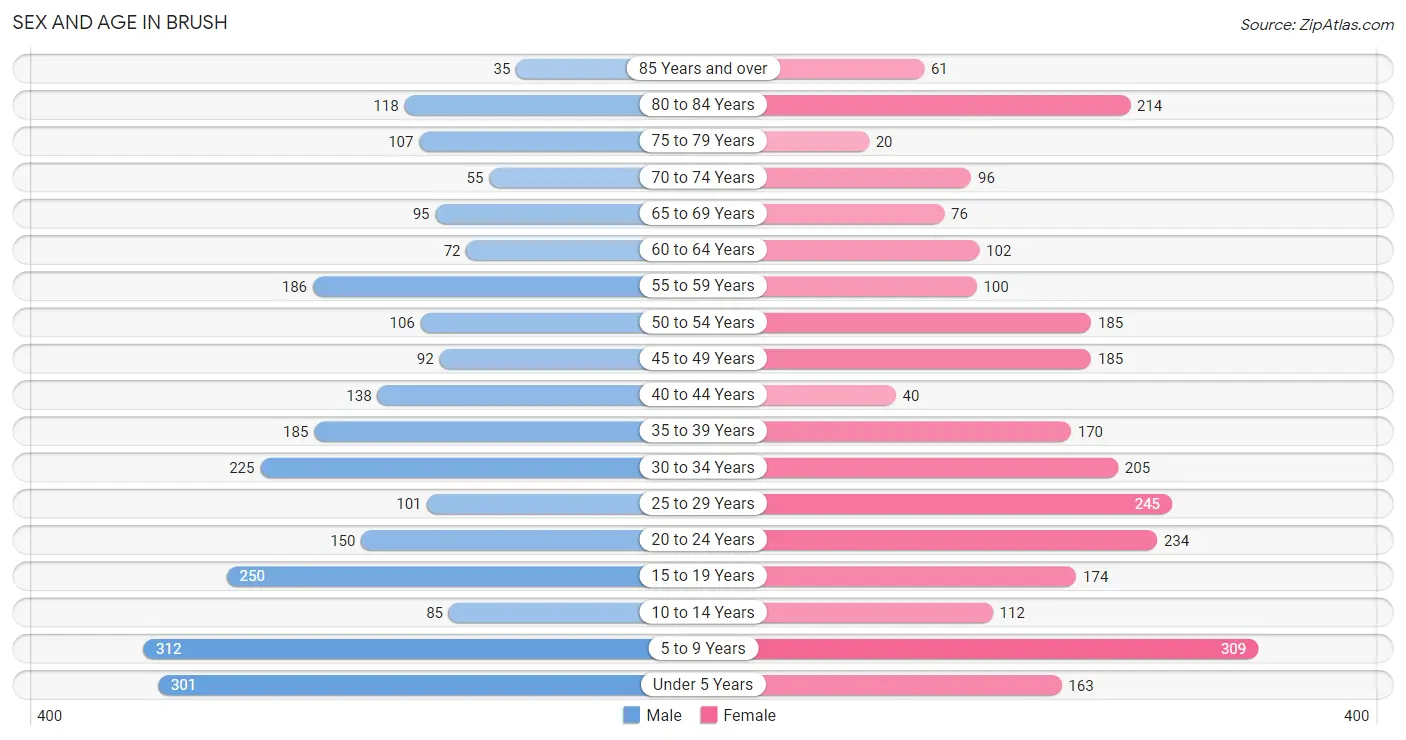
The most populous age groups in Brush are 5 to 9 Years (312 | 11.9%) for men and 5 to 9 Years (309 | 11.5%) for women.
| Age Bracket | Male | Female |
| Under 5 Years | 301 (11.5%) | 163 (6.1%) |
| 5 to 9 Years | 312 (11.9%) | 309 (11.5%) |
| 10 to 14 Years | 85 (3.3%) | 112 (4.2%) |
| 15 to 19 Years | 250 (9.6%) | 174 (6.5%) |
| 20 to 24 Years | 150 (5.7%) | 234 (8.7%) |
| 25 to 29 Years | 101 (3.9%) | 245 (9.1%) |
| 30 to 34 Years | 225 (8.6%) | 205 (7.6%) |
| 35 to 39 Years | 185 (7.1%) | 170 (6.3%) |
| 40 to 44 Years | 138 (5.3%) | 40 (1.5%) |
| 45 to 49 Years | 92 (3.5%) | 185 (6.9%) |
| 50 to 54 Years | 106 (4.1%) | 185 (6.9%) |
| 55 to 59 Years | 186 (7.1%) | 100 (3.7%) |
| 60 to 64 Years | 72 (2.8%) | 102 (3.8%) |
| 65 to 69 Years | 95 (3.6%) | 76 (2.8%) |
| 70 to 74 Years | 55 (2.1%) | 96 (3.6%) |
| 75 to 79 Years | 107 (4.1%) | 20 (0.7%) |
| 80 to 84 Years | 118 (4.5%) | 214 (8.0%) |
| 85 Years and over | 35 (1.3%) | 61 (2.3%) |
| Total | 2,613 (100.0%) | 2,691 (100.0%) |
Families and Households in Brush
Median Family Size in Brush
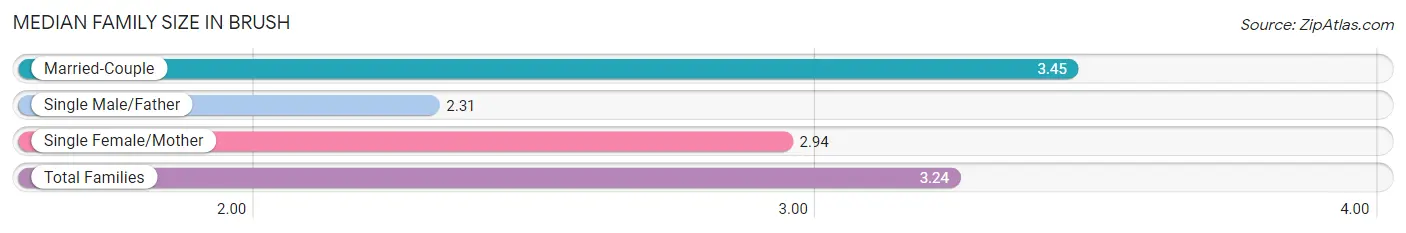
The median family size in Brush is 3.24 persons per family, with married-couple families (970 | 75.1%) accounting for the largest median family size of 3.45 persons per family. On the other hand, single male/father families (153 | 11.8%) represent the smallest median family size with 2.31 persons per family.
| Family Type | # Families | Family Size |
| Married-Couple | 970 (75.1%) | 3.45 |
| Single Male/Father | 153 (11.8%) | 2.31 |
| Single Female/Mother | 169 (13.1%) | 2.94 |
| Total Families | 1,292 (100.0%) | 3.24 |
Median Household Size in Brush
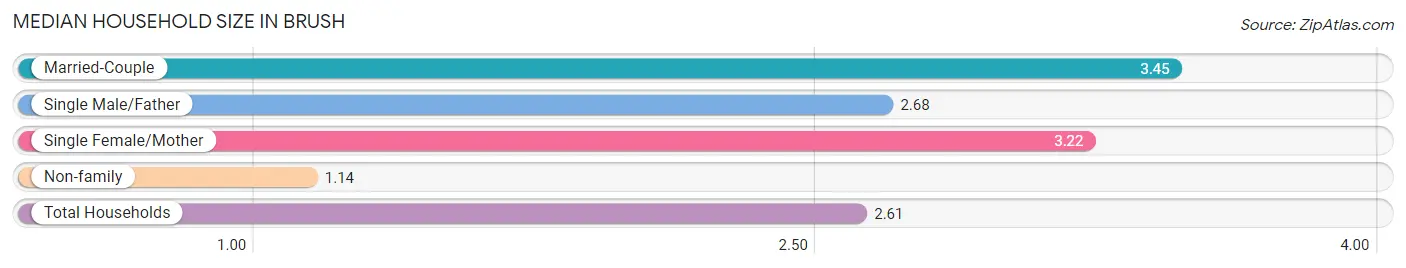
The median household size in Brush is 2.61 persons per household, with married-couple households (970 | 50.6%) accounting for the largest median household size of 3.45 persons per household. non-family households (625 | 32.6%) represent the smallest median household size with 1.14 persons per household.
| Household Type | # Households | Household Size |
| Married-Couple | 970 (50.6%) | 3.45 |
| Single Male/Father | 153 (8.0%) | 2.68 |
| Single Female/Mother | 169 (8.8%) | 3.22 |
| Non-family | 625 (32.6%) | 1.14 |
| Total Households | 1,917 (100.0%) | 2.61 |
Household Size by Marriage Status in Brush
Out of a total of 1,917 households in Brush, 1,292 (67.4%) are family households, while 625 (32.6%) are nonfamily households. The most numerous type of family households are 4-person households, comprising 403, and the most common type of nonfamily households are 1-person households, comprising 590.
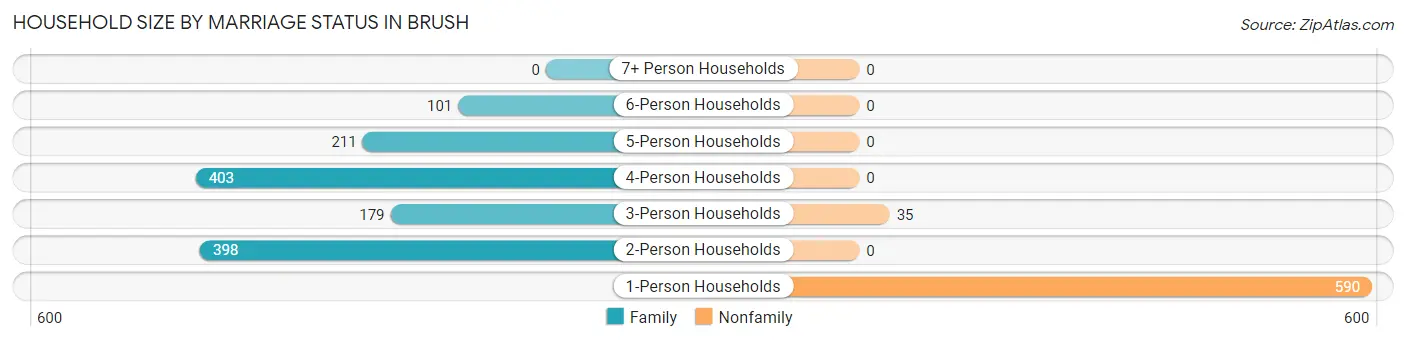
| Household Size | Family Households | Nonfamily Households |
| 1-Person Households | - | 590 (30.8%) |
| 2-Person Households | 398 (20.8%) | 0 (0.0%) |
| 3-Person Households | 179 (9.3%) | 35 (1.8%) |
| 4-Person Households | 403 (21.0%) | 0 (0.0%) |
| 5-Person Households | 211 (11.0%) | 0 (0.0%) |
| 6-Person Households | 101 (5.3%) | 0 (0.0%) |
| 7+ Person Households | 0 (0.0%) | 0 (0.0%) |
| Total | 1,292 (67.4%) | 625 (32.6%) |
Female Fertility in Brush
Fertility by Age in Brush
Average fertility rate in Brush is 80.0 births per 1,000 women. Women in the age bracket of 20 to 34 years have the highest fertility rate with 152.0 births per 1,000 women. Women in the age bracket of 20 to 34 years acount for 100.0% of all women with births.
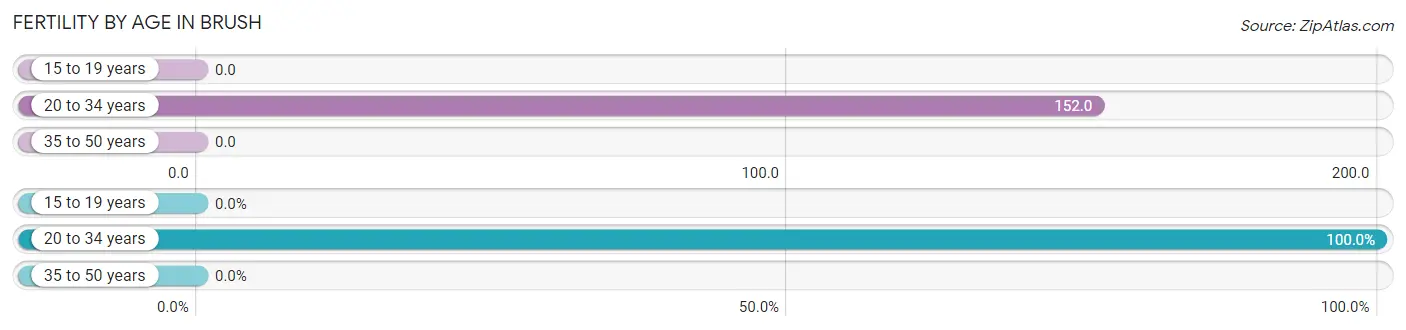
| Age Bracket | Women with Births | Births / 1,000 Women |
| 15 to 19 years | 0 (0.0%) | 0.0 |
| 20 to 34 years | 104 (100.0%) | 152.0 |
| 35 to 50 years | 0 (0.0%) | 0.0 |
| Total | 104 (100.0%) | 80.0 |
Fertility by Age by Marriage Status in Brush
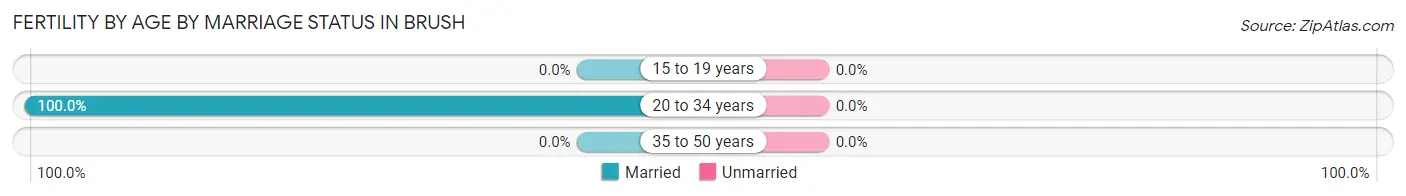
| Age Bracket | Married | Unmarried |
| 15 to 19 years | 0 (0.0%) | 0 (0.0%) |
| 20 to 34 years | 104 (100.0%) | 0 (0.0%) |
| 35 to 50 years | 0 (0.0%) | 0 (0.0%) |
| Total | 104 (100.0%) | 0 (0.0%) |
Fertility by Education in Brush
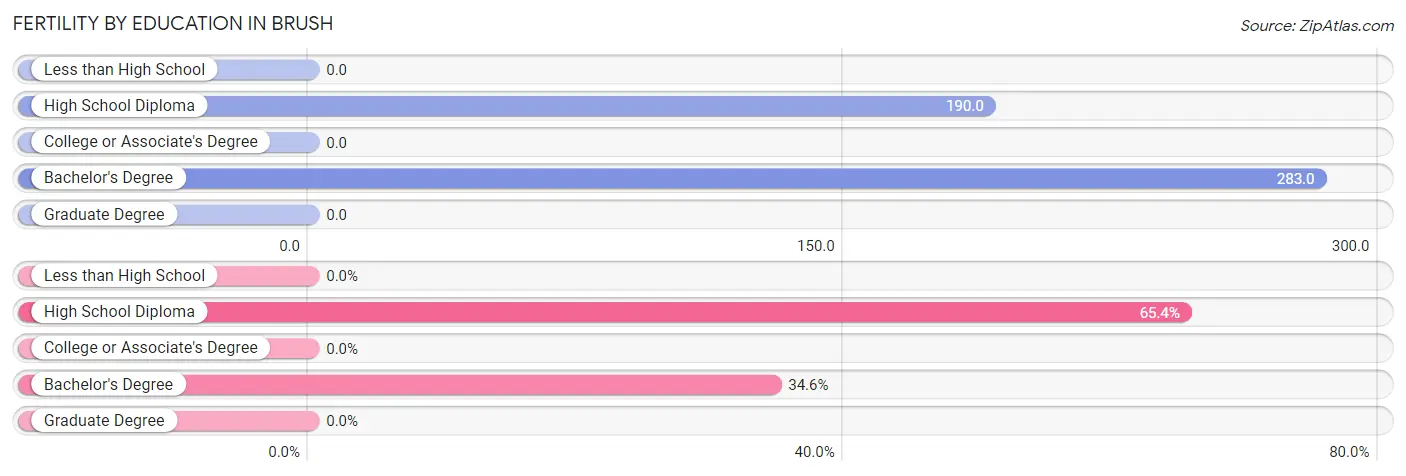
| Educational Attainment | Women with Births | Births / 1,000 Women |
| Less than High School | 0 (0.0%) | 0.0 |
| High School Diploma | 68 (65.4%) | 190.0 |
| College or Associate's Degree | 0 (0.0%) | 0.0 |
| Bachelor's Degree | 36 (34.6%) | 283.0 |
| Graduate Degree | 0 (0.0%) | 0.0 |
| Total | 104 (100.0%) | 80.0 |
Fertility by Education by Marriage Status in Brush
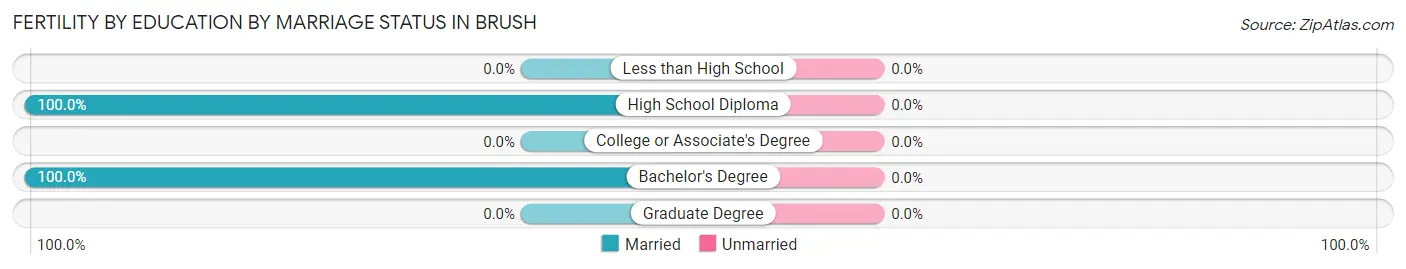
| Educational Attainment | Married | Unmarried |
| Less than High School | 0 (0.0%) | 0 (0.0%) |
| High School Diploma | 68 (100.0%) | 0 (0.0%) |
| College or Associate's Degree | 0 (0.0%) | 0 (0.0%) |
| Bachelor's Degree | 36 (100.0%) | 0 (0.0%) |
| Graduate Degree | 0 (0.0%) | 0 (0.0%) |
| Total | 104 (100.0%) | 0 (0.0%) |
Employment Characteristics in Brush
Employment by Class of Employer in Brush
Among the 2,158 employed individuals in Brush, private company employees (1,302 | 60.3%), local government employees (354 | 16.4%), and not-for-profit organizations (270 | 12.5%) make up the most common classes of employment.
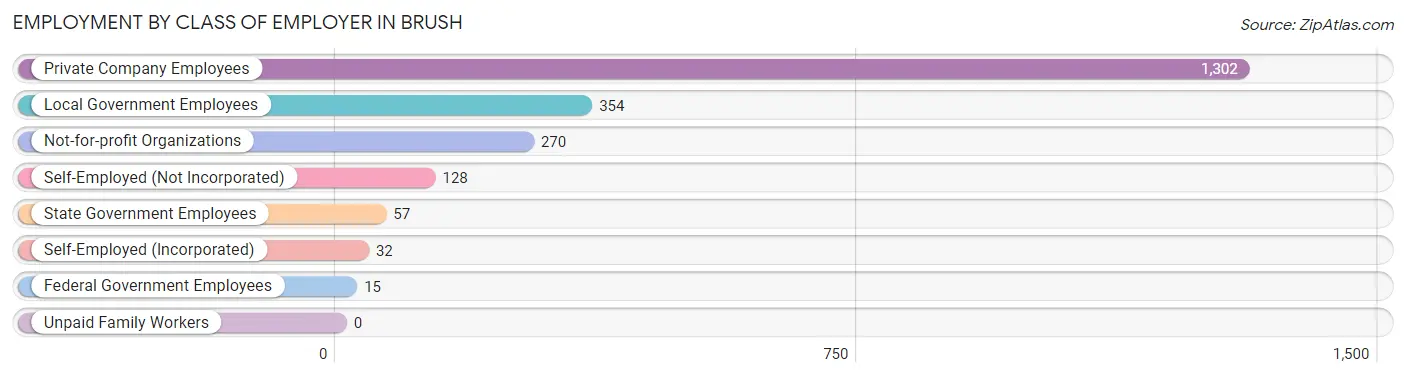
| Employer Class | # Employees | % Employees |
| Private Company Employees | 1,302 | 60.3% |
| Self-Employed (Incorporated) | 32 | 1.5% |
| Self-Employed (Not Incorporated) | 128 | 5.9% |
| Not-for-profit Organizations | 270 | 12.5% |
| Local Government Employees | 354 | 16.4% |
| State Government Employees | 57 | 2.6% |
| Federal Government Employees | 15 | 0.7% |
| Unpaid Family Workers | 0 | 0.0% |
| Total | 2,158 | 100.0% |
Employment Status by Age in Brush
According to the labor force statistics for Brush, out of the total population over 16 years of age (3,947), 61.4% or 2,423 individuals are in the labor force, with 3.9% or 94 of them unemployed. The age group with the highest labor force participation rate is 20 to 24 years, with 100.0% or 384 individuals in the labor force. Within the labor force, the 20 to 24 years age range has the highest percentage of unemployed individuals, with 12.2% or 47 of them being unemployed.
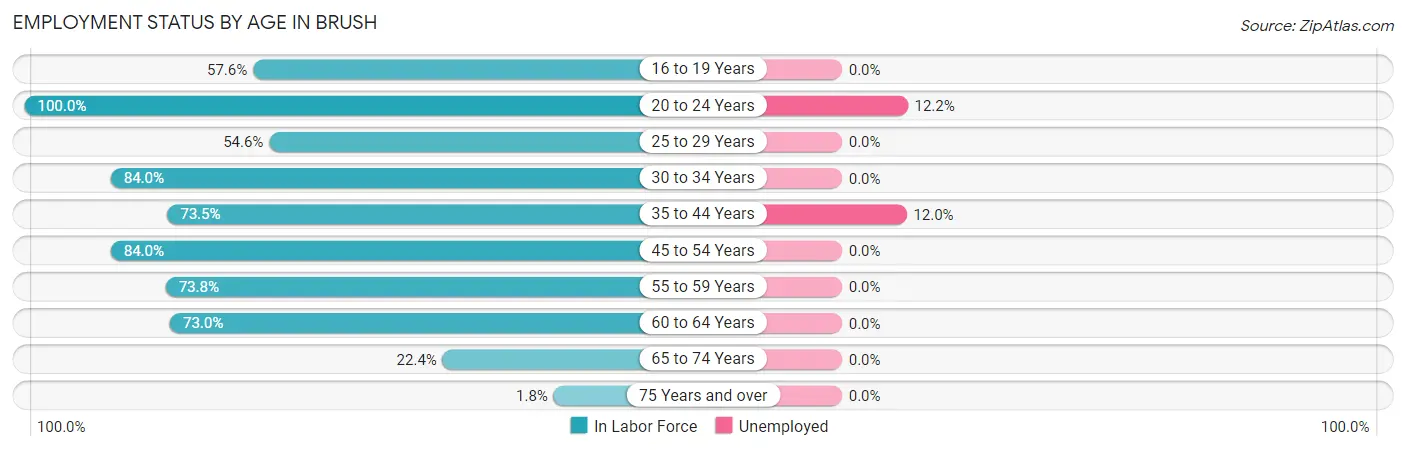
| Age Bracket | In Labor Force | Unemployed |
| 16 to 19 Years | 201 (57.6%) | 0 (0.0%) |
| 20 to 24 Years | 384 (100.0%) | 47 (12.2%) |
| 25 to 29 Years | 189 (54.6%) | 0 (0.0%) |
| 30 to 34 Years | 361 (84.0%) | 0 (0.0%) |
| 35 to 44 Years | 392 (73.5%) | 47 (12.0%) |
| 45 to 54 Years | 477 (84.0%) | 0 (0.0%) |
| 55 to 59 Years | 211 (73.8%) | 0 (0.0%) |
| 60 to 64 Years | 127 (73.0%) | 0 (0.0%) |
| 65 to 74 Years | 72 (22.4%) | 0 (0.0%) |
| 75 Years and over | 10 (1.8%) | 0 (0.0%) |
| Total | 2,423 (61.4%) | 94 (3.9%) |
Employment Status by Educational Attainment in Brush
According to labor force statistics for Brush, 75.2% of individuals (1,757) out of the total population between 25 and 64 years of age (2,337) are in the labor force, with 2.7% or 47 of them being unemployed. The group with the highest labor force participation rate are those with the educational attainment of bachelor's degree or higher, with 95.5% or 383 individuals in the labor force. Within the labor force, individuals with less than high school education have the highest percentage of unemployment, with 9.4% or 25 of them being unemployed.
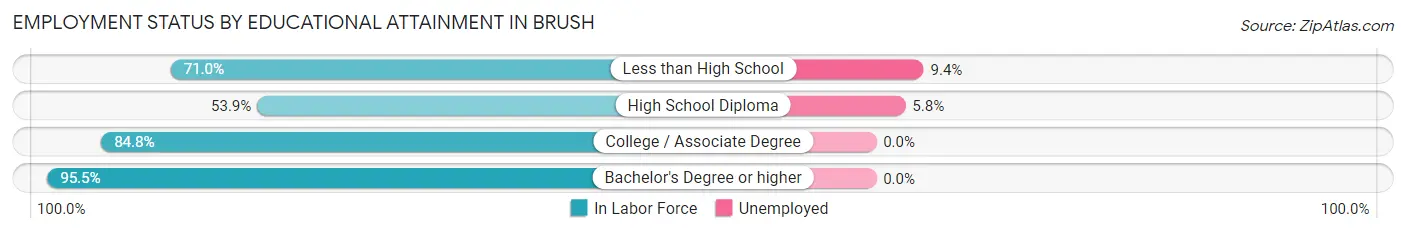
| Educational Attainment | In Labor Force | Unemployed |
| Less than High School | 267 (71.0%) | 35 (9.4%) |
| High School Diploma | 377 (53.9%) | 41 (5.8%) |
| College / Associate Degree | 730 (84.8%) | 0 (0.0%) |
| Bachelor's Degree or higher | 383 (95.5%) | 0 (0.0%) |
| Total | 1,757 (75.2%) | 63 (2.7%) |
Employment Occupations by Sex in Brush
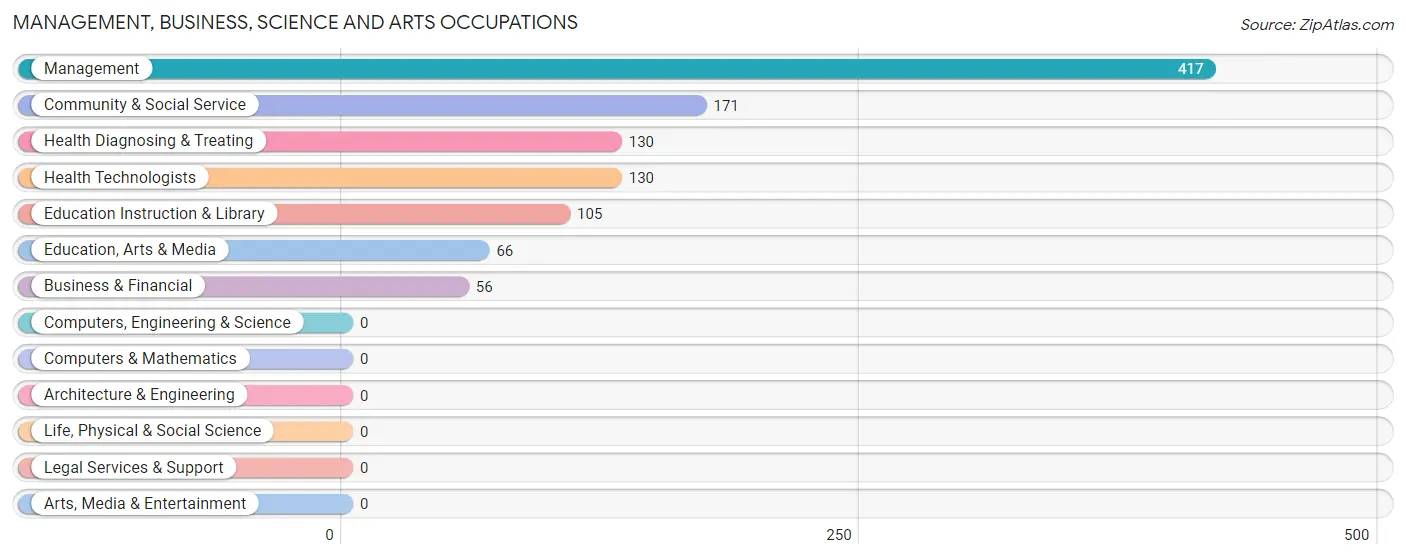
Management, Business, Science and Arts Occupations
The most common Management, Business, Science and Arts occupations in Brush are Management (417 | 17.9%), Community & Social Service (171 | 7.3%), Health Diagnosing & Treating (130 | 5.6%), Health Technologists (130 | 5.6%), and Education Instruction & Library (105 | 4.5%).
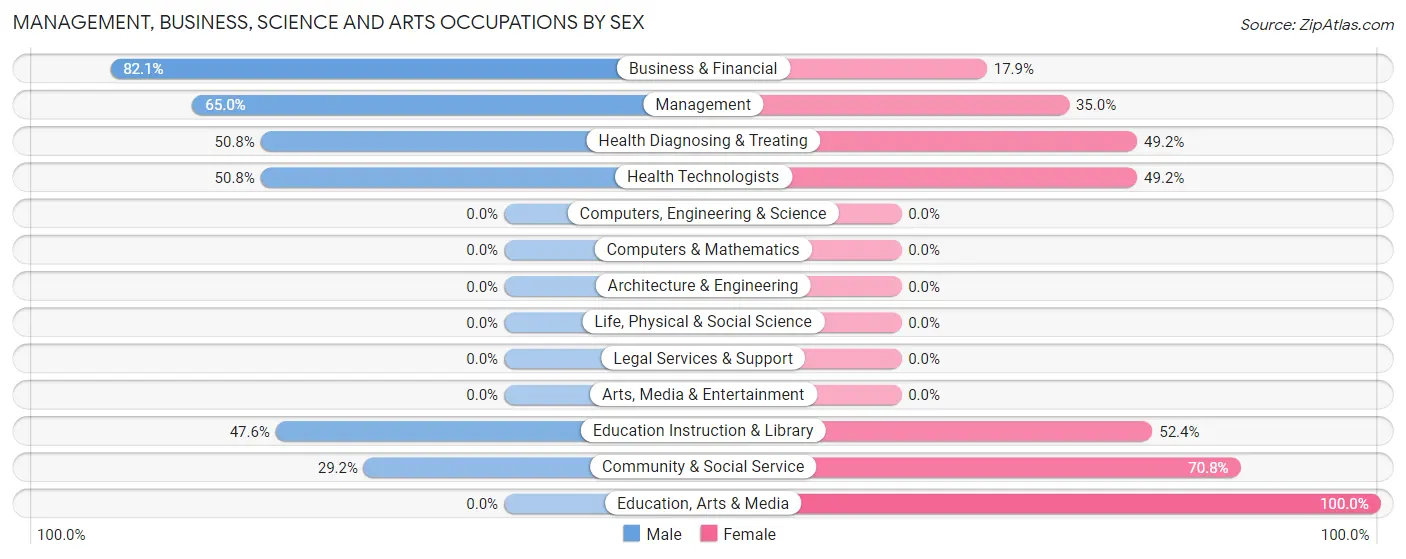
Management, Business, Science and Arts Occupations by Sex
Within the Management, Business, Science and Arts occupations in Brush, the most male-oriented occupations are Business & Financial (82.1%), Management (65.0%), and Health Diagnosing & Treating (50.8%), while the most female-oriented occupations are Education, Arts & Media (100.0%), Community & Social Service (70.8%), and Education Instruction & Library (52.4%).
| Occupation | Male | Female |
| Management | 271 (65.0%) | 146 (35.0%) |
| Business & Financial | 46 (82.1%) | 10 (17.9%) |
| Computers, Engineering & Science | 0 (0.0%) | 0 (0.0%) |
| Computers & Mathematics | 0 (0.0%) | 0 (0.0%) |
| Architecture & Engineering | 0 (0.0%) | 0 (0.0%) |
| Life, Physical & Social Science | 0 (0.0%) | 0 (0.0%) |
| Community & Social Service | 50 (29.2%) | 121 (70.8%) |
| Education, Arts & Media | 0 (0.0%) | 66 (100.0%) |
| Legal Services & Support | 0 (0.0%) | 0 (0.0%) |
| Education Instruction & Library | 50 (47.6%) | 55 (52.4%) |
| Arts, Media & Entertainment | 0 (0.0%) | 0 (0.0%) |
| Health Diagnosing & Treating | 66 (50.8%) | 64 (49.2%) |
| Health Technologists | 66 (50.8%) | 64 (49.2%) |
| Total (Category) | 433 (55.9%) | 341 (44.1%) |
| Total (Overall) | 1,307 (56.1%) | 1,023 (43.9%) |
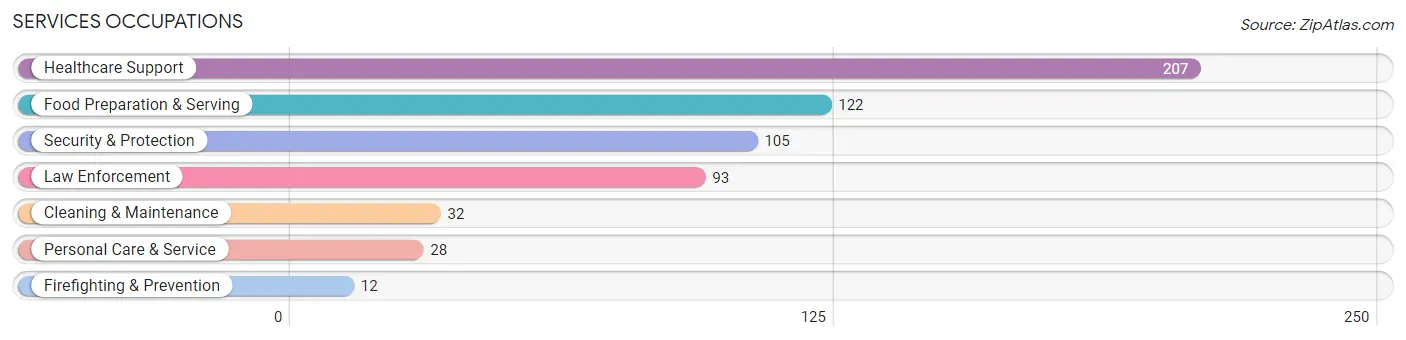
Services Occupations
The most common Services occupations in Brush are Healthcare Support (207 | 8.9%), Food Preparation & Serving (122 | 5.2%), Security & Protection (105 | 4.5%), Law Enforcement (93 | 4.0%), and Cleaning & Maintenance (32 | 1.4%).
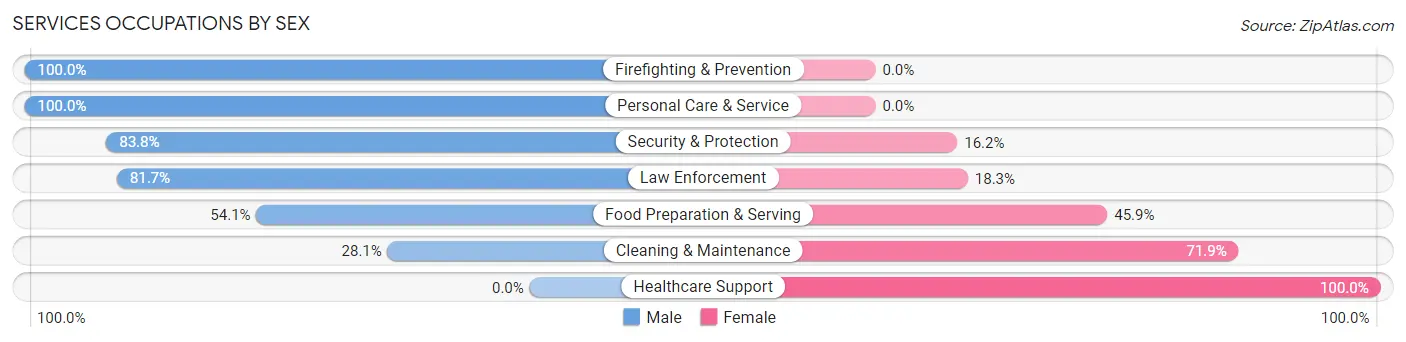
Services Occupations by Sex
Within the Services occupations in Brush, the most male-oriented occupations are Firefighting & Prevention (100.0%), Personal Care & Service (100.0%), and Security & Protection (83.8%), while the most female-oriented occupations are Healthcare Support (100.0%), Cleaning & Maintenance (71.9%), and Food Preparation & Serving (45.9%).
| Occupation | Male | Female |
| Healthcare Support | 0 (0.0%) | 207 (100.0%) |
| Security & Protection | 88 (83.8%) | 17 (16.2%) |
| Firefighting & Prevention | 12 (100.0%) | 0 (0.0%) |
| Law Enforcement | 76 (81.7%) | 17 (18.3%) |
| Food Preparation & Serving | 66 (54.1%) | 56 (45.9%) |
| Cleaning & Maintenance | 9 (28.1%) | 23 (71.9%) |
| Personal Care & Service | 28 (100.0%) | 0 (0.0%) |
| Total (Category) | 191 (38.7%) | 303 (61.3%) |
| Total (Overall) | 1,307 (56.1%) | 1,023 (43.9%) |
Sales and Office Occupations
The most common Sales and Office occupations in Brush are Office & Administration (243 | 10.4%), and Sales & Related (190 | 8.2%).
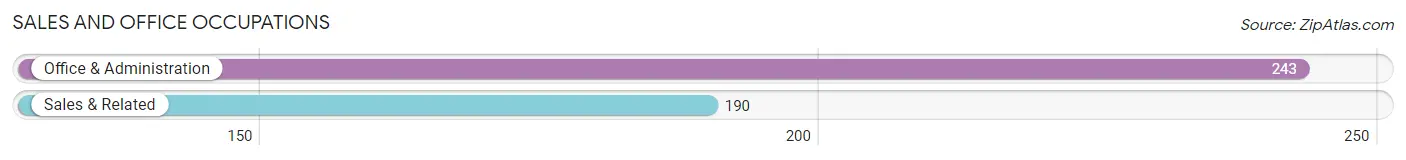
Sales and Office Occupations by Sex
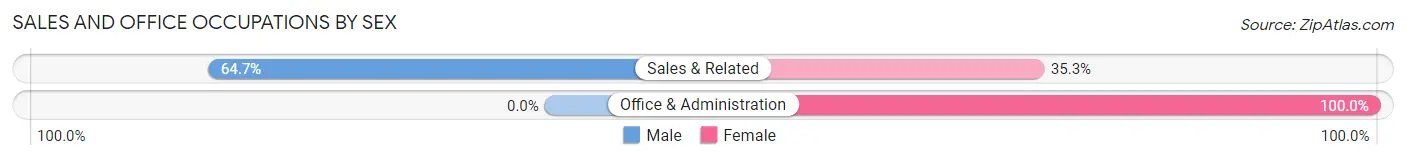
| Occupation | Male | Female |
| Sales & Related | 123 (64.7%) | 67 (35.3%) |
| Office & Administration | 0 (0.0%) | 243 (100.0%) |
| Total (Category) | 123 (28.4%) | 310 (71.6%) |
| Total (Overall) | 1,307 (56.1%) | 1,023 (43.9%) |
Natural Resources, Construction and Maintenance Occupations
The most common Natural Resources, Construction and Maintenance occupations in Brush are Construction & Extraction (138 | 5.9%), and Installation, Maintenance & Repair (77 | 3.3%).
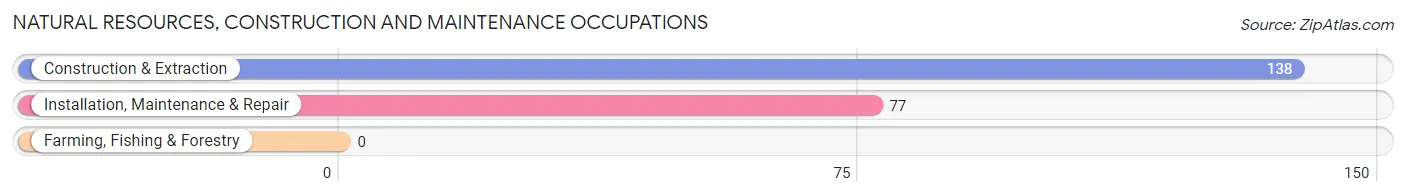
Natural Resources, Construction and Maintenance Occupations by Sex
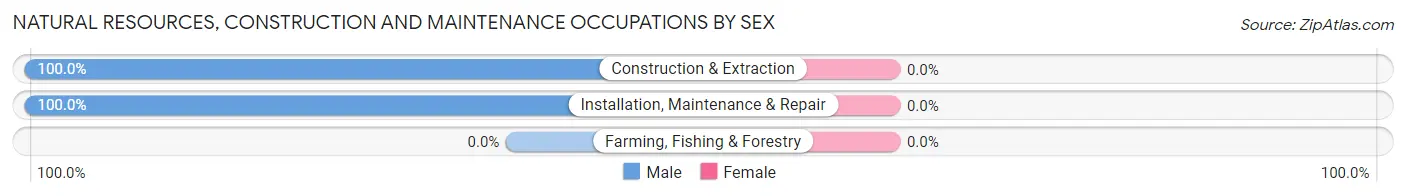
| Occupation | Male | Female |
| Farming, Fishing & Forestry | 0 (0.0%) | 0 (0.0%) |
| Construction & Extraction | 138 (100.0%) | 0 (0.0%) |
| Installation, Maintenance & Repair | 77 (100.0%) | 0 (0.0%) |
| Total (Category) | 215 (100.0%) | 0 (0.0%) |
| Total (Overall) | 1,307 (56.1%) | 1,023 (43.9%) |
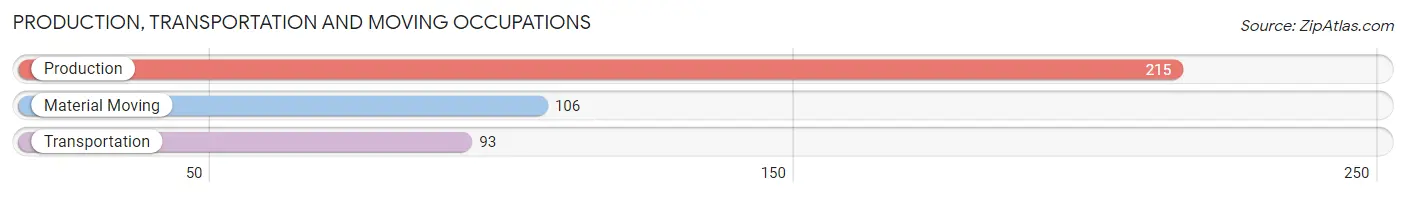
Production, Transportation and Moving Occupations
The most common Production, Transportation and Moving occupations in Brush are Production (215 | 9.2%), Material Moving (106 | 4.5%), and Transportation (93 | 4.0%).
Production, Transportation and Moving Occupations by Sex
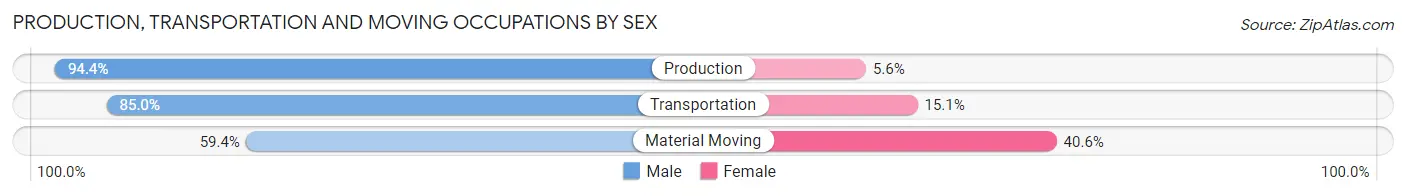
| Occupation | Male | Female |
| Production | 203 (94.4%) | 12 (5.6%) |
| Transportation | 79 (85.0%) | 14 (15.0%) |
| Material Moving | 63 (59.4%) | 43 (40.6%) |
| Total (Category) | 345 (83.3%) | 69 (16.7%) |
| Total (Overall) | 1,307 (56.1%) | 1,023 (43.9%) |
Employment Industries by Sex in Brush
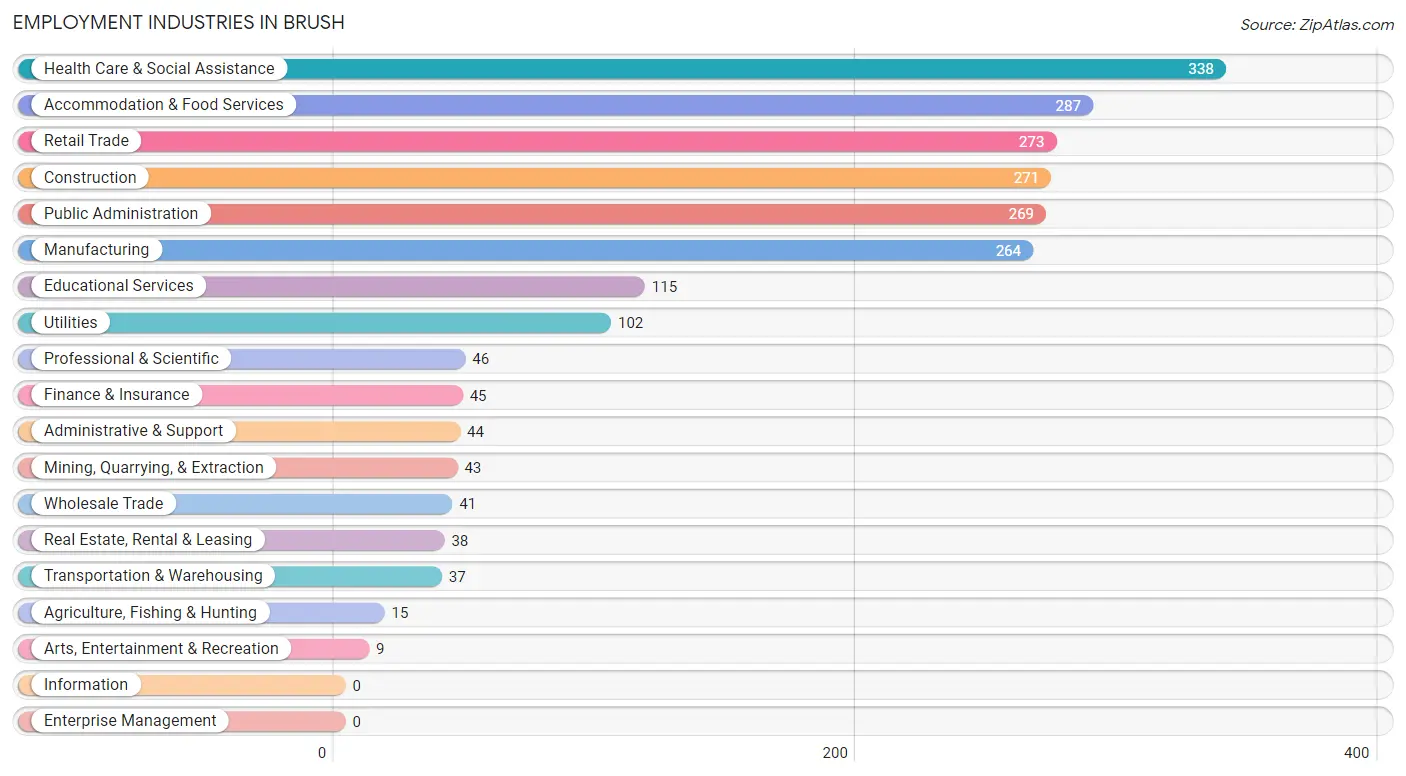
Employment Industries in Brush
The major employment industries in Brush include Health Care & Social Assistance (338 | 14.5%), Accommodation & Food Services (287 | 12.3%), Retail Trade (273 | 11.7%), Construction (271 | 11.6%), and Public Administration (269 | 11.6%).
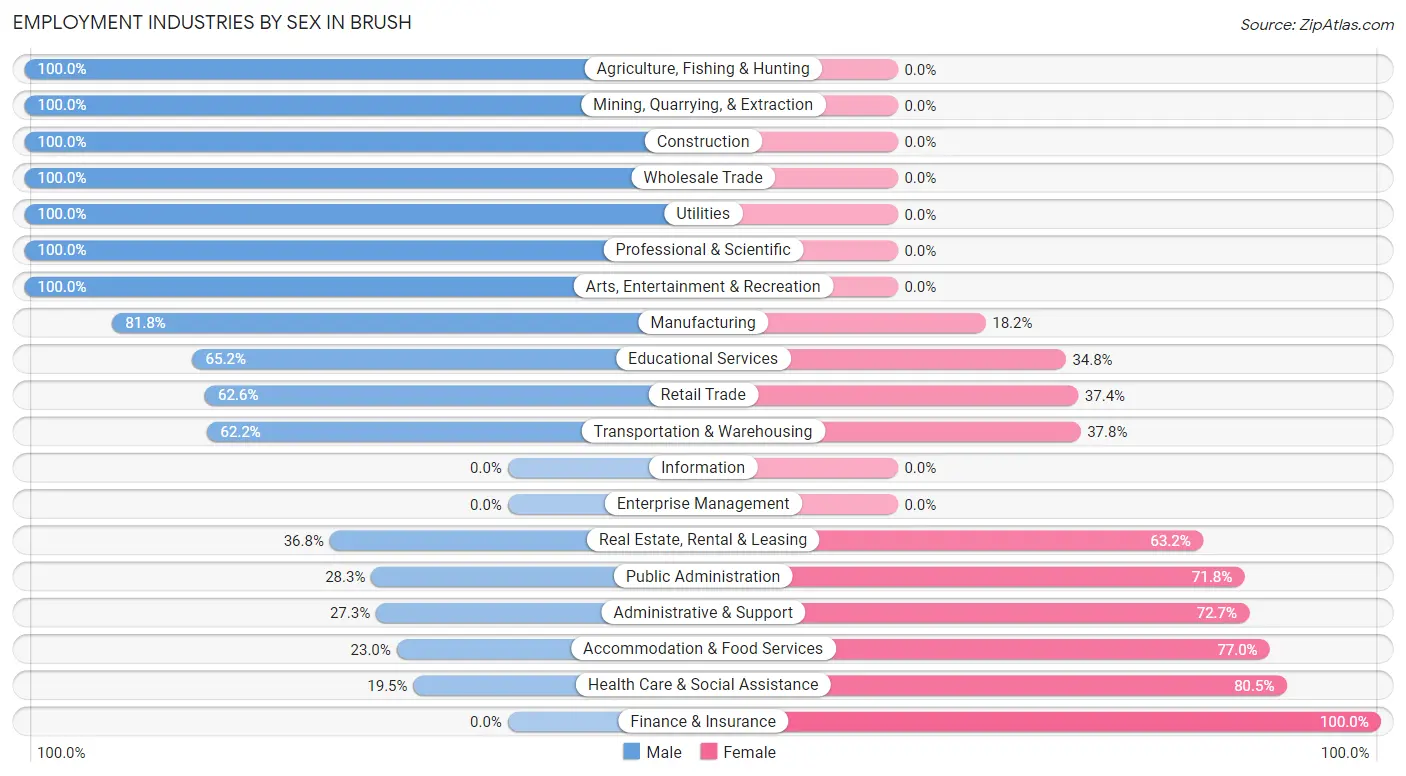
Employment Industries by Sex in Brush
The Brush industries that see more men than women are Agriculture, Fishing & Hunting (100.0%), Mining, Quarrying, & Extraction (100.0%), and Construction (100.0%), whereas the industries that tend to have a higher number of women are Finance & Insurance (100.0%), Health Care & Social Assistance (80.5%), and Accommodation & Food Services (77.0%).
| Industry | Male | Female |
| Agriculture, Fishing & Hunting | 15 (100.0%) | 0 (0.0%) |
| Mining, Quarrying, & Extraction | 43 (100.0%) | 0 (0.0%) |
| Construction | 271 (100.0%) | 0 (0.0%) |
| Manufacturing | 216 (81.8%) | 48 (18.2%) |
| Wholesale Trade | 41 (100.0%) | 0 (0.0%) |
| Retail Trade | 171 (62.6%) | 102 (37.4%) |
| Transportation & Warehousing | 23 (62.2%) | 14 (37.8%) |
| Utilities | 102 (100.0%) | 0 (0.0%) |
| Information | 0 (0.0%) | 0 (0.0%) |
| Finance & Insurance | 0 (0.0%) | 45 (100.0%) |
| Real Estate, Rental & Leasing | 14 (36.8%) | 24 (63.2%) |
| Professional & Scientific | 46 (100.0%) | 0 (0.0%) |
| Enterprise Management | 0 (0.0%) | 0 (0.0%) |
| Administrative & Support | 12 (27.3%) | 32 (72.7%) |
| Educational Services | 75 (65.2%) | 40 (34.8%) |
| Health Care & Social Assistance | 66 (19.5%) | 272 (80.5%) |
| Arts, Entertainment & Recreation | 9 (100.0%) | 0 (0.0%) |
| Accommodation & Food Services | 66 (23.0%) | 221 (77.0%) |
| Public Administration | 76 (28.2%) | 193 (71.8%) |
| Total | 1,307 (56.1%) | 1,023 (43.9%) |
Education in Brush
School Enrollment in Brush
The most common levels of schooling among the 1,300 students in Brush are elementary school (510 | 39.2%), high school (257 | 19.8%), and middle school (144 | 11.1%).
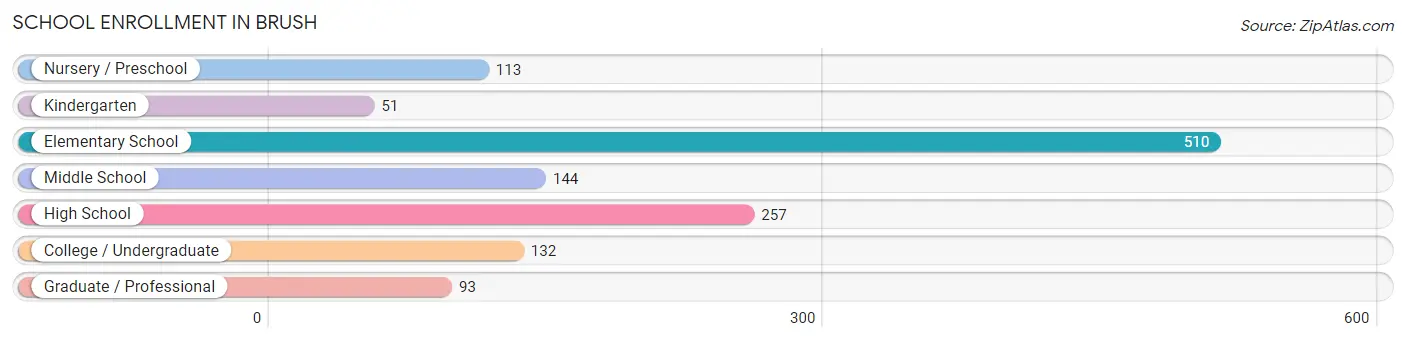
| School Level | # Students | % Students |
| Nursery / Preschool | 113 | 8.7% |
| Kindergarten | 51 | 3.9% |
| Elementary School | 510 | 39.2% |
| Middle School | 144 | 11.1% |
| High School | 257 | 19.8% |
| College / Undergraduate | 132 | 10.2% |
| Graduate / Professional | 93 | 7.1% |
| Total | 1,300 | 100.0% |
School Enrollment by Age by Funding Source in Brush
Out of a total of 1,300 students who are enrolled in schools in Brush, 315 (24.2%) attend a private institution, while the remaining 985 (75.8%) are enrolled in public schools. The age group of 25 to 34 year olds has the highest likelihood of being enrolled in private schools, with 89 (100.0% in the age bracket) enrolled. Conversely, the age group of 3 to 4 year olds has the lowest likelihood of being enrolled in a private school, with 62 (100.0% in the age bracket) attending a public institution.
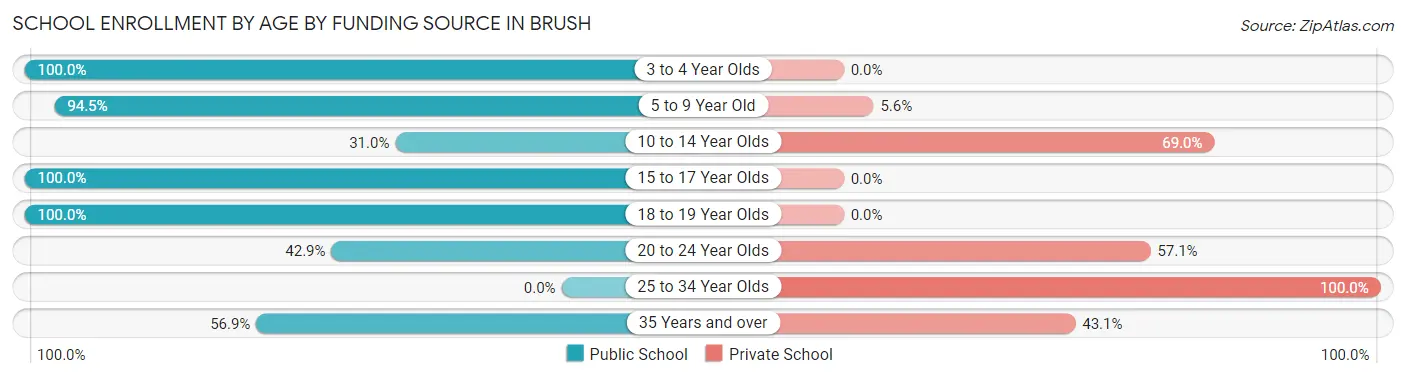
| Age Bracket | Public School | Private School |
| 3 to 4 Year Olds | 62 (100.0%) | 0 (0.0%) |
| 5 to 9 Year Old | 528 (94.5%) | 31 (5.6%) |
| 10 to 14 Year Olds | 61 (31.0%) | 136 (69.0%) |
| 15 to 17 Year Olds | 201 (100.0%) | 0 (0.0%) |
| 18 to 19 Year Olds | 78 (100.0%) | 0 (0.0%) |
| 20 to 24 Year Olds | 27 (42.9%) | 36 (57.1%) |
| 25 to 34 Year Olds | 0 (0.0%) | 89 (100.0%) |
| 35 Years and over | 29 (56.9%) | 22 (43.1%) |
| Total | 985 (75.8%) | 315 (24.2%) |
Educational Attainment by Field of Study in Brush
Education (135 | 21.7%), science & technology (128 | 20.6%), business (95 | 15.3%), social sciences (71 | 11.4%), and psychology (70 | 11.3%) are the most common fields of study among 622 individuals in Brush who have obtained a bachelor's degree or higher.
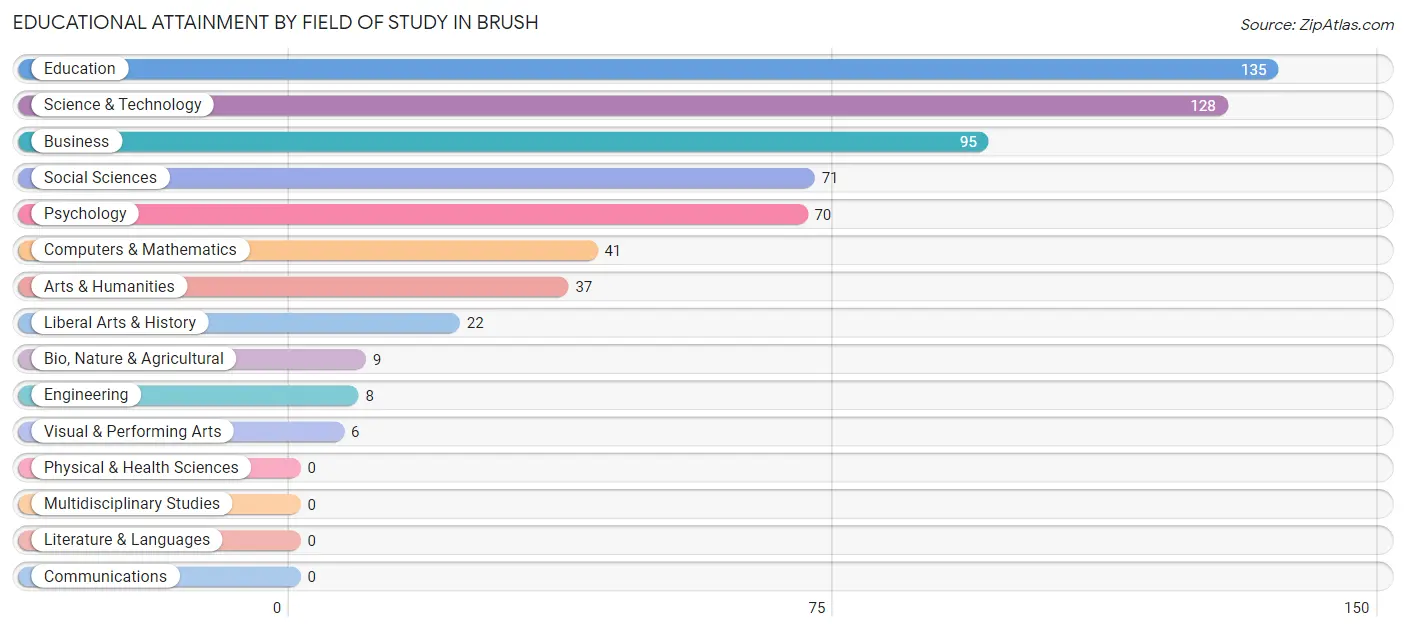
| Field of Study | # Graduates | % Graduates |
| Computers & Mathematics | 41 | 6.6% |
| Bio, Nature & Agricultural | 9 | 1.5% |
| Physical & Health Sciences | 0 | 0.0% |
| Psychology | 70 | 11.3% |
| Social Sciences | 71 | 11.4% |
| Engineering | 8 | 1.3% |
| Multidisciplinary Studies | 0 | 0.0% |
| Science & Technology | 128 | 20.6% |
| Business | 95 | 15.3% |
| Education | 135 | 21.7% |
| Literature & Languages | 0 | 0.0% |
| Liberal Arts & History | 22 | 3.5% |
| Visual & Performing Arts | 6 | 1.0% |
| Communications | 0 | 0.0% |
| Arts & Humanities | 37 | 5.9% |
| Total | 622 | 100.0% |
Transportation & Commute in Brush
Vehicle Availability by Sex in Brush
The most prevalent vehicle ownership categories in Brush are males with 2 vehicles (572, accounting for 45.9%) and females with 2 vehicles (270, making up 62.6%).
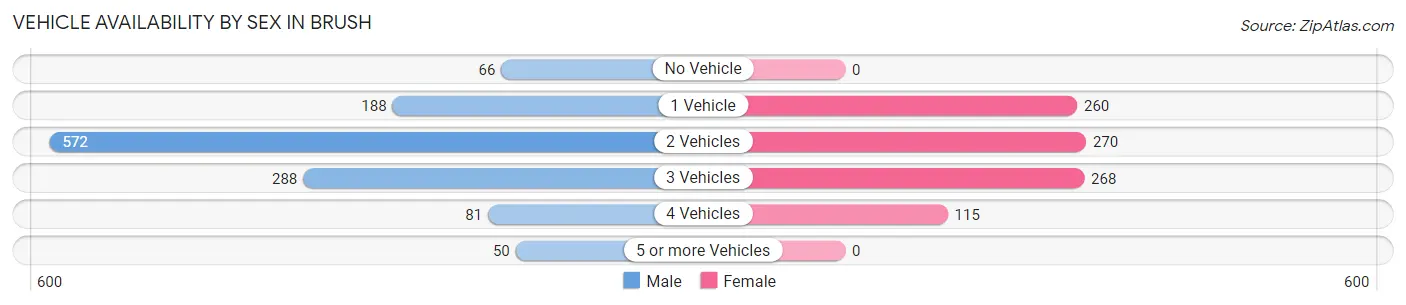
| Vehicles Available | Male | Female |
| No Vehicle | 66 (5.3%) | 0 (0.0%) |
| 1 Vehicle | 188 (15.1%) | 260 (28.5%) |
| 2 Vehicles | 572 (45.9%) | 270 (29.6%) |
| 3 Vehicles | 288 (23.1%) | 268 (29.3%) |
| 4 Vehicles | 81 (6.5%) | 115 (12.6%) |
| 5 or more Vehicles | 50 (4.0%) | 0 (0.0%) |
| Total | 1,245 (100.0%) | 913 (100.0%) |
Commute Time in Brush
The most frequently occuring commute durations in Brush are 5 to 9 minutes (608 commuters, 28.8%), 10 to 14 minutes (464 commuters, 22.0%), and 20 to 24 minutes (262 commuters, 12.4%).
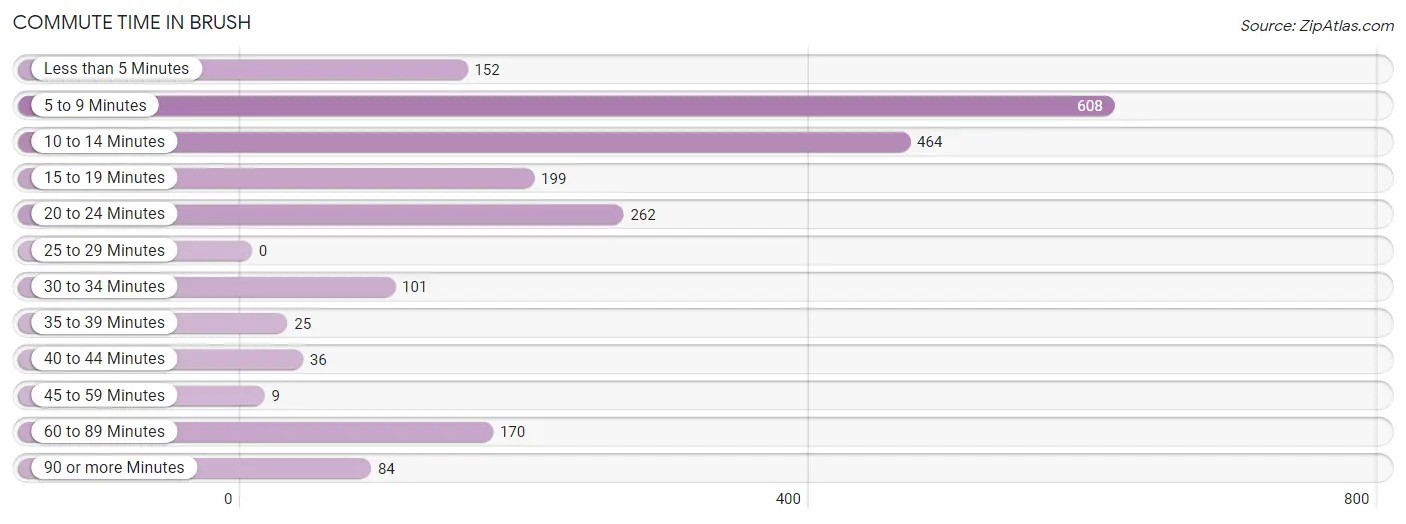
| Commute Time | # Commuters | % Commuters |
| Less than 5 Minutes | 152 | 7.2% |
| 5 to 9 Minutes | 608 | 28.8% |
| 10 to 14 Minutes | 464 | 22.0% |
| 15 to 19 Minutes | 199 | 9.4% |
| 20 to 24 Minutes | 262 | 12.4% |
| 25 to 29 Minutes | 0 | 0.0% |
| 30 to 34 Minutes | 101 | 4.8% |
| 35 to 39 Minutes | 25 | 1.2% |
| 40 to 44 Minutes | 36 | 1.7% |
| 45 to 59 Minutes | 9 | 0.4% |
| 60 to 89 Minutes | 170 | 8.1% |
| 90 or more Minutes | 84 | 4.0% |
Commute Time by Sex in Brush
The most common commute times in Brush are 5 to 9 minutes (327 commuters, 26.3%) for males and 5 to 9 minutes (281 commuters, 32.5%) for females.
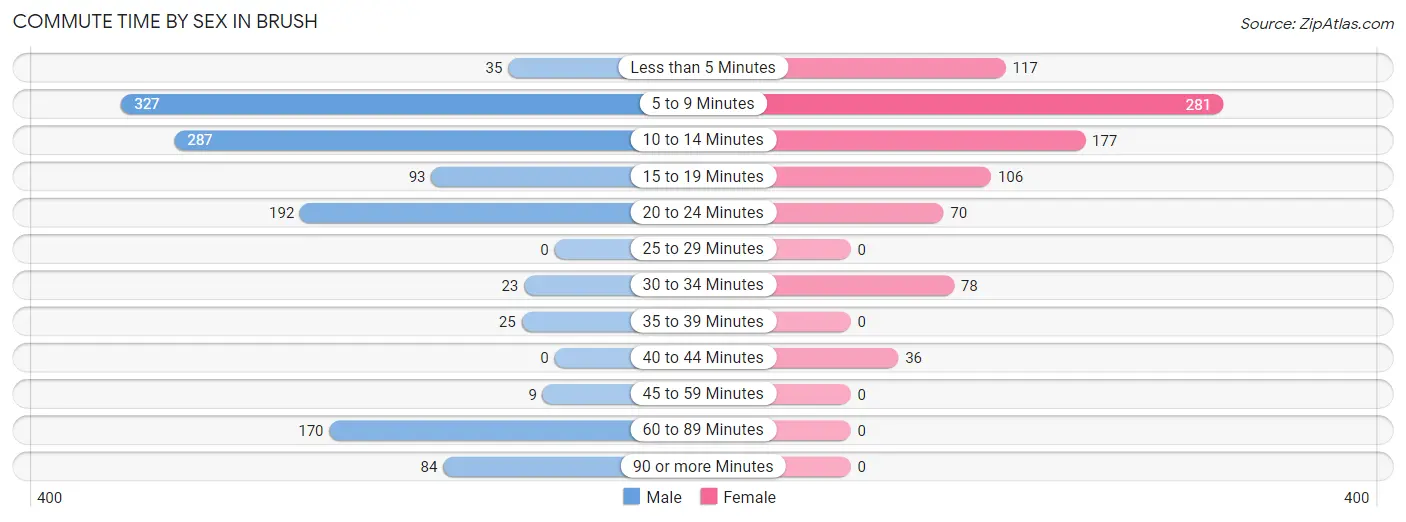
| Commute Time | Male | Female |
| Less than 5 Minutes | 35 (2.8%) | 117 (13.5%) |
| 5 to 9 Minutes | 327 (26.3%) | 281 (32.5%) |
| 10 to 14 Minutes | 287 (23.1%) | 177 (20.5%) |
| 15 to 19 Minutes | 93 (7.5%) | 106 (12.2%) |
| 20 to 24 Minutes | 192 (15.4%) | 70 (8.1%) |
| 25 to 29 Minutes | 0 (0.0%) | 0 (0.0%) |
| 30 to 34 Minutes | 23 (1.8%) | 78 (9.0%) |
| 35 to 39 Minutes | 25 (2.0%) | 0 (0.0%) |
| 40 to 44 Minutes | 0 (0.0%) | 36 (4.2%) |
| 45 to 59 Minutes | 9 (0.7%) | 0 (0.0%) |
| 60 to 89 Minutes | 170 (13.7%) | 0 (0.0%) |
| 90 or more Minutes | 84 (6.8%) | 0 (0.0%) |
Time of Departure to Work by Sex in Brush
The most frequent times of departure to work in Brush are 6:00 AM to 6:29 AM (261, 21.0%) for males and 7:30 AM to 7:59 AM (214, 24.7%) for females.
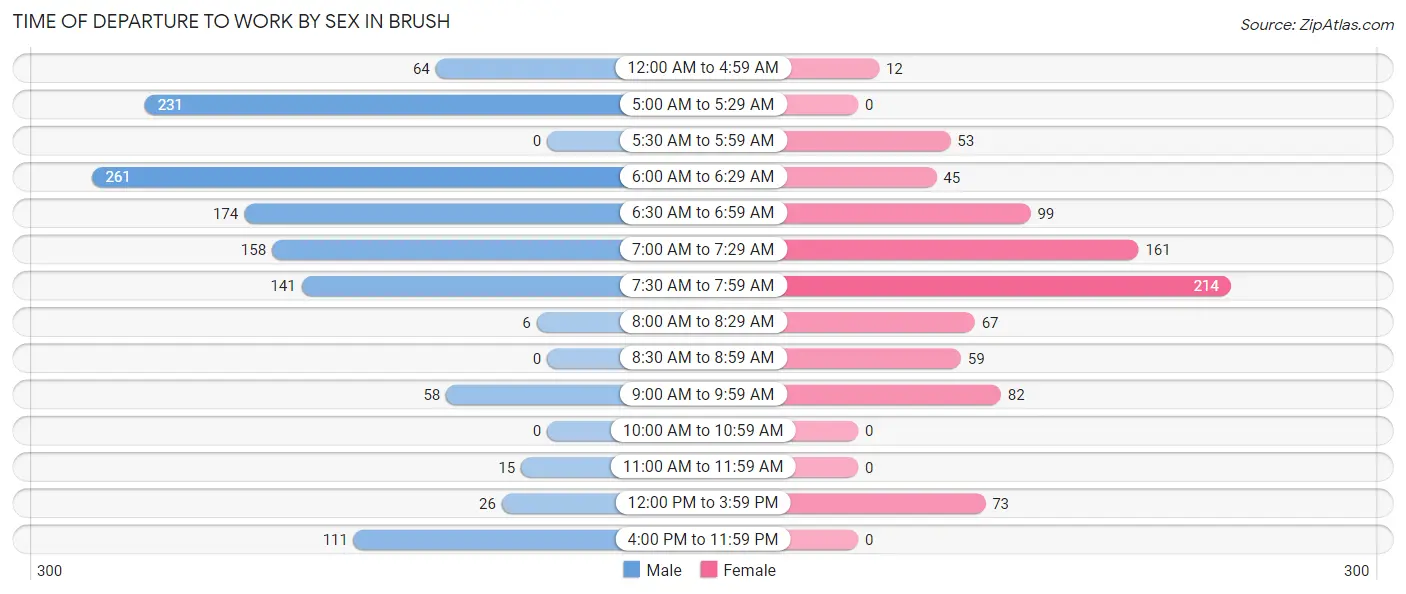
| Time of Departure | Male | Female |
| 12:00 AM to 4:59 AM | 64 (5.1%) | 12 (1.4%) |
| 5:00 AM to 5:29 AM | 231 (18.5%) | 0 (0.0%) |
| 5:30 AM to 5:59 AM | 0 (0.0%) | 53 (6.1%) |
| 6:00 AM to 6:29 AM | 261 (21.0%) | 45 (5.2%) |
| 6:30 AM to 6:59 AM | 174 (14.0%) | 99 (11.5%) |
| 7:00 AM to 7:29 AM | 158 (12.7%) | 161 (18.6%) |
| 7:30 AM to 7:59 AM | 141 (11.3%) | 214 (24.7%) |
| 8:00 AM to 8:29 AM | 6 (0.5%) | 67 (7.7%) |
| 8:30 AM to 8:59 AM | 0 (0.0%) | 59 (6.8%) |
| 9:00 AM to 9:59 AM | 58 (4.7%) | 82 (9.5%) |
| 10:00 AM to 10:59 AM | 0 (0.0%) | 0 (0.0%) |
| 11:00 AM to 11:59 AM | 15 (1.2%) | 0 (0.0%) |
| 12:00 PM to 3:59 PM | 26 (2.1%) | 73 (8.4%) |
| 4:00 PM to 11:59 PM | 111 (8.9%) | 0 (0.0%) |
| Total | 1,245 (100.0%) | 865 (100.0%) |
Housing Occupancy in Brush
Occupancy by Ownership in Brush
Of the total 1,917 dwellings in Brush, owner-occupied units account for 1,230 (64.2%), while renter-occupied units make up 687 (35.8%).
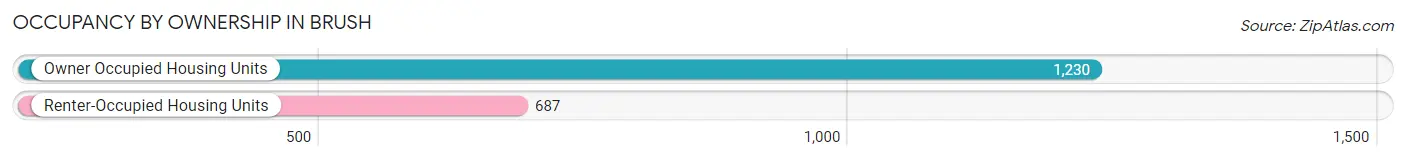
| Occupancy | # Housing Units | % Housing Units |
| Owner Occupied Housing Units | 1,230 | 64.2% |
| Renter-Occupied Housing Units | 687 | 35.8% |
| Total Occupied Housing Units | 1,917 | 100.0% |
Occupancy by Household Size in Brush
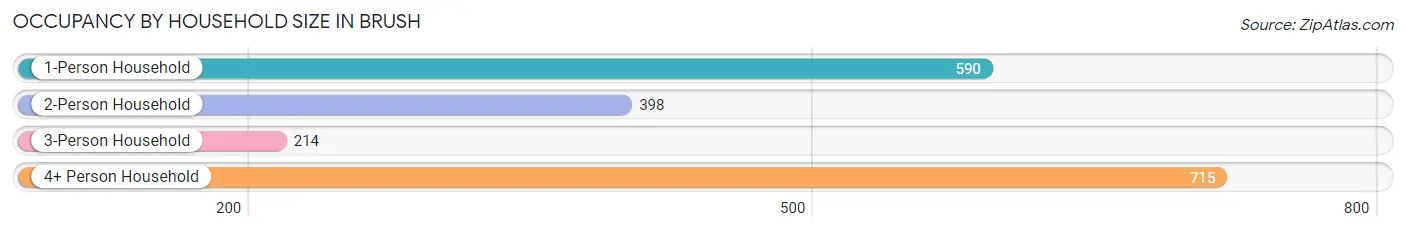
| Household Size | # Housing Units | % Housing Units |
| 1-Person Household | 590 | 30.8% |
| 2-Person Household | 398 | 20.8% |
| 3-Person Household | 214 | 11.2% |
| 4+ Person Household | 715 | 37.3% |
| Total Housing Units | 1,917 | 100.0% |
Occupancy by Ownership by Household Size in Brush
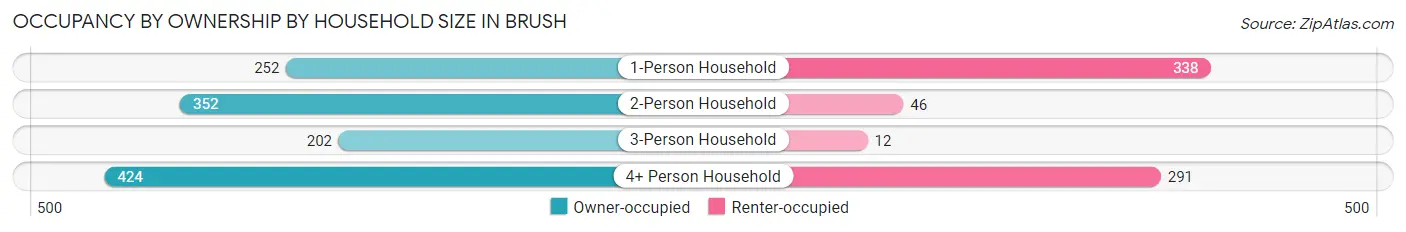
| Household Size | Owner-occupied | Renter-occupied |
| 1-Person Household | 252 (42.7%) | 338 (57.3%) |
| 2-Person Household | 352 (88.4%) | 46 (11.6%) |
| 3-Person Household | 202 (94.4%) | 12 (5.6%) |
| 4+ Person Household | 424 (59.3%) | 291 (40.7%) |
| Total Housing Units | 1,230 (64.2%) | 687 (35.8%) |
Occupancy by Educational Attainment in Brush
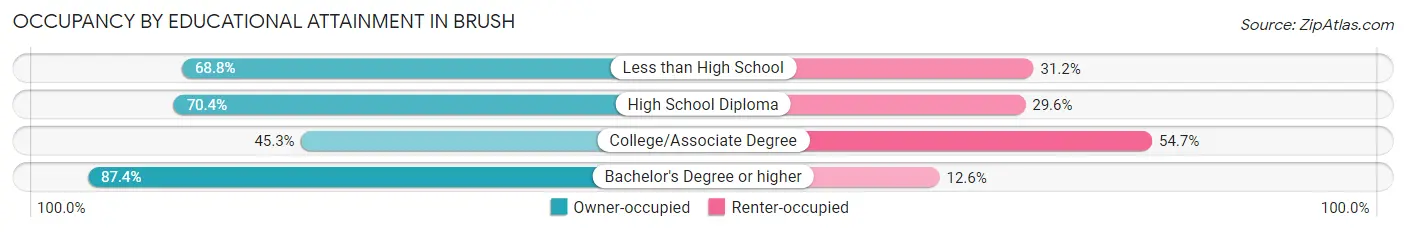
| Household Size | Owner-occupied | Renter-occupied |
| Less than High School | 291 (68.8%) | 132 (31.2%) |
| High School Diploma | 331 (70.4%) | 139 (29.6%) |
| College/Associate Degree | 309 (45.3%) | 373 (54.7%) |
| Bachelor's Degree or higher | 299 (87.4%) | 43 (12.6%) |
Occupancy by Age of Householder in Brush
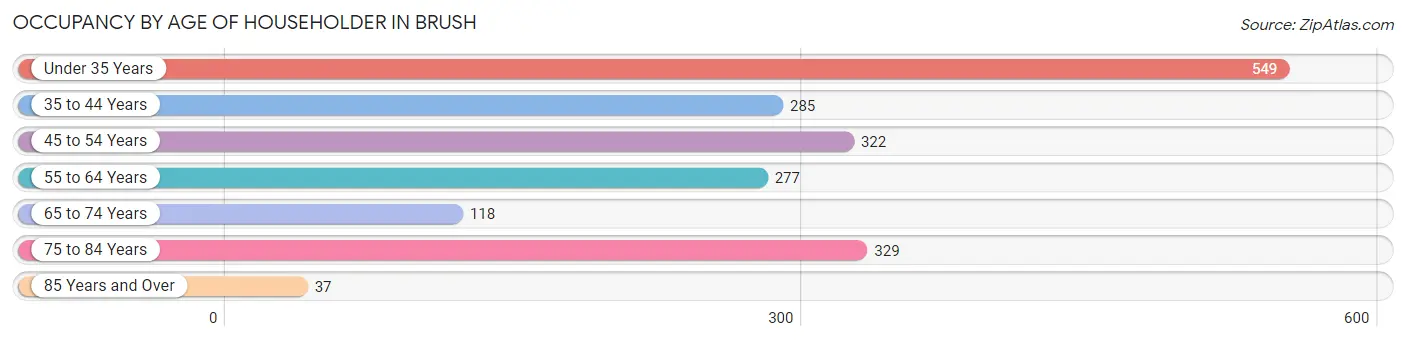
| Age Bracket | # Households | % Households |
| Under 35 Years | 549 | 28.6% |
| 35 to 44 Years | 285 | 14.9% |
| 45 to 54 Years | 322 | 16.8% |
| 55 to 64 Years | 277 | 14.4% |
| 65 to 74 Years | 118 | 6.2% |
| 75 to 84 Years | 329 | 17.2% |
| 85 Years and Over | 37 | 1.9% |
| Total | 1,917 | 100.0% |
Housing Finances in Brush
Median Income by Occupancy in Brush
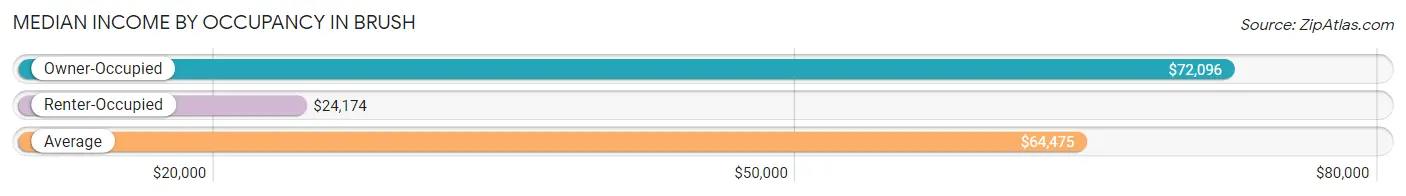
| Occupancy Type | # Households | Median Income |
| Owner-Occupied | 1,230 (64.2%) | $72,096 |
| Renter-Occupied | 687 (35.8%) | $24,174 |
| Average | 1,917 (100.0%) | $64,475 |
Occupancy by Householder Income Bracket in Brush
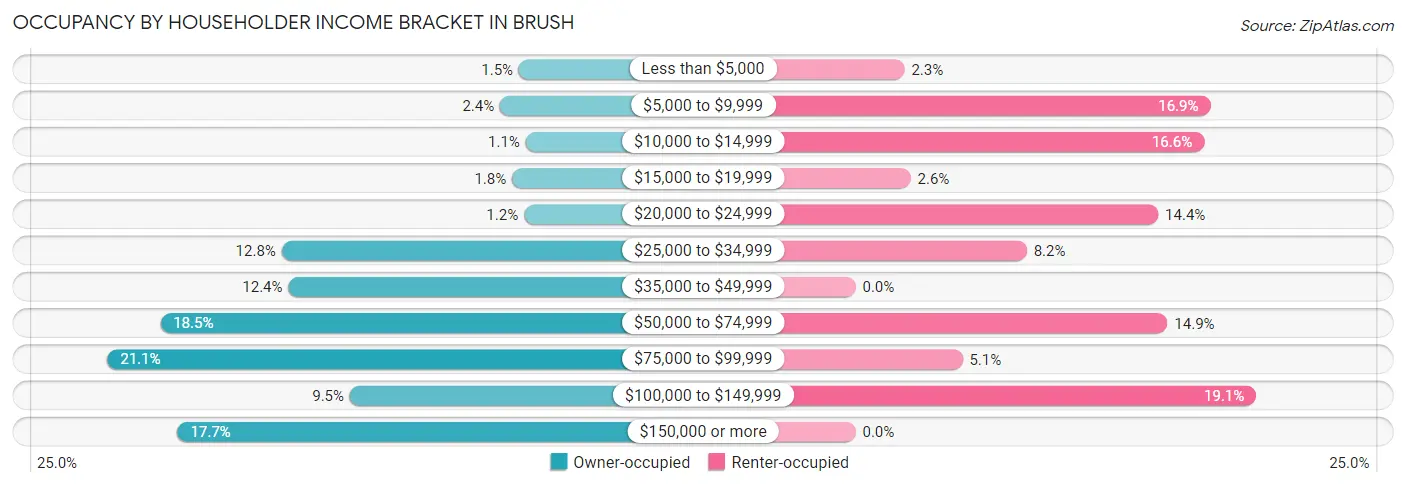
| Income Bracket | Owner-occupied | Renter-occupied |
| Less than $5,000 | 18 (1.5%) | 16 (2.3%) |
| $5,000 to $9,999 | 29 (2.4%) | 116 (16.9%) |
| $10,000 to $14,999 | 14 (1.1%) | 114 (16.6%) |
| $15,000 to $19,999 | 22 (1.8%) | 18 (2.6%) |
| $20,000 to $24,999 | 15 (1.2%) | 99 (14.4%) |
| $25,000 to $34,999 | 157 (12.8%) | 56 (8.2%) |
| $35,000 to $49,999 | 153 (12.4%) | 0 (0.0%) |
| $50,000 to $74,999 | 228 (18.5%) | 102 (14.8%) |
| $75,000 to $99,999 | 259 (21.1%) | 35 (5.1%) |
| $100,000 to $149,999 | 117 (9.5%) | 131 (19.1%) |
| $150,000 or more | 218 (17.7%) | 0 (0.0%) |
| Total | 1,230 (100.0%) | 687 (100.0%) |
Monthly Housing Cost Tiers in Brush
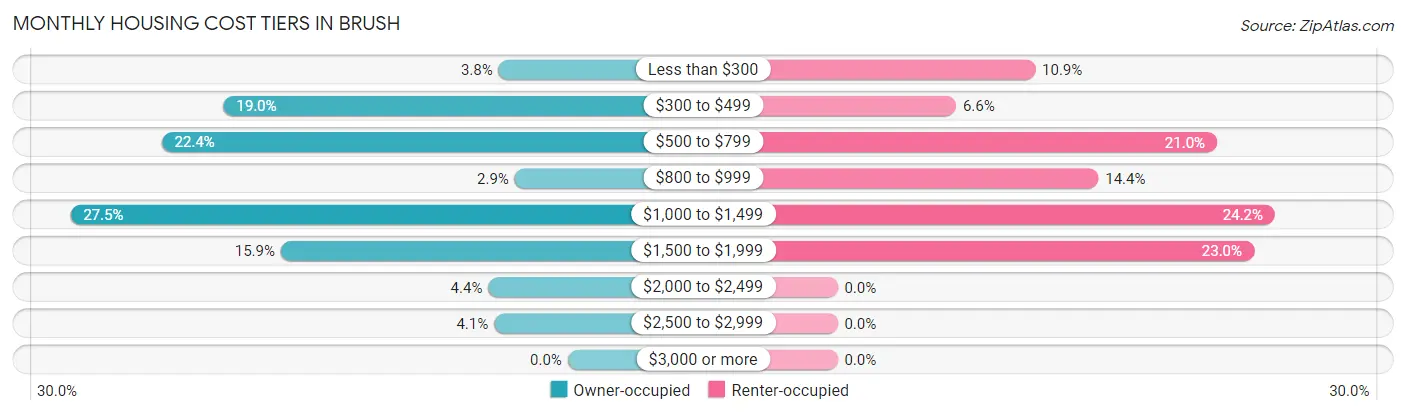
| Monthly Cost | Owner-occupied | Renter-occupied |
| Less than $300 | 47 (3.8%) | 75 (10.9%) |
| $300 to $499 | 234 (19.0%) | 45 (6.6%) |
| $500 to $799 | 276 (22.4%) | 144 (21.0%) |
| $800 to $999 | 36 (2.9%) | 99 (14.4%) |
| $1,000 to $1,499 | 338 (27.5%) | 166 (24.2%) |
| $1,500 to $1,999 | 195 (15.9%) | 158 (23.0%) |
| $2,000 to $2,499 | 54 (4.4%) | 0 (0.0%) |
| $2,500 to $2,999 | 50 (4.1%) | 0 (0.0%) |
| $3,000 or more | 0 (0.0%) | 0 (0.0%) |
| Total | 1,230 (100.0%) | 687 (100.0%) |
Physical Housing Characteristics in Brush
Housing Structures in Brush
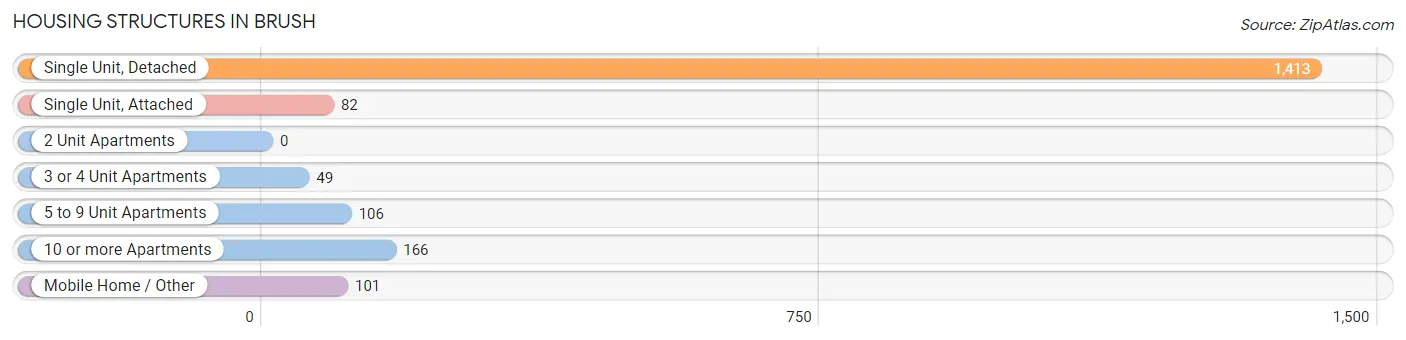
| Structure Type | # Housing Units | % Housing Units |
| Single Unit, Detached | 1,413 | 73.7% |
| Single Unit, Attached | 82 | 4.3% |
| 2 Unit Apartments | 0 | 0.0% |
| 3 or 4 Unit Apartments | 49 | 2.6% |
| 5 to 9 Unit Apartments | 106 | 5.5% |
| 10 or more Apartments | 166 | 8.7% |
| Mobile Home / Other | 101 | 5.3% |
| Total | 1,917 | 100.0% |
Housing Structures by Occupancy in Brush
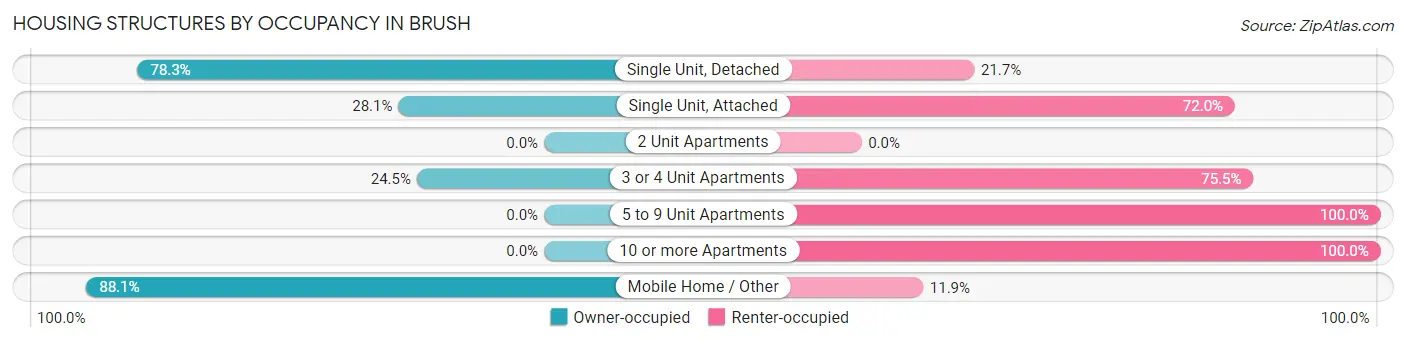
| Structure Type | Owner-occupied | Renter-occupied |
| Single Unit, Detached | 1,106 (78.3%) | 307 (21.7%) |
| Single Unit, Attached | 23 (28.1%) | 59 (72.0%) |
| 2 Unit Apartments | 0 (0.0%) | 0 (0.0%) |
| 3 or 4 Unit Apartments | 12 (24.5%) | 37 (75.5%) |
| 5 to 9 Unit Apartments | 0 (0.0%) | 106 (100.0%) |
| 10 or more Apartments | 0 (0.0%) | 166 (100.0%) |
| Mobile Home / Other | 89 (88.1%) | 12 (11.9%) |
| Total | 1,230 (64.2%) | 687 (35.8%) |
Housing Structures by Number of Rooms in Brush
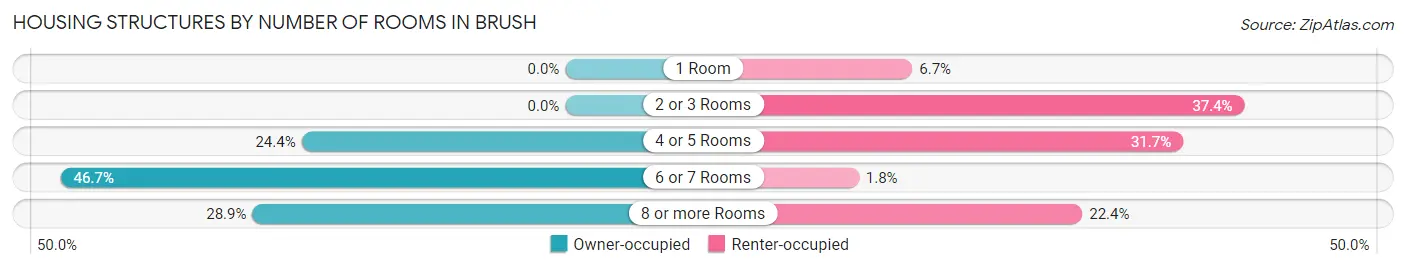
| Number of Rooms | Owner-occupied | Renter-occupied |
| 1 Room | 0 (0.0%) | 46 (6.7%) |
| 2 or 3 Rooms | 0 (0.0%) | 257 (37.4%) |
| 4 or 5 Rooms | 300 (24.4%) | 218 (31.7%) |
| 6 or 7 Rooms | 574 (46.7%) | 12 (1.8%) |
| 8 or more Rooms | 356 (28.9%) | 154 (22.4%) |
| Total | 1,230 (100.0%) | 687 (100.0%) |
Housing Structure by Heating Type in Brush
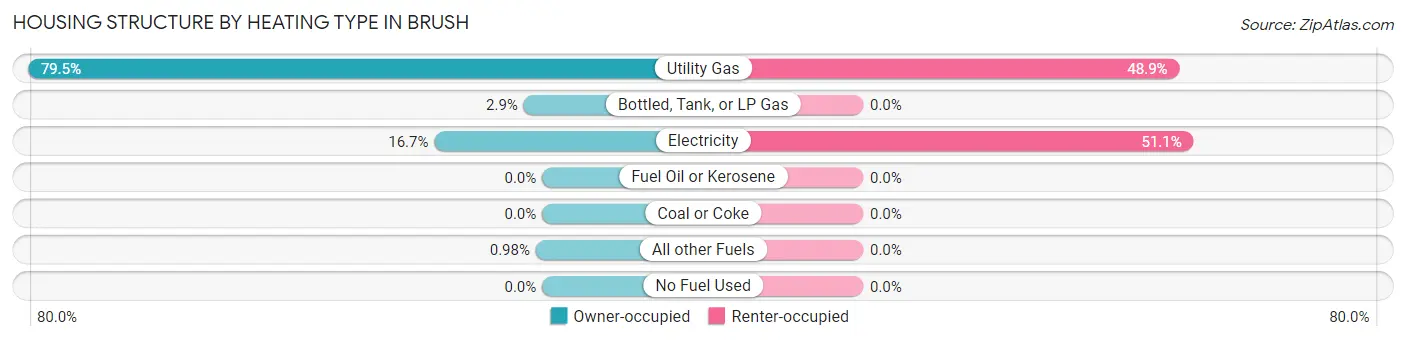
| Heating Type | Owner-occupied | Renter-occupied |
| Utility Gas | 978 (79.5%) | 336 (48.9%) |
| Bottled, Tank, or LP Gas | 35 (2.9%) | 0 (0.0%) |
| Electricity | 205 (16.7%) | 351 (51.1%) |
| Fuel Oil or Kerosene | 0 (0.0%) | 0 (0.0%) |
| Coal or Coke | 0 (0.0%) | 0 (0.0%) |
| All other Fuels | 12 (1.0%) | 0 (0.0%) |
| No Fuel Used | 0 (0.0%) | 0 (0.0%) |
| Total | 1,230 (100.0%) | 687 (100.0%) |
Household Vehicle Usage in Brush
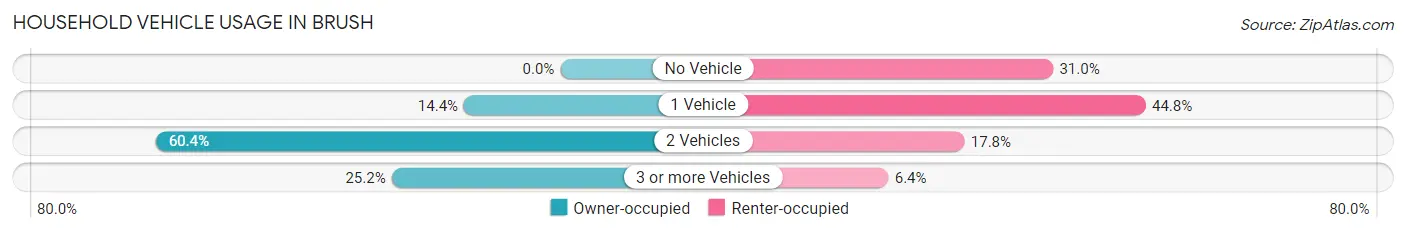
| Vehicles per Household | Owner-occupied | Renter-occupied |
| No Vehicle | 0 (0.0%) | 213 (31.0%) |
| 1 Vehicle | 177 (14.4%) | 308 (44.8%) |
| 2 Vehicles | 743 (60.4%) | 122 (17.8%) |
| 3 or more Vehicles | 310 (25.2%) | 44 (6.4%) |
| Total | 1,230 (100.0%) | 687 (100.0%) |
Real Estate & Mortgages in Brush
Real Estate and Mortgage Overview in Brush
| Characteristic | Without Mortgage | With Mortgage |
| Housing Units | 574 | 656 |
| Median Property Value | $236,700 | $255,600 |
| Median Household Income | $60,313 | $147 |
| Monthly Housing Costs | $535 | $0 |
| Real Estate Taxes | $993 | $0 |
Property Value by Mortgage Status in Brush
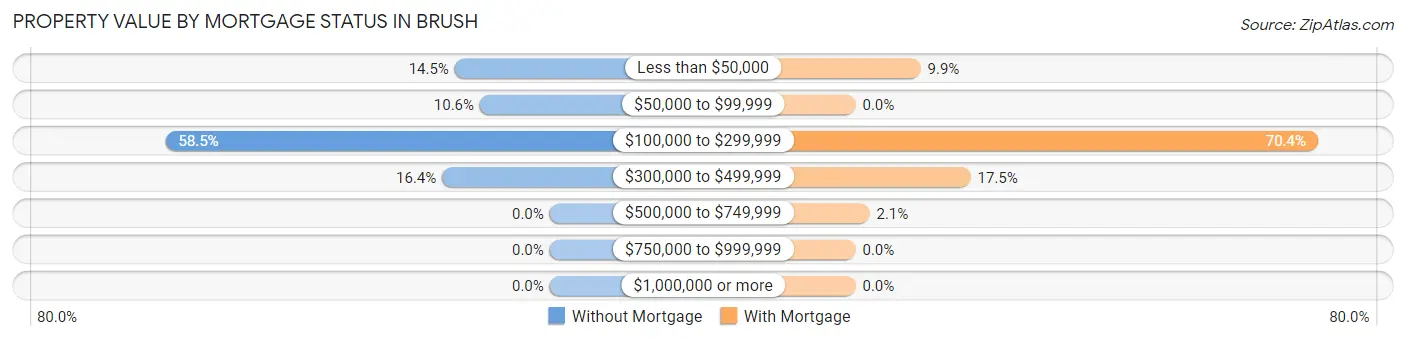
| Property Value | Without Mortgage | With Mortgage |
| Less than $50,000 | 83 (14.5%) | 65 (9.9%) |
| $50,000 to $99,999 | 61 (10.6%) | 0 (0.0%) |
| $100,000 to $299,999 | 336 (58.5%) | 462 (70.4%) |
| $300,000 to $499,999 | 94 (16.4%) | 115 (17.5%) |
| $500,000 to $749,999 | 0 (0.0%) | 14 (2.1%) |
| $750,000 to $999,999 | 0 (0.0%) | 0 (0.0%) |
| $1,000,000 or more | 0 (0.0%) | 0 (0.0%) |
| Total | 574 (100.0%) | 656 (100.0%) |
Household Income by Mortgage Status in Brush
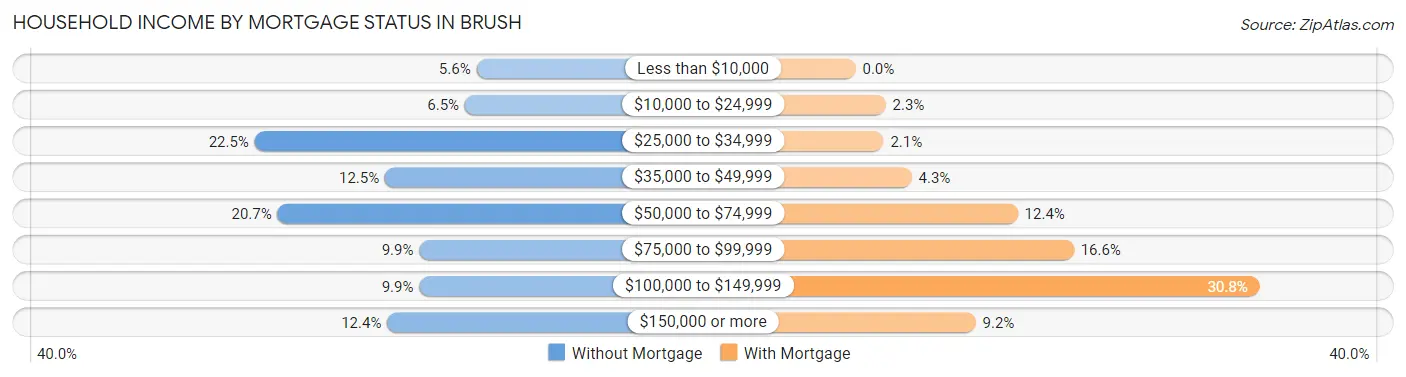
| Household Income | Without Mortgage | With Mortgage |
| Less than $10,000 | 32 (5.6%) | 0 (0.0%) |
| $10,000 to $24,999 | 37 (6.5%) | 15 (2.3%) |
| $25,000 to $34,999 | 129 (22.5%) | 14 (2.1%) |
| $35,000 to $49,999 | 72 (12.5%) | 28 (4.3%) |
| $50,000 to $74,999 | 119 (20.7%) | 81 (12.3%) |
| $75,000 to $99,999 | 57 (9.9%) | 109 (16.6%) |
| $100,000 to $149,999 | 57 (9.9%) | 202 (30.8%) |
| $150,000 or more | 71 (12.4%) | 60 (9.1%) |
| Total | 574 (100.0%) | 656 (100.0%) |
Property Value to Household Income Ratio in Brush
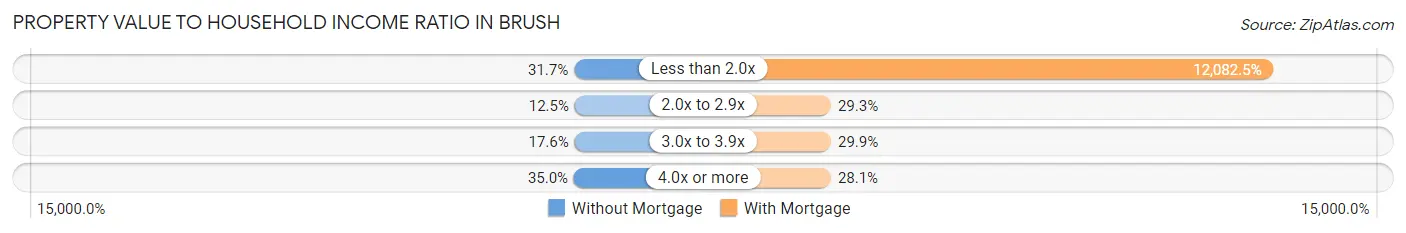
| Value-to-Income Ratio | Without Mortgage | With Mortgage |
| Less than 2.0x | 182 (31.7%) | 79,261 (12,082.5%) |
| 2.0x to 2.9x | 72 (12.5%) | 192 (29.3%) |
| 3.0x to 3.9x | 101 (17.6%) | 196 (29.9%) |
| 4.0x or more | 201 (35.0%) | 184 (28.1%) |
| Total | 574 (100.0%) | 656 (100.0%) |
Real Estate Taxes by Mortgage Status in Brush
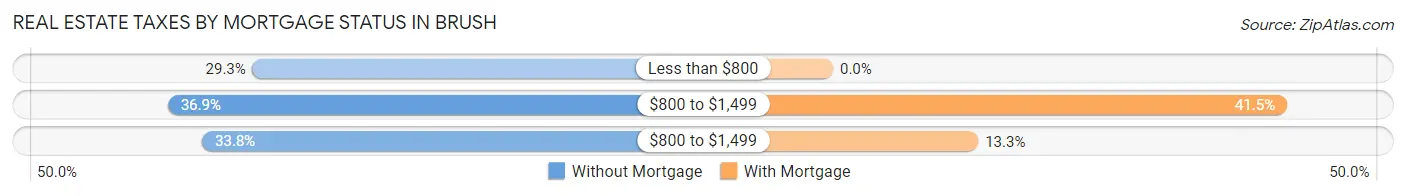
| Property Taxes | Without Mortgage | With Mortgage |
| Less than $800 | 168 (29.3%) | 0 (0.0%) |
| $800 to $1,499 | 212 (36.9%) | 272 (41.5%) |
| $800 to $1,499 | 194 (33.8%) | 87 (13.3%) |
| Total | 574 (100.0%) | 656 (100.0%) |
Health & Disability in Brush
Health Insurance Coverage by Age in Brush
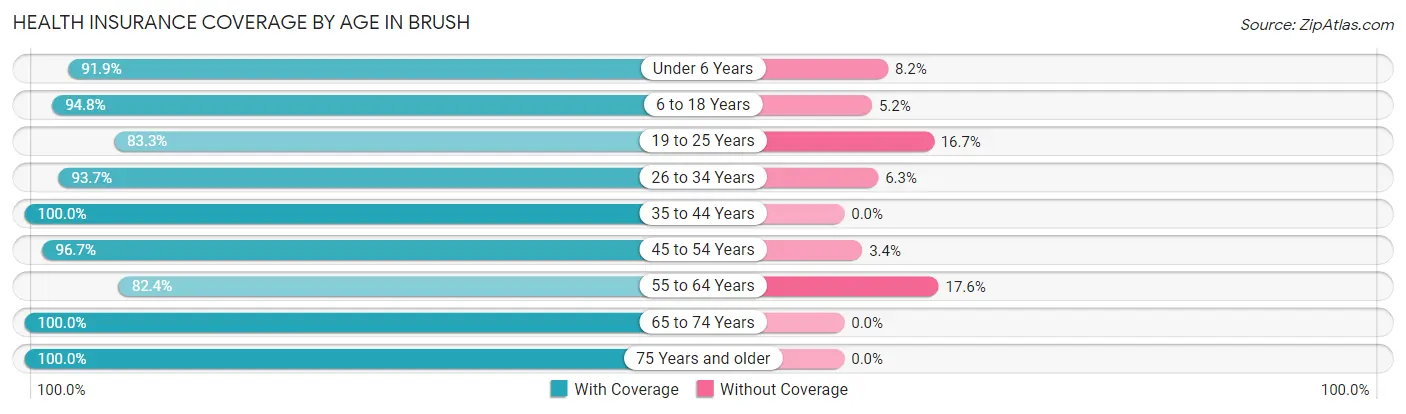
| Age Bracket | With Coverage | Without Coverage |
| Under 6 Years | 530 (91.8%) | 47 (8.2%) |
| 6 to 18 Years | 937 (94.8%) | 51 (5.2%) |
| 19 to 25 Years | 445 (83.3%) | 89 (16.7%) |
| 26 to 34 Years | 710 (93.7%) | 48 (6.3%) |
| 35 to 44 Years | 504 (100.0%) | 0 (0.0%) |
| 45 to 54 Years | 519 (96.7%) | 18 (3.4%) |
| 55 to 64 Years | 366 (82.4%) | 78 (17.6%) |
| 65 to 74 Years | 247 (100.0%) | 0 (0.0%) |
| 75 Years and older | 445 (100.0%) | 0 (0.0%) |
| Total | 4,703 (93.4%) | 331 (6.6%) |
Health Insurance Coverage by Citizenship Status in Brush
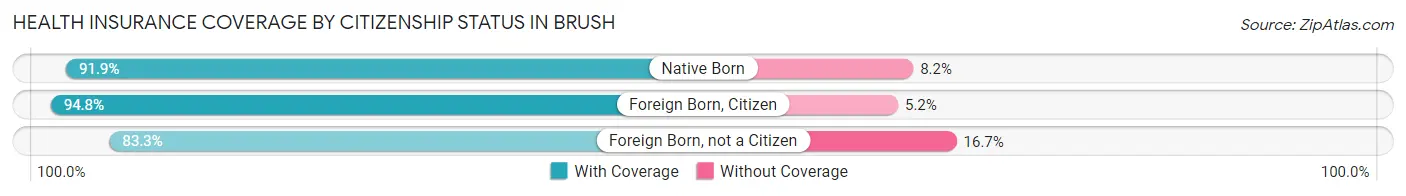
| Citizenship Status | With Coverage | Without Coverage |
| Native Born | 530 (91.8%) | 47 (8.2%) |
| Foreign Born, Citizen | 937 (94.8%) | 51 (5.2%) |
| Foreign Born, not a Citizen | 445 (83.3%) | 89 (16.7%) |
Health Insurance Coverage by Household Income in Brush
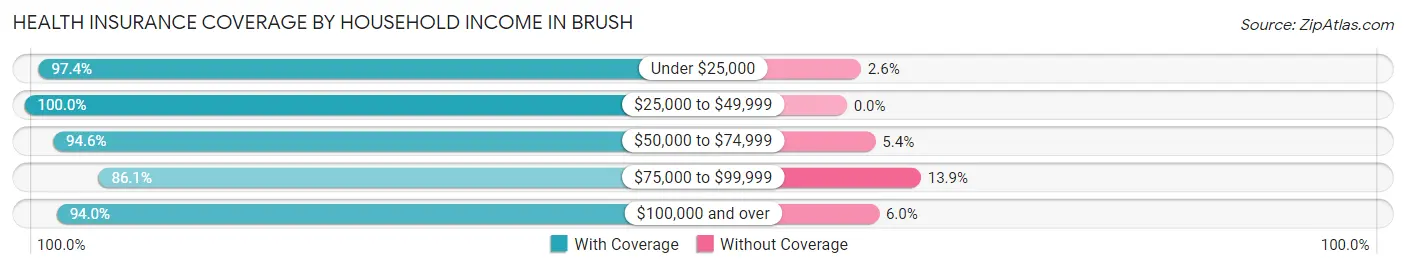
| Household Income | With Coverage | Without Coverage |
| Under $25,000 | 664 (97.4%) | 18 (2.6%) |
| $25,000 to $49,999 | 545 (100.0%) | 0 (0.0%) |
| $50,000 to $74,999 | 1,095 (94.6%) | 62 (5.4%) |
| $75,000 to $99,999 | 1,019 (86.1%) | 164 (13.9%) |
| $100,000 and over | 1,358 (94.0%) | 87 (6.0%) |
Public vs Private Health Insurance Coverage by Age in Brush
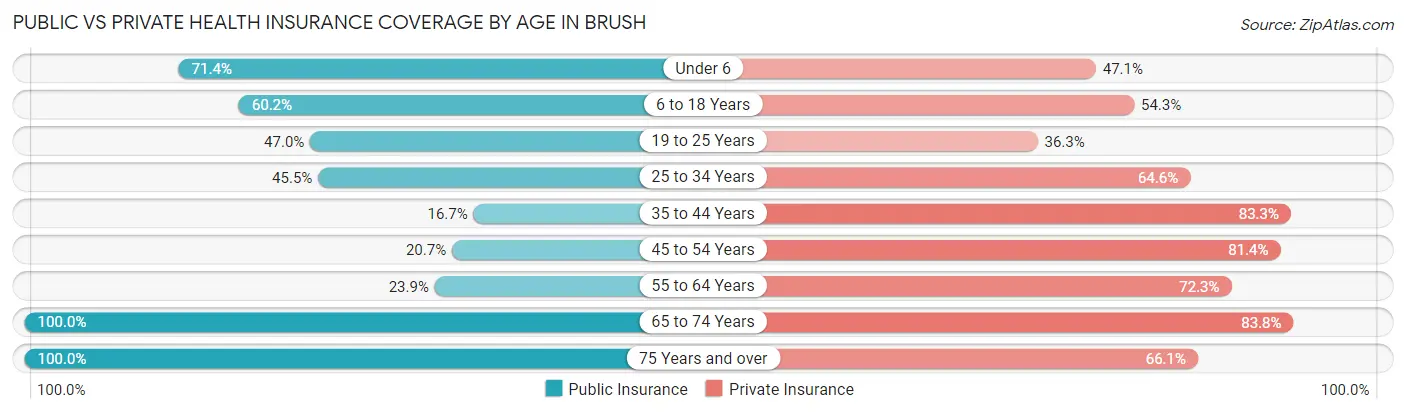
| Age Bracket | Public Insurance | Private Insurance |
| Under 6 | 412 (71.4%) | 272 (47.1%) |
| 6 to 18 Years | 595 (60.2%) | 536 (54.2%) |
| 19 to 25 Years | 251 (47.0%) | 194 (36.3%) |
| 25 to 34 Years | 345 (45.5%) | 490 (64.6%) |
| 35 to 44 Years | 84 (16.7%) | 420 (83.3%) |
| 45 to 54 Years | 111 (20.7%) | 437 (81.4%) |
| 55 to 64 Years | 106 (23.9%) | 321 (72.3%) |
| 65 to 74 Years | 247 (100.0%) | 207 (83.8%) |
| 75 Years and over | 445 (100.0%) | 294 (66.1%) |
| Total | 2,596 (51.6%) | 3,171 (63.0%) |
Disability Status by Sex by Age in Brush
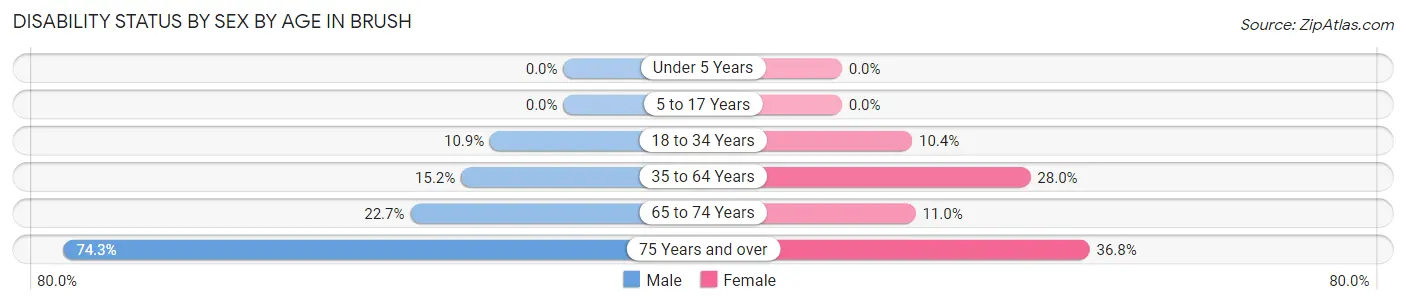
| Age Bracket | Male | Female |
| Under 5 Years | 0 (0.0%) | 0 (0.0%) |
| 5 to 17 Years | 0 (0.0%) | 0 (0.0%) |
| 18 to 34 Years | 64 (10.9%) | 82 (10.4%) |
| 35 to 64 Years | 117 (15.2%) | 200 (28.0%) |
| 65 to 74 Years | 25 (22.7%) | 15 (11.0%) |
| 75 Years and over | 173 (74.3%) | 78 (36.8%) |
Disability Class by Sex by Age in Brush
Disability Class: Hearing Difficulty
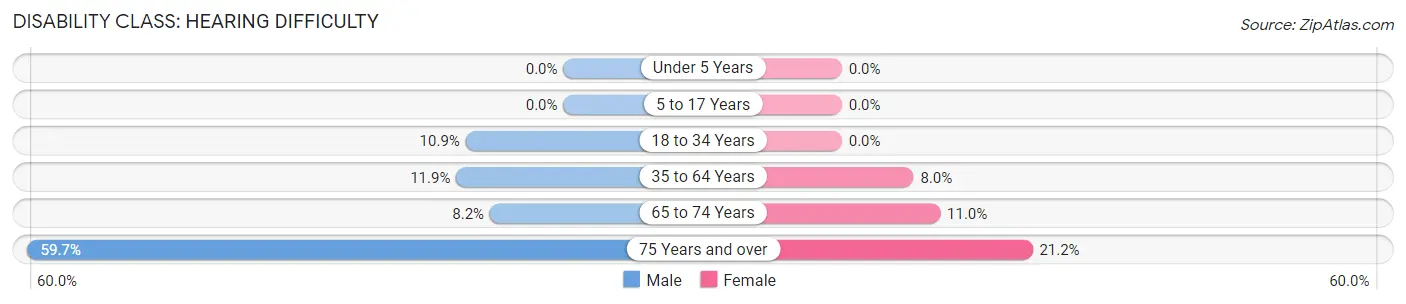
| Age Bracket | Male | Female |
| Under 5 Years | 0 (0.0%) | 0 (0.0%) |
| 5 to 17 Years | 0 (0.0%) | 0 (0.0%) |
| 18 to 34 Years | 64 (10.9%) | 0 (0.0%) |
| 35 to 64 Years | 92 (11.9%) | 57 (8.0%) |
| 65 to 74 Years | 9 (8.2%) | 15 (11.0%) |
| 75 Years and over | 139 (59.7%) | 45 (21.2%) |
Disability Class: Vision Difficulty
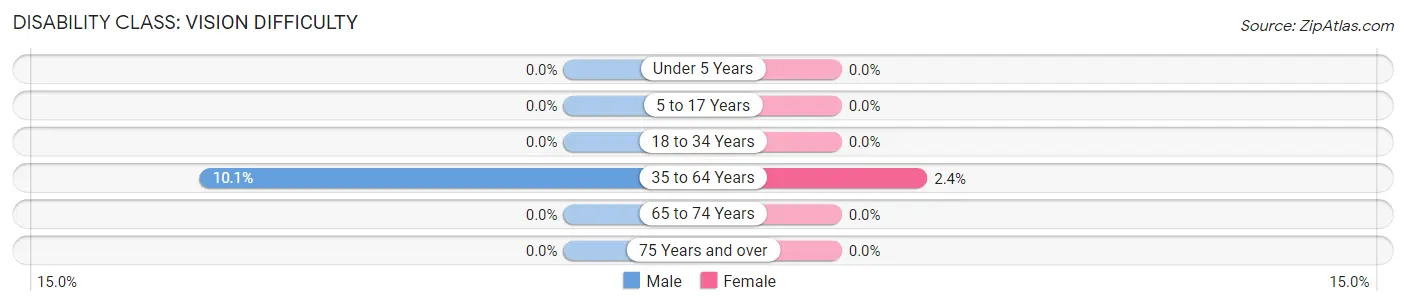
| Age Bracket | Male | Female |
| Under 5 Years | 0 (0.0%) | 0 (0.0%) |
| 5 to 17 Years | 0 (0.0%) | 0 (0.0%) |
| 18 to 34 Years | 0 (0.0%) | 0 (0.0%) |
| 35 to 64 Years | 78 (10.1%) | 17 (2.4%) |
| 65 to 74 Years | 0 (0.0%) | 0 (0.0%) |
| 75 Years and over | 0 (0.0%) | 0 (0.0%) |
Disability Class: Cognitive Difficulty
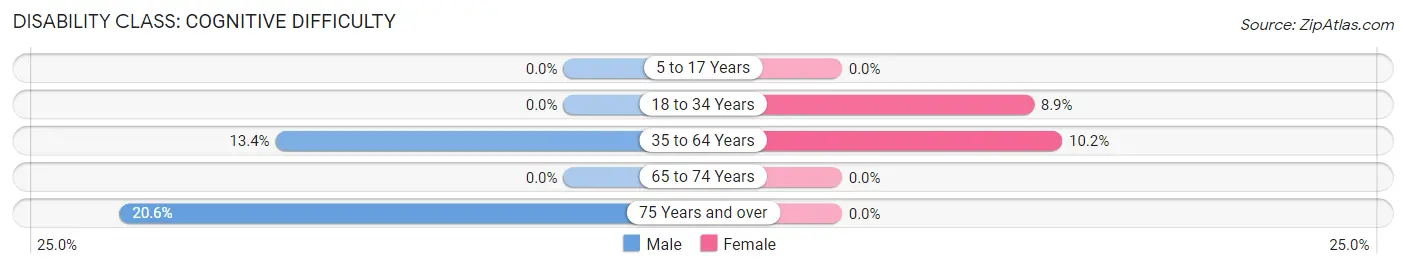
| Age Bracket | Male | Female |
| 5 to 17 Years | 0 (0.0%) | 0 (0.0%) |
| 18 to 34 Years | 0 (0.0%) | 70 (8.9%) |
| 35 to 64 Years | 103 (13.4%) | 73 (10.2%) |
| 65 to 74 Years | 0 (0.0%) | 0 (0.0%) |
| 75 Years and over | 48 (20.6%) | 0 (0.0%) |
Disability Class: Ambulatory Difficulty
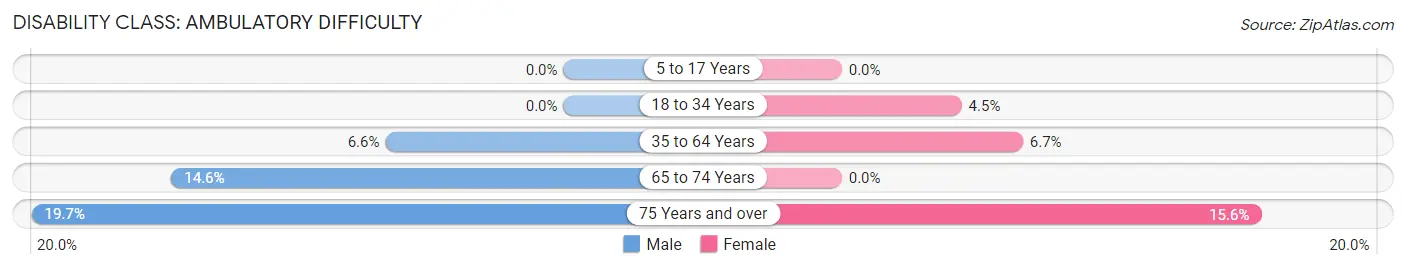
| Age Bracket | Male | Female |
| 5 to 17 Years | 0 (0.0%) | 0 (0.0%) |
| 18 to 34 Years | 0 (0.0%) | 35 (4.4%) |
| 35 to 64 Years | 51 (6.6%) | 48 (6.7%) |
| 65 to 74 Years | 16 (14.5%) | 0 (0.0%) |
| 75 Years and over | 46 (19.7%) | 33 (15.6%) |
Disability Class: Self-Care Difficulty
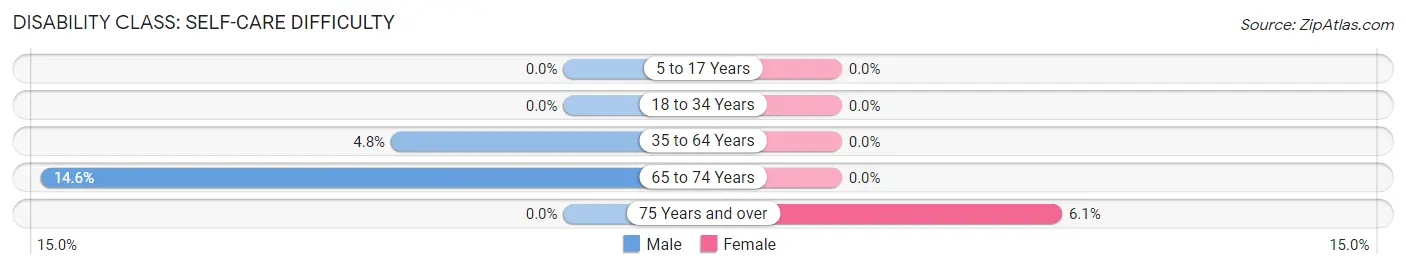
| Age Bracket | Male | Female |
| 5 to 17 Years | 0 (0.0%) | 0 (0.0%) |
| 18 to 34 Years | 0 (0.0%) | 0 (0.0%) |
| 35 to 64 Years | 37 (4.8%) | 0 (0.0%) |
| 65 to 74 Years | 16 (14.5%) | 0 (0.0%) |
| 75 Years and over | 0 (0.0%) | 13 (6.1%) |
Technology Access in Brush
Computing Device Access in Brush
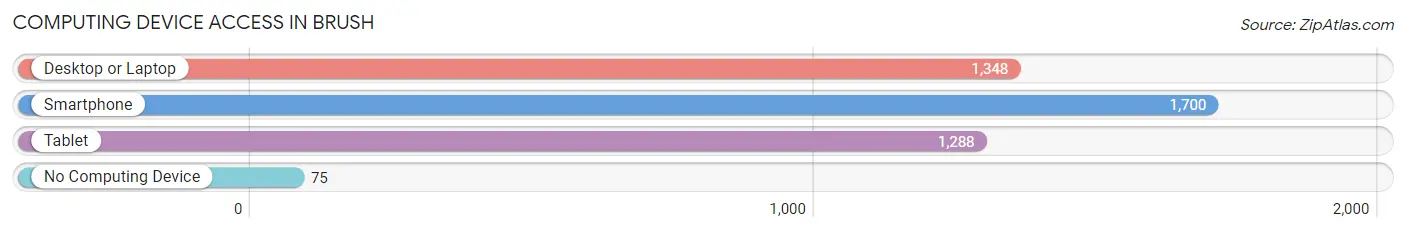
| Device Type | # Households | % Households |
| Desktop or Laptop | 1,348 | 70.3% |
| Smartphone | 1,700 | 88.7% |
| Tablet | 1,288 | 67.2% |
| No Computing Device | 75 | 3.9% |
| Total | 1,917 | 100.0% |
Internet Access in Brush
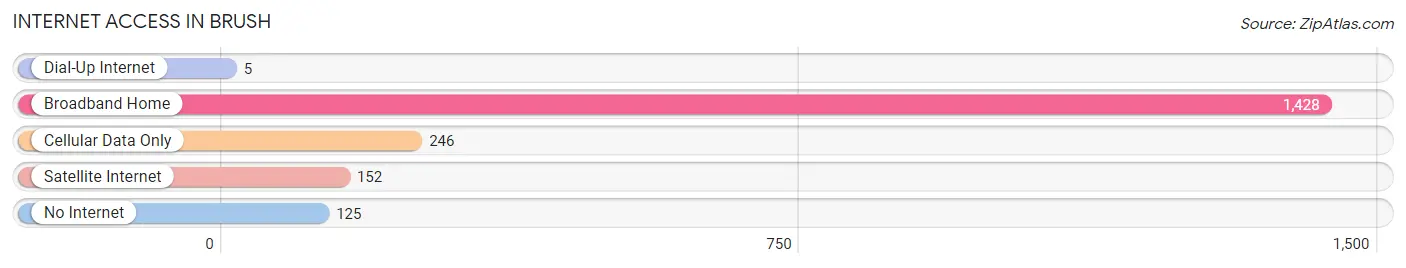
| Internet Type | # Households | % Households |
| Dial-Up Internet | 5 | 0.3% |
| Broadband Home | 1,428 | 74.5% |
| Cellular Data Only | 246 | 12.8% |
| Satellite Internet | 152 | 7.9% |
| No Internet | 125 | 6.5% |
| Total | 1,917 | 100.0% |
Brush Summary
Brush is a small city located in Morgan County, Colorado, United States. The city is situated along the South Platte River, approximately 100 miles northeast of Denver. As of the 2010 census, the population of Brush was 5,463.
Geography
Brush is located at 40°17'25" North, 103°36'17" West (40.290278, -103.604722). According to the United States Census Bureau, the city has a total area of 2.3 square miles, all of it land.
History
The area that is now Brush was first settled in the late 1800s by homesteaders. The town was named after a nearby brush-covered hill. The town was officially incorporated in 1885.
In the early 1900s, Brush was a major stop on the Union Pacific Railroad. The railroad brought many new settlers to the area, and the town grew rapidly. By 1910, the population had grown to 1,845.
In the 1920s, the Great Western Sugar Company opened a sugar beet processing plant in Brush. This brought a large influx of new residents to the area, and the population grew to 3,845 by 1930.
The sugar beet industry continued to be a major part of the local economy until the late 1970s, when the plant closed. Since then, the economy of Brush has diversified, with agriculture, manufacturing, and retail businesses providing employment for many of the city's residents.
Economy
The economy of Brush is largely based on agriculture, manufacturing, and retail businesses. The city is home to several large agricultural operations, including a large dairy farm and a large hog farm.
Manufacturing is also an important part of the local economy. The city is home to several manufacturing companies, including a plastics manufacturer and a metal fabrication company.
Retail businesses are also an important part of the local economy. The city is home to several large retail stores, including a Walmart Supercenter and a Lowe's Home Improvement store.
Demographics
As of the 2010 census, the population of Brush was 5,463. The racial makeup of the city was 87.3% White, 0.7% African American, 0.7% Native American, 0.4% Asian, 0.1% Pacific Islander, 8.7% from other races, and 2.1% from two or more races. Hispanic or Latino of any race were 20.2% of the population.
The median income for a household in Brush was $37,917, and the median income for a family was $45,938. The per capita income for the city was $17,945. About 11.3% of families and 14.2% of the population were below the poverty line, including 19.2% of those under age 18 and 8.2% of those age 65 or over.
Common Questions
What is Per Capita Income in Brush?
Per Capita income in Brush is $29,272.
What is the Median Family Income in Brush?
Median Family Income in Brush is $78,522.
What is the Median Household income in Brush?
Median Household Income in Brush is $64,475.
What is Income or Wage Gap in Brush?
Income or Wage Gap in Brush is 53.2%.
Women in Brush earn 46.8 cents for every dollar earned by a man.
What is Inequality or Gini Index in Brush?
Inequality or Gini Index in Brush is 0.48.
What is the Total Population of Brush?
Total Population of Brush is 5,304.
What is the Total Male Population of Brush?
Total Male Population of Brush is 2,613.
What is the Total Female Population of Brush?
Total Female Population of Brush is 2,691.
What is the Ratio of Males per 100 Females in Brush?
There are 97.10 Males per 100 Females in Brush.
What is the Ratio of Females per 100 Males in Brush?
There are 102.99 Females per 100 Males in Brush.
What is the Median Population Age in Brush?
Median Population Age in Brush is 31.5 Years.
What is the Average Family Size in Brush
Average Family Size in Brush is 3.2 People.
What is the Average Household Size in Brush
Average Household Size in Brush is 2.6 People.
How Large is the Labor Force in Brush?
There are 2,423 People in the Labor Forcein in Brush.
What is the Percentage of People in the Labor Force in Brush?
61.4% of People are in the Labor Force in Brush.
What is the Unemployment Rate in Brush?
Unemployment Rate in Brush is 3.9%.