Black Hawk, CO Map & Demographics
Black Hawk Map
Black Hawk Overview
$61,069
PER CAPITA INCOME
$65,417
AVG HOUSEHOLD INCOME
0.37
INEQUALITY / GINI INDEX
129
TOTAL POPULATION
81
MALE POPULATION
48
FEMALE POPULATION
168.75
MALES / 100 FEMALES
59.26
FEMALES / 100 MALES
55.2
MEDIAN AGE
3.0
AVG FAMILY SIZE
2.4
AVG HOUSEHOLD SIZE
90
LABOR FORCE [ PEOPLE ]
73.2%
PERCENT IN LABOR FORCE
Black Hawk Zip Codes
Black Hawk Area Codes
Income in Black Hawk
Income Overview in Black Hawk
| Characteristic | Number | Measure |
| Per Capita Income | 129 | $61,069 |
| Median Family Income | 23 | $0 |
| Mean Family Income | 23 | $97,117 |
| Median Household Income | 55 | $65,417 |
| Mean Household Income | 55 | $83,522 |
| Income Deficit | 23 | $0 |
| Wage / Income Gap (%) | 129 | 0.00% |
| Wage / Income Gap ($) | 129 | 100.00¢ per $1 |
| Gini / Inequality Index | 129 | 0.37 |
Earnings by Sex in Black Hawk
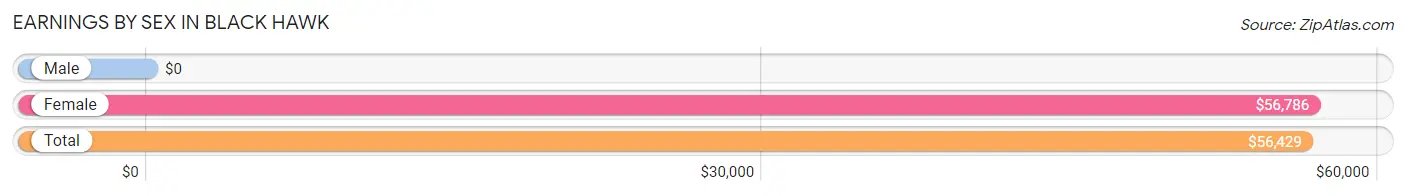
| Sex | Number | Average Earnings |
| Male | 66 (73.3%) | $0 |
| Female | 24 (26.7%) | $56,786 |
| Total | 90 (100.0%) | $56,429 |
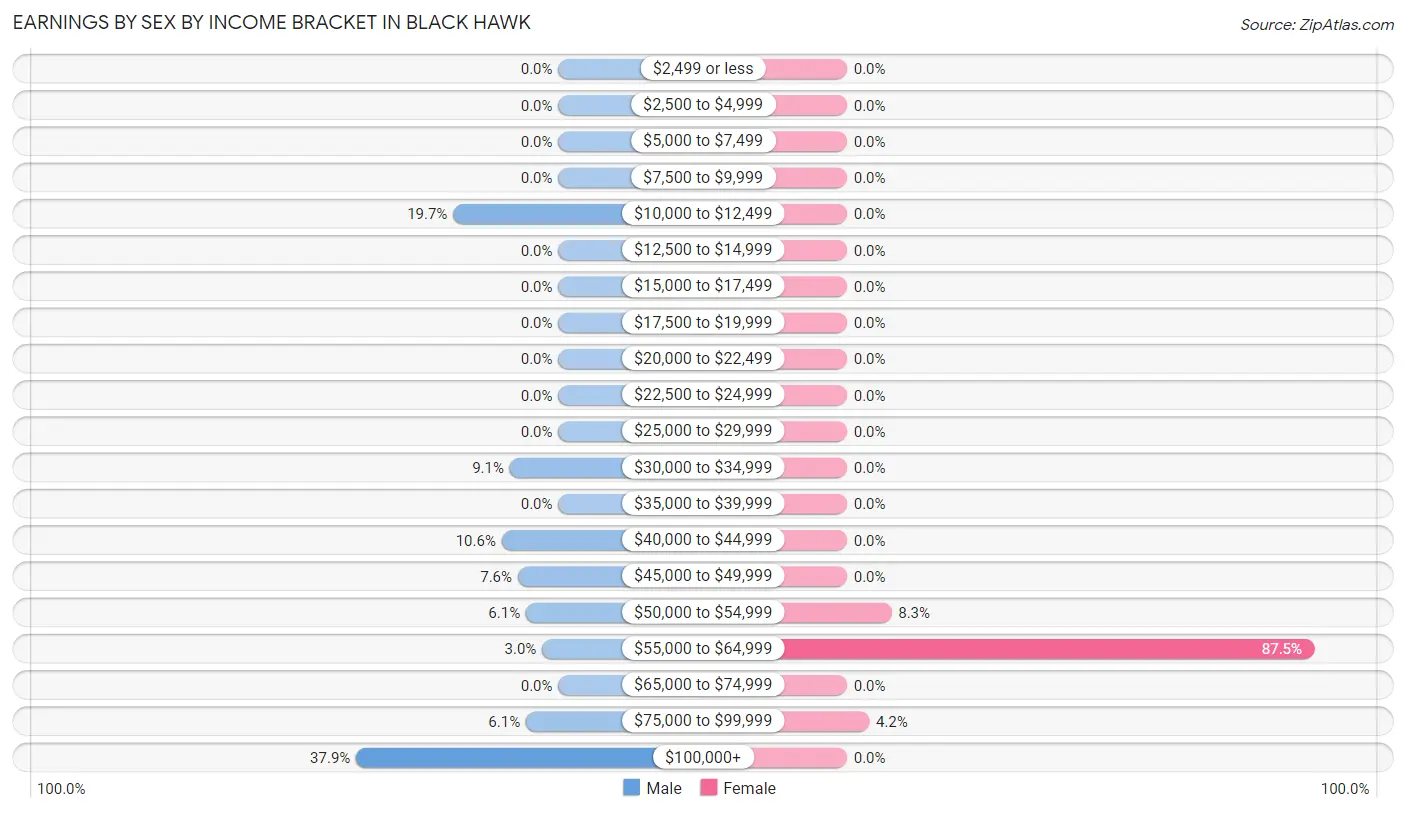
Earnings by Sex by Income Bracket in Black Hawk
The most common earnings brackets in Black Hawk are $100,000+ for men (25 | 37.9%) and $55,000 to $64,999 for women (21 | 87.5%).
| Income | Male | Female |
| $2,499 or less | 0 (0.0%) | 0 (0.0%) |
| $2,500 to $4,999 | 0 (0.0%) | 0 (0.0%) |
| $5,000 to $7,499 | 0 (0.0%) | 0 (0.0%) |
| $7,500 to $9,999 | 0 (0.0%) | 0 (0.0%) |
| $10,000 to $12,499 | 13 (19.7%) | 0 (0.0%) |
| $12,500 to $14,999 | 0 (0.0%) | 0 (0.0%) |
| $15,000 to $17,499 | 0 (0.0%) | 0 (0.0%) |
| $17,500 to $19,999 | 0 (0.0%) | 0 (0.0%) |
| $20,000 to $22,499 | 0 (0.0%) | 0 (0.0%) |
| $22,500 to $24,999 | 0 (0.0%) | 0 (0.0%) |
| $25,000 to $29,999 | 0 (0.0%) | 0 (0.0%) |
| $30,000 to $34,999 | 6 (9.1%) | 0 (0.0%) |
| $35,000 to $39,999 | 0 (0.0%) | 0 (0.0%) |
| $40,000 to $44,999 | 7 (10.6%) | 0 (0.0%) |
| $45,000 to $49,999 | 5 (7.6%) | 0 (0.0%) |
| $50,000 to $54,999 | 4 (6.1%) | 2 (8.3%) |
| $55,000 to $64,999 | 2 (3.0%) | 21 (87.5%) |
| $65,000 to $74,999 | 0 (0.0%) | 0 (0.0%) |
| $75,000 to $99,999 | 4 (6.1%) | 1 (4.2%) |
| $100,000+ | 25 (37.9%) | 0 (0.0%) |
| Total | 66 (100.0%) | 24 (100.0%) |
Earnings by Sex by Educational Attainment in Black Hawk
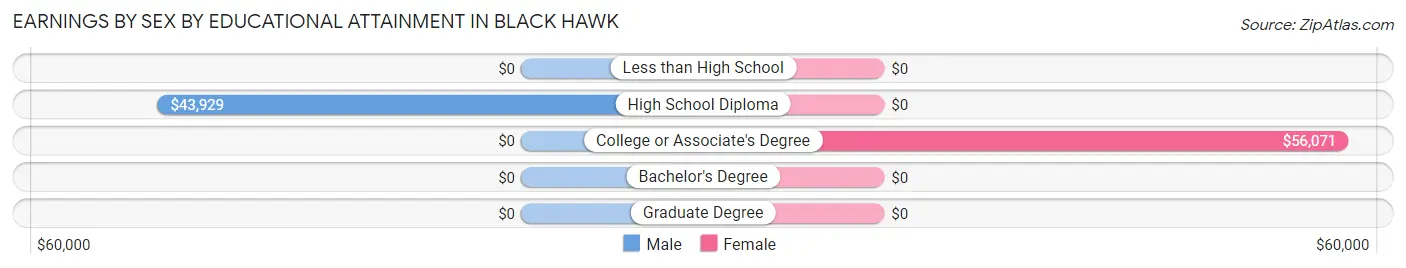
| Educational Attainment | Male Income | Female Income |
| Less than High School | - | - |
| High School Diploma | $43,929 | $0 |
| College or Associate's Degree | - | - |
| Bachelor's Degree | - | - |
| Graduate Degree | - | - |
| Total | - | - |
Family Income in Black Hawk
Family Income Brackets in Black Hawk
According to the Black Hawk family income data, there are 9 families falling into the $50,000 to $74,999 income range, which is the most common income bracket and makes up 39.1% of all families.
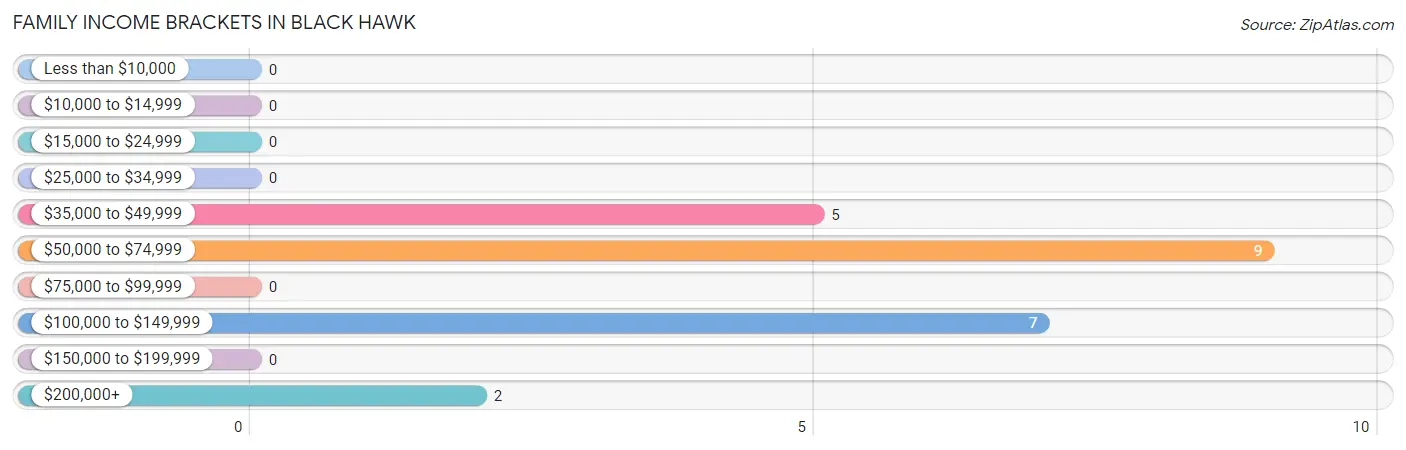
| Income Bracket | # Families | % Families |
| Less than $10,000 | 0 | 0.0% |
| $10,000 to $14,999 | 0 | 0.0% |
| $15,000 to $24,999 | 0 | 0.0% |
| $25,000 to $34,999 | 0 | 0.0% |
| $35,000 to $49,999 | 5 | 21.7% |
| $50,000 to $74,999 | 9 | 39.1% |
| $75,000 to $99,999 | 0 | 0.0% |
| $100,000 to $149,999 | 7 | 30.4% |
| $150,000 to $199,999 | 0 | 0.0% |
| $200,000+ | 2 | 8.7% |
Family Income by Famaliy Size in Black Hawk
2-person families (16 | 69.6%) account for the highest median family income in Black Hawk with $65,833 per family, while 2-person families (16 | 69.6%) have the highest median income of $32,916 per family member.
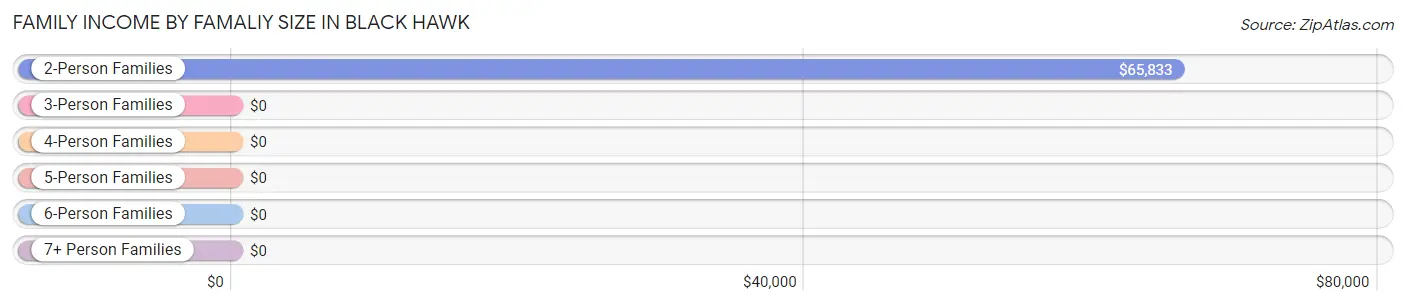
| Income Bracket | # Families | Median Income |
| 2-Person Families | 16 (69.6%) | $65,833 |
| 3-Person Families | 7 (30.4%) | $0 |
| 4-Person Families | 0 (0.0%) | $0 |
| 5-Person Families | 0 (0.0%) | $0 |
| 6-Person Families | 0 (0.0%) | $0 |
| 7+ Person Families | 0 (0.0%) | $0 |
| Total | 23 (100.0%) | $0 |
Family Income by Number of Earners in Black Hawk
| Number of Earners | # Families | Median Income |
| No Earners | 1 (4.3%) | $0 |
| 1 Earner | 14 (60.9%) | $0 |
| 2 Earners | 8 (34.8%) | $0 |
| 3+ Earners | 0 (0.0%) | $0 |
| Total | 23 (100.0%) | $0 |
Household Income in Black Hawk
Household Income Brackets in Black Hawk
With 19 households falling in the category, the $50,000 to $74,999 income range is the most frequent in Black Hawk, accounting for 34.5% of all households.
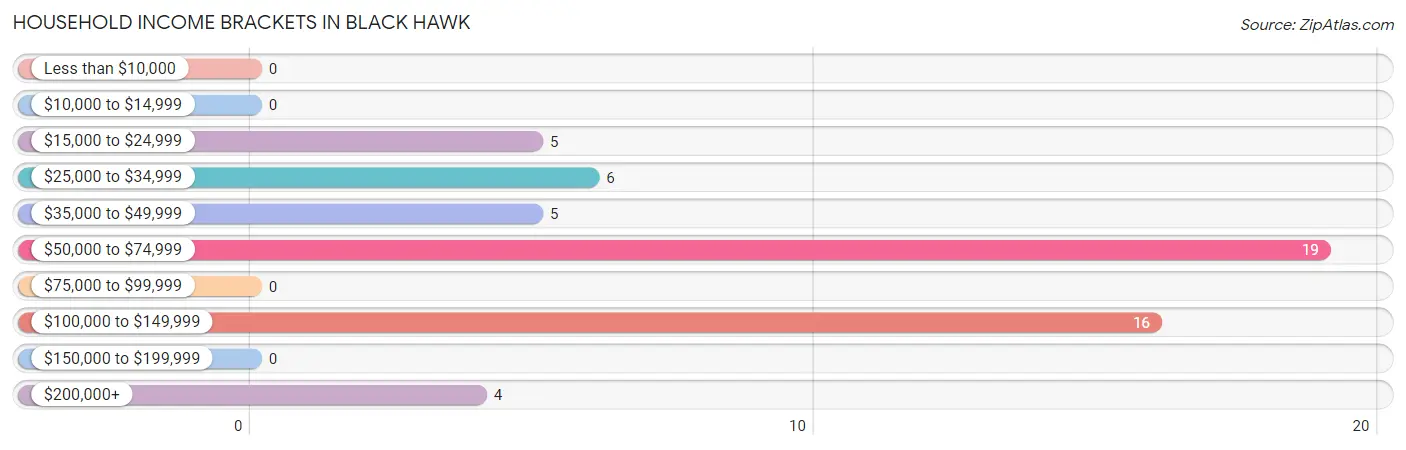
| Income Bracket | # Households | % Households |
| Less than $10,000 | 0 | 0.0% |
| $10,000 to $14,999 | 0 | 0.0% |
| $15,000 to $24,999 | 5 | 9.1% |
| $25,000 to $34,999 | 6 | 10.9% |
| $35,000 to $49,999 | 5 | 9.1% |
| $50,000 to $74,999 | 19 | 34.5% |
| $75,000 to $99,999 | 0 | 0.0% |
| $100,000 to $149,999 | 16 | 29.1% |
| $150,000 to $199,999 | 0 | 0.0% |
| $200,000+ | 4 | 7.3% |
Household Income by Householder Age in Black Hawk
The median household income in Black Hawk is $65,417, with the highest median household income of $120,536 found in the 25 to 44 years age bracket for the primary householder. A total of 11 households (20.0%) fall into this category.
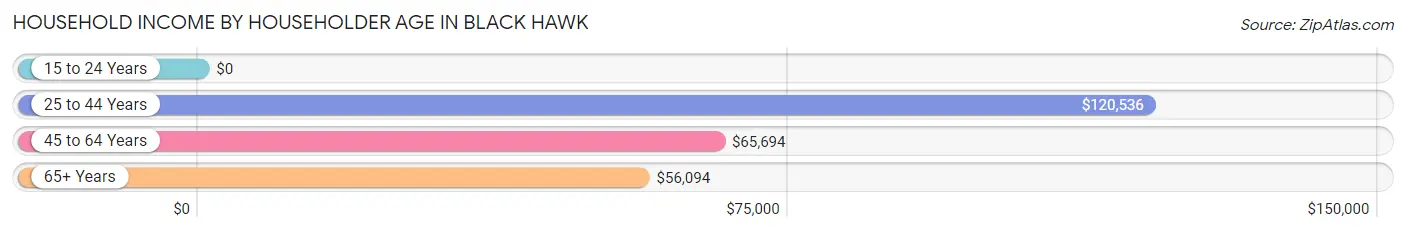
| Income Bracket | # Households | Median Income |
| 15 to 24 Years | 0 (0.0%) | $0 |
| 25 to 44 Years | 11 (20.0%) | $120,536 |
| 45 to 64 Years | 17 (30.9%) | $65,694 |
| 65+ Years | 27 (49.1%) | $56,094 |
| Total | 55 (100.0%) | $65,417 |
Poverty in Black Hawk
Income Below Poverty by Sex and Age in Black Hawk
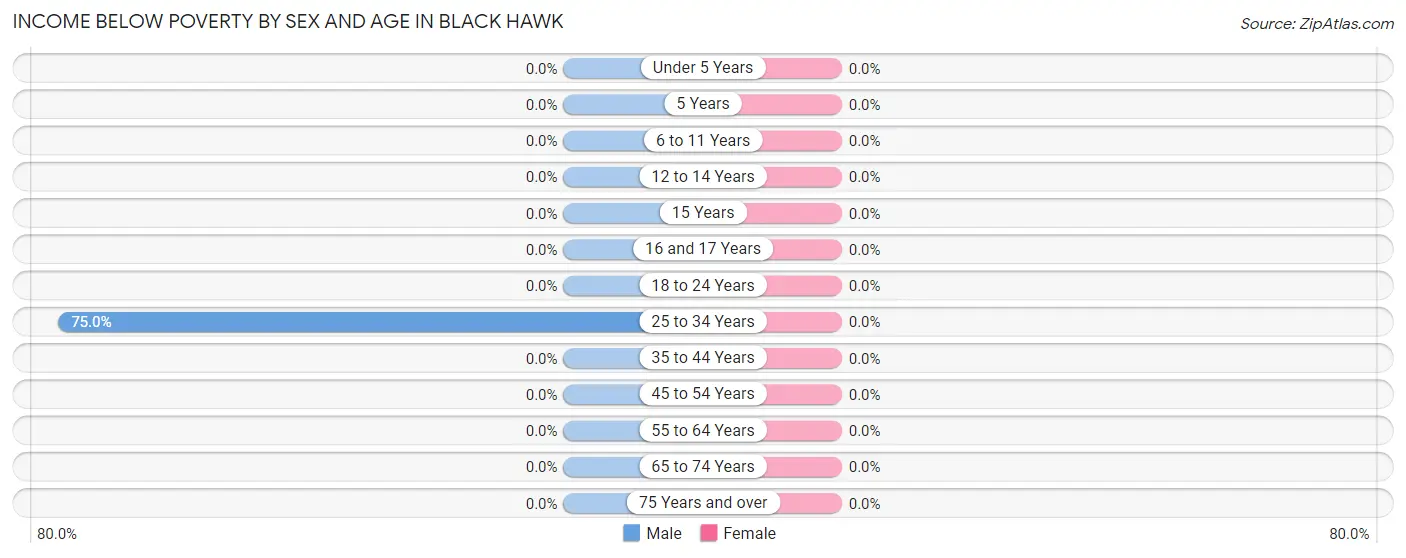
| Age Bracket | Male | Female |
| Under 5 Years | 0 (0.0%) | 0 (0.0%) |
| 5 Years | 0 (0.0%) | 0 (0.0%) |
| 6 to 11 Years | 0 (0.0%) | 0 (0.0%) |
| 12 to 14 Years | 0 (0.0%) | 0 (0.0%) |
| 15 Years | 0 (0.0%) | 0 (0.0%) |
| 16 and 17 Years | 0 (0.0%) | 0 (0.0%) |
| 18 to 24 Years | 0 (0.0%) | 0 (0.0%) |
| 25 to 34 Years | 6 (75.0%) | 0 (0.0%) |
| 35 to 44 Years | 0 (0.0%) | 0 (0.0%) |
| 45 to 54 Years | 0 (0.0%) | 0 (0.0%) |
| 55 to 64 Years | 0 (0.0%) | 0 (0.0%) |
| 65 to 74 Years | 0 (0.0%) | 0 (0.0%) |
| 75 Years and over | 0 (0.0%) | 0 (0.0%) |
| Total | 6 (7.6%) | 0 (0.0%) |
Income Above Poverty by Sex and Age in Black Hawk
According to the poverty statistics in Black Hawk, males aged 35 to 44 years and females aged 25 to 34 years are the age groups that are most secure financially, with 100.0% of males and 100.0% of females in these age groups living above the poverty line.
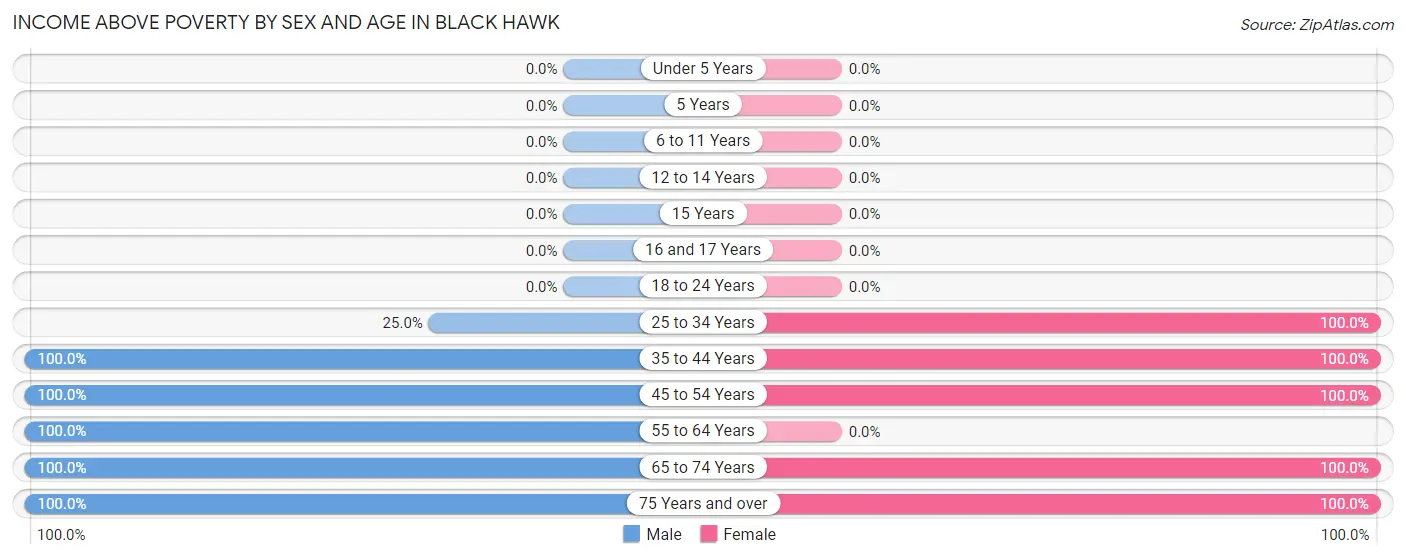
| Age Bracket | Male | Female |
| Under 5 Years | 0 (0.0%) | 0 (0.0%) |
| 5 Years | 0 (0.0%) | 0 (0.0%) |
| 6 to 11 Years | 0 (0.0%) | 0 (0.0%) |
| 12 to 14 Years | 0 (0.0%) | 0 (0.0%) |
| 15 Years | 0 (0.0%) | 0 (0.0%) |
| 16 and 17 Years | 0 (0.0%) | 0 (0.0%) |
| 18 to 24 Years | 0 (0.0%) | 0 (0.0%) |
| 25 to 34 Years | 2 (25.0%) | 9 (100.0%) |
| 35 to 44 Years | 11 (100.0%) | 9 (100.0%) |
| 45 to 54 Years | 6 (100.0%) | 14 (100.0%) |
| 55 to 64 Years | 7 (100.0%) | 0 (0.0%) |
| 65 to 74 Years | 34 (100.0%) | 1 (100.0%) |
| 75 Years and over | 13 (100.0%) | 11 (100.0%) |
| Total | 73 (92.4%) | 44 (100.0%) |
Income Below Poverty Among Married-Couple Families in Black Hawk
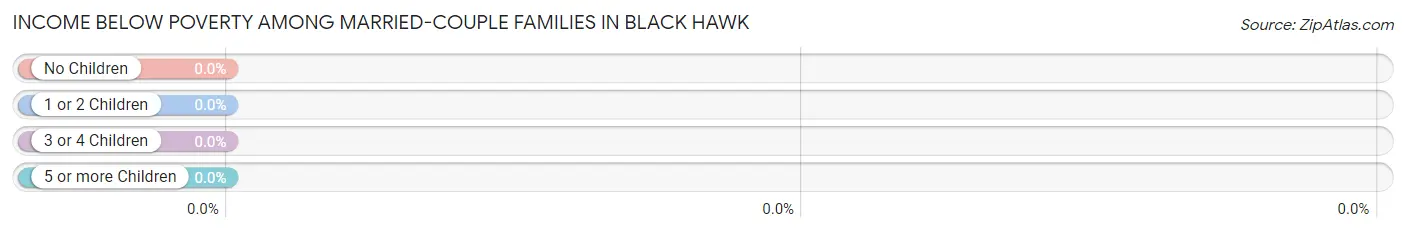
| Children | Above Poverty | Below Poverty |
| No Children | 11 (100.0%) | 0 (0.0%) |
| 1 or 2 Children | 0 (0.0%) | 0 (0.0%) |
| 3 or 4 Children | 0 (0.0%) | 0 (0.0%) |
| 5 or more Children | 0 (0.0%) | 0 (0.0%) |
| Total | 11 (100.0%) | 0 (0.0%) |
Income Below Poverty Among Single-Parent Households in Black Hawk
| Children | Single Father | Single Mother |
| No Children | 0 (0.0%) | 0 (0.0%) |
| 1 or 2 Children | 0 (0.0%) | 0 (0.0%) |
| 3 or 4 Children | 0 (0.0%) | 0 (0.0%) |
| 5 or more Children | 0 (0.0%) | 0 (0.0%) |
| Total | 0 (0.0%) | 0 (0.0%) |
Income Below Poverty Among Married-Couple vs Single-Parent Households in Black Hawk
| Children | Married-Couple Families | Single-Parent Households |
| No Children | 0 (0.0%) | 0 (0.0%) |
| 1 or 2 Children | 0 (0.0%) | 0 (0.0%) |
| 3 or 4 Children | 0 (0.0%) | 0 (0.0%) |
| 5 or more Children | 0 (0.0%) | 0 (0.0%) |
| Total | 0 (0.0%) | 0 (0.0%) |
Race in Black Hawk
The most populous races in Black Hawk are White / Caucasian (94 | 72.9%), Hispanic or Latino (34 | 26.4%), and Two or more Races (34 | 26.4%).
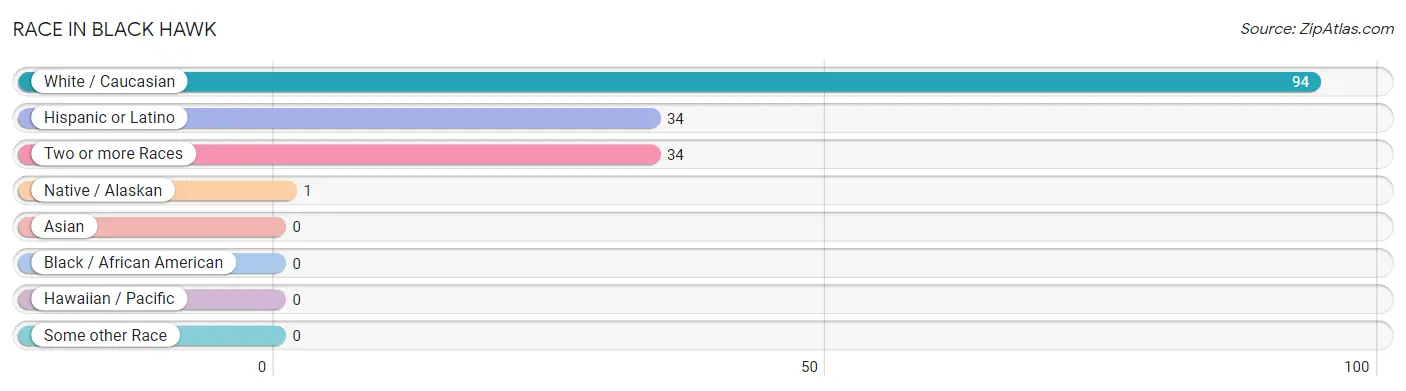
| Race | # Population | % Population |
| Asian | 0 | 0.0% |
| Black / African American | 0 | 0.0% |
| Hawaiian / Pacific | 0 | 0.0% |
| Hispanic or Latino | 34 | 26.4% |
| Native / Alaskan | 1 | 0.8% |
| White / Caucasian | 94 | 72.9% |
| Two or more Races | 34 | 26.4% |
| Some other Race | 0 | 0.0% |
| Total | 129 | 100.0% |
Ancestry in Black Hawk
The most populous ancestries reported in Black Hawk are English (28 | 21.7%), Puerto Rican (25 | 19.4%), Irish (14 | 10.8%), Korean (9 | 7.0%), and Spaniard (9 | 7.0%), together accounting for 65.9% of all Black Hawk residents.
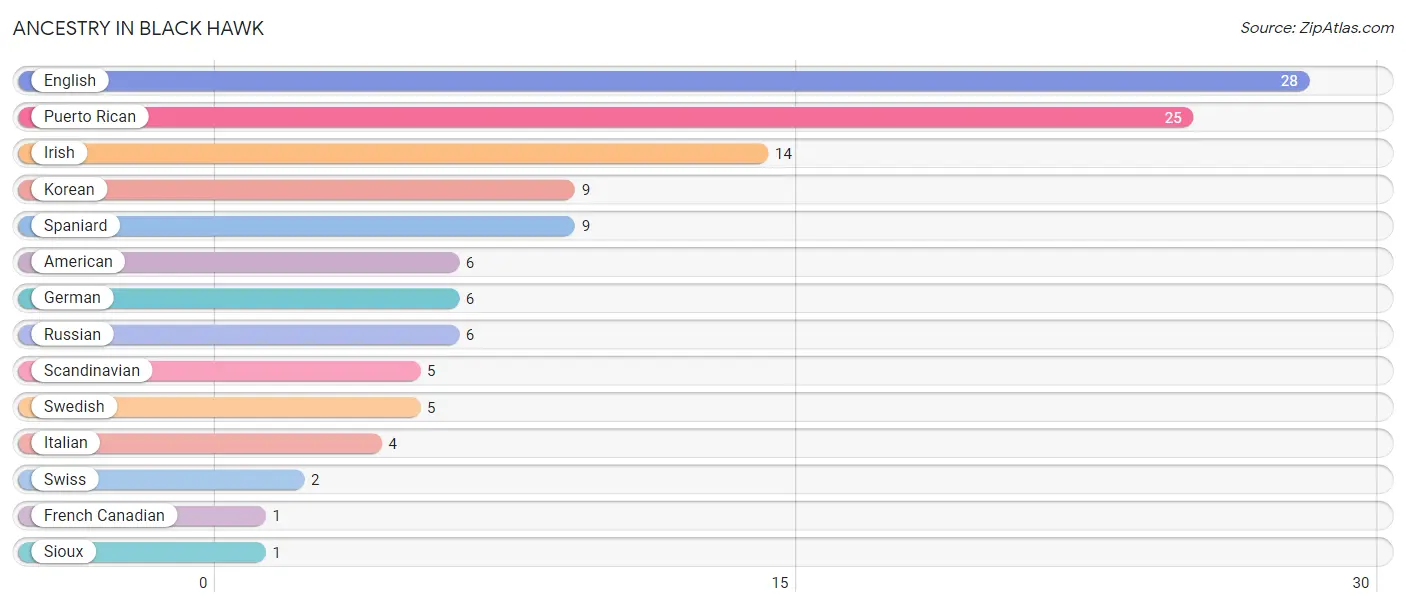
| Ancestry | # Population | % Population |
| American | 6 | 4.6% |
| English | 28 | 21.7% |
| French Canadian | 1 | 0.8% |
| German | 6 | 4.6% |
| Irish | 14 | 10.8% |
| Italian | 4 | 3.1% |
| Korean | 9 | 7.0% |
| Puerto Rican | 25 | 19.4% |
| Russian | 6 | 4.6% |
| Scandinavian | 5 | 3.9% |
| Sioux | 1 | 0.8% |
| Spaniard | 9 | 7.0% |
| Swedish | 5 | 3.9% |
| Swiss | 2 | 1.5% | View All 14 Rows |
Immigrants in Black Hawk

| Immigration Origin | # Population | % Population | View All 0 Rows |
Sex and Age in Black Hawk
Sex and Age in Black Hawk
The most populous age groups in Black Hawk are 65 to 69 Years (26 | 32.1%) for men and 30 to 34 Years (9 | 18.8%) for women.
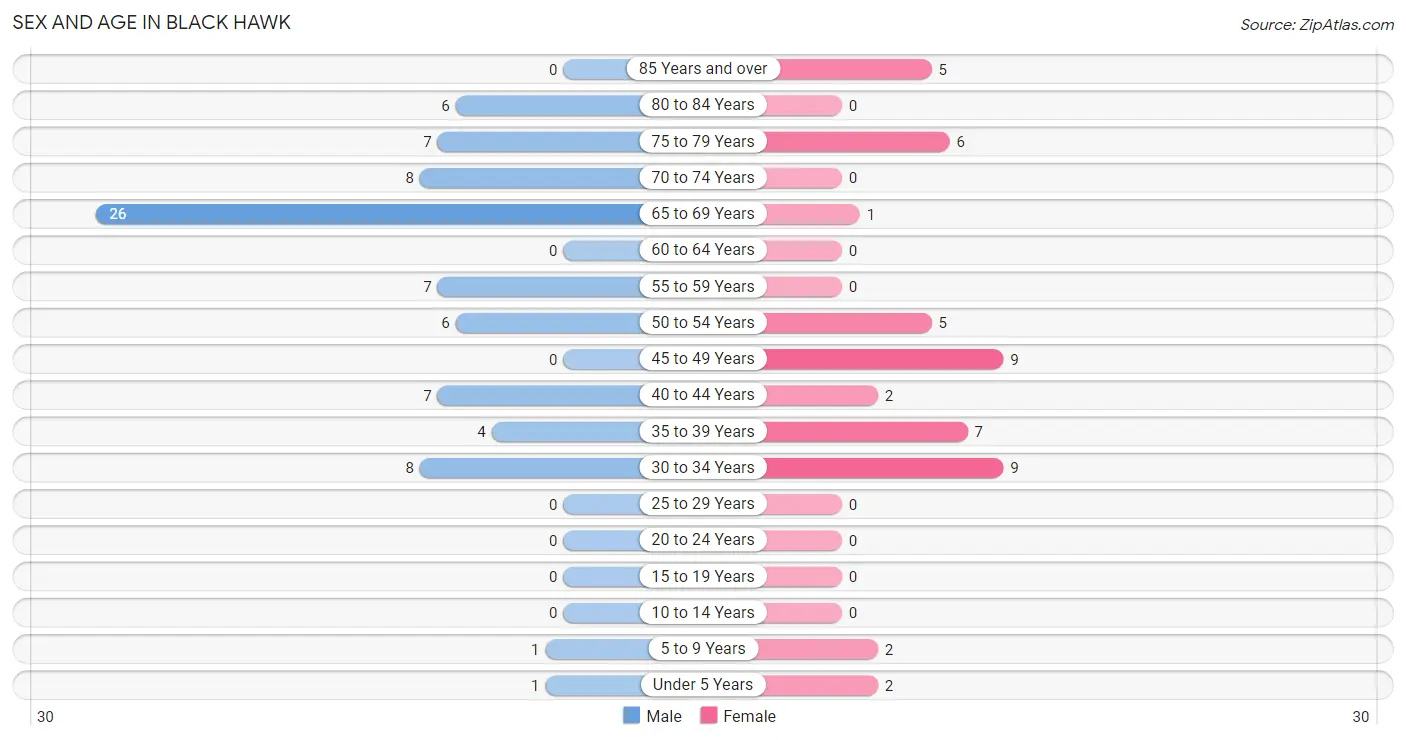
| Age Bracket | Male | Female |
| Under 5 Years | 1 (1.2%) | 2 (4.2%) |
| 5 to 9 Years | 1 (1.2%) | 2 (4.2%) |
| 10 to 14 Years | 0 (0.0%) | 0 (0.0%) |
| 15 to 19 Years | 0 (0.0%) | 0 (0.0%) |
| 20 to 24 Years | 0 (0.0%) | 0 (0.0%) |
| 25 to 29 Years | 0 (0.0%) | 0 (0.0%) |
| 30 to 34 Years | 8 (9.9%) | 9 (18.8%) |
| 35 to 39 Years | 4 (4.9%) | 7 (14.6%) |
| 40 to 44 Years | 7 (8.6%) | 2 (4.2%) |
| 45 to 49 Years | 0 (0.0%) | 9 (18.8%) |
| 50 to 54 Years | 6 (7.4%) | 5 (10.4%) |
| 55 to 59 Years | 7 (8.6%) | 0 (0.0%) |
| 60 to 64 Years | 0 (0.0%) | 0 (0.0%) |
| 65 to 69 Years | 26 (32.1%) | 1 (2.1%) |
| 70 to 74 Years | 8 (9.9%) | 0 (0.0%) |
| 75 to 79 Years | 7 (8.6%) | 6 (12.5%) |
| 80 to 84 Years | 6 (7.4%) | 0 (0.0%) |
| 85 Years and over | 0 (0.0%) | 5 (10.4%) |
| Total | 81 (100.0%) | 48 (100.0%) |
Families and Households in Black Hawk
Median Family Size in Black Hawk
The median family size in Black Hawk is 3.04 persons per family, with married-couple families (11 | 47.8%) accounting for the largest median family size of 3.82 persons per family. On the other hand, single female/mother families (5 | 21.7%) represent the smallest median family size with 2.00 persons per family.
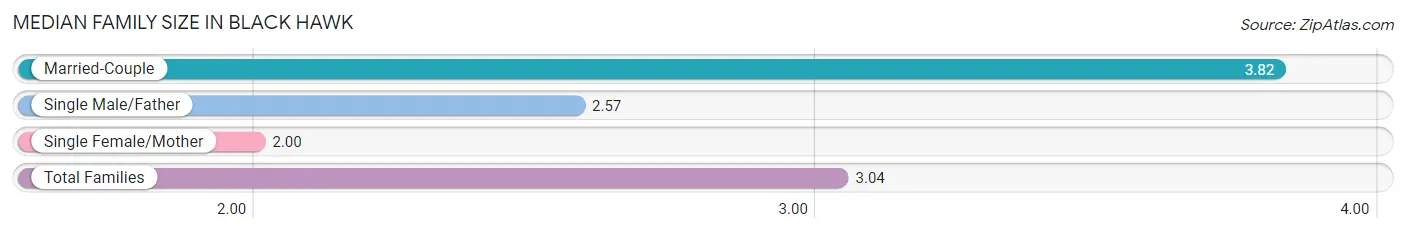
| Family Type | # Families | Family Size |
| Married-Couple | 11 (47.8%) | 3.82 |
| Single Male/Father | 7 (30.4%) | 2.57 |
| Single Female/Mother | 5 (21.7%) | 2.00 |
| Total Families | 23 (100.0%) | 3.04 |
Median Household Size in Black Hawk
The median household size in Black Hawk is 2.35 persons per household, with married-couple households (11 | 20.0%) accounting for the largest median household size of 3.82 persons per household. non-family households (32 | 58.2%) represent the smallest median household size with 1.84 persons per household.
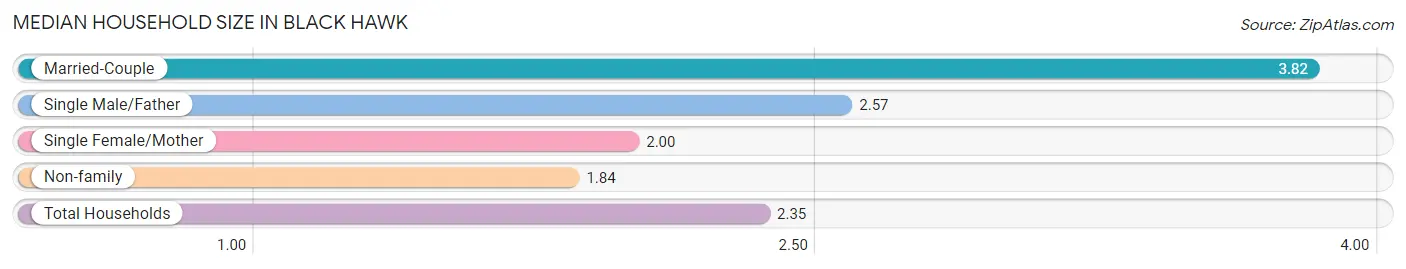
| Household Type | # Households | Household Size |
| Married-Couple | 11 (20.0%) | 3.82 |
| Single Male/Father | 7 (12.7%) | 2.57 |
| Single Female/Mother | 5 (9.1%) | 2.00 |
| Non-family | 32 (58.2%) | 1.84 |
| Total Households | 55 (100.0%) | 2.35 |
Household Size by Marriage Status in Black Hawk
Out of a total of 55 households in Black Hawk, 23 (41.8%) are family households, while 32 (58.2%) are nonfamily households. The most numerous type of family households are 2-person households, comprising 16, and the most common type of nonfamily households are 1-person households, comprising 19.
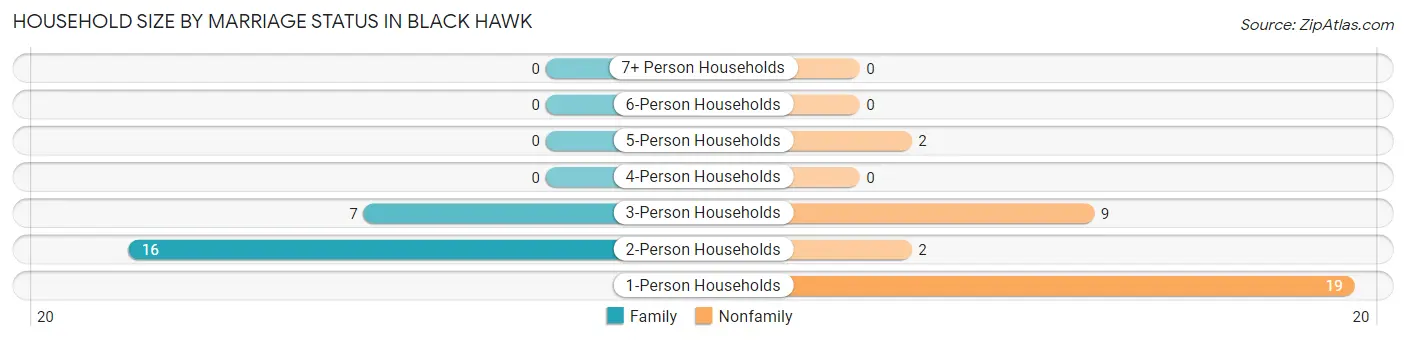
| Household Size | Family Households | Nonfamily Households |
| 1-Person Households | - | 19 (34.5%) |
| 2-Person Households | 16 (29.1%) | 2 (3.6%) |
| 3-Person Households | 7 (12.7%) | 9 (16.4%) |
| 4-Person Households | 0 (0.0%) | 0 (0.0%) |
| 5-Person Households | 0 (0.0%) | 2 (3.6%) |
| 6-Person Households | 0 (0.0%) | 0 (0.0%) |
| 7+ Person Households | 0 (0.0%) | 0 (0.0%) |
| Total | 23 (41.8%) | 32 (58.2%) |
Female Fertility in Black Hawk
Fertility by Age in Black Hawk
| Age Bracket | Women with Births | Births / 1,000 Women |
| 15 to 19 years | 0 (0.0%) | 0.0 |
| 20 to 34 years | 0 (0.0%) | 0.0 |
| 35 to 50 years | 0 (0.0%) | 0.0 |
| Total | 0 (0.0%) | 0.0 |
Fertility by Age by Marriage Status in Black Hawk
| Age Bracket | Married | Unmarried |
| 15 to 19 years | 0 (0.0%) | 0 (0.0%) |
| 20 to 34 years | 0 (0.0%) | 0 (0.0%) |
| 35 to 50 years | 0 (0.0%) | 0 (0.0%) |
| Total | 0 (0.0%) | 0 (0.0%) |
Fertility by Education in Black Hawk
| Educational Attainment | Women with Births | Births / 1,000 Women |
| Less than High School | 0 (0.0%) | 0.0 |
| High School Diploma | 0 (0.0%) | 0.0 |
| College or Associate's Degree | 0 (0.0%) | 0.0 |
| Bachelor's Degree | 0 (0.0%) | 0.0 |
| Graduate Degree | 0 (0.0%) | 0.0 |
| Total | 0 (0.0%) | 0.0 |
Fertility by Education by Marriage Status in Black Hawk
| Educational Attainment | Married | Unmarried |
| Less than High School | 0 (0.0%) | 0 (0.0%) |
| High School Diploma | 0 (0.0%) | 0 (0.0%) |
| College or Associate's Degree | 0 (0.0%) | 0 (0.0%) |
| Bachelor's Degree | 0 (0.0%) | 0 (0.0%) |
| Graduate Degree | 0 (0.0%) | 0 (0.0%) |
| Total | 0 (0.0%) | 0 (0.0%) |
Employment Characteristics in Black Hawk
Employment by Class of Employer in Black Hawk
Among the 82 employed individuals in Black Hawk, private company employees (44 | 53.7%), federal government employees (25 | 30.5%), and local government employees (7 | 8.5%) make up the most common classes of employment.
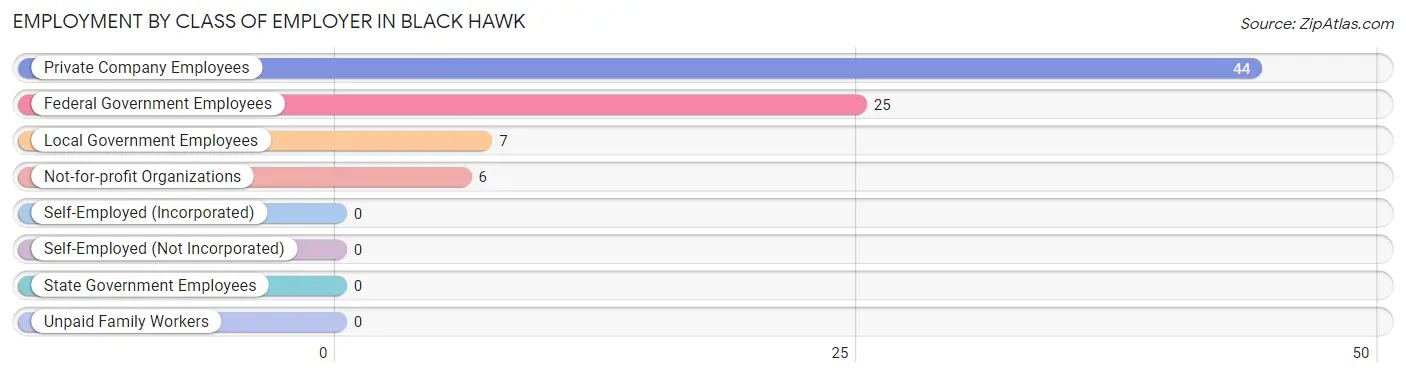
| Employer Class | # Employees | % Employees |
| Private Company Employees | 44 | 53.7% |
| Self-Employed (Incorporated) | 0 | 0.0% |
| Self-Employed (Not Incorporated) | 0 | 0.0% |
| Not-for-profit Organizations | 6 | 7.3% |
| Local Government Employees | 7 | 8.5% |
| State Government Employees | 0 | 0.0% |
| Federal Government Employees | 25 | 30.5% |
| Unpaid Family Workers | 0 | 0.0% |
| Total | 82 | 100.0% |
Employment Status by Age in Black Hawk
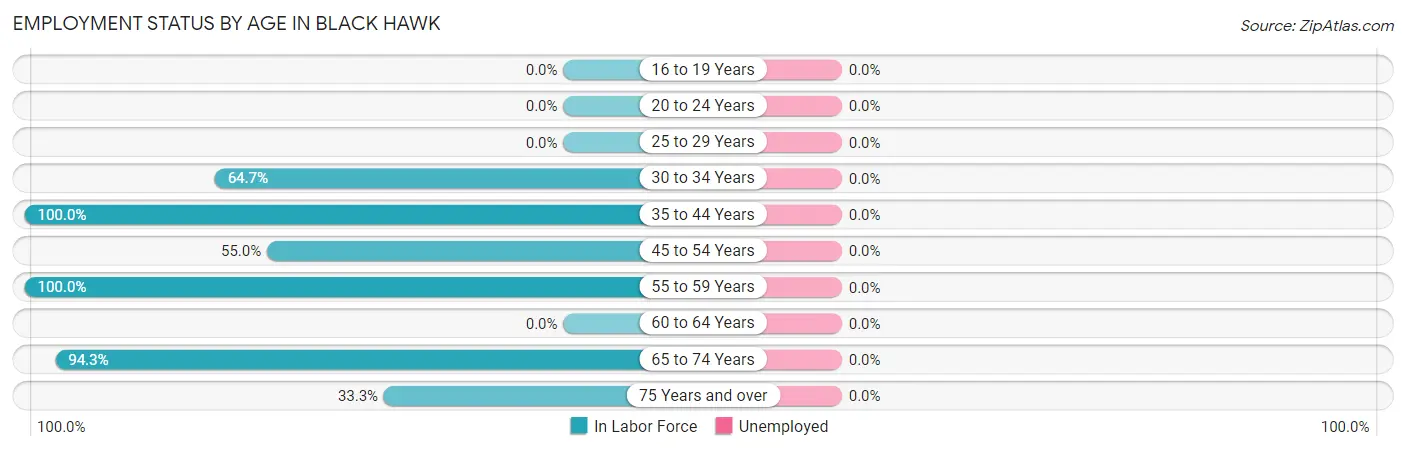
| Age Bracket | In Labor Force | Unemployed |
| 16 to 19 Years | 0 (0.0%) | 0 (0.0%) |
| 20 to 24 Years | 0 (0.0%) | 0 (0.0%) |
| 25 to 29 Years | 0 (0.0%) | 0 (0.0%) |
| 30 to 34 Years | 11 (64.7%) | 0 (0.0%) |
| 35 to 44 Years | 20 (100.0%) | 0 (0.0%) |
| 45 to 54 Years | 11 (55.0%) | 0 (0.0%) |
| 55 to 59 Years | 7 (100.0%) | 0 (0.0%) |
| 60 to 64 Years | 0 (0.0%) | 0 (0.0%) |
| 65 to 74 Years | 33 (94.3%) | 0 (0.0%) |
| 75 Years and over | 8 (33.3%) | 0 (0.0%) |
| Total | 90 (73.2%) | 0 (0.0%) |
Employment Status by Educational Attainment in Black Hawk
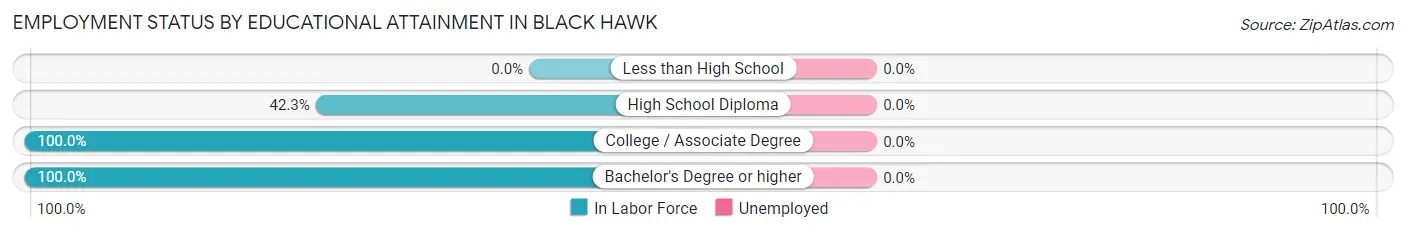
| Educational Attainment | In Labor Force | Unemployed |
| Less than High School | 0 (0.0%) | 0 (0.0%) |
| High School Diploma | 11 (42.3%) | 0 (0.0%) |
| College / Associate Degree | 18 (100.0%) | 0 (0.0%) |
| Bachelor's Degree or higher | 20 (100.0%) | 0 (0.0%) |
| Total | 49 (76.6%) | 0 (0.0%) |
Employment Occupations by Sex in Black Hawk
Management, Business, Science and Arts Occupations
The most common Management, Business, Science and Arts occupations in Black Hawk are Management (13 | 14.4%), Community & Social Service (5 | 5.6%), and Arts, Media & Entertainment (5 | 5.6%).
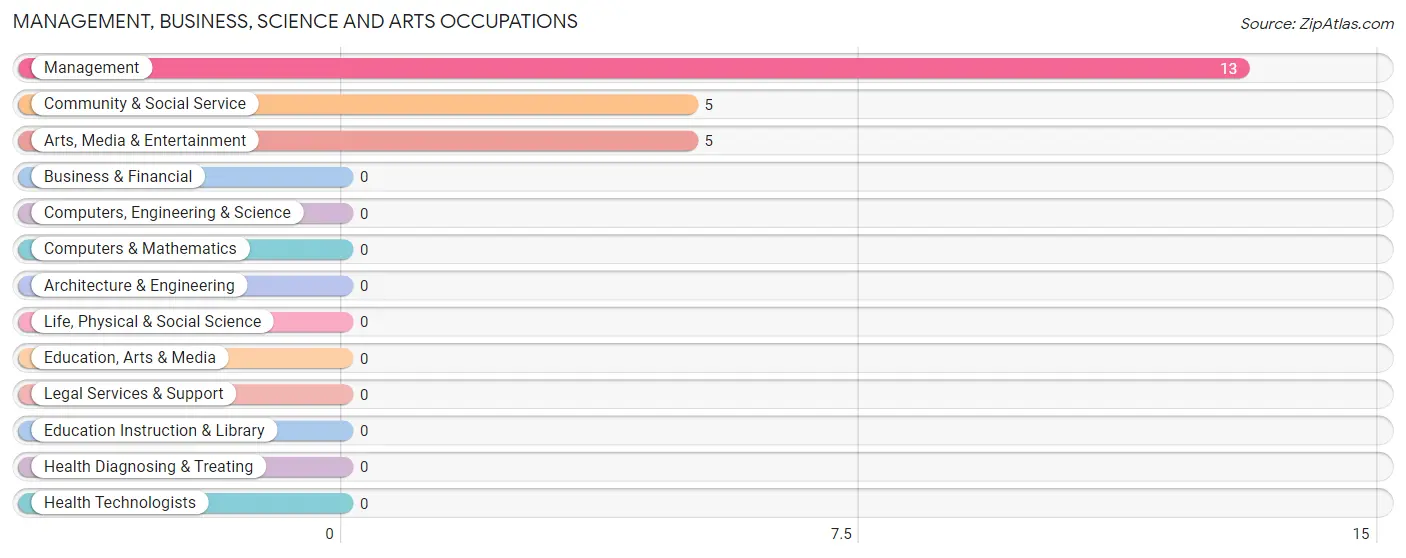
Management, Business, Science and Arts Occupations by Sex
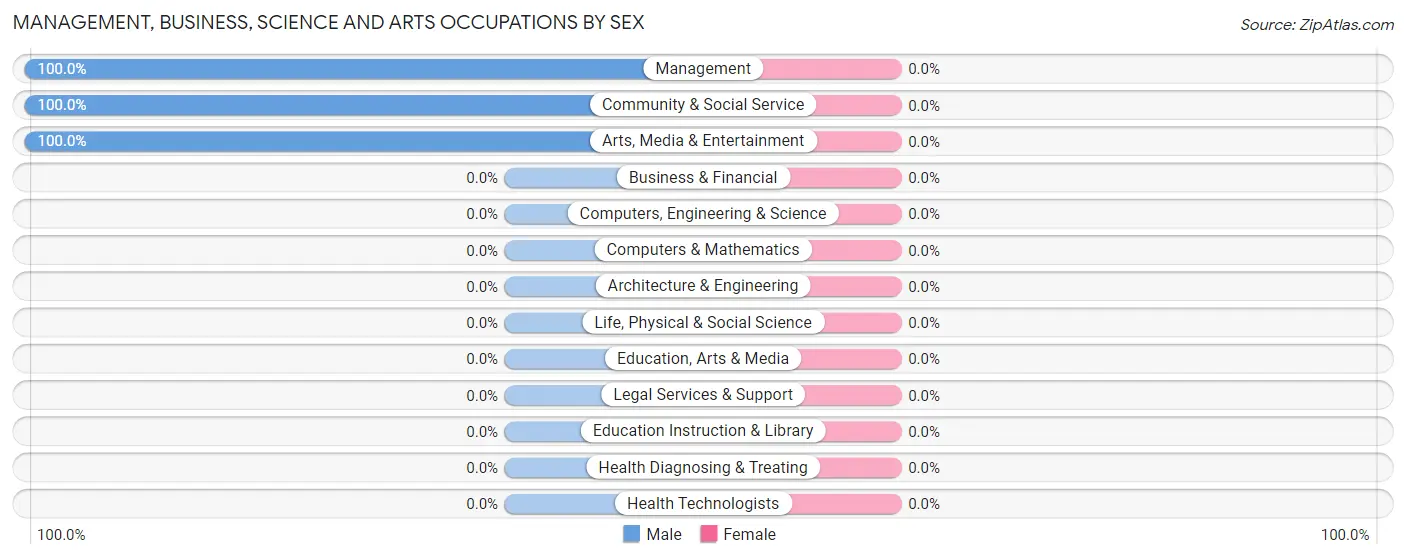
| Occupation | Male | Female |
| Management | 13 (100.0%) | 0 (0.0%) |
| Business & Financial | 0 (0.0%) | 0 (0.0%) |
| Computers, Engineering & Science | 0 (0.0%) | 0 (0.0%) |
| Computers & Mathematics | 0 (0.0%) | 0 (0.0%) |
| Architecture & Engineering | 0 (0.0%) | 0 (0.0%) |
| Life, Physical & Social Science | 0 (0.0%) | 0 (0.0%) |
| Community & Social Service | 5 (100.0%) | 0 (0.0%) |
| Education, Arts & Media | 0 (0.0%) | 0 (0.0%) |
| Legal Services & Support | 0 (0.0%) | 0 (0.0%) |
| Education Instruction & Library | 0 (0.0%) | 0 (0.0%) |
| Arts, Media & Entertainment | 5 (100.0%) | 0 (0.0%) |
| Health Diagnosing & Treating | 0 (0.0%) | 0 (0.0%) |
| Health Technologists | 0 (0.0%) | 0 (0.0%) |
| Total (Category) | 18 (100.0%) | 0 (0.0%) |
| Total (Overall) | 66 (73.3%) | 24 (26.7%) |
Services Occupations
The most common Services occupations in Black Hawk are Personal Care & Service (23 | 25.6%), Security & Protection (5 | 5.6%), and Firefighting & Prevention (5 | 5.6%).
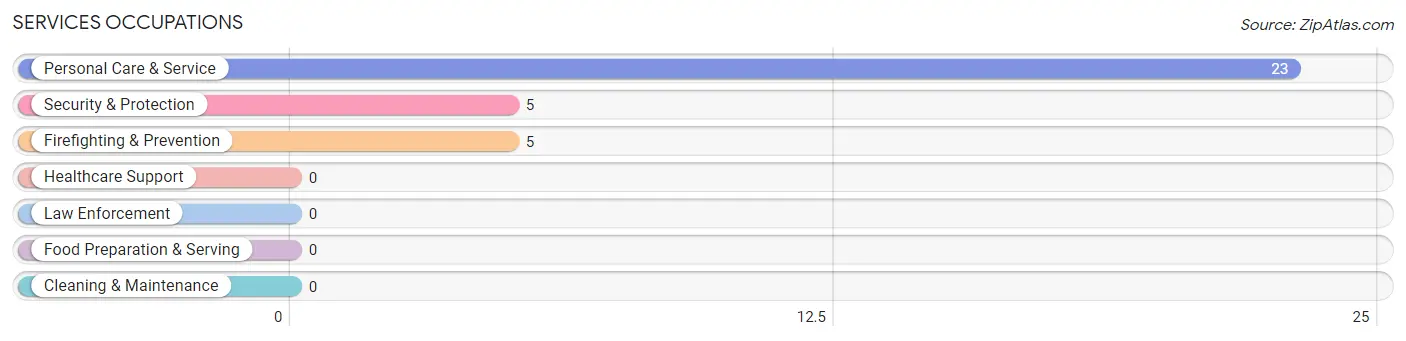
Services Occupations by Sex
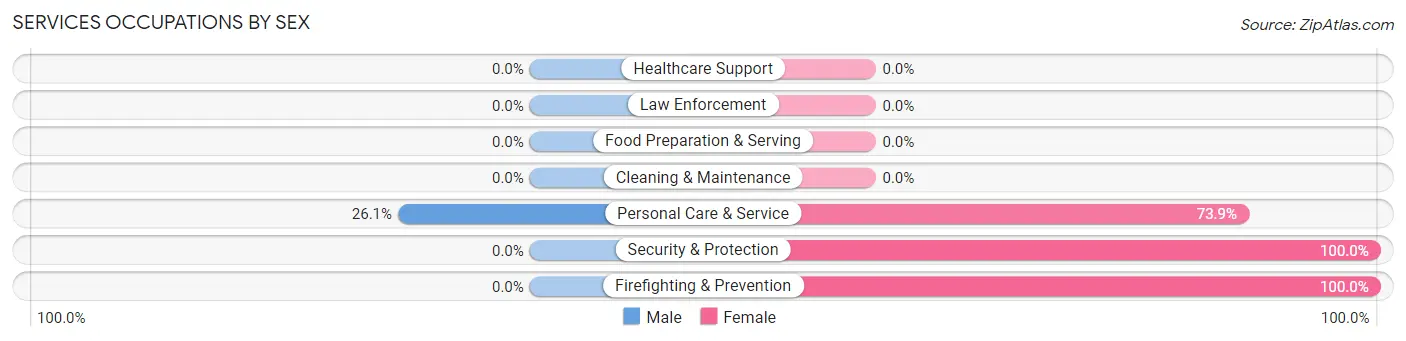
| Occupation | Male | Female |
| Healthcare Support | 0 (0.0%) | 0 (0.0%) |
| Security & Protection | 0 (0.0%) | 5 (100.0%) |
| Firefighting & Prevention | 0 (0.0%) | 5 (100.0%) |
| Law Enforcement | 0 (0.0%) | 0 (0.0%) |
| Food Preparation & Serving | 0 (0.0%) | 0 (0.0%) |
| Cleaning & Maintenance | 0 (0.0%) | 0 (0.0%) |
| Personal Care & Service | 6 (26.1%) | 17 (73.9%) |
| Total (Category) | 6 (21.4%) | 22 (78.6%) |
| Total (Overall) | 66 (73.3%) | 24 (26.7%) |
Sales and Office Occupations
The most common Sales and Office occupations in Black Hawk are , and Office & Administration (27 | 30.0%).
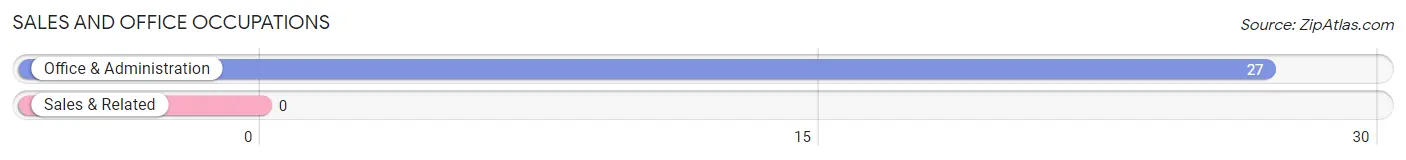
Sales and Office Occupations by Sex
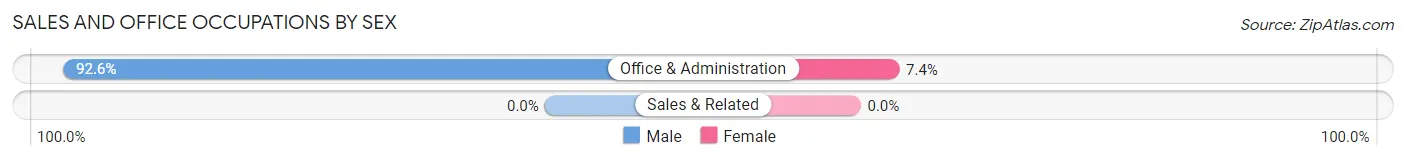
| Occupation | Male | Female |
| Sales & Related | 0 (0.0%) | 0 (0.0%) |
| Office & Administration | 25 (92.6%) | 2 (7.4%) |
| Total (Category) | 25 (92.6%) | 2 (7.4%) |
| Total (Overall) | 66 (73.3%) | 24 (26.7%) |
Natural Resources, Construction and Maintenance Occupations
The most common Natural Resources, Construction and Maintenance occupations in Black Hawk are Installation, Maintenance & Repair (7 | 7.8%), and Construction & Extraction (2 | 2.2%).
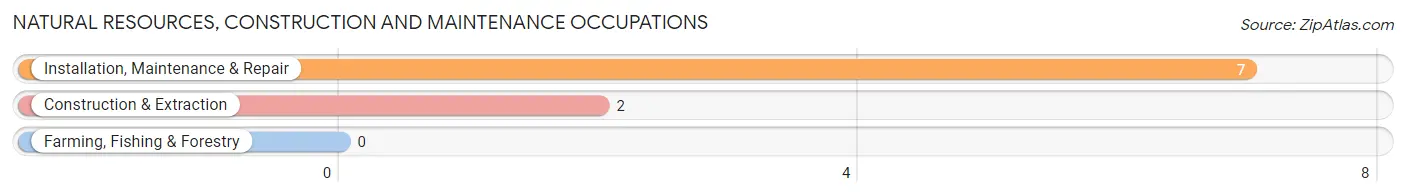
Natural Resources, Construction and Maintenance Occupations by Sex
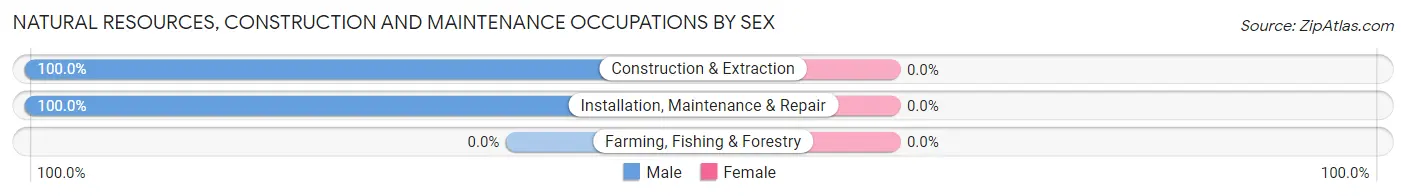
| Occupation | Male | Female |
| Farming, Fishing & Forestry | 0 (0.0%) | 0 (0.0%) |
| Construction & Extraction | 2 (100.0%) | 0 (0.0%) |
| Installation, Maintenance & Repair | 7 (100.0%) | 0 (0.0%) |
| Total (Category) | 9 (100.0%) | 0 (0.0%) |
| Total (Overall) | 66 (73.3%) | 24 (26.7%) |
Production, Transportation and Moving Occupations
The most common Production, Transportation and Moving occupations in Black Hawk are , and Transportation (8 | 8.9%).
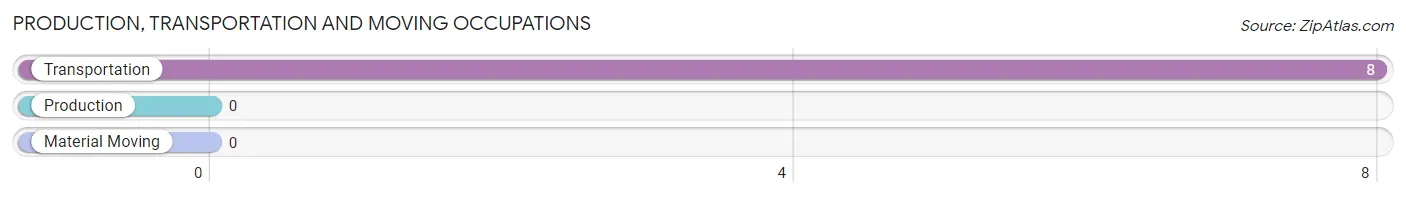
Production, Transportation and Moving Occupations by Sex
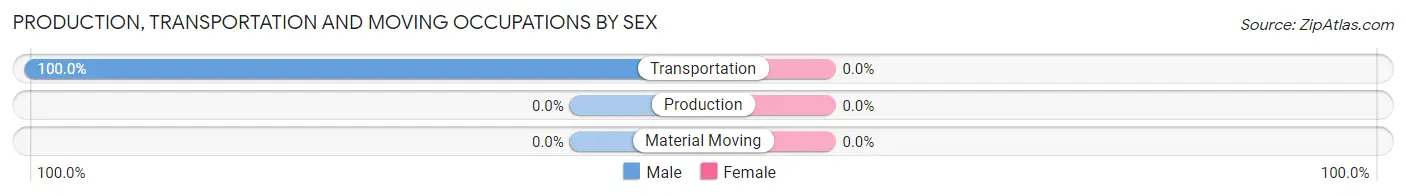
| Occupation | Male | Female |
| Production | 0 (0.0%) | 0 (0.0%) |
| Transportation | 8 (100.0%) | 0 (0.0%) |
| Material Moving | 0 (0.0%) | 0 (0.0%) |
| Total (Category) | 8 (100.0%) | 0 (0.0%) |
| Total (Overall) | 66 (73.3%) | 24 (26.7%) |
Employment Industries by Sex in Black Hawk
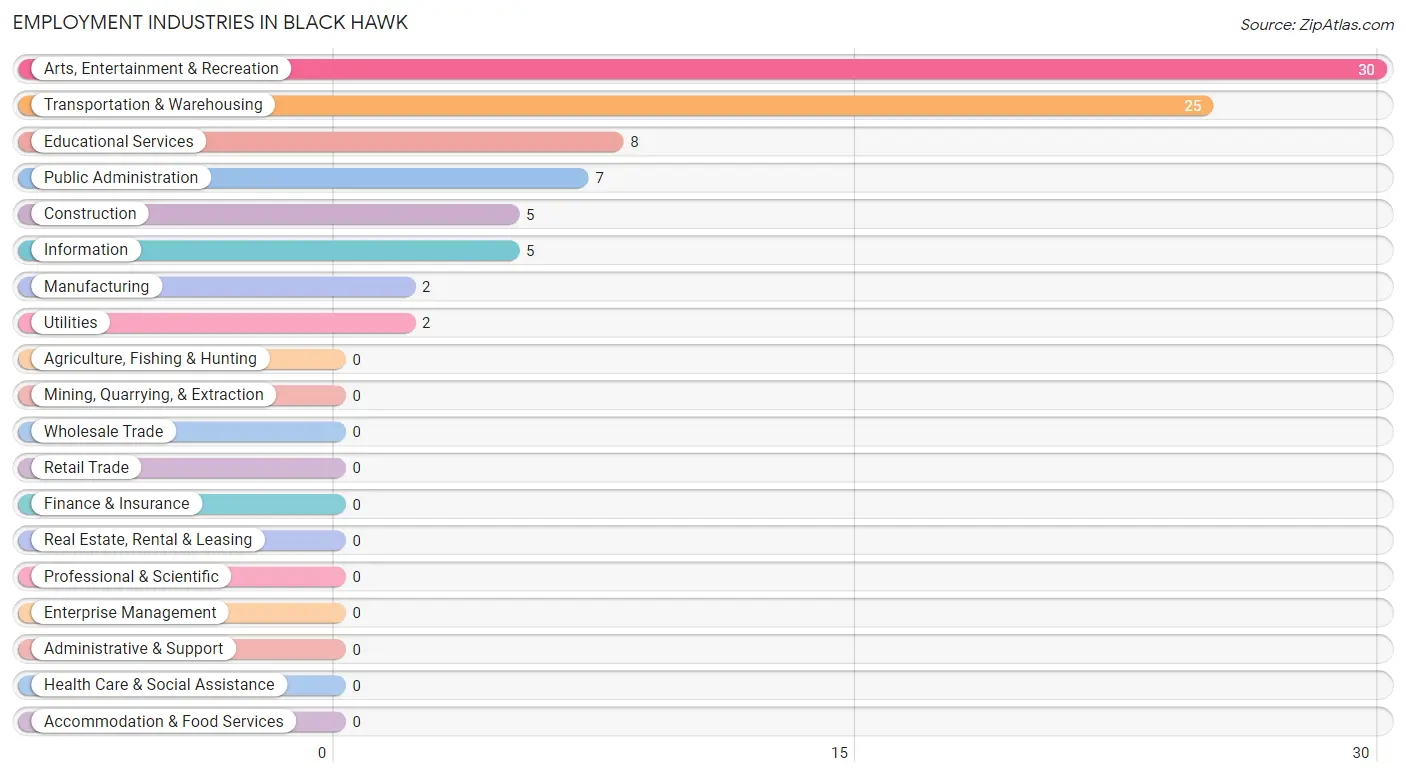
Employment Industries in Black Hawk
The major employment industries in Black Hawk include Arts, Entertainment & Recreation (30 | 33.3%), Transportation & Warehousing (25 | 27.8%), Educational Services (8 | 8.9%), Public Administration (7 | 7.8%), and Construction (5 | 5.6%).
Employment Industries by Sex in Black Hawk
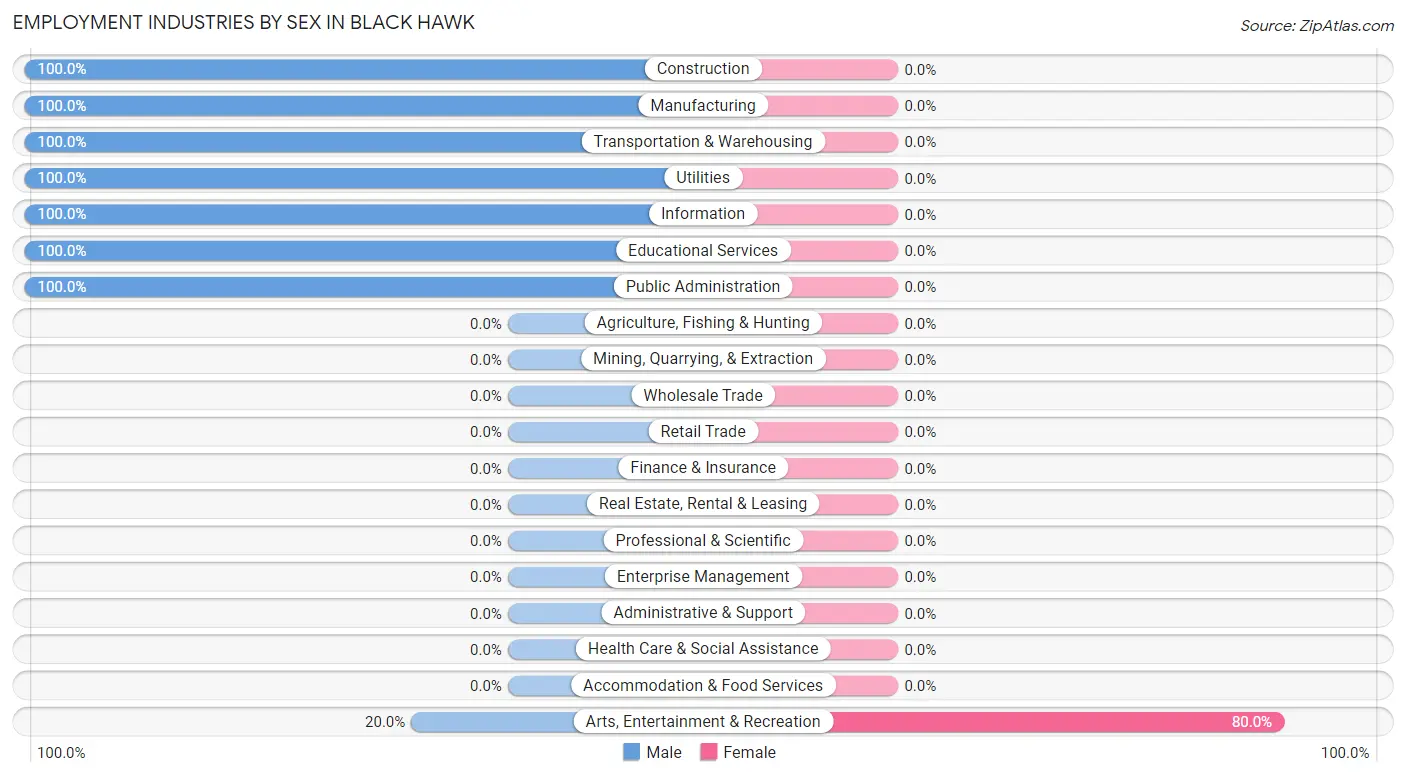
| Industry | Male | Female |
| Agriculture, Fishing & Hunting | 0 (0.0%) | 0 (0.0%) |
| Mining, Quarrying, & Extraction | 0 (0.0%) | 0 (0.0%) |
| Construction | 5 (100.0%) | 0 (0.0%) |
| Manufacturing | 2 (100.0%) | 0 (0.0%) |
| Wholesale Trade | 0 (0.0%) | 0 (0.0%) |
| Retail Trade | 0 (0.0%) | 0 (0.0%) |
| Transportation & Warehousing | 25 (100.0%) | 0 (0.0%) |
| Utilities | 2 (100.0%) | 0 (0.0%) |
| Information | 5 (100.0%) | 0 (0.0%) |
| Finance & Insurance | 0 (0.0%) | 0 (0.0%) |
| Real Estate, Rental & Leasing | 0 (0.0%) | 0 (0.0%) |
| Professional & Scientific | 0 (0.0%) | 0 (0.0%) |
| Enterprise Management | 0 (0.0%) | 0 (0.0%) |
| Administrative & Support | 0 (0.0%) | 0 (0.0%) |
| Educational Services | 8 (100.0%) | 0 (0.0%) |
| Health Care & Social Assistance | 0 (0.0%) | 0 (0.0%) |
| Arts, Entertainment & Recreation | 6 (20.0%) | 24 (80.0%) |
| Accommodation & Food Services | 0 (0.0%) | 0 (0.0%) |
| Public Administration | 7 (100.0%) | 0 (0.0%) |
| Total | 66 (73.3%) | 24 (26.7%) |
Education in Black Hawk
School Enrollment in Black Hawk
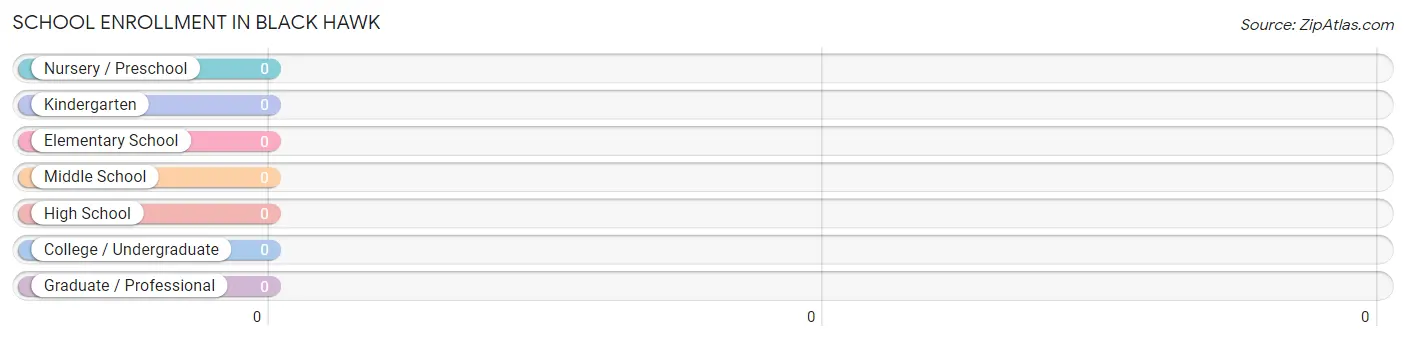
| School Level | # Students | % Students |
| Nursery / Preschool | 0 | 0.0% |
| Kindergarten | 0 | 0.0% |
| Elementary School | 0 | 0.0% |
| Middle School | 0 | 0.0% |
| High School | 0 | 0.0% |
| College / Undergraduate | 0 | 0.0% |
| Graduate / Professional | 0 | 0.0% |
| Total | 0 | 0.0% |
School Enrollment by Age by Funding Source in Black Hawk
| Age Bracket | Public School | Private School |
| 3 to 4 Year Olds | 0 (0.0%) | 0 (0.0%) |
| 5 to 9 Year Old | 0 (0.0%) | 0 (0.0%) |
| 10 to 14 Year Olds | 0 (0.0%) | 0 (0.0%) |
| 15 to 17 Year Olds | 0 (0.0%) | 0 (0.0%) |
| 18 to 19 Year Olds | 0 (0.0%) | 0 (0.0%) |
| 20 to 24 Year Olds | 0 (0.0%) | 0 (0.0%) |
| 25 to 34 Year Olds | 0 (0.0%) | 0 (0.0%) |
| 35 Years and over | 0 (0.0%) | 0 (0.0%) |
| Total | 0 (0.0%) | 0 (0.0%) |
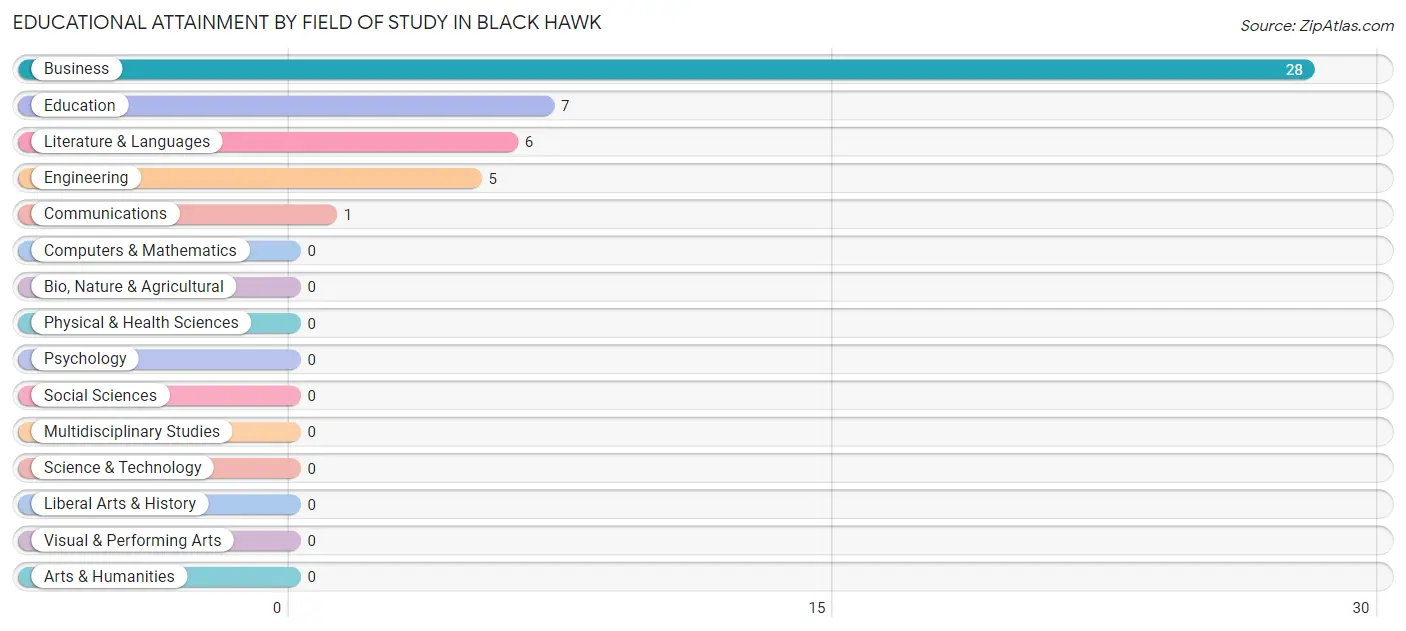
Educational Attainment by Field of Study in Black Hawk
Business (28 | 59.6%), education (7 | 14.9%), literature & languages (6 | 12.8%), engineering (5 | 10.6%), and communications (1 | 2.1%) are the most common fields of study among 47 individuals in Black Hawk who have obtained a bachelor's degree or higher.
| Field of Study | # Graduates | % Graduates |
| Computers & Mathematics | 0 | 0.0% |
| Bio, Nature & Agricultural | 0 | 0.0% |
| Physical & Health Sciences | 0 | 0.0% |
| Psychology | 0 | 0.0% |
| Social Sciences | 0 | 0.0% |
| Engineering | 5 | 10.6% |
| Multidisciplinary Studies | 0 | 0.0% |
| Science & Technology | 0 | 0.0% |
| Business | 28 | 59.6% |
| Education | 7 | 14.9% |
| Literature & Languages | 6 | 12.8% |
| Liberal Arts & History | 0 | 0.0% |
| Visual & Performing Arts | 0 | 0.0% |
| Communications | 1 | 2.1% |
| Arts & Humanities | 0 | 0.0% |
| Total | 47 | 100.0% |
Transportation & Commute in Black Hawk
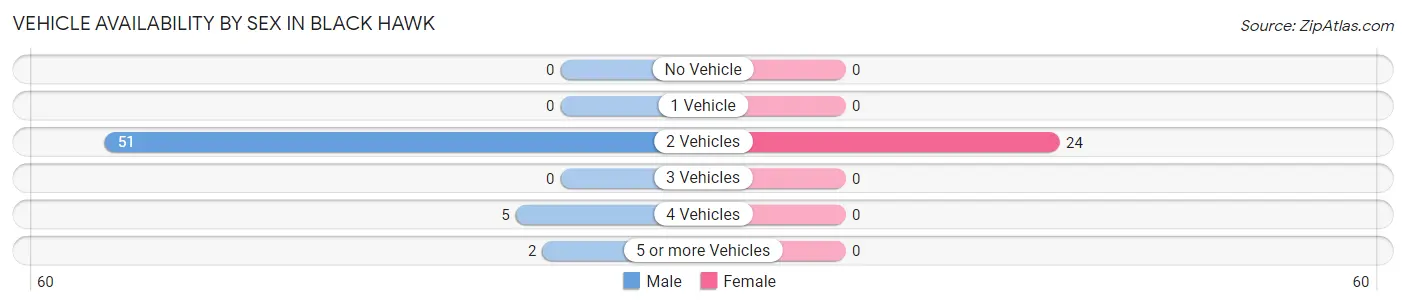
Vehicle Availability by Sex in Black Hawk
The most prevalent vehicle ownership categories in Black Hawk are males with 2 vehicles (51, accounting for 87.9%) and females with 2 vehicles (24, making up 212.5%).
| Vehicles Available | Male | Female |
| No Vehicle | 0 (0.0%) | 0 (0.0%) |
| 1 Vehicle | 0 (0.0%) | 0 (0.0%) |
| 2 Vehicles | 51 (87.9%) | 24 (100.0%) |
| 3 Vehicles | 0 (0.0%) | 0 (0.0%) |
| 4 Vehicles | 5 (8.6%) | 0 (0.0%) |
| 5 or more Vehicles | 2 (3.5%) | 0 (0.0%) |
| Total | 58 (100.0%) | 24 (100.0%) |
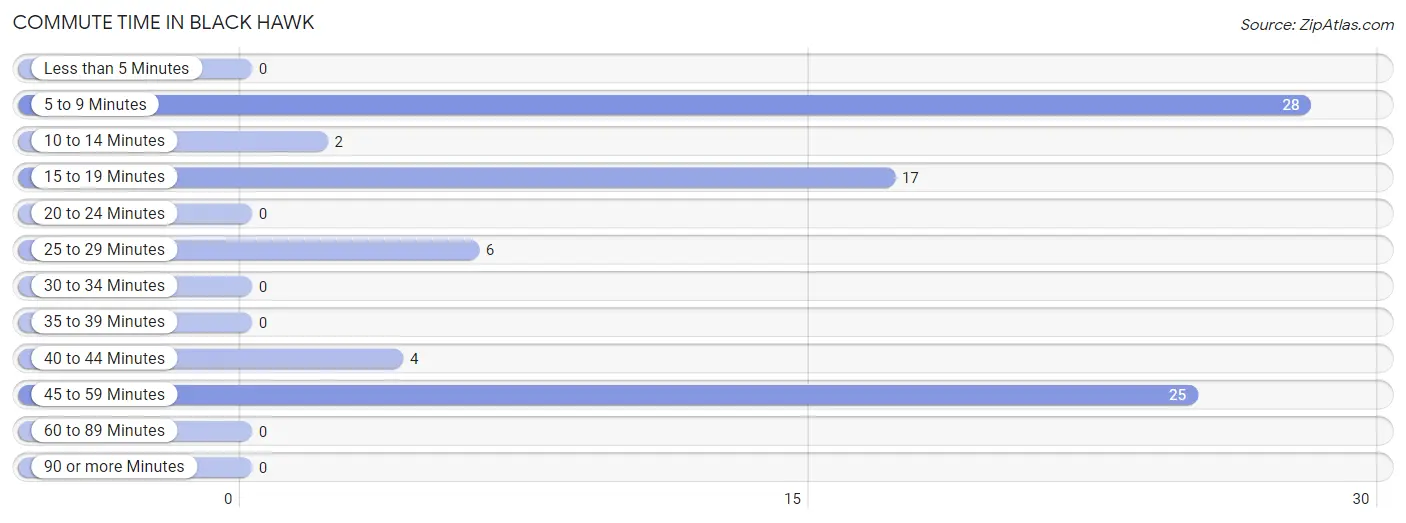
Commute Time in Black Hawk
The most frequently occuring commute durations in Black Hawk are 5 to 9 minutes (28 commuters, 34.2%), 45 to 59 minutes (25 commuters, 30.5%), and 15 to 19 minutes (17 commuters, 20.7%).
| Commute Time | # Commuters | % Commuters |
| Less than 5 Minutes | 0 | 0.0% |
| 5 to 9 Minutes | 28 | 34.2% |
| 10 to 14 Minutes | 2 | 2.4% |
| 15 to 19 Minutes | 17 | 20.7% |
| 20 to 24 Minutes | 0 | 0.0% |
| 25 to 29 Minutes | 6 | 7.3% |
| 30 to 34 Minutes | 0 | 0.0% |
| 35 to 39 Minutes | 0 | 0.0% |
| 40 to 44 Minutes | 4 | 4.9% |
| 45 to 59 Minutes | 25 | 30.5% |
| 60 to 89 Minutes | 0 | 0.0% |
| 90 or more Minutes | 0 | 0.0% |
Commute Time by Sex in Black Hawk
The most common commute times in Black Hawk are 45 to 59 minutes (25 commuters, 43.1%) for males and 5 to 9 minutes (17 commuters, 70.8%) for females.
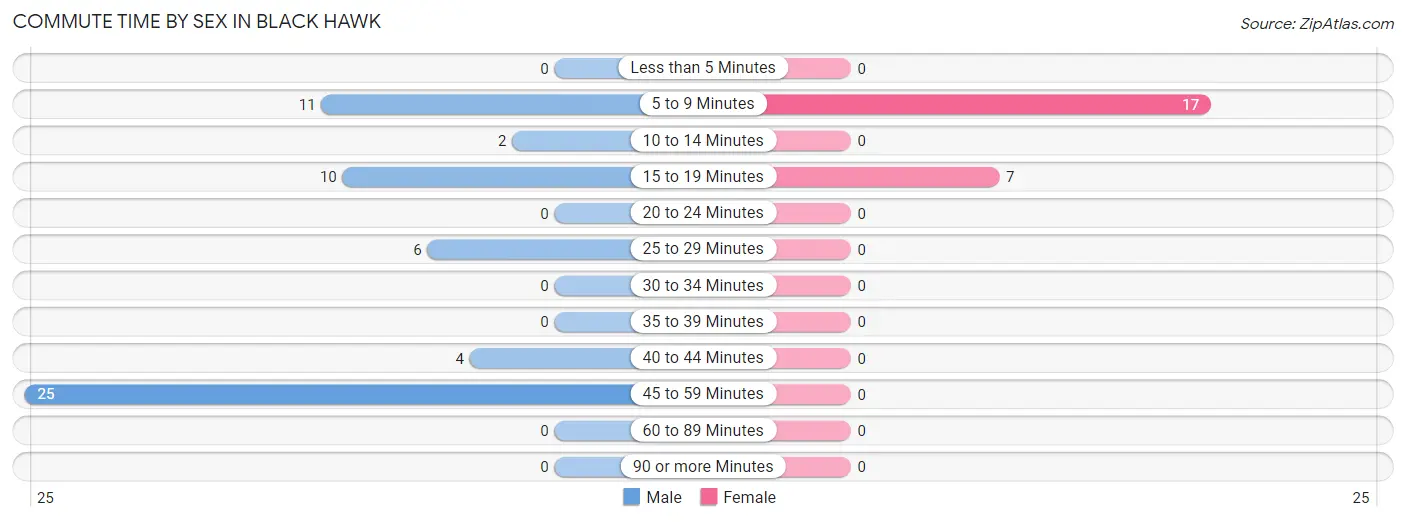
| Commute Time | Male | Female |
| Less than 5 Minutes | 0 (0.0%) | 0 (0.0%) |
| 5 to 9 Minutes | 11 (19.0%) | 17 (70.8%) |
| 10 to 14 Minutes | 2 (3.5%) | 0 (0.0%) |
| 15 to 19 Minutes | 10 (17.2%) | 7 (29.2%) |
| 20 to 24 Minutes | 0 (0.0%) | 0 (0.0%) |
| 25 to 29 Minutes | 6 (10.3%) | 0 (0.0%) |
| 30 to 34 Minutes | 0 (0.0%) | 0 (0.0%) |
| 35 to 39 Minutes | 0 (0.0%) | 0 (0.0%) |
| 40 to 44 Minutes | 4 (6.9%) | 0 (0.0%) |
| 45 to 59 Minutes | 25 (43.1%) | 0 (0.0%) |
| 60 to 89 Minutes | 0 (0.0%) | 0 (0.0%) |
| 90 or more Minutes | 0 (0.0%) | 0 (0.0%) |
Time of Departure to Work by Sex in Black Hawk
The most frequent times of departure to work in Black Hawk are 6:00 AM to 6:29 AM (25, 43.1%) for males and 12:00 PM to 3:59 PM (14, 58.3%) for females.
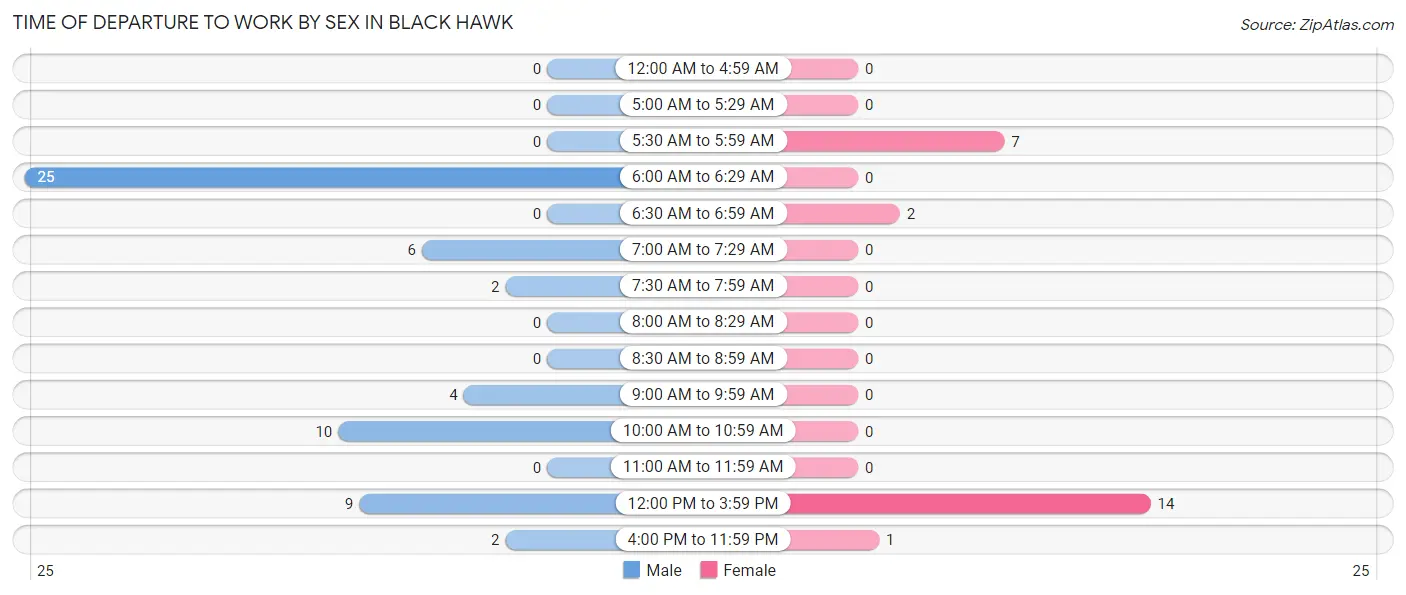
| Time of Departure | Male | Female |
| 12:00 AM to 4:59 AM | 0 (0.0%) | 0 (0.0%) |
| 5:00 AM to 5:29 AM | 0 (0.0%) | 0 (0.0%) |
| 5:30 AM to 5:59 AM | 0 (0.0%) | 7 (29.2%) |
| 6:00 AM to 6:29 AM | 25 (43.1%) | 0 (0.0%) |
| 6:30 AM to 6:59 AM | 0 (0.0%) | 2 (8.3%) |
| 7:00 AM to 7:29 AM | 6 (10.3%) | 0 (0.0%) |
| 7:30 AM to 7:59 AM | 2 (3.5%) | 0 (0.0%) |
| 8:00 AM to 8:29 AM | 0 (0.0%) | 0 (0.0%) |
| 8:30 AM to 8:59 AM | 0 (0.0%) | 0 (0.0%) |
| 9:00 AM to 9:59 AM | 4 (6.9%) | 0 (0.0%) |
| 10:00 AM to 10:59 AM | 10 (17.2%) | 0 (0.0%) |
| 11:00 AM to 11:59 AM | 0 (0.0%) | 0 (0.0%) |
| 12:00 PM to 3:59 PM | 9 (15.5%) | 14 (58.3%) |
| 4:00 PM to 11:59 PM | 2 (3.5%) | 1 (4.2%) |
| Total | 58 (100.0%) | 24 (100.0%) |
Housing Occupancy in Black Hawk
Occupancy by Ownership in Black Hawk
Of the total 55 dwellings in Black Hawk, owner-occupied units account for 35 (63.6%), while renter-occupied units make up 20 (36.4%).
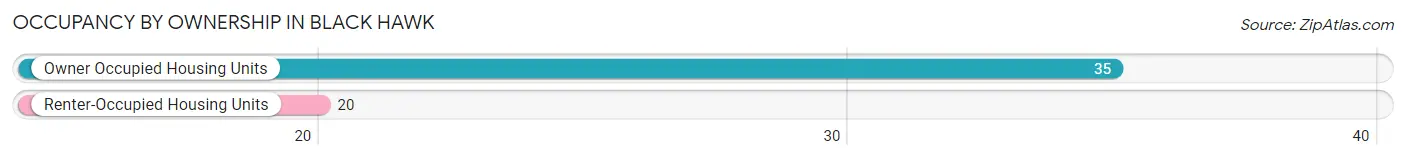
| Occupancy | # Housing Units | % Housing Units |
| Owner Occupied Housing Units | 35 | 63.6% |
| Renter-Occupied Housing Units | 20 | 36.4% |
| Total Occupied Housing Units | 55 | 100.0% |
Occupancy by Household Size in Black Hawk
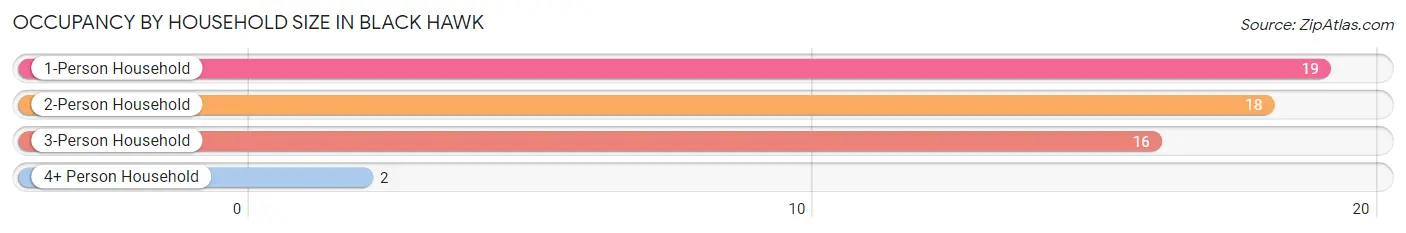
| Household Size | # Housing Units | % Housing Units |
| 1-Person Household | 19 | 34.5% |
| 2-Person Household | 18 | 32.7% |
| 3-Person Household | 16 | 29.1% |
| 4+ Person Household | 2 | 3.6% |
| Total Housing Units | 55 | 100.0% |
Occupancy by Ownership by Household Size in Black Hawk
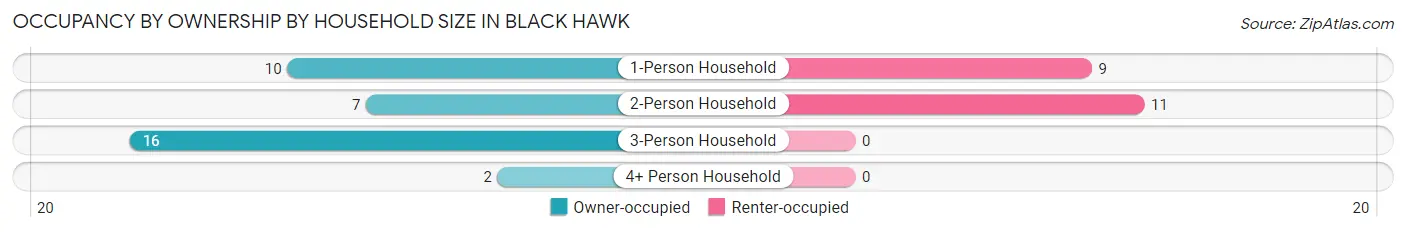
| Household Size | Owner-occupied | Renter-occupied |
| 1-Person Household | 10 (52.6%) | 9 (47.4%) |
| 2-Person Household | 7 (38.9%) | 11 (61.1%) |
| 3-Person Household | 16 (100.0%) | 0 (0.0%) |
| 4+ Person Household | 2 (100.0%) | 0 (0.0%) |
| Total Housing Units | 35 (63.6%) | 20 (36.4%) |
Occupancy by Educational Attainment in Black Hawk
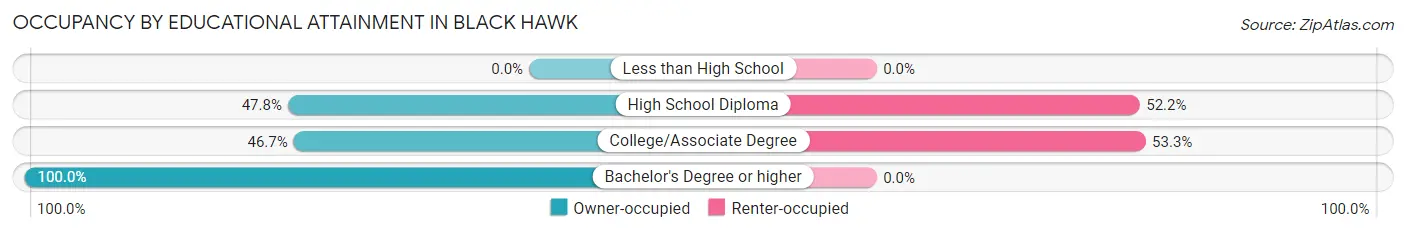
| Household Size | Owner-occupied | Renter-occupied |
| Less than High School | 0 (0.0%) | 0 (0.0%) |
| High School Diploma | 11 (47.8%) | 12 (52.2%) |
| College/Associate Degree | 7 (46.7%) | 8 (53.3%) |
| Bachelor's Degree or higher | 17 (100.0%) | 0 (0.0%) |
Occupancy by Age of Householder in Black Hawk

| Age Bracket | # Households | % Households |
| Under 35 Years | 2 | 3.6% |
| 35 to 44 Years | 9 | 16.4% |
| 45 to 54 Years | 15 | 27.3% |
| 55 to 64 Years | 2 | 3.6% |
| 65 to 74 Years | 9 | 16.4% |
| 75 to 84 Years | 13 | 23.6% |
| 85 Years and Over | 5 | 9.1% |
| Total | 55 | 100.0% |
Housing Finances in Black Hawk
Median Income by Occupancy in Black Hawk
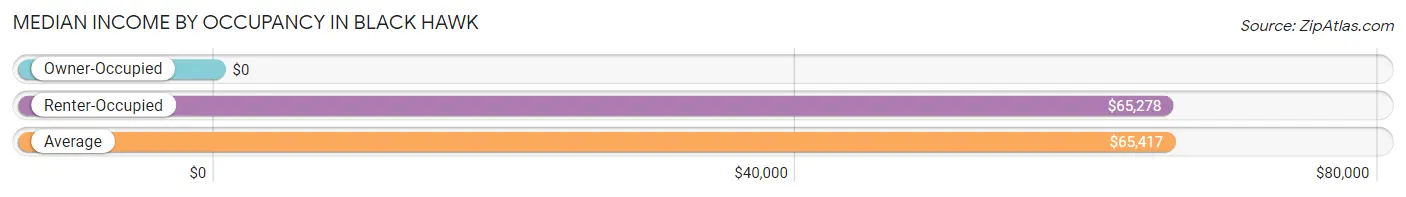
| Occupancy Type | # Households | Median Income |
| Owner-Occupied | 35 (63.6%) | $0 |
| Renter-Occupied | 20 (36.4%) | $65,278 |
| Average | 55 (100.0%) | $65,417 |
Occupancy by Householder Income Bracket in Black Hawk
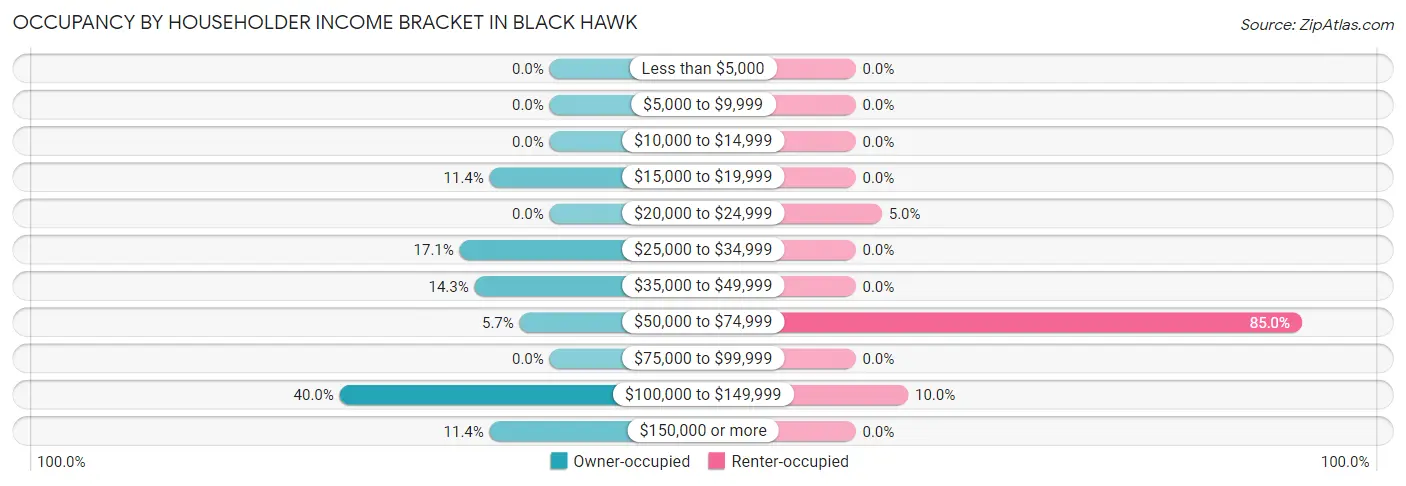
| Income Bracket | Owner-occupied | Renter-occupied |
| Less than $5,000 | 0 (0.0%) | 0 (0.0%) |
| $5,000 to $9,999 | 0 (0.0%) | 0 (0.0%) |
| $10,000 to $14,999 | 0 (0.0%) | 0 (0.0%) |
| $15,000 to $19,999 | 4 (11.4%) | 0 (0.0%) |
| $20,000 to $24,999 | 0 (0.0%) | 1 (5.0%) |
| $25,000 to $34,999 | 6 (17.1%) | 0 (0.0%) |
| $35,000 to $49,999 | 5 (14.3%) | 0 (0.0%) |
| $50,000 to $74,999 | 2 (5.7%) | 17 (85.0%) |
| $75,000 to $99,999 | 0 (0.0%) | 0 (0.0%) |
| $100,000 to $149,999 | 14 (40.0%) | 2 (10.0%) |
| $150,000 or more | 4 (11.4%) | 0 (0.0%) |
| Total | 35 (100.0%) | 20 (100.0%) |
Monthly Housing Cost Tiers in Black Hawk
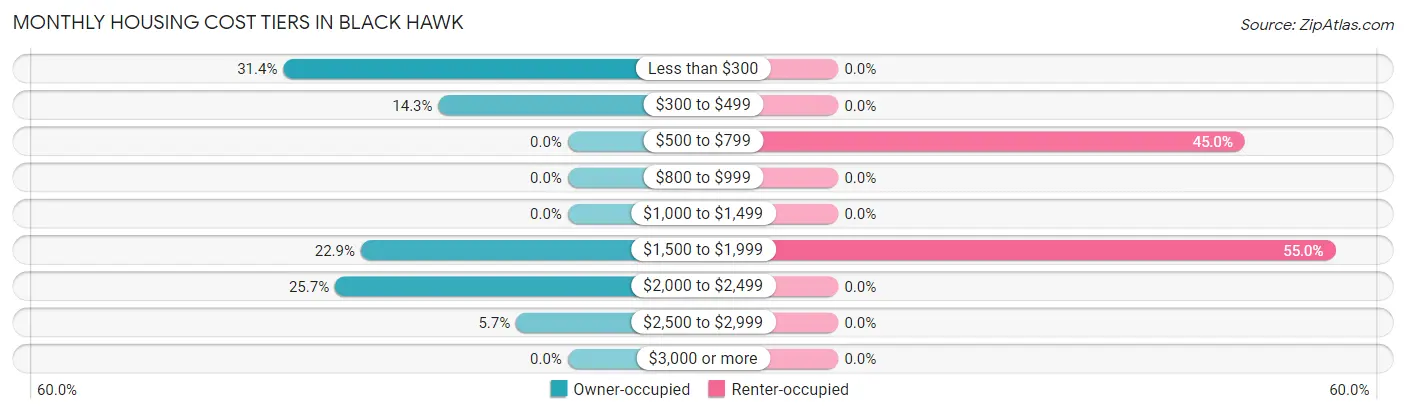
| Monthly Cost | Owner-occupied | Renter-occupied |
| Less than $300 | 11 (31.4%) | 0 (0.0%) |
| $300 to $499 | 5 (14.3%) | 0 (0.0%) |
| $500 to $799 | 0 (0.0%) | 9 (45.0%) |
| $800 to $999 | 0 (0.0%) | 0 (0.0%) |
| $1,000 to $1,499 | 0 (0.0%) | 0 (0.0%) |
| $1,500 to $1,999 | 8 (22.9%) | 11 (55.0%) |
| $2,000 to $2,499 | 9 (25.7%) | 0 (0.0%) |
| $2,500 to $2,999 | 2 (5.7%) | 0 (0.0%) |
| $3,000 or more | 0 (0.0%) | 0 (0.0%) |
| Total | 35 (100.0%) | 20 (100.0%) |
Physical Housing Characteristics in Black Hawk
Housing Structures in Black Hawk
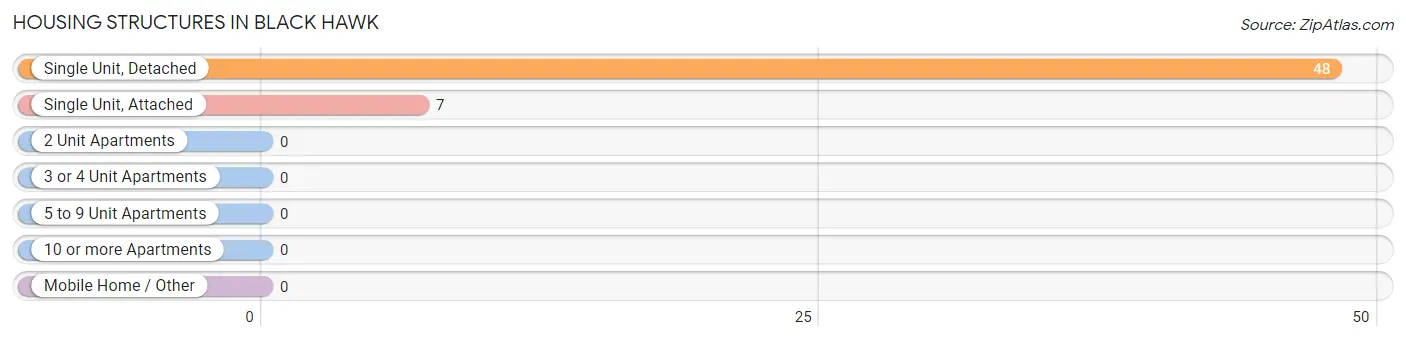
| Structure Type | # Housing Units | % Housing Units |
| Single Unit, Detached | 48 | 87.3% |
| Single Unit, Attached | 7 | 12.7% |
| 2 Unit Apartments | 0 | 0.0% |
| 3 or 4 Unit Apartments | 0 | 0.0% |
| 5 to 9 Unit Apartments | 0 | 0.0% |
| 10 or more Apartments | 0 | 0.0% |
| Mobile Home / Other | 0 | 0.0% |
| Total | 55 | 100.0% |
Housing Structures by Occupancy in Black Hawk
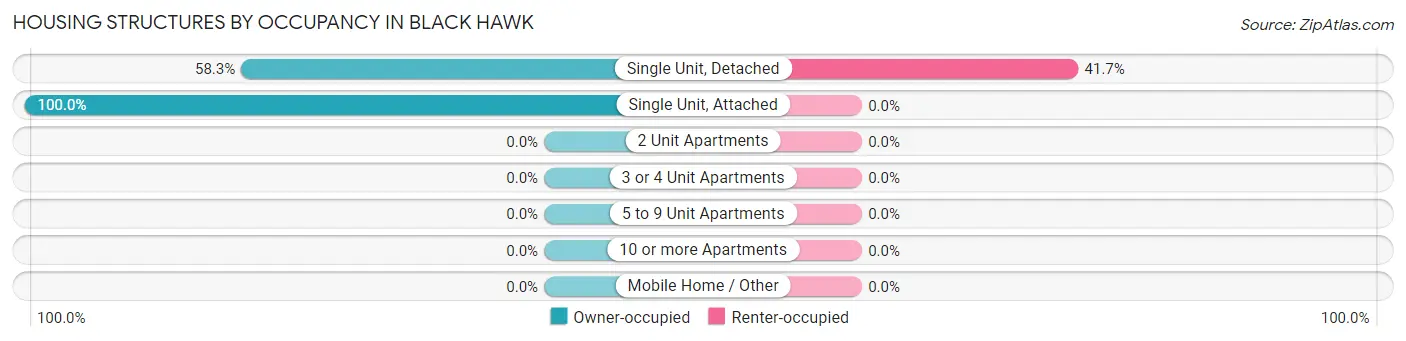
| Structure Type | Owner-occupied | Renter-occupied |
| Single Unit, Detached | 28 (58.3%) | 20 (41.7%) |
| Single Unit, Attached | 7 (100.0%) | 0 (0.0%) |
| 2 Unit Apartments | 0 (0.0%) | 0 (0.0%) |
| 3 or 4 Unit Apartments | 0 (0.0%) | 0 (0.0%) |
| 5 to 9 Unit Apartments | 0 (0.0%) | 0 (0.0%) |
| 10 or more Apartments | 0 (0.0%) | 0 (0.0%) |
| Mobile Home / Other | 0 (0.0%) | 0 (0.0%) |
| Total | 35 (63.6%) | 20 (36.4%) |
Housing Structures by Number of Rooms in Black Hawk
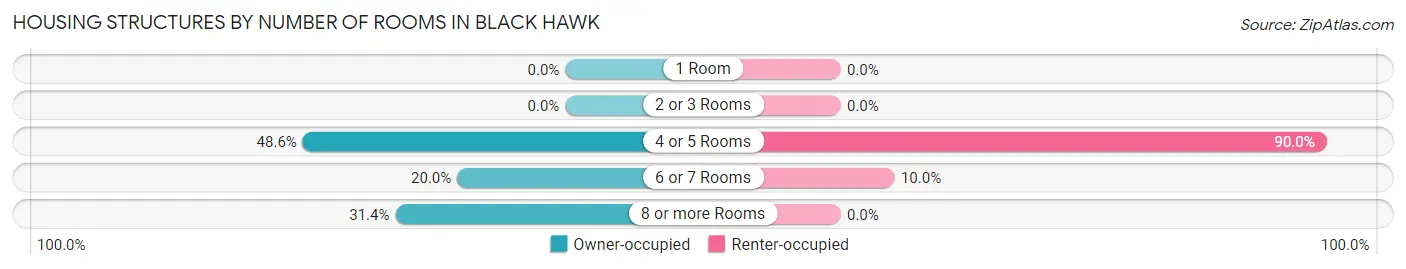
| Number of Rooms | Owner-occupied | Renter-occupied |
| 1 Room | 0 (0.0%) | 0 (0.0%) |
| 2 or 3 Rooms | 0 (0.0%) | 0 (0.0%) |
| 4 or 5 Rooms | 17 (48.6%) | 18 (90.0%) |
| 6 or 7 Rooms | 7 (20.0%) | 2 (10.0%) |
| 8 or more Rooms | 11 (31.4%) | 0 (0.0%) |
| Total | 35 (100.0%) | 20 (100.0%) |
Housing Structure by Heating Type in Black Hawk
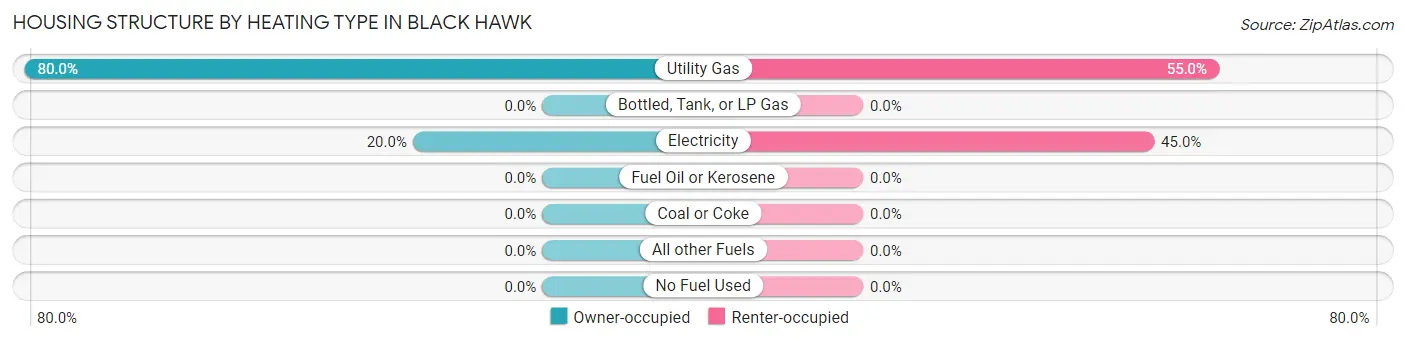
| Heating Type | Owner-occupied | Renter-occupied |
| Utility Gas | 28 (80.0%) | 11 (55.0%) |
| Bottled, Tank, or LP Gas | 0 (0.0%) | 0 (0.0%) |
| Electricity | 7 (20.0%) | 9 (45.0%) |
| Fuel Oil or Kerosene | 0 (0.0%) | 0 (0.0%) |
| Coal or Coke | 0 (0.0%) | 0 (0.0%) |
| All other Fuels | 0 (0.0%) | 0 (0.0%) |
| No Fuel Used | 0 (0.0%) | 0 (0.0%) |
| Total | 35 (100.0%) | 20 (100.0%) |
Household Vehicle Usage in Black Hawk
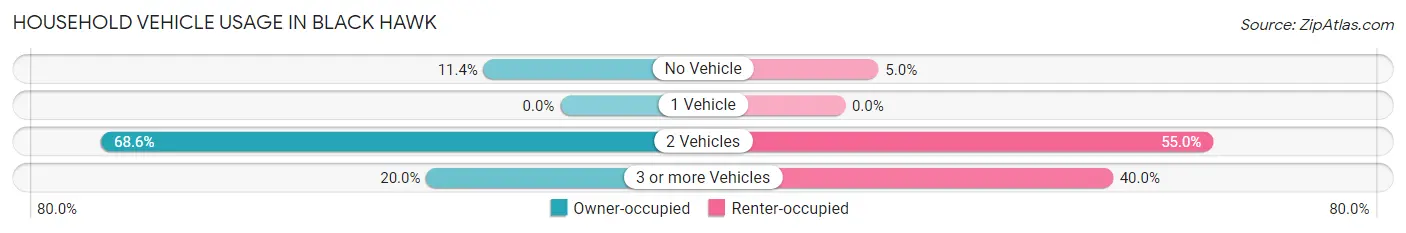
| Vehicles per Household | Owner-occupied | Renter-occupied |
| No Vehicle | 4 (11.4%) | 1 (5.0%) |
| 1 Vehicle | 0 (0.0%) | 0 (0.0%) |
| 2 Vehicles | 24 (68.6%) | 11 (55.0%) |
| 3 or more Vehicles | 7 (20.0%) | 8 (40.0%) |
| Total | 35 (100.0%) | 20 (100.0%) |
Real Estate & Mortgages in Black Hawk
Real Estate and Mortgage Overview in Black Hawk
| Characteristic | Without Mortgage | With Mortgage |
| Housing Units | 16 | 19 |
| Median Property Value | $427,300 | $541,700 |
| Median Household Income | $34,167 | $3 |
| Monthly Housing Costs | $229 | $0 |
| Real Estate Taxes | $600 | $0 |
Property Value by Mortgage Status in Black Hawk
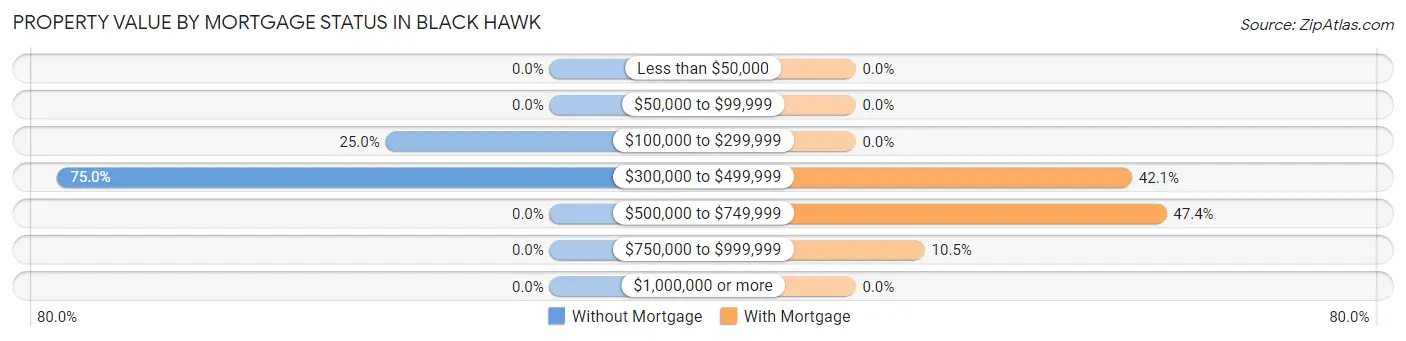
| Property Value | Without Mortgage | With Mortgage |
| Less than $50,000 | 0 (0.0%) | 0 (0.0%) |
| $50,000 to $99,999 | 0 (0.0%) | 0 (0.0%) |
| $100,000 to $299,999 | 4 (25.0%) | 0 (0.0%) |
| $300,000 to $499,999 | 12 (75.0%) | 8 (42.1%) |
| $500,000 to $749,999 | 0 (0.0%) | 9 (47.4%) |
| $750,000 to $999,999 | 0 (0.0%) | 2 (10.5%) |
| $1,000,000 or more | 0 (0.0%) | 0 (0.0%) |
| Total | 16 (100.0%) | 19 (100.0%) |
Household Income by Mortgage Status in Black Hawk
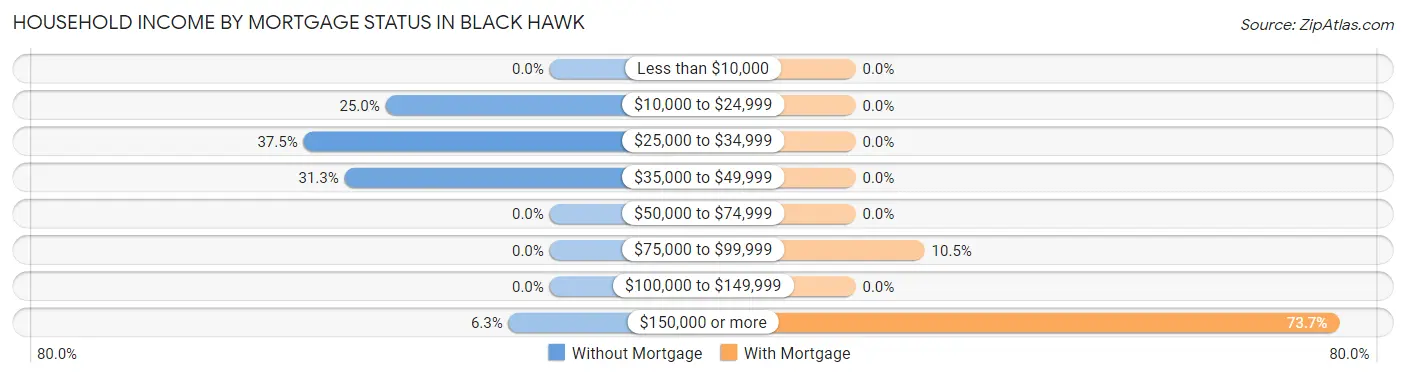
| Household Income | Without Mortgage | With Mortgage |
| Less than $10,000 | 0 (0.0%) | 0 (0.0%) |
| $10,000 to $24,999 | 4 (25.0%) | 0 (0.0%) |
| $25,000 to $34,999 | 6 (37.5%) | 0 (0.0%) |
| $35,000 to $49,999 | 5 (31.2%) | 0 (0.0%) |
| $50,000 to $74,999 | 0 (0.0%) | 0 (0.0%) |
| $75,000 to $99,999 | 0 (0.0%) | 2 (10.5%) |
| $100,000 to $149,999 | 0 (0.0%) | 0 (0.0%) |
| $150,000 or more | 1 (6.2%) | 14 (73.7%) |
| Total | 16 (100.0%) | 19 (100.0%) |
Property Value to Household Income Ratio in Black Hawk
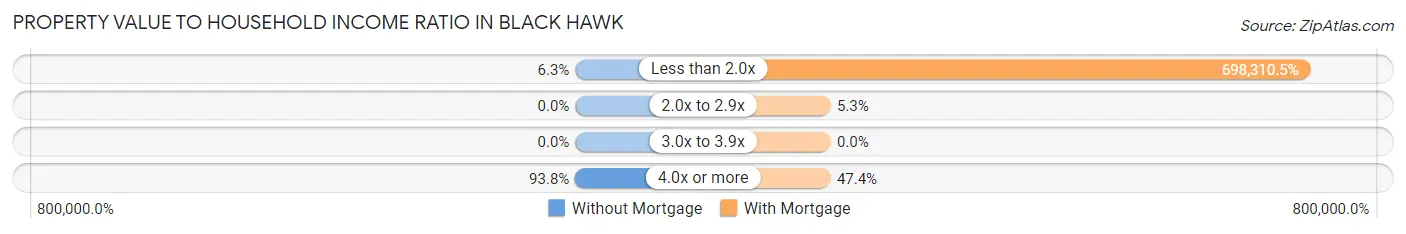
| Value-to-Income Ratio | Without Mortgage | With Mortgage |
| Less than 2.0x | 1 (6.2%) | 132,679 (698,310.5%) |
| 2.0x to 2.9x | 0 (0.0%) | 1 (5.3%) |
| 3.0x to 3.9x | 0 (0.0%) | 0 (0.0%) |
| 4.0x or more | 15 (93.8%) | 9 (47.4%) |
| Total | 16 (100.0%) | 19 (100.0%) |
Real Estate Taxes by Mortgage Status in Black Hawk
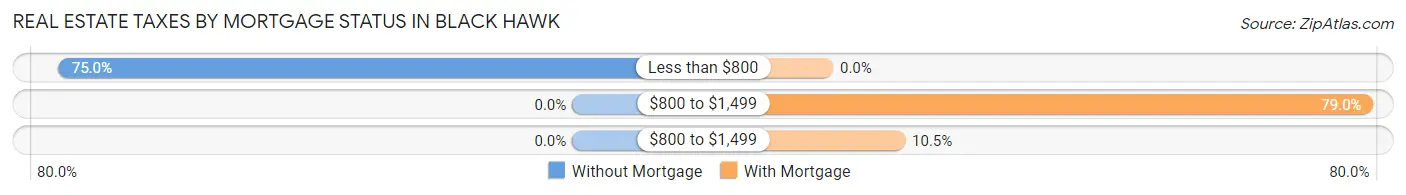
| Property Taxes | Without Mortgage | With Mortgage |
| Less than $800 | 12 (75.0%) | 0 (0.0%) |
| $800 to $1,499 | 0 (0.0%) | 15 (78.9%) |
| $800 to $1,499 | 0 (0.0%) | 2 (10.5%) |
| Total | 16 (100.0%) | 19 (100.0%) |
Health & Disability in Black Hawk
Health Insurance Coverage by Age in Black Hawk
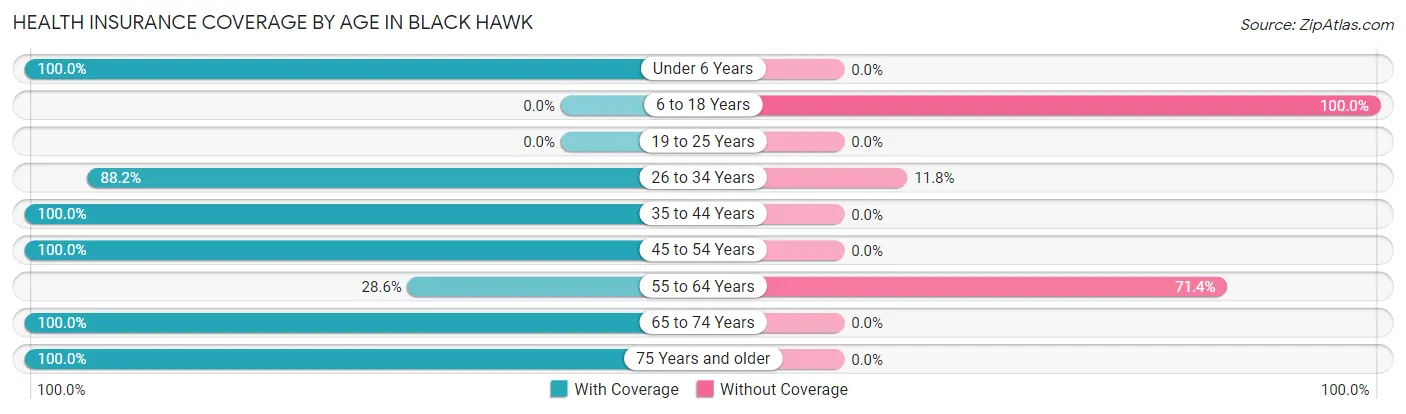
| Age Bracket | With Coverage | Without Coverage |
| Under 6 Years | 5 (100.0%) | 0 (0.0%) |
| 6 to 18 Years | 0 (0.0%) | 1 (100.0%) |
| 19 to 25 Years | 0 (0.0%) | 0 (0.0%) |
| 26 to 34 Years | 15 (88.2%) | 2 (11.8%) |
| 35 to 44 Years | 20 (100.0%) | 0 (0.0%) |
| 45 to 54 Years | 20 (100.0%) | 0 (0.0%) |
| 55 to 64 Years | 2 (28.6%) | 5 (71.4%) |
| 65 to 74 Years | 35 (100.0%) | 0 (0.0%) |
| 75 Years and older | 24 (100.0%) | 0 (0.0%) |
| Total | 121 (93.8%) | 8 (6.2%) |
Health Insurance Coverage by Citizenship Status in Black Hawk
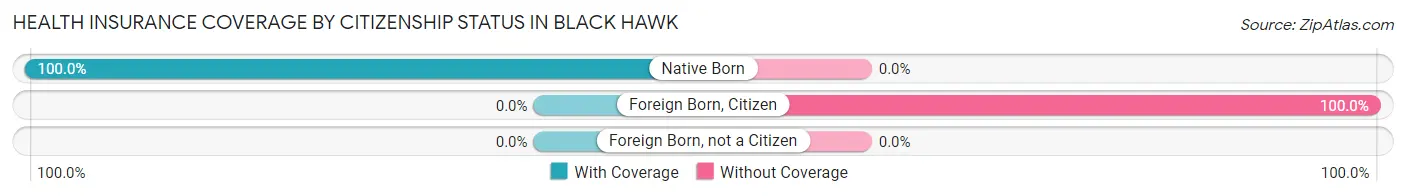
| Citizenship Status | With Coverage | Without Coverage |
| Native Born | 5 (100.0%) | 0 (0.0%) |
| Foreign Born, Citizen | 0 (0.0%) | 1 (100.0%) |
| Foreign Born, not a Citizen | 0 (0.0%) | 0 (0.0%) |
Health Insurance Coverage by Household Income in Black Hawk
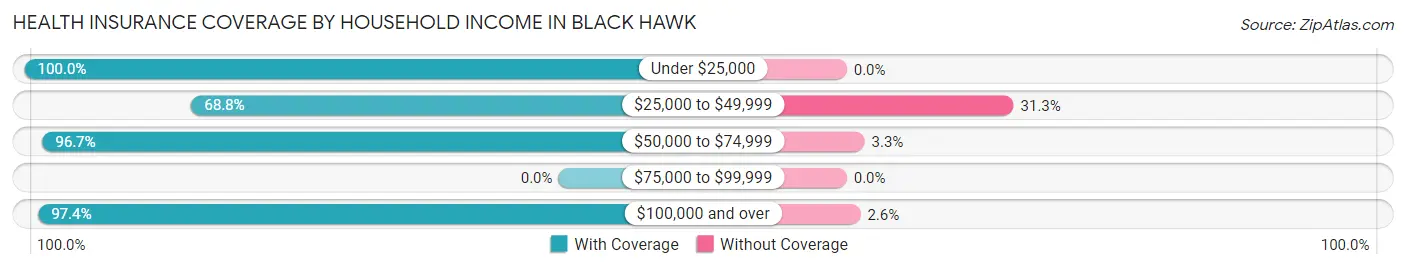
| Household Income | With Coverage | Without Coverage |
| Under $25,000 | 5 (100.0%) | 0 (0.0%) |
| $25,000 to $49,999 | 11 (68.8%) | 5 (31.2%) |
| $50,000 to $74,999 | 29 (96.7%) | 1 (3.3%) |
| $75,000 to $99,999 | 0 (0.0%) | 0 (0.0%) |
| $100,000 and over | 76 (97.4%) | 2 (2.6%) |
Public vs Private Health Insurance Coverage by Age in Black Hawk
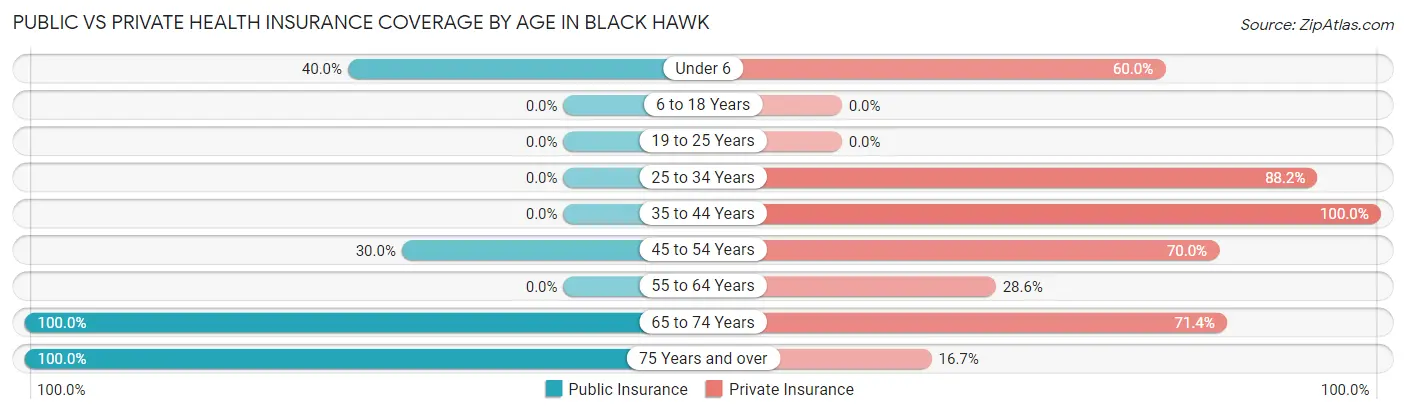
| Age Bracket | Public Insurance | Private Insurance |
| Under 6 | 2 (40.0%) | 3 (60.0%) |
| 6 to 18 Years | 0 (0.0%) | 0 (0.0%) |
| 19 to 25 Years | 0 (0.0%) | 0 (0.0%) |
| 25 to 34 Years | 0 (0.0%) | 15 (88.2%) |
| 35 to 44 Years | 0 (0.0%) | 20 (100.0%) |
| 45 to 54 Years | 6 (30.0%) | 14 (70.0%) |
| 55 to 64 Years | 0 (0.0%) | 2 (28.6%) |
| 65 to 74 Years | 35 (100.0%) | 25 (71.4%) |
| 75 Years and over | 24 (100.0%) | 4 (16.7%) |
| Total | 67 (51.9%) | 83 (64.3%) |
Disability Status by Sex by Age in Black Hawk
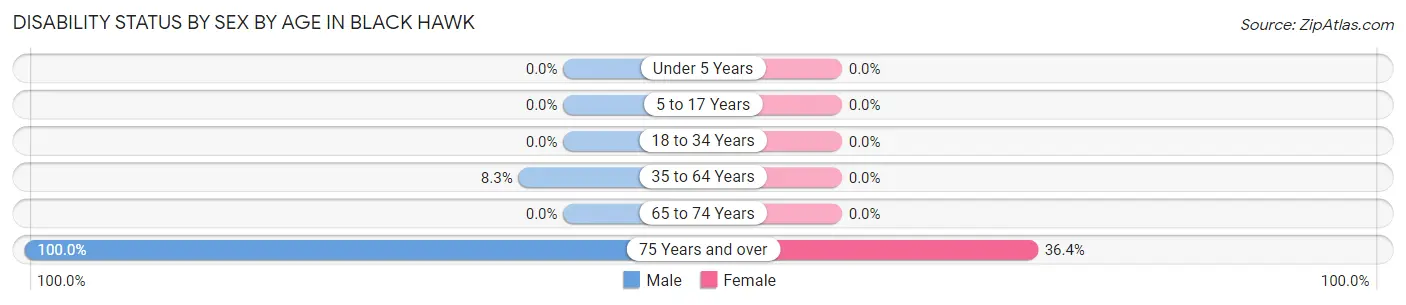
| Age Bracket | Male | Female |
| Under 5 Years | 0 (0.0%) | 0 (0.0%) |
| 5 to 17 Years | 0 (0.0%) | 0 (0.0%) |
| 18 to 34 Years | 0 (0.0%) | 0 (0.0%) |
| 35 to 64 Years | 2 (8.3%) | 0 (0.0%) |
| 65 to 74 Years | 0 (0.0%) | 0 (0.0%) |
| 75 Years and over | 13 (100.0%) | 4 (36.4%) |
Disability Class by Sex by Age in Black Hawk
Disability Class: Hearing Difficulty
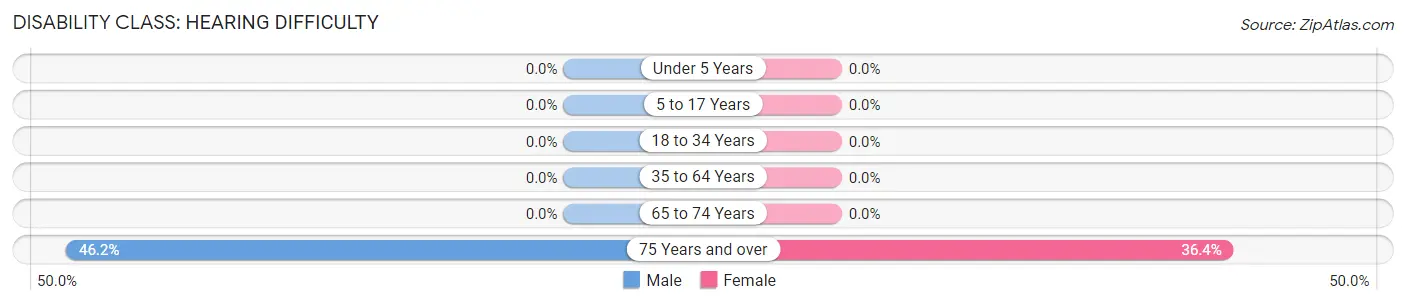
| Age Bracket | Male | Female |
| Under 5 Years | 0 (0.0%) | 0 (0.0%) |
| 5 to 17 Years | 0 (0.0%) | 0 (0.0%) |
| 18 to 34 Years | 0 (0.0%) | 0 (0.0%) |
| 35 to 64 Years | 0 (0.0%) | 0 (0.0%) |
| 65 to 74 Years | 0 (0.0%) | 0 (0.0%) |
| 75 Years and over | 6 (46.2%) | 4 (36.4%) |
Disability Class: Vision Difficulty
| Age Bracket | Male | Female |
| Under 5 Years | 0 (0.0%) | 0 (0.0%) |
| 5 to 17 Years | 0 (0.0%) | 0 (0.0%) |
| 18 to 34 Years | 0 (0.0%) | 0 (0.0%) |
| 35 to 64 Years | 0 (0.0%) | 0 (0.0%) |
| 65 to 74 Years | 0 (0.0%) | 0 (0.0%) |
| 75 Years and over | 0 (0.0%) | 0 (0.0%) |
Disability Class: Cognitive Difficulty

| Age Bracket | Male | Female |
| 5 to 17 Years | 0 (0.0%) | 0 (0.0%) |
| 18 to 34 Years | 0 (0.0%) | 0 (0.0%) |
| 35 to 64 Years | 0 (0.0%) | 0 (0.0%) |
| 65 to 74 Years | 0 (0.0%) | 0 (0.0%) |
| 75 Years and over | 0 (0.0%) | 0 (0.0%) |
Disability Class: Ambulatory Difficulty
| Age Bracket | Male | Female |
| 5 to 17 Years | 0 (0.0%) | 0 (0.0%) |
| 18 to 34 Years | 0 (0.0%) | 0 (0.0%) |
| 35 to 64 Years | 2 (8.3%) | 0 (0.0%) |
| 65 to 74 Years | 0 (0.0%) | 0 (0.0%) |
| 75 Years and over | 13 (100.0%) | 0 (0.0%) |
Disability Class: Self-Care Difficulty
| Age Bracket | Male | Female |
| 5 to 17 Years | 0 (0.0%) | 0 (0.0%) |
| 18 to 34 Years | 0 (0.0%) | 0 (0.0%) |
| 35 to 64 Years | 0 (0.0%) | 0 (0.0%) |
| 65 to 74 Years | 0 (0.0%) | 0 (0.0%) |
| 75 Years and over | 0 (0.0%) | 0 (0.0%) |
Technology Access in Black Hawk
Computing Device Access in Black Hawk
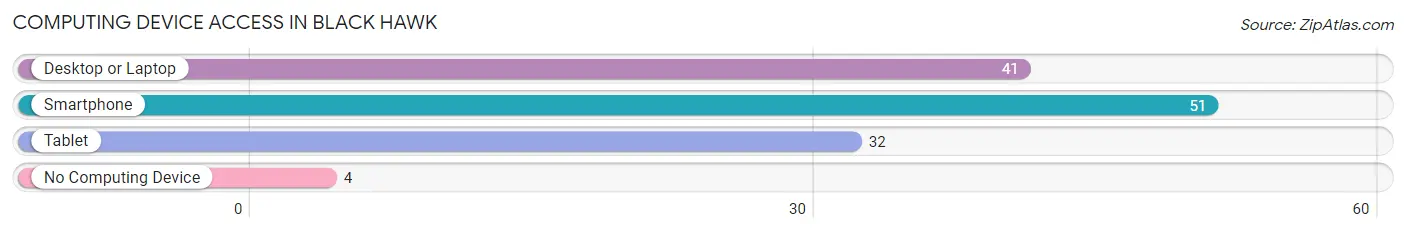
| Device Type | # Households | % Households |
| Desktop or Laptop | 41 | 74.6% |
| Smartphone | 51 | 92.7% |
| Tablet | 32 | 58.2% |
| No Computing Device | 4 | 7.3% |
| Total | 55 | 100.0% |
Internet Access in Black Hawk
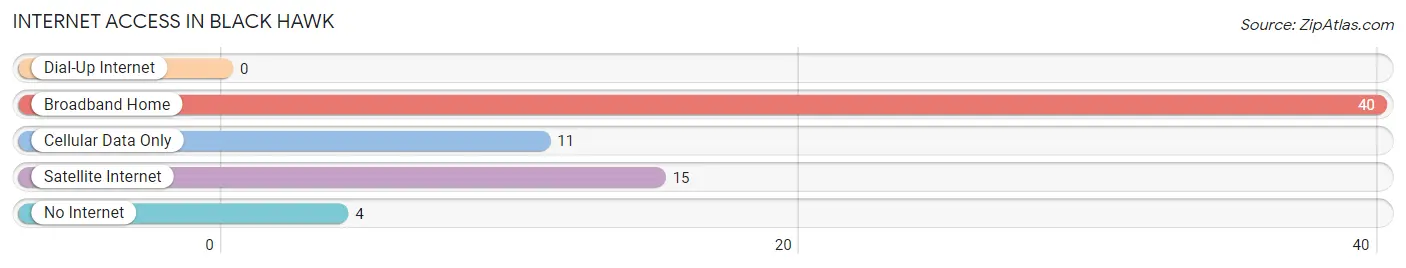
| Internet Type | # Households | % Households |
| Dial-Up Internet | 0 | 0.0% |
| Broadband Home | 40 | 72.7% |
| Cellular Data Only | 11 | 20.0% |
| Satellite Internet | 15 | 27.3% |
| No Internet | 4 | 7.3% |
| Total | 55 | 100.0% |
Black Hawk Summary
Black Hawk, Colorado is a small city located in Gilpin County, Colorado. It is situated in the foothills of the Rocky Mountains, approximately 40 miles west of Denver. The city is known for its casinos, which attract visitors from all over the state and beyond. The city has a population of just over 100 people, and is the smallest incorporated city in the state.
History
The area that is now Black Hawk was originally inhabited by the Ute Indians. The first European settlers arrived in the area in the late 1800s, and the town was officially incorporated in 1929. The city was named after Chief Black Hawk, a leader of the Sauk tribe of Native Americans.
The city was originally a mining town, and the first gold mine was established in 1859. The city quickly grew, and by the late 1800s, it was home to several saloons, hotels, and other businesses. The city was also home to several gambling establishments, which attracted visitors from all over the state.
In the early 1900s, the city began to decline as the gold mines began to run dry. The city was nearly abandoned by the 1940s, but in the late 1960s, the city was revitalized when the state legalized gambling. This led to the opening of several casinos in the city, which attracted visitors from all over the state and beyond.
Geography
Black Hawk is located in the foothills of the Rocky Mountains, approximately 40 miles west of Denver. The city is situated at an elevation of 8,400 feet, and is surrounded by mountains and forests. The city is located in a valley, and is bordered by the Clear Creek River to the north and the South Platte River to the south.
The city has a total area of 0.6 square miles, all of which is land. The city is located in a temperate climate, with warm summers and cold winters. The average temperature in the summer is around 70 degrees Fahrenheit, and the average temperature in the winter is around 30 degrees Fahrenheit.
Economy
The economy of Black Hawk is largely based on tourism. The city is home to several casinos, which attract visitors from all over the state and beyond. The casinos generate a significant amount of revenue for the city, and provide employment for many of the city’s residents.
In addition to the casinos, the city is also home to several restaurants, bars, and other businesses. The city is also home to several small manufacturing companies, which produce a variety of products.
Demographics
As of the 2010 census, the population of Black Hawk was 104. The city has a population density of 173 people per square mile. The median age of the city’s population is 44.7 years, and the median household income is $50,000.
The city is predominantly white, with 87.5% of the population identifying as white. The city is also home to a small Hispanic population, with 8.7% of the population identifying as Hispanic or Latino. The city is also home to a small African American population, with 1.9% of the population identifying as African American.
Conclusion
Black Hawk, Colorado is a small city located in Gilpin County, Colorado. It is situated in the foothills of the Rocky Mountains, approximately 40 miles west of Denver. The city is known for its casinos, which attract visitors from all over the state and beyond. The city has a population of just over 100 people, and is the smallest incorporated city in the state. The economy of Black Hawk is largely based on tourism, and the city is home to several casinos, restaurants, bars, and other businesses. The city is predominantly white, with 87.5% of the population identifying as white. The city is also home to a small Hispanic population, with 8.7% of the population identifying as Hispanic or Latino. The city is also home to a small African American population, with 1.9% of the population identifying as African American.
Common Questions
What is Per Capita Income in Black Hawk?
Per Capita income in Black Hawk is $61,069.
What is the Median Household income in Black Hawk?
Median Household Income in Black Hawk is $65,417.
What is Inequality or Gini Index in Black Hawk?
Inequality or Gini Index in Black Hawk is 0.37.
What is the Total Population of Black Hawk?
Total Population of Black Hawk is 129.
What is the Total Male Population of Black Hawk?
Total Male Population of Black Hawk is 81.
What is the Total Female Population of Black Hawk?
Total Female Population of Black Hawk is 48.
What is the Ratio of Males per 100 Females in Black Hawk?
There are 168.75 Males per 100 Females in Black Hawk.
What is the Ratio of Females per 100 Males in Black Hawk?
There are 59.26 Females per 100 Males in Black Hawk.
What is the Median Population Age in Black Hawk?
Median Population Age in Black Hawk is 55.2 Years.
What is the Average Family Size in Black Hawk
Average Family Size in Black Hawk is 3.0 People.
What is the Average Household Size in Black Hawk
Average Household Size in Black Hawk is 2.4 People.
How Large is the Labor Force in Black Hawk?
There are 90 People in the Labor Forcein in Black Hawk.
What is the Percentage of People in the Labor Force in Black Hawk?
73.2% of People are in the Labor Force in Black Hawk.