Berkley, CO Map & Demographics
Berkley Map
Berkley Overview
$33,159
PER CAPITA INCOME
$86,364
AVG FAMILY INCOME
$77,390
AVG HOUSEHOLD INCOME
44.5%
WAGE / INCOME GAP [ % ]
55.5¢/ $1
WAGE / INCOME GAP [ $ ]
0.42
INEQUALITY / GINI INDEX
11,185
TOTAL POPULATION
5,656
MALE POPULATION
5,529
FEMALE POPULATION
102.30
MALES / 100 FEMALES
97.75
FEMALES / 100 MALES
35.1
MEDIAN AGE
3.3
AVG FAMILY SIZE
2.8
AVG HOUSEHOLD SIZE
6,514
LABOR FORCE [ PEOPLE ]
71.5%
PERCENT IN LABOR FORCE
6.0%
UNEMPLOYMENT RATE
Income in Berkley
Income Overview in Berkley
Per Capita Income in Berkley is $33,159, while median incomes of families and households are $86,364 and $77,390 respectively.
| Characteristic | Number | Measure |
| Per Capita Income | 11,185 | $33,159 |
| Median Family Income | 2,690 | $86,364 |
| Mean Family Income | 2,690 | $104,711 |
| Median Household Income | 4,025 | $77,390 |
| Mean Household Income | 4,025 | $89,767 |
| Income Deficit | 2,690 | $0 |
| Wage / Income Gap (%) | 11,185 | 44.50% |
| Wage / Income Gap ($) | 11,185 | 55.50¢ per $1 |
| Gini / Inequality Index | 11,185 | 0.42 |
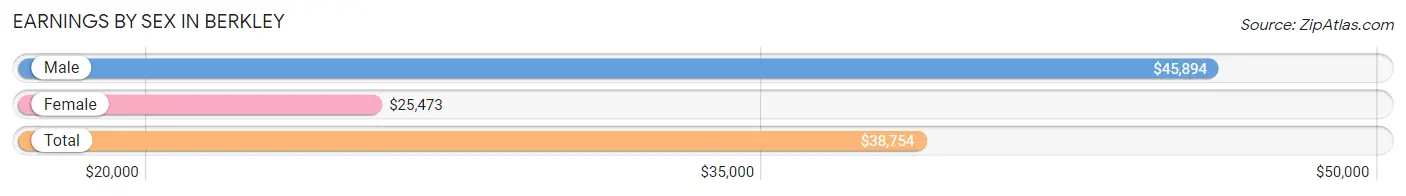
Earnings by Sex in Berkley
Average Earnings in Berkley are $38,754, $45,894 for men and $25,473 for women, a difference of 44.5%.
| Sex | Number | Average Earnings |
| Male | 3,690 (54.2%) | $45,894 |
| Female | 3,120 (45.8%) | $25,473 |
| Total | 6,810 (100.0%) | $38,754 |
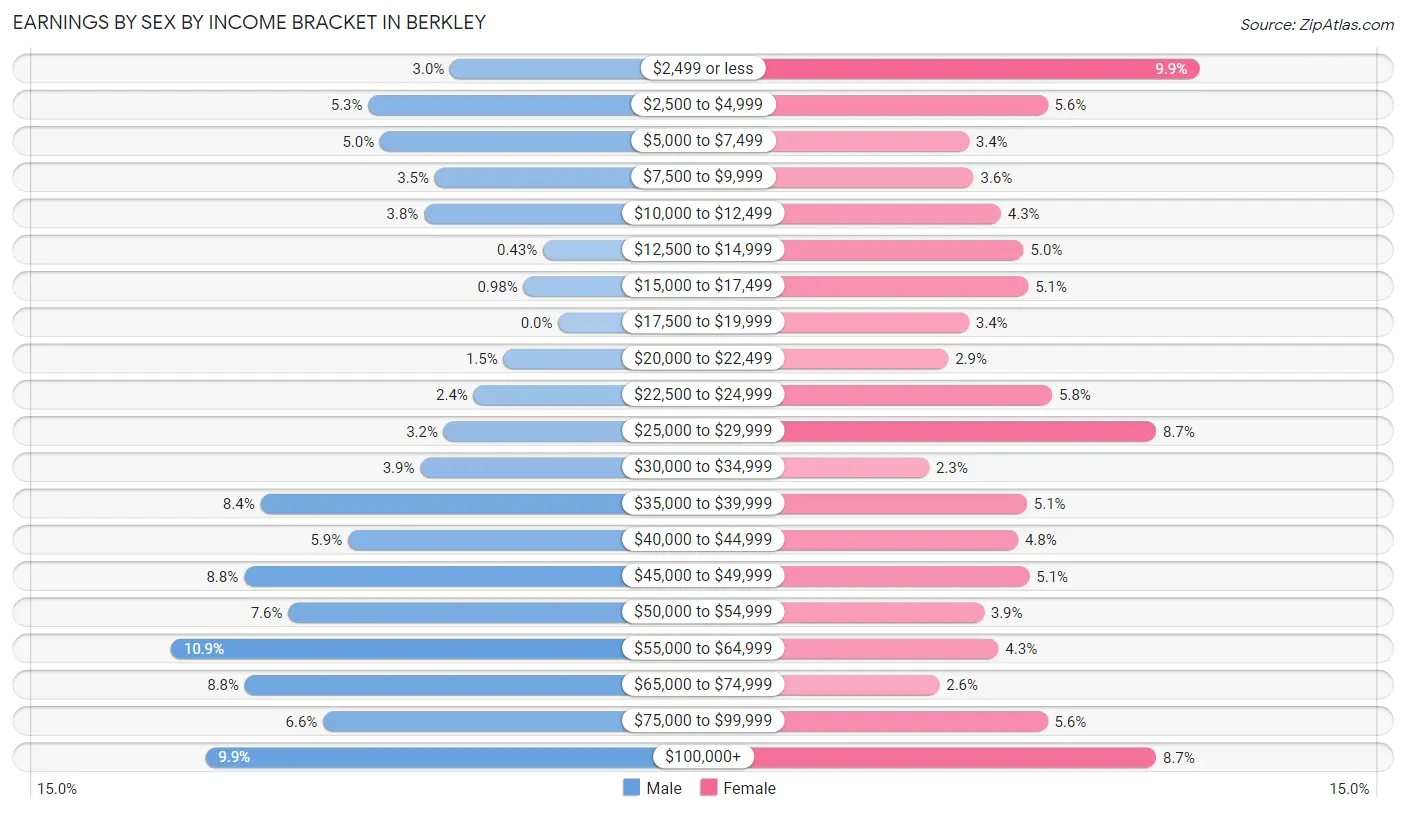
Earnings by Sex by Income Bracket in Berkley
The most common earnings brackets in Berkley are $55,000 to $64,999 for men (402 | 10.9%) and $2,499 or less for women (309 | 9.9%).
| Income | Male | Female |
| $2,499 or less | 112 (3.0%) | 309 (9.9%) |
| $2,500 to $4,999 | 197 (5.3%) | 176 (5.6%) |
| $5,000 to $7,499 | 185 (5.0%) | 107 (3.4%) |
| $7,500 to $9,999 | 128 (3.5%) | 111 (3.6%) |
| $10,000 to $12,499 | 139 (3.8%) | 135 (4.3%) |
| $12,500 to $14,999 | 16 (0.4%) | 155 (5.0%) |
| $15,000 to $17,499 | 36 (1.0%) | 159 (5.1%) |
| $17,500 to $19,999 | 0 (0.0%) | 107 (3.4%) |
| $20,000 to $22,499 | 57 (1.5%) | 89 (2.9%) |
| $22,500 to $24,999 | 88 (2.4%) | 180 (5.8%) |
| $25,000 to $29,999 | 119 (3.2%) | 271 (8.7%) |
| $30,000 to $34,999 | 143 (3.9%) | 72 (2.3%) |
| $35,000 to $39,999 | 309 (8.4%) | 158 (5.1%) |
| $40,000 to $44,999 | 218 (5.9%) | 150 (4.8%) |
| $45,000 to $49,999 | 326 (8.8%) | 160 (5.1%) |
| $50,000 to $54,999 | 280 (7.6%) | 120 (3.8%) |
| $55,000 to $64,999 | 402 (10.9%) | 133 (4.3%) |
| $65,000 to $74,999 | 325 (8.8%) | 81 (2.6%) |
| $75,000 to $99,999 | 244 (6.6%) | 176 (5.6%) |
| $100,000+ | 366 (9.9%) | 271 (8.7%) |
| Total | 3,690 (100.0%) | 3,120 (100.0%) |
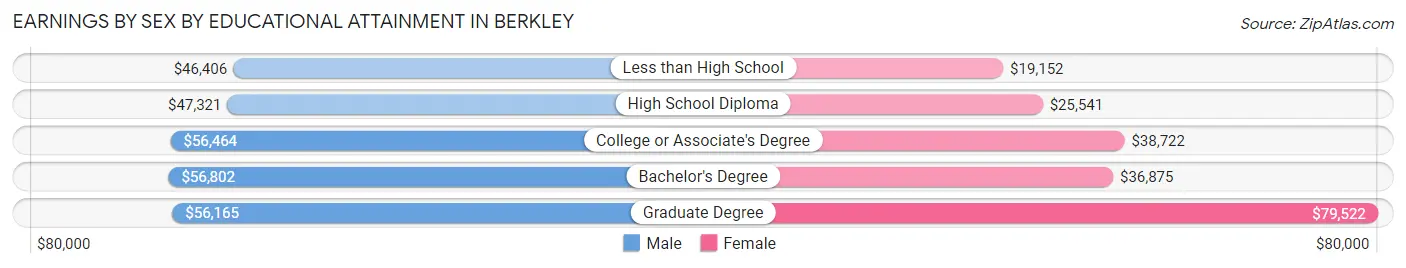
Earnings by Sex by Educational Attainment in Berkley
Average earnings in Berkley are $51,648 for men and $34,254 for women, a difference of 33.7%. Men with an educational attainment of bachelor's degree enjoy the highest average annual earnings of $56,802, while those with less than high school education earn the least with $46,406. Women with an educational attainment of graduate degree earn the most with the average annual earnings of $79,522, while those with less than high school education have the smallest earnings of $19,152.
| Educational Attainment | Male Income | Female Income |
| Less than High School | $46,406 | $19,152 |
| High School Diploma | $47,321 | $25,541 |
| College or Associate's Degree | $56,464 | $38,722 |
| Bachelor's Degree | $56,802 | $36,875 |
| Graduate Degree | $56,165 | $79,522 |
| Total | $51,648 | $34,254 |
Family Income in Berkley
Family Income Brackets in Berkley
According to the Berkley family income data, there are 675 families falling into the $75,000 to $99,999 income range, which is the most common income bracket and makes up 25.1% of all families. Conversely, the $10,000 to $14,999 income bracket is the least frequent group with only 70 families (2.6%) belonging to this category.
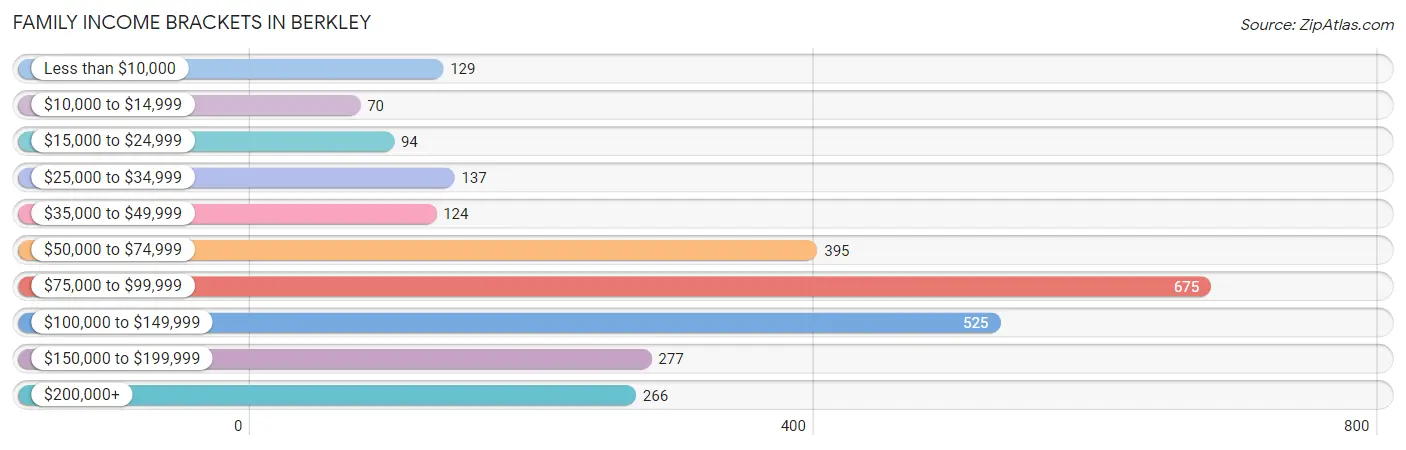
| Income Bracket | # Families | % Families |
| Less than $10,000 | 129 | 4.8% |
| $10,000 to $14,999 | 70 | 2.6% |
| $15,000 to $24,999 | 94 | 3.5% |
| $25,000 to $34,999 | 137 | 5.1% |
| $35,000 to $49,999 | 124 | 4.6% |
| $50,000 to $74,999 | 395 | 14.7% |
| $75,000 to $99,999 | 675 | 25.1% |
| $100,000 to $149,999 | 525 | 19.5% |
| $150,000 to $199,999 | 277 | 10.3% |
| $200,000+ | 266 | 9.9% |
Family Income by Famaliy Size in Berkley
6-person families (83 | 3.1%) account for the highest median family income in Berkley with $132,102 per family, while 2-person families (988 | 36.7%) have the highest median income of $41,080 per family member.
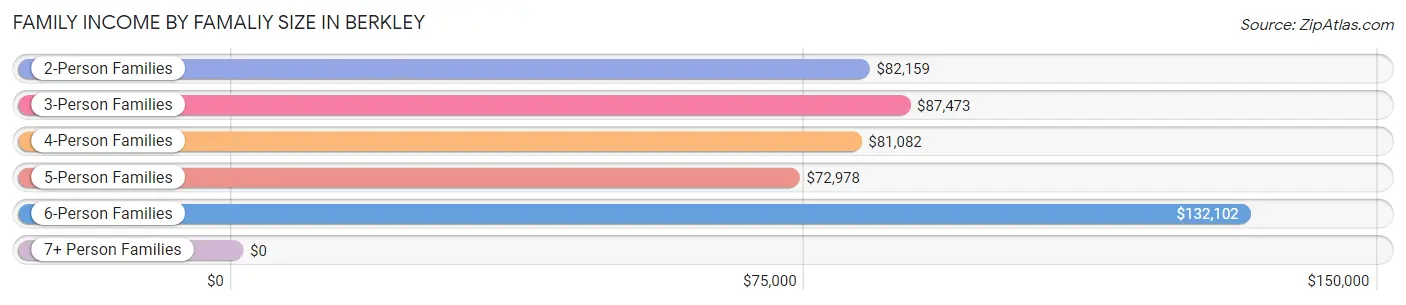
| Income Bracket | # Families | Median Income |
| 2-Person Families | 988 (36.7%) | $82,159 |
| 3-Person Families | 766 (28.5%) | $87,473 |
| 4-Person Families | 489 (18.2%) | $81,082 |
| 5-Person Families | 275 (10.2%) | $72,978 |
| 6-Person Families | 83 (3.1%) | $132,102 |
| 7+ Person Families | 89 (3.3%) | $0 |
| Total | 2,690 (100.0%) | $86,364 |
Family Income by Number of Earners in Berkley
The median family income in Berkley is $86,364, with families comprising 3+ earners (465) having the highest median family income of $131,442, while families with no earners (164) have the lowest median family income of $40,000, accounting for 17.3% and 6.1% of families, respectively.
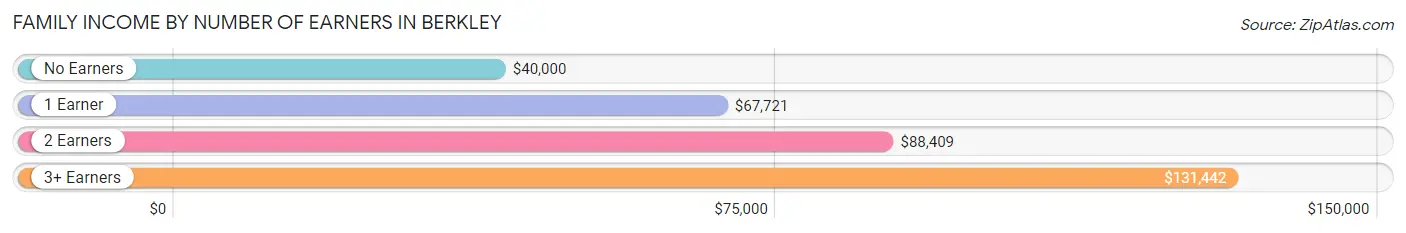
| Number of Earners | # Families | Median Income |
| No Earners | 164 (6.1%) | $40,000 |
| 1 Earner | 727 (27.0%) | $67,721 |
| 2 Earners | 1,334 (49.6%) | $88,409 |
| 3+ Earners | 465 (17.3%) | $131,442 |
| Total | 2,690 (100.0%) | $86,364 |
Household Income in Berkley
Household Income Brackets in Berkley
With 781 households falling in the category, the $75,000 to $99,999 income range is the most frequent in Berkley, accounting for 19.4% of all households. In contrast, only 177 households (4.4%) fall into the $10,000 to $14,999 income bracket, making it the least populous group.
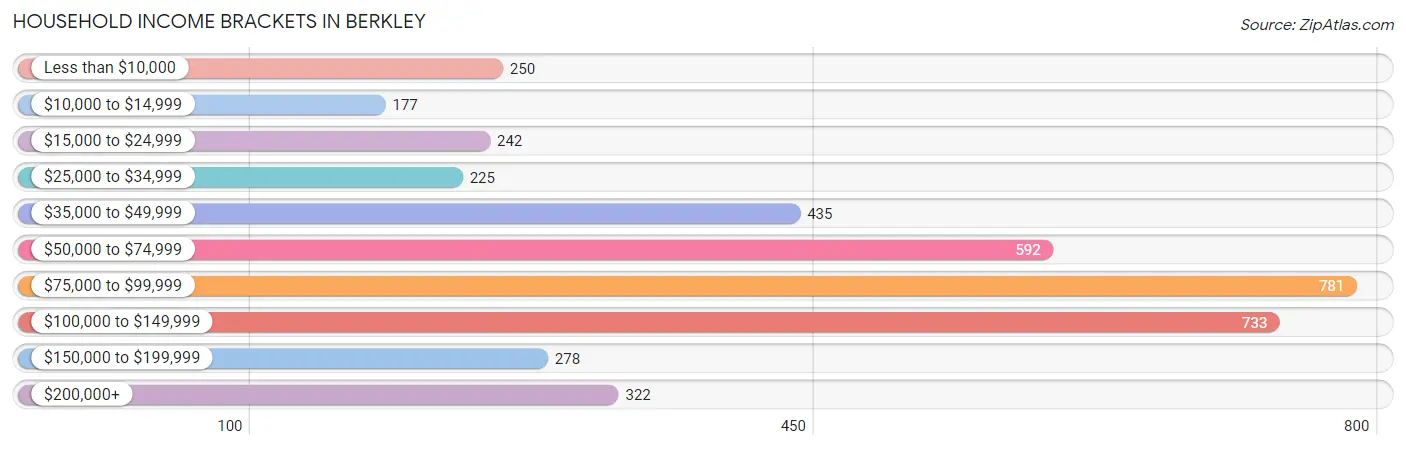
| Income Bracket | # Households | % Households |
| Less than $10,000 | 250 | 6.2% |
| $10,000 to $14,999 | 177 | 4.4% |
| $15,000 to $24,999 | 242 | 6.0% |
| $25,000 to $34,999 | 225 | 5.6% |
| $35,000 to $49,999 | 435 | 10.8% |
| $50,000 to $74,999 | 592 | 14.7% |
| $75,000 to $99,999 | 781 | 19.4% |
| $100,000 to $149,999 | 733 | 18.2% |
| $150,000 to $199,999 | 278 | 6.9% |
| $200,000+ | 322 | 8.0% |
Household Income by Householder Age in Berkley
The median household income in Berkley is $77,390, with the highest median household income of $88,133 found in the 45 to 64 years age bracket for the primary householder. A total of 1,374 households (34.1%) fall into this category. Meanwhile, the 15 to 24 years age bracket for the primary householder has the lowest median household income of $0, with 313 households (7.8%) in this group.
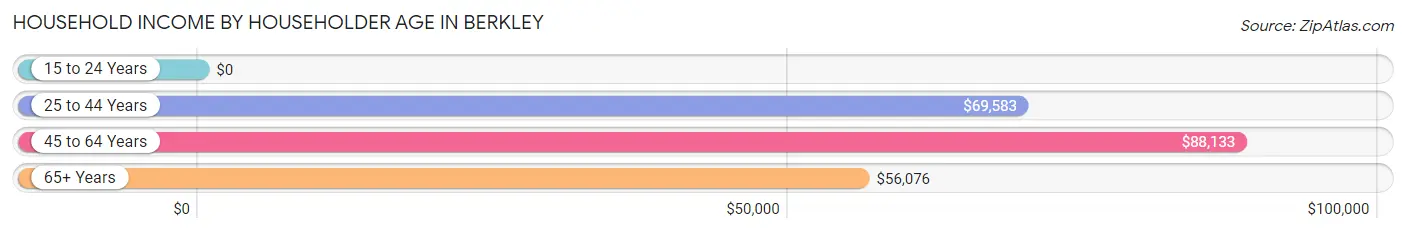
| Income Bracket | # Households | Median Income |
| 15 to 24 Years | 313 (7.8%) | $0 |
| 25 to 44 Years | 1,561 (38.8%) | $69,583 |
| 45 to 64 Years | 1,374 (34.1%) | $88,133 |
| 65+ Years | 777 (19.3%) | $56,076 |
| Total | 4,025 (100.0%) | $77,390 |
Poverty in Berkley
Income Below Poverty by Sex and Age in Berkley
With 14.9% poverty level for males and 13.8% for females among the residents of Berkley, 5 year old males and 5 year old females are the most vulnerable to poverty, with 21 males (28.0%) and 34 females (80.9%) in their respective age groups living below the poverty level.
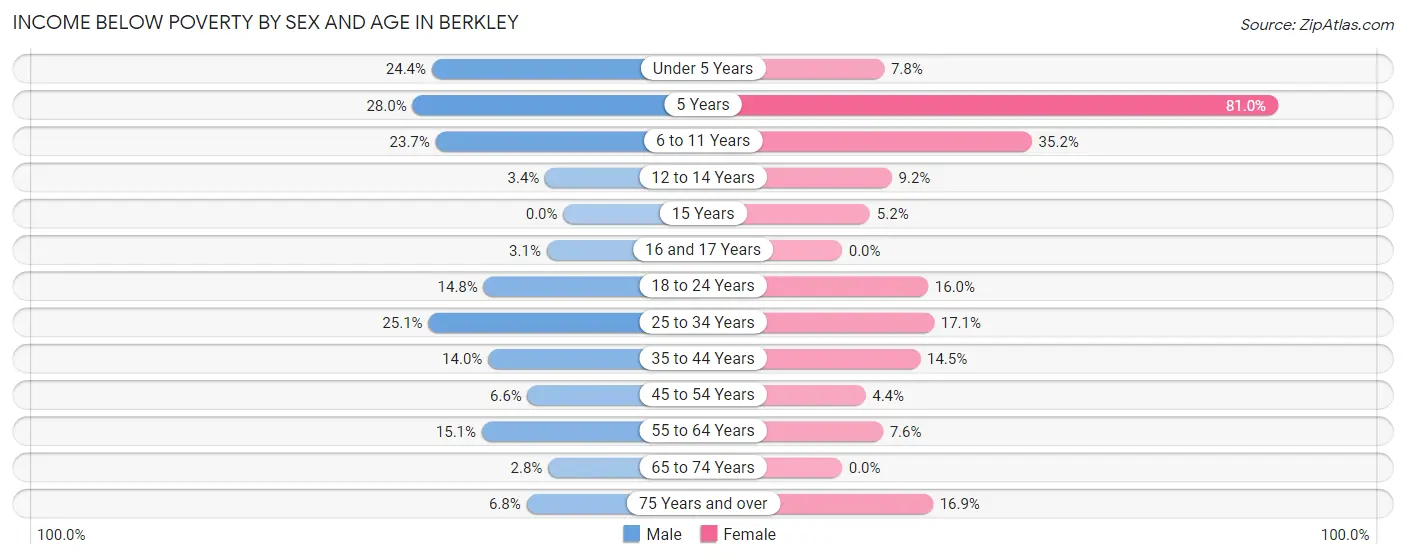
| Age Bracket | Male | Female |
| Under 5 Years | 72 (24.4%) | 23 (7.8%) |
| 5 Years | 21 (28.0%) | 34 (80.9%) |
| 6 to 11 Years | 78 (23.7%) | 154 (35.2%) |
| 12 to 14 Years | 6 (3.4%) | 22 (9.2%) |
| 15 Years | 0 (0.0%) | 7 (5.2%) |
| 16 and 17 Years | 6 (3.1%) | 0 (0.0%) |
| 18 to 24 Years | 99 (14.8%) | 148 (16.0%) |
| 25 to 34 Years | 240 (25.1%) | 119 (17.1%) |
| 35 to 44 Years | 134 (14.0%) | 129 (14.5%) |
| 45 to 54 Years | 36 (6.6%) | 24 (4.4%) |
| 55 to 64 Years | 118 (15.1%) | 47 (7.6%) |
| 65 to 74 Years | 9 (2.8%) | 0 (0.0%) |
| 75 Years and over | 20 (6.8%) | 56 (16.9%) |
| Total | 839 (14.9%) | 763 (13.8%) |
Income Above Poverty by Sex and Age in Berkley
According to the poverty statistics in Berkley, males aged 15 years and females aged 16 and 17 years are the age groups that are most secure financially, with 100.0% of males and 100.0% of females in these age groups living above the poverty line.
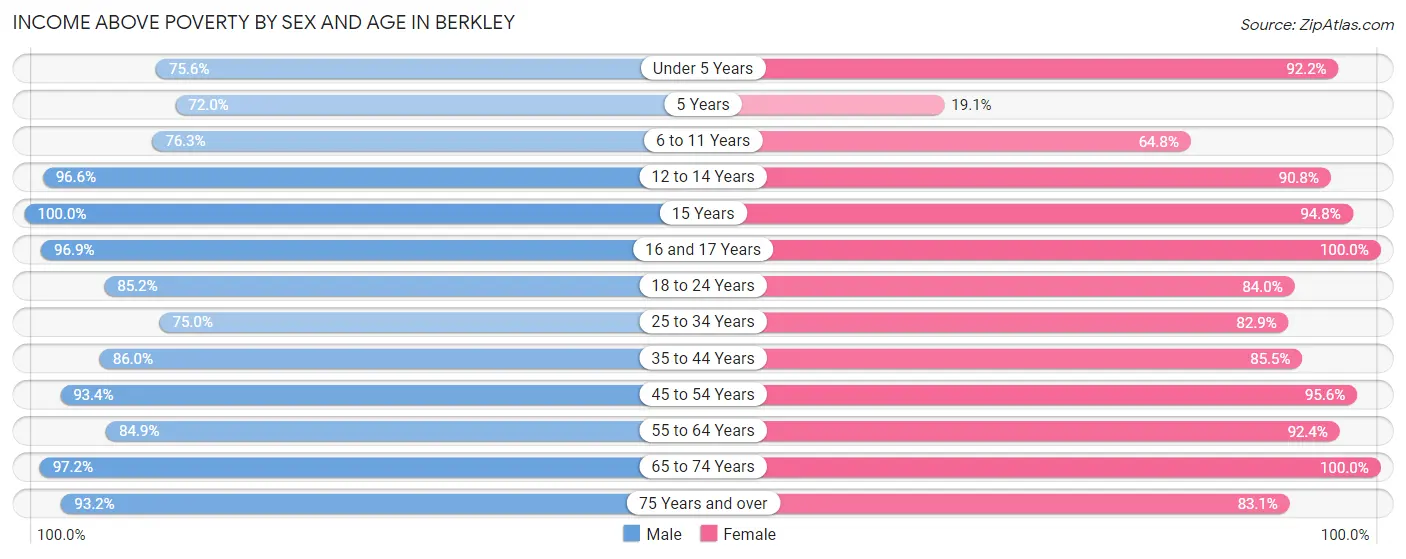
| Age Bracket | Male | Female |
| Under 5 Years | 223 (75.6%) | 271 (92.2%) |
| 5 Years | 54 (72.0%) | 8 (19.1%) |
| 6 to 11 Years | 251 (76.3%) | 283 (64.8%) |
| 12 to 14 Years | 172 (96.6%) | 216 (90.8%) |
| 15 Years | 34 (100.0%) | 127 (94.8%) |
| 16 and 17 Years | 189 (96.9%) | 52 (100.0%) |
| 18 to 24 Years | 570 (85.2%) | 778 (84.0%) |
| 25 to 34 Years | 718 (75.0%) | 578 (82.9%) |
| 35 to 44 Years | 826 (86.0%) | 759 (85.5%) |
| 45 to 54 Years | 508 (93.4%) | 526 (95.6%) |
| 55 to 64 Years | 662 (84.9%) | 572 (92.4%) |
| 65 to 74 Years | 310 (97.2%) | 312 (100.0%) |
| 75 Years and over | 273 (93.2%) | 276 (83.1%) |
| Total | 4,790 (85.1%) | 4,758 (86.2%) |
Income Below Poverty Among Married-Couple Families in Berkley
The poverty statistics for married-couple families in Berkley show that 6.0% or 117 of the total 1,964 families live below the poverty line. Families with 3 or 4 children have the highest poverty rate of 16.7%, comprising of 38 families. On the other hand, families with no children have the lowest poverty rate of 2.8%, which includes 31 families.
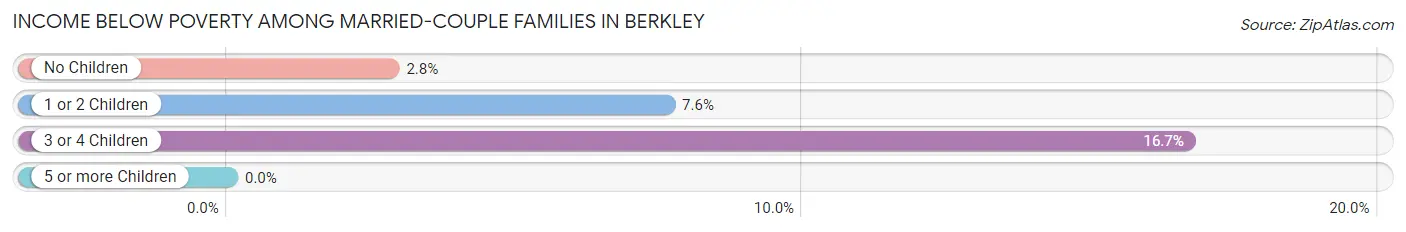
| Children | Above Poverty | Below Poverty |
| No Children | 1,074 (97.2%) | 31 (2.8%) |
| 1 or 2 Children | 583 (92.4%) | 48 (7.6%) |
| 3 or 4 Children | 190 (83.3%) | 38 (16.7%) |
| 5 or more Children | 0 (0.0%) | 0 (0.0%) |
| Total | 1,847 (94.0%) | 117 (6.0%) |
Income Below Poverty Among Single-Parent Households in Berkley
According to the poverty data in Berkley, 15.0% or 38 single-father households and 27.5% or 130 single-mother households are living below the poverty line. Among single-father households, those with no children have the highest poverty rate, with 38 households (22.5%) experiencing poverty. Likewise, among single-mother households, those with 1 or 2 children have the highest poverty rate, with 123 households (52.6%) falling below the poverty line.
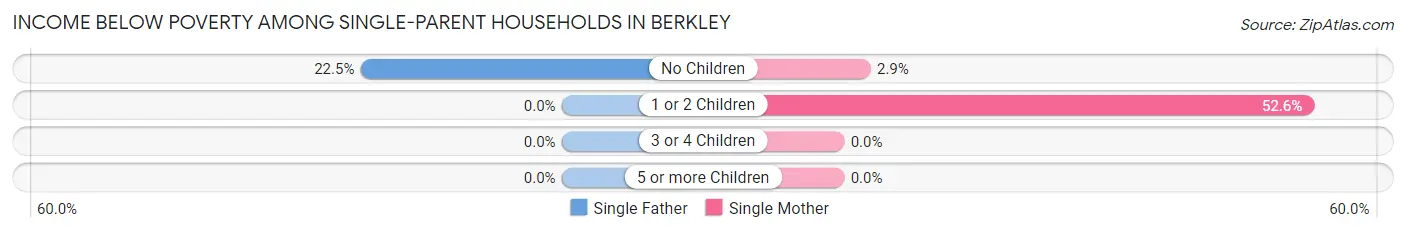
| Children | Single Father | Single Mother |
| No Children | 38 (22.5%) | 7 (2.9%) |
| 1 or 2 Children | 0 (0.0%) | 123 (52.6%) |
| 3 or 4 Children | 0 (0.0%) | 0 (0.0%) |
| 5 or more Children | 0 (0.0%) | 0 (0.0%) |
| Total | 38 (15.0%) | 130 (27.5%) |
Income Below Poverty Among Married-Couple vs Single-Parent Households in Berkley
The poverty data for Berkley shows that 117 of the married-couple family households (6.0%) and 168 of the single-parent households (23.1%) are living below the poverty level. Within the married-couple family households, those with 3 or 4 children have the highest poverty rate, with 38 households (16.7%) falling below the poverty line. Among the single-parent households, those with 1 or 2 children have the highest poverty rate, with 123 household (43.3%) living below poverty.
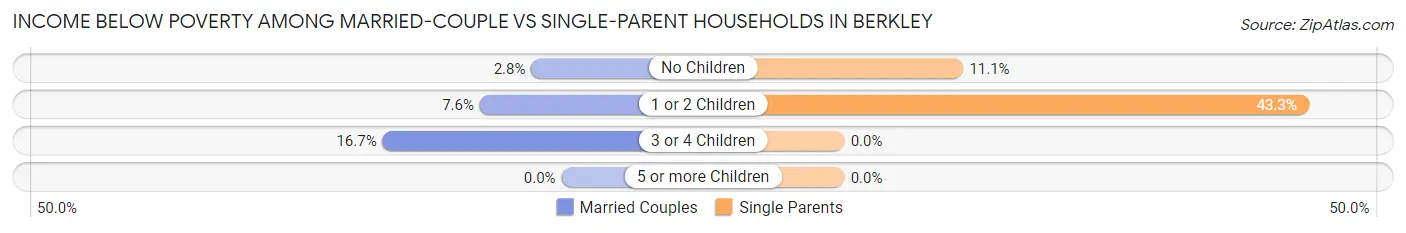
| Children | Married-Couple Families | Single-Parent Households |
| No Children | 31 (2.8%) | 45 (11.1%) |
| 1 or 2 Children | 48 (7.6%) | 123 (43.3%) |
| 3 or 4 Children | 38 (16.7%) | 0 (0.0%) |
| 5 or more Children | 0 (0.0%) | 0 (0.0%) |
| Total | 117 (6.0%) | 168 (23.1%) |
Race in Berkley
The most populous races in Berkley are White / Caucasian (7,479 | 66.9%), Hispanic or Latino (6,095 | 54.5%), and Two or more Races (1,851 | 16.6%).
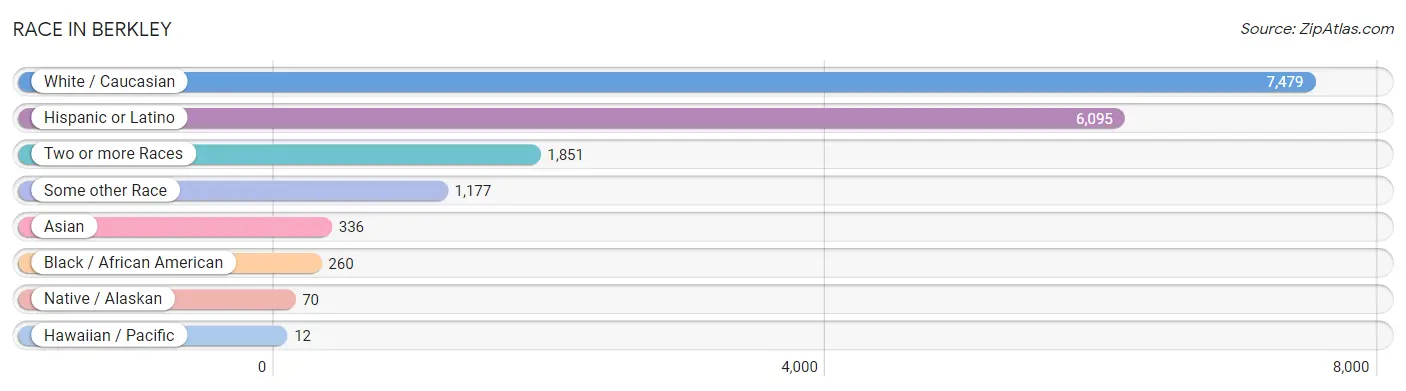
| Race | # Population | % Population |
| Asian | 336 | 3.0% |
| Black / African American | 260 | 2.3% |
| Hawaiian / Pacific | 12 | 0.1% |
| Hispanic or Latino | 6,095 | 54.5% |
| Native / Alaskan | 70 | 0.6% |
| White / Caucasian | 7,479 | 66.9% |
| Two or more Races | 1,851 | 16.6% |
| Some other Race | 1,177 | 10.5% |
| Total | 11,185 | 100.0% |
Ancestry in Berkley
The most populous ancestries reported in Berkley are Mexican (5,348 | 47.8%), German (804 | 7.2%), English (635 | 5.7%), Irish (556 | 5.0%), and Italian (388 | 3.5%), together accounting for 69.1% of all Berkley residents.
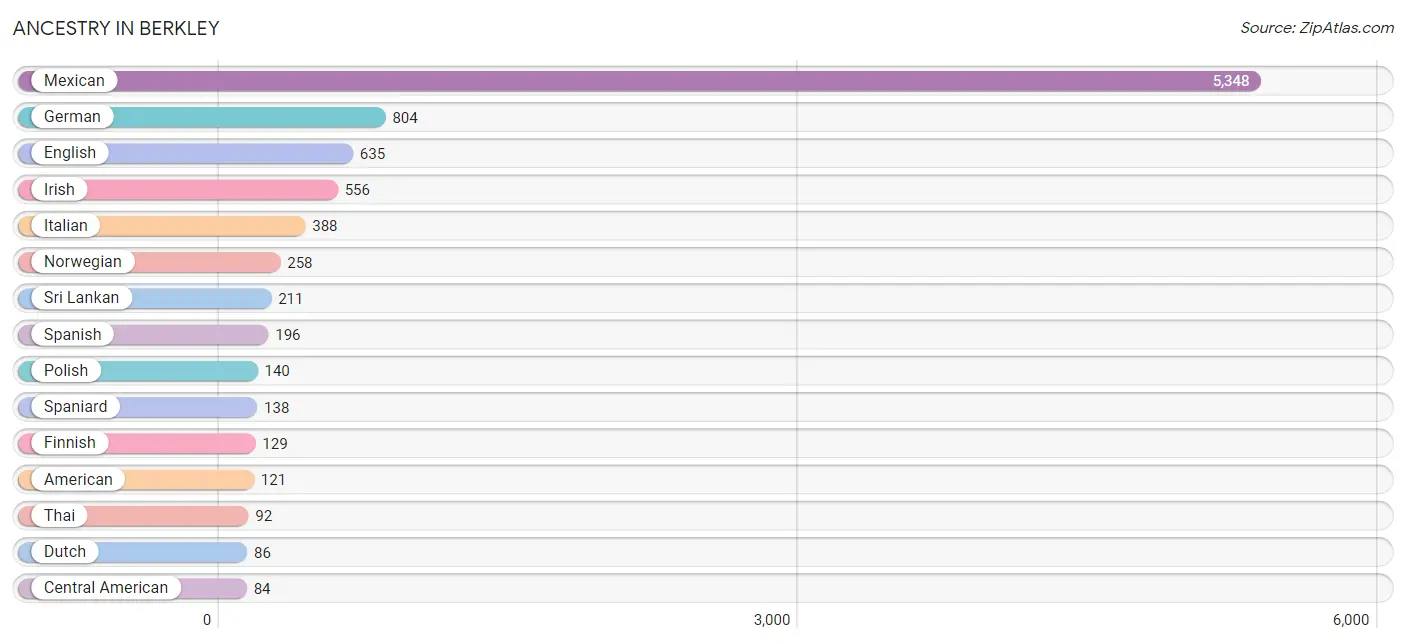
| Ancestry | # Population | % Population |
| American | 121 | 1.1% |
| Apache | 6 | 0.1% |
| Armenian | 6 | 0.1% |
| Austrian | 12 | 0.1% |
| Bangladeshi | 42 | 0.4% |
| Basque | 8 | 0.1% |
| Belgian | 11 | 0.1% |
| Bhutanese | 12 | 0.1% |
| Blackfeet | 18 | 0.2% |
| British | 15 | 0.1% |
| Burmese | 69 | 0.6% |
| Carpatho Rusyn | 18 | 0.2% |
| Celtic | 20 | 0.2% |
| Central American | 84 | 0.7% |
| Cherokee | 21 | 0.2% |
| Croatian | 10 | 0.1% |
| Czech | 8 | 0.1% |
| Czechoslovakian | 22 | 0.2% |
| Danish | 15 | 0.1% |
| Dutch | 86 | 0.8% |
| English | 635 | 5.7% |
| Ethiopian | 3 | 0.0% |
| European | 32 | 0.3% |
| Fijian | 7 | 0.1% |
| Finnish | 129 | 1.1% |
| French | 46 | 0.4% |
| German | 804 | 7.2% |
| Greek | 13 | 0.1% |
| Guamanian / Chamorro | 5 | 0.0% |
| Guatemalan | 78 | 0.7% |
| Hungarian | 23 | 0.2% |
| Indian (Asian) | 64 | 0.6% |
| Irish | 556 | 5.0% |
| Italian | 388 | 3.5% |
| Mexican | 5,348 | 47.8% |
| Native Hawaiian | 8 | 0.1% |
| Navajo | 60 | 0.5% |
| Northern European | 31 | 0.3% |
| Norwegian | 258 | 2.3% |
| Osage | 11 | 0.1% |
| Polish | 140 | 1.3% |
| Portuguese | 25 | 0.2% |
| Pueblo | 14 | 0.1% |
| Russian | 69 | 0.6% |
| Salvadoran | 6 | 0.1% |
| Scandinavian | 78 | 0.7% |
| Scotch-Irish | 33 | 0.3% |
| Scottish | 47 | 0.4% |
| Sioux | 15 | 0.1% |
| Slovak | 7 | 0.1% |
| Spaniard | 138 | 1.2% |
| Spanish | 196 | 1.8% |
| Spanish American | 27 | 0.2% |
| Spanish American Indian | 6 | 0.1% |
| Sri Lankan | 211 | 1.9% |
| Subsaharan African | 3 | 0.0% |
| Swedish | 77 | 0.7% |
| Thai | 92 | 0.8% |
| Ukrainian | 35 | 0.3% |
| Ute | 7 | 0.1% |
| Welsh | 8 | 0.1% | View All 61 Rows |
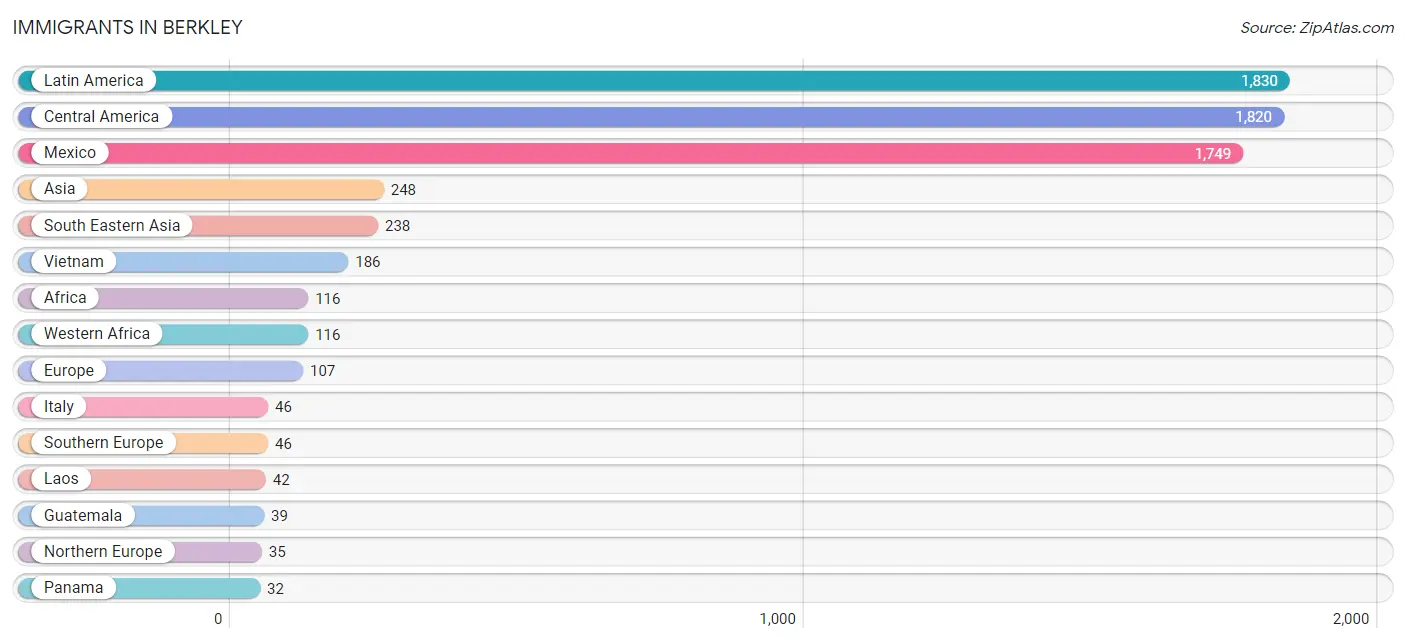
Immigrants in Berkley
The most numerous immigrant groups reported in Berkley came from Latin America (1,830 | 16.4%), Central America (1,820 | 16.3%), Mexico (1,749 | 15.6%), Asia (248 | 2.2%), and South Eastern Asia (238 | 2.1%), together accounting for 52.6% of all Berkley residents.
| Immigration Origin | # Population | % Population |
| Africa | 116 | 1.0% |
| Asia | 248 | 2.2% |
| Bosnia and Herzegovina | 7 | 0.1% |
| Brazil | 10 | 0.1% |
| Canada | 6 | 0.1% |
| Central America | 1,820 | 16.3% |
| Eastern Asia | 10 | 0.1% |
| Eastern Europe | 26 | 0.2% |
| England | 18 | 0.2% |
| Europe | 107 | 1.0% |
| Guatemala | 39 | 0.4% |
| Hungary | 7 | 0.1% |
| Italy | 46 | 0.4% |
| Korea | 10 | 0.1% |
| Laos | 42 | 0.4% |
| Latin America | 1,830 | 16.4% |
| Mexico | 1,749 | 15.6% |
| Northern Europe | 35 | 0.3% |
| Panama | 32 | 0.3% |
| Scotland | 9 | 0.1% |
| South America | 10 | 0.1% |
| South Eastern Asia | 238 | 2.1% |
| Southern Europe | 46 | 0.4% |
| Thailand | 10 | 0.1% |
| Ukraine | 12 | 0.1% |
| Vietnam | 186 | 1.7% |
| Western Africa | 116 | 1.0% | View All 27 Rows |
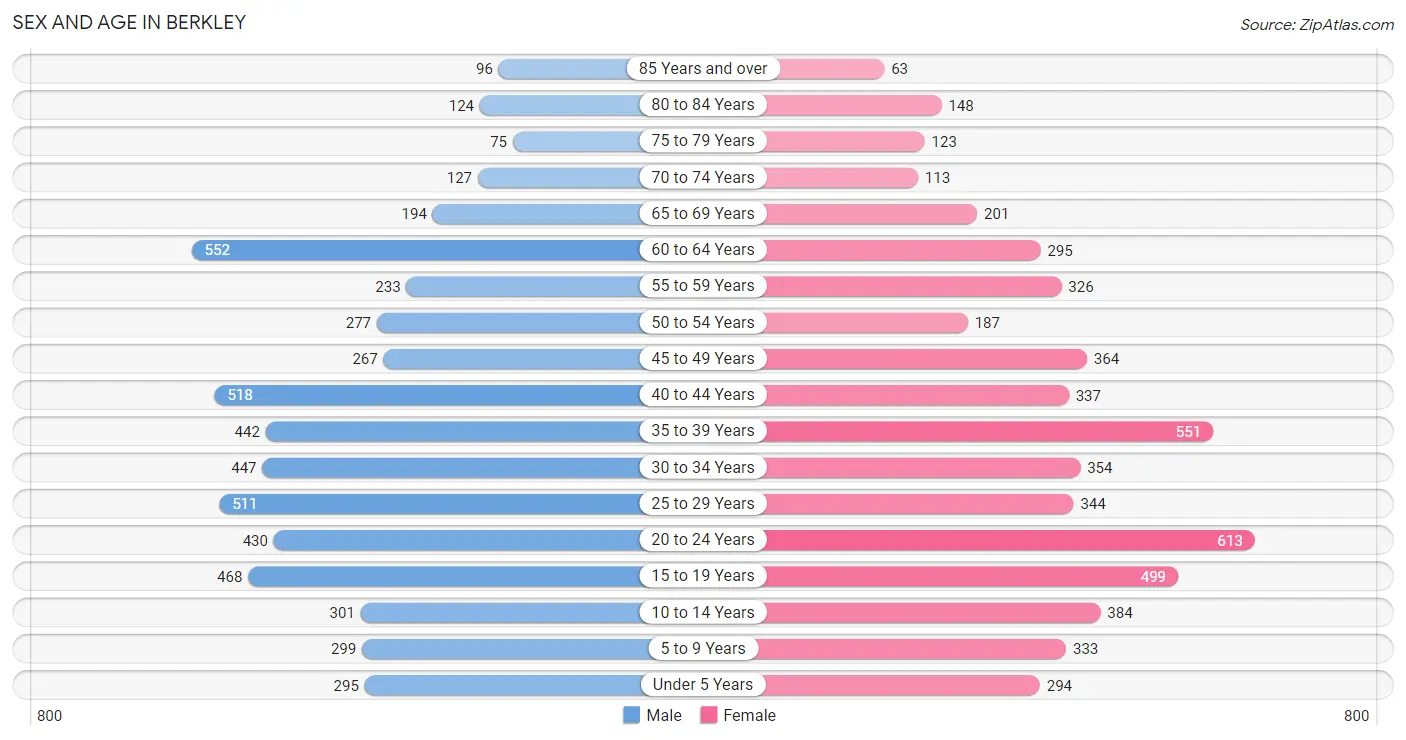
Sex and Age in Berkley
Sex and Age in Berkley
The most populous age groups in Berkley are 60 to 64 Years (552 | 9.8%) for men and 20 to 24 Years (613 | 11.1%) for women.
| Age Bracket | Male | Female |
| Under 5 Years | 295 (5.2%) | 294 (5.3%) |
| 5 to 9 Years | 299 (5.3%) | 333 (6.0%) |
| 10 to 14 Years | 301 (5.3%) | 384 (7.0%) |
| 15 to 19 Years | 468 (8.3%) | 499 (9.0%) |
| 20 to 24 Years | 430 (7.6%) | 613 (11.1%) |
| 25 to 29 Years | 511 (9.0%) | 344 (6.2%) |
| 30 to 34 Years | 447 (7.9%) | 354 (6.4%) |
| 35 to 39 Years | 442 (7.8%) | 551 (10.0%) |
| 40 to 44 Years | 518 (9.2%) | 337 (6.1%) |
| 45 to 49 Years | 267 (4.7%) | 364 (6.6%) |
| 50 to 54 Years | 277 (4.9%) | 187 (3.4%) |
| 55 to 59 Years | 233 (4.1%) | 326 (5.9%) |
| 60 to 64 Years | 552 (9.8%) | 295 (5.3%) |
| 65 to 69 Years | 194 (3.4%) | 201 (3.6%) |
| 70 to 74 Years | 127 (2.2%) | 113 (2.0%) |
| 75 to 79 Years | 75 (1.3%) | 123 (2.2%) |
| 80 to 84 Years | 124 (2.2%) | 148 (2.7%) |
| 85 Years and over | 96 (1.7%) | 63 (1.1%) |
| Total | 5,656 (100.0%) | 5,529 (100.0%) |
Families and Households in Berkley
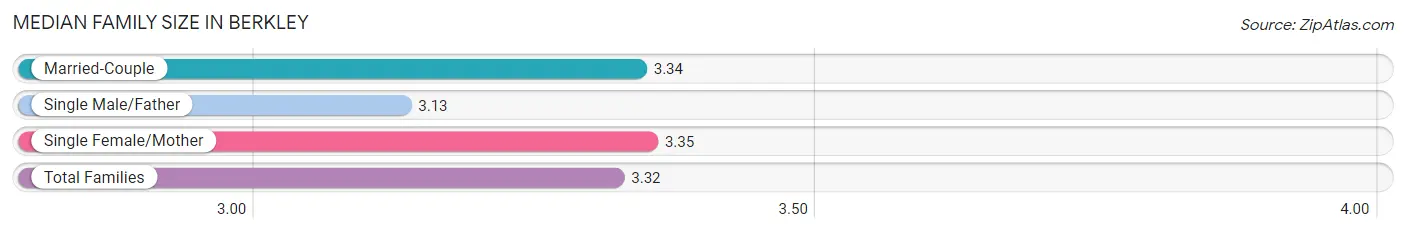
Median Family Size in Berkley
The median family size in Berkley is 3.32 persons per family, with single female/mother families (472 | 17.5%) accounting for the largest median family size of 3.35 persons per family. On the other hand, single male/father families (254 | 9.4%) represent the smallest median family size with 3.13 persons per family.
| Family Type | # Families | Family Size |
| Married-Couple | 1,964 (73.0%) | 3.34 |
| Single Male/Father | 254 (9.4%) | 3.13 |
| Single Female/Mother | 472 (17.5%) | 3.35 |
| Total Families | 2,690 (100.0%) | 3.32 |
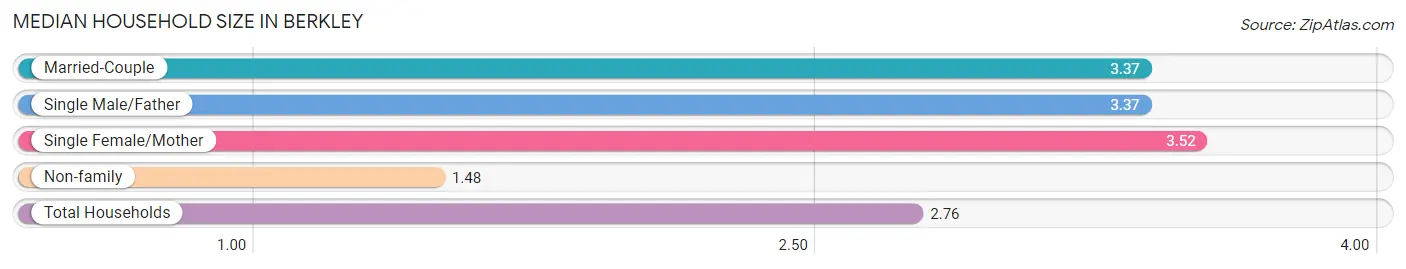
Median Household Size in Berkley
The median household size in Berkley is 2.76 persons per household, with single female/mother households (472 | 11.7%) accounting for the largest median household size of 3.52 persons per household. non-family households (1,335 | 33.2%) represent the smallest median household size with 1.48 persons per household.
| Household Type | # Households | Household Size |
| Married-Couple | 1,964 (48.8%) | 3.37 |
| Single Male/Father | 254 (6.3%) | 3.37 |
| Single Female/Mother | 472 (11.7%) | 3.52 |
| Non-family | 1,335 (33.2%) | 1.48 |
| Total Households | 4,025 (100.0%) | 2.76 |
Household Size by Marriage Status in Berkley
Out of a total of 4,025 households in Berkley, 2,690 (66.8%) are family households, while 1,335 (33.2%) are nonfamily households. The most numerous type of family households are 2-person households, comprising 915, and the most common type of nonfamily households are 1-person households, comprising 867.
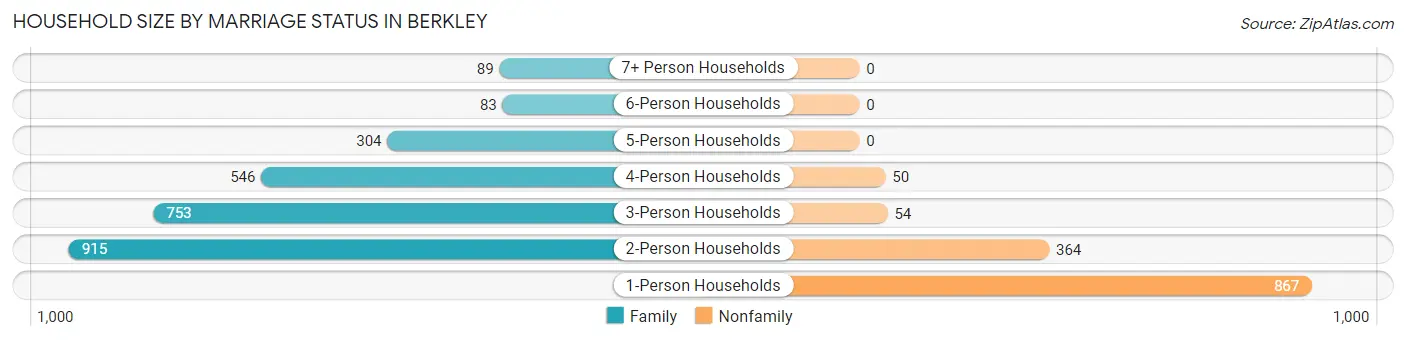
| Household Size | Family Households | Nonfamily Households |
| 1-Person Households | - | 867 (21.5%) |
| 2-Person Households | 915 (22.7%) | 364 (9.0%) |
| 3-Person Households | 753 (18.7%) | 54 (1.3%) |
| 4-Person Households | 546 (13.6%) | 50 (1.2%) |
| 5-Person Households | 304 (7.5%) | 0 (0.0%) |
| 6-Person Households | 83 (2.1%) | 0 (0.0%) |
| 7+ Person Households | 89 (2.2%) | 0 (0.0%) |
| Total | 2,690 (66.8%) | 1,335 (33.2%) |
Female Fertility in Berkley
Fertility by Age in Berkley
Average fertility rate in Berkley is 29.0 births per 1,000 women. Women in the age bracket of 20 to 34 years have the highest fertility rate with 43.0 births per 1,000 women. Women in the age bracket of 20 to 34 years acount for 64.0% of all women with births.
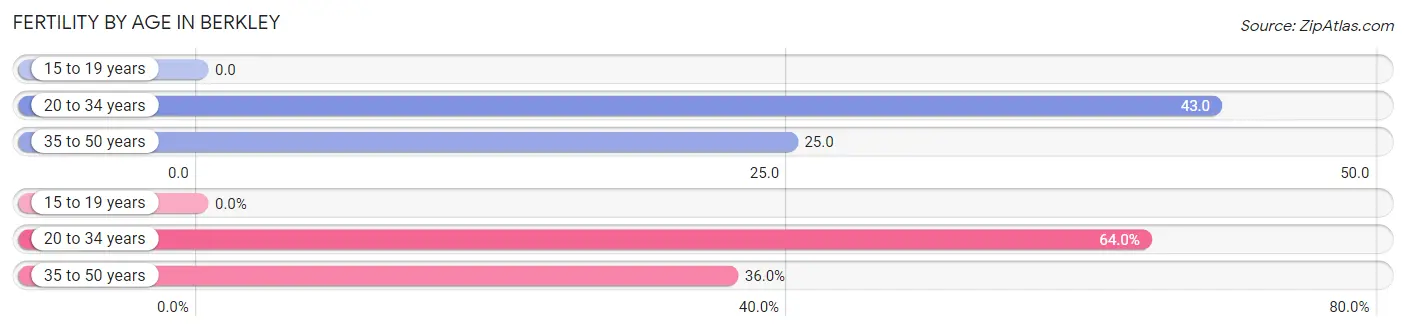
| Age Bracket | Women with Births | Births / 1,000 Women |
| 15 to 19 years | 0 (0.0%) | 0.0 |
| 20 to 34 years | 57 (64.0%) | 43.0 |
| 35 to 50 years | 32 (36.0%) | 25.0 |
| Total | 89 (100.0%) | 29.0 |
Fertility by Age by Marriage Status in Berkley
85.4% of women with births (89) in Berkley are married. The highest percentage of unmarried women with births falls into 20 to 34 years age bracket with 22.8% of them unmarried at the time of birth, while the lowest percentage of unmarried women with births belong to 35 to 50 years age bracket with 0.0% of them unmarried.
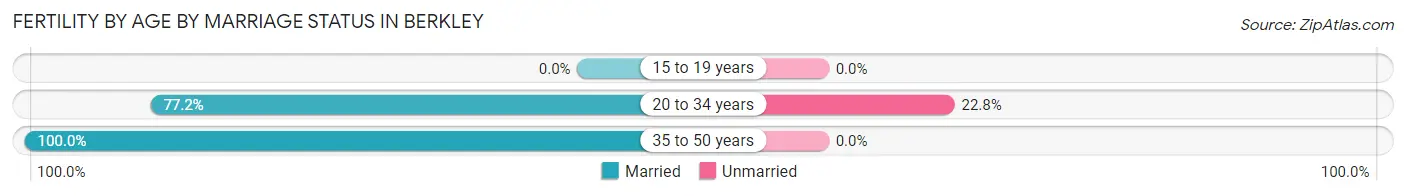
| Age Bracket | Married | Unmarried |
| 15 to 19 years | 0 (0.0%) | 0 (0.0%) |
| 20 to 34 years | 44 (77.2%) | 13 (22.8%) |
| 35 to 50 years | 32 (100.0%) | 0 (0.0%) |
| Total | 76 (85.4%) | 13 (14.6%) |
Fertility by Education in Berkley
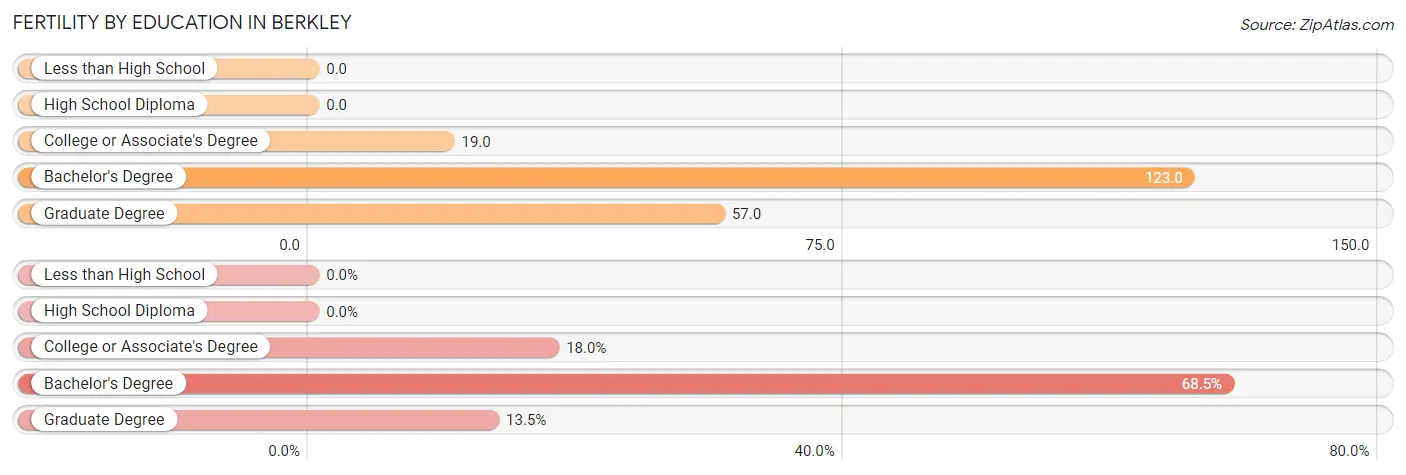
| Educational Attainment | Women with Births | Births / 1,000 Women |
| Less than High School | 0 (0.0%) | 0.0 |
| High School Diploma | 0 (0.0%) | 0.0 |
| College or Associate's Degree | 16 (18.0%) | 19.0 |
| Bachelor's Degree | 61 (68.5%) | 123.0 |
| Graduate Degree | 12 (13.5%) | 57.0 |
| Total | 89 (100.0%) | 29.0 |
Fertility by Education by Marriage Status in Berkley
14.6% of women with births in Berkley are unmarried. Women with the educational attainment of bachelor's degree are most likely to be married with 100.0% of them married at childbirth, while women with the educational attainment of college or associate's degree are least likely to be married with 81.2% of them unmarried at childbirth.
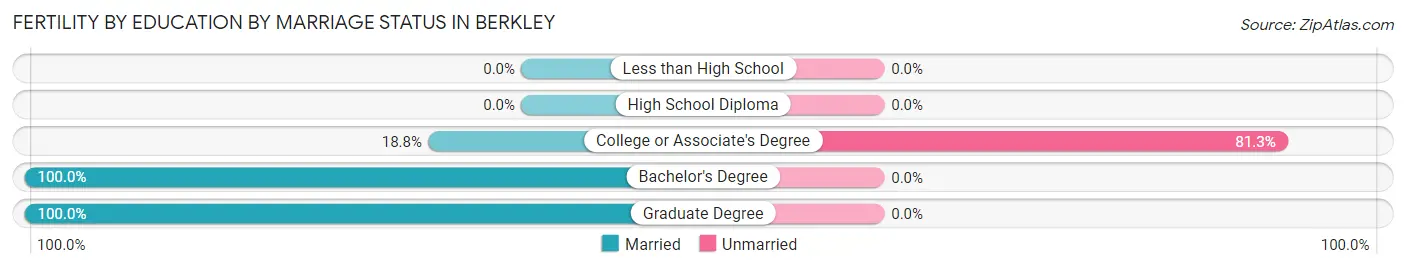
| Educational Attainment | Married | Unmarried |
| Less than High School | 0 (0.0%) | 0 (0.0%) |
| High School Diploma | 0 (0.0%) | 0 (0.0%) |
| College or Associate's Degree | 3 (18.8%) | 13 (81.2%) |
| Bachelor's Degree | 61 (100.0%) | 0 (0.0%) |
| Graduate Degree | 12 (100.0%) | 0 (0.0%) |
| Total | 76 (85.4%) | 13 (14.6%) |
Employment Characteristics in Berkley
Employment by Class of Employer in Berkley
Among the 6,068 employed individuals in Berkley, private company employees (4,309 | 71.0%), local government employees (483 | 8.0%), and not-for-profit organizations (399 | 6.6%) make up the most common classes of employment.
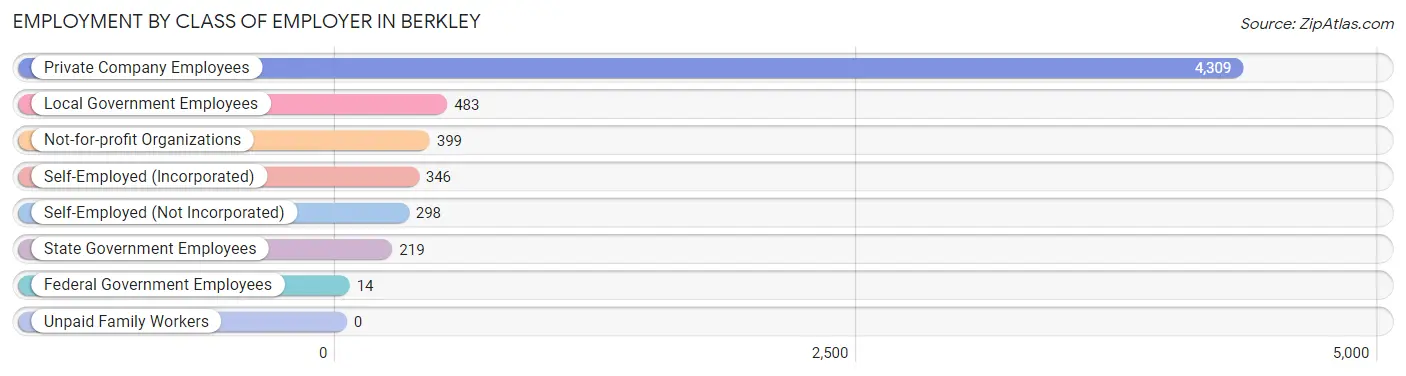
| Employer Class | # Employees | % Employees |
| Private Company Employees | 4,309 | 71.0% |
| Self-Employed (Incorporated) | 346 | 5.7% |
| Self-Employed (Not Incorporated) | 298 | 4.9% |
| Not-for-profit Organizations | 399 | 6.6% |
| Local Government Employees | 483 | 8.0% |
| State Government Employees | 219 | 3.6% |
| Federal Government Employees | 14 | 0.2% |
| Unpaid Family Workers | 0 | 0.0% |
| Total | 6,068 | 100.0% |
Employment Status by Age in Berkley
According to the labor force statistics for Berkley, out of the total population over 16 years of age (9,111), 71.5% or 6,514 individuals are in the labor force, with 6.0% or 391 of them unemployed. The age group with the highest labor force participation rate is 25 to 29 years, with 94.9% or 811 individuals in the labor force. Within the labor force, the 25 to 29 years age range has the highest percentage of unemployed individuals, with 20.0% or 162 of them being unemployed.
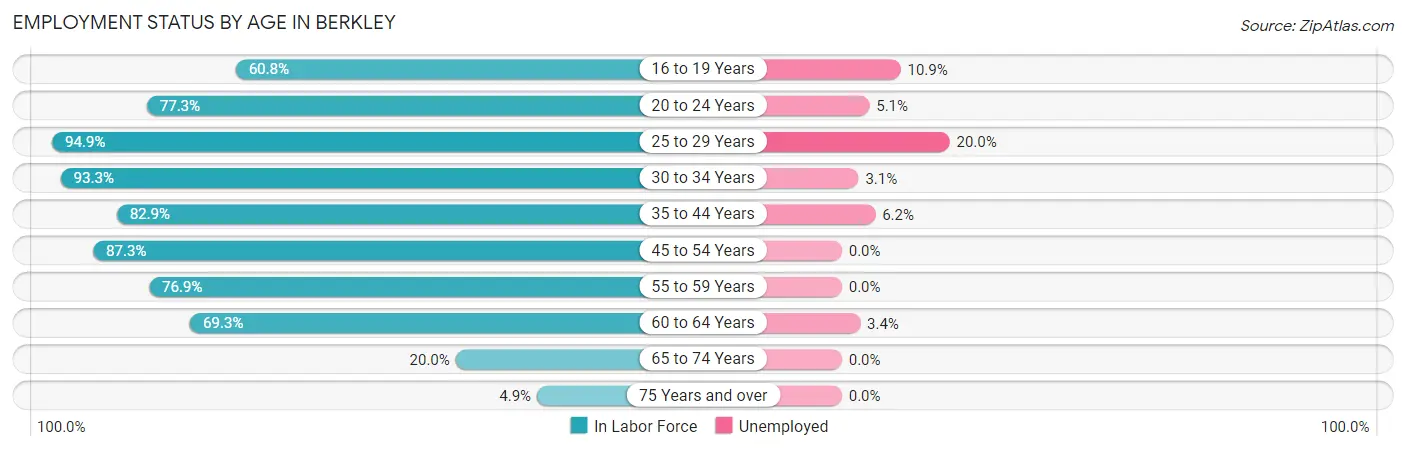
| Age Bracket | In Labor Force | Unemployed |
| 16 to 19 Years | 486 (60.8%) | 53 (10.9%) |
| 20 to 24 Years | 806 (77.3%) | 41 (5.1%) |
| 25 to 29 Years | 811 (94.9%) | 162 (20.0%) |
| 30 to 34 Years | 747 (93.3%) | 23 (3.1%) |
| 35 to 44 Years | 1,532 (82.9%) | 95 (6.2%) |
| 45 to 54 Years | 956 (87.3%) | 0 (0.0%) |
| 55 to 59 Years | 430 (76.9%) | 0 (0.0%) |
| 60 to 64 Years | 587 (69.3%) | 20 (3.4%) |
| 65 to 74 Years | 127 (20.0%) | 0 (0.0%) |
| 75 Years and over | 31 (4.9%) | 0 (0.0%) |
| Total | 6,514 (71.5%) | 391 (6.0%) |
Employment Status by Educational Attainment in Berkley
According to labor force statistics for Berkley, 84.3% of individuals (5,062) out of the total population between 25 and 64 years of age (6,005) are in the labor force, with 5.9% or 299 of them being unemployed. The group with the highest labor force participation rate are those with the educational attainment of bachelor's degree or higher, with 93.0% or 1,559 individuals in the labor force. Within the labor force, individuals with high school diploma education have the highest percentage of unemployment, with 7.6% or 108 of them being unemployed.
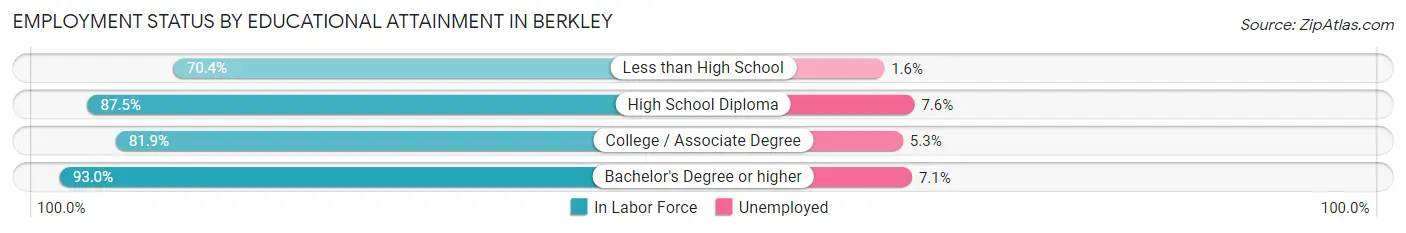
| Educational Attainment | In Labor Force | Unemployed |
| Less than High School | 807 (70.4%) | 18 (1.6%) |
| High School Diploma | 1,424 (87.5%) | 124 (7.6%) |
| College / Associate Degree | 1,273 (81.9%) | 82 (5.3%) |
| Bachelor's Degree or higher | 1,559 (93.0%) | 119 (7.1%) |
| Total | 5,062 (84.3%) | 354 (5.9%) |
Employment Occupations by Sex in Berkley
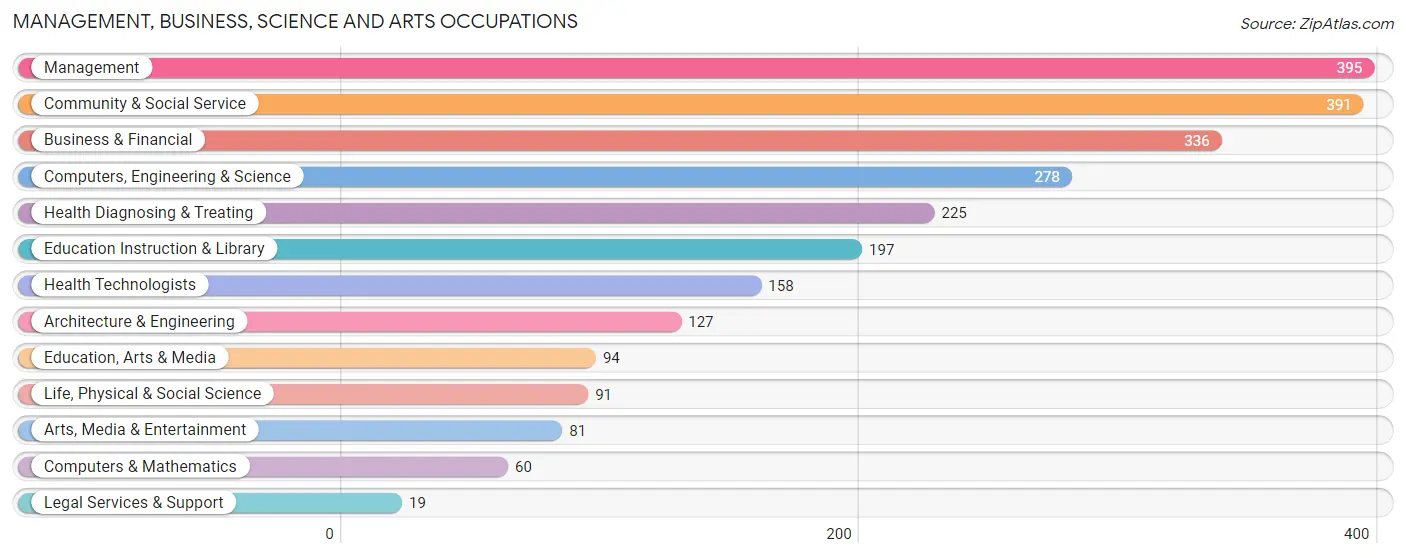
Management, Business, Science and Arts Occupations
The most common Management, Business, Science and Arts occupations in Berkley are Management (395 | 6.5%), Community & Social Service (391 | 6.4%), Business & Financial (336 | 5.5%), Computers, Engineering & Science (278 | 4.5%), and Health Diagnosing & Treating (225 | 3.7%).
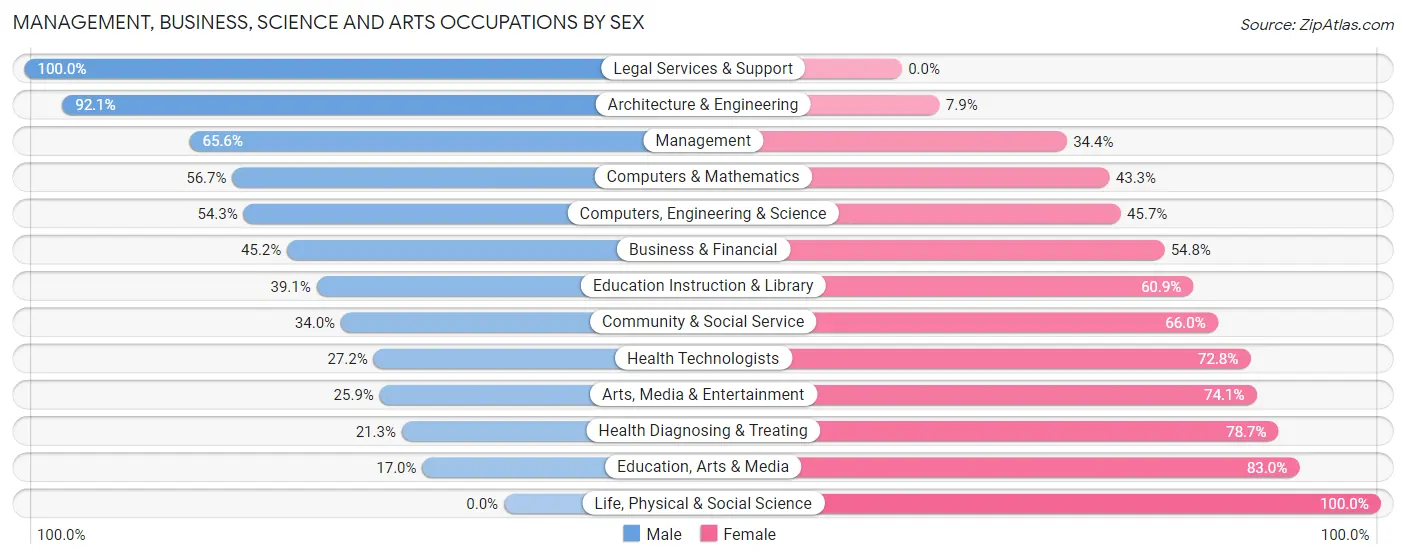
Management, Business, Science and Arts Occupations by Sex
Within the Management, Business, Science and Arts occupations in Berkley, the most male-oriented occupations are Legal Services & Support (100.0%), Architecture & Engineering (92.1%), and Management (65.6%), while the most female-oriented occupations are Life, Physical & Social Science (100.0%), Education, Arts & Media (83.0%), and Health Diagnosing & Treating (78.7%).
| Occupation | Male | Female |
| Management | 259 (65.6%) | 136 (34.4%) |
| Business & Financial | 152 (45.2%) | 184 (54.8%) |
| Computers, Engineering & Science | 151 (54.3%) | 127 (45.7%) |
| Computers & Mathematics | 34 (56.7%) | 26 (43.3%) |
| Architecture & Engineering | 117 (92.1%) | 10 (7.9%) |
| Life, Physical & Social Science | 0 (0.0%) | 91 (100.0%) |
| Community & Social Service | 133 (34.0%) | 258 (66.0%) |
| Education, Arts & Media | 16 (17.0%) | 78 (83.0%) |
| Legal Services & Support | 19 (100.0%) | 0 (0.0%) |
| Education Instruction & Library | 77 (39.1%) | 120 (60.9%) |
| Arts, Media & Entertainment | 21 (25.9%) | 60 (74.1%) |
| Health Diagnosing & Treating | 48 (21.3%) | 177 (78.7%) |
| Health Technologists | 43 (27.2%) | 115 (72.8%) |
| Total (Category) | 743 (45.7%) | 882 (54.3%) |
| Total (Overall) | 3,240 (52.9%) | 2,879 (47.0%) |
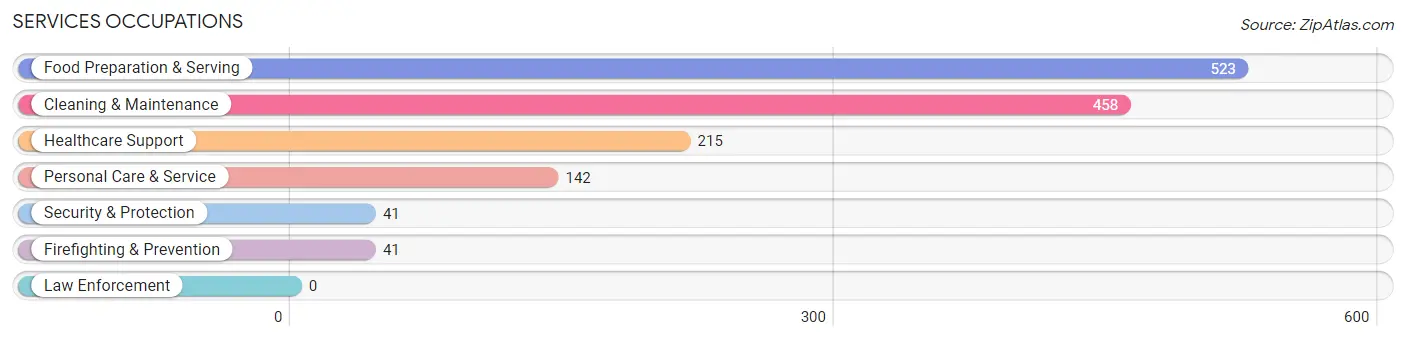
Services Occupations
The most common Services occupations in Berkley are Food Preparation & Serving (523 | 8.6%), Cleaning & Maintenance (458 | 7.5%), Healthcare Support (215 | 3.5%), Personal Care & Service (142 | 2.3%), and Security & Protection (41 | 0.7%).
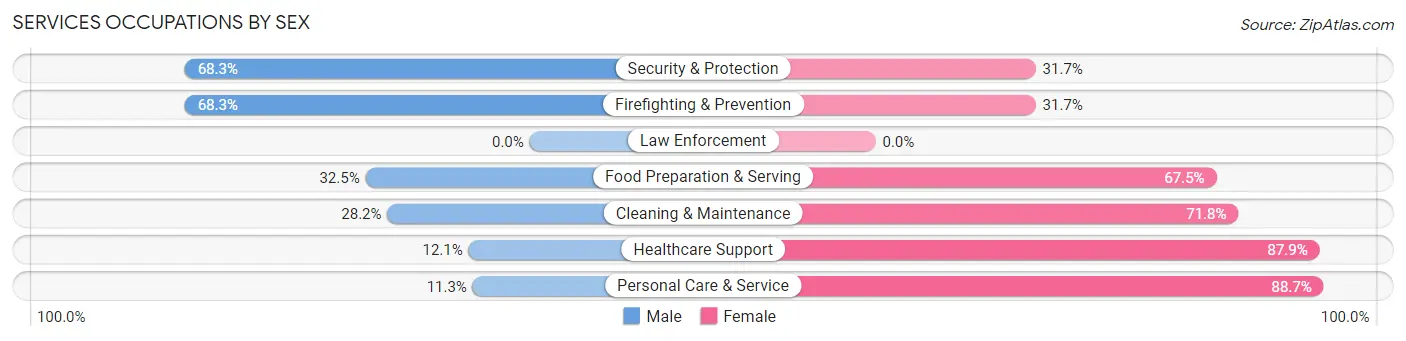
Services Occupations by Sex
Within the Services occupations in Berkley, the most male-oriented occupations are Security & Protection (68.3%), Firefighting & Prevention (68.3%), and Food Preparation & Serving (32.5%), while the most female-oriented occupations are Personal Care & Service (88.7%), Healthcare Support (87.9%), and Cleaning & Maintenance (71.8%).
| Occupation | Male | Female |
| Healthcare Support | 26 (12.1%) | 189 (87.9%) |
| Security & Protection | 28 (68.3%) | 13 (31.7%) |
| Firefighting & Prevention | 28 (68.3%) | 13 (31.7%) |
| Law Enforcement | 0 (0.0%) | 0 (0.0%) |
| Food Preparation & Serving | 170 (32.5%) | 353 (67.5%) |
| Cleaning & Maintenance | 129 (28.2%) | 329 (71.8%) |
| Personal Care & Service | 16 (11.3%) | 126 (88.7%) |
| Total (Category) | 369 (26.8%) | 1,010 (73.2%) |
| Total (Overall) | 3,240 (52.9%) | 2,879 (47.0%) |
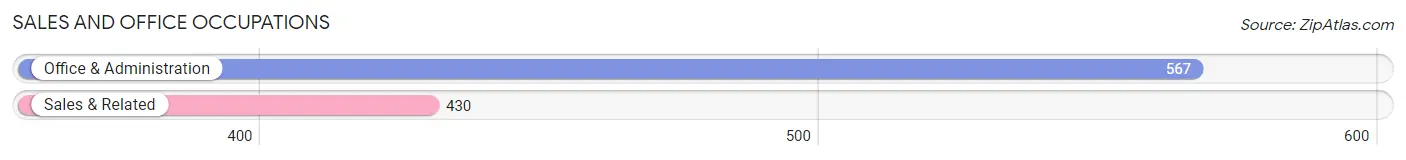
Sales and Office Occupations
The most common Sales and Office occupations in Berkley are Office & Administration (567 | 9.3%), and Sales & Related (430 | 7.0%).
Sales and Office Occupations by Sex
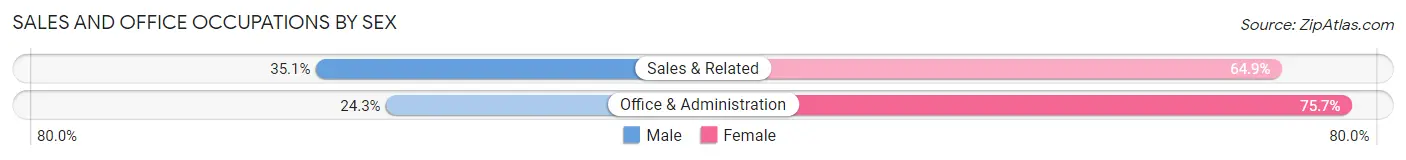
| Occupation | Male | Female |
| Sales & Related | 151 (35.1%) | 279 (64.9%) |
| Office & Administration | 138 (24.3%) | 429 (75.7%) |
| Total (Category) | 289 (29.0%) | 708 (71.0%) |
| Total (Overall) | 3,240 (52.9%) | 2,879 (47.0%) |
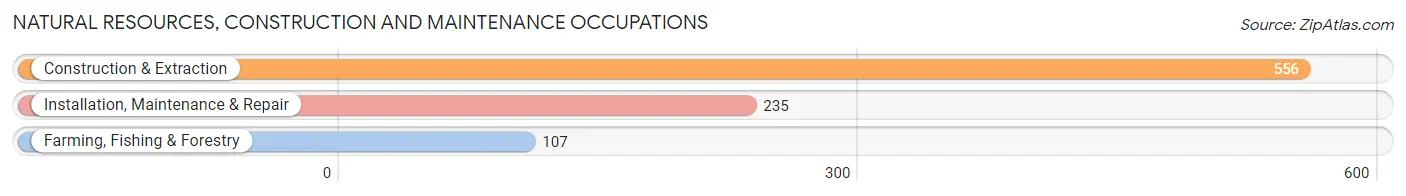
Natural Resources, Construction and Maintenance Occupations
The most common Natural Resources, Construction and Maintenance occupations in Berkley are Construction & Extraction (556 | 9.1%), Installation, Maintenance & Repair (235 | 3.8%), and Farming, Fishing & Forestry (107 | 1.8%).
Natural Resources, Construction and Maintenance Occupations by Sex
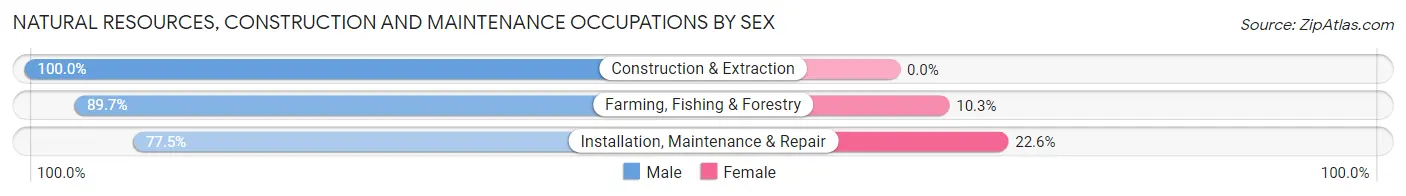
| Occupation | Male | Female |
| Farming, Fishing & Forestry | 96 (89.7%) | 11 (10.3%) |
| Construction & Extraction | 556 (100.0%) | 0 (0.0%) |
| Installation, Maintenance & Repair | 182 (77.4%) | 53 (22.6%) |
| Total (Category) | 834 (92.9%) | 64 (7.1%) |
| Total (Overall) | 3,240 (52.9%) | 2,879 (47.0%) |
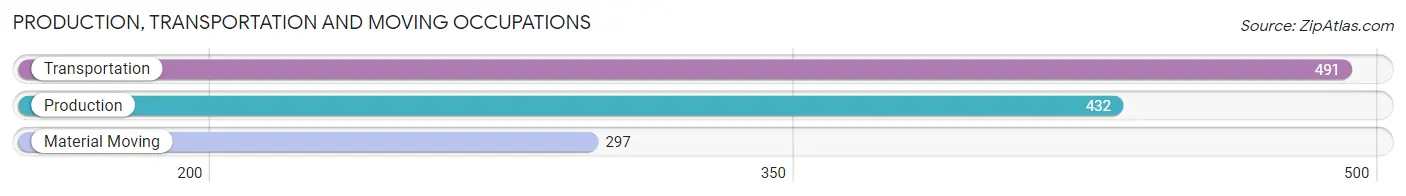
Production, Transportation and Moving Occupations
The most common Production, Transportation and Moving occupations in Berkley are Transportation (491 | 8.0%), Production (432 | 7.1%), and Material Moving (297 | 4.9%).
Production, Transportation and Moving Occupations by Sex
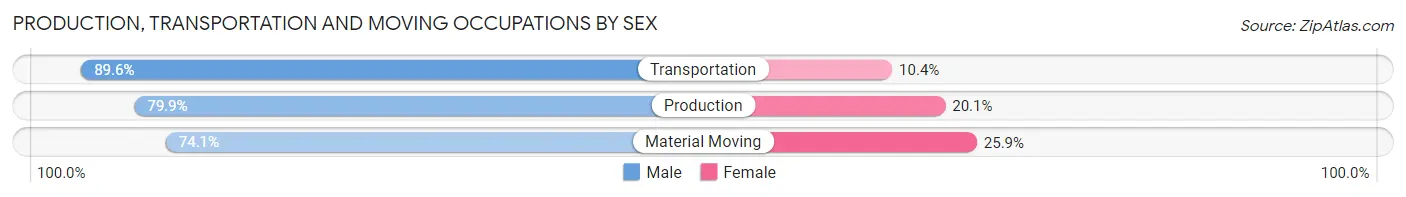
| Occupation | Male | Female |
| Production | 345 (79.9%) | 87 (20.1%) |
| Transportation | 440 (89.6%) | 51 (10.4%) |
| Material Moving | 220 (74.1%) | 77 (25.9%) |
| Total (Category) | 1,005 (82.4%) | 215 (17.6%) |
| Total (Overall) | 3,240 (52.9%) | 2,879 (47.0%) |
Employment Industries by Sex in Berkley
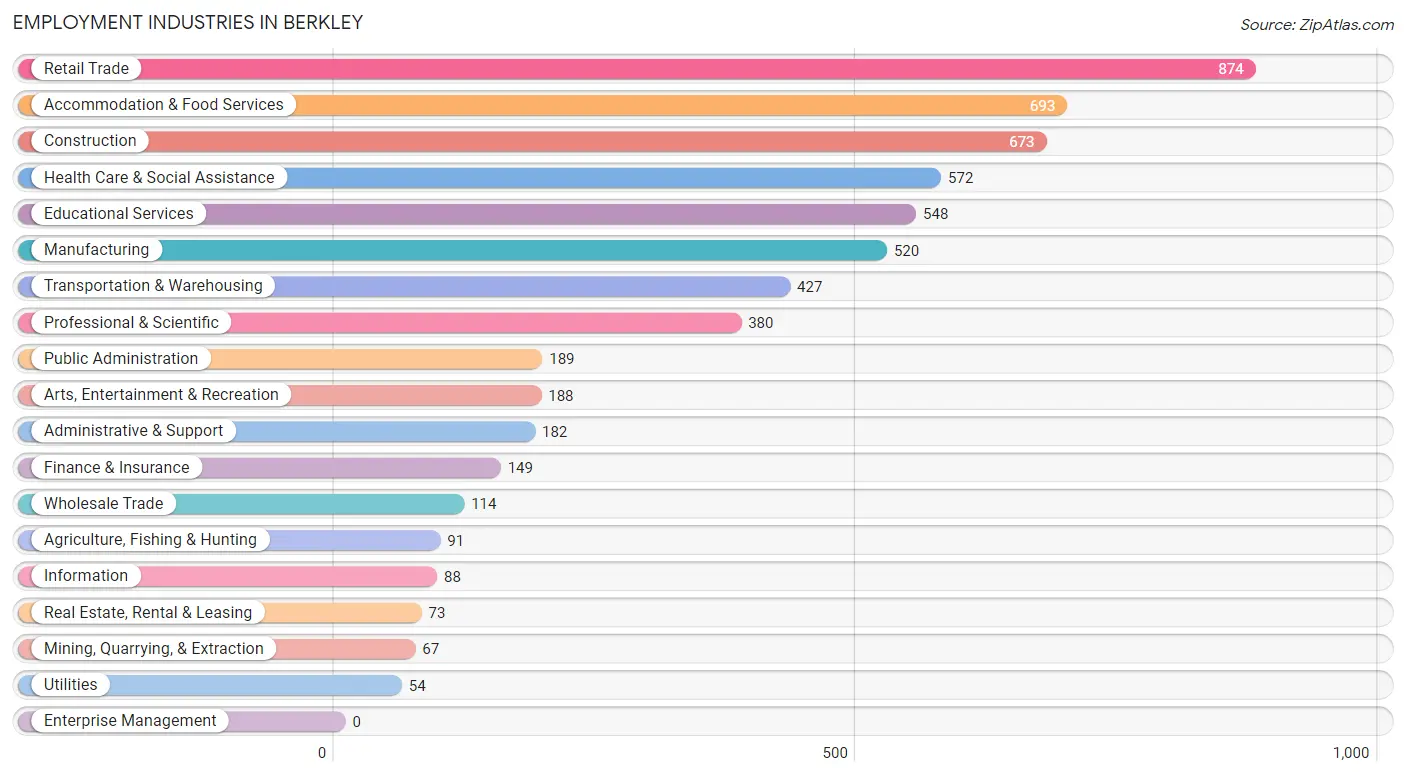
Employment Industries in Berkley
The major employment industries in Berkley include Retail Trade (874 | 14.3%), Accommodation & Food Services (693 | 11.3%), Construction (673 | 11.0%), Health Care & Social Assistance (572 | 9.3%), and Educational Services (548 | 9.0%).
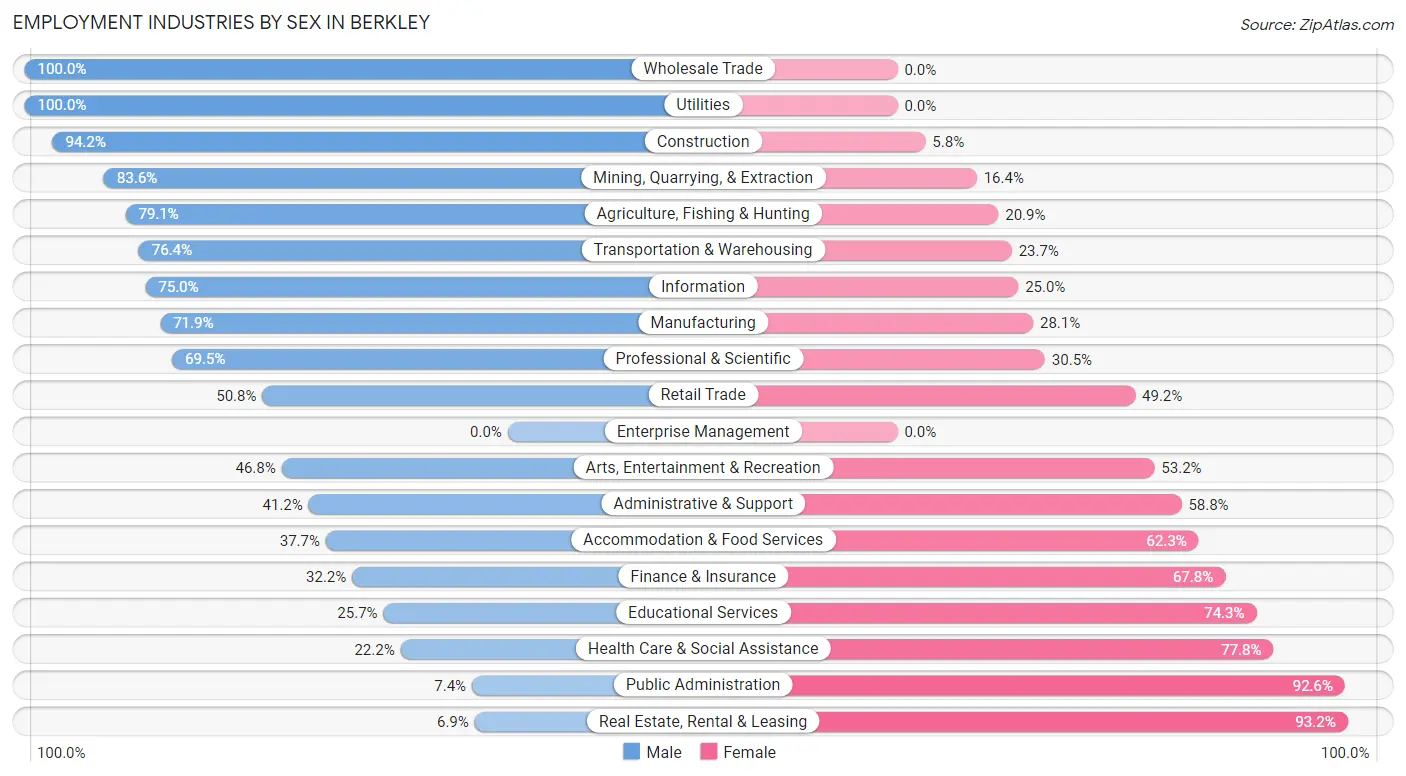
Employment Industries by Sex in Berkley
The Berkley industries that see more men than women are Wholesale Trade (100.0%), Utilities (100.0%), and Construction (94.2%), whereas the industries that tend to have a higher number of women are Real Estate, Rental & Leasing (93.1%), Public Administration (92.6%), and Health Care & Social Assistance (77.8%).
| Industry | Male | Female |
| Agriculture, Fishing & Hunting | 72 (79.1%) | 19 (20.9%) |
| Mining, Quarrying, & Extraction | 56 (83.6%) | 11 (16.4%) |
| Construction | 634 (94.2%) | 39 (5.8%) |
| Manufacturing | 374 (71.9%) | 146 (28.1%) |
| Wholesale Trade | 114 (100.0%) | 0 (0.0%) |
| Retail Trade | 444 (50.8%) | 430 (49.2%) |
| Transportation & Warehousing | 326 (76.3%) | 101 (23.6%) |
| Utilities | 54 (100.0%) | 0 (0.0%) |
| Information | 66 (75.0%) | 22 (25.0%) |
| Finance & Insurance | 48 (32.2%) | 101 (67.8%) |
| Real Estate, Rental & Leasing | 5 (6.9%) | 68 (93.1%) |
| Professional & Scientific | 264 (69.5%) | 116 (30.5%) |
| Enterprise Management | 0 (0.0%) | 0 (0.0%) |
| Administrative & Support | 75 (41.2%) | 107 (58.8%) |
| Educational Services | 141 (25.7%) | 407 (74.3%) |
| Health Care & Social Assistance | 127 (22.2%) | 445 (77.8%) |
| Arts, Entertainment & Recreation | 88 (46.8%) | 100 (53.2%) |
| Accommodation & Food Services | 261 (37.7%) | 432 (62.3%) |
| Public Administration | 14 (7.4%) | 175 (92.6%) |
| Total | 3,240 (52.9%) | 2,879 (47.0%) |
Education in Berkley
School Enrollment in Berkley
The most common levels of schooling among the 2,667 students in Berkley are high school (763 | 28.6%), college / undergraduate (556 | 20.8%), and middle school (537 | 20.1%).
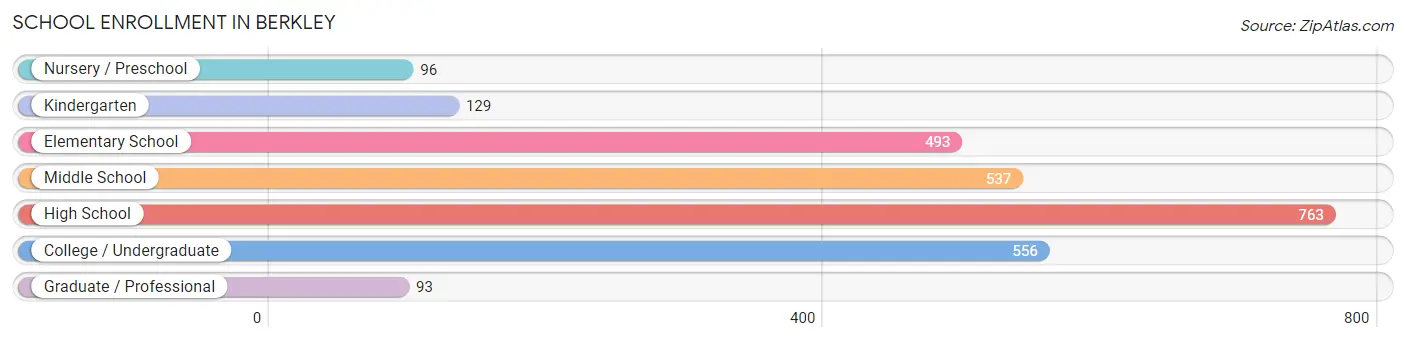
| School Level | # Students | % Students |
| Nursery / Preschool | 96 | 3.6% |
| Kindergarten | 129 | 4.8% |
| Elementary School | 493 | 18.5% |
| Middle School | 537 | 20.1% |
| High School | 763 | 28.6% |
| College / Undergraduate | 556 | 20.8% |
| Graduate / Professional | 93 | 3.5% |
| Total | 2,667 | 100.0% |
School Enrollment by Age by Funding Source in Berkley
Out of a total of 2,667 students who are enrolled in schools in Berkley, 411 (15.4%) attend a private institution, while the remaining 2,256 (84.6%) are enrolled in public schools. The age group of 35 years and over has the highest likelihood of being enrolled in private schools, with 57 (41.6% in the age bracket) enrolled. Conversely, the age group of 18 to 19 year olds has the lowest likelihood of being enrolled in a private school, with 348 (98.3% in the age bracket) attending a public institution.
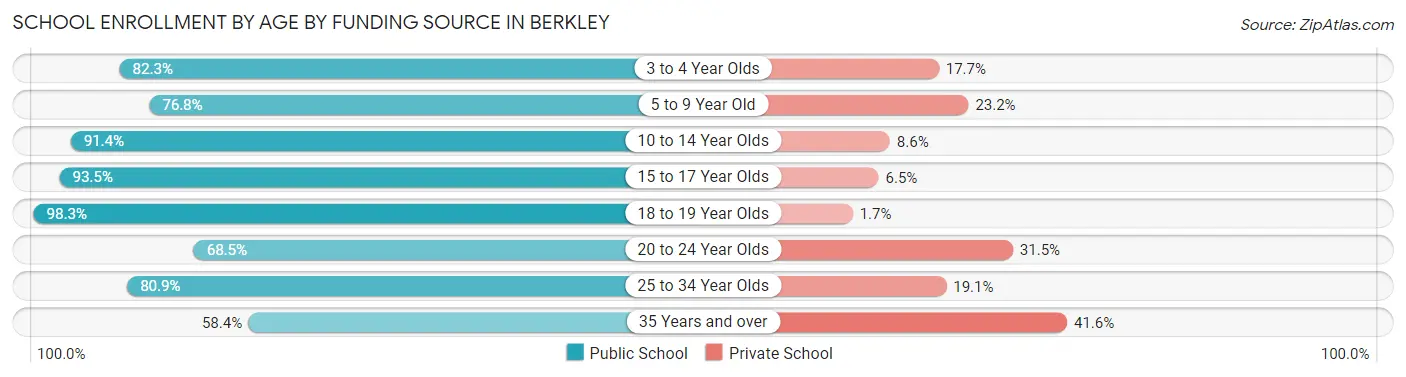
| Age Bracket | Public School | Private School |
| 3 to 4 Year Olds | 79 (82.3%) | 17 (17.7%) |
| 5 to 9 Year Old | 436 (76.8%) | 132 (23.2%) |
| 10 to 14 Year Olds | 626 (91.4%) | 59 (8.6%) |
| 15 to 17 Year Olds | 388 (93.5%) | 27 (6.5%) |
| 18 to 19 Year Olds | 348 (98.3%) | 6 (1.7%) |
| 20 to 24 Year Olds | 189 (68.5%) | 87 (31.5%) |
| 25 to 34 Year Olds | 110 (80.9%) | 26 (19.1%) |
| 35 Years and over | 80 (58.4%) | 57 (41.6%) |
| Total | 2,256 (84.6%) | 411 (15.4%) |
Educational Attainment by Field of Study in Berkley
Business (490 | 24.4%), science & technology (223 | 11.1%), arts & humanities (216 | 10.8%), bio, nature & agricultural (145 | 7.2%), and visual & performing arts (144 | 7.2%) are the most common fields of study among 2,006 individuals in Berkley who have obtained a bachelor's degree or higher.
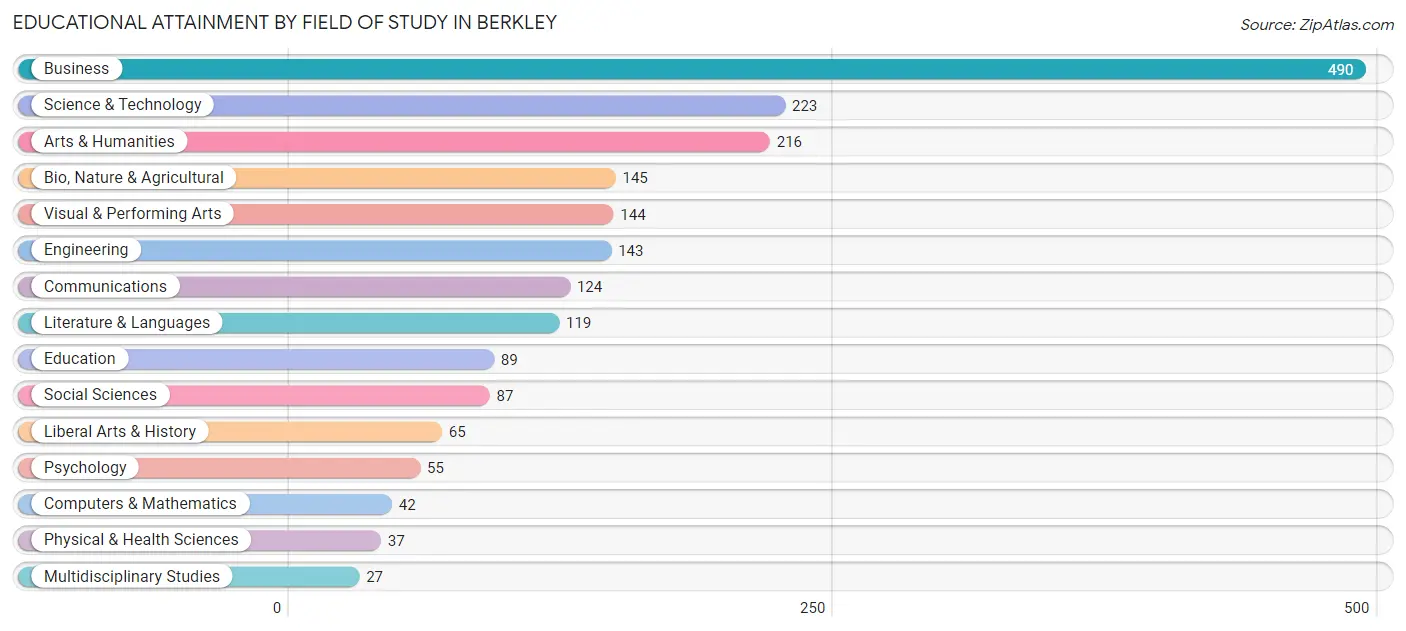
| Field of Study | # Graduates | % Graduates |
| Computers & Mathematics | 42 | 2.1% |
| Bio, Nature & Agricultural | 145 | 7.2% |
| Physical & Health Sciences | 37 | 1.8% |
| Psychology | 55 | 2.7% |
| Social Sciences | 87 | 4.3% |
| Engineering | 143 | 7.1% |
| Multidisciplinary Studies | 27 | 1.3% |
| Science & Technology | 223 | 11.1% |
| Business | 490 | 24.4% |
| Education | 89 | 4.4% |
| Literature & Languages | 119 | 5.9% |
| Liberal Arts & History | 65 | 3.2% |
| Visual & Performing Arts | 144 | 7.2% |
| Communications | 124 | 6.2% |
| Arts & Humanities | 216 | 10.8% |
| Total | 2,006 | 100.0% |
Transportation & Commute in Berkley
Vehicle Availability by Sex in Berkley
The most prevalent vehicle ownership categories in Berkley are males with 3 vehicles (1,241, accounting for 39.0%) and females with 3 vehicles (918, making up 43.2%).
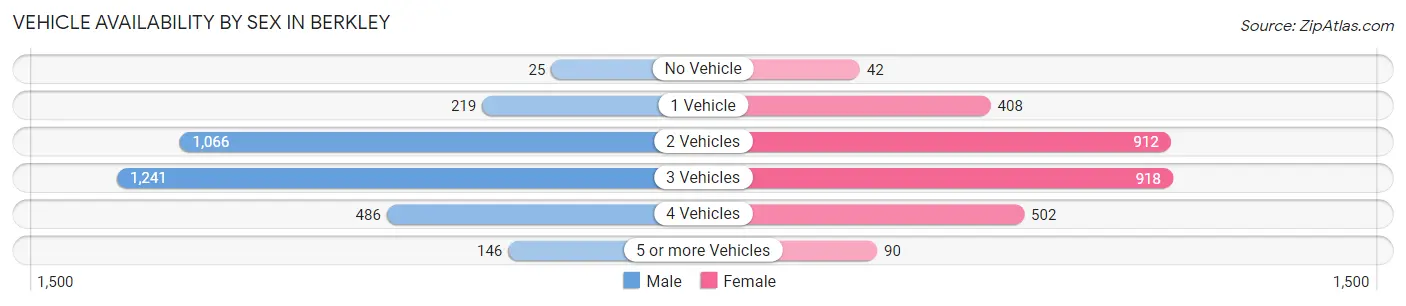
| Vehicles Available | Male | Female |
| No Vehicle | 25 (0.8%) | 42 (1.5%) |
| 1 Vehicle | 219 (6.9%) | 408 (14.2%) |
| 2 Vehicles | 1,066 (33.5%) | 912 (31.8%) |
| 3 Vehicles | 1,241 (39.0%) | 918 (32.0%) |
| 4 Vehicles | 486 (15.3%) | 502 (17.5%) |
| 5 or more Vehicles | 146 (4.6%) | 90 (3.1%) |
| Total | 3,183 (100.0%) | 2,872 (100.0%) |
Commute Time in Berkley
The most frequently occuring commute durations in Berkley are 15 to 19 minutes (1,124 commuters, 20.2%), 20 to 24 minutes (1,093 commuters, 19.7%), and 30 to 34 minutes (996 commuters, 17.9%).
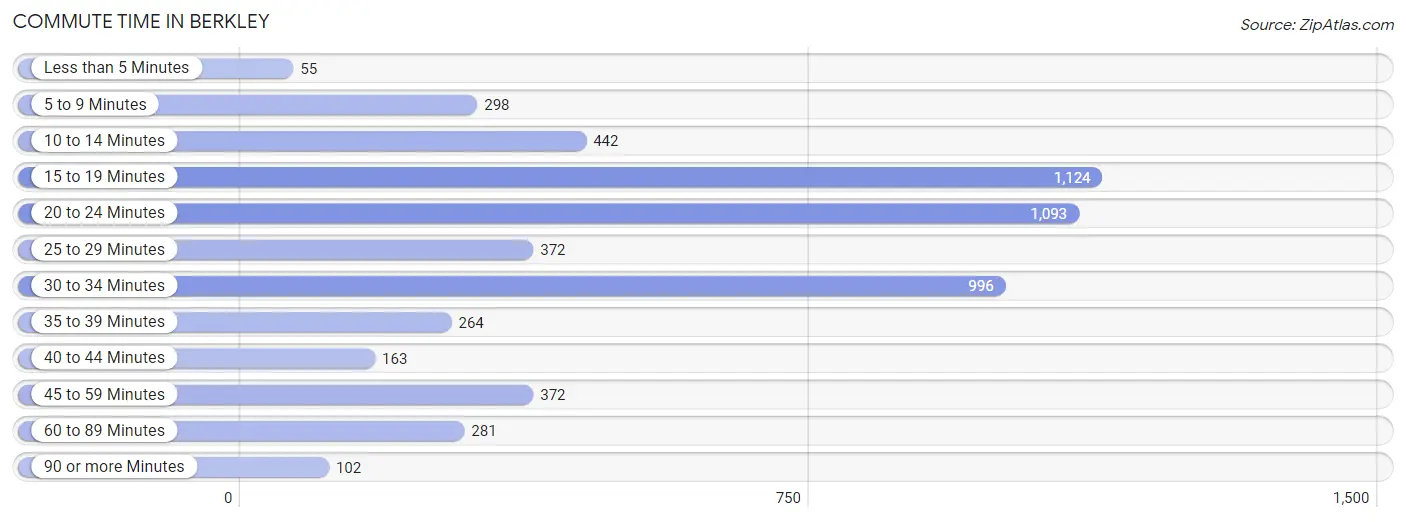
| Commute Time | # Commuters | % Commuters |
| Less than 5 Minutes | 55 | 1.0% |
| 5 to 9 Minutes | 298 | 5.4% |
| 10 to 14 Minutes | 442 | 8.0% |
| 15 to 19 Minutes | 1,124 | 20.2% |
| 20 to 24 Minutes | 1,093 | 19.7% |
| 25 to 29 Minutes | 372 | 6.7% |
| 30 to 34 Minutes | 996 | 17.9% |
| 35 to 39 Minutes | 264 | 4.8% |
| 40 to 44 Minutes | 163 | 2.9% |
| 45 to 59 Minutes | 372 | 6.7% |
| 60 to 89 Minutes | 281 | 5.1% |
| 90 or more Minutes | 102 | 1.8% |
Commute Time by Sex in Berkley
The most common commute times in Berkley are 15 to 19 minutes (589 commuters, 20.2%) for males and 20 to 24 minutes (708 commuters, 26.8%) for females.
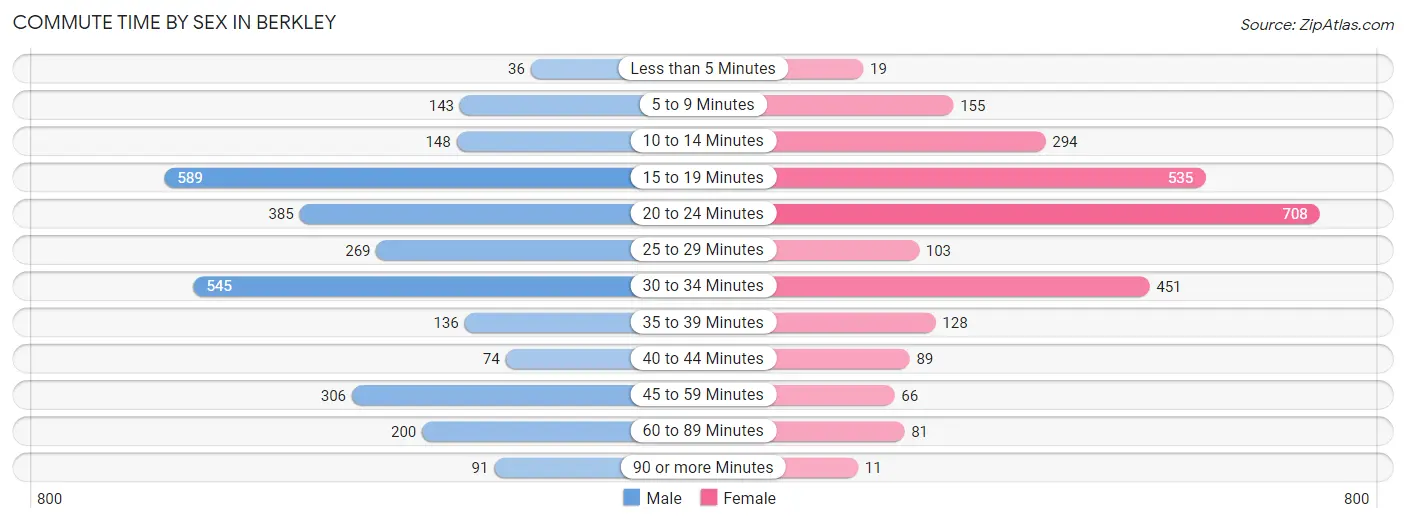
| Commute Time | Male | Female |
| Less than 5 Minutes | 36 (1.2%) | 19 (0.7%) |
| 5 to 9 Minutes | 143 (4.9%) | 155 (5.9%) |
| 10 to 14 Minutes | 148 (5.1%) | 294 (11.1%) |
| 15 to 19 Minutes | 589 (20.2%) | 535 (20.3%) |
| 20 to 24 Minutes | 385 (13.2%) | 708 (26.8%) |
| 25 to 29 Minutes | 269 (9.2%) | 103 (3.9%) |
| 30 to 34 Minutes | 545 (18.6%) | 451 (17.1%) |
| 35 to 39 Minutes | 136 (4.6%) | 128 (4.9%) |
| 40 to 44 Minutes | 74 (2.5%) | 89 (3.4%) |
| 45 to 59 Minutes | 306 (10.5%) | 66 (2.5%) |
| 60 to 89 Minutes | 200 (6.8%) | 81 (3.1%) |
| 90 or more Minutes | 91 (3.1%) | 11 (0.4%) |
Time of Departure to Work by Sex in Berkley
The most frequent times of departure to work in Berkley are 6:00 AM to 6:29 AM (470, 16.1%) for males and 9:00 AM to 9:59 AM (401, 15.2%) for females.
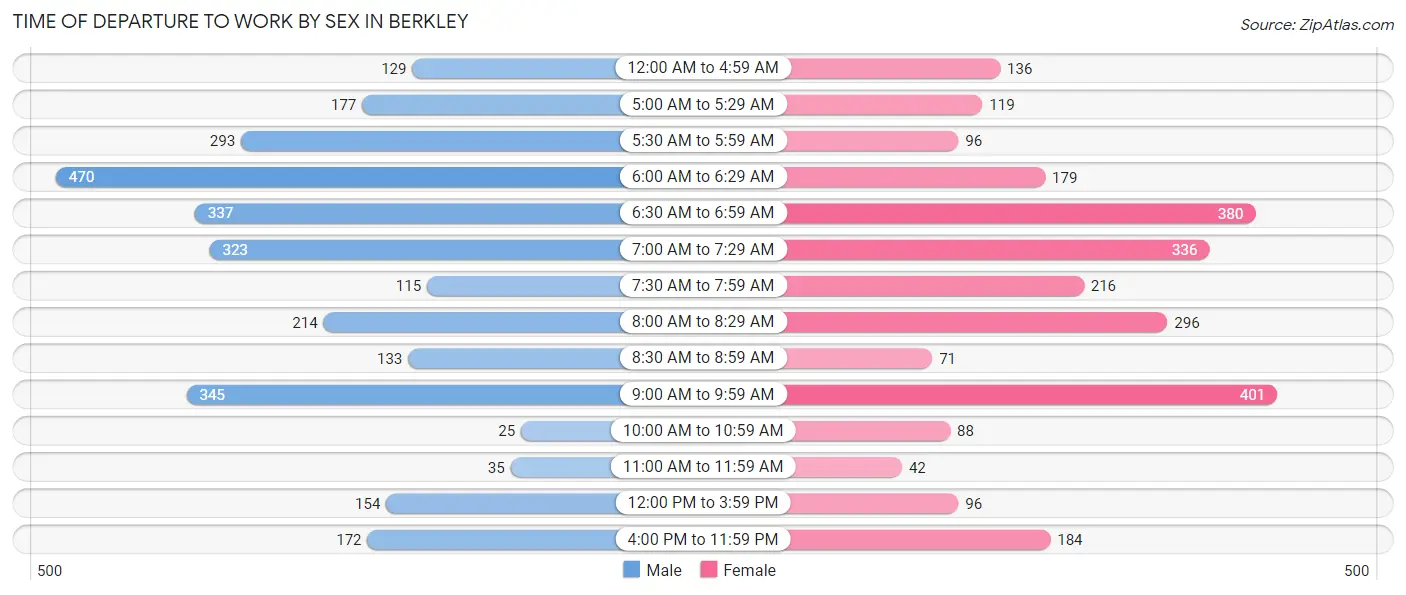
| Time of Departure | Male | Female |
| 12:00 AM to 4:59 AM | 129 (4.4%) | 136 (5.1%) |
| 5:00 AM to 5:29 AM | 177 (6.1%) | 119 (4.5%) |
| 5:30 AM to 5:59 AM | 293 (10.0%) | 96 (3.6%) |
| 6:00 AM to 6:29 AM | 470 (16.1%) | 179 (6.8%) |
| 6:30 AM to 6:59 AM | 337 (11.5%) | 380 (14.4%) |
| 7:00 AM to 7:29 AM | 323 (11.1%) | 336 (12.7%) |
| 7:30 AM to 7:59 AM | 115 (3.9%) | 216 (8.2%) |
| 8:00 AM to 8:29 AM | 214 (7.3%) | 296 (11.2%) |
| 8:30 AM to 8:59 AM | 133 (4.5%) | 71 (2.7%) |
| 9:00 AM to 9:59 AM | 345 (11.8%) | 401 (15.2%) |
| 10:00 AM to 10:59 AM | 25 (0.9%) | 88 (3.3%) |
| 11:00 AM to 11:59 AM | 35 (1.2%) | 42 (1.6%) |
| 12:00 PM to 3:59 PM | 154 (5.3%) | 96 (3.6%) |
| 4:00 PM to 11:59 PM | 172 (5.9%) | 184 (7.0%) |
| Total | 2,922 (100.0%) | 2,640 (100.0%) |
Housing Occupancy in Berkley
Occupancy by Ownership in Berkley
Of the total 4,025 dwellings in Berkley, owner-occupied units account for 2,734 (67.9%), while renter-occupied units make up 1,291 (32.1%).
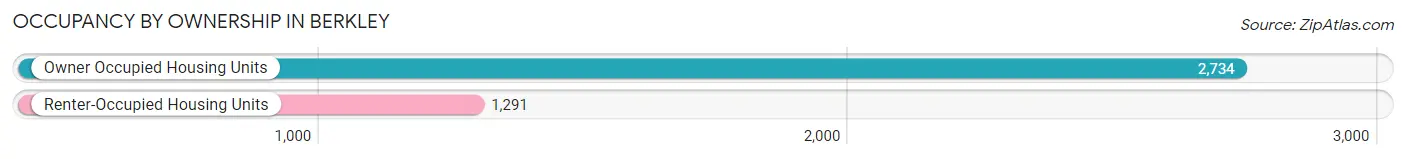
| Occupancy | # Housing Units | % Housing Units |
| Owner Occupied Housing Units | 2,734 | 67.9% |
| Renter-Occupied Housing Units | 1,291 | 32.1% |
| Total Occupied Housing Units | 4,025 | 100.0% |
Occupancy by Household Size in Berkley
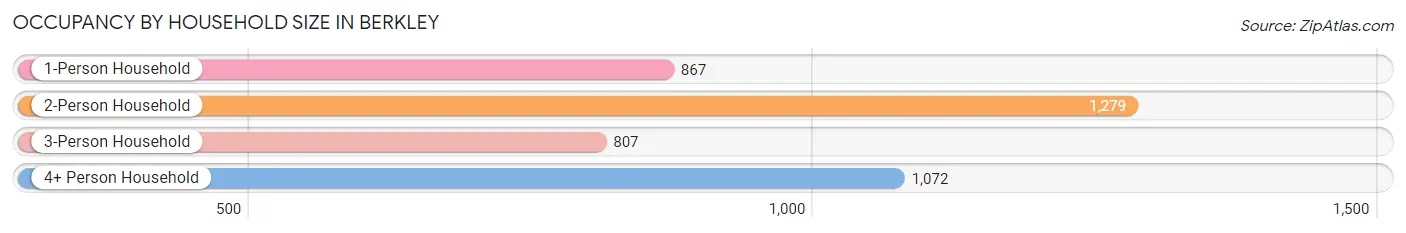
| Household Size | # Housing Units | % Housing Units |
| 1-Person Household | 867 | 21.5% |
| 2-Person Household | 1,279 | 31.8% |
| 3-Person Household | 807 | 20.1% |
| 4+ Person Household | 1,072 | 26.6% |
| Total Housing Units | 4,025 | 100.0% |
Occupancy by Ownership by Household Size in Berkley
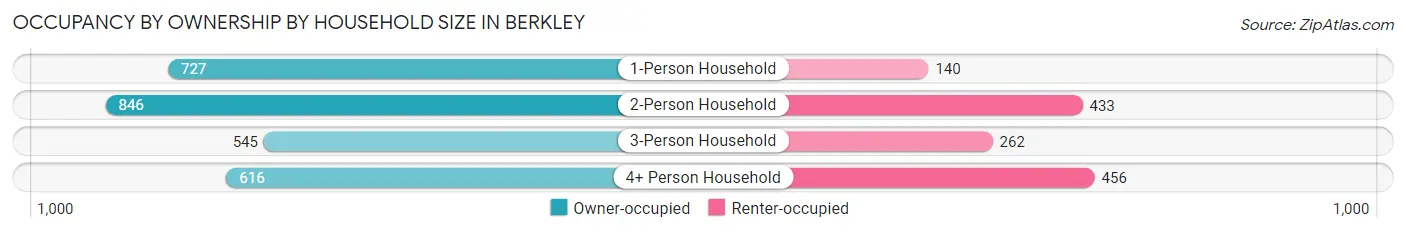
| Household Size | Owner-occupied | Renter-occupied |
| 1-Person Household | 727 (83.9%) | 140 (16.2%) |
| 2-Person Household | 846 (66.1%) | 433 (33.9%) |
| 3-Person Household | 545 (67.5%) | 262 (32.5%) |
| 4+ Person Household | 616 (57.5%) | 456 (42.5%) |
| Total Housing Units | 2,734 (67.9%) | 1,291 (32.1%) |
Occupancy by Educational Attainment in Berkley
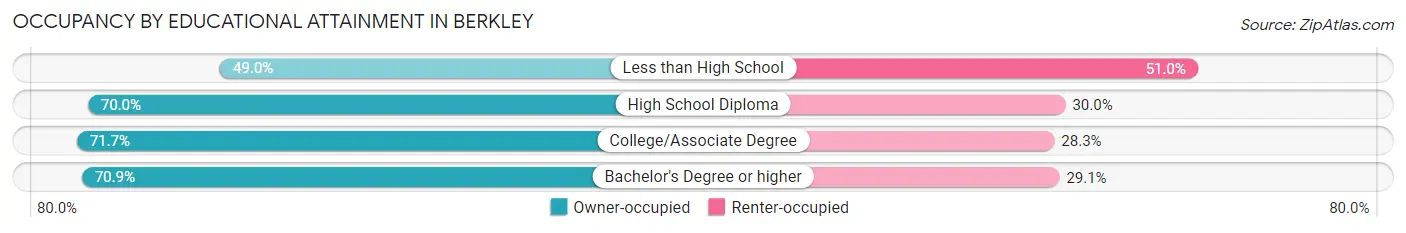
| Household Size | Owner-occupied | Renter-occupied |
| Less than High School | 272 (49.0%) | 283 (51.0%) |
| High School Diploma | 720 (70.0%) | 309 (30.0%) |
| College/Associate Degree | 954 (71.7%) | 376 (28.3%) |
| Bachelor's Degree or higher | 788 (70.9%) | 323 (29.1%) |
Occupancy by Age of Householder in Berkley
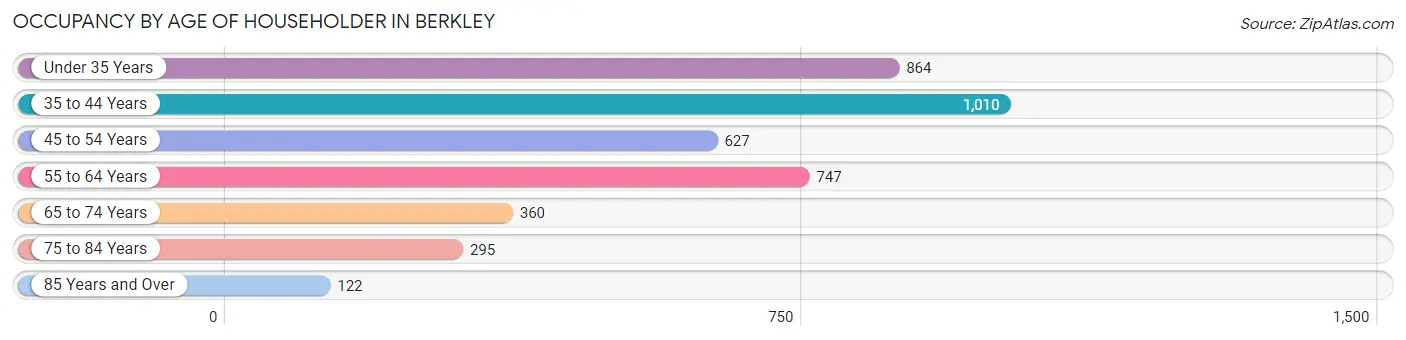
| Age Bracket | # Households | % Households |
| Under 35 Years | 864 | 21.5% |
| 35 to 44 Years | 1,010 | 25.1% |
| 45 to 54 Years | 627 | 15.6% |
| 55 to 64 Years | 747 | 18.6% |
| 65 to 74 Years | 360 | 8.9% |
| 75 to 84 Years | 295 | 7.3% |
| 85 Years and Over | 122 | 3.0% |
| Total | 4,025 | 100.0% |
Housing Finances in Berkley
Median Income by Occupancy in Berkley
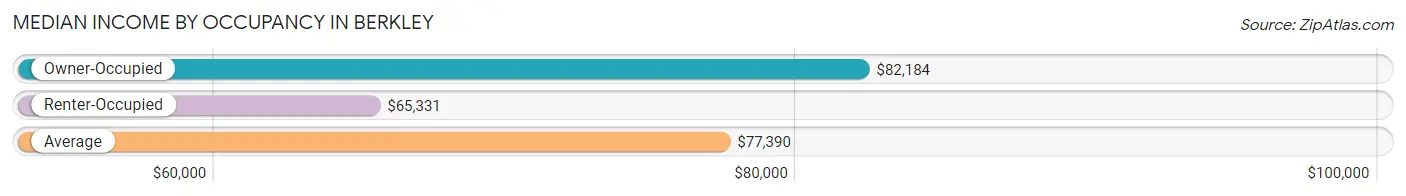
| Occupancy Type | # Households | Median Income |
| Owner-Occupied | 2,734 (67.9%) | $82,184 |
| Renter-Occupied | 1,291 (32.1%) | $65,331 |
| Average | 4,025 (100.0%) | $77,390 |
Occupancy by Householder Income Bracket in Berkley
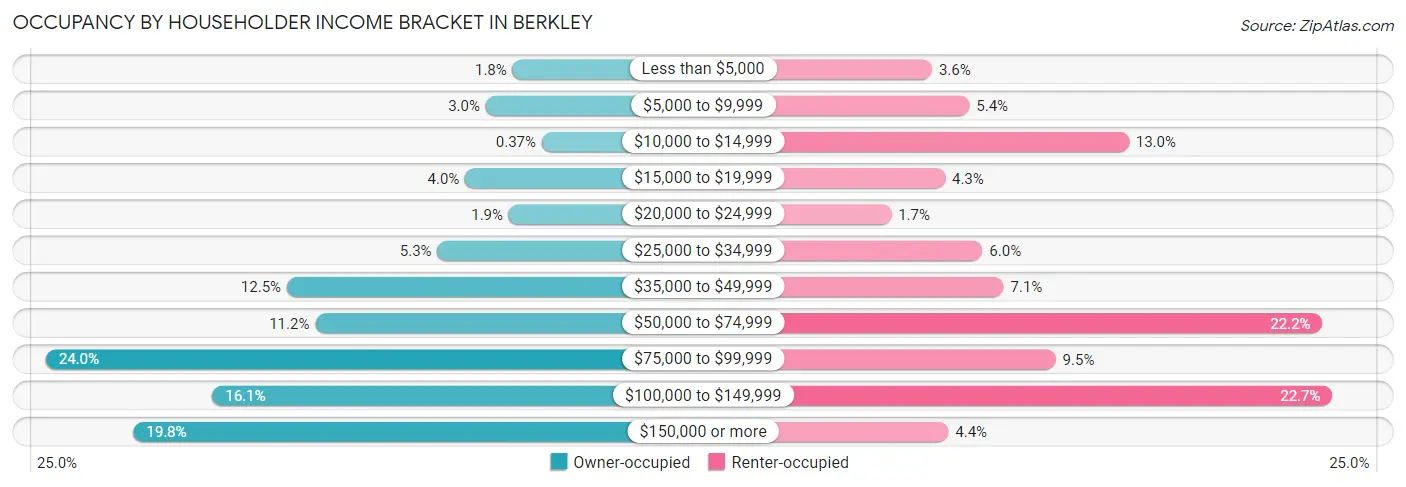
| Income Bracket | Owner-occupied | Renter-occupied |
| Less than $5,000 | 48 (1.8%) | 47 (3.6%) |
| $5,000 to $9,999 | 83 (3.0%) | 70 (5.4%) |
| $10,000 to $14,999 | 10 (0.4%) | 168 (13.0%) |
| $15,000 to $19,999 | 110 (4.0%) | 55 (4.3%) |
| $20,000 to $24,999 | 53 (1.9%) | 22 (1.7%) |
| $25,000 to $34,999 | 146 (5.3%) | 78 (6.0%) |
| $35,000 to $49,999 | 342 (12.5%) | 91 (7.0%) |
| $50,000 to $74,999 | 305 (11.2%) | 287 (22.2%) |
| $75,000 to $99,999 | 656 (24.0%) | 123 (9.5%) |
| $100,000 to $149,999 | 439 (16.1%) | 293 (22.7%) |
| $150,000 or more | 542 (19.8%) | 57 (4.4%) |
| Total | 2,734 (100.0%) | 1,291 (100.0%) |
Monthly Housing Cost Tiers in Berkley
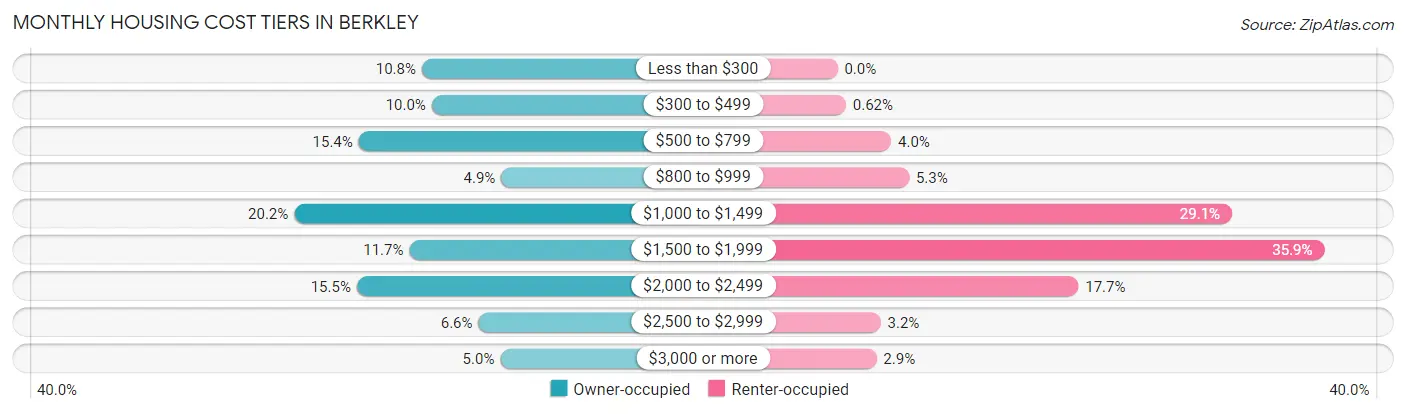
| Monthly Cost | Owner-occupied | Renter-occupied |
| Less than $300 | 294 (10.7%) | 0 (0.0%) |
| $300 to $499 | 274 (10.0%) | 8 (0.6%) |
| $500 to $799 | 421 (15.4%) | 51 (4.0%) |
| $800 to $999 | 134 (4.9%) | 68 (5.3%) |
| $1,000 to $1,499 | 551 (20.2%) | 375 (29.0%) |
| $1,500 to $1,999 | 319 (11.7%) | 463 (35.9%) |
| $2,000 to $2,499 | 425 (15.5%) | 229 (17.7%) |
| $2,500 to $2,999 | 180 (6.6%) | 41 (3.2%) |
| $3,000 or more | 136 (5.0%) | 37 (2.9%) |
| Total | 2,734 (100.0%) | 1,291 (100.0%) |
Physical Housing Characteristics in Berkley
Housing Structures in Berkley
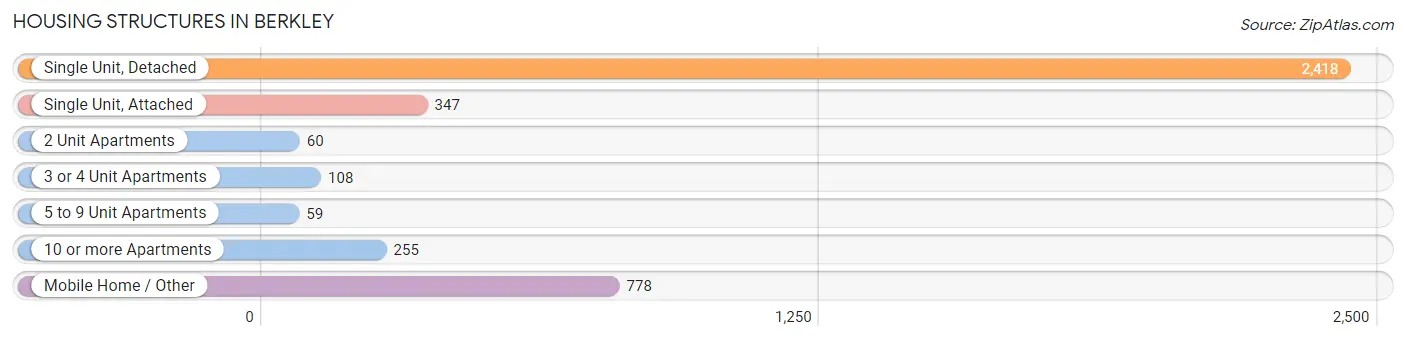
| Structure Type | # Housing Units | % Housing Units |
| Single Unit, Detached | 2,418 | 60.1% |
| Single Unit, Attached | 347 | 8.6% |
| 2 Unit Apartments | 60 | 1.5% |
| 3 or 4 Unit Apartments | 108 | 2.7% |
| 5 to 9 Unit Apartments | 59 | 1.5% |
| 10 or more Apartments | 255 | 6.3% |
| Mobile Home / Other | 778 | 19.3% |
| Total | 4,025 | 100.0% |
Housing Structures by Occupancy in Berkley
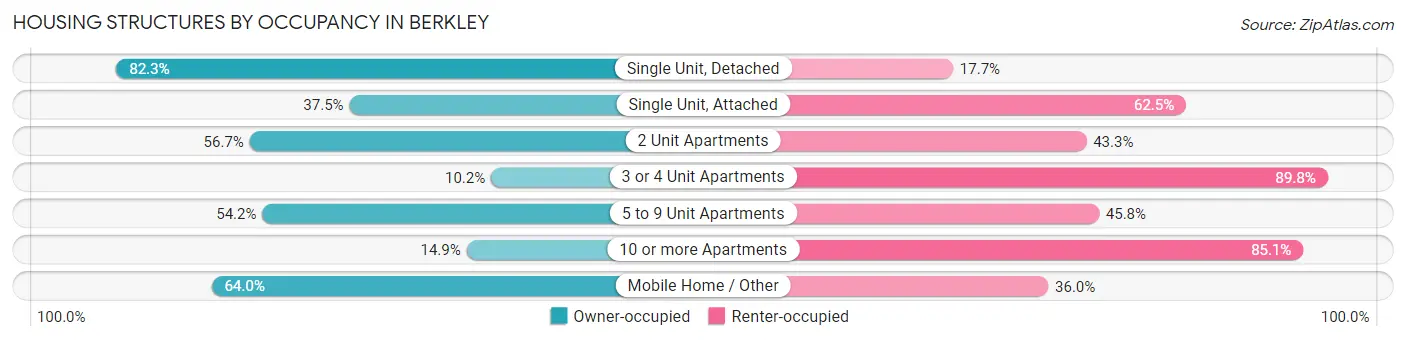
| Structure Type | Owner-occupied | Renter-occupied |
| Single Unit, Detached | 1,991 (82.3%) | 427 (17.7%) |
| Single Unit, Attached | 130 (37.5%) | 217 (62.5%) |
| 2 Unit Apartments | 34 (56.7%) | 26 (43.3%) |
| 3 or 4 Unit Apartments | 11 (10.2%) | 97 (89.8%) |
| 5 to 9 Unit Apartments | 32 (54.2%) | 27 (45.8%) |
| 10 or more Apartments | 38 (14.9%) | 217 (85.1%) |
| Mobile Home / Other | 498 (64.0%) | 280 (36.0%) |
| Total | 2,734 (67.9%) | 1,291 (32.1%) |
Housing Structures by Number of Rooms in Berkley
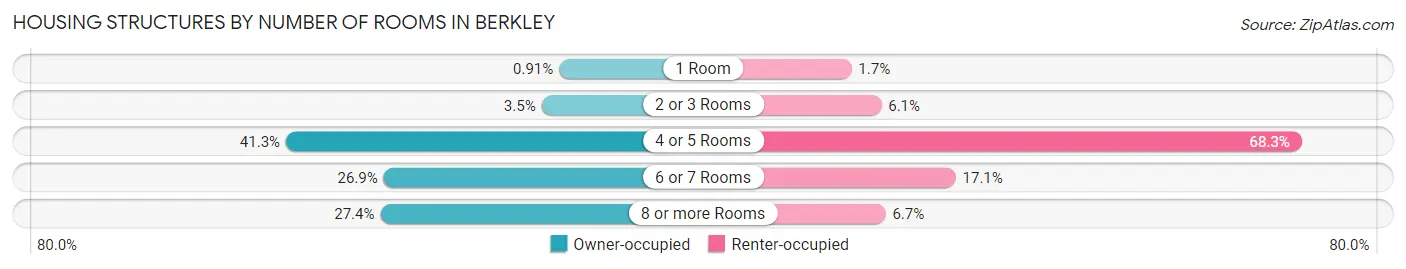
| Number of Rooms | Owner-occupied | Renter-occupied |
| 1 Room | 25 (0.9%) | 22 (1.7%) |
| 2 or 3 Rooms | 96 (3.5%) | 79 (6.1%) |
| 4 or 5 Rooms | 1,130 (41.3%) | 882 (68.3%) |
| 6 or 7 Rooms | 735 (26.9%) | 221 (17.1%) |
| 8 or more Rooms | 748 (27.4%) | 87 (6.7%) |
| Total | 2,734 (100.0%) | 1,291 (100.0%) |
Housing Structure by Heating Type in Berkley
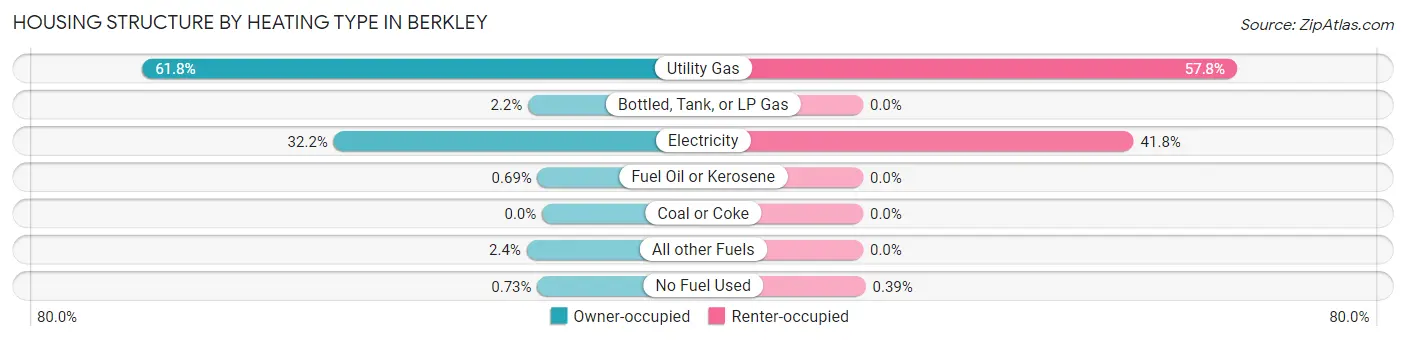
| Heating Type | Owner-occupied | Renter-occupied |
| Utility Gas | 1,690 (61.8%) | 746 (57.8%) |
| Bottled, Tank, or LP Gas | 59 (2.2%) | 0 (0.0%) |
| Electricity | 881 (32.2%) | 540 (41.8%) |
| Fuel Oil or Kerosene | 19 (0.7%) | 0 (0.0%) |
| Coal or Coke | 0 (0.0%) | 0 (0.0%) |
| All other Fuels | 65 (2.4%) | 0 (0.0%) |
| No Fuel Used | 20 (0.7%) | 5 (0.4%) |
| Total | 2,734 (100.0%) | 1,291 (100.0%) |
Household Vehicle Usage in Berkley
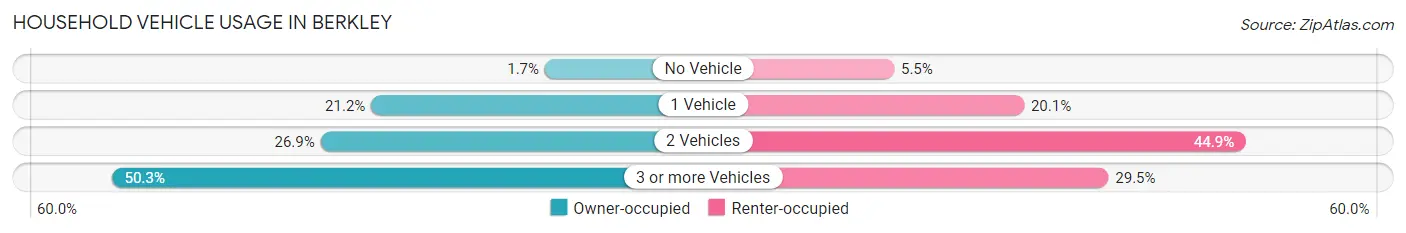
| Vehicles per Household | Owner-occupied | Renter-occupied |
| No Vehicle | 47 (1.7%) | 71 (5.5%) |
| 1 Vehicle | 579 (21.2%) | 259 (20.1%) |
| 2 Vehicles | 734 (26.9%) | 580 (44.9%) |
| 3 or more Vehicles | 1,374 (50.3%) | 381 (29.5%) |
| Total | 2,734 (100.0%) | 1,291 (100.0%) |
Real Estate & Mortgages in Berkley
Real Estate and Mortgage Overview in Berkley
| Characteristic | Without Mortgage | With Mortgage |
| Housing Units | 1,151 | 1,583 |
| Median Property Value | $282,700 | $472,900 |
| Median Household Income | $82,216 | $339 |
| Monthly Housing Costs | $534 | $127 |
| Real Estate Taxes | $1,630 | $41 |
Property Value by Mortgage Status in Berkley
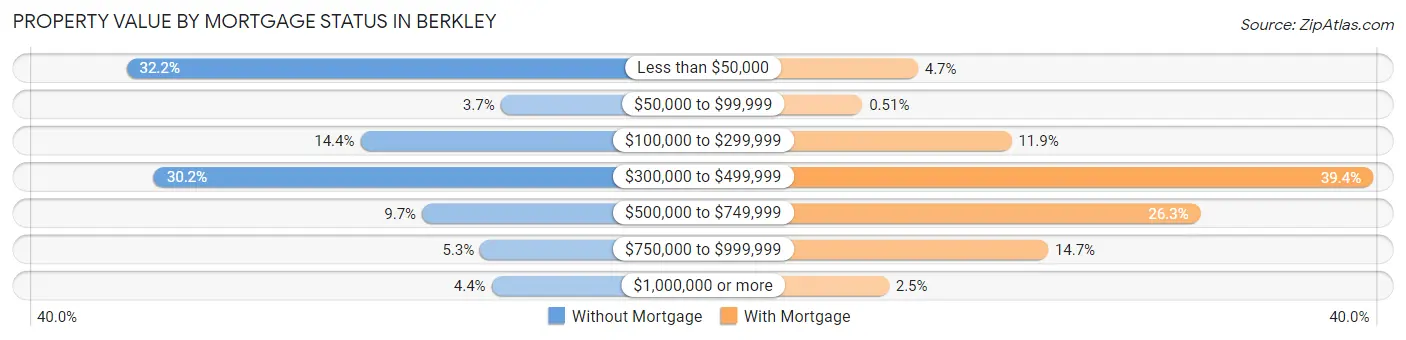
| Property Value | Without Mortgage | With Mortgage |
| Less than $50,000 | 371 (32.2%) | 75 (4.7%) |
| $50,000 to $99,999 | 43 (3.7%) | 8 (0.5%) |
| $100,000 to $299,999 | 166 (14.4%) | 188 (11.9%) |
| $300,000 to $499,999 | 347 (30.1%) | 624 (39.4%) |
| $500,000 to $749,999 | 112 (9.7%) | 416 (26.3%) |
| $750,000 to $999,999 | 61 (5.3%) | 232 (14.7%) |
| $1,000,000 or more | 51 (4.4%) | 40 (2.5%) |
| Total | 1,151 (100.0%) | 1,583 (100.0%) |
Household Income by Mortgage Status in Berkley
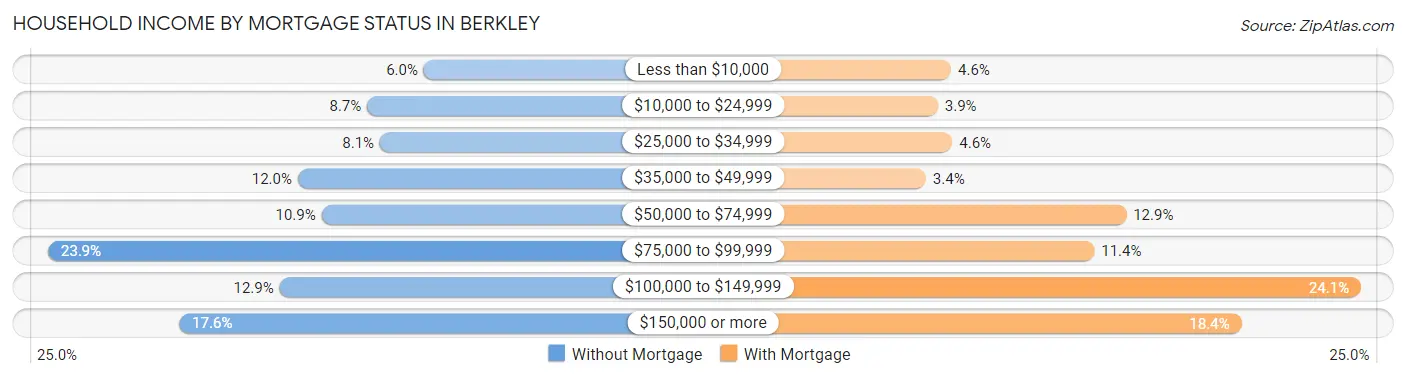
| Household Income | Without Mortgage | With Mortgage |
| Less than $10,000 | 69 (6.0%) | 72 (4.5%) |
| $10,000 to $24,999 | 100 (8.7%) | 62 (3.9%) |
| $25,000 to $34,999 | 93 (8.1%) | 73 (4.6%) |
| $35,000 to $49,999 | 138 (12.0%) | 53 (3.4%) |
| $50,000 to $74,999 | 125 (10.9%) | 204 (12.9%) |
| $75,000 to $99,999 | 275 (23.9%) | 180 (11.4%) |
| $100,000 to $149,999 | 148 (12.9%) | 381 (24.1%) |
| $150,000 or more | 203 (17.6%) | 291 (18.4%) |
| Total | 1,151 (100.0%) | 1,583 (100.0%) |
Property Value to Household Income Ratio in Berkley
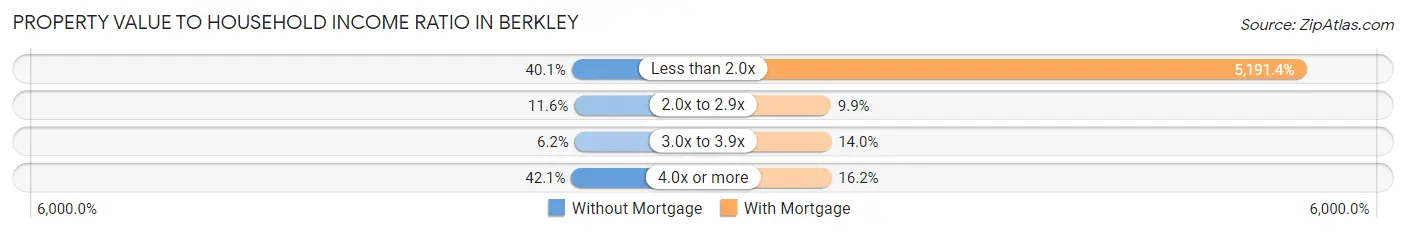
| Value-to-Income Ratio | Without Mortgage | With Mortgage |
| Less than 2.0x | 462 (40.1%) | 82,179 (5,191.3%) |
| 2.0x to 2.9x | 134 (11.6%) | 156 (9.9%) |
| 3.0x to 3.9x | 71 (6.2%) | 222 (14.0%) |
| 4.0x or more | 484 (42.0%) | 257 (16.2%) |
| Total | 1,151 (100.0%) | 1,583 (100.0%) |
Real Estate Taxes by Mortgage Status in Berkley
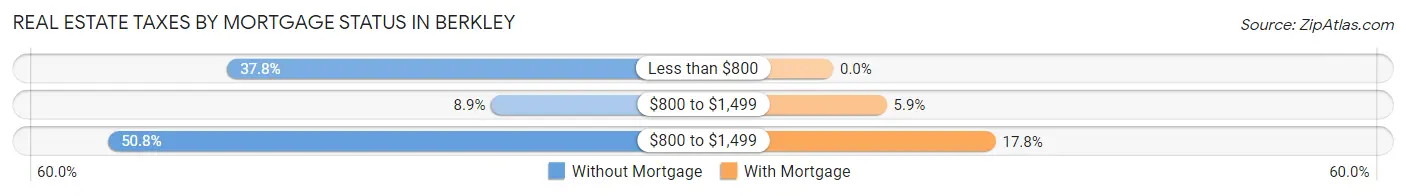
| Property Taxes | Without Mortgage | With Mortgage |
| Less than $800 | 435 (37.8%) | 0 (0.0%) |
| $800 to $1,499 | 102 (8.9%) | 93 (5.9%) |
| $800 to $1,499 | 585 (50.8%) | 282 (17.8%) |
| Total | 1,151 (100.0%) | 1,583 (100.0%) |
Health & Disability in Berkley
Health Insurance Coverage by Age in Berkley
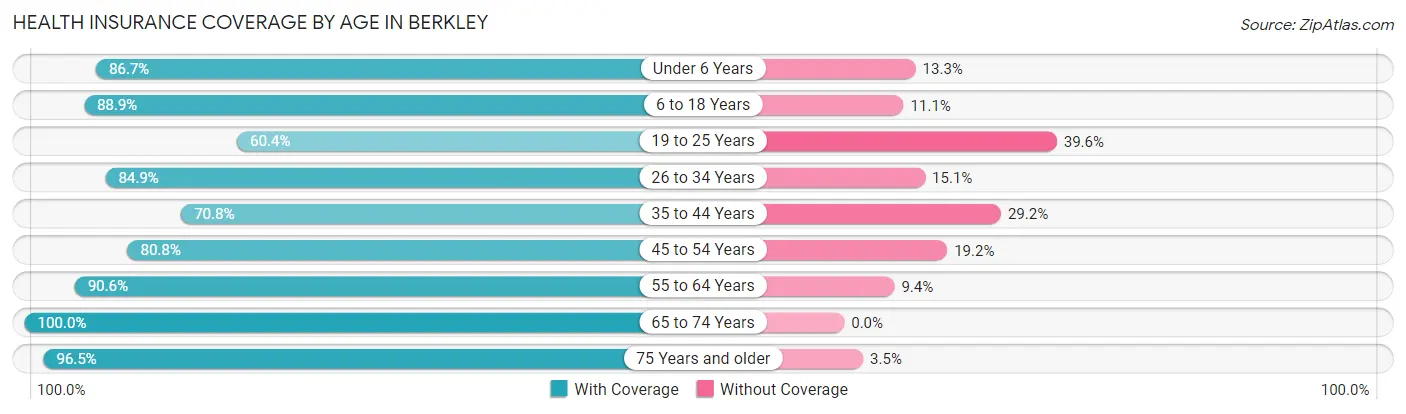
| Age Bracket | With Coverage | Without Coverage |
| Under 6 Years | 612 (86.7%) | 94 (13.3%) |
| 6 to 18 Years | 1,687 (88.9%) | 210 (11.1%) |
| 19 to 25 Years | 943 (60.4%) | 619 (39.6%) |
| 26 to 34 Years | 1,194 (84.9%) | 212 (15.1%) |
| 35 to 44 Years | 1,308 (70.8%) | 540 (29.2%) |
| 45 to 54 Years | 884 (80.8%) | 210 (19.2%) |
| 55 to 64 Years | 1,268 (90.6%) | 131 (9.4%) |
| 65 to 74 Years | 631 (100.0%) | 0 (0.0%) |
| 75 Years and older | 603 (96.5%) | 22 (3.5%) |
| Total | 9,130 (81.8%) | 2,038 (18.2%) |
Health Insurance Coverage by Citizenship Status in Berkley
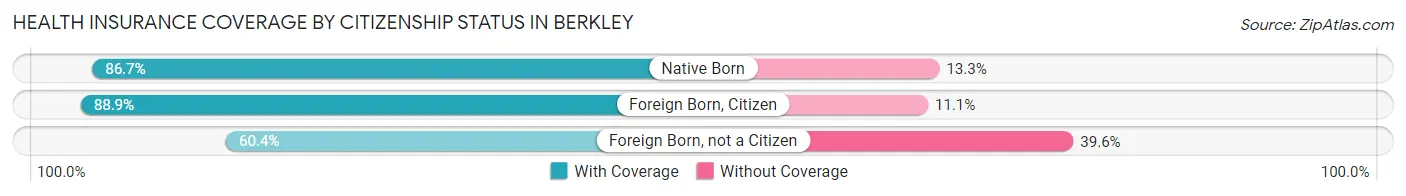
| Citizenship Status | With Coverage | Without Coverage |
| Native Born | 612 (86.7%) | 94 (13.3%) |
| Foreign Born, Citizen | 1,687 (88.9%) | 210 (11.1%) |
| Foreign Born, not a Citizen | 943 (60.4%) | 619 (39.6%) |
Health Insurance Coverage by Household Income in Berkley
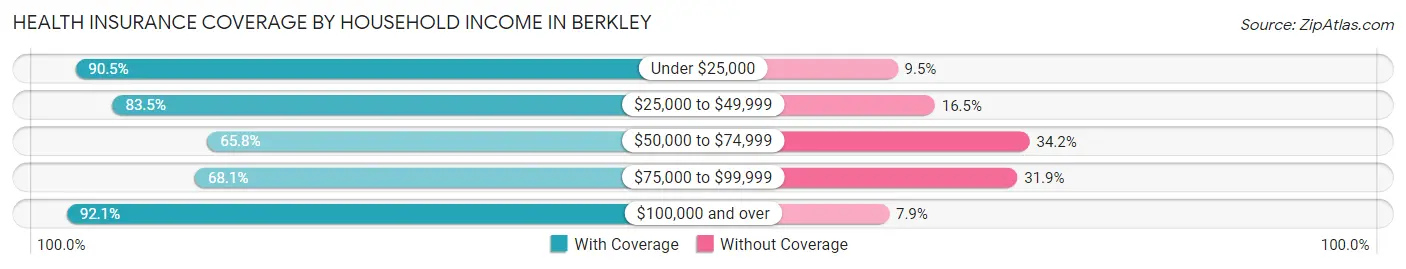
| Household Income | With Coverage | Without Coverage |
| Under $25,000 | 1,179 (90.5%) | 124 (9.5%) |
| $25,000 to $49,999 | 1,134 (83.5%) | 224 (16.5%) |
| $50,000 to $74,999 | 1,116 (65.8%) | 581 (34.2%) |
| $75,000 to $99,999 | 1,624 (68.1%) | 762 (31.9%) |
| $100,000 and over | 4,019 (92.1%) | 345 (7.9%) |
Public vs Private Health Insurance Coverage by Age in Berkley
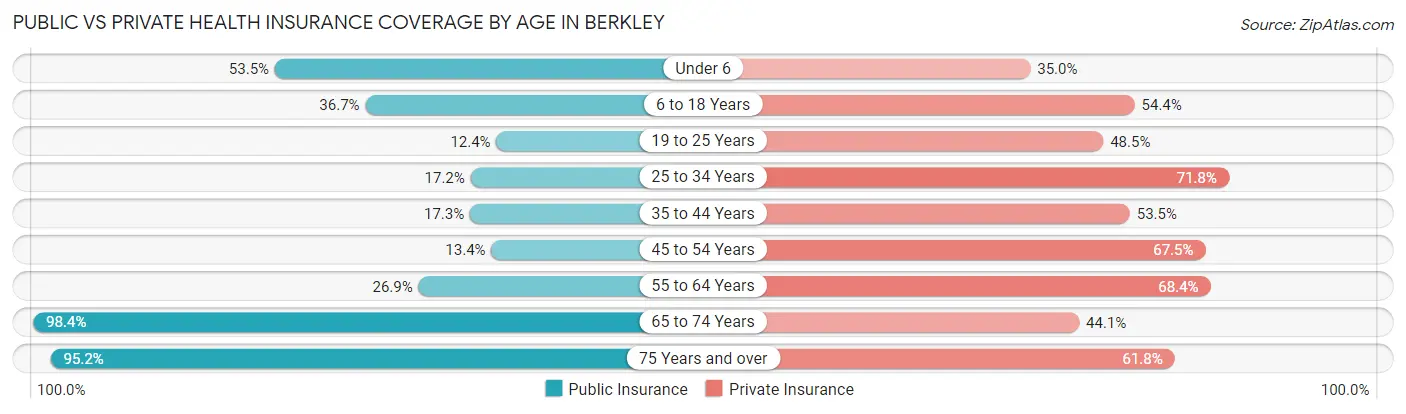
| Age Bracket | Public Insurance | Private Insurance |
| Under 6 | 378 (53.5%) | 247 (35.0%) |
| 6 to 18 Years | 697 (36.7%) | 1,031 (54.3%) |
| 19 to 25 Years | 194 (12.4%) | 758 (48.5%) |
| 25 to 34 Years | 242 (17.2%) | 1,010 (71.8%) |
| 35 to 44 Years | 320 (17.3%) | 988 (53.5%) |
| 45 to 54 Years | 146 (13.4%) | 738 (67.5%) |
| 55 to 64 Years | 376 (26.9%) | 957 (68.4%) |
| 65 to 74 Years | 621 (98.4%) | 278 (44.1%) |
| 75 Years and over | 595 (95.2%) | 386 (61.8%) |
| Total | 3,569 (32.0%) | 6,393 (57.2%) |
Disability Status by Sex by Age in Berkley
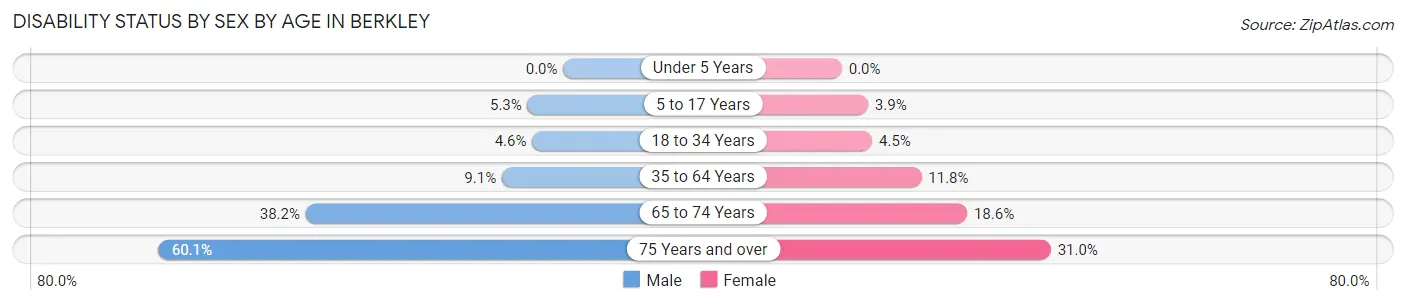
| Age Bracket | Male | Female |
| Under 5 Years | 0 (0.0%) | 0 (0.0%) |
| 5 to 17 Years | 44 (5.3%) | 35 (3.9%) |
| 18 to 34 Years | 75 (4.6%) | 73 (4.5%) |
| 35 to 64 Years | 208 (9.1%) | 243 (11.8%) |
| 65 to 74 Years | 122 (38.2%) | 58 (18.6%) |
| 75 Years and over | 176 (60.1%) | 103 (31.0%) |
Disability Class by Sex by Age in Berkley
Disability Class: Hearing Difficulty
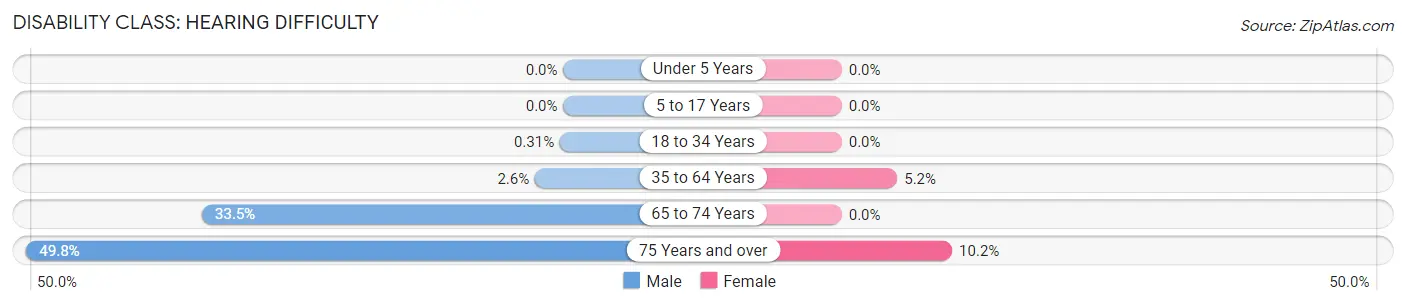
| Age Bracket | Male | Female |
| Under 5 Years | 0 (0.0%) | 0 (0.0%) |
| 5 to 17 Years | 0 (0.0%) | 0 (0.0%) |
| 18 to 34 Years | 5 (0.3%) | 0 (0.0%) |
| 35 to 64 Years | 60 (2.6%) | 106 (5.1%) |
| 65 to 74 Years | 107 (33.5%) | 0 (0.0%) |
| 75 Years and over | 146 (49.8%) | 34 (10.2%) |
Disability Class: Vision Difficulty
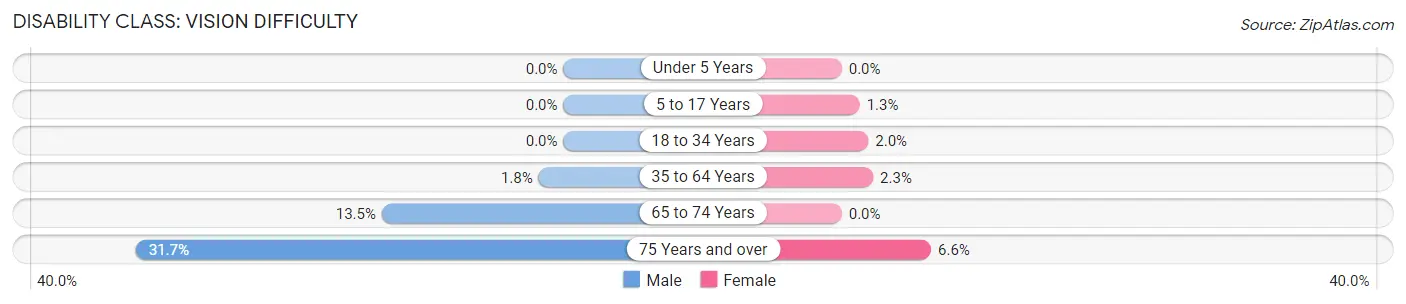
| Age Bracket | Male | Female |
| Under 5 Years | 0 (0.0%) | 0 (0.0%) |
| 5 to 17 Years | 0 (0.0%) | 12 (1.3%) |
| 18 to 34 Years | 0 (0.0%) | 32 (2.0%) |
| 35 to 64 Years | 42 (1.8%) | 48 (2.3%) |
| 65 to 74 Years | 43 (13.5%) | 0 (0.0%) |
| 75 Years and over | 93 (31.7%) | 22 (6.6%) |
Disability Class: Cognitive Difficulty
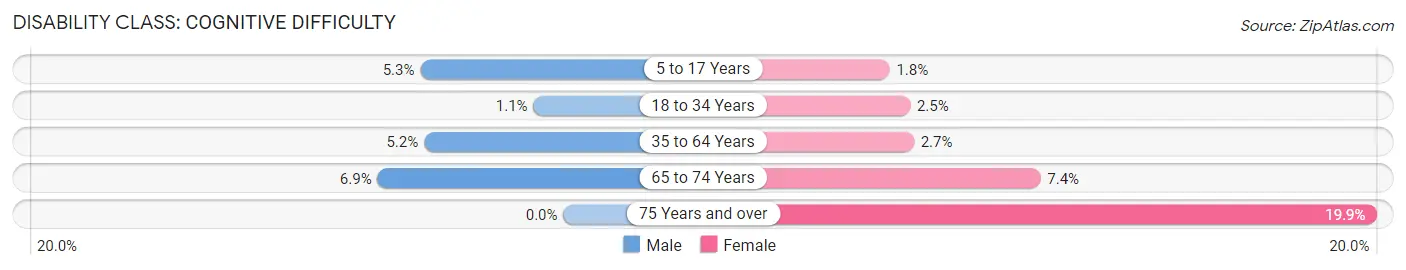
| Age Bracket | Male | Female |
| 5 to 17 Years | 44 (5.3%) | 16 (1.8%) |
| 18 to 34 Years | 18 (1.1%) | 41 (2.5%) |
| 35 to 64 Years | 118 (5.2%) | 55 (2.7%) |
| 65 to 74 Years | 22 (6.9%) | 23 (7.4%) |
| 75 Years and over | 0 (0.0%) | 66 (19.9%) |
Disability Class: Ambulatory Difficulty
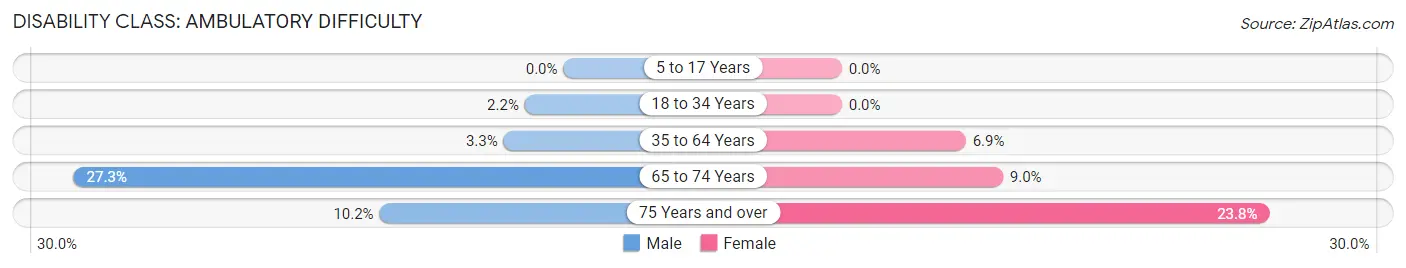
| Age Bracket | Male | Female |
| 5 to 17 Years | 0 (0.0%) | 0 (0.0%) |
| 18 to 34 Years | 35 (2.1%) | 0 (0.0%) |
| 35 to 64 Years | 76 (3.3%) | 142 (6.9%) |
| 65 to 74 Years | 87 (27.3%) | 28 (9.0%) |
| 75 Years and over | 30 (10.2%) | 79 (23.8%) |
Disability Class: Self-Care Difficulty
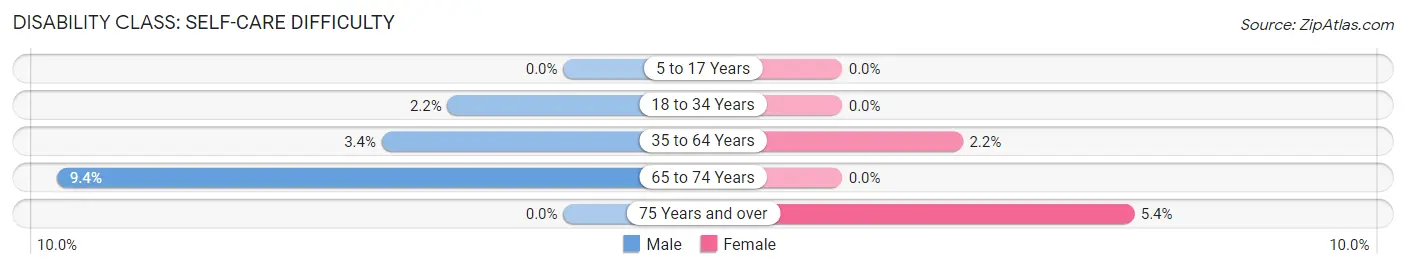
| Age Bracket | Male | Female |
| 5 to 17 Years | 0 (0.0%) | 0 (0.0%) |
| 18 to 34 Years | 35 (2.1%) | 0 (0.0%) |
| 35 to 64 Years | 77 (3.4%) | 46 (2.2%) |
| 65 to 74 Years | 30 (9.4%) | 0 (0.0%) |
| 75 Years and over | 0 (0.0%) | 18 (5.4%) |
Technology Access in Berkley
Computing Device Access in Berkley
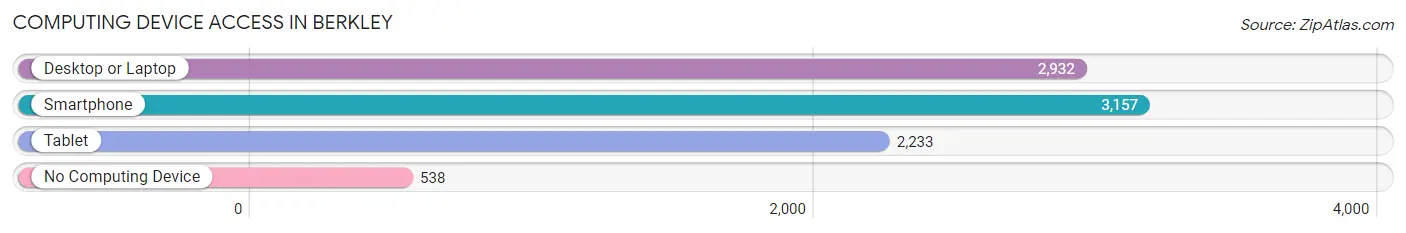
| Device Type | # Households | % Households |
| Desktop or Laptop | 2,932 | 72.8% |
| Smartphone | 3,157 | 78.4% |
| Tablet | 2,233 | 55.5% |
| No Computing Device | 538 | 13.4% |
| Total | 4,025 | 100.0% |
Internet Access in Berkley
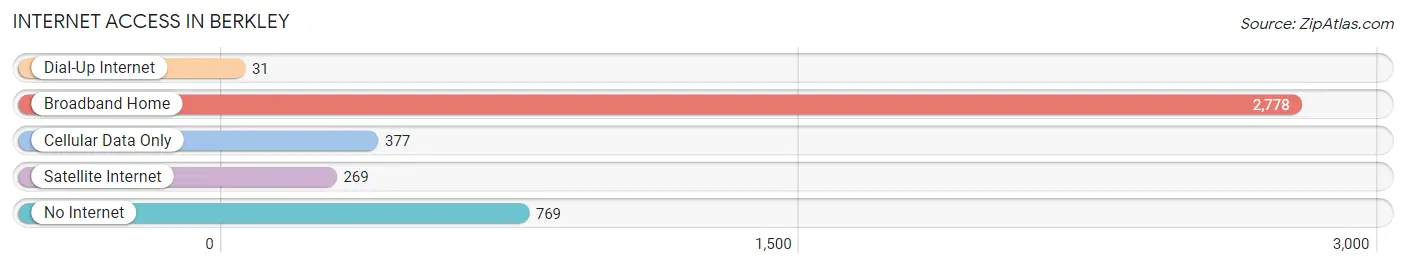
| Internet Type | # Households | % Households |
| Dial-Up Internet | 31 | 0.8% |
| Broadband Home | 2,778 | 69.0% |
| Cellular Data Only | 377 | 9.4% |
| Satellite Internet | 269 | 6.7% |
| No Internet | 769 | 19.1% |
| Total | 4,025 | 100.0% |
Berkley Summary
Berkley, Colorado is a small town located in the foothills of the Rocky Mountains in Jefferson County. It is situated at an elevation of 5,890 feet and is approximately 20 miles west of Denver. The town was founded in 1859 and was originally known as “Berkley’s Station”. It was named after the first settler, William Berkley, who arrived in the area in 1859. The town was incorporated in 1887 and has a population of approximately 1,500 people.
Geography
Berkley is located in the foothills of the Rocky Mountains in Jefferson County. It is situated at an elevation of 5,890 feet and is approximately 20 miles west of Denver. The town is surrounded by the Rocky Mountains to the west, the Front Range to the east, and the Great Plains to the north. The town is located in a valley surrounded by mountains, and is home to several small lakes and streams. The town is also home to several parks, including the Berkley Lake Park, which is a popular spot for fishing, swimming, and camping.
Economy
Berkley’s economy is largely based on tourism and agriculture. The town is home to several small businesses, including restaurants, shops, and galleries. The town is also home to several wineries and breweries, which attract visitors from all over the state. The town is also home to several farms, which produce a variety of fruits and vegetables. The town is also home to several small manufacturing companies, which produce a variety of products, including furniture, clothing, and electronics.
Demographics
As of the 2010 census, the population of Berkley was 1,500 people. The town is predominantly white, with approximately 90% of the population being Caucasian. The town is also home to a small Hispanic population, which makes up approximately 5% of the population. The town is also home to a small African American population, which makes up approximately 2% of the population. The median household income in Berkley is approximately $50,000, and the median home value is approximately $250,000.
Conclusion
Berkley, Colorado is a small town located in the foothills of the Rocky Mountains in Jefferson County. It is situated at an elevation of 5,890 feet and is approximately 20 miles west of Denver. The town was founded in 1859 and was originally known as “Berkley’s Station”. The town’s economy is largely based on tourism and agriculture, and the town is home to several small businesses, wineries, breweries, and farms. The population of Berkley is predominantly white, with approximately 90% of the population being Caucasian. The median household income in Berkley is approximately $50,000, and the median home value is approximately $250,000.
Common Questions
What is Per Capita Income in Berkley?
Per Capita income in Berkley is $33,159.
What is the Median Family Income in Berkley?
Median Family Income in Berkley is $86,364.
What is the Median Household income in Berkley?
Median Household Income in Berkley is $77,390.
What is Income or Wage Gap in Berkley?
Income or Wage Gap in Berkley is 44.5%.
Women in Berkley earn 55.5 cents for every dollar earned by a man.
What is Inequality or Gini Index in Berkley?
Inequality or Gini Index in Berkley is 0.42.
What is the Total Population of Berkley?
Total Population of Berkley is 11,185.
What is the Total Male Population of Berkley?
Total Male Population of Berkley is 5,656.
What is the Total Female Population of Berkley?
Total Female Population of Berkley is 5,529.
What is the Ratio of Males per 100 Females in Berkley?
There are 102.30 Males per 100 Females in Berkley.
What is the Ratio of Females per 100 Males in Berkley?
There are 97.75 Females per 100 Males in Berkley.
What is the Median Population Age in Berkley?
Median Population Age in Berkley is 35.1 Years.
What is the Average Family Size in Berkley
Average Family Size in Berkley is 3.3 People.
What is the Average Household Size in Berkley
Average Household Size in Berkley is 2.8 People.
How Large is the Labor Force in Berkley?
There are 6,514 People in the Labor Forcein in Berkley.
What is the Percentage of People in the Labor Force in Berkley?
71.5% of People are in the Labor Force in Berkley.
What is the Unemployment Rate in Berkley?
Unemployment Rate in Berkley is 6.0%.