Bennett, CO Map & Demographics
Bennett Map
Bennett Overview
$38,022
PER CAPITA INCOME
$110,781
AVG FAMILY INCOME
$82,035
AVG HOUSEHOLD INCOME
39.9%
WAGE / INCOME GAP [ % ]
60.1¢/ $1
WAGE / INCOME GAP [ $ ]
0.38
INEQUALITY / GINI INDEX
3,299
TOTAL POPULATION
1,700
MALE POPULATION
1,599
FEMALE POPULATION
106.32
MALES / 100 FEMALES
94.06
FEMALES / 100 MALES
34.5
MEDIAN AGE
3.5
AVG FAMILY SIZE
3.0
AVG HOUSEHOLD SIZE
1,739
LABOR FORCE [ PEOPLE ]
67.1%
PERCENT IN LABOR FORCE
2.3%
UNEMPLOYMENT RATE
Bennett Zip Codes
Bennett Area Codes
Income in Bennett
Income Overview in Bennett
Per Capita Income in Bennett is $38,022, while median incomes of families and households are $110,781 and $82,035 respectively.
| Characteristic | Number | Measure |
| Per Capita Income | 3,299 | $38,022 |
| Median Family Income | 786 | $110,781 |
| Mean Family Income | 786 | $125,664 |
| Median Household Income | 1,120 | $82,035 |
| Mean Household Income | 1,120 | $109,586 |
| Income Deficit | 786 | $0 |
| Wage / Income Gap (%) | 3,299 | 39.88% |
| Wage / Income Gap ($) | 3,299 | 60.12¢ per $1 |
| Gini / Inequality Index | 3,299 | 0.38 |
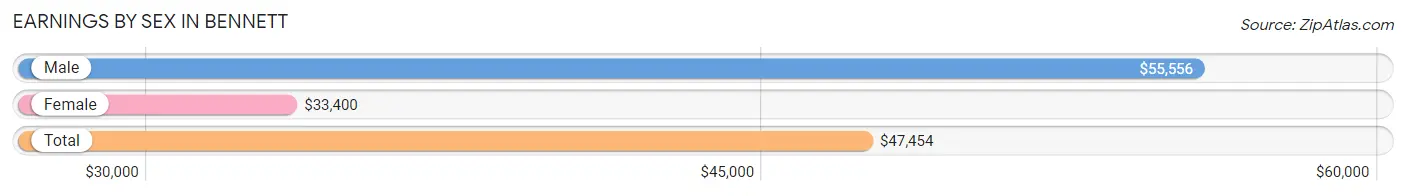
Earnings by Sex in Bennett
Average Earnings in Bennett are $47,454, $55,556 for men and $33,400 for women, a difference of 39.9%.
| Sex | Number | Average Earnings |
| Male | 1,080 (58.7%) | $55,556 |
| Female | 760 (41.3%) | $33,400 |
| Total | 1,840 (100.0%) | $47,454 |
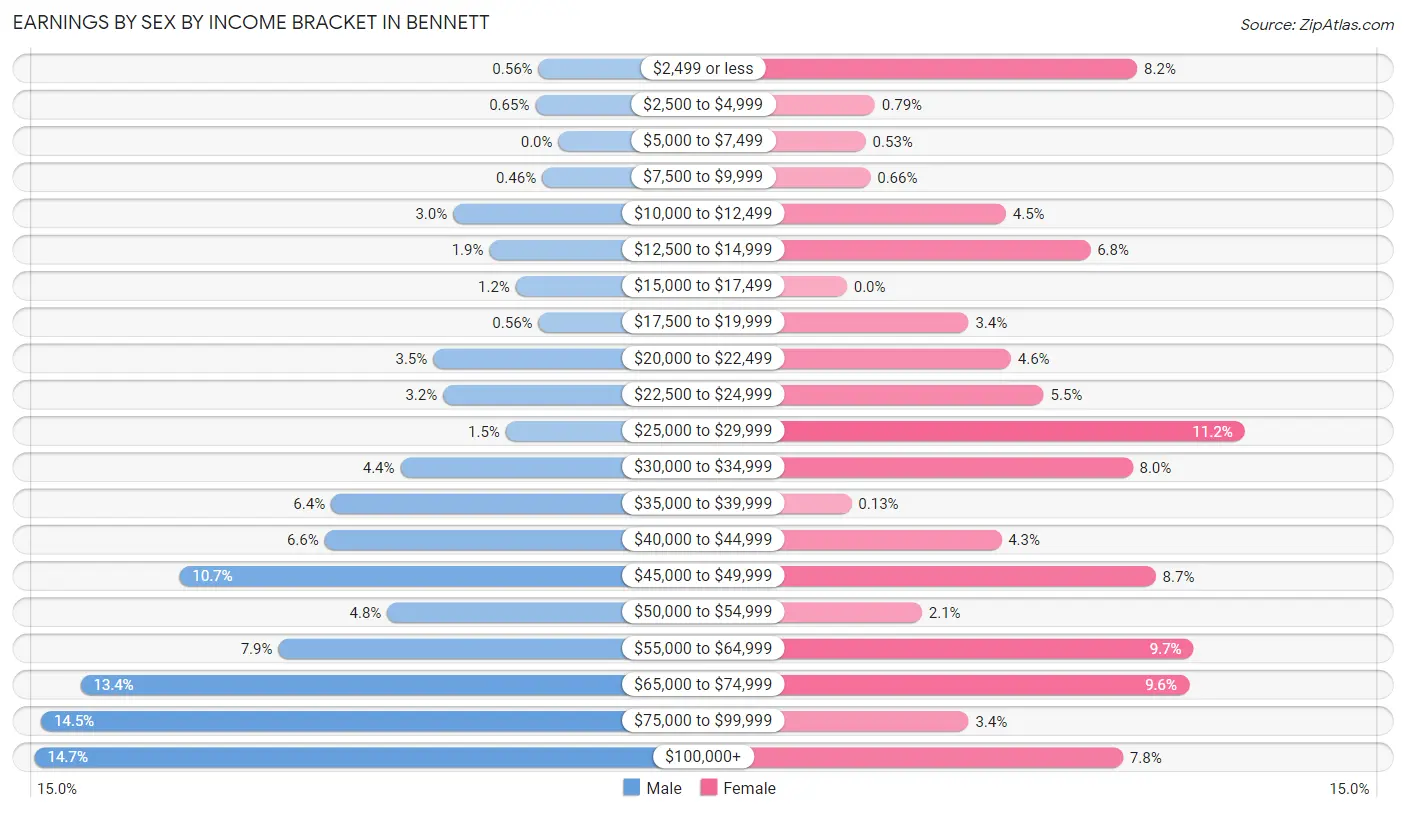
Earnings by Sex by Income Bracket in Bennett
The most common earnings brackets in Bennett are $100,000+ for men (159 | 14.7%) and $25,000 to $29,999 for women (85 | 11.2%).
| Income | Male | Female |
| $2,499 or less | 6 (0.6%) | 62 (8.2%) |
| $2,500 to $4,999 | 7 (0.6%) | 6 (0.8%) |
| $5,000 to $7,499 | 0 (0.0%) | 4 (0.5%) |
| $7,500 to $9,999 | 5 (0.5%) | 5 (0.7%) |
| $10,000 to $12,499 | 32 (3.0%) | 34 (4.5%) |
| $12,500 to $14,999 | 21 (1.9%) | 52 (6.8%) |
| $15,000 to $17,499 | 13 (1.2%) | 0 (0.0%) |
| $17,500 to $19,999 | 6 (0.6%) | 26 (3.4%) |
| $20,000 to $22,499 | 38 (3.5%) | 35 (4.6%) |
| $22,500 to $24,999 | 35 (3.2%) | 42 (5.5%) |
| $25,000 to $29,999 | 16 (1.5%) | 85 (11.2%) |
| $30,000 to $34,999 | 48 (4.4%) | 61 (8.0%) |
| $35,000 to $39,999 | 69 (6.4%) | 1 (0.1%) |
| $40,000 to $44,999 | 71 (6.6%) | 33 (4.3%) |
| $45,000 to $49,999 | 115 (10.6%) | 66 (8.7%) |
| $50,000 to $54,999 | 52 (4.8%) | 16 (2.1%) |
| $55,000 to $64,999 | 85 (7.9%) | 74 (9.7%) |
| $65,000 to $74,999 | 145 (13.4%) | 73 (9.6%) |
| $75,000 to $99,999 | 157 (14.5%) | 26 (3.4%) |
| $100,000+ | 159 (14.7%) | 59 (7.8%) |
| Total | 1,080 (100.0%) | 760 (100.0%) |
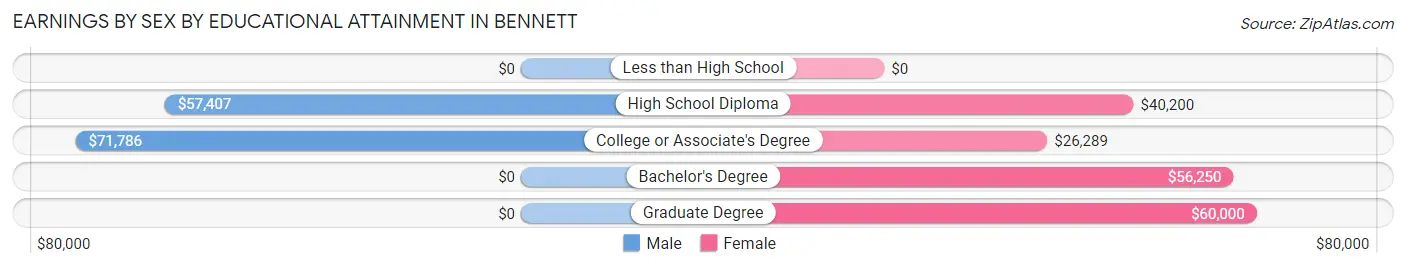
Earnings by Sex by Educational Attainment in Bennett
Average earnings in Bennett are $66,375 for men and $36,250 for women, a difference of 45.4%. Men with an educational attainment of college or associate's degree enjoy the highest average annual earnings of $71,786, while those with high school diploma education earn the least with $57,407. Women with an educational attainment of graduate degree earn the most with the average annual earnings of $60,000, while those with college or associate's degree education have the smallest earnings of $26,289.
| Educational Attainment | Male Income | Female Income |
| Less than High School | - | - |
| High School Diploma | $57,407 | $40,200 |
| College or Associate's Degree | $71,786 | $26,289 |
| Bachelor's Degree | - | - |
| Graduate Degree | - | - |
| Total | $66,375 | $36,250 |
Family Income in Bennett
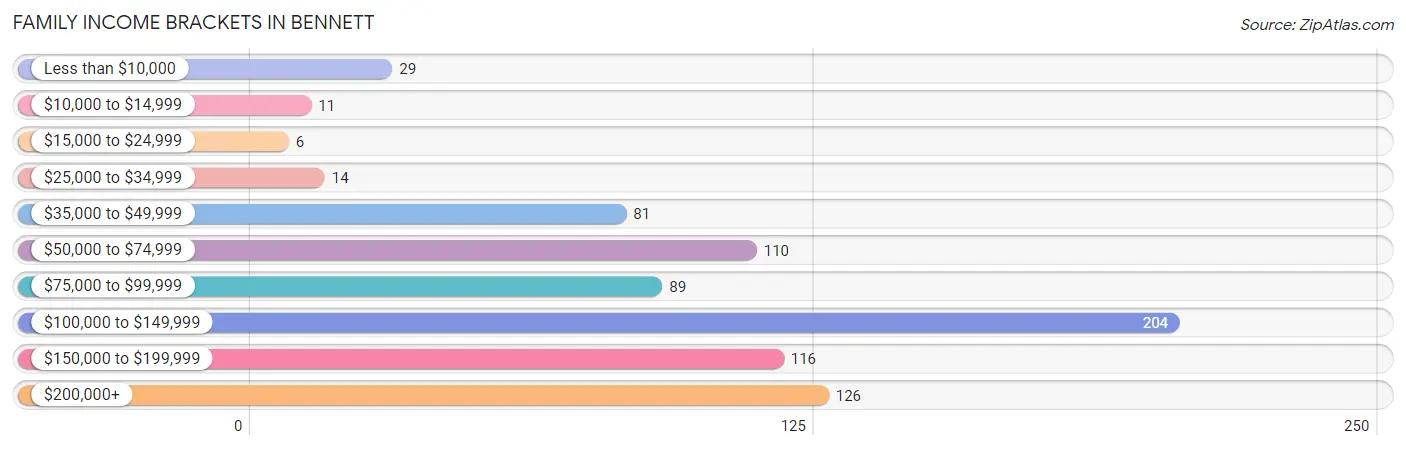
Family Income Brackets in Bennett
According to the Bennett family income data, there are 204 families falling into the $100,000 to $149,999 income range, which is the most common income bracket and makes up 26.0% of all families. Conversely, the $15,000 to $24,999 income bracket is the least frequent group with only 6 families (0.8%) belonging to this category.
| Income Bracket | # Families | % Families |
| Less than $10,000 | 29 | 3.7% |
| $10,000 to $14,999 | 11 | 1.4% |
| $15,000 to $24,999 | 6 | 0.8% |
| $25,000 to $34,999 | 14 | 1.8% |
| $35,000 to $49,999 | 81 | 10.3% |
| $50,000 to $74,999 | 110 | 14.0% |
| $75,000 to $99,999 | 89 | 11.3% |
| $100,000 to $149,999 | 204 | 26.0% |
| $150,000 to $199,999 | 116 | 14.8% |
| $200,000+ | 126 | 16.0% |
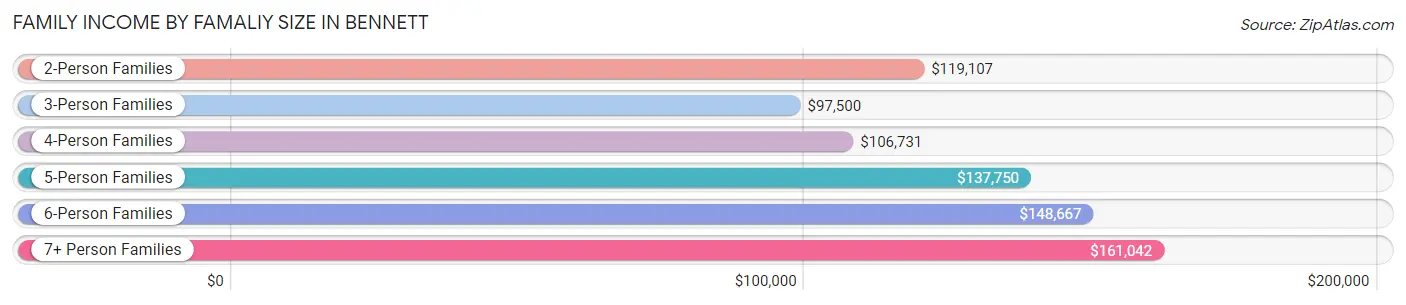
Family Income by Famaliy Size in Bennett
7+ person families (25 | 3.2%) account for the highest median family income in Bennett with $161,042 per family, while 2-person families (225 | 28.6%) have the highest median income of $59,554 per family member.
| Income Bracket | # Families | Median Income |
| 2-Person Families | 225 (28.6%) | $119,107 |
| 3-Person Families | 180 (22.9%) | $97,500 |
| 4-Person Families | 242 (30.8%) | $106,731 |
| 5-Person Families | 92 (11.7%) | $137,750 |
| 6-Person Families | 22 (2.8%) | $148,667 |
| 7+ Person Families | 25 (3.2%) | $161,042 |
| Total | 786 (100.0%) | $110,781 |
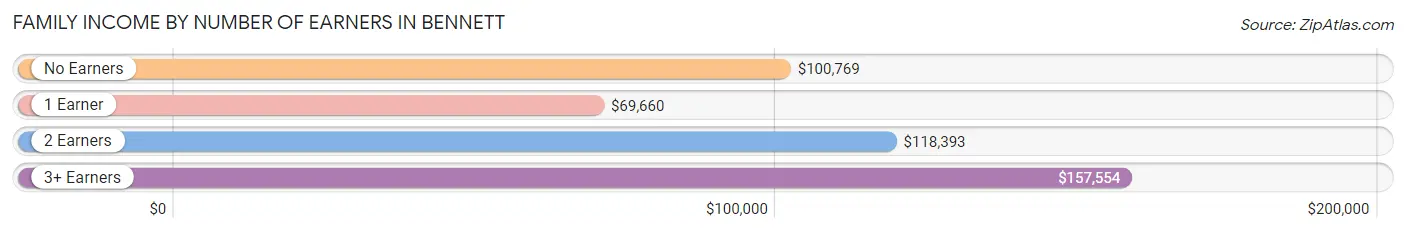
Family Income by Number of Earners in Bennett
The median family income in Bennett is $110,781, with families comprising 3+ earners (183) having the highest median family income of $157,554, while families with 1 earner (378) have the lowest median family income of $69,660, accounting for 23.3% and 48.1% of families, respectively.
| Number of Earners | # Families | Median Income |
| No Earners | 18 (2.3%) | $100,769 |
| 1 Earner | 378 (48.1%) | $69,660 |
| 2 Earners | 207 (26.3%) | $118,393 |
| 3+ Earners | 183 (23.3%) | $157,554 |
| Total | 786 (100.0%) | $110,781 |
Household Income in Bennett
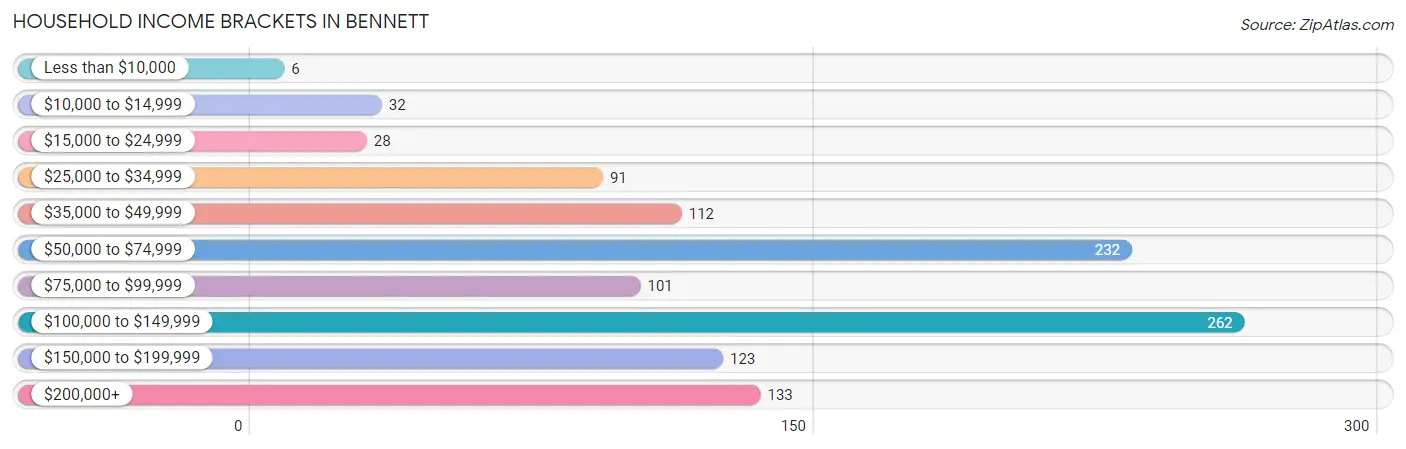
Household Income Brackets in Bennett
With 262 households falling in the category, the $100,000 to $149,999 income range is the most frequent in Bennett, accounting for 23.4% of all households. In contrast, only 6 households (0.5%) fall into the less than $10,000 income bracket, making it the least populous group.
| Income Bracket | # Households | % Households |
| Less than $10,000 | 6 | 0.5% |
| $10,000 to $14,999 | 32 | 2.9% |
| $15,000 to $24,999 | 28 | 2.5% |
| $25,000 to $34,999 | 91 | 8.1% |
| $35,000 to $49,999 | 112 | 10.0% |
| $50,000 to $74,999 | 232 | 20.7% |
| $75,000 to $99,999 | 101 | 9.0% |
| $100,000 to $149,999 | 262 | 23.4% |
| $150,000 to $199,999 | 123 | 11.0% |
| $200,000+ | 133 | 11.9% |
Household Income by Householder Age in Bennett
The median household income in Bennett is $82,035, with the highest median household income of $136,681 found in the 45 to 64 years age bracket for the primary householder. A total of 363 households (32.4%) fall into this category. Meanwhile, the 65+ years age bracket for the primary householder has the lowest median household income of $0, with 211 households (18.8%) in this group.
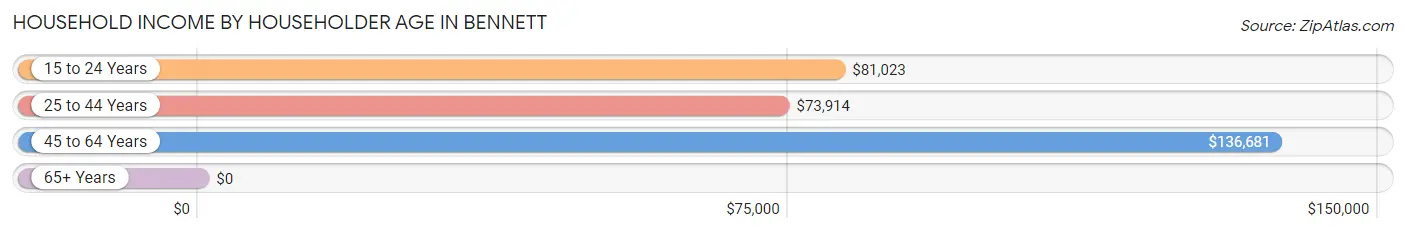
| Income Bracket | # Households | Median Income |
| 15 to 24 Years | 39 (3.5%) | $81,023 |
| 25 to 44 Years | 507 (45.3%) | $73,914 |
| 45 to 64 Years | 363 (32.4%) | $136,681 |
| 65+ Years | 211 (18.8%) | $0 |
| Total | 1,120 (100.0%) | $82,035 |
Poverty in Bennett
Income Below Poverty by Sex and Age in Bennett
With 4.3% poverty level for males and 8.9% for females among the residents of Bennett, under 5 year old males and 16 and 17 year old females are the most vulnerable to poverty, with 33 males (41.2%) and 17 females (24.6%) in their respective age groups living below the poverty level.
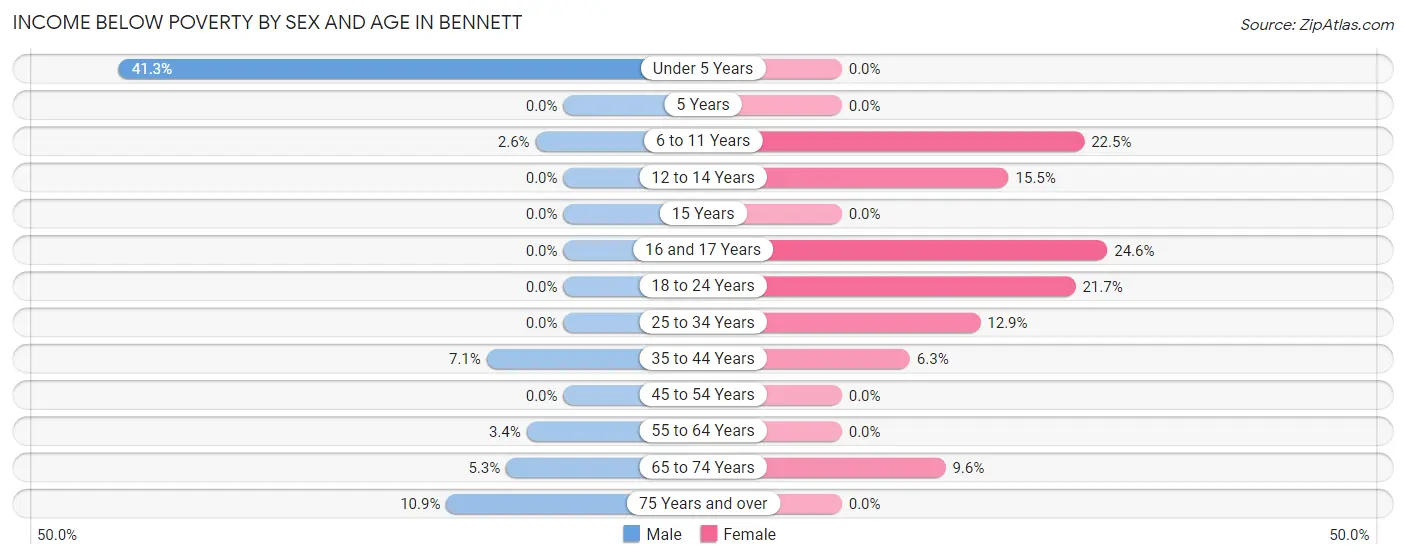
| Age Bracket | Male | Female |
| Under 5 Years | 33 (41.2%) | 0 (0.0%) |
| 5 Years | 0 (0.0%) | 0 (0.0%) |
| 6 to 11 Years | 3 (2.6%) | 36 (22.5%) |
| 12 to 14 Years | 0 (0.0%) | 13 (15.5%) |
| 15 Years | 0 (0.0%) | 0 (0.0%) |
| 16 and 17 Years | 0 (0.0%) | 17 (24.6%) |
| 18 to 24 Years | 0 (0.0%) | 18 (21.7%) |
| 25 to 34 Years | 0 (0.0%) | 40 (12.9%) |
| 35 to 44 Years | 19 (7.1%) | 12 (6.3%) |
| 45 to 54 Years | 0 (0.0%) | 0 (0.0%) |
| 55 to 64 Years | 9 (3.4%) | 0 (0.0%) |
| 65 to 74 Years | 5 (5.3%) | 5 (9.6%) |
| 75 Years and over | 5 (10.9%) | 0 (0.0%) |
| Total | 74 (4.3%) | 141 (8.9%) |
Income Above Poverty by Sex and Age in Bennett
According to the poverty statistics in Bennett, males aged 5 years and females aged under 5 years are the age groups that are most secure financially, with 100.0% of males and 100.0% of females in these age groups living above the poverty line.
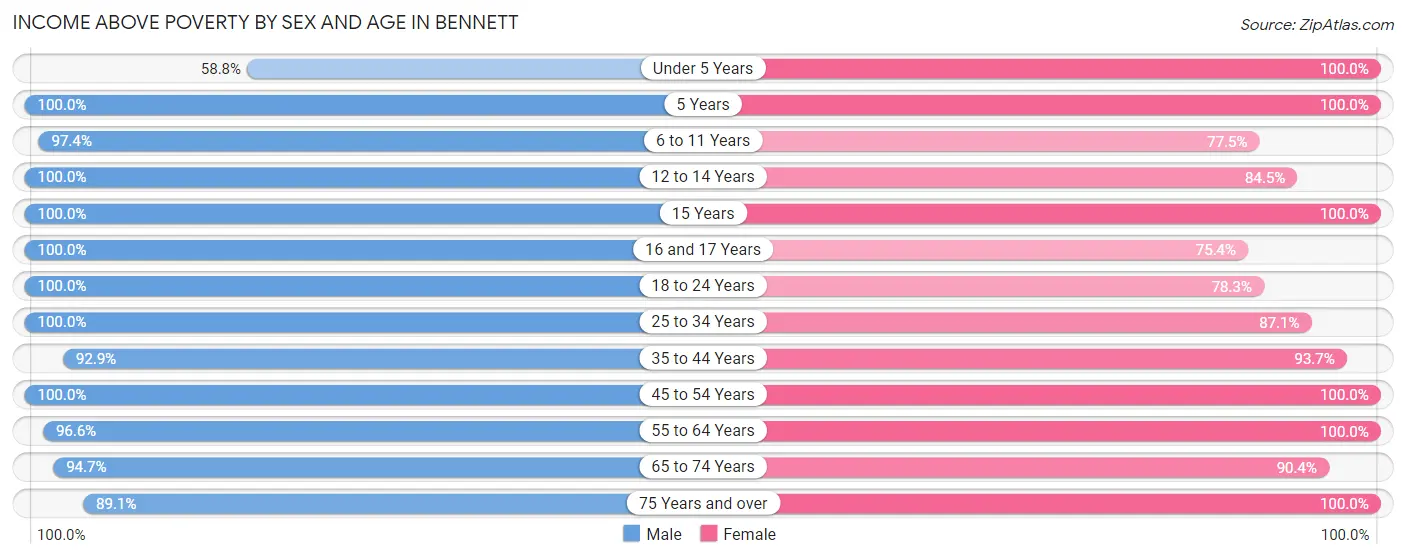
| Age Bracket | Male | Female |
| Under 5 Years | 47 (58.8%) | 102 (100.0%) |
| 5 Years | 18 (100.0%) | 19 (100.0%) |
| 6 to 11 Years | 113 (97.4%) | 124 (77.5%) |
| 12 to 14 Years | 81 (100.0%) | 71 (84.5%) |
| 15 Years | 23 (100.0%) | 15 (100.0%) |
| 16 and 17 Years | 106 (100.0%) | 52 (75.4%) |
| 18 to 24 Years | 196 (100.0%) | 65 (78.3%) |
| 25 to 34 Years | 201 (100.0%) | 271 (87.1%) |
| 35 to 44 Years | 248 (92.9%) | 178 (93.7%) |
| 45 to 54 Years | 208 (100.0%) | 152 (100.0%) |
| 55 to 64 Years | 255 (96.6%) | 250 (100.0%) |
| 65 to 74 Years | 89 (94.7%) | 47 (90.4%) |
| 75 Years and over | 41 (89.1%) | 103 (100.0%) |
| Total | 1,626 (95.7%) | 1,449 (91.1%) |
Income Below Poverty Among Married-Couple Families in Bennett
The poverty statistics for married-couple families in Bennett show that 3.5% or 21 of the total 604 families live below the poverty line. Families with 3 or 4 children have the highest poverty rate of 21.1%, comprising of 11 families. On the other hand, families with no children have the lowest poverty rate of 0.0%, which includes 0 families.
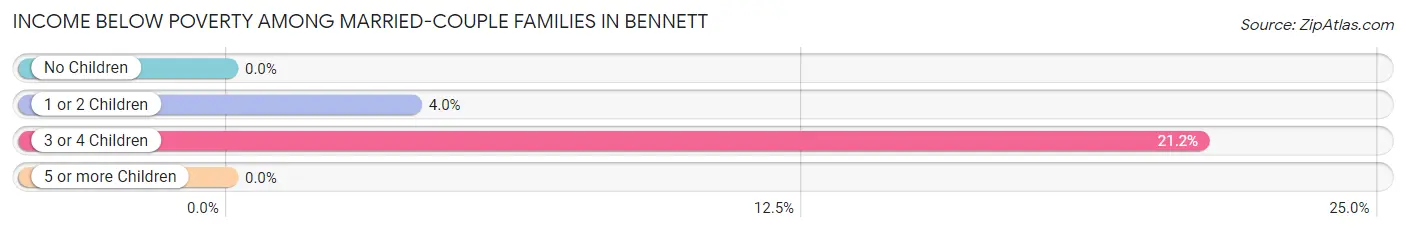
| Children | Above Poverty | Below Poverty |
| No Children | 293 (100.0%) | 0 (0.0%) |
| 1 or 2 Children | 240 (96.0%) | 10 (4.0%) |
| 3 or 4 Children | 41 (78.8%) | 11 (21.1%) |
| 5 or more Children | 9 (100.0%) | 0 (0.0%) |
| Total | 583 (96.5%) | 21 (3.5%) |
Income Below Poverty Among Single-Parent Households in Bennett
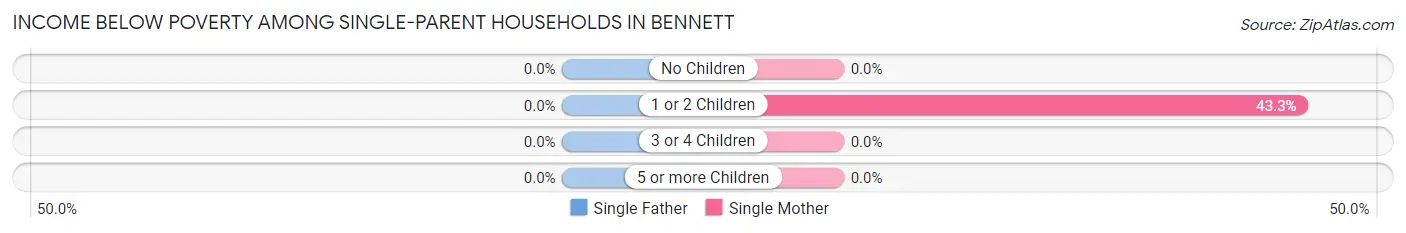
| Children | Single Father | Single Mother |
| No Children | 0 (0.0%) | 0 (0.0%) |
| 1 or 2 Children | 0 (0.0%) | 29 (43.3%) |
| 3 or 4 Children | 0 (0.0%) | 0 (0.0%) |
| 5 or more Children | 0 (0.0%) | 0 (0.0%) |
| Total | 0 (0.0%) | 29 (36.2%) |
Income Below Poverty Among Married-Couple vs Single-Parent Households in Bennett
The poverty data for Bennett shows that 21 of the married-couple family households (3.5%) and 29 of the single-parent households (15.9%) are living below the poverty level. Within the married-couple family households, those with 3 or 4 children have the highest poverty rate, with 11 households (21.1%) falling below the poverty line. Among the single-parent households, those with 1 or 2 children have the highest poverty rate, with 29 household (19.6%) living below poverty.
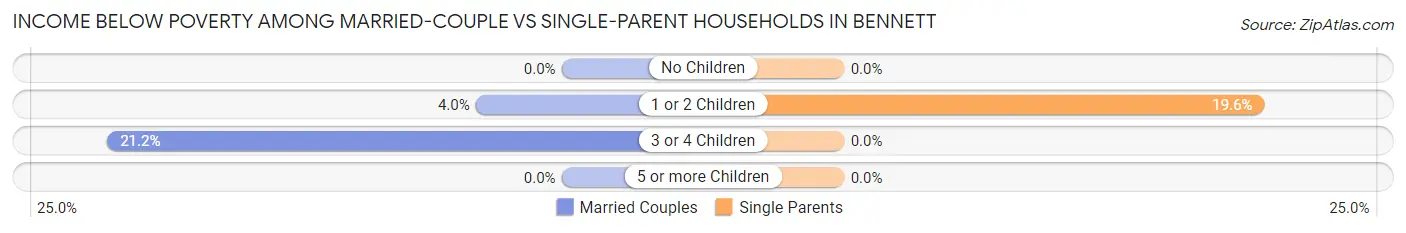
| Children | Married-Couple Families | Single-Parent Households |
| No Children | 0 (0.0%) | 0 (0.0%) |
| 1 or 2 Children | 10 (4.0%) | 29 (19.6%) |
| 3 or 4 Children | 11 (21.1%) | 0 (0.0%) |
| 5 or more Children | 0 (0.0%) | 0 (0.0%) |
| Total | 21 (3.5%) | 29 (15.9%) |
Race in Bennett
The most populous races in Bennett are White / Caucasian (2,616 | 79.3%), Hispanic or Latino (589 | 17.8%), and Two or more Races (320 | 9.7%).
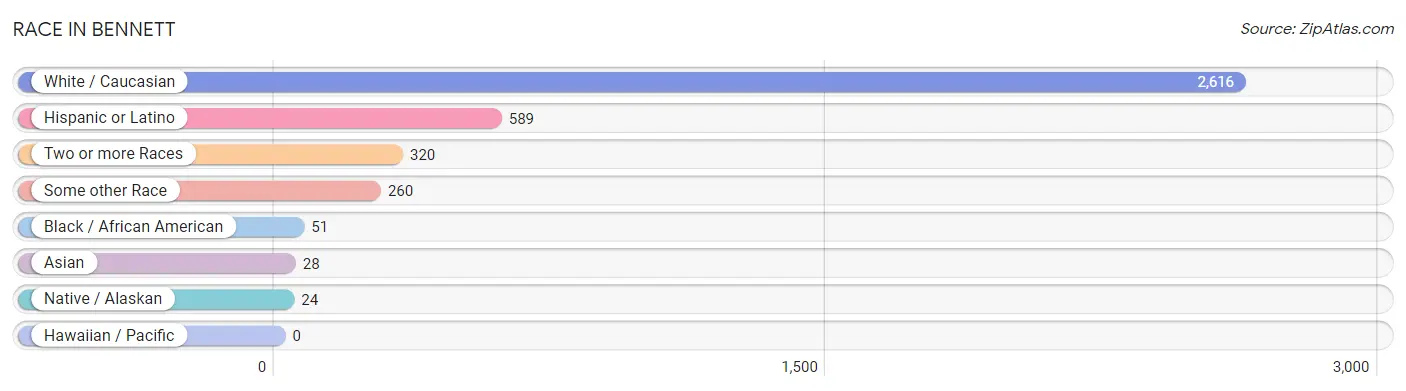
| Race | # Population | % Population |
| Asian | 28 | 0.9% |
| Black / African American | 51 | 1.5% |
| Hawaiian / Pacific | 0 | 0.0% |
| Hispanic or Latino | 589 | 17.8% |
| Native / Alaskan | 24 | 0.7% |
| White / Caucasian | 2,616 | 79.3% |
| Two or more Races | 320 | 9.7% |
| Some other Race | 260 | 7.9% |
| Total | 3,299 | 100.0% |
Ancestry in Bennett
The most populous ancestries reported in Bennett are Mexican (541 | 16.4%), German (480 | 14.5%), Irish (179 | 5.4%), French (123 | 3.7%), and English (122 | 3.7%), together accounting for 43.8% of all Bennett residents.
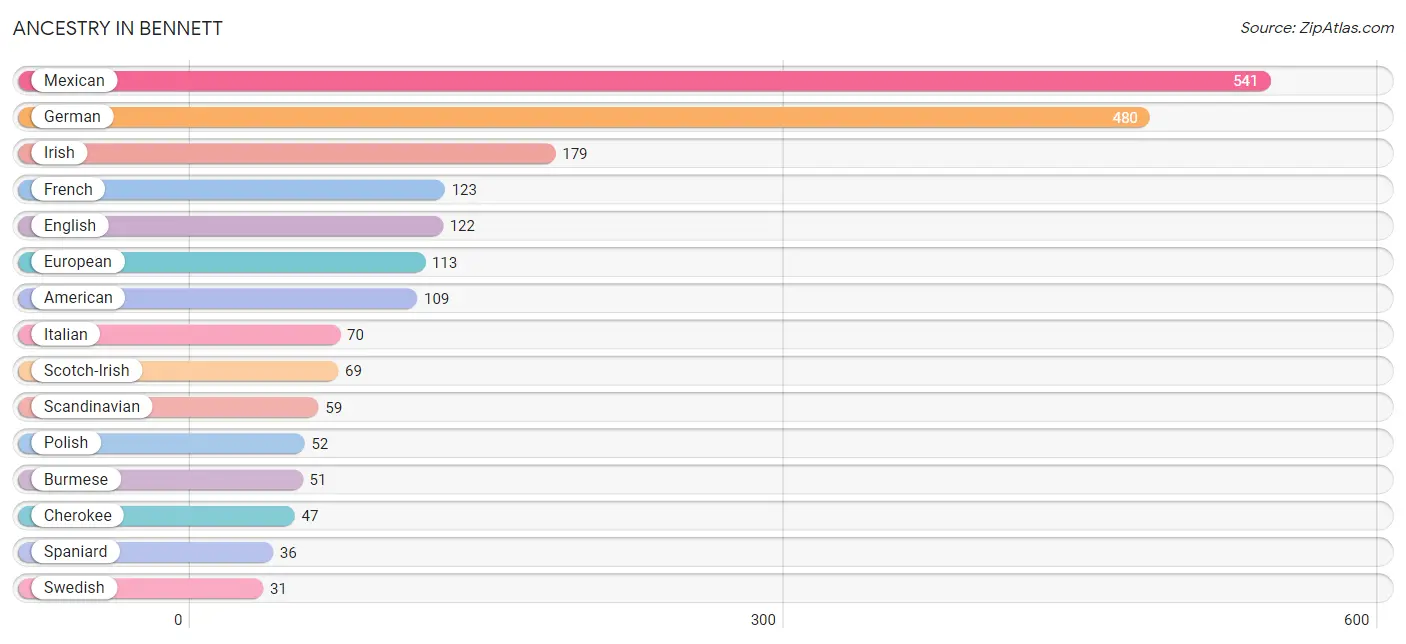
| Ancestry | # Population | % Population |
| American | 109 | 3.3% |
| Apache | 4 | 0.1% |
| Arab | 5 | 0.2% |
| Basque | 4 | 0.1% |
| Bhutanese | 26 | 0.8% |
| Brazilian | 9 | 0.3% |
| Burmese | 51 | 1.5% |
| Cherokee | 47 | 1.4% |
| Cree | 2 | 0.1% |
| Cuban | 7 | 0.2% |
| Czech | 13 | 0.4% |
| Danish | 14 | 0.4% |
| Dutch | 25 | 0.8% |
| English | 122 | 3.7% |
| European | 113 | 3.4% |
| French | 123 | 3.7% |
| French Canadian | 18 | 0.5% |
| German | 480 | 14.5% |
| Indian (Asian) | 9 | 0.3% |
| Irish | 179 | 5.4% |
| Italian | 70 | 2.1% |
| Korean | 17 | 0.5% |
| Lebanese | 5 | 0.2% |
| Mexican | 541 | 16.4% |
| Mexican American Indian | 13 | 0.4% |
| Norwegian | 12 | 0.4% |
| Polish | 52 | 1.6% |
| Russian | 6 | 0.2% |
| Scandinavian | 59 | 1.8% |
| Scotch-Irish | 69 | 2.1% |
| Scottish | 21 | 0.6% |
| Shoshone | 8 | 0.2% |
| Slovene | 6 | 0.2% |
| Spaniard | 36 | 1.1% |
| Spanish | 5 | 0.2% |
| Swedish | 31 | 0.9% |
| Ukrainian | 11 | 0.3% |
| Welsh | 31 | 0.9% | View All 38 Rows |
Immigrants in Bennett
The most numerous immigrant groups reported in Bennett came from Latin America (144 | 4.4%), Central America (140 | 4.2%), Mexico (140 | 4.2%), Asia (59 | 1.8%), and China (38 | 1.1%), together accounting for 15.8% of all Bennett residents.
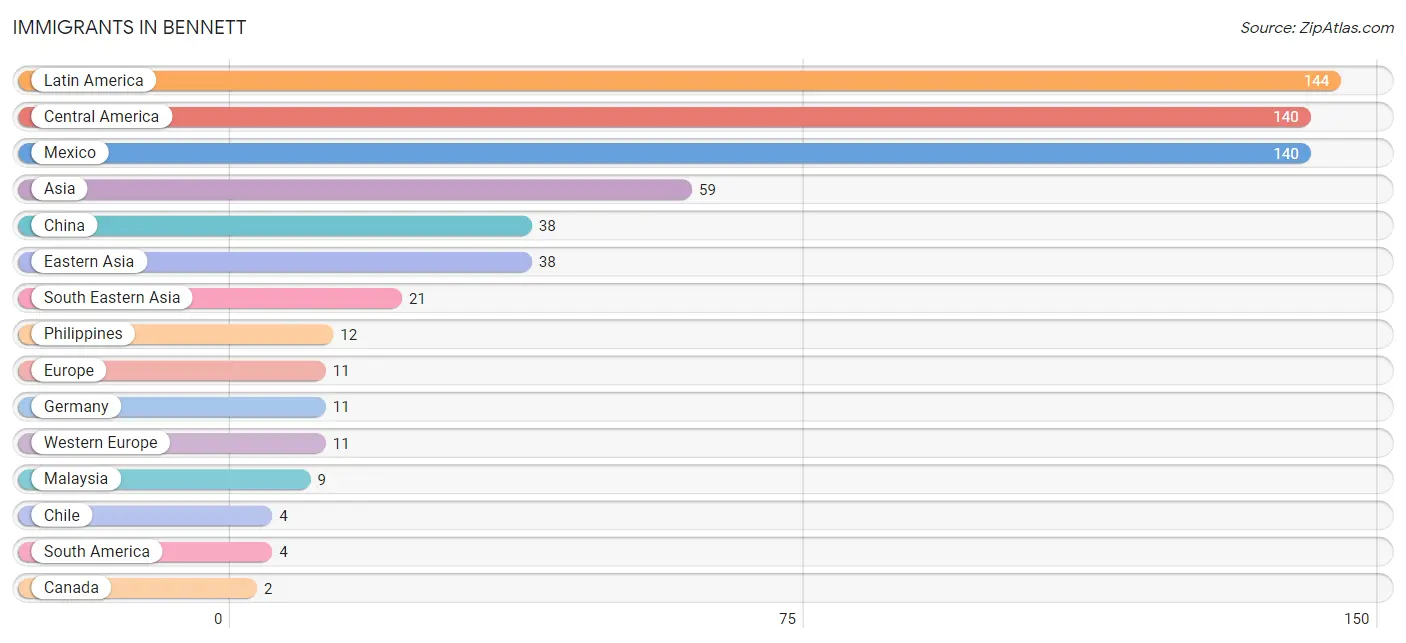
| Immigration Origin | # Population | % Population |
| Asia | 59 | 1.8% |
| Canada | 2 | 0.1% |
| Central America | 140 | 4.2% |
| Chile | 4 | 0.1% |
| China | 38 | 1.1% |
| Eastern Asia | 38 | 1.1% |
| Europe | 11 | 0.3% |
| Germany | 11 | 0.3% |
| Latin America | 144 | 4.4% |
| Malaysia | 9 | 0.3% |
| Mexico | 140 | 4.2% |
| Philippines | 12 | 0.4% |
| South America | 4 | 0.1% |
| South Eastern Asia | 21 | 0.6% |
| Western Europe | 11 | 0.3% | View All 15 Rows |
Sex and Age in Bennett
Sex and Age in Bennett
The most populous age groups in Bennett are 15 to 19 Years (187 | 11.0%) for men and 30 to 34 Years (161 | 10.1%) for women.
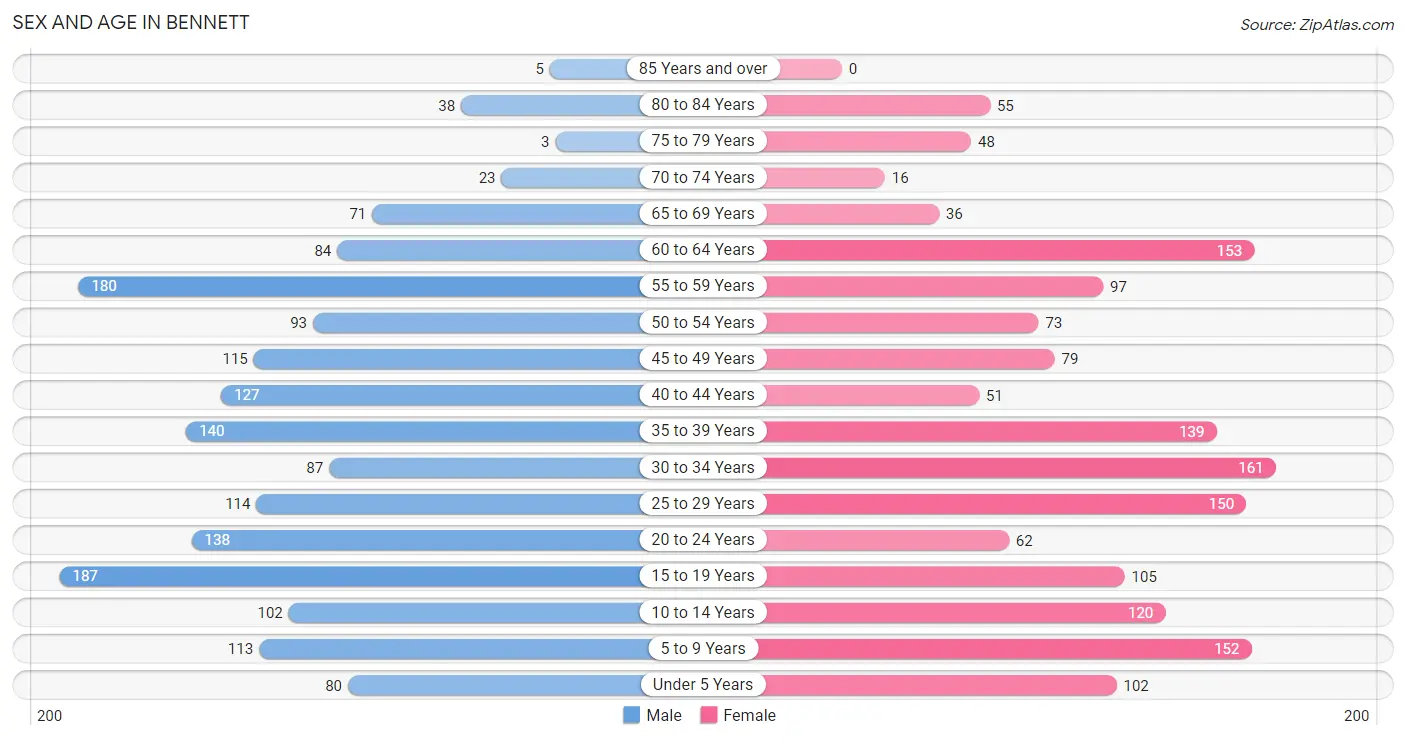
| Age Bracket | Male | Female |
| Under 5 Years | 80 (4.7%) | 102 (6.4%) |
| 5 to 9 Years | 113 (6.7%) | 152 (9.5%) |
| 10 to 14 Years | 102 (6.0%) | 120 (7.5%) |
| 15 to 19 Years | 187 (11.0%) | 105 (6.6%) |
| 20 to 24 Years | 138 (8.1%) | 62 (3.9%) |
| 25 to 29 Years | 114 (6.7%) | 150 (9.4%) |
| 30 to 34 Years | 87 (5.1%) | 161 (10.1%) |
| 35 to 39 Years | 140 (8.2%) | 139 (8.7%) |
| 40 to 44 Years | 127 (7.5%) | 51 (3.2%) |
| 45 to 49 Years | 115 (6.8%) | 79 (4.9%) |
| 50 to 54 Years | 93 (5.5%) | 73 (4.6%) |
| 55 to 59 Years | 180 (10.6%) | 97 (6.1%) |
| 60 to 64 Years | 84 (4.9%) | 153 (9.6%) |
| 65 to 69 Years | 71 (4.2%) | 36 (2.2%) |
| 70 to 74 Years | 23 (1.3%) | 16 (1.0%) |
| 75 to 79 Years | 3 (0.2%) | 48 (3.0%) |
| 80 to 84 Years | 38 (2.2%) | 55 (3.4%) |
| 85 Years and over | 5 (0.3%) | 0 (0.0%) |
| Total | 1,700 (100.0%) | 1,599 (100.0%) |
Families and Households in Bennett
Median Family Size in Bennett
The median family size in Bennett is 3.55 persons per family, with single female/mother families (80 | 10.2%) accounting for the largest median family size of 3.95 persons per family. On the other hand, single male/father families (102 | 13.0%) represent the smallest median family size with 2.78 persons per family.
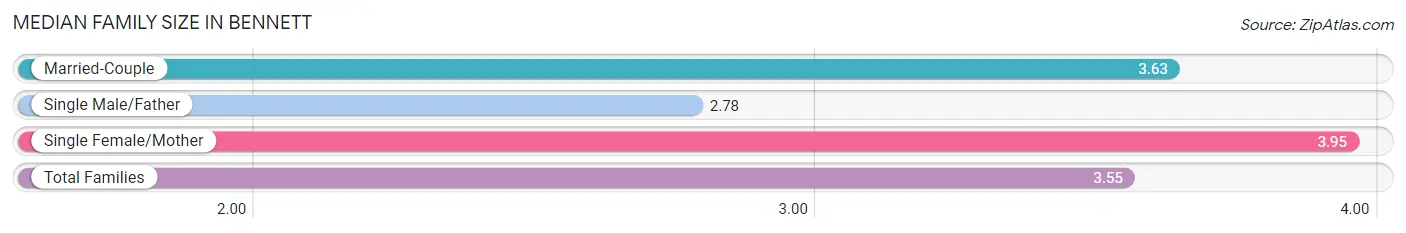
| Family Type | # Families | Family Size |
| Married-Couple | 604 (76.8%) | 3.63 |
| Single Male/Father | 102 (13.0%) | 2.78 |
| Single Female/Mother | 80 (10.2%) | 3.95 |
| Total Families | 786 (100.0%) | 3.55 |
Median Household Size in Bennett
The median household size in Bennett is 2.95 persons per household, with single female/mother households (80 | 7.1%) accounting for the largest median household size of 4.78 persons per household. non-family households (334 | 29.8%) represent the smallest median household size with 1.21 persons per household.
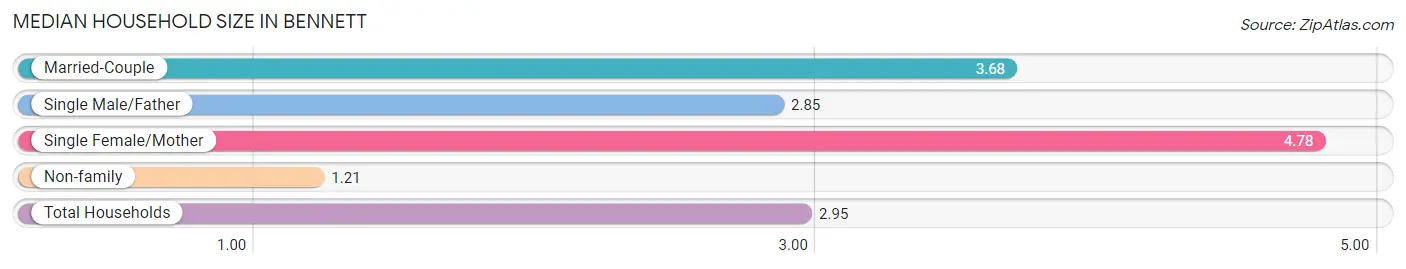
| Household Type | # Households | Household Size |
| Married-Couple | 604 (53.9%) | 3.68 |
| Single Male/Father | 102 (9.1%) | 2.85 |
| Single Female/Mother | 80 (7.1%) | 4.78 |
| Non-family | 334 (29.8%) | 1.21 |
| Total Households | 1,120 (100.0%) | 2.95 |
Household Size by Marriage Status in Bennett
Out of a total of 1,120 households in Bennett, 786 (70.2%) are family households, while 334 (29.8%) are nonfamily households. The most numerous type of family households are 4-person households, comprising 313, and the most common type of nonfamily households are 1-person households, comprising 268.
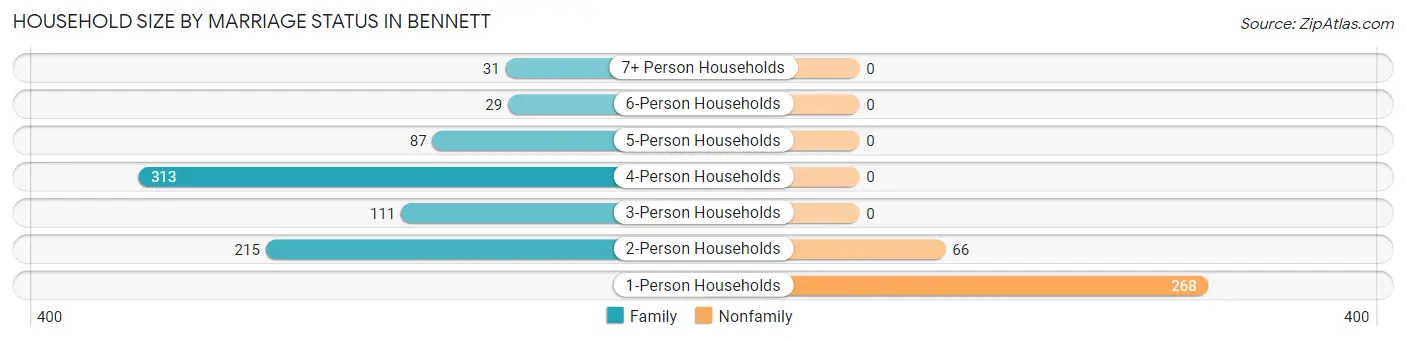
| Household Size | Family Households | Nonfamily Households |
| 1-Person Households | - | 268 (23.9%) |
| 2-Person Households | 215 (19.2%) | 66 (5.9%) |
| 3-Person Households | 111 (9.9%) | 0 (0.0%) |
| 4-Person Households | 313 (28.0%) | 0 (0.0%) |
| 5-Person Households | 87 (7.8%) | 0 (0.0%) |
| 6-Person Households | 29 (2.6%) | 0 (0.0%) |
| 7+ Person Households | 31 (2.8%) | 0 (0.0%) |
| Total | 786 (70.2%) | 334 (29.8%) |
Female Fertility in Bennett
Fertility by Age in Bennett
Average fertility rate in Bennett is 14.0 births per 1,000 women. Women in the age bracket of 20 to 34 years have the highest fertility rate with 29.0 births per 1,000 women. Women in the age bracket of 20 to 34 years acount for 100.0% of all women with births.
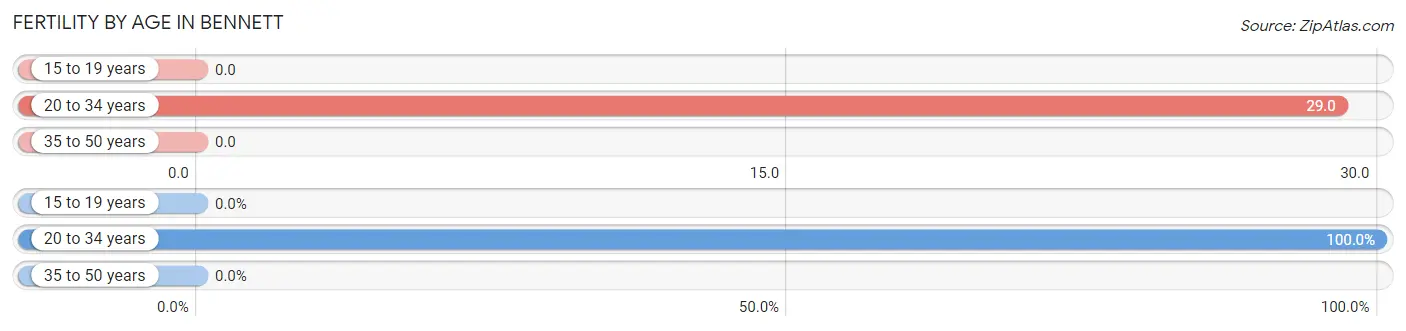
| Age Bracket | Women with Births | Births / 1,000 Women |
| 15 to 19 years | 0 (0.0%) | 0.0 |
| 20 to 34 years | 11 (100.0%) | 29.0 |
| 35 to 50 years | 0 (0.0%) | 0.0 |
| Total | 11 (100.0%) | 14.0 |
Fertility by Age by Marriage Status in Bennett
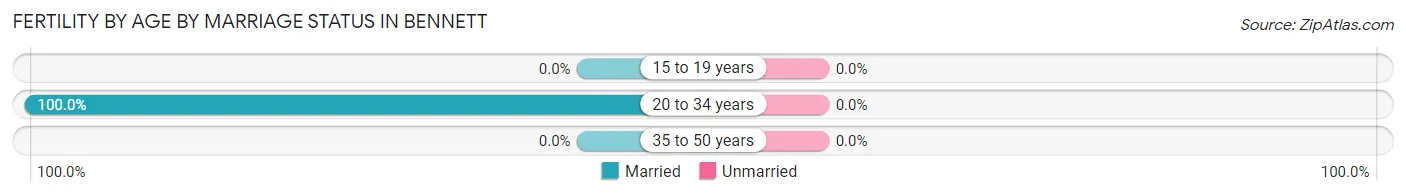
| Age Bracket | Married | Unmarried |
| 15 to 19 years | 0 (0.0%) | 0 (0.0%) |
| 20 to 34 years | 11 (100.0%) | 0 (0.0%) |
| 35 to 50 years | 0 (0.0%) | 0 (0.0%) |
| Total | 11 (100.0%) | 0 (0.0%) |
Fertility by Education in Bennett
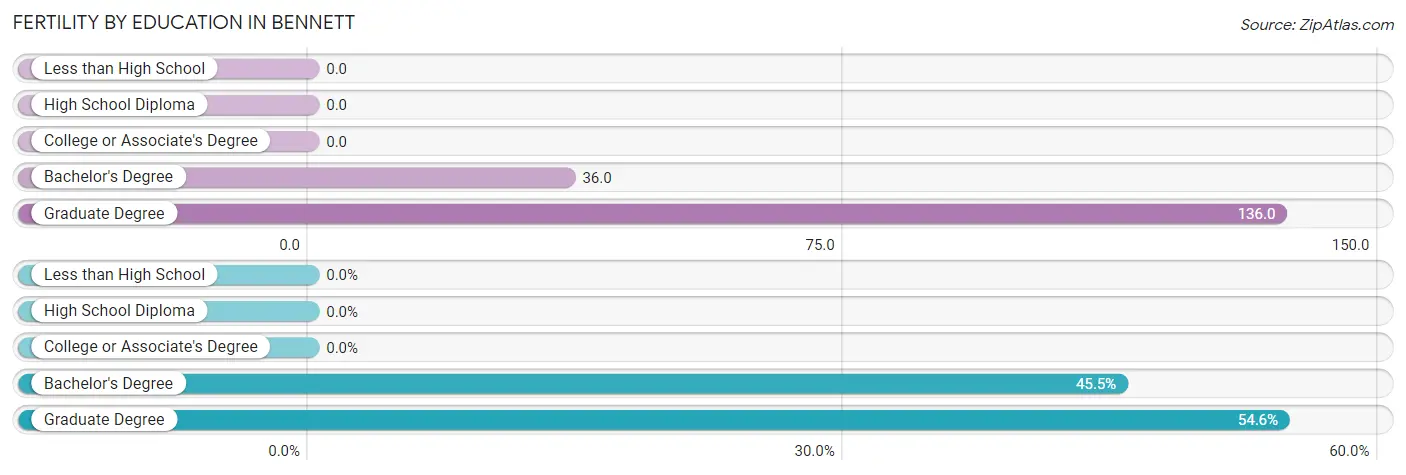
| Educational Attainment | Women with Births | Births / 1,000 Women |
| Less than High School | 0 (0.0%) | 0.0 |
| High School Diploma | 0 (0.0%) | 0.0 |
| College or Associate's Degree | 0 (0.0%) | 0.0 |
| Bachelor's Degree | 5 (45.5%) | 36.0 |
| Graduate Degree | 6 (54.5%) | 136.0 |
| Total | 11 (100.0%) | 14.0 |
Fertility by Education by Marriage Status in Bennett
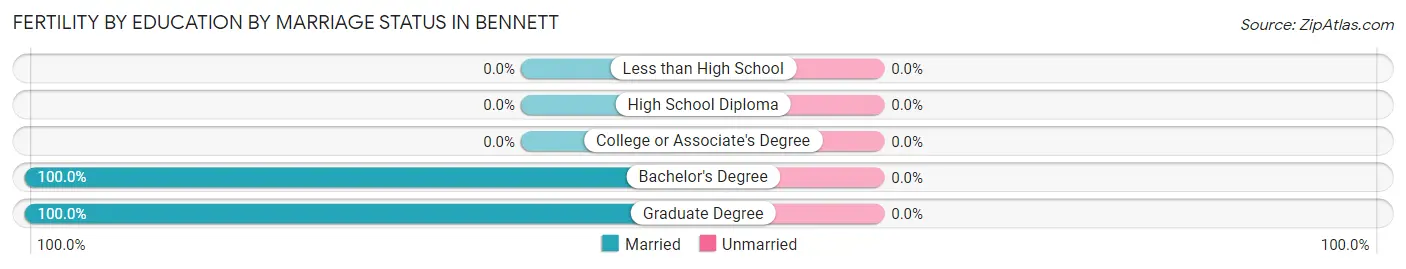
| Educational Attainment | Married | Unmarried |
| Less than High School | 0 (0.0%) | 0 (0.0%) |
| High School Diploma | 0 (0.0%) | 0 (0.0%) |
| College or Associate's Degree | 0 (0.0%) | 0 (0.0%) |
| Bachelor's Degree | 5 (100.0%) | 0 (0.0%) |
| Graduate Degree | 6 (100.0%) | 0 (0.0%) |
| Total | 11 (100.0%) | 0 (0.0%) |
Employment Characteristics in Bennett
Employment by Class of Employer in Bennett
Among the 1,661 employed individuals in Bennett, private company employees (1,009 | 60.8%), self-employed (incorporated) (169 | 10.2%), and local government employees (129 | 7.8%) make up the most common classes of employment.
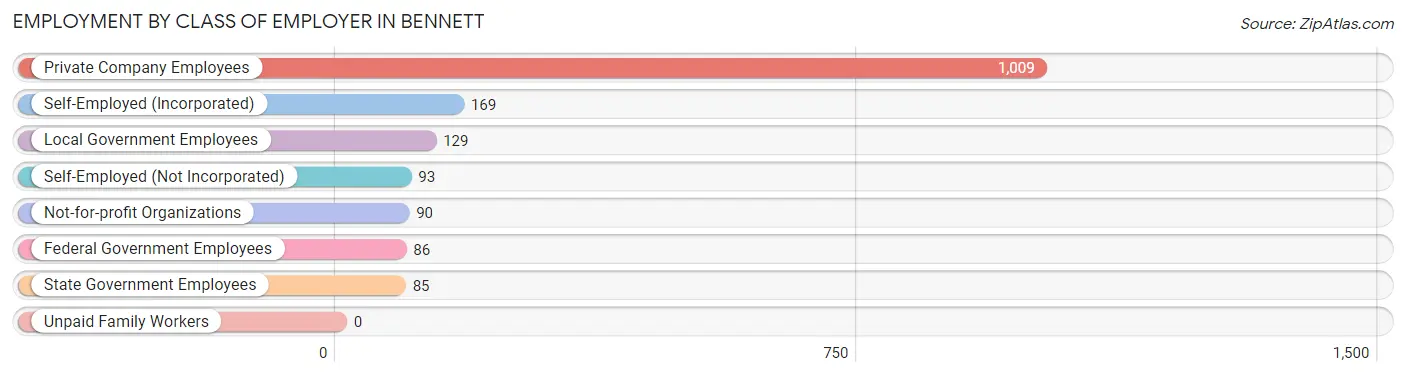
| Employer Class | # Employees | % Employees |
| Private Company Employees | 1,009 | 60.8% |
| Self-Employed (Incorporated) | 169 | 10.2% |
| Self-Employed (Not Incorporated) | 93 | 5.6% |
| Not-for-profit Organizations | 90 | 5.4% |
| Local Government Employees | 129 | 7.8% |
| State Government Employees | 85 | 5.1% |
| Federal Government Employees | 86 | 5.2% |
| Unpaid Family Workers | 0 | 0.0% |
| Total | 1,661 | 100.0% |
Employment Status by Age in Bennett
According to the labor force statistics for Bennett, out of the total population over 16 years of age (2,592), 67.1% or 1,739 individuals are in the labor force, with 2.3% or 40 of them unemployed. The age group with the highest labor force participation rate is 20 to 24 years, with 93.0% or 186 individuals in the labor force. Within the labor force, the 25 to 29 years age range has the highest percentage of unemployed individuals, with 13.3% or 23 of them being unemployed.
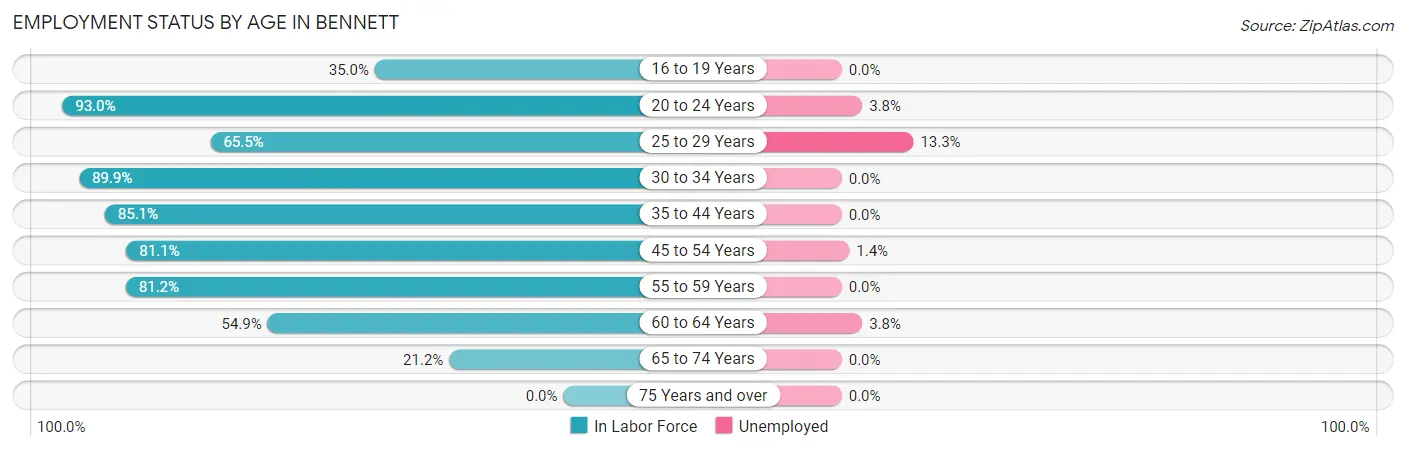
| Age Bracket | In Labor Force | Unemployed |
| 16 to 19 Years | 89 (35.0%) | 0 (0.0%) |
| 20 to 24 Years | 186 (93.0%) | 7 (3.8%) |
| 25 to 29 Years | 173 (65.5%) | 23 (13.3%) |
| 30 to 34 Years | 223 (89.9%) | 0 (0.0%) |
| 35 to 44 Years | 389 (85.1%) | 0 (0.0%) |
| 45 to 54 Years | 292 (81.1%) | 4 (1.4%) |
| 55 to 59 Years | 225 (81.2%) | 0 (0.0%) |
| 60 to 64 Years | 130 (54.9%) | 5 (3.8%) |
| 65 to 74 Years | 31 (21.2%) | 0 (0.0%) |
| 75 Years and over | 0 (0.0%) | 0 (0.0%) |
| Total | 1,739 (67.1%) | 40 (2.3%) |
Employment Status by Educational Attainment in Bennett
According to labor force statistics for Bennett, 77.7% of individuals (1,432) out of the total population between 25 and 64 years of age (1,843) are in the labor force, with 2.3% or 33 of them being unemployed. The group with the highest labor force participation rate are those with the educational attainment of bachelor's degree or higher, with 93.1% or 375 individuals in the labor force. Within the labor force, individuals with college / associate degree education have the highest percentage of unemployment, with 4.6% or 21 of them being unemployed.
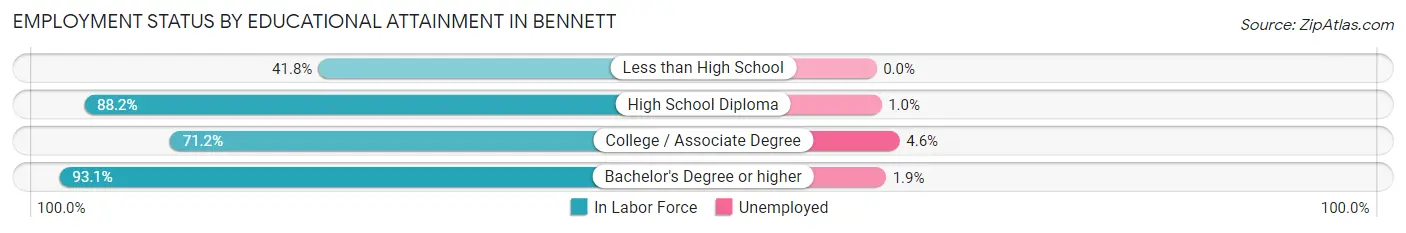
| Educational Attainment | In Labor Force | Unemployed |
| Less than High School | 94 (41.8%) | 0 (0.0%) |
| High School Diploma | 508 (88.2%) | 6 (1.0%) |
| College / Associate Degree | 455 (71.2%) | 29 (4.6%) |
| Bachelor's Degree or higher | 375 (93.1%) | 8 (1.9%) |
| Total | 1,432 (77.7%) | 42 (2.3%) |
Employment Occupations by Sex in Bennett
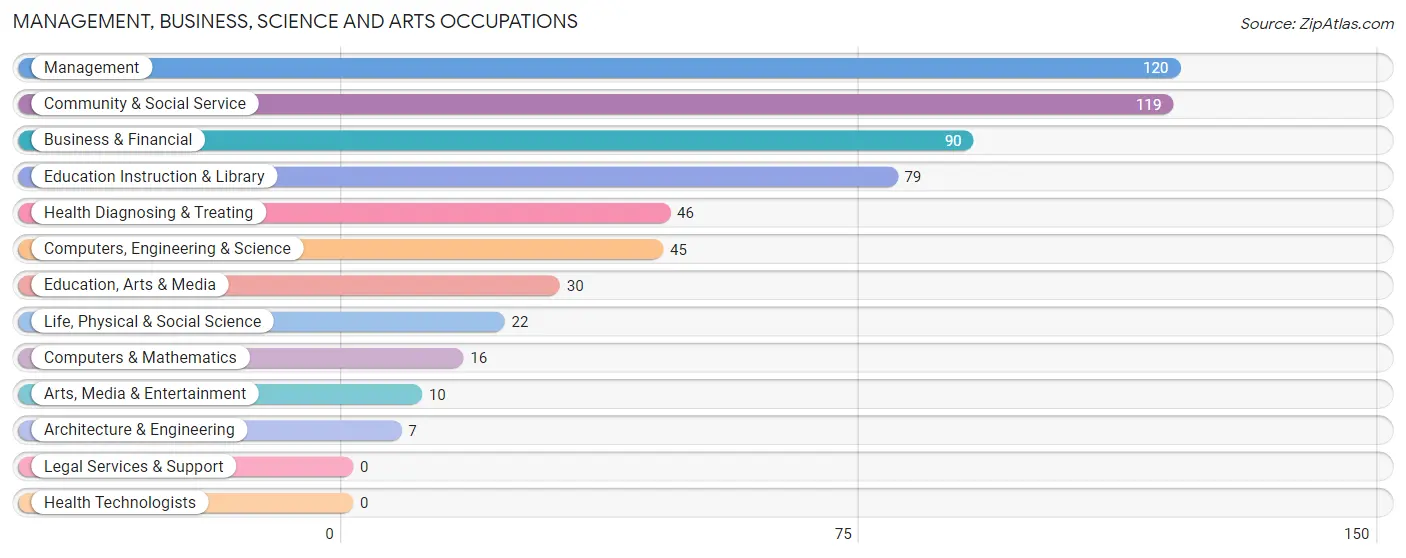
Management, Business, Science and Arts Occupations
The most common Management, Business, Science and Arts occupations in Bennett are Management (120 | 7.2%), Community & Social Service (119 | 7.1%), Business & Financial (90 | 5.4%), Education Instruction & Library (79 | 4.7%), and Health Diagnosing & Treating (46 | 2.8%).
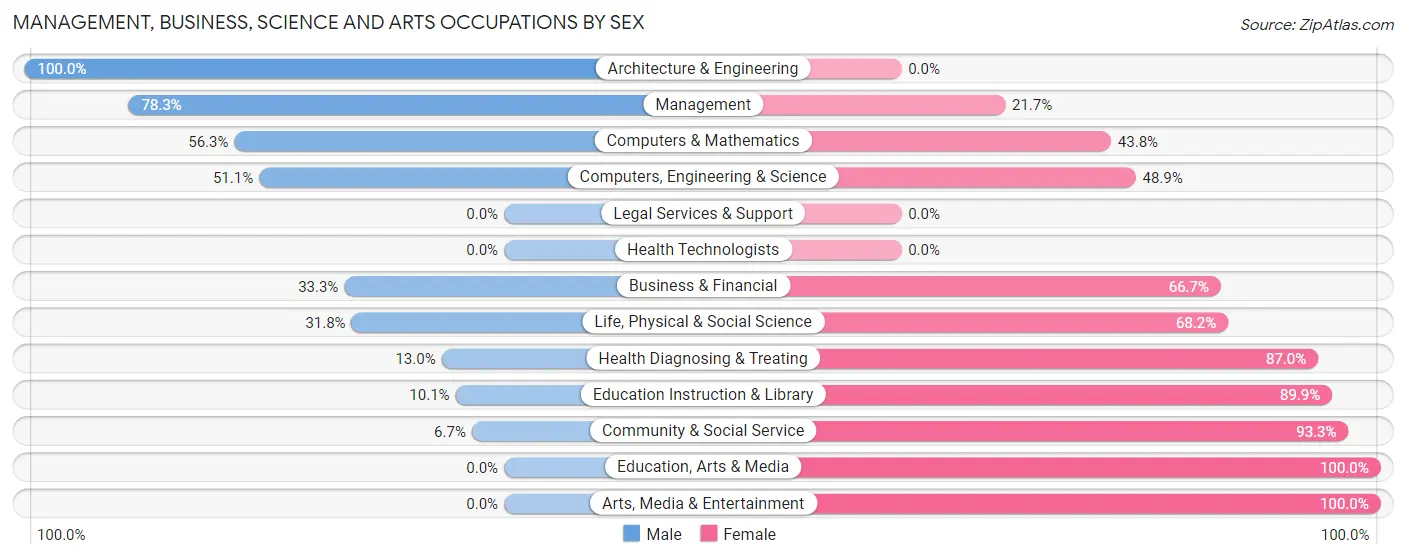
Management, Business, Science and Arts Occupations by Sex
Within the Management, Business, Science and Arts occupations in Bennett, the most male-oriented occupations are Architecture & Engineering (100.0%), Management (78.3%), and Computers & Mathematics (56.2%), while the most female-oriented occupations are Education, Arts & Media (100.0%), Arts, Media & Entertainment (100.0%), and Community & Social Service (93.3%).
| Occupation | Male | Female |
| Management | 94 (78.3%) | 26 (21.7%) |
| Business & Financial | 30 (33.3%) | 60 (66.7%) |
| Computers, Engineering & Science | 23 (51.1%) | 22 (48.9%) |
| Computers & Mathematics | 9 (56.2%) | 7 (43.8%) |
| Architecture & Engineering | 7 (100.0%) | 0 (0.0%) |
| Life, Physical & Social Science | 7 (31.8%) | 15 (68.2%) |
| Community & Social Service | 8 (6.7%) | 111 (93.3%) |
| Education, Arts & Media | 0 (0.0%) | 30 (100.0%) |
| Legal Services & Support | 0 (0.0%) | 0 (0.0%) |
| Education Instruction & Library | 8 (10.1%) | 71 (89.9%) |
| Arts, Media & Entertainment | 0 (0.0%) | 10 (100.0%) |
| Health Diagnosing & Treating | 6 (13.0%) | 40 (87.0%) |
| Health Technologists | 0 (0.0%) | 0 (0.0%) |
| Total (Category) | 161 (38.3%) | 259 (61.7%) |
| Total (Overall) | 990 (59.4%) | 676 (40.6%) |
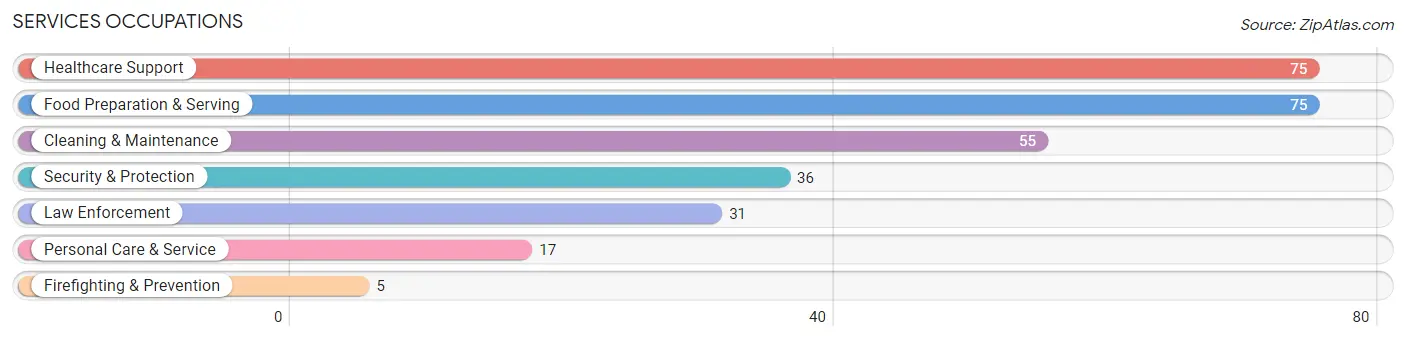
Services Occupations
The most common Services occupations in Bennett are Healthcare Support (75 | 4.5%), Food Preparation & Serving (75 | 4.5%), Cleaning & Maintenance (55 | 3.3%), Security & Protection (36 | 2.2%), and Law Enforcement (31 | 1.9%).
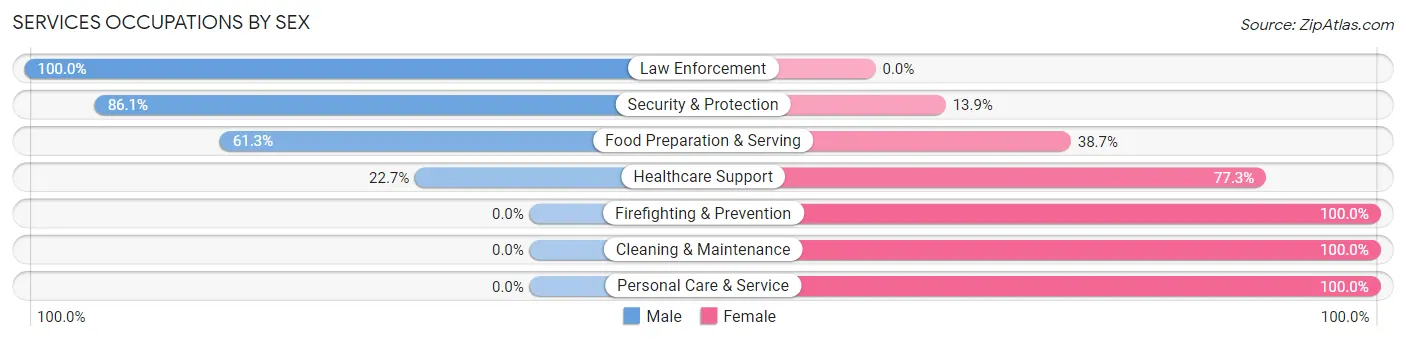
Services Occupations by Sex
Within the Services occupations in Bennett, the most male-oriented occupations are Law Enforcement (100.0%), Security & Protection (86.1%), and Food Preparation & Serving (61.3%), while the most female-oriented occupations are Firefighting & Prevention (100.0%), Cleaning & Maintenance (100.0%), and Personal Care & Service (100.0%).
| Occupation | Male | Female |
| Healthcare Support | 17 (22.7%) | 58 (77.3%) |
| Security & Protection | 31 (86.1%) | 5 (13.9%) |
| Firefighting & Prevention | 0 (0.0%) | 5 (100.0%) |
| Law Enforcement | 31 (100.0%) | 0 (0.0%) |
| Food Preparation & Serving | 46 (61.3%) | 29 (38.7%) |
| Cleaning & Maintenance | 0 (0.0%) | 55 (100.0%) |
| Personal Care & Service | 0 (0.0%) | 17 (100.0%) |
| Total (Category) | 94 (36.4%) | 164 (63.6%) |
| Total (Overall) | 990 (59.4%) | 676 (40.6%) |
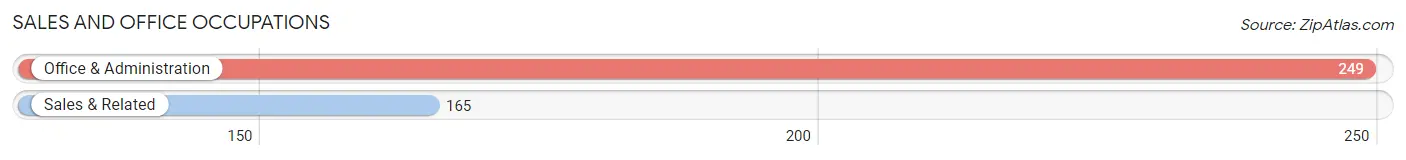
Sales and Office Occupations
The most common Sales and Office occupations in Bennett are Office & Administration (249 | 14.9%), and Sales & Related (165 | 9.9%).
Sales and Office Occupations by Sex
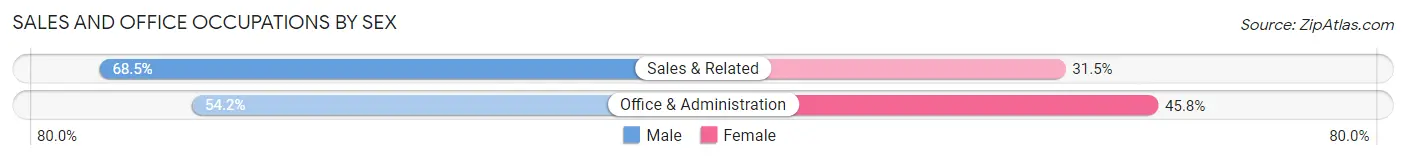
| Occupation | Male | Female |
| Sales & Related | 113 (68.5%) | 52 (31.5%) |
| Office & Administration | 135 (54.2%) | 114 (45.8%) |
| Total (Category) | 248 (59.9%) | 166 (40.1%) |
| Total (Overall) | 990 (59.4%) | 676 (40.6%) |
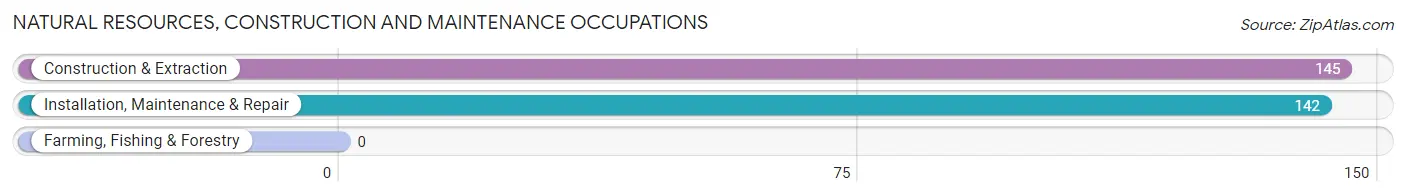
Natural Resources, Construction and Maintenance Occupations
The most common Natural Resources, Construction and Maintenance occupations in Bennett are Construction & Extraction (145 | 8.7%), and Installation, Maintenance & Repair (142 | 8.5%).
Natural Resources, Construction and Maintenance Occupations by Sex
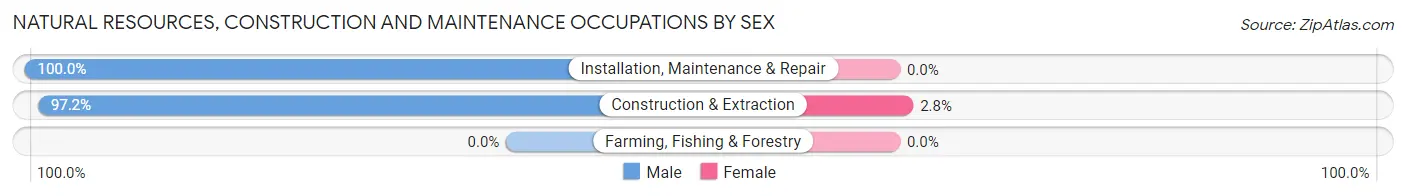
| Occupation | Male | Female |
| Farming, Fishing & Forestry | 0 (0.0%) | 0 (0.0%) |
| Construction & Extraction | 141 (97.2%) | 4 (2.8%) |
| Installation, Maintenance & Repair | 142 (100.0%) | 0 (0.0%) |
| Total (Category) | 283 (98.6%) | 4 (1.4%) |
| Total (Overall) | 990 (59.4%) | 676 (40.6%) |
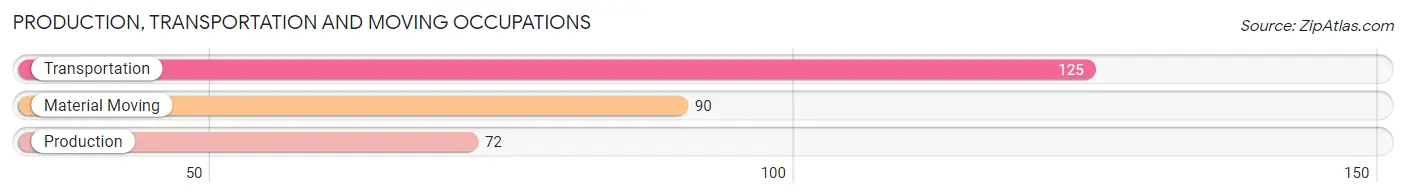
Production, Transportation and Moving Occupations
The most common Production, Transportation and Moving occupations in Bennett are Transportation (125 | 7.5%), Material Moving (90 | 5.4%), and Production (72 | 4.3%).
Production, Transportation and Moving Occupations by Sex
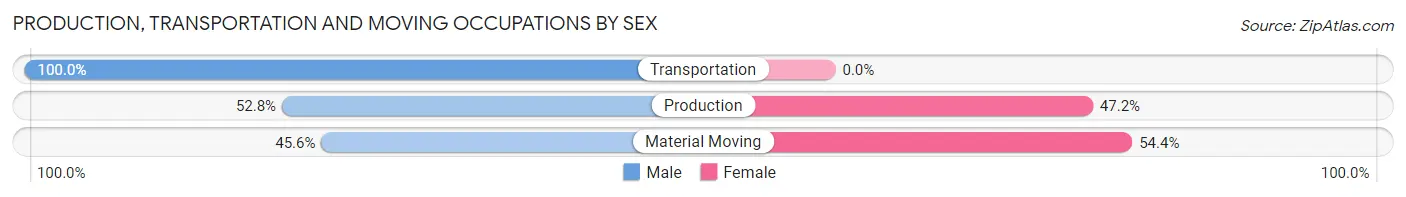
| Occupation | Male | Female |
| Production | 38 (52.8%) | 34 (47.2%) |
| Transportation | 125 (100.0%) | 0 (0.0%) |
| Material Moving | 41 (45.6%) | 49 (54.4%) |
| Total (Category) | 204 (71.1%) | 83 (28.9%) |
| Total (Overall) | 990 (59.4%) | 676 (40.6%) |
Employment Industries by Sex in Bennett
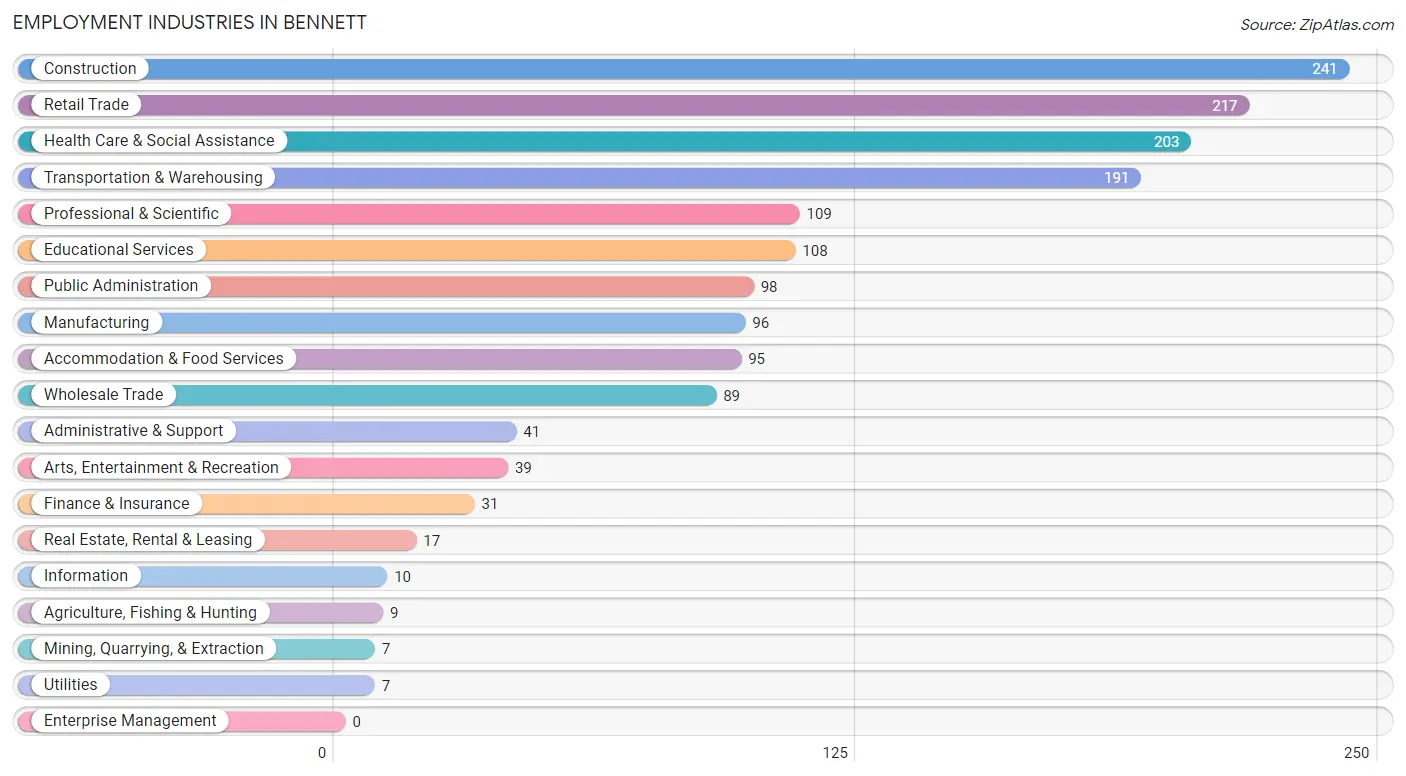
Employment Industries in Bennett
The major employment industries in Bennett include Construction (241 | 14.5%), Retail Trade (217 | 13.0%), Health Care & Social Assistance (203 | 12.2%), Transportation & Warehousing (191 | 11.5%), and Professional & Scientific (109 | 6.5%).
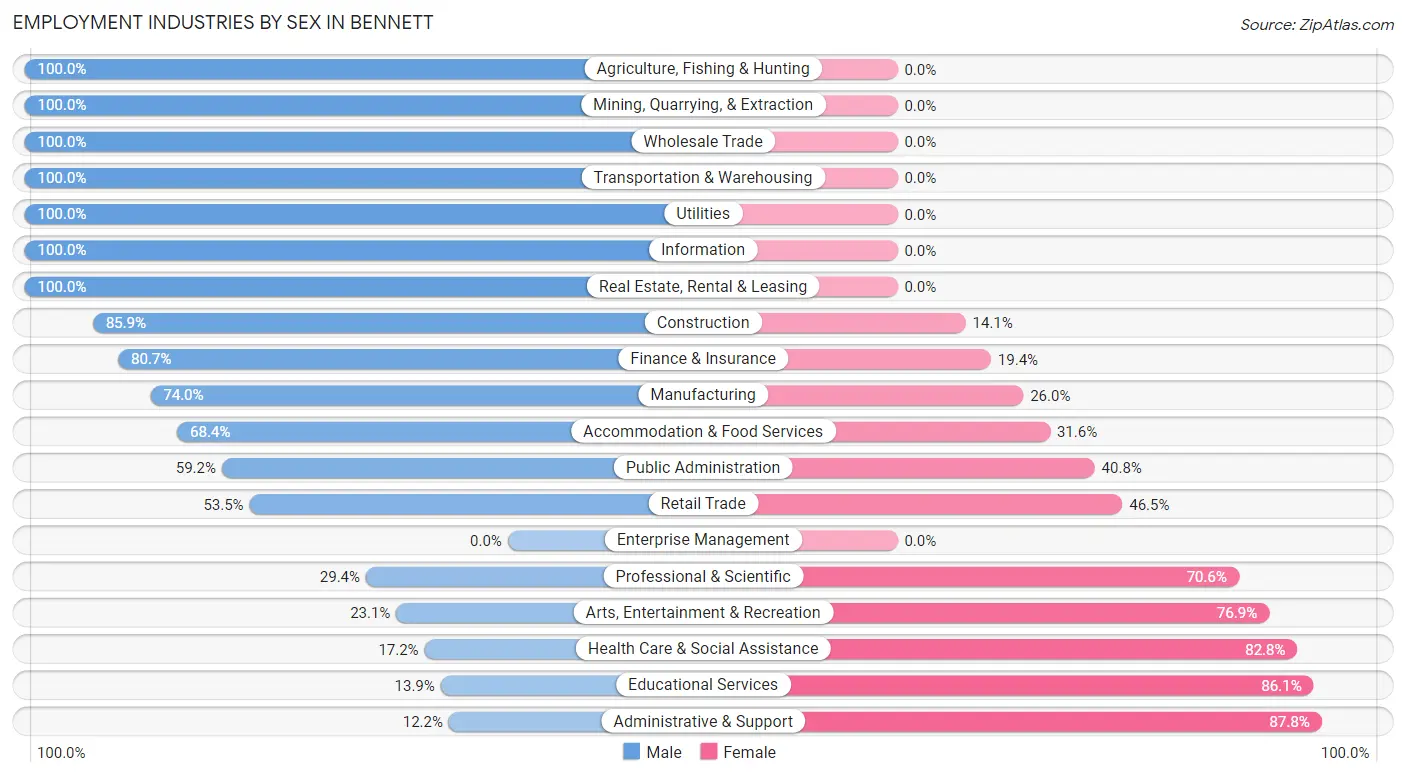
Employment Industries by Sex in Bennett
The Bennett industries that see more men than women are Agriculture, Fishing & Hunting (100.0%), Mining, Quarrying, & Extraction (100.0%), and Wholesale Trade (100.0%), whereas the industries that tend to have a higher number of women are Administrative & Support (87.8%), Educational Services (86.1%), and Health Care & Social Assistance (82.8%).
| Industry | Male | Female |
| Agriculture, Fishing & Hunting | 9 (100.0%) | 0 (0.0%) |
| Mining, Quarrying, & Extraction | 7 (100.0%) | 0 (0.0%) |
| Construction | 207 (85.9%) | 34 (14.1%) |
| Manufacturing | 71 (74.0%) | 25 (26.0%) |
| Wholesale Trade | 89 (100.0%) | 0 (0.0%) |
| Retail Trade | 116 (53.5%) | 101 (46.5%) |
| Transportation & Warehousing | 191 (100.0%) | 0 (0.0%) |
| Utilities | 7 (100.0%) | 0 (0.0%) |
| Information | 10 (100.0%) | 0 (0.0%) |
| Finance & Insurance | 25 (80.6%) | 6 (19.4%) |
| Real Estate, Rental & Leasing | 17 (100.0%) | 0 (0.0%) |
| Professional & Scientific | 32 (29.4%) | 77 (70.6%) |
| Enterprise Management | 0 (0.0%) | 0 (0.0%) |
| Administrative & Support | 5 (12.2%) | 36 (87.8%) |
| Educational Services | 15 (13.9%) | 93 (86.1%) |
| Health Care & Social Assistance | 35 (17.2%) | 168 (82.8%) |
| Arts, Entertainment & Recreation | 9 (23.1%) | 30 (76.9%) |
| Accommodation & Food Services | 65 (68.4%) | 30 (31.6%) |
| Public Administration | 58 (59.2%) | 40 (40.8%) |
| Total | 990 (59.4%) | 676 (40.6%) |
Education in Bennett
School Enrollment in Bennett
The most common levels of schooling among the 858 students in Bennett are high school (220 | 25.6%), middle school (213 | 24.8%), and elementary school (158 | 18.4%).
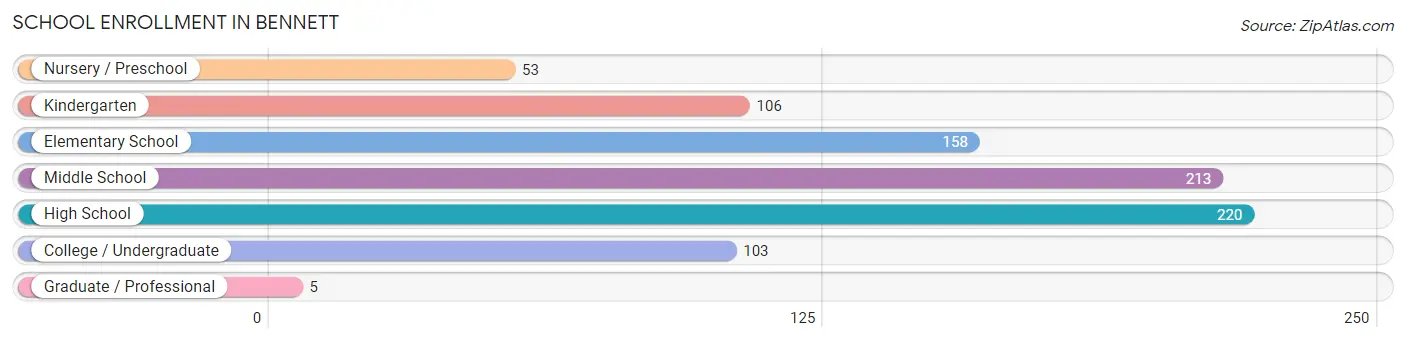
| School Level | # Students | % Students |
| Nursery / Preschool | 53 | 6.2% |
| Kindergarten | 106 | 12.3% |
| Elementary School | 158 | 18.4% |
| Middle School | 213 | 24.8% |
| High School | 220 | 25.6% |
| College / Undergraduate | 103 | 12.0% |
| Graduate / Professional | 5 | 0.6% |
| Total | 858 | 100.0% |
School Enrollment by Age by Funding Source in Bennett
Out of a total of 858 students who are enrolled in schools in Bennett, 120 (14.0%) attend a private institution, while the remaining 738 (86.0%) are enrolled in public schools. The age group of 35 years and over has the highest likelihood of being enrolled in private schools, with 29 (74.4% in the age bracket) enrolled. Conversely, the age group of 3 to 4 year olds has the lowest likelihood of being enrolled in a private school, with 48 (100.0% in the age bracket) attending a public institution.
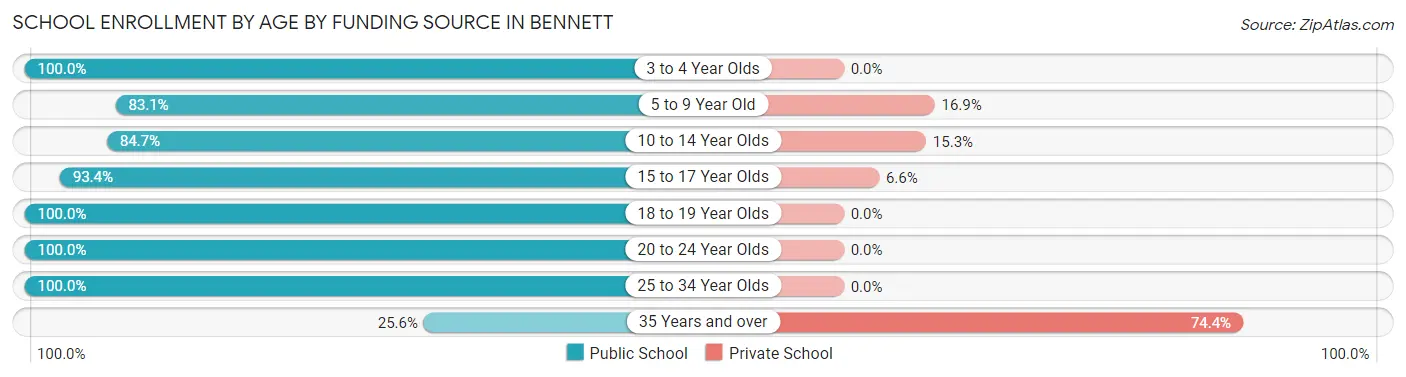
| Age Bracket | Public School | Private School |
| 3 to 4 Year Olds | 48 (100.0%) | 0 (0.0%) |
| 5 to 9 Year Old | 211 (83.1%) | 43 (16.9%) |
| 10 to 14 Year Olds | 188 (84.7%) | 34 (15.3%) |
| 15 to 17 Year Olds | 199 (93.4%) | 14 (6.6%) |
| 18 to 19 Year Olds | 22 (100.0%) | 0 (0.0%) |
| 20 to 24 Year Olds | 11 (100.0%) | 0 (0.0%) |
| 25 to 34 Year Olds | 49 (100.0%) | 0 (0.0%) |
| 35 Years and over | 10 (25.6%) | 29 (74.4%) |
| Total | 738 (86.0%) | 120 (14.0%) |
Educational Attainment by Field of Study in Bennett
Arts & humanities (109 | 23.2%), engineering (75 | 16.0%), business (72 | 15.3%), education (57 | 12.1%), and science & technology (52 | 11.1%) are the most common fields of study among 469 individuals in Bennett who have obtained a bachelor's degree or higher.
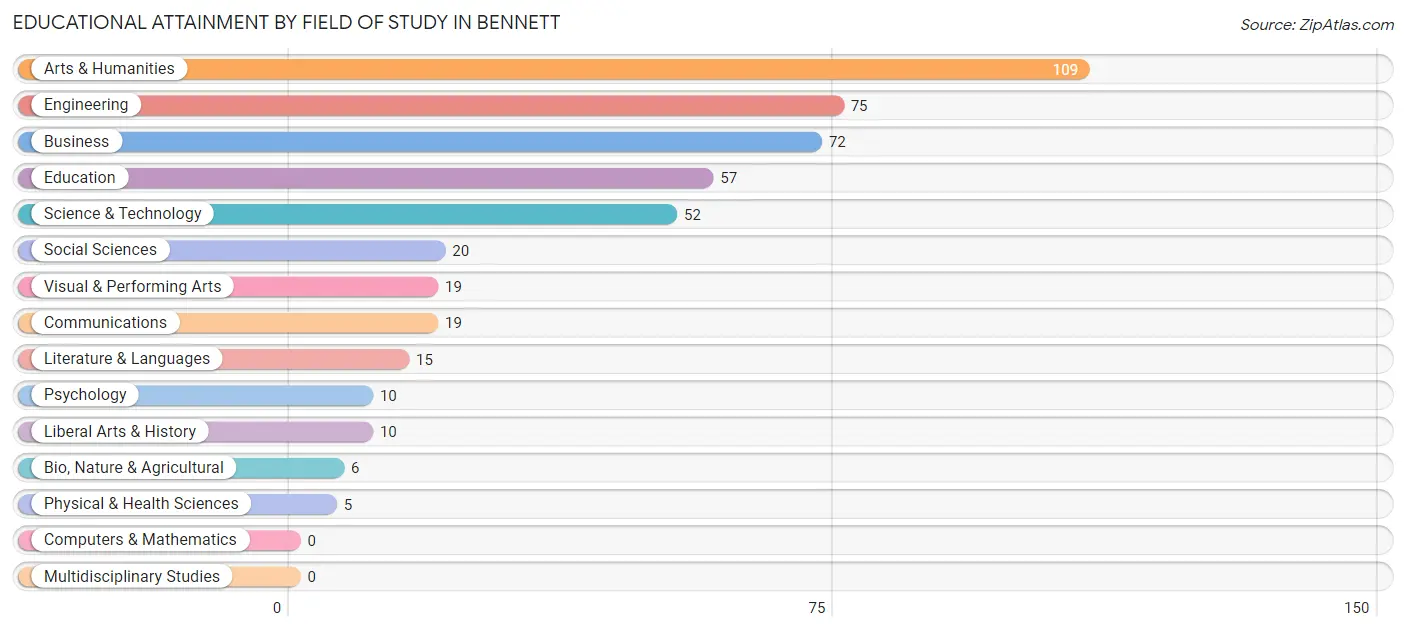
| Field of Study | # Graduates | % Graduates |
| Computers & Mathematics | 0 | 0.0% |
| Bio, Nature & Agricultural | 6 | 1.3% |
| Physical & Health Sciences | 5 | 1.1% |
| Psychology | 10 | 2.1% |
| Social Sciences | 20 | 4.3% |
| Engineering | 75 | 16.0% |
| Multidisciplinary Studies | 0 | 0.0% |
| Science & Technology | 52 | 11.1% |
| Business | 72 | 15.3% |
| Education | 57 | 12.1% |
| Literature & Languages | 15 | 3.2% |
| Liberal Arts & History | 10 | 2.1% |
| Visual & Performing Arts | 19 | 4.1% |
| Communications | 19 | 4.1% |
| Arts & Humanities | 109 | 23.2% |
| Total | 469 | 100.0% |
Transportation & Commute in Bennett
Vehicle Availability by Sex in Bennett
The most prevalent vehicle ownership categories in Bennett are males with 3 vehicles (346, accounting for 33.8%) and females with 3 vehicles (191, making up 54.2%).
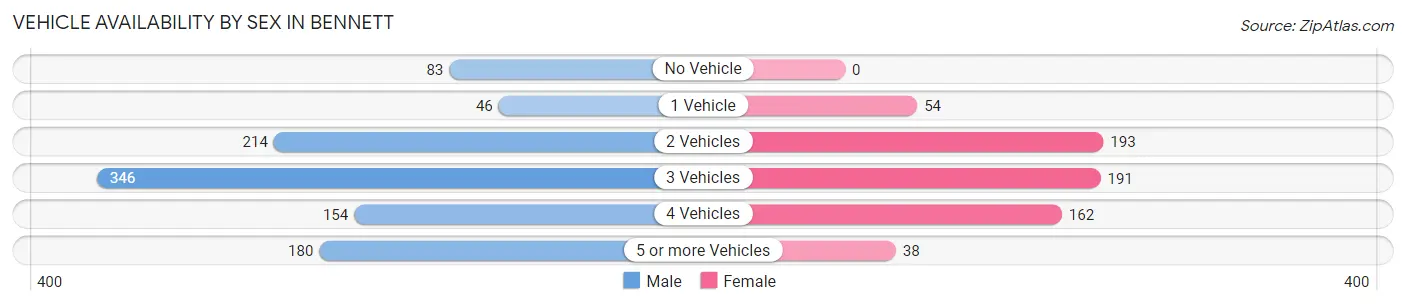
| Vehicles Available | Male | Female |
| No Vehicle | 83 (8.1%) | 0 (0.0%) |
| 1 Vehicle | 46 (4.5%) | 54 (8.5%) |
| 2 Vehicles | 214 (20.9%) | 193 (30.2%) |
| 3 Vehicles | 346 (33.8%) | 191 (29.9%) |
| 4 Vehicles | 154 (15.0%) | 162 (25.4%) |
| 5 or more Vehicles | 180 (17.6%) | 38 (6.0%) |
| Total | 1,023 (100.0%) | 638 (100.0%) |
Commute Time in Bennett
The most frequently occuring commute durations in Bennett are 30 to 34 minutes (440 commuters, 28.4%), 45 to 59 minutes (232 commuters, 15.0%), and 90 or more minutes (182 commuters, 11.7%).
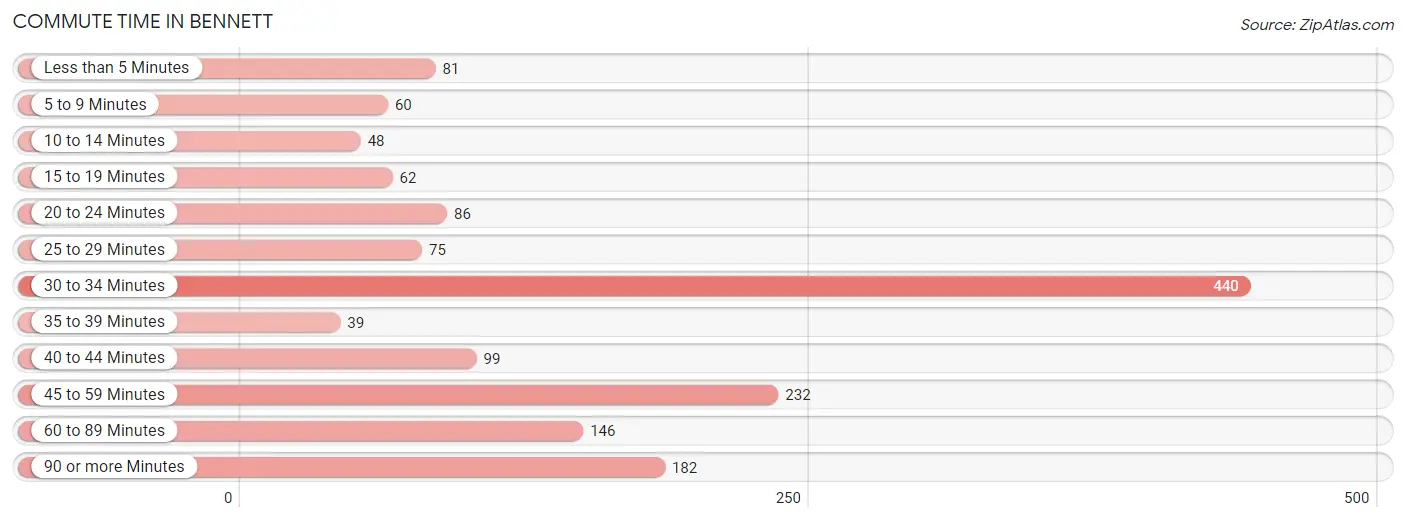
| Commute Time | # Commuters | % Commuters |
| Less than 5 Minutes | 81 | 5.2% |
| 5 to 9 Minutes | 60 | 3.9% |
| 10 to 14 Minutes | 48 | 3.1% |
| 15 to 19 Minutes | 62 | 4.0% |
| 20 to 24 Minutes | 86 | 5.6% |
| 25 to 29 Minutes | 75 | 4.8% |
| 30 to 34 Minutes | 440 | 28.4% |
| 35 to 39 Minutes | 39 | 2.5% |
| 40 to 44 Minutes | 99 | 6.4% |
| 45 to 59 Minutes | 232 | 15.0% |
| 60 to 89 Minutes | 146 | 9.4% |
| 90 or more Minutes | 182 | 11.7% |
Commute Time by Sex in Bennett
The most common commute times in Bennett are 30 to 34 minutes (275 commuters, 28.7%) for males and 30 to 34 minutes (165 commuters, 27.8%) for females.
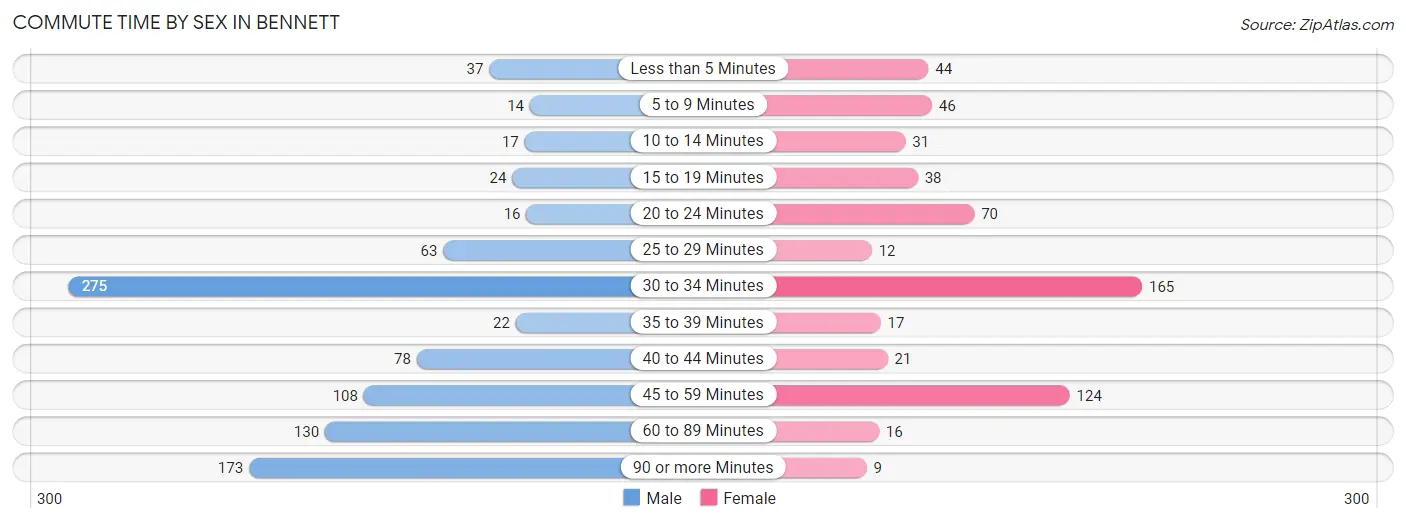
| Commute Time | Male | Female |
| Less than 5 Minutes | 37 (3.9%) | 44 (7.4%) |
| 5 to 9 Minutes | 14 (1.5%) | 46 (7.8%) |
| 10 to 14 Minutes | 17 (1.8%) | 31 (5.2%) |
| 15 to 19 Minutes | 24 (2.5%) | 38 (6.4%) |
| 20 to 24 Minutes | 16 (1.7%) | 70 (11.8%) |
| 25 to 29 Minutes | 63 (6.6%) | 12 (2.0%) |
| 30 to 34 Minutes | 275 (28.7%) | 165 (27.8%) |
| 35 to 39 Minutes | 22 (2.3%) | 17 (2.9%) |
| 40 to 44 Minutes | 78 (8.2%) | 21 (3.5%) |
| 45 to 59 Minutes | 108 (11.3%) | 124 (20.9%) |
| 60 to 89 Minutes | 130 (13.6%) | 16 (2.7%) |
| 90 or more Minutes | 173 (18.1%) | 9 (1.5%) |
Time of Departure to Work by Sex in Bennett
The most frequent times of departure to work in Bennett are 6:00 AM to 6:29 AM (232, 24.2%) for males and 6:30 AM to 6:59 AM (152, 25.6%) for females.
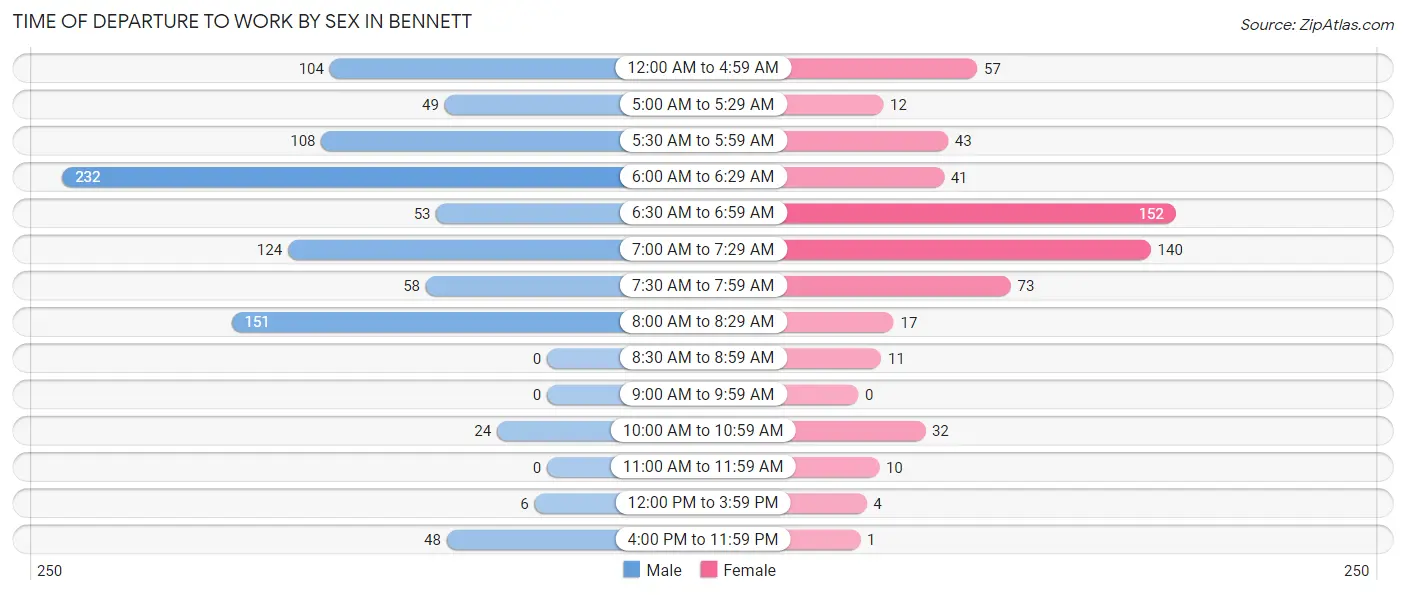
| Time of Departure | Male | Female |
| 12:00 AM to 4:59 AM | 104 (10.9%) | 57 (9.6%) |
| 5:00 AM to 5:29 AM | 49 (5.1%) | 12 (2.0%) |
| 5:30 AM to 5:59 AM | 108 (11.3%) | 43 (7.2%) |
| 6:00 AM to 6:29 AM | 232 (24.2%) | 41 (6.9%) |
| 6:30 AM to 6:59 AM | 53 (5.5%) | 152 (25.6%) |
| 7:00 AM to 7:29 AM | 124 (13.0%) | 140 (23.6%) |
| 7:30 AM to 7:59 AM | 58 (6.1%) | 73 (12.3%) |
| 8:00 AM to 8:29 AM | 151 (15.8%) | 17 (2.9%) |
| 8:30 AM to 8:59 AM | 0 (0.0%) | 11 (1.8%) |
| 9:00 AM to 9:59 AM | 0 (0.0%) | 0 (0.0%) |
| 10:00 AM to 10:59 AM | 24 (2.5%) | 32 (5.4%) |
| 11:00 AM to 11:59 AM | 0 (0.0%) | 10 (1.7%) |
| 12:00 PM to 3:59 PM | 6 (0.6%) | 4 (0.7%) |
| 4:00 PM to 11:59 PM | 48 (5.0%) | 1 (0.2%) |
| Total | 957 (100.0%) | 593 (100.0%) |
Housing Occupancy in Bennett
Occupancy by Ownership in Bennett
Of the total 1,120 dwellings in Bennett, owner-occupied units account for 948 (84.6%), while renter-occupied units make up 172 (15.4%).
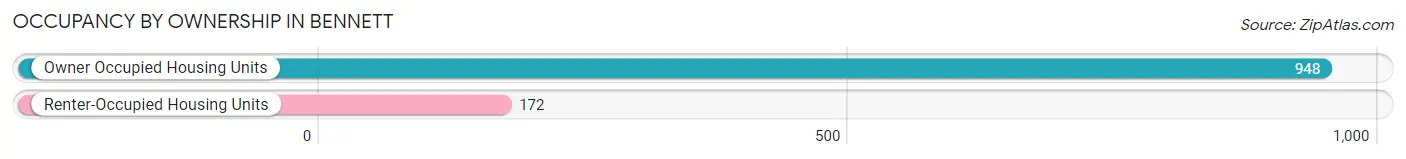
| Occupancy | # Housing Units | % Housing Units |
| Owner Occupied Housing Units | 948 | 84.6% |
| Renter-Occupied Housing Units | 172 | 15.4% |
| Total Occupied Housing Units | 1,120 | 100.0% |
Occupancy by Household Size in Bennett
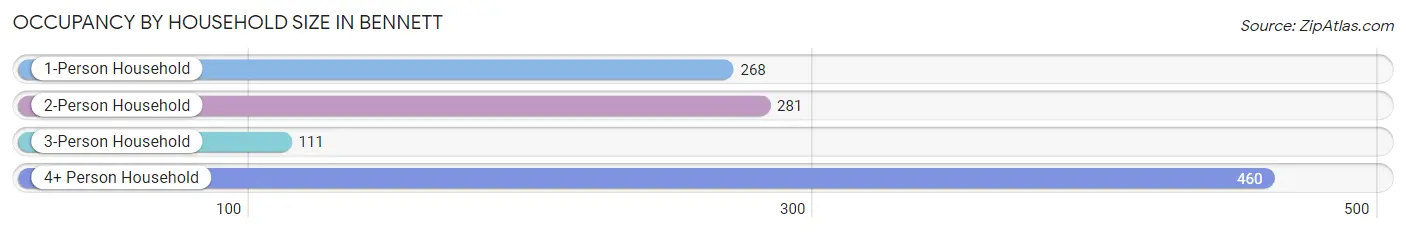
| Household Size | # Housing Units | % Housing Units |
| 1-Person Household | 268 | 23.9% |
| 2-Person Household | 281 | 25.1% |
| 3-Person Household | 111 | 9.9% |
| 4+ Person Household | 460 | 41.1% |
| Total Housing Units | 1,120 | 100.0% |
Occupancy by Ownership by Household Size in Bennett
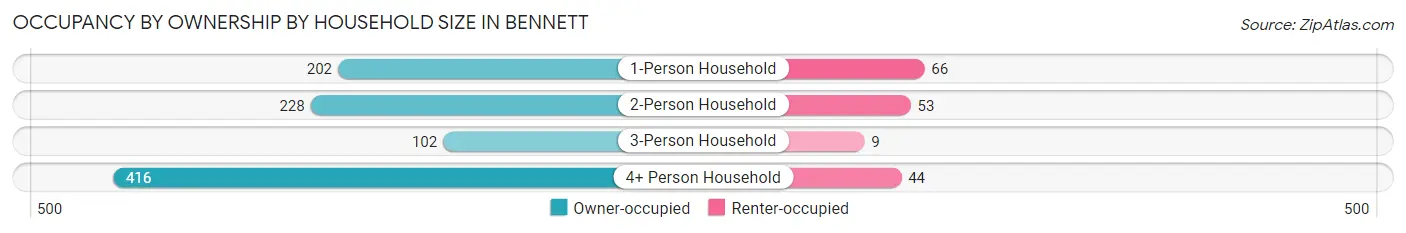
| Household Size | Owner-occupied | Renter-occupied |
| 1-Person Household | 202 (75.4%) | 66 (24.6%) |
| 2-Person Household | 228 (81.1%) | 53 (18.9%) |
| 3-Person Household | 102 (91.9%) | 9 (8.1%) |
| 4+ Person Household | 416 (90.4%) | 44 (9.6%) |
| Total Housing Units | 948 (84.6%) | 172 (15.4%) |
Occupancy by Educational Attainment in Bennett
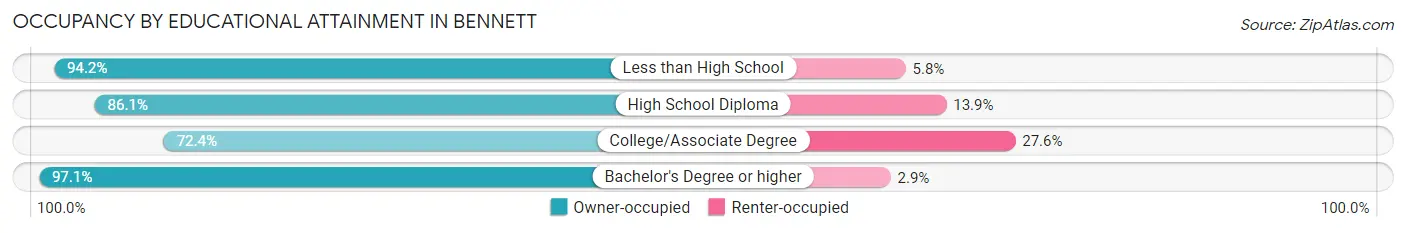
| Household Size | Owner-occupied | Renter-occupied |
| Less than High School | 97 (94.2%) | 6 (5.8%) |
| High School Diploma | 285 (86.1%) | 46 (13.9%) |
| College/Associate Degree | 294 (72.4%) | 112 (27.6%) |
| Bachelor's Degree or higher | 272 (97.1%) | 8 (2.9%) |
Occupancy by Age of Householder in Bennett
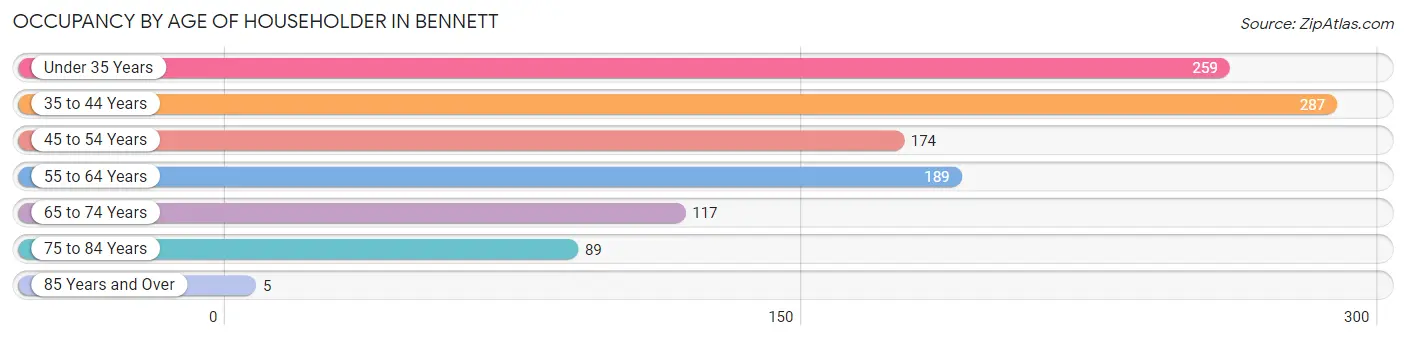
| Age Bracket | # Households | % Households |
| Under 35 Years | 259 | 23.1% |
| 35 to 44 Years | 287 | 25.6% |
| 45 to 54 Years | 174 | 15.5% |
| 55 to 64 Years | 189 | 16.9% |
| 65 to 74 Years | 117 | 10.4% |
| 75 to 84 Years | 89 | 8.0% |
| 85 Years and Over | 5 | 0.4% |
| Total | 1,120 | 100.0% |
Housing Finances in Bennett
Median Income by Occupancy in Bennett
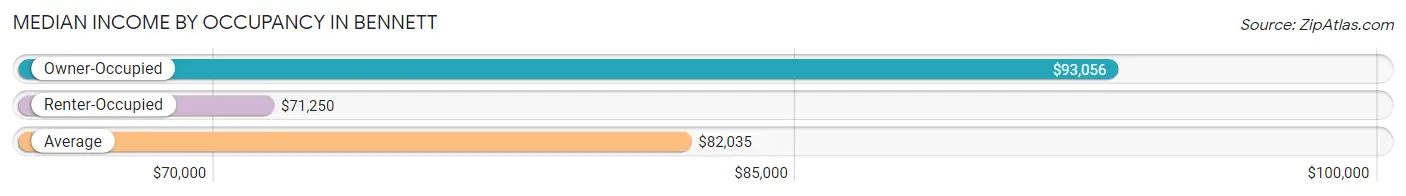
| Occupancy Type | # Households | Median Income |
| Owner-Occupied | 948 (84.6%) | $93,056 |
| Renter-Occupied | 172 (15.4%) | $71,250 |
| Average | 1,120 (100.0%) | $82,035 |
Occupancy by Householder Income Bracket in Bennett
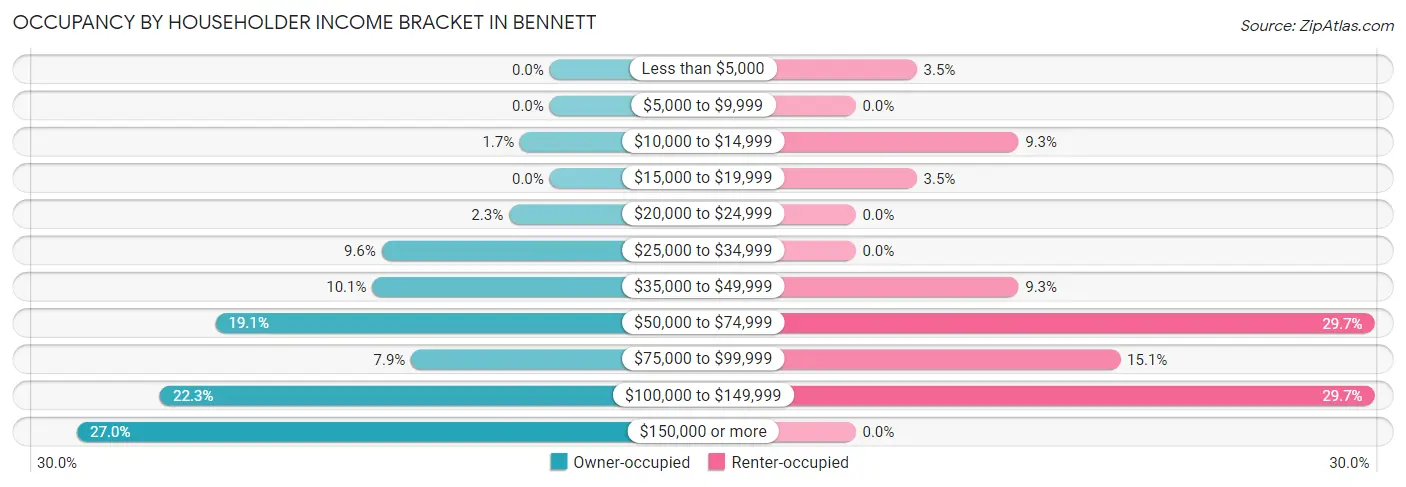
| Income Bracket | Owner-occupied | Renter-occupied |
| Less than $5,000 | 0 (0.0%) | 6 (3.5%) |
| $5,000 to $9,999 | 0 (0.0%) | 0 (0.0%) |
| $10,000 to $14,999 | 16 (1.7%) | 16 (9.3%) |
| $15,000 to $19,999 | 0 (0.0%) | 6 (3.5%) |
| $20,000 to $24,999 | 22 (2.3%) | 0 (0.0%) |
| $25,000 to $34,999 | 91 (9.6%) | 0 (0.0%) |
| $35,000 to $49,999 | 96 (10.1%) | 16 (9.3%) |
| $50,000 to $74,999 | 181 (19.1%) | 51 (29.6%) |
| $75,000 to $99,999 | 75 (7.9%) | 26 (15.1%) |
| $100,000 to $149,999 | 211 (22.3%) | 51 (29.6%) |
| $150,000 or more | 256 (27.0%) | 0 (0.0%) |
| Total | 948 (100.0%) | 172 (100.0%) |
Monthly Housing Cost Tiers in Bennett
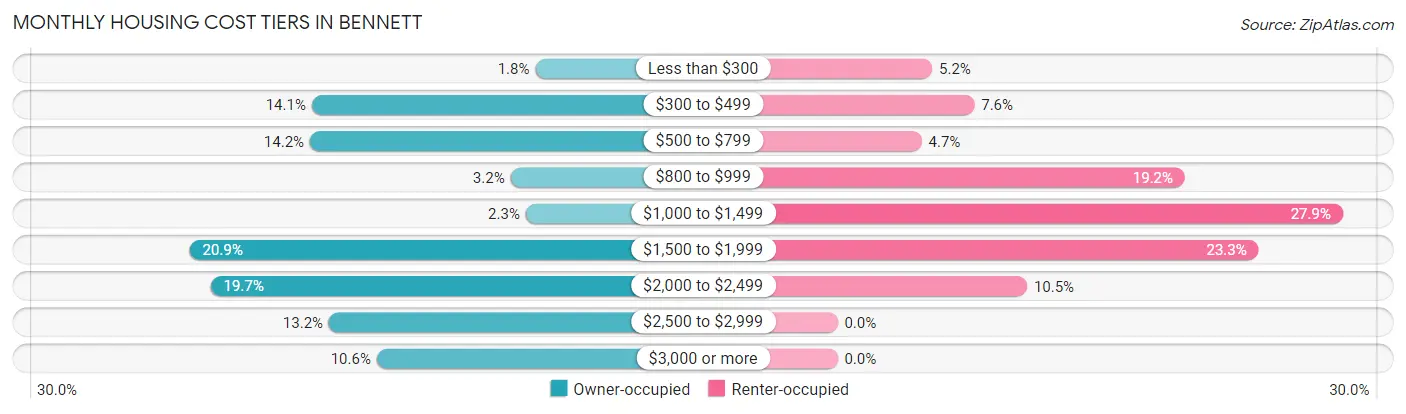
| Monthly Cost | Owner-occupied | Renter-occupied |
| Less than $300 | 17 (1.8%) | 9 (5.2%) |
| $300 to $499 | 134 (14.1%) | 13 (7.6%) |
| $500 to $799 | 135 (14.2%) | 8 (4.6%) |
| $800 to $999 | 30 (3.2%) | 33 (19.2%) |
| $1,000 to $1,499 | 22 (2.3%) | 48 (27.9%) |
| $1,500 to $1,999 | 198 (20.9%) | 40 (23.3%) |
| $2,000 to $2,499 | 187 (19.7%) | 18 (10.5%) |
| $2,500 to $2,999 | 125 (13.2%) | 0 (0.0%) |
| $3,000 or more | 100 (10.5%) | 0 (0.0%) |
| Total | 948 (100.0%) | 172 (100.0%) |
Physical Housing Characteristics in Bennett
Housing Structures in Bennett
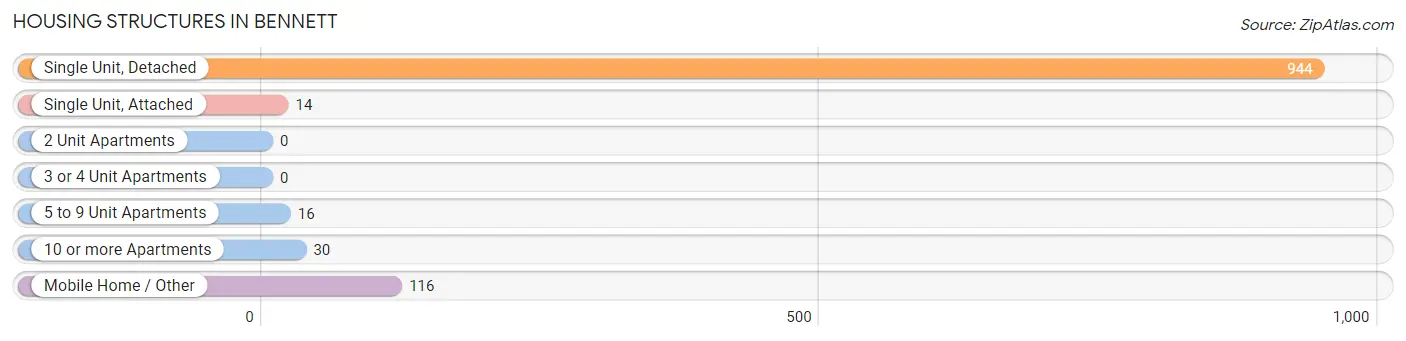
| Structure Type | # Housing Units | % Housing Units |
| Single Unit, Detached | 944 | 84.3% |
| Single Unit, Attached | 14 | 1.3% |
| 2 Unit Apartments | 0 | 0.0% |
| 3 or 4 Unit Apartments | 0 | 0.0% |
| 5 to 9 Unit Apartments | 16 | 1.4% |
| 10 or more Apartments | 30 | 2.7% |
| Mobile Home / Other | 116 | 10.4% |
| Total | 1,120 | 100.0% |
Housing Structures by Occupancy in Bennett
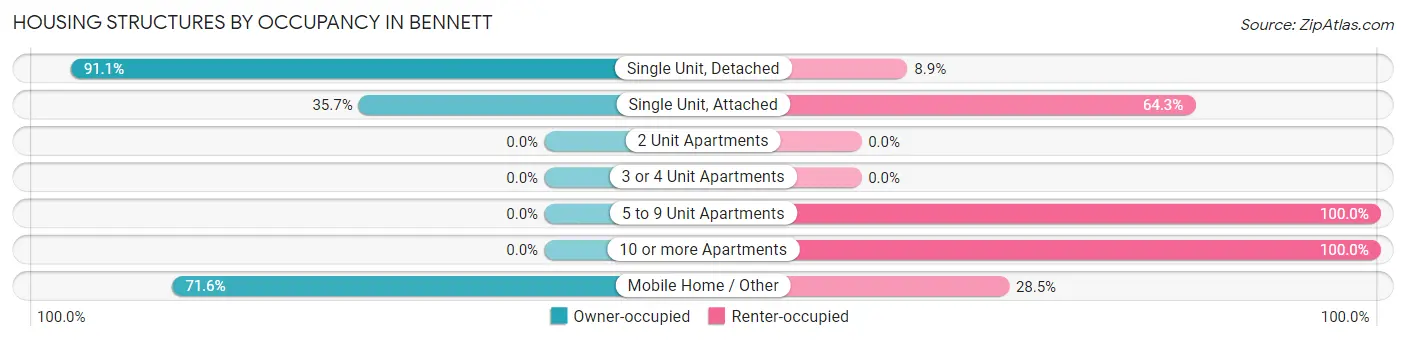
| Structure Type | Owner-occupied | Renter-occupied |
| Single Unit, Detached | 860 (91.1%) | 84 (8.9%) |
| Single Unit, Attached | 5 (35.7%) | 9 (64.3%) |
| 2 Unit Apartments | 0 (0.0%) | 0 (0.0%) |
| 3 or 4 Unit Apartments | 0 (0.0%) | 0 (0.0%) |
| 5 to 9 Unit Apartments | 0 (0.0%) | 16 (100.0%) |
| 10 or more Apartments | 0 (0.0%) | 30 (100.0%) |
| Mobile Home / Other | 83 (71.6%) | 33 (28.4%) |
| Total | 948 (84.6%) | 172 (15.4%) |
Housing Structures by Number of Rooms in Bennett
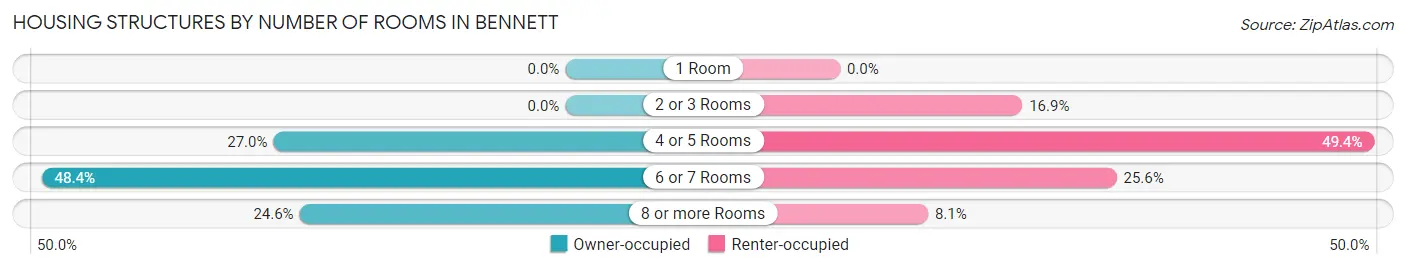
| Number of Rooms | Owner-occupied | Renter-occupied |
| 1 Room | 0 (0.0%) | 0 (0.0%) |
| 2 or 3 Rooms | 0 (0.0%) | 29 (16.9%) |
| 4 or 5 Rooms | 256 (27.0%) | 85 (49.4%) |
| 6 or 7 Rooms | 459 (48.4%) | 44 (25.6%) |
| 8 or more Rooms | 233 (24.6%) | 14 (8.1%) |
| Total | 948 (100.0%) | 172 (100.0%) |
Housing Structure by Heating Type in Bennett
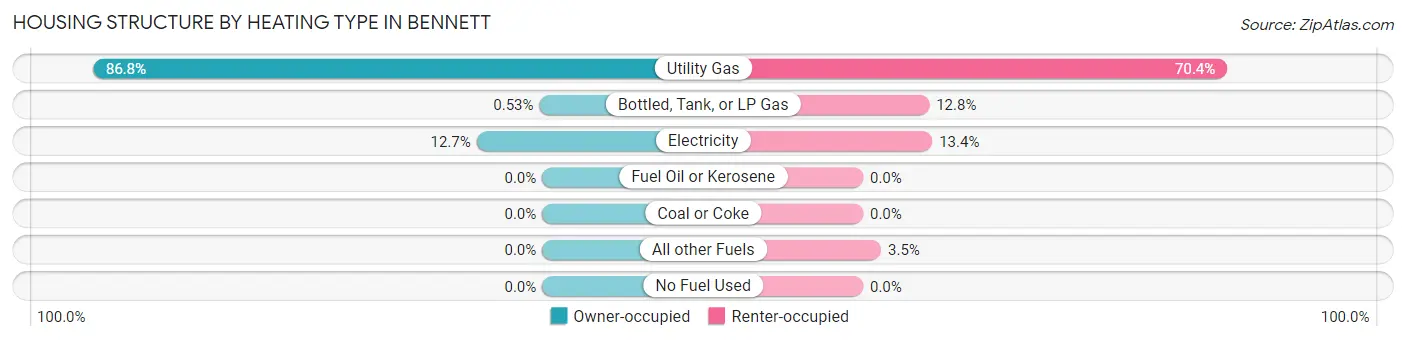
| Heating Type | Owner-occupied | Renter-occupied |
| Utility Gas | 823 (86.8%) | 121 (70.4%) |
| Bottled, Tank, or LP Gas | 5 (0.5%) | 22 (12.8%) |
| Electricity | 120 (12.7%) | 23 (13.4%) |
| Fuel Oil or Kerosene | 0 (0.0%) | 0 (0.0%) |
| Coal or Coke | 0 (0.0%) | 0 (0.0%) |
| All other Fuels | 0 (0.0%) | 6 (3.5%) |
| No Fuel Used | 0 (0.0%) | 0 (0.0%) |
| Total | 948 (100.0%) | 172 (100.0%) |
Household Vehicle Usage in Bennett
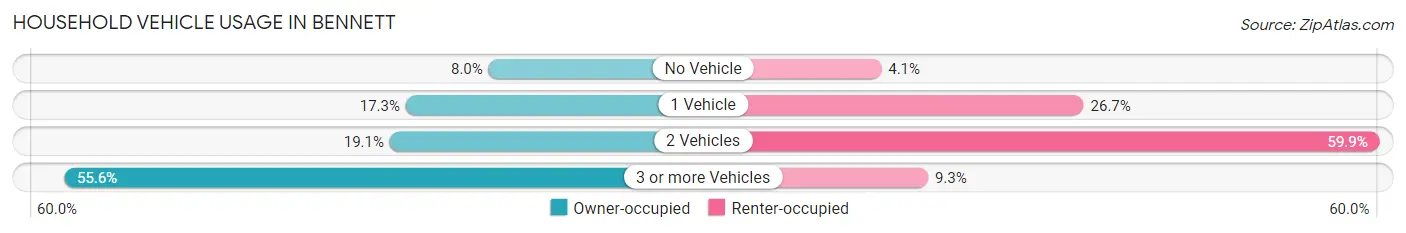
| Vehicles per Household | Owner-occupied | Renter-occupied |
| No Vehicle | 76 (8.0%) | 7 (4.1%) |
| 1 Vehicle | 164 (17.3%) | 46 (26.7%) |
| 2 Vehicles | 181 (19.1%) | 103 (59.9%) |
| 3 or more Vehicles | 527 (55.6%) | 16 (9.3%) |
| Total | 948 (100.0%) | 172 (100.0%) |
Real Estate & Mortgages in Bennett
Real Estate and Mortgage Overview in Bennett
| Characteristic | Without Mortgage | With Mortgage |
| Housing Units | 212 | 736 |
| Median Property Value | $215,400 | $394,100 |
| Median Household Income | $29,167 | $256 |
| Monthly Housing Costs | $554 | $100 |
| Real Estate Taxes | $1,532 | $83 |
Property Value by Mortgage Status in Bennett
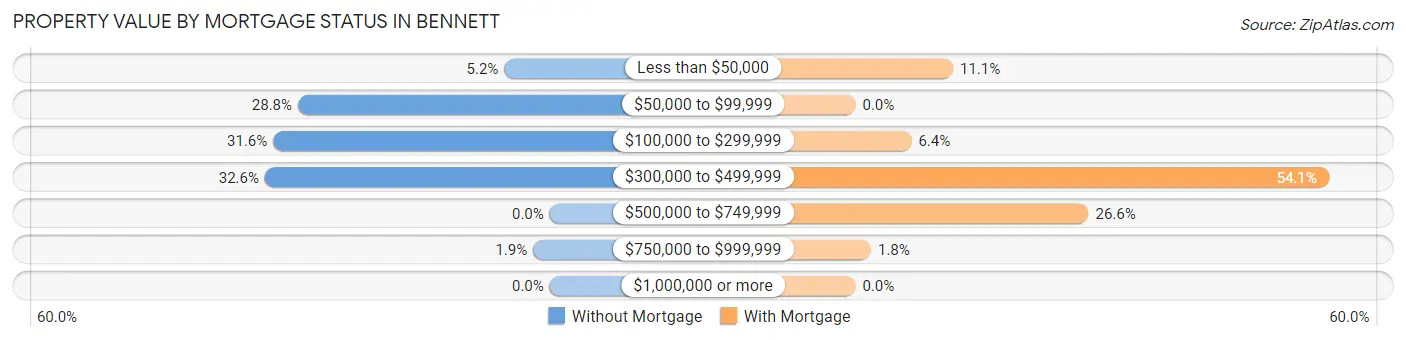
| Property Value | Without Mortgage | With Mortgage |
| Less than $50,000 | 11 (5.2%) | 82 (11.1%) |
| $50,000 to $99,999 | 61 (28.8%) | 0 (0.0%) |
| $100,000 to $299,999 | 67 (31.6%) | 47 (6.4%) |
| $300,000 to $499,999 | 69 (32.6%) | 398 (54.1%) |
| $500,000 to $749,999 | 0 (0.0%) | 196 (26.6%) |
| $750,000 to $999,999 | 4 (1.9%) | 13 (1.8%) |
| $1,000,000 or more | 0 (0.0%) | 0 (0.0%) |
| Total | 212 (100.0%) | 736 (100.0%) |
Household Income by Mortgage Status in Bennett
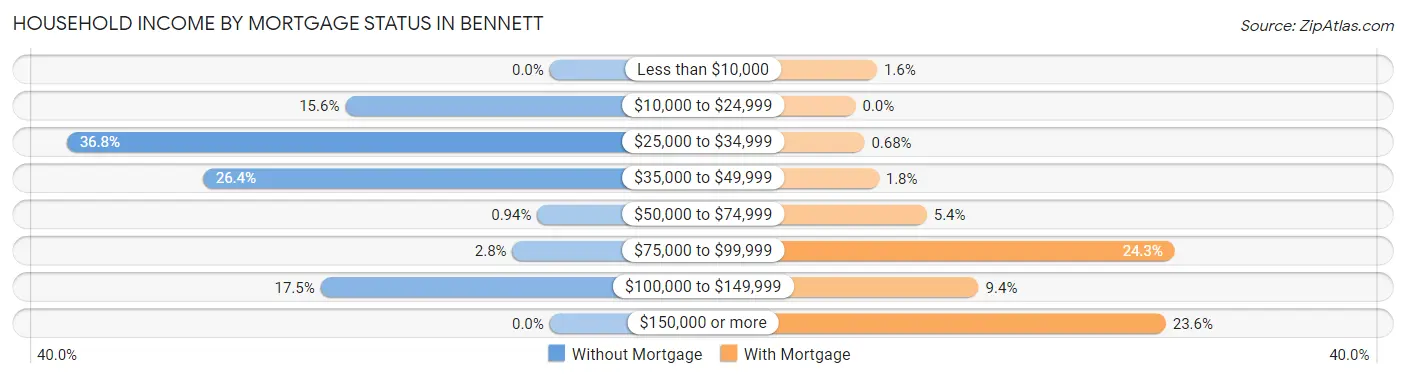
| Household Income | Without Mortgage | With Mortgage |
| Less than $10,000 | 0 (0.0%) | 12 (1.6%) |
| $10,000 to $24,999 | 33 (15.6%) | 0 (0.0%) |
| $25,000 to $34,999 | 78 (36.8%) | 5 (0.7%) |
| $35,000 to $49,999 | 56 (26.4%) | 13 (1.8%) |
| $50,000 to $74,999 | 2 (0.9%) | 40 (5.4%) |
| $75,000 to $99,999 | 6 (2.8%) | 179 (24.3%) |
| $100,000 to $149,999 | 37 (17.4%) | 69 (9.4%) |
| $150,000 or more | 0 (0.0%) | 174 (23.6%) |
| Total | 212 (100.0%) | 736 (100.0%) |
Property Value to Household Income Ratio in Bennett
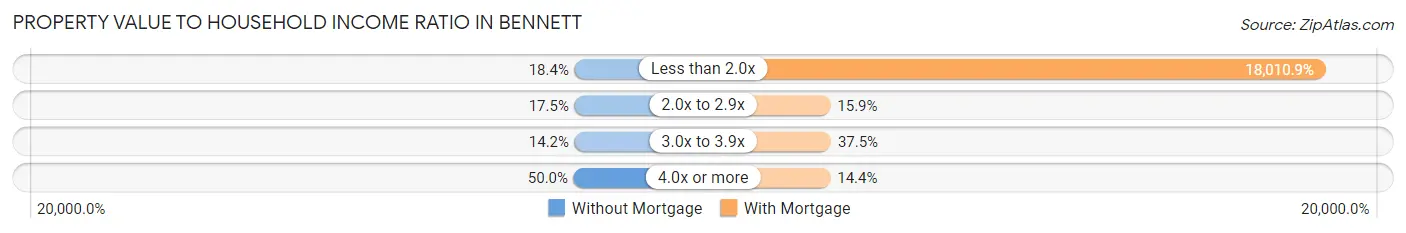
| Value-to-Income Ratio | Without Mortgage | With Mortgage |
| Less than 2.0x | 39 (18.4%) | 132,560 (18,010.9%) |
| 2.0x to 2.9x | 37 (17.4%) | 117 (15.9%) |
| 3.0x to 3.9x | 30 (14.1%) | 276 (37.5%) |
| 4.0x or more | 106 (50.0%) | 106 (14.4%) |
| Total | 212 (100.0%) | 736 (100.0%) |
Real Estate Taxes by Mortgage Status in Bennett
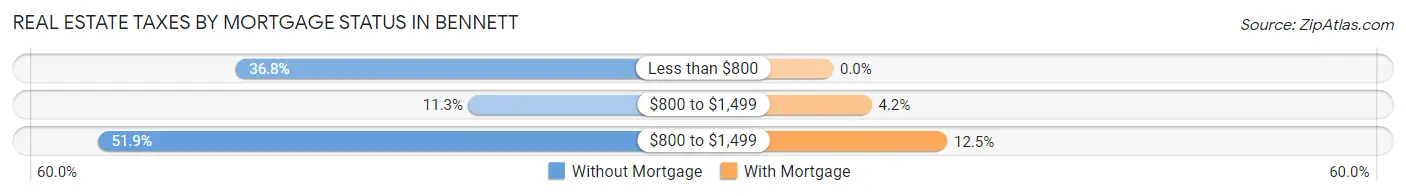
| Property Taxes | Without Mortgage | With Mortgage |
| Less than $800 | 78 (36.8%) | 0 (0.0%) |
| $800 to $1,499 | 24 (11.3%) | 31 (4.2%) |
| $800 to $1,499 | 110 (51.9%) | 92 (12.5%) |
| Total | 212 (100.0%) | 736 (100.0%) |
Health & Disability in Bennett
Health Insurance Coverage by Age in Bennett
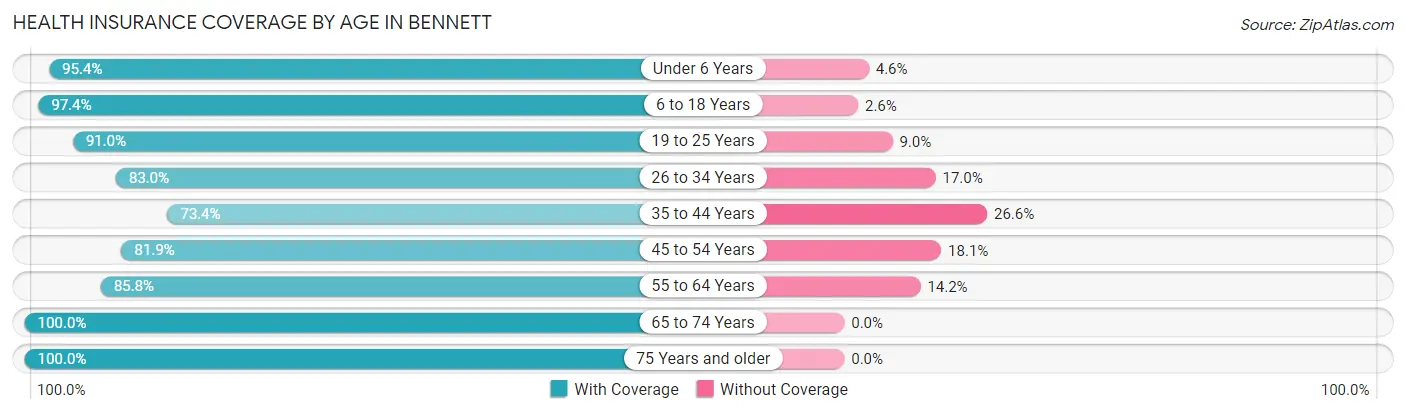
| Age Bracket | With Coverage | Without Coverage |
| Under 6 Years | 209 (95.4%) | 10 (4.6%) |
| 6 to 18 Years | 686 (97.4%) | 18 (2.6%) |
| 19 to 25 Years | 223 (91.0%) | 22 (9.0%) |
| 26 to 34 Years | 400 (83.0%) | 82 (17.0%) |
| 35 to 44 Years | 328 (73.4%) | 119 (26.6%) |
| 45 to 54 Years | 295 (81.9%) | 65 (18.1%) |
| 55 to 64 Years | 441 (85.8%) | 73 (14.2%) |
| 65 to 74 Years | 146 (100.0%) | 0 (0.0%) |
| 75 Years and older | 149 (100.0%) | 0 (0.0%) |
| Total | 2,877 (88.1%) | 389 (11.9%) |
Health Insurance Coverage by Citizenship Status in Bennett
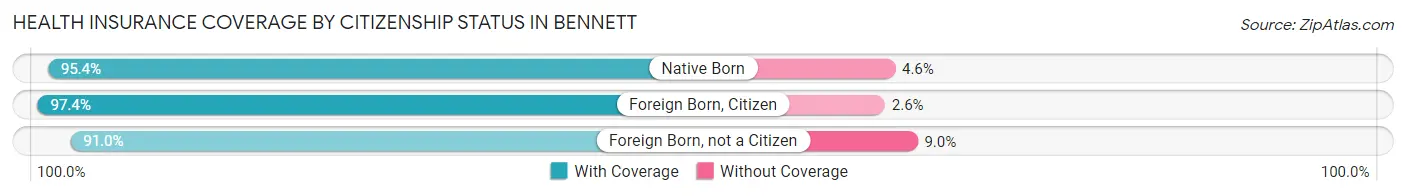
| Citizenship Status | With Coverage | Without Coverage |
| Native Born | 209 (95.4%) | 10 (4.6%) |
| Foreign Born, Citizen | 686 (97.4%) | 18 (2.6%) |
| Foreign Born, not a Citizen | 223 (91.0%) | 22 (9.0%) |
Health Insurance Coverage by Household Income in Bennett
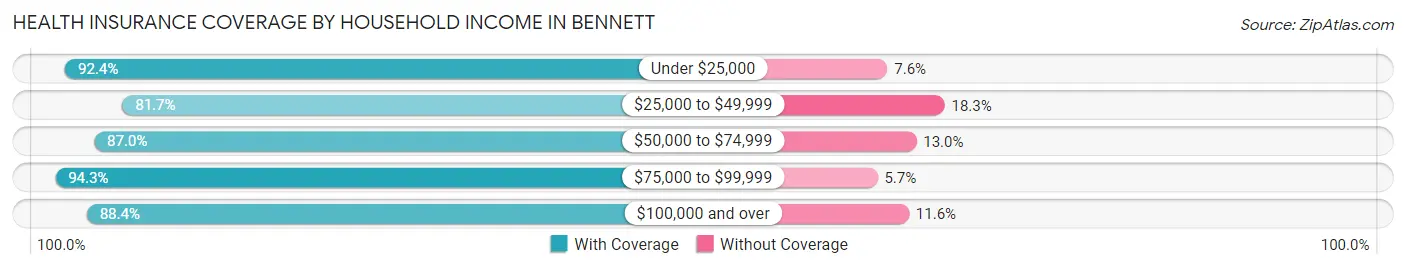
| Household Income | With Coverage | Without Coverage |
| Under $25,000 | 73 (92.4%) | 6 (7.6%) |
| $25,000 to $49,999 | 348 (81.7%) | 78 (18.3%) |
| $50,000 to $74,999 | 521 (87.0%) | 78 (13.0%) |
| $75,000 to $99,999 | 394 (94.3%) | 24 (5.7%) |
| $100,000 and over | 1,541 (88.4%) | 203 (11.6%) |
Public vs Private Health Insurance Coverage by Age in Bennett
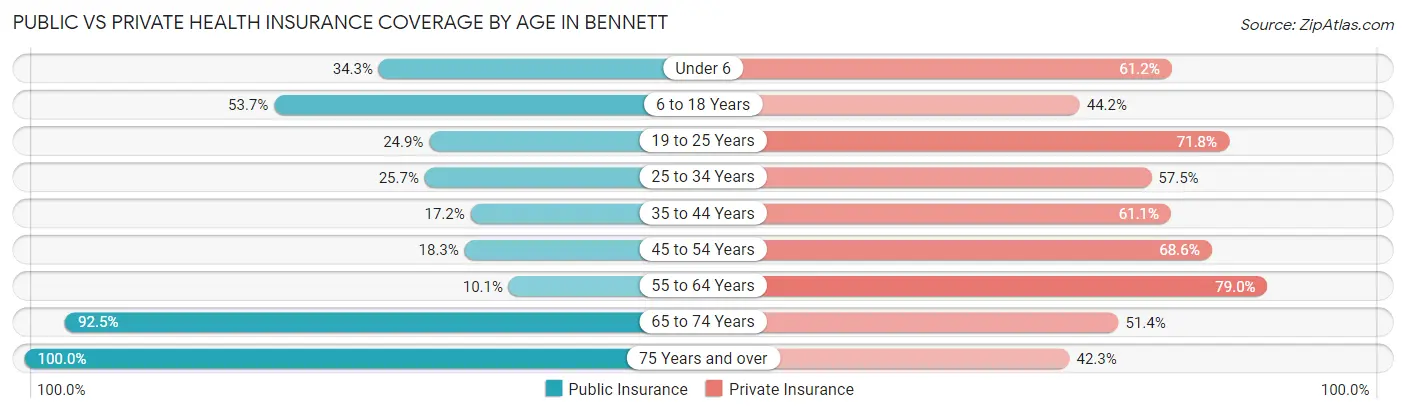
| Age Bracket | Public Insurance | Private Insurance |
| Under 6 | 75 (34.3%) | 134 (61.2%) |
| 6 to 18 Years | 378 (53.7%) | 311 (44.2%) |
| 19 to 25 Years | 61 (24.9%) | 176 (71.8%) |
| 25 to 34 Years | 124 (25.7%) | 277 (57.5%) |
| 35 to 44 Years | 77 (17.2%) | 273 (61.1%) |
| 45 to 54 Years | 66 (18.3%) | 247 (68.6%) |
| 55 to 64 Years | 52 (10.1%) | 406 (79.0%) |
| 65 to 74 Years | 135 (92.5%) | 75 (51.4%) |
| 75 Years and over | 149 (100.0%) | 63 (42.3%) |
| Total | 1,117 (34.2%) | 1,962 (60.1%) |
Disability Status by Sex by Age in Bennett
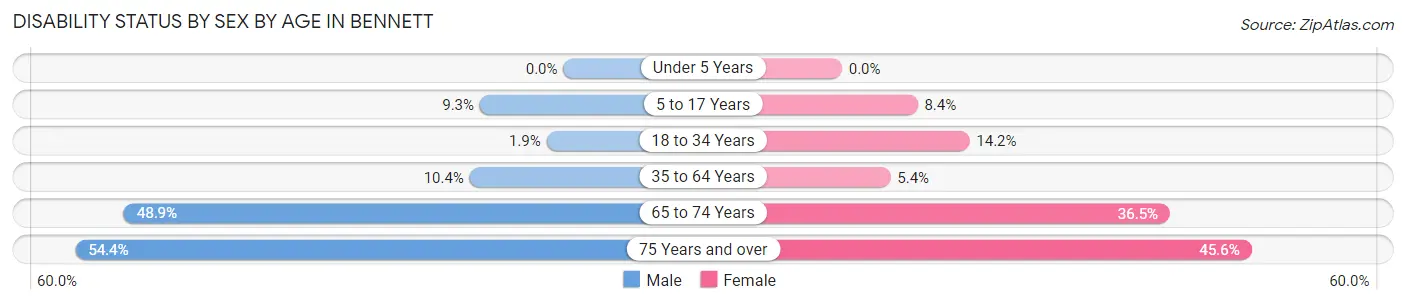
| Age Bracket | Male | Female |
| Under 5 Years | 0 (0.0%) | 0 (0.0%) |
| 5 to 17 Years | 32 (9.3%) | 30 (8.4%) |
| 18 to 34 Years | 7 (1.9%) | 56 (14.2%) |
| 35 to 64 Years | 76 (10.4%) | 32 (5.4%) |
| 65 to 74 Years | 46 (48.9%) | 19 (36.5%) |
| 75 Years and over | 25 (54.3%) | 47 (45.6%) |
Disability Class by Sex by Age in Bennett
Disability Class: Hearing Difficulty
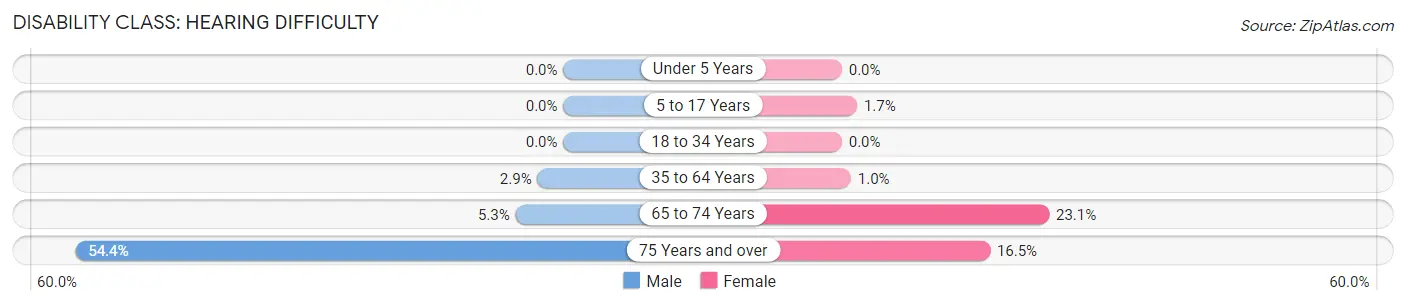
| Age Bracket | Male | Female |
| Under 5 Years | 0 (0.0%) | 0 (0.0%) |
| 5 to 17 Years | 0 (0.0%) | 6 (1.7%) |
| 18 to 34 Years | 0 (0.0%) | 0 (0.0%) |
| 35 to 64 Years | 21 (2.9%) | 6 (1.0%) |
| 65 to 74 Years | 5 (5.3%) | 12 (23.1%) |
| 75 Years and over | 25 (54.3%) | 17 (16.5%) |
Disability Class: Vision Difficulty
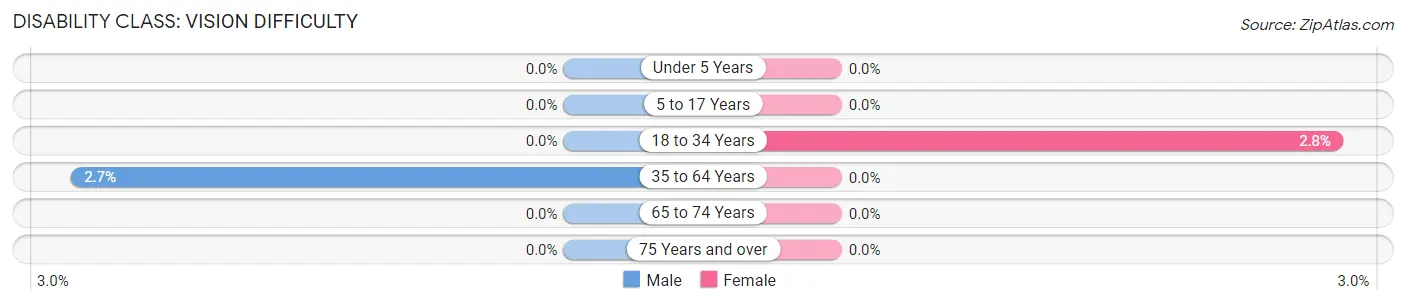
| Age Bracket | Male | Female |
| Under 5 Years | 0 (0.0%) | 0 (0.0%) |
| 5 to 17 Years | 0 (0.0%) | 0 (0.0%) |
| 18 to 34 Years | 0 (0.0%) | 11 (2.8%) |
| 35 to 64 Years | 20 (2.7%) | 0 (0.0%) |
| 65 to 74 Years | 0 (0.0%) | 0 (0.0%) |
| 75 Years and over | 0 (0.0%) | 0 (0.0%) |
Disability Class: Cognitive Difficulty
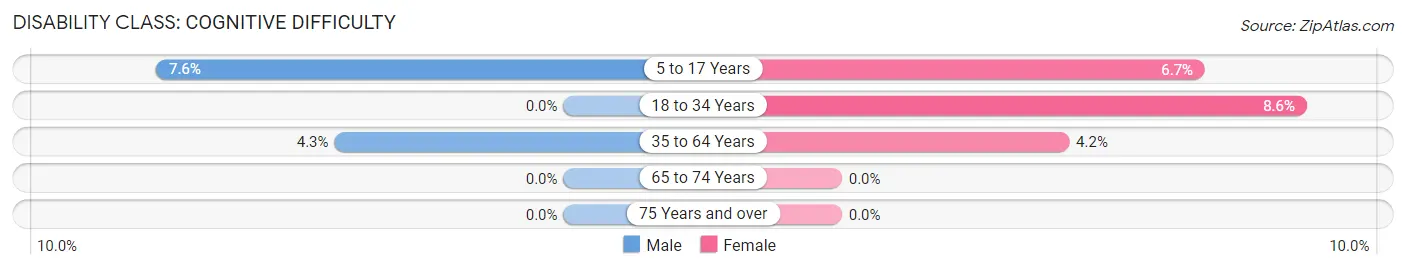
| Age Bracket | Male | Female |
| 5 to 17 Years | 26 (7.6%) | 24 (6.7%) |
| 18 to 34 Years | 0 (0.0%) | 34 (8.6%) |
| 35 to 64 Years | 31 (4.3%) | 25 (4.2%) |
| 65 to 74 Years | 0 (0.0%) | 0 (0.0%) |
| 75 Years and over | 0 (0.0%) | 0 (0.0%) |
Disability Class: Ambulatory Difficulty
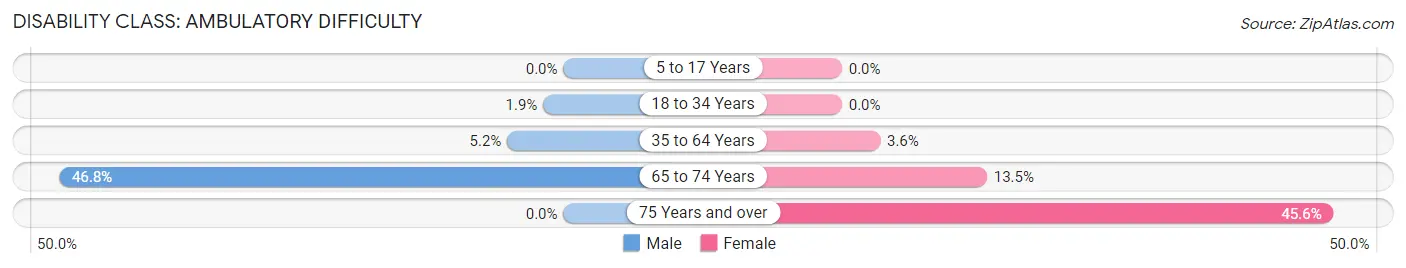
| Age Bracket | Male | Female |
| 5 to 17 Years | 0 (0.0%) | 0 (0.0%) |
| 18 to 34 Years | 7 (1.9%) | 0 (0.0%) |
| 35 to 64 Years | 38 (5.2%) | 21 (3.5%) |
| 65 to 74 Years | 44 (46.8%) | 7 (13.5%) |
| 75 Years and over | 0 (0.0%) | 47 (45.6%) |
Disability Class: Self-Care Difficulty
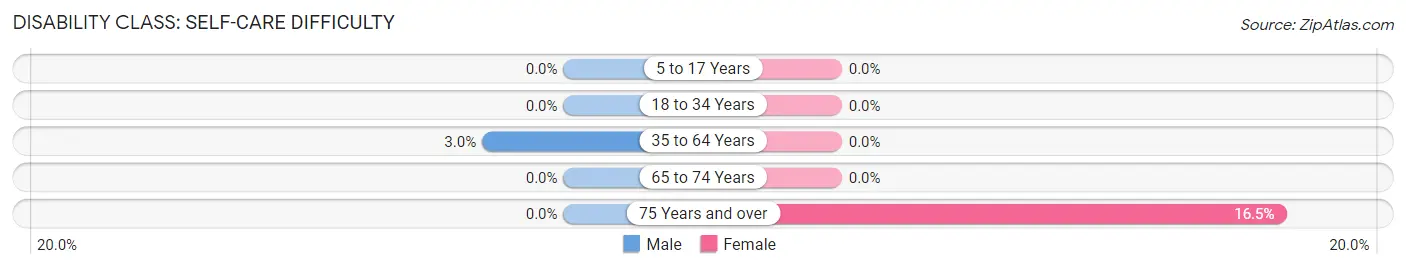
| Age Bracket | Male | Female |
| 5 to 17 Years | 0 (0.0%) | 0 (0.0%) |
| 18 to 34 Years | 0 (0.0%) | 0 (0.0%) |
| 35 to 64 Years | 22 (3.0%) | 0 (0.0%) |
| 65 to 74 Years | 0 (0.0%) | 0 (0.0%) |
| 75 Years and over | 0 (0.0%) | 17 (16.5%) |
Technology Access in Bennett
Computing Device Access in Bennett
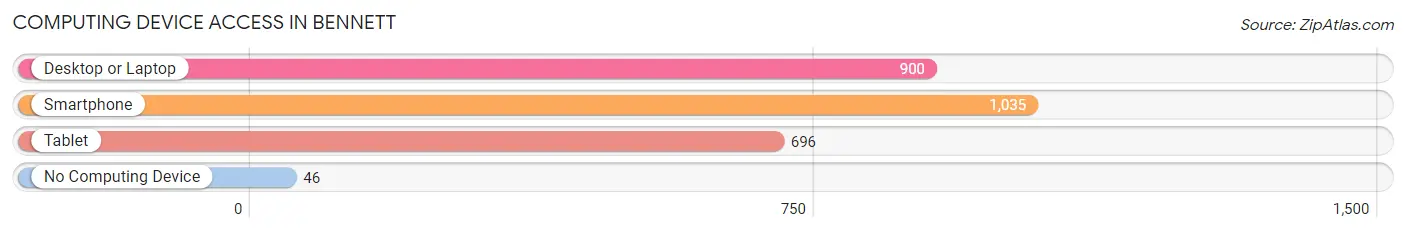
| Device Type | # Households | % Households |
| Desktop or Laptop | 900 | 80.4% |
| Smartphone | 1,035 | 92.4% |
| Tablet | 696 | 62.1% |
| No Computing Device | 46 | 4.1% |
| Total | 1,120 | 100.0% |
Internet Access in Bennett
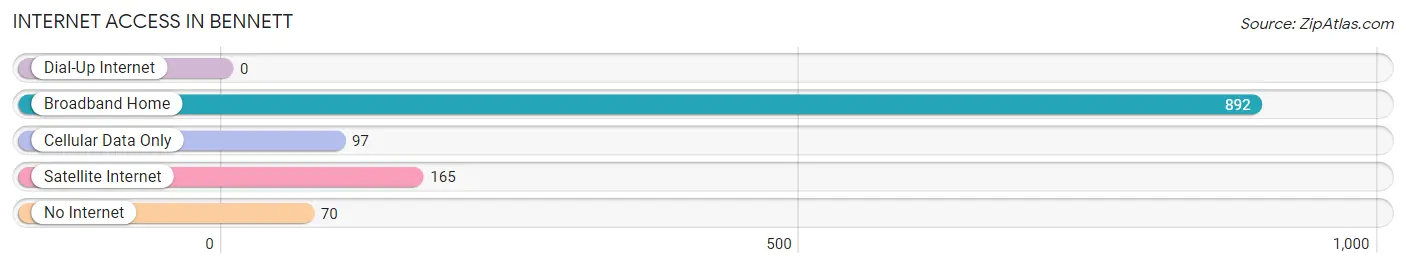
| Internet Type | # Households | % Households |
| Dial-Up Internet | 0 | 0.0% |
| Broadband Home | 892 | 79.6% |
| Cellular Data Only | 97 | 8.7% |
| Satellite Internet | 165 | 14.7% |
| No Internet | 70 | 6.2% |
| Total | 1,120 | 100.0% |
Bennett Summary
Bennett, Colorado is a small town located in Adams County, Colorado, approximately 25 miles east of Denver. The town was founded in 1882 and has a population of approximately 4,000 people. Bennett is a rural community with a strong agricultural heritage, and is known for its small-town charm and friendly atmosphere.
Geography
Bennett is located in the South Platte River Valley, at an elevation of 5,400 feet. The town is surrounded by rolling hills and open plains, and is situated in the foothills of the Rocky Mountains. The town is located in the Denver-Aurora-Lakewood Metropolitan Statistical Area, and is part of the Denver-Aurora-Boulder Combined Statistical Area.
The town is located in the South Platte River Valley, and is bordered by the towns of Strasburg to the north, Byers to the east, Deer Trail to the south, and Watkins to the west. The town is located approximately 25 miles east of Denver, and is accessible via Interstate 70 and U.S. Highway 36.
Economy
Bennett’s economy is largely based on agriculture, with the town’s main industries being farming, ranching, and livestock production. The town is also home to several small businesses, including a grocery store, a hardware store, and a few restaurants.
The town is also home to several small manufacturing companies, including a plastics manufacturer, a metal fabrication company, and a machine shop. The town is also home to a number of small service businesses, including a gas station, a car repair shop, and a few auto body shops.
Demographics
As of the 2010 census, the population of Bennett was 4,094. The racial makeup of the town was 91.3% White, 0.7% African American, 0.7% Native American, 0.3% Asian, 0.1% Pacific Islander, 4.3% from other races, and 2.6% from two or more races. Hispanic or Latino of any race were 10.2% of the population.
The median income for a household in the town was $45,938, and the median income for a family was $51,938. The per capita income for the town was $20,938. About 8.3% of families and 10.2% of the population were below the poverty line, including 14.3% of those under age 18 and 6.3% of those age 65 or over.
Conclusion
Bennett, Colorado is a small town located in Adams County, Colorado, approximately 25 miles east of Denver. The town was founded in 1882 and has a population of approximately 4,000 people. Bennett is a rural community with a strong agricultural heritage, and is known for its small-town charm and friendly atmosphere. The town’s economy is largely based on agriculture, with the town’s main industries being farming, ranching, and livestock production. The town is also home to several small businesses, including a grocery store, a hardware store, and a few restaurants. The town is also home to several small manufacturing companies, including a plastics manufacturer, a metal fabrication company, and a machine shop. The town is also home to a number of small service businesses, including a gas station, a car repair shop, and a few auto body shops. As of the 2010 census, the population of Bennett was 4,094. The racial makeup of the town was 91.3% White, 0.7% African American, 0.7% Native American, 0.3% Asian, 0.1% Pacific Islander, 4.3% from other races, and 2.6% from two or more races. Hispanic or Latino of any race were 10.2% of the population. Bennett is a small town with a strong agricultural heritage, and is known for its small-town charm and friendly atmosphere.
Common Questions
What is Per Capita Income in Bennett?
Per Capita income in Bennett is $38,022.
What is the Median Family Income in Bennett?
Median Family Income in Bennett is $110,781.
What is the Median Household income in Bennett?
Median Household Income in Bennett is $82,035.
What is Income or Wage Gap in Bennett?
Income or Wage Gap in Bennett is 39.9%.
Women in Bennett earn 60.1 cents for every dollar earned by a man.
What is Inequality or Gini Index in Bennett?
Inequality or Gini Index in Bennett is 0.38.
What is the Total Population of Bennett?
Total Population of Bennett is 3,299.
What is the Total Male Population of Bennett?
Total Male Population of Bennett is 1,700.
What is the Total Female Population of Bennett?
Total Female Population of Bennett is 1,599.
What is the Ratio of Males per 100 Females in Bennett?
There are 106.32 Males per 100 Females in Bennett.
What is the Ratio of Females per 100 Males in Bennett?
There are 94.06 Females per 100 Males in Bennett.
What is the Median Population Age in Bennett?
Median Population Age in Bennett is 34.5 Years.
What is the Average Family Size in Bennett
Average Family Size in Bennett is 3.5 People.
What is the Average Household Size in Bennett
Average Household Size in Bennett is 3.0 People.
How Large is the Labor Force in Bennett?
There are 1,739 People in the Labor Forcein in Bennett.
What is the Percentage of People in the Labor Force in Bennett?
67.1% of People are in the Labor Force in Bennett.
What is the Unemployment Rate in Bennett?
Unemployment Rate in Bennett is 2.3%.