Ault, CO Map & Demographics
Ault Map
Ault Overview
$31,520
PER CAPITA INCOME
$92,500
AVG FAMILY INCOME
$76,215
AVG HOUSEHOLD INCOME
48.6%
WAGE / INCOME GAP [ % ]
51.4¢/ $1
WAGE / INCOME GAP [ $ ]
0.32
INEQUALITY / GINI INDEX
1,601
TOTAL POPULATION
829
MALE POPULATION
772
FEMALE POPULATION
107.38
MALES / 100 FEMALES
93.12
FEMALES / 100 MALES
37.8
MEDIAN AGE
3.2
AVG FAMILY SIZE
2.6
AVG HOUSEHOLD SIZE
857
LABOR FORCE [ PEOPLE ]
69.3%
PERCENT IN LABOR FORCE
1.6%
UNEMPLOYMENT RATE
Ault Zip Codes
Income in Ault
Income Overview in Ault
Per Capita Income in Ault is $31,520, while median incomes of families and households are $92,500 and $76,215 respectively.
| Characteristic | Number | Measure |
| Per Capita Income | 1,601 | $31,520 |
| Median Family Income | 404 | $92,500 |
| Mean Family Income | 404 | $95,047 |
| Median Household Income | 612 | $76,215 |
| Mean Household Income | 612 | $78,856 |
| Income Deficit | 404 | $0 |
| Wage / Income Gap (%) | 1,601 | 48.61% |
| Wage / Income Gap ($) | 1,601 | 51.39¢ per $1 |
| Gini / Inequality Index | 1,601 | 0.32 |
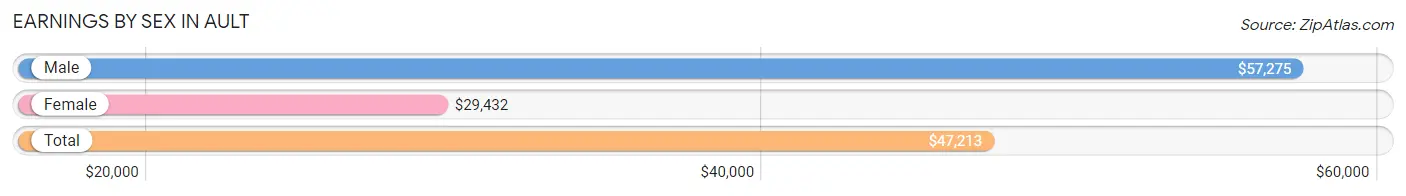
Earnings by Sex in Ault
Average Earnings in Ault are $47,213, $57,275 for men and $29,432 for women, a difference of 48.6%.
| Sex | Number | Average Earnings |
| Male | 517 (59.6%) | $57,275 |
| Female | 350 (40.4%) | $29,432 |
| Total | 867 (100.0%) | $47,213 |
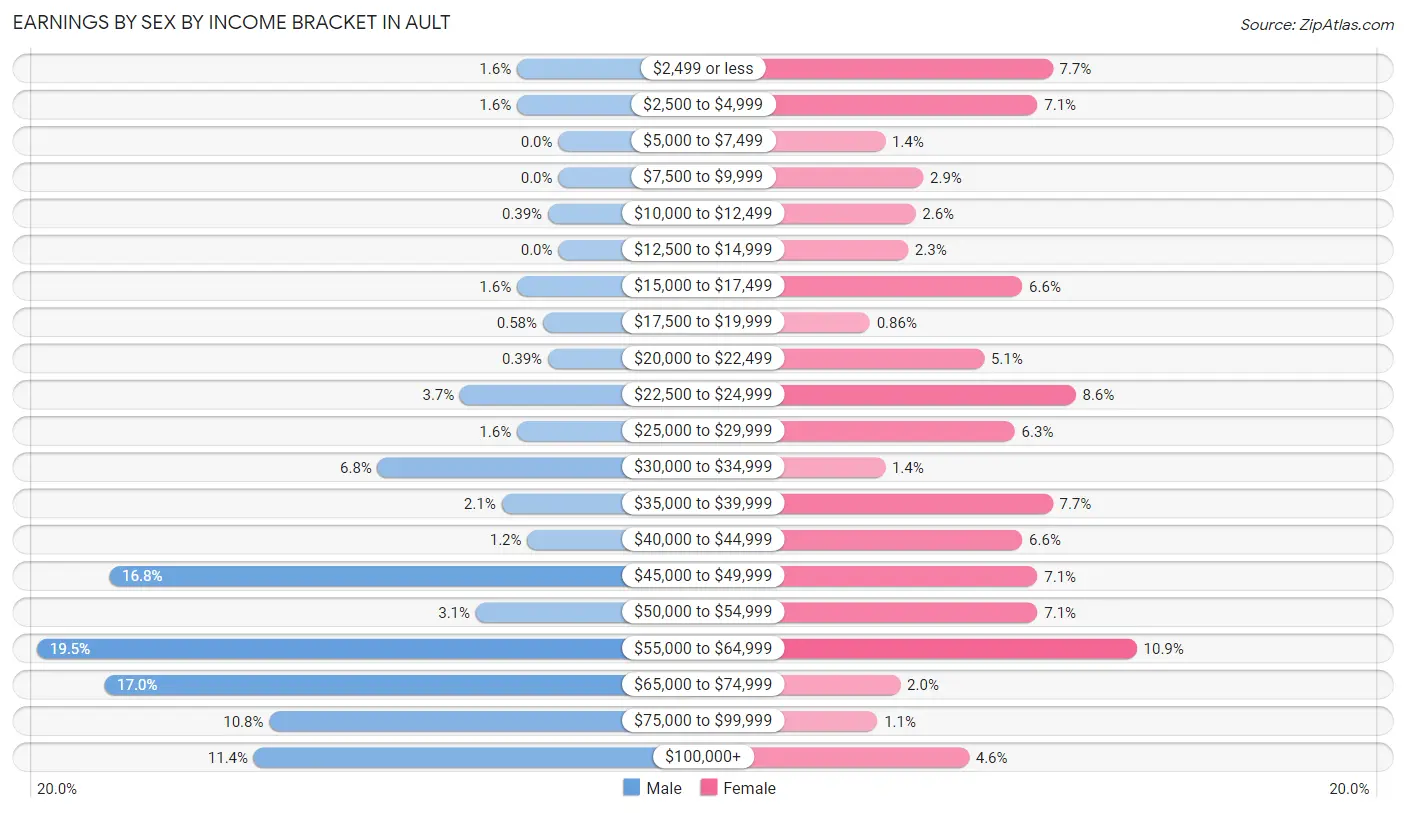
Earnings by Sex by Income Bracket in Ault
The most common earnings brackets in Ault are $55,000 to $64,999 for men (101 | 19.5%) and $55,000 to $64,999 for women (38 | 10.9%).
| Income | Male | Female |
| $2,499 or less | 8 (1.5%) | 27 (7.7%) |
| $2,500 to $4,999 | 8 (1.5%) | 25 (7.1%) |
| $5,000 to $7,499 | 0 (0.0%) | 5 (1.4%) |
| $7,500 to $9,999 | 0 (0.0%) | 10 (2.9%) |
| $10,000 to $12,499 | 2 (0.4%) | 9 (2.6%) |
| $12,500 to $14,999 | 0 (0.0%) | 8 (2.3%) |
| $15,000 to $17,499 | 8 (1.5%) | 23 (6.6%) |
| $17,500 to $19,999 | 3 (0.6%) | 3 (0.9%) |
| $20,000 to $22,499 | 2 (0.4%) | 18 (5.1%) |
| $22,500 to $24,999 | 19 (3.7%) | 30 (8.6%) |
| $25,000 to $29,999 | 8 (1.5%) | 22 (6.3%) |
| $30,000 to $34,999 | 35 (6.8%) | 5 (1.4%) |
| $35,000 to $39,999 | 11 (2.1%) | 27 (7.7%) |
| $40,000 to $44,999 | 6 (1.2%) | 23 (6.6%) |
| $45,000 to $49,999 | 87 (16.8%) | 25 (7.1%) |
| $50,000 to $54,999 | 16 (3.1%) | 25 (7.1%) |
| $55,000 to $64,999 | 101 (19.5%) | 38 (10.9%) |
| $65,000 to $74,999 | 88 (17.0%) | 7 (2.0%) |
| $75,000 to $99,999 | 56 (10.8%) | 4 (1.1%) |
| $100,000+ | 59 (11.4%) | 16 (4.6%) |
| Total | 517 (100.0%) | 350 (100.0%) |
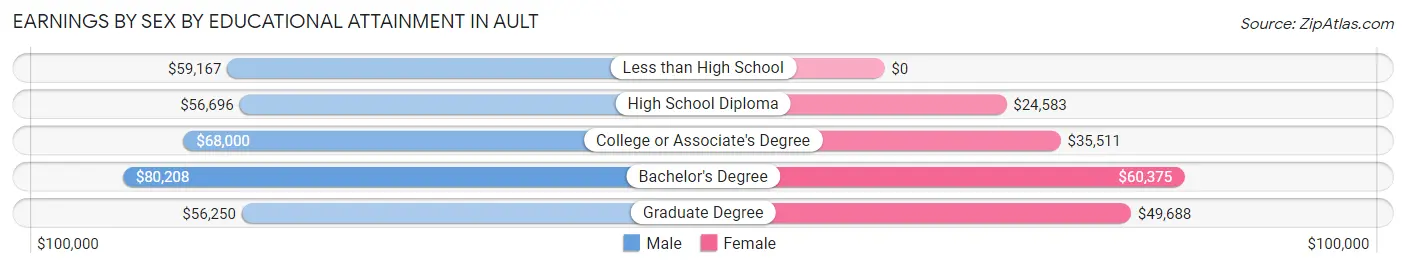
Earnings by Sex by Educational Attainment in Ault
Average earnings in Ault are $58,542 for men and $34,000 for women, a difference of 41.9%. Men with an educational attainment of bachelor's degree enjoy the highest average annual earnings of $80,208, while those with graduate degree education earn the least with $56,250. Women with an educational attainment of bachelor's degree earn the most with the average annual earnings of $60,375, while those with high school diploma education have the smallest earnings of $24,583.
| Educational Attainment | Male Income | Female Income |
| Less than High School | $59,167 | $0 |
| High School Diploma | $56,696 | $24,583 |
| College or Associate's Degree | $68,000 | $35,511 |
| Bachelor's Degree | $80,208 | $60,375 |
| Graduate Degree | $56,250 | $49,688 |
| Total | $58,542 | $34,000 |
Family Income in Ault
Family Income Brackets in Ault
According to the Ault family income data, there are 126 families falling into the $100,000 to $149,999 income range, which is the most common income bracket and makes up 31.2% of all families.
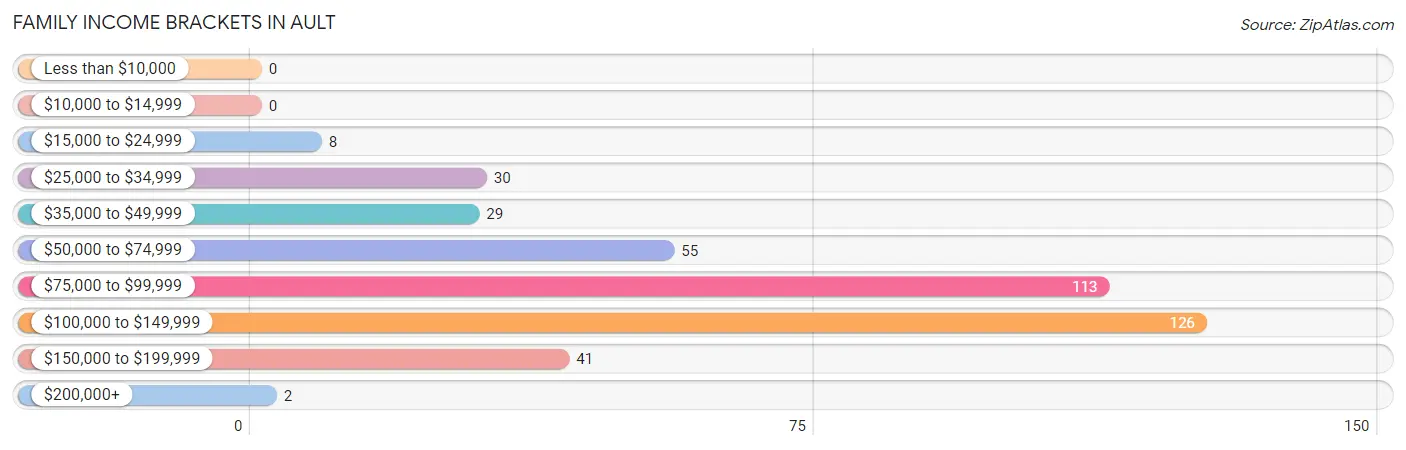
| Income Bracket | # Families | % Families |
| Less than $10,000 | 0 | 0.0% |
| $10,000 to $14,999 | 0 | 0.0% |
| $15,000 to $24,999 | 8 | 2.0% |
| $25,000 to $34,999 | 30 | 7.4% |
| $35,000 to $49,999 | 29 | 7.2% |
| $50,000 to $74,999 | 55 | 13.6% |
| $75,000 to $99,999 | 113 | 28.0% |
| $100,000 to $149,999 | 126 | 31.2% |
| $150,000 to $199,999 | 41 | 10.1% |
| $200,000+ | 2 | 0.5% |
Family Income by Famaliy Size in Ault
6-person families (20 | 5.0%) account for the highest median family income in Ault with $102,188 per family, while 2-person families (198 | 49.0%) have the highest median income of $45,208 per family member.
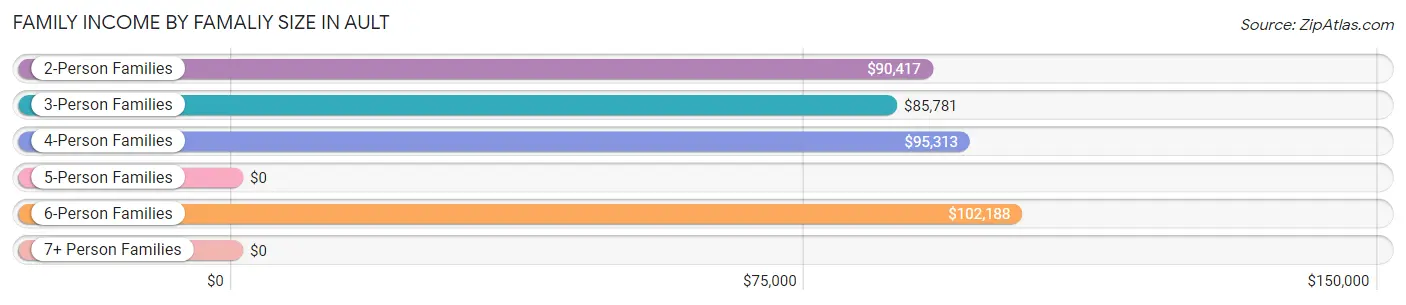
| Income Bracket | # Families | Median Income |
| 2-Person Families | 198 (49.0%) | $90,417 |
| 3-Person Families | 89 (22.0%) | $85,781 |
| 4-Person Families | 52 (12.9%) | $95,313 |
| 5-Person Families | 26 (6.4%) | $0 |
| 6-Person Families | 20 (5.0%) | $102,188 |
| 7+ Person Families | 19 (4.7%) | $0 |
| Total | 404 (100.0%) | $92,500 |
Family Income by Number of Earners in Ault
The median family income in Ault is $92,500, with families comprising 3+ earners (46) having the highest median family income of $138,500, while families with no earners (36) have the lowest median family income of $43,182, accounting for 11.4% and 8.9% of families, respectively.
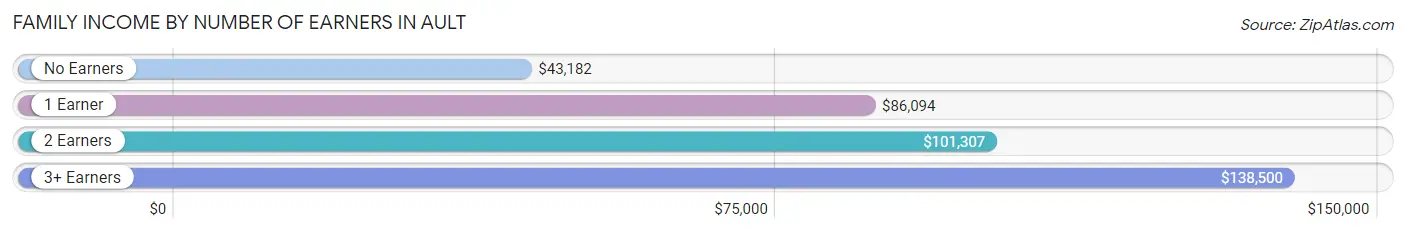
| Number of Earners | # Families | Median Income |
| No Earners | 36 (8.9%) | $43,182 |
| 1 Earner | 101 (25.0%) | $86,094 |
| 2 Earners | 221 (54.7%) | $101,307 |
| 3+ Earners | 46 (11.4%) | $138,500 |
| Total | 404 (100.0%) | $92,500 |
Household Income in Ault
Household Income Brackets in Ault
With 165 households falling in the category, the $75,000 to $99,999 income range is the most frequent in Ault, accounting for 27.0% of all households. In contrast, only 2 households (0.3%) fall into the $200,000+ income bracket, making it the least populous group.
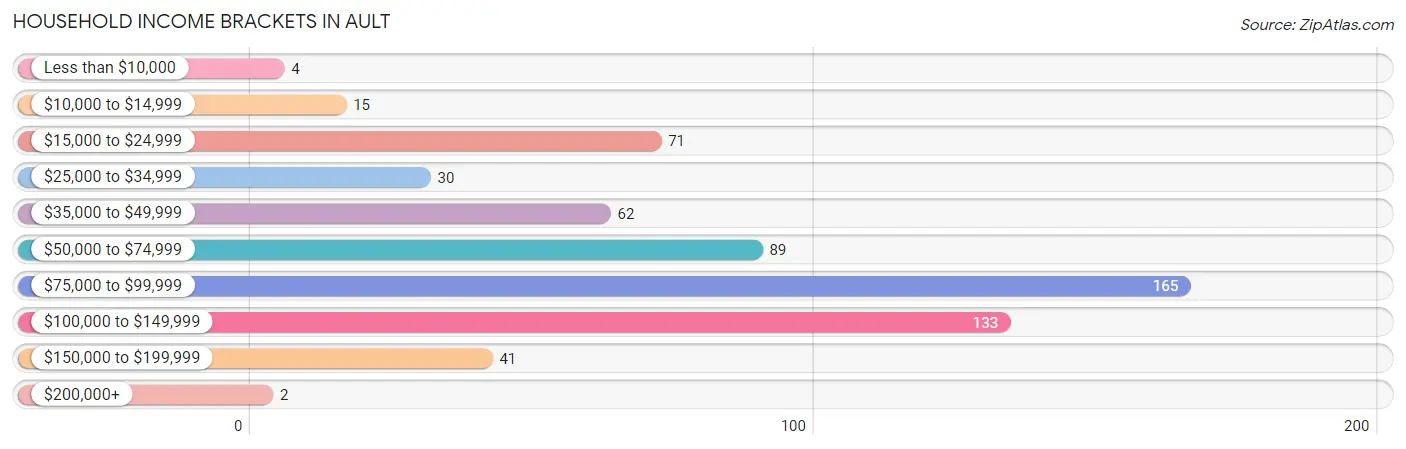
| Income Bracket | # Households | % Households |
| Less than $10,000 | 4 | 0.7% |
| $10,000 to $14,999 | 15 | 2.5% |
| $15,000 to $24,999 | 71 | 11.6% |
| $25,000 to $34,999 | 30 | 4.9% |
| $35,000 to $49,999 | 62 | 10.1% |
| $50,000 to $74,999 | 89 | 14.5% |
| $75,000 to $99,999 | 165 | 27.0% |
| $100,000 to $149,999 | 133 | 21.7% |
| $150,000 to $199,999 | 41 | 6.7% |
| $200,000+ | 2 | 0.3% |
Household Income by Householder Age in Ault
The median household income in Ault is $76,215, with the highest median household income of $93,409 found in the 25 to 44 years age bracket for the primary householder. A total of 202 households (33.0%) fall into this category. Meanwhile, the 15 to 24 years age bracket for the primary householder has the lowest median household income of $0, with 14 households (2.3%) in this group.
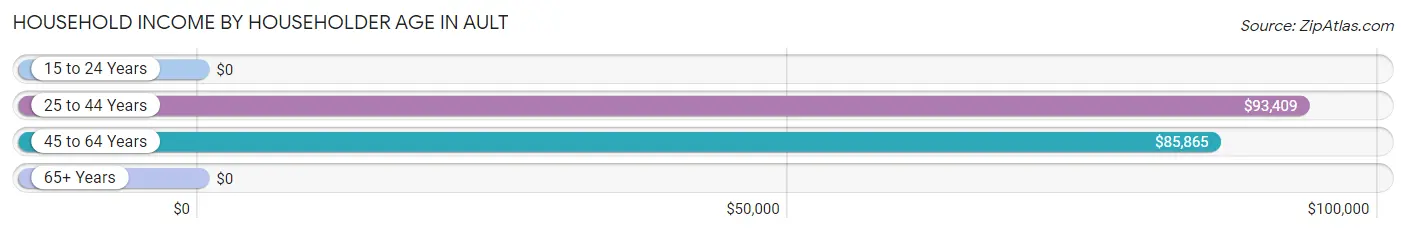
| Income Bracket | # Households | Median Income |
| 15 to 24 Years | 14 (2.3%) | $0 |
| 25 to 44 Years | 202 (33.0%) | $93,409 |
| 45 to 64 Years | 213 (34.8%) | $85,865 |
| 65+ Years | 183 (29.9%) | $0 |
| Total | 612 (100.0%) | $76,215 |
Poverty in Ault
Income Below Poverty by Sex and Age in Ault
With 6.1% poverty level for males and 6.0% for females among the residents of Ault, 55 to 64 year old males and 65 to 74 year old females are the most vulnerable to poverty, with 28 males (25.7%) and 10 females (18.2%) in their respective age groups living below the poverty level.
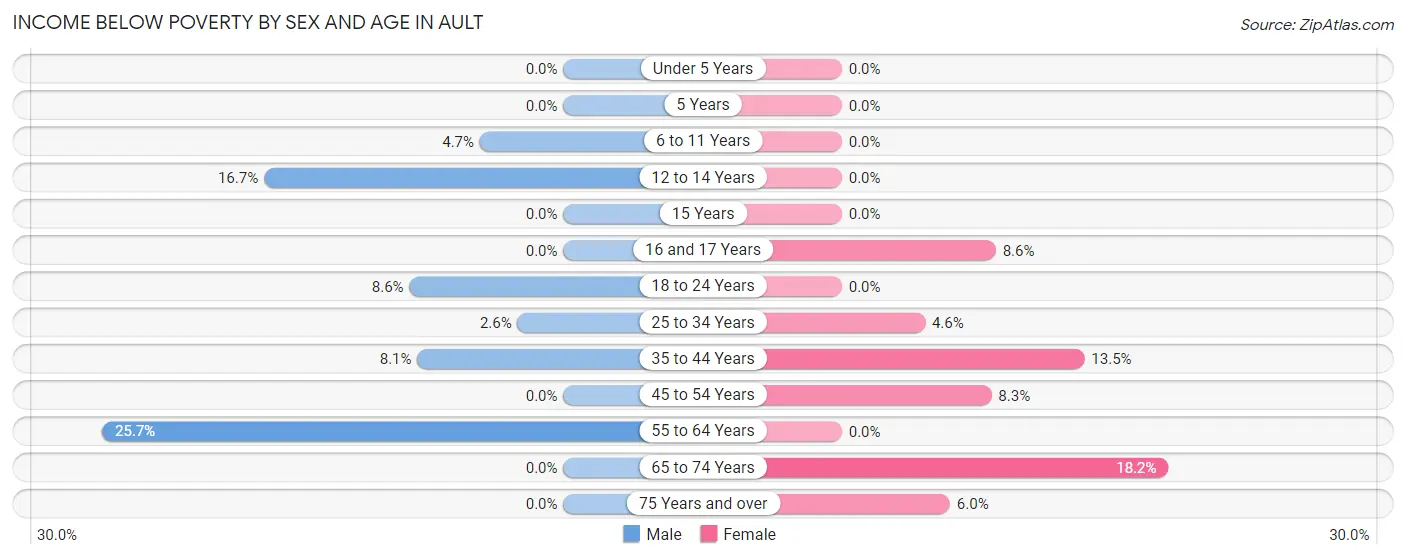
| Age Bracket | Male | Female |
| Under 5 Years | 0 (0.0%) | 0 (0.0%) |
| 5 Years | 0 (0.0%) | 0 (0.0%) |
| 6 to 11 Years | 2 (4.6%) | 0 (0.0%) |
| 12 to 14 Years | 3 (16.7%) | 0 (0.0%) |
| 15 Years | 0 (0.0%) | 0 (0.0%) |
| 16 and 17 Years | 0 (0.0%) | 3 (8.6%) |
| 18 to 24 Years | 3 (8.6%) | 0 (0.0%) |
| 25 to 34 Years | 4 (2.5%) | 5 (4.6%) |
| 35 to 44 Years | 10 (8.1%) | 15 (13.5%) |
| 45 to 54 Years | 0 (0.0%) | 8 (8.3%) |
| 55 to 64 Years | 28 (25.7%) | 0 (0.0%) |
| 65 to 74 Years | 0 (0.0%) | 10 (18.2%) |
| 75 Years and over | 0 (0.0%) | 5 (6.0%) |
| Total | 50 (6.1%) | 46 (6.0%) |
Income Above Poverty by Sex and Age in Ault
According to the poverty statistics in Ault, males aged under 5 years and females aged under 5 years are the age groups that are most secure financially, with 100.0% of males and 100.0% of females in these age groups living above the poverty line.
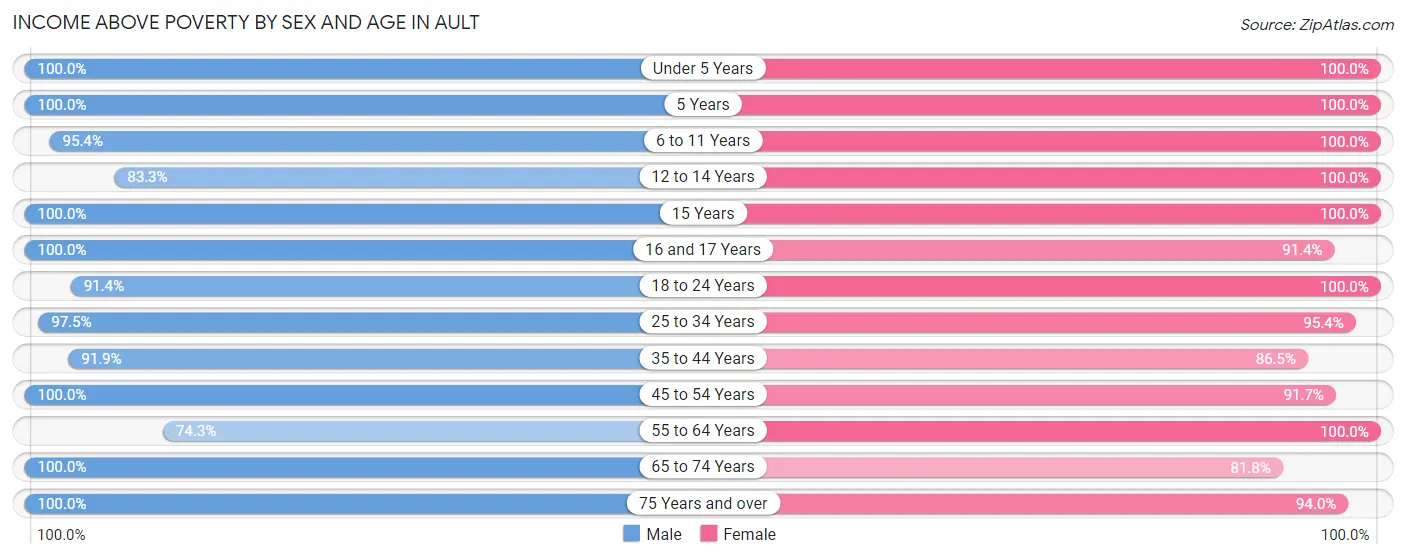
| Age Bracket | Male | Female |
| Under 5 Years | 80 (100.0%) | 18 (100.0%) |
| 5 Years | 16 (100.0%) | 14 (100.0%) |
| 6 to 11 Years | 41 (95.4%) | 71 (100.0%) |
| 12 to 14 Years | 15 (83.3%) | 68 (100.0%) |
| 15 Years | 4 (100.0%) | 23 (100.0%) |
| 16 and 17 Years | 15 (100.0%) | 32 (91.4%) |
| 18 to 24 Years | 32 (91.4%) | 16 (100.0%) |
| 25 to 34 Years | 153 (97.5%) | 103 (95.4%) |
| 35 to 44 Years | 113 (91.9%) | 96 (86.5%) |
| 45 to 54 Years | 81 (100.0%) | 88 (91.7%) |
| 55 to 64 Years | 81 (74.3%) | 70 (100.0%) |
| 65 to 74 Years | 110 (100.0%) | 45 (81.8%) |
| 75 Years and over | 32 (100.0%) | 78 (94.0%) |
| Total | 773 (93.9%) | 722 (94.0%) |
Income Below Poverty Among Married-Couple Families in Ault
The poverty statistics for married-couple families in Ault show that 1.0% or 3 of the total 307 families live below the poverty line. Families with 3 or 4 children have the highest poverty rate of 14.3%, comprising of 3 families. On the other hand, families with no children have the lowest poverty rate of 0.0%, which includes 0 families.
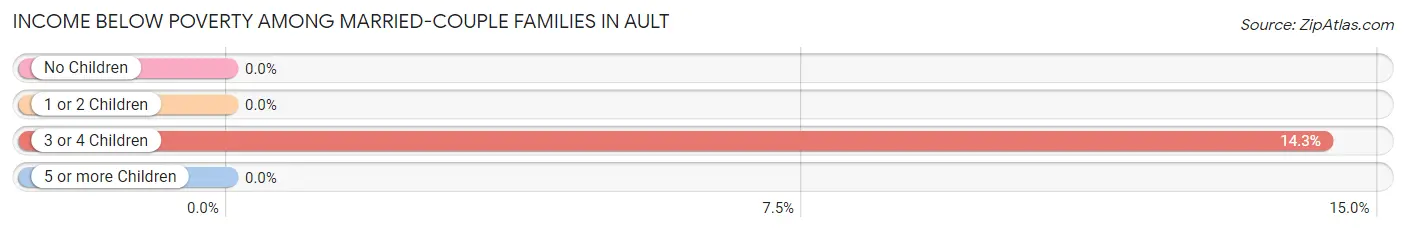
| Children | Above Poverty | Below Poverty |
| No Children | 145 (100.0%) | 0 (0.0%) |
| 1 or 2 Children | 122 (100.0%) | 0 (0.0%) |
| 3 or 4 Children | 18 (85.7%) | 3 (14.3%) |
| 5 or more Children | 19 (100.0%) | 0 (0.0%) |
| Total | 304 (99.0%) | 3 (1.0%) |
Income Below Poverty Among Single-Parent Households in Ault
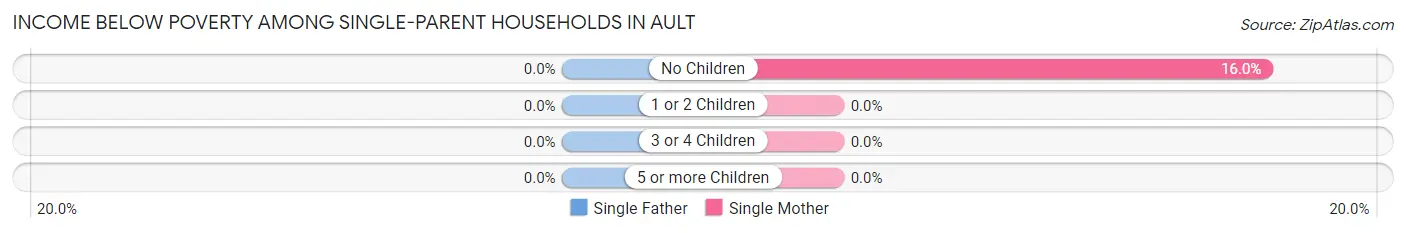
| Children | Single Father | Single Mother |
| No Children | 0 (0.0%) | 4 (16.0%) |
| 1 or 2 Children | 0 (0.0%) | 0 (0.0%) |
| 3 or 4 Children | 0 (0.0%) | 0 (0.0%) |
| 5 or more Children | 0 (0.0%) | 0 (0.0%) |
| Total | 0 (0.0%) | 4 (8.3%) |
Income Below Poverty Among Married-Couple vs Single-Parent Households in Ault
The poverty data for Ault shows that 3 of the married-couple family households (1.0%) and 4 of the single-parent households (4.1%) are living below the poverty level. Within the married-couple family households, those with 3 or 4 children have the highest poverty rate, with 3 households (14.3%) falling below the poverty line. Among the single-parent households, those with no children have the highest poverty rate, with 4 household (5.8%) living below poverty.
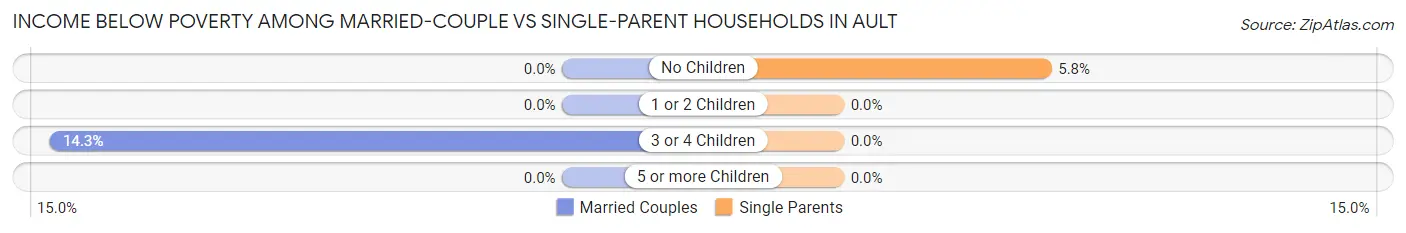
| Children | Married-Couple Families | Single-Parent Households |
| No Children | 0 (0.0%) | 4 (5.8%) |
| 1 or 2 Children | 0 (0.0%) | 0 (0.0%) |
| 3 or 4 Children | 3 (14.3%) | 0 (0.0%) |
| 5 or more Children | 0 (0.0%) | 0 (0.0%) |
| Total | 3 (1.0%) | 4 (4.1%) |
Race in Ault
The most populous races in Ault are White / Caucasian (1,371 | 85.6%), Hispanic or Latino (453 | 28.3%), and Two or more Races (154 | 9.6%).
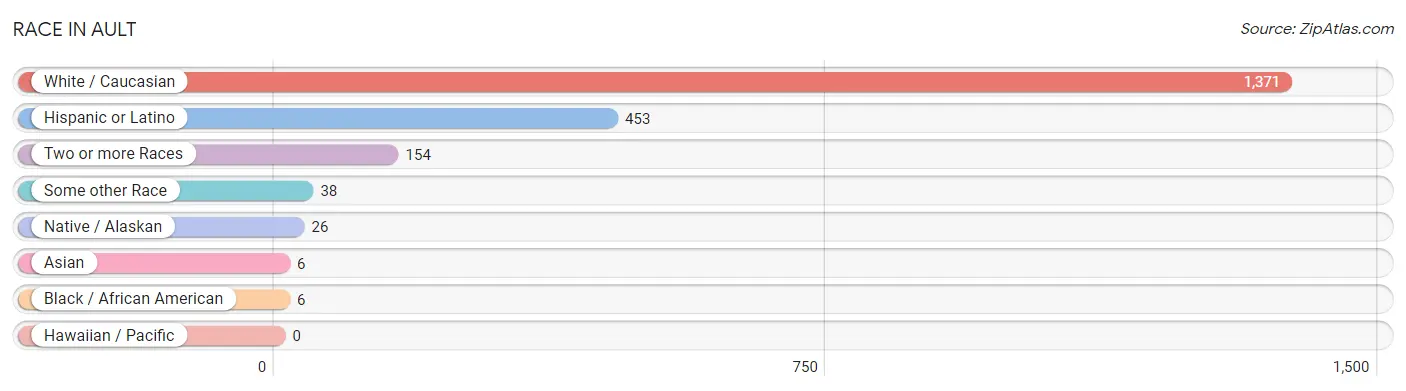
| Race | # Population | % Population |
| Asian | 6 | 0.4% |
| Black / African American | 6 | 0.4% |
| Hawaiian / Pacific | 0 | 0.0% |
| Hispanic or Latino | 453 | 28.3% |
| Native / Alaskan | 26 | 1.6% |
| White / Caucasian | 1,371 | 85.6% |
| Two or more Races | 154 | 9.6% |
| Some other Race | 38 | 2.4% |
| Total | 1,601 | 100.0% |
Ancestry in Ault
The most populous ancestries reported in Ault are German (409 | 25.6%), Mexican (331 | 20.7%), Irish (133 | 8.3%), English (92 | 5.8%), and American (79 | 4.9%), together accounting for 65.2% of all Ault residents.
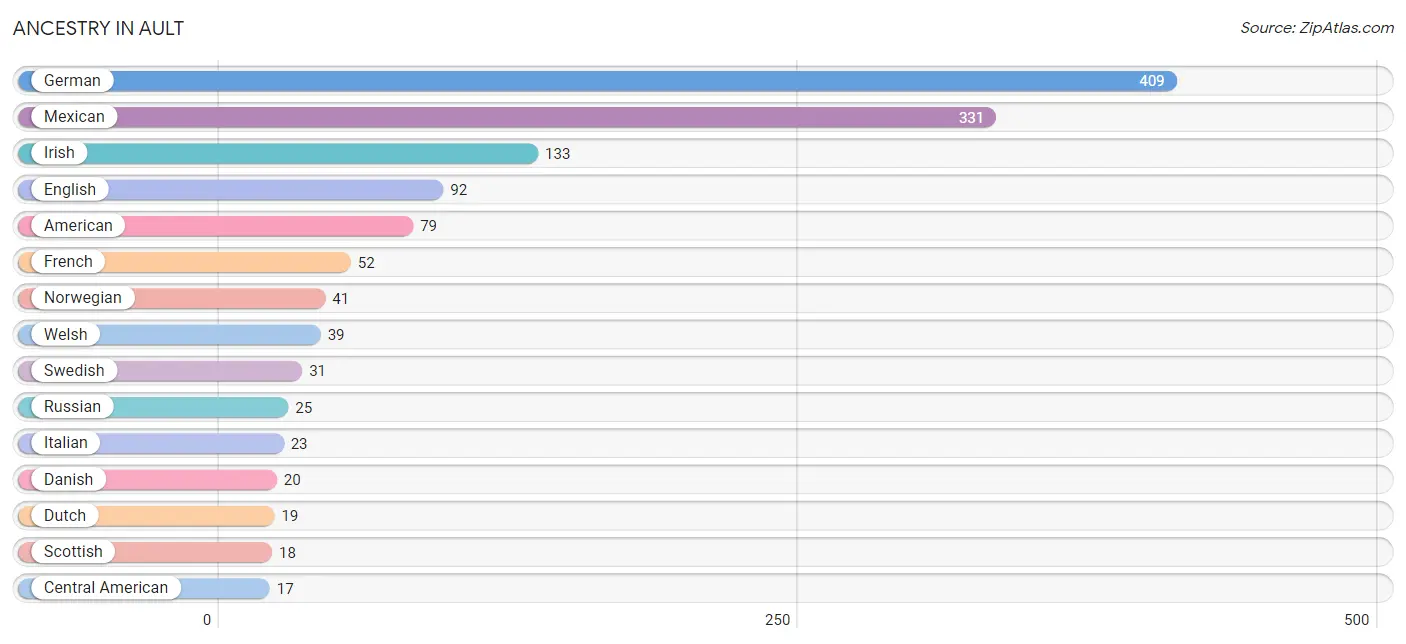
| Ancestry | # Population | % Population |
| American | 79 | 4.9% |
| Apache | 4 | 0.3% |
| Austrian | 8 | 0.5% |
| Bhutanese | 6 | 0.4% |
| Central American | 17 | 1.1% |
| Chippewa | 5 | 0.3% |
| Czech | 4 | 0.3% |
| Danish | 20 | 1.3% |
| Dutch | 19 | 1.2% |
| English | 92 | 5.8% |
| European | 4 | 0.3% |
| French | 52 | 3.3% |
| German | 409 | 25.6% |
| Greek | 8 | 0.5% |
| Hungarian | 8 | 0.5% |
| Irish | 133 | 8.3% |
| Italian | 23 | 1.4% |
| Mexican | 331 | 20.7% |
| Navajo | 14 | 0.9% |
| Norwegian | 41 | 2.6% |
| Polish | 10 | 0.6% |
| Russian | 25 | 1.6% |
| Salvadoran | 17 | 1.1% |
| Scandinavian | 14 | 0.9% |
| Scotch-Irish | 12 | 0.7% |
| Scottish | 18 | 1.1% |
| Slavic | 4 | 0.3% |
| Slovene | 2 | 0.1% |
| Swedish | 31 | 1.9% |
| Swiss | 6 | 0.4% |
| Ukrainian | 9 | 0.6% |
| Welsh | 39 | 2.4% |
| Yugoslavian | 8 | 0.5% | View All 33 Rows |
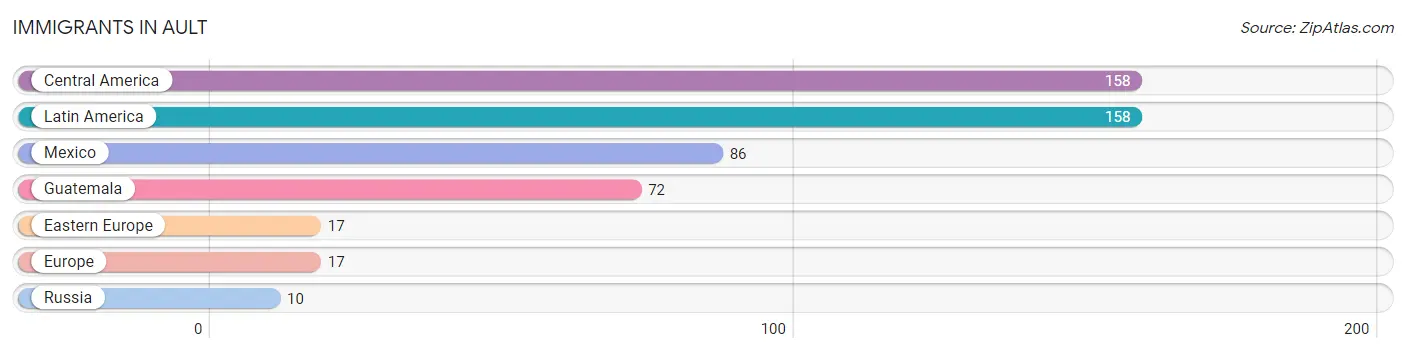
Immigrants in Ault
The most numerous immigrant groups reported in Ault came from Central America (158 | 9.9%), Latin America (158 | 9.9%), Mexico (86 | 5.4%), Guatemala (72 | 4.5%), and Eastern Europe (17 | 1.1%), together accounting for 30.7% of all Ault residents.
| Immigration Origin | # Population | % Population |
| Central America | 158 | 9.9% |
| Eastern Europe | 17 | 1.1% |
| Europe | 17 | 1.1% |
| Guatemala | 72 | 4.5% |
| Latin America | 158 | 9.9% |
| Mexico | 86 | 5.4% |
| Russia | 10 | 0.6% | View All 7 Rows |
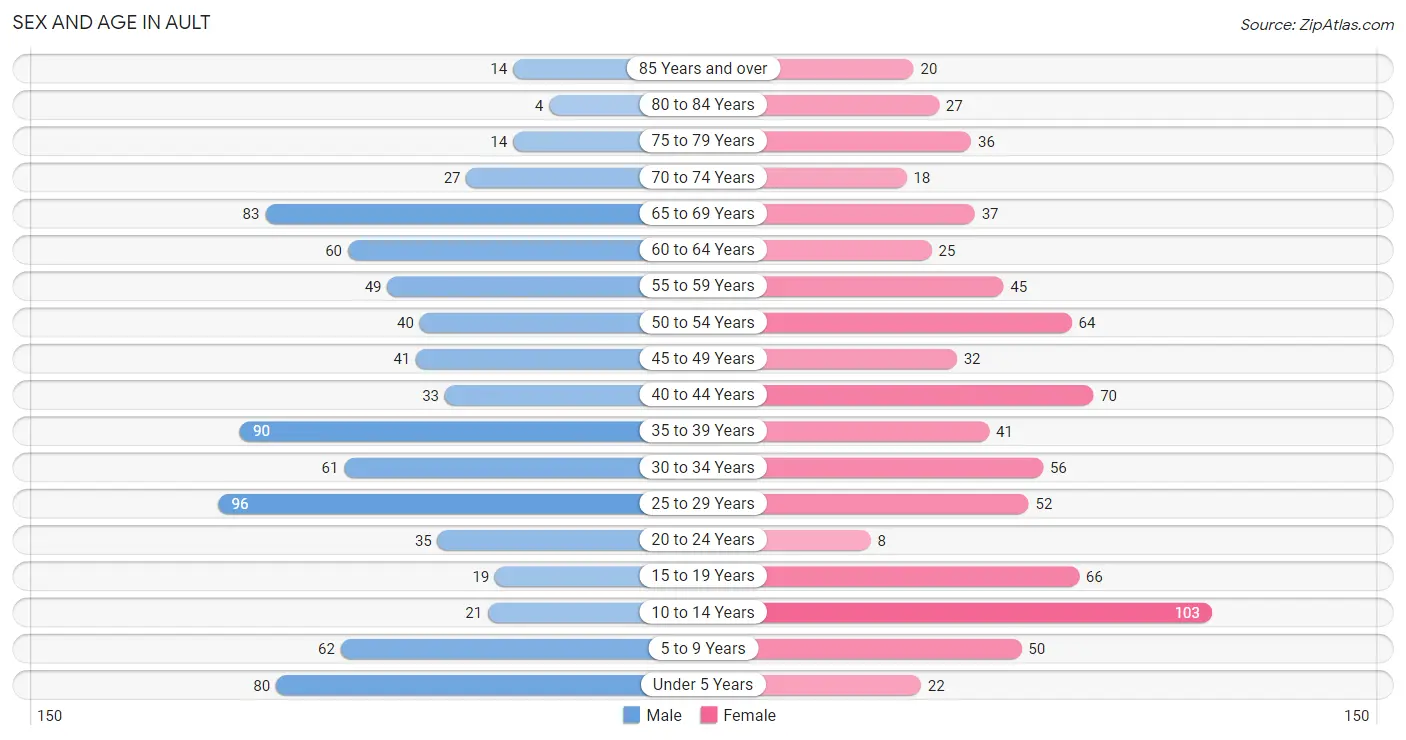
Sex and Age in Ault
Sex and Age in Ault
The most populous age groups in Ault are 25 to 29 Years (96 | 11.6%) for men and 10 to 14 Years (103 | 13.3%) for women.
| Age Bracket | Male | Female |
| Under 5 Years | 80 (9.7%) | 22 (2.9%) |
| 5 to 9 Years | 62 (7.5%) | 50 (6.5%) |
| 10 to 14 Years | 21 (2.5%) | 103 (13.3%) |
| 15 to 19 Years | 19 (2.3%) | 66 (8.6%) |
| 20 to 24 Years | 35 (4.2%) | 8 (1.0%) |
| 25 to 29 Years | 96 (11.6%) | 52 (6.7%) |
| 30 to 34 Years | 61 (7.4%) | 56 (7.2%) |
| 35 to 39 Years | 90 (10.9%) | 41 (5.3%) |
| 40 to 44 Years | 33 (4.0%) | 70 (9.1%) |
| 45 to 49 Years | 41 (5.0%) | 32 (4.2%) |
| 50 to 54 Years | 40 (4.8%) | 64 (8.3%) |
| 55 to 59 Years | 49 (5.9%) | 45 (5.8%) |
| 60 to 64 Years | 60 (7.2%) | 25 (3.2%) |
| 65 to 69 Years | 83 (10.0%) | 37 (4.8%) |
| 70 to 74 Years | 27 (3.3%) | 18 (2.3%) |
| 75 to 79 Years | 14 (1.7%) | 36 (4.7%) |
| 80 to 84 Years | 4 (0.5%) | 27 (3.5%) |
| 85 Years and over | 14 (1.7%) | 20 (2.6%) |
| Total | 829 (100.0%) | 772 (100.0%) |
Families and Households in Ault
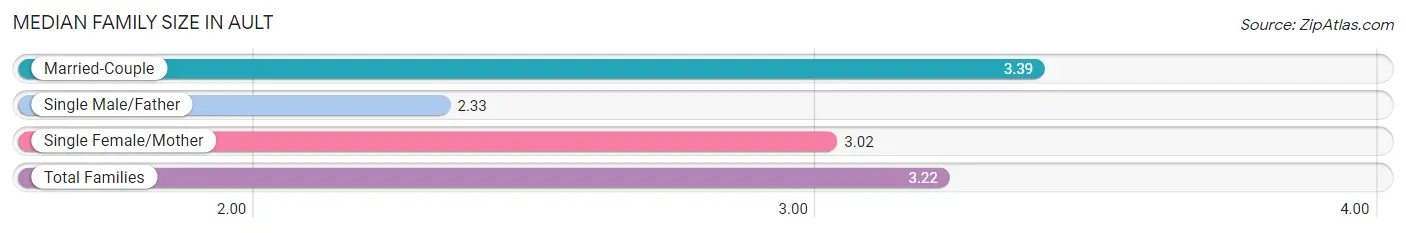
Median Family Size in Ault
The median family size in Ault is 3.22 persons per family, with married-couple families (307 | 76.0%) accounting for the largest median family size of 3.39 persons per family. On the other hand, single male/father families (49 | 12.1%) represent the smallest median family size with 2.33 persons per family.
| Family Type | # Families | Family Size |
| Married-Couple | 307 (76.0%) | 3.39 |
| Single Male/Father | 49 (12.1%) | 2.33 |
| Single Female/Mother | 48 (11.9%) | 3.02 |
| Total Families | 404 (100.0%) | 3.22 |
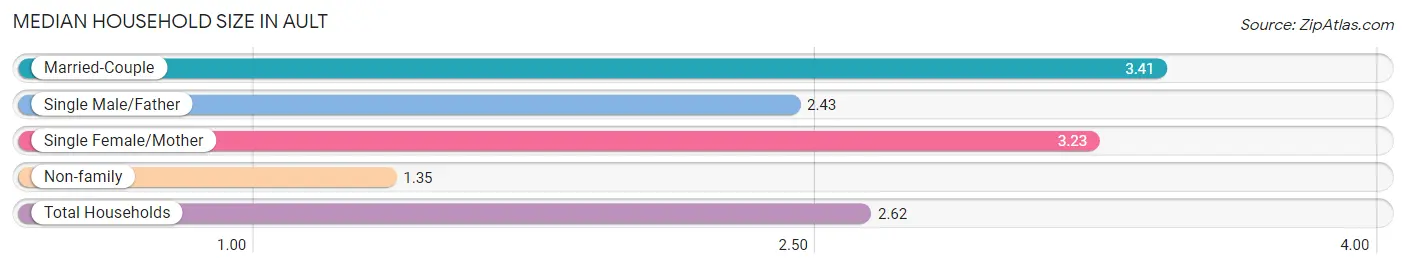
Median Household Size in Ault
The median household size in Ault is 2.62 persons per household, with married-couple households (307 | 50.2%) accounting for the largest median household size of 3.41 persons per household. non-family households (208 | 34.0%) represent the smallest median household size with 1.35 persons per household.
| Household Type | # Households | Household Size |
| Married-Couple | 307 (50.2%) | 3.41 |
| Single Male/Father | 49 (8.0%) | 2.43 |
| Single Female/Mother | 48 (7.8%) | 3.23 |
| Non-family | 208 (34.0%) | 1.35 |
| Total Households | 612 (100.0%) | 2.62 |
Household Size by Marriage Status in Ault
Out of a total of 612 households in Ault, 404 (66.0%) are family households, while 208 (34.0%) are nonfamily households. The most numerous type of family households are 2-person households, comprising 186, and the most common type of nonfamily households are 1-person households, comprising 164.
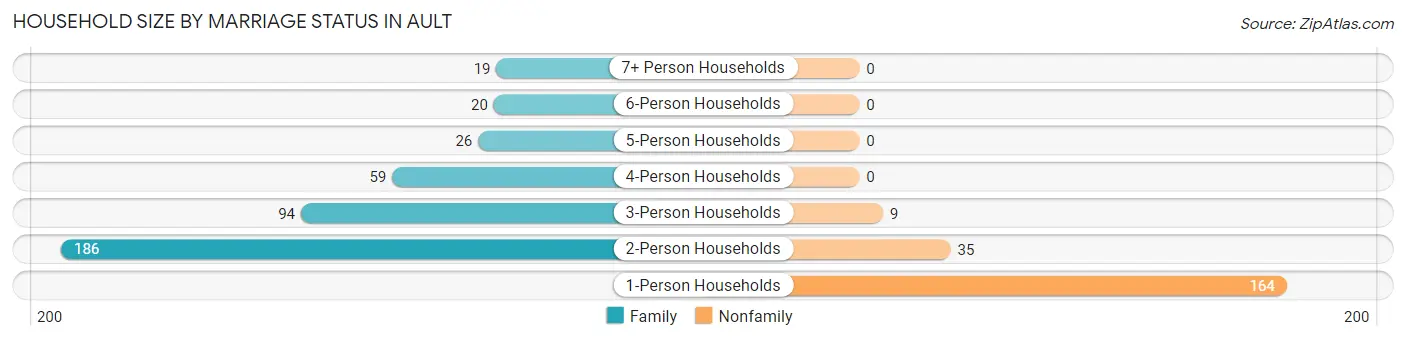
| Household Size | Family Households | Nonfamily Households |
| 1-Person Households | - | 164 (26.8%) |
| 2-Person Households | 186 (30.4%) | 35 (5.7%) |
| 3-Person Households | 94 (15.4%) | 9 (1.5%) |
| 4-Person Households | 59 (9.6%) | 0 (0.0%) |
| 5-Person Households | 26 (4.3%) | 0 (0.0%) |
| 6-Person Households | 20 (3.3%) | 0 (0.0%) |
| 7+ Person Households | 19 (3.1%) | 0 (0.0%) |
| Total | 404 (66.0%) | 208 (34.0%) |
Female Fertility in Ault
Fertility by Age in Ault
Average fertility rate in Ault is 30.0 births per 1,000 women. Women in the age bracket of 20 to 34 years have the highest fertility rate with 69.0 births per 1,000 women. Women in the age bracket of 20 to 34 years acount for 80.0% of all women with births.
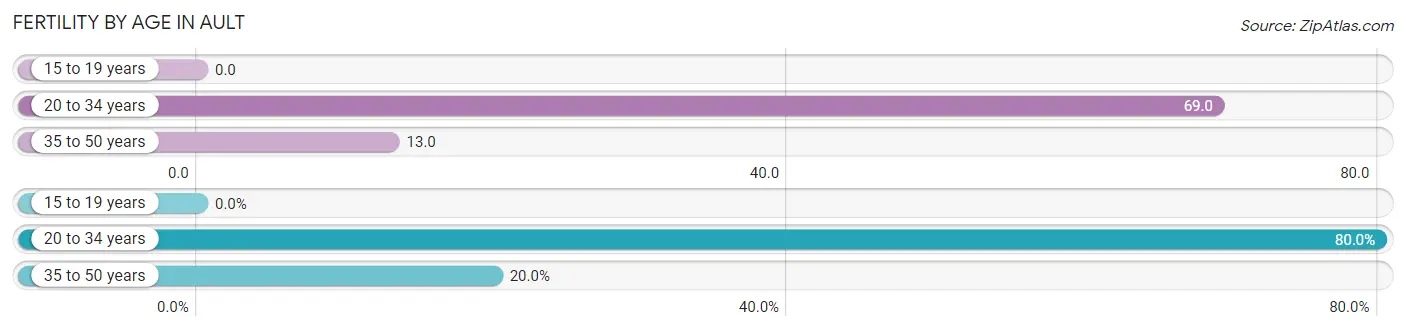
| Age Bracket | Women with Births | Births / 1,000 Women |
| 15 to 19 years | 0 (0.0%) | 0.0 |
| 20 to 34 years | 8 (80.0%) | 69.0 |
| 35 to 50 years | 2 (20.0%) | 13.0 |
| Total | 10 (100.0%) | 30.0 |
Fertility by Age by Marriage Status in Ault
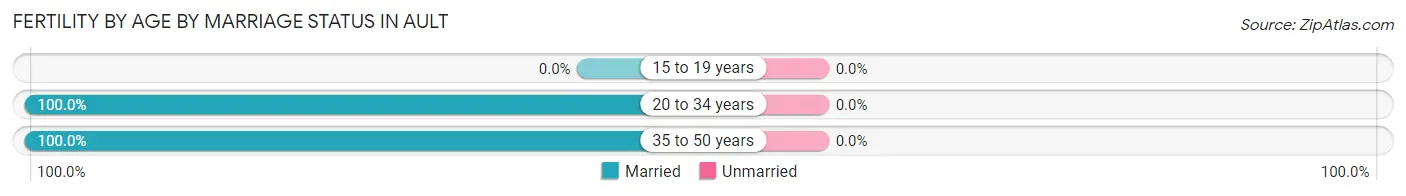
| Age Bracket | Married | Unmarried |
| 15 to 19 years | 0 (0.0%) | 0 (0.0%) |
| 20 to 34 years | 8 (100.0%) | 0 (0.0%) |
| 35 to 50 years | 2 (100.0%) | 0 (0.0%) |
| Total | 10 (100.0%) | 0 (0.0%) |
Fertility by Education in Ault
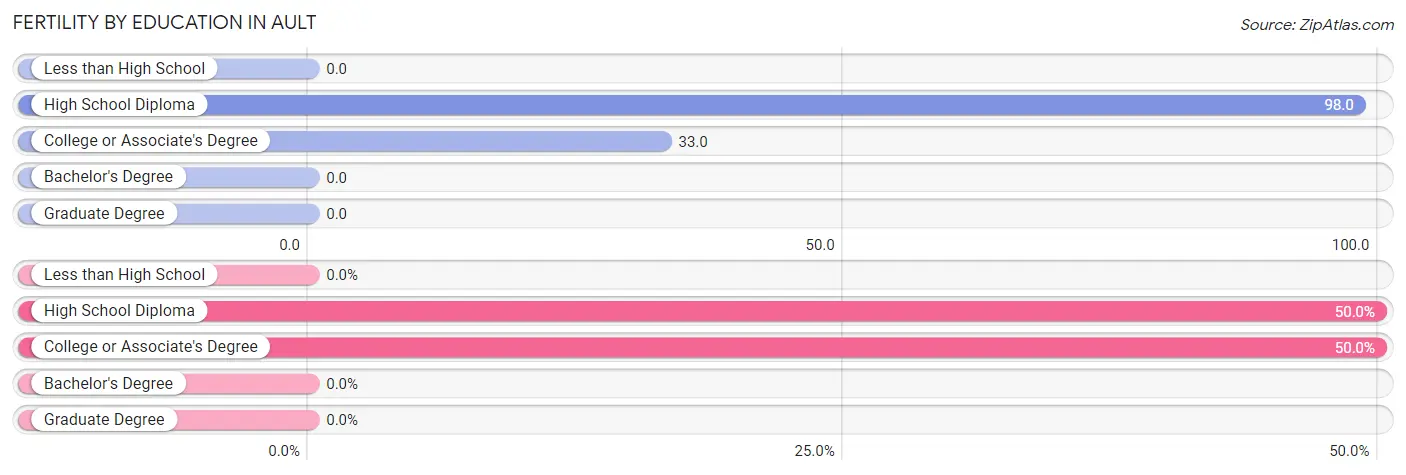
| Educational Attainment | Women with Births | Births / 1,000 Women |
| Less than High School | 0 (0.0%) | 0.0 |
| High School Diploma | 5 (50.0%) | 98.0 |
| College or Associate's Degree | 5 (50.0%) | 33.0 |
| Bachelor's Degree | 0 (0.0%) | 0.0 |
| Graduate Degree | 0 (0.0%) | 0.0 |
| Total | 10 (100.0%) | 30.0 |
Fertility by Education by Marriage Status in Ault
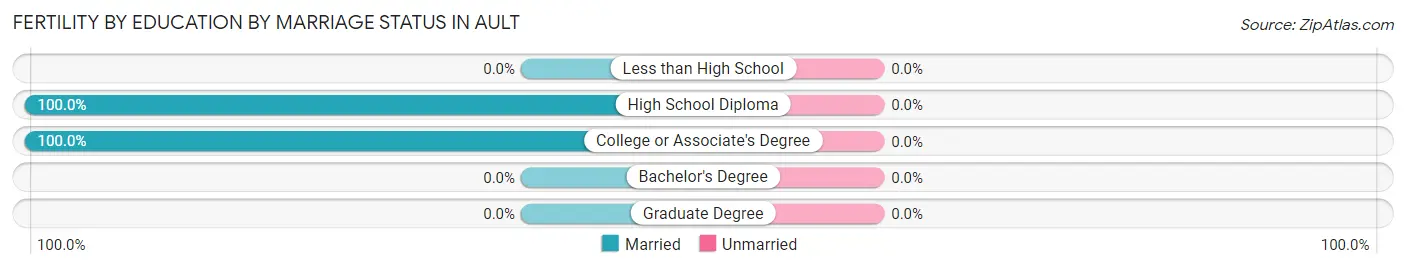
| Educational Attainment | Married | Unmarried |
| Less than High School | 0 (0.0%) | 0 (0.0%) |
| High School Diploma | 5 (100.0%) | 0 (0.0%) |
| College or Associate's Degree | 5 (100.0%) | 0 (0.0%) |
| Bachelor's Degree | 0 (0.0%) | 0 (0.0%) |
| Graduate Degree | 0 (0.0%) | 0 (0.0%) |
| Total | 10 (100.0%) | 0 (0.0%) |
Employment Characteristics in Ault
Employment by Class of Employer in Ault
Among the 829 employed individuals in Ault, private company employees (600 | 72.4%), local government employees (65 | 7.8%), and self-employed (not incorporated) (54 | 6.5%) make up the most common classes of employment.
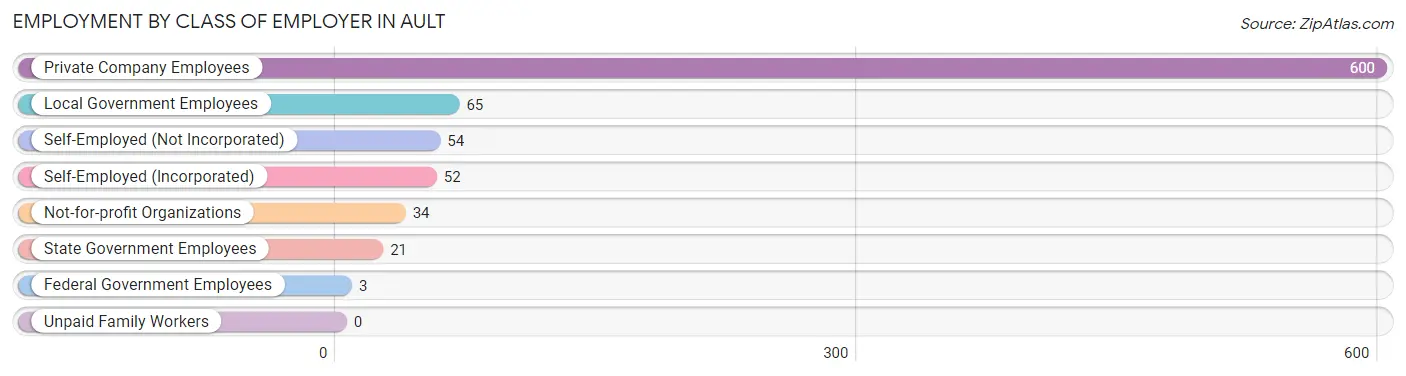
| Employer Class | # Employees | % Employees |
| Private Company Employees | 600 | 72.4% |
| Self-Employed (Incorporated) | 52 | 6.3% |
| Self-Employed (Not Incorporated) | 54 | 6.5% |
| Not-for-profit Organizations | 34 | 4.1% |
| Local Government Employees | 65 | 7.8% |
| State Government Employees | 21 | 2.5% |
| Federal Government Employees | 3 | 0.4% |
| Unpaid Family Workers | 0 | 0.0% |
| Total | 829 | 100.0% |
Employment Status by Age in Ault
According to the labor force statistics for Ault, out of the total population over 16 years of age (1,236), 69.3% or 857 individuals are in the labor force, with 1.6% or 14 of them unemployed. The age group with the highest labor force participation rate is 20 to 24 years, with 100.0% or 43 individuals in the labor force. Within the labor force, the 30 to 34 years age range has the highest percentage of unemployed individuals, with 9.3% or 10 of them being unemployed.
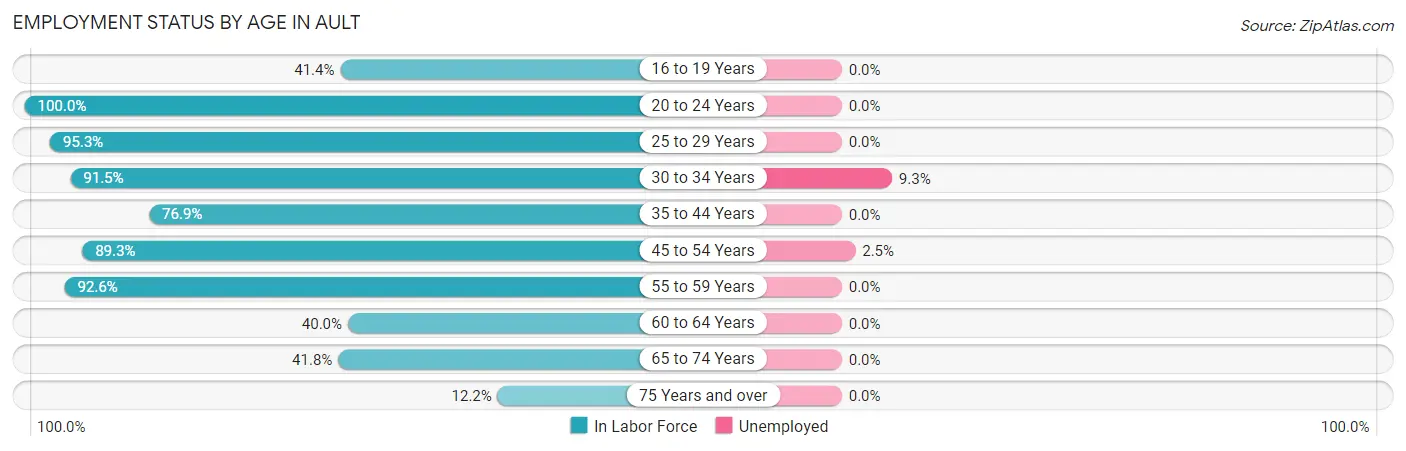
| Age Bracket | In Labor Force | Unemployed |
| 16 to 19 Years | 24 (41.4%) | 0 (0.0%) |
| 20 to 24 Years | 43 (100.0%) | 0 (0.0%) |
| 25 to 29 Years | 141 (95.3%) | 0 (0.0%) |
| 30 to 34 Years | 107 (91.5%) | 10 (9.3%) |
| 35 to 44 Years | 180 (76.9%) | 0 (0.0%) |
| 45 to 54 Years | 158 (89.3%) | 4 (2.5%) |
| 55 to 59 Years | 87 (92.6%) | 0 (0.0%) |
| 60 to 64 Years | 34 (40.0%) | 0 (0.0%) |
| 65 to 74 Years | 69 (41.8%) | 0 (0.0%) |
| 75 Years and over | 14 (12.2%) | 0 (0.0%) |
| Total | 857 (69.3%) | 14 (1.6%) |
Employment Status by Educational Attainment in Ault
According to labor force statistics for Ault, 82.7% of individuals (707) out of the total population between 25 and 64 years of age (855) are in the labor force, with 2.0% or 14 of them being unemployed. The group with the highest labor force participation rate are those with the educational attainment of college / associate degree, with 91.2% or 301 individuals in the labor force. Within the labor force, individuals with college / associate degree education have the highest percentage of unemployment, with 4.7% or 14 of them being unemployed.
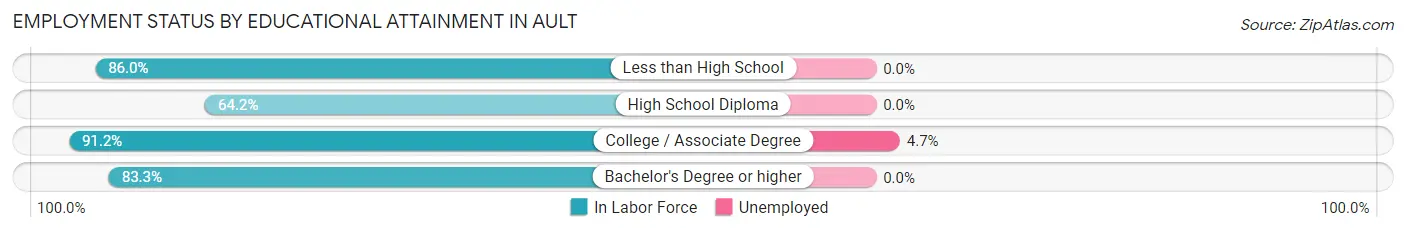
| Educational Attainment | In Labor Force | Unemployed |
| Less than High School | 141 (86.0%) | 0 (0.0%) |
| High School Diploma | 120 (64.2%) | 0 (0.0%) |
| College / Associate Degree | 301 (91.2%) | 16 (4.7%) |
| Bachelor's Degree or higher | 145 (83.3%) | 0 (0.0%) |
| Total | 707 (82.7%) | 17 (2.0%) |
Employment Occupations by Sex in Ault
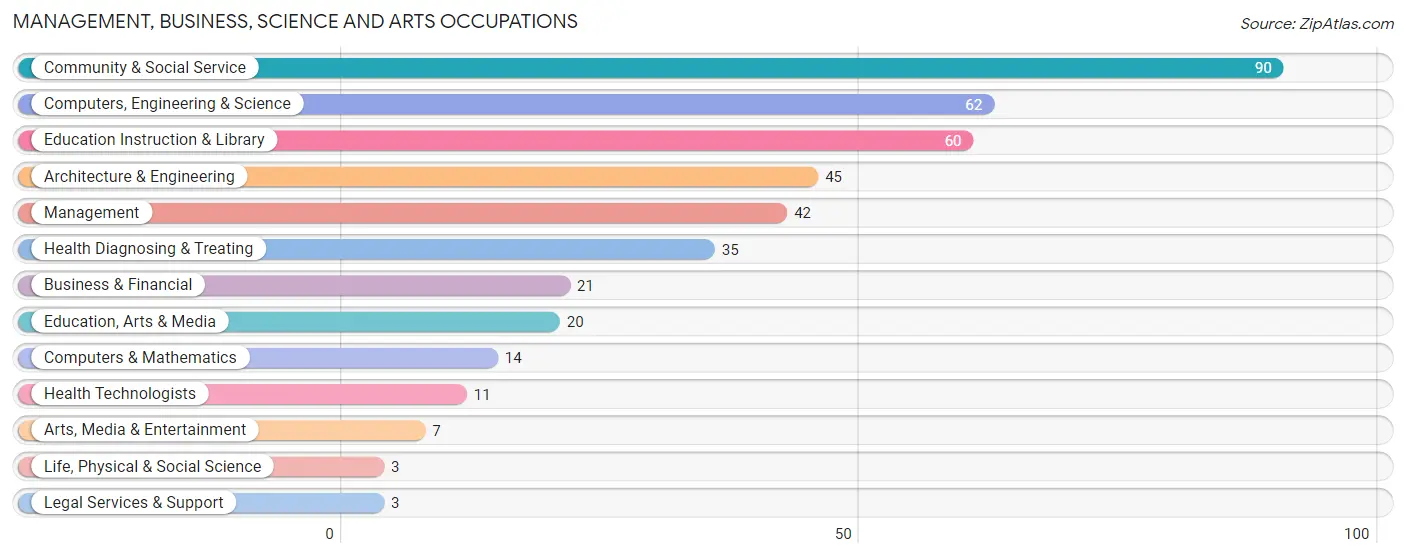
Management, Business, Science and Arts Occupations
The most common Management, Business, Science and Arts occupations in Ault are Community & Social Service (90 | 10.7%), Computers, Engineering & Science (62 | 7.4%), Education Instruction & Library (60 | 7.1%), Architecture & Engineering (45 | 5.4%), and Management (42 | 5.0%).
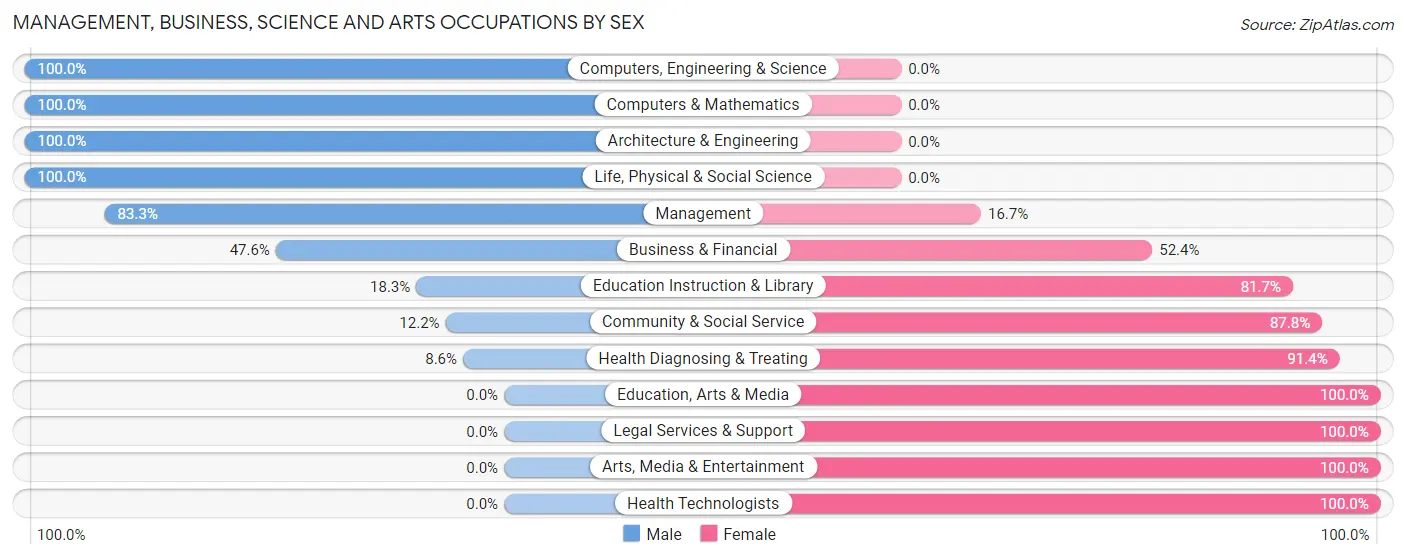
Management, Business, Science and Arts Occupations by Sex
Within the Management, Business, Science and Arts occupations in Ault, the most male-oriented occupations are Computers, Engineering & Science (100.0%), Computers & Mathematics (100.0%), and Architecture & Engineering (100.0%), while the most female-oriented occupations are Education, Arts & Media (100.0%), Legal Services & Support (100.0%), and Arts, Media & Entertainment (100.0%).
| Occupation | Male | Female |
| Management | 35 (83.3%) | 7 (16.7%) |
| Business & Financial | 10 (47.6%) | 11 (52.4%) |
| Computers, Engineering & Science | 62 (100.0%) | 0 (0.0%) |
| Computers & Mathematics | 14 (100.0%) | 0 (0.0%) |
| Architecture & Engineering | 45 (100.0%) | 0 (0.0%) |
| Life, Physical & Social Science | 3 (100.0%) | 0 (0.0%) |
| Community & Social Service | 11 (12.2%) | 79 (87.8%) |
| Education, Arts & Media | 0 (0.0%) | 20 (100.0%) |
| Legal Services & Support | 0 (0.0%) | 3 (100.0%) |
| Education Instruction & Library | 11 (18.3%) | 49 (81.7%) |
| Arts, Media & Entertainment | 0 (0.0%) | 7 (100.0%) |
| Health Diagnosing & Treating | 3 (8.6%) | 32 (91.4%) |
| Health Technologists | 0 (0.0%) | 11 (100.0%) |
| Total (Category) | 121 (48.4%) | 129 (51.6%) |
| Total (Overall) | 510 (60.7%) | 330 (39.3%) |
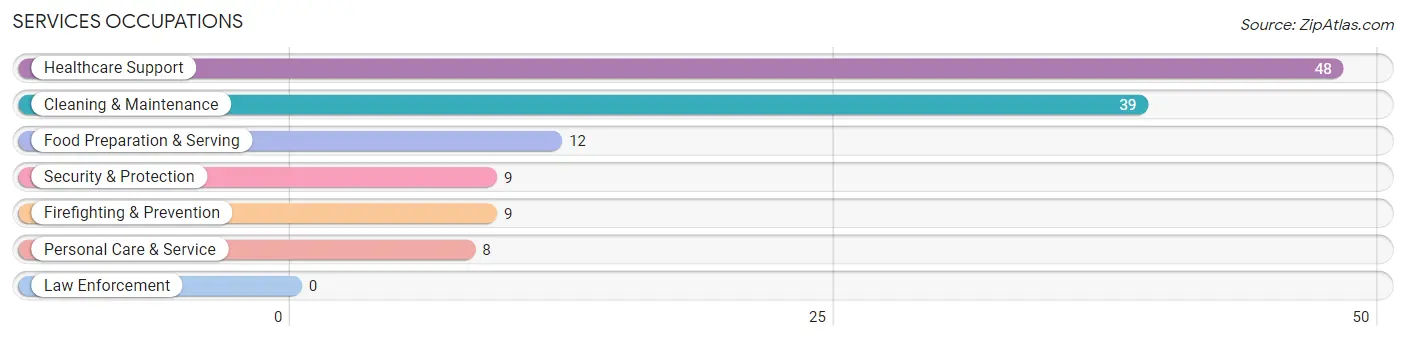
Services Occupations
The most common Services occupations in Ault are Healthcare Support (48 | 5.7%), Cleaning & Maintenance (39 | 4.6%), Food Preparation & Serving (12 | 1.4%), Security & Protection (9 | 1.1%), and Firefighting & Prevention (9 | 1.1%).
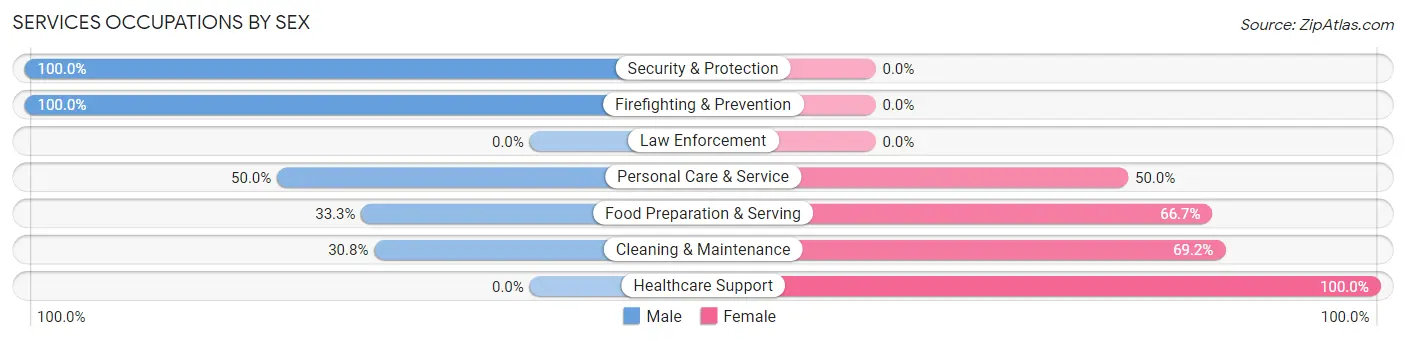
Services Occupations by Sex
Within the Services occupations in Ault, the most male-oriented occupations are Security & Protection (100.0%), Firefighting & Prevention (100.0%), and Personal Care & Service (50.0%), while the most female-oriented occupations are Healthcare Support (100.0%), Cleaning & Maintenance (69.2%), and Food Preparation & Serving (66.7%).
| Occupation | Male | Female |
| Healthcare Support | 0 (0.0%) | 48 (100.0%) |
| Security & Protection | 9 (100.0%) | 0 (0.0%) |
| Firefighting & Prevention | 9 (100.0%) | 0 (0.0%) |
| Law Enforcement | 0 (0.0%) | 0 (0.0%) |
| Food Preparation & Serving | 4 (33.3%) | 8 (66.7%) |
| Cleaning & Maintenance | 12 (30.8%) | 27 (69.2%) |
| Personal Care & Service | 4 (50.0%) | 4 (50.0%) |
| Total (Category) | 29 (25.0%) | 87 (75.0%) |
| Total (Overall) | 510 (60.7%) | 330 (39.3%) |
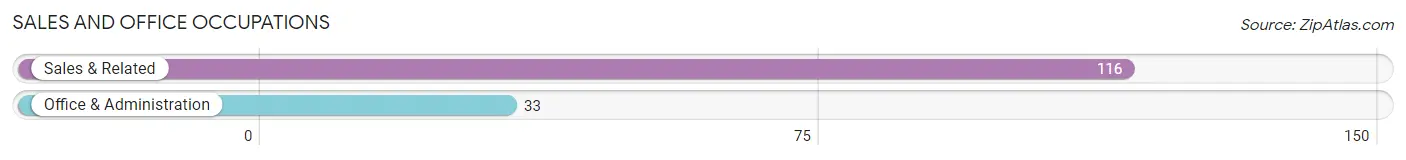
Sales and Office Occupations
The most common Sales and Office occupations in Ault are Sales & Related (116 | 13.8%), and Office & Administration (33 | 3.9%).
Sales and Office Occupations by Sex
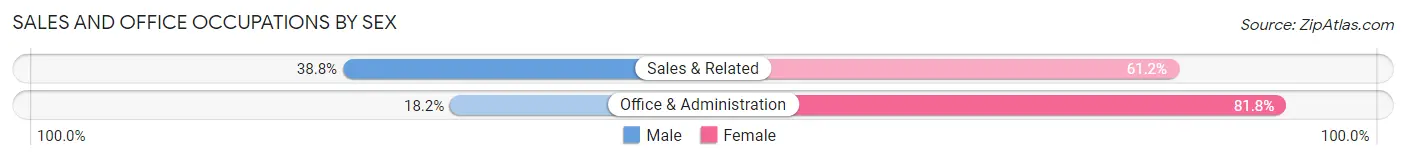
| Occupation | Male | Female |
| Sales & Related | 45 (38.8%) | 71 (61.2%) |
| Office & Administration | 6 (18.2%) | 27 (81.8%) |
| Total (Category) | 51 (34.2%) | 98 (65.8%) |
| Total (Overall) | 510 (60.7%) | 330 (39.3%) |
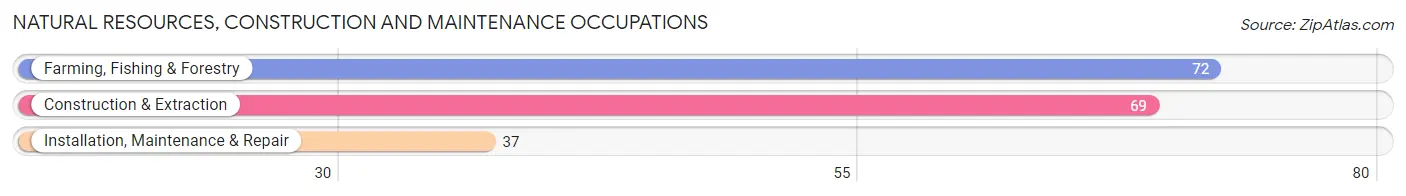
Natural Resources, Construction and Maintenance Occupations
The most common Natural Resources, Construction and Maintenance occupations in Ault are Farming, Fishing & Forestry (72 | 8.6%), Construction & Extraction (69 | 8.2%), and Installation, Maintenance & Repair (37 | 4.4%).
Natural Resources, Construction and Maintenance Occupations by Sex
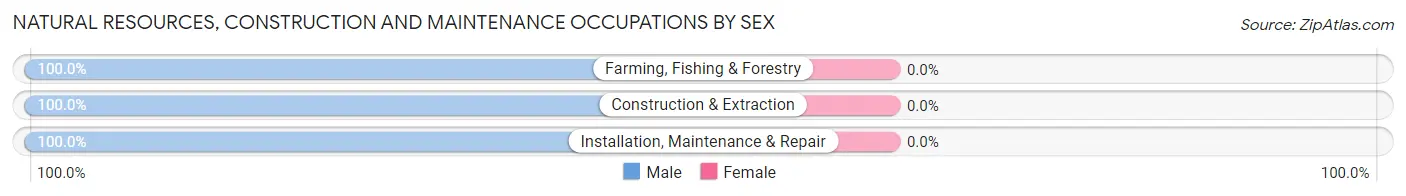
| Occupation | Male | Female |
| Farming, Fishing & Forestry | 72 (100.0%) | 0 (0.0%) |
| Construction & Extraction | 69 (100.0%) | 0 (0.0%) |
| Installation, Maintenance & Repair | 37 (100.0%) | 0 (0.0%) |
| Total (Category) | 178 (100.0%) | 0 (0.0%) |
| Total (Overall) | 510 (60.7%) | 330 (39.3%) |
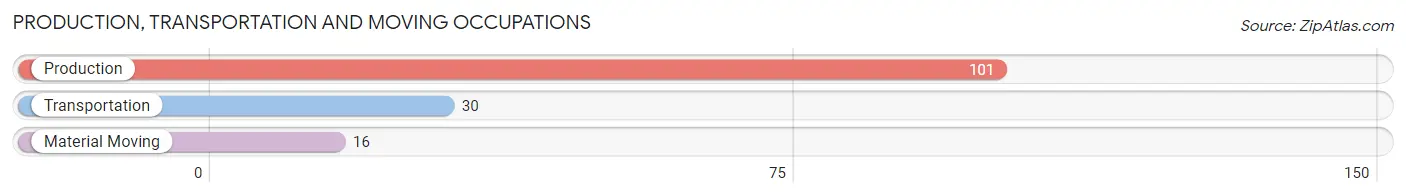
Production, Transportation and Moving Occupations
The most common Production, Transportation and Moving occupations in Ault are Production (101 | 12.0%), Transportation (30 | 3.6%), and Material Moving (16 | 1.9%).
Production, Transportation and Moving Occupations by Sex
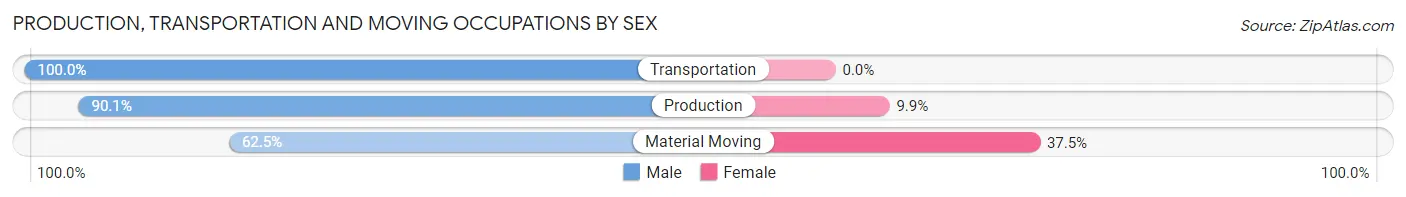
| Occupation | Male | Female |
| Production | 91 (90.1%) | 10 (9.9%) |
| Transportation | 30 (100.0%) | 0 (0.0%) |
| Material Moving | 10 (62.5%) | 6 (37.5%) |
| Total (Category) | 131 (89.1%) | 16 (10.9%) |
| Total (Overall) | 510 (60.7%) | 330 (39.3%) |
Employment Industries by Sex in Ault
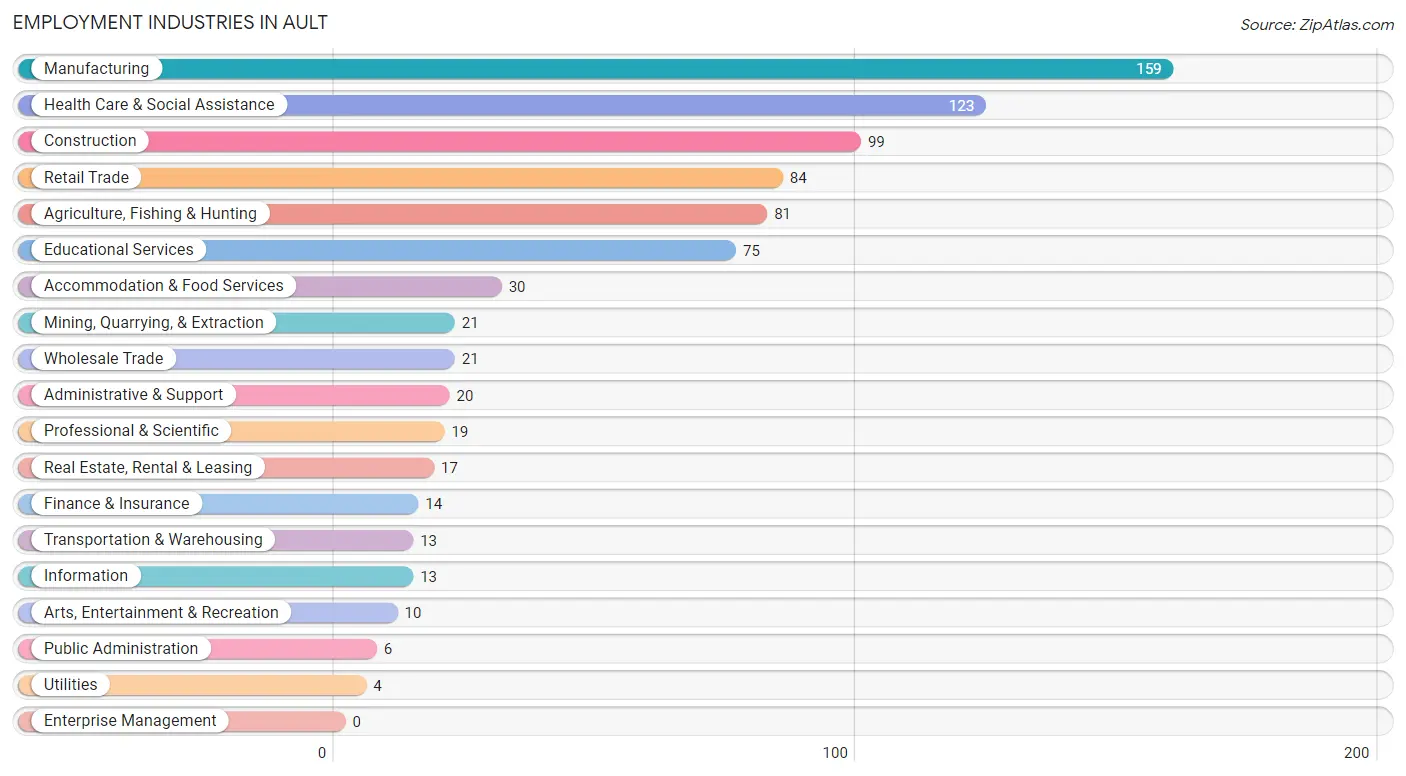
Employment Industries in Ault
The major employment industries in Ault include Manufacturing (159 | 18.9%), Health Care & Social Assistance (123 | 14.6%), Construction (99 | 11.8%), Retail Trade (84 | 10.0%), and Agriculture, Fishing & Hunting (81 | 9.6%).
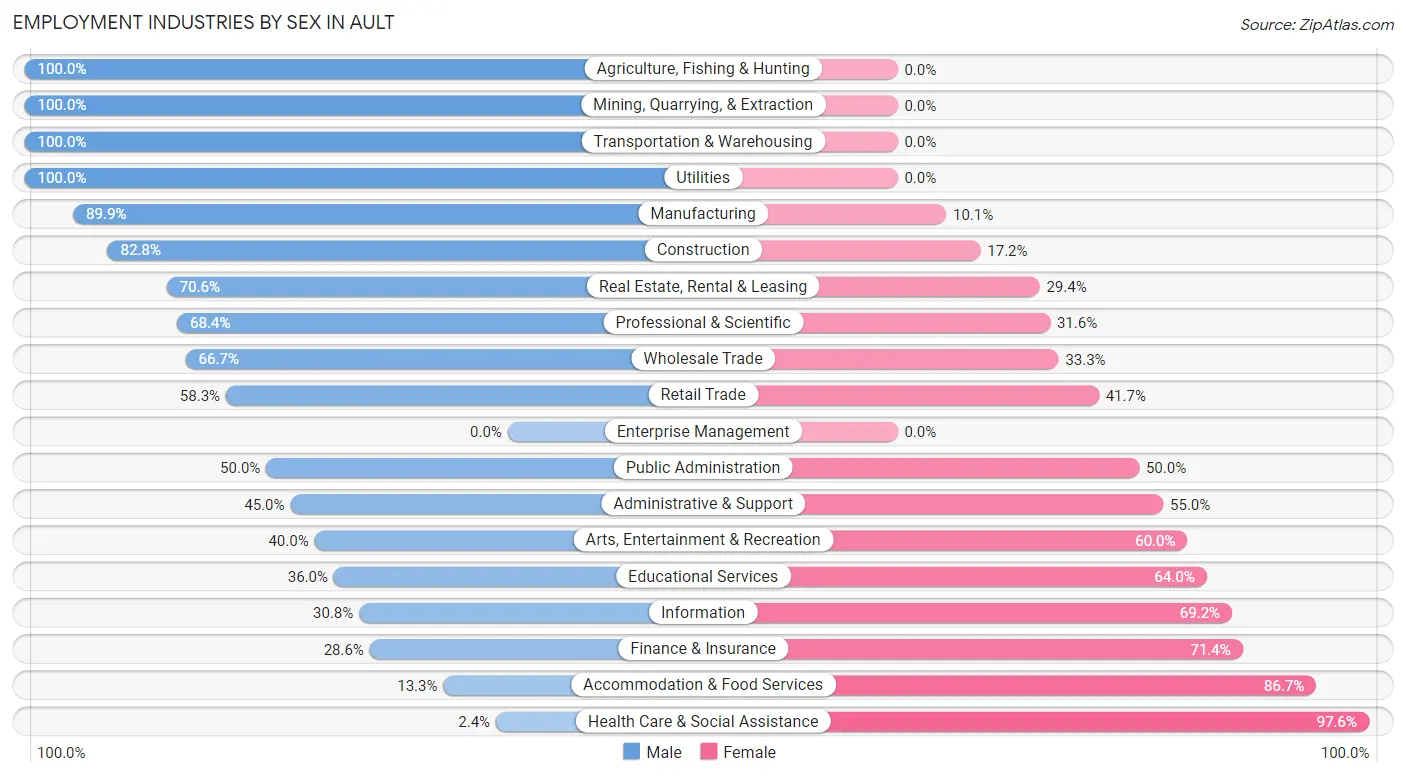
Employment Industries by Sex in Ault
The Ault industries that see more men than women are Agriculture, Fishing & Hunting (100.0%), Mining, Quarrying, & Extraction (100.0%), and Transportation & Warehousing (100.0%), whereas the industries that tend to have a higher number of women are Health Care & Social Assistance (97.6%), Accommodation & Food Services (86.7%), and Finance & Insurance (71.4%).
| Industry | Male | Female |
| Agriculture, Fishing & Hunting | 81 (100.0%) | 0 (0.0%) |
| Mining, Quarrying, & Extraction | 21 (100.0%) | 0 (0.0%) |
| Construction | 82 (82.8%) | 17 (17.2%) |
| Manufacturing | 143 (89.9%) | 16 (10.1%) |
| Wholesale Trade | 14 (66.7%) | 7 (33.3%) |
| Retail Trade | 49 (58.3%) | 35 (41.7%) |
| Transportation & Warehousing | 13 (100.0%) | 0 (0.0%) |
| Utilities | 4 (100.0%) | 0 (0.0%) |
| Information | 4 (30.8%) | 9 (69.2%) |
| Finance & Insurance | 4 (28.6%) | 10 (71.4%) |
| Real Estate, Rental & Leasing | 12 (70.6%) | 5 (29.4%) |
| Professional & Scientific | 13 (68.4%) | 6 (31.6%) |
| Enterprise Management | 0 (0.0%) | 0 (0.0%) |
| Administrative & Support | 9 (45.0%) | 11 (55.0%) |
| Educational Services | 27 (36.0%) | 48 (64.0%) |
| Health Care & Social Assistance | 3 (2.4%) | 120 (97.6%) |
| Arts, Entertainment & Recreation | 4 (40.0%) | 6 (60.0%) |
| Accommodation & Food Services | 4 (13.3%) | 26 (86.7%) |
| Public Administration | 3 (50.0%) | 3 (50.0%) |
| Total | 510 (60.7%) | 330 (39.3%) |
Education in Ault
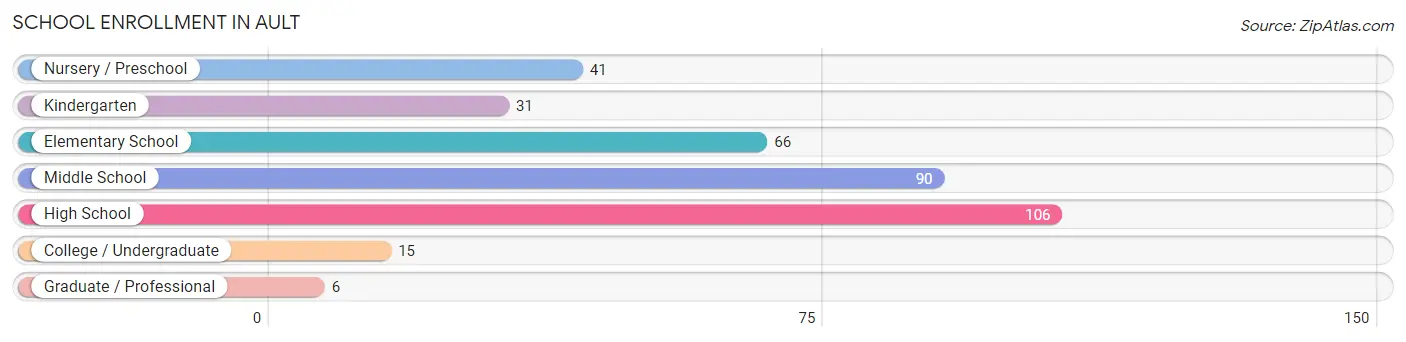
School Enrollment in Ault
The most common levels of schooling among the 355 students in Ault are high school (106 | 29.9%), middle school (90 | 25.4%), and elementary school (66 | 18.6%).
| School Level | # Students | % Students |
| Nursery / Preschool | 41 | 11.6% |
| Kindergarten | 31 | 8.7% |
| Elementary School | 66 | 18.6% |
| Middle School | 90 | 25.4% |
| High School | 106 | 29.9% |
| College / Undergraduate | 15 | 4.2% |
| Graduate / Professional | 6 | 1.7% |
| Total | 355 | 100.0% |
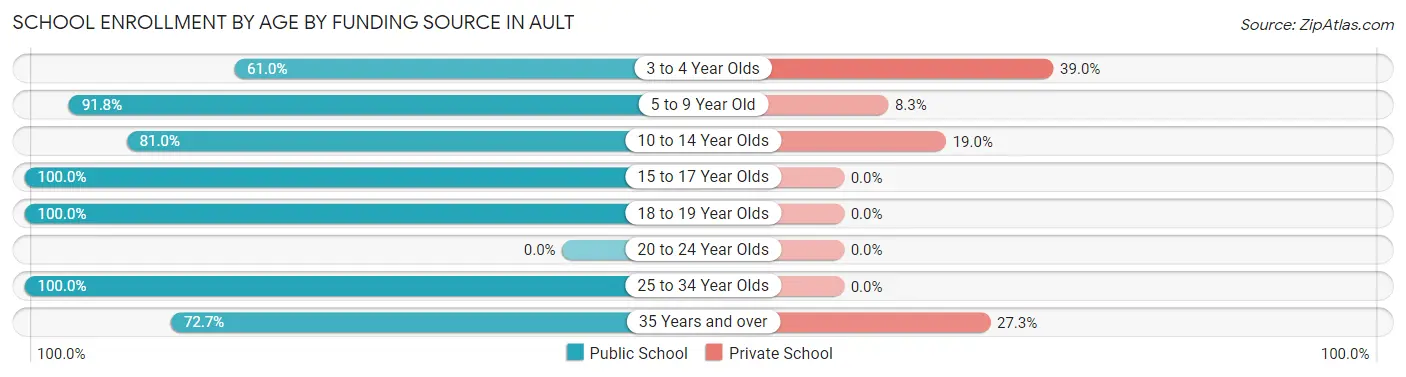
School Enrollment by Age by Funding Source in Ault
Out of a total of 355 students who are enrolled in schools in Ault, 50 (14.1%) attend a private institution, while the remaining 305 (85.9%) are enrolled in public schools. The age group of 3 to 4 year olds has the highest likelihood of being enrolled in private schools, with 16 (39.0% in the age bracket) enrolled. Conversely, the age group of 15 to 17 year olds has the lowest likelihood of being enrolled in a private school, with 67 (100.0% in the age bracket) attending a public institution.
| Age Bracket | Public School | Private School |
| 3 to 4 Year Olds | 25 (61.0%) | 16 (39.0%) |
| 5 to 9 Year Old | 89 (91.7%) | 8 (8.3%) |
| 10 to 14 Year Olds | 98 (81.0%) | 23 (19.0%) |
| 15 to 17 Year Olds | 67 (100.0%) | 0 (0.0%) |
| 18 to 19 Year Olds | 8 (100.0%) | 0 (0.0%) |
| 20 to 24 Year Olds | 0 (0.0%) | 0 (0.0%) |
| 25 to 34 Year Olds | 10 (100.0%) | 0 (0.0%) |
| 35 Years and over | 8 (72.7%) | 3 (27.3%) |
| Total | 305 (85.9%) | 50 (14.1%) |
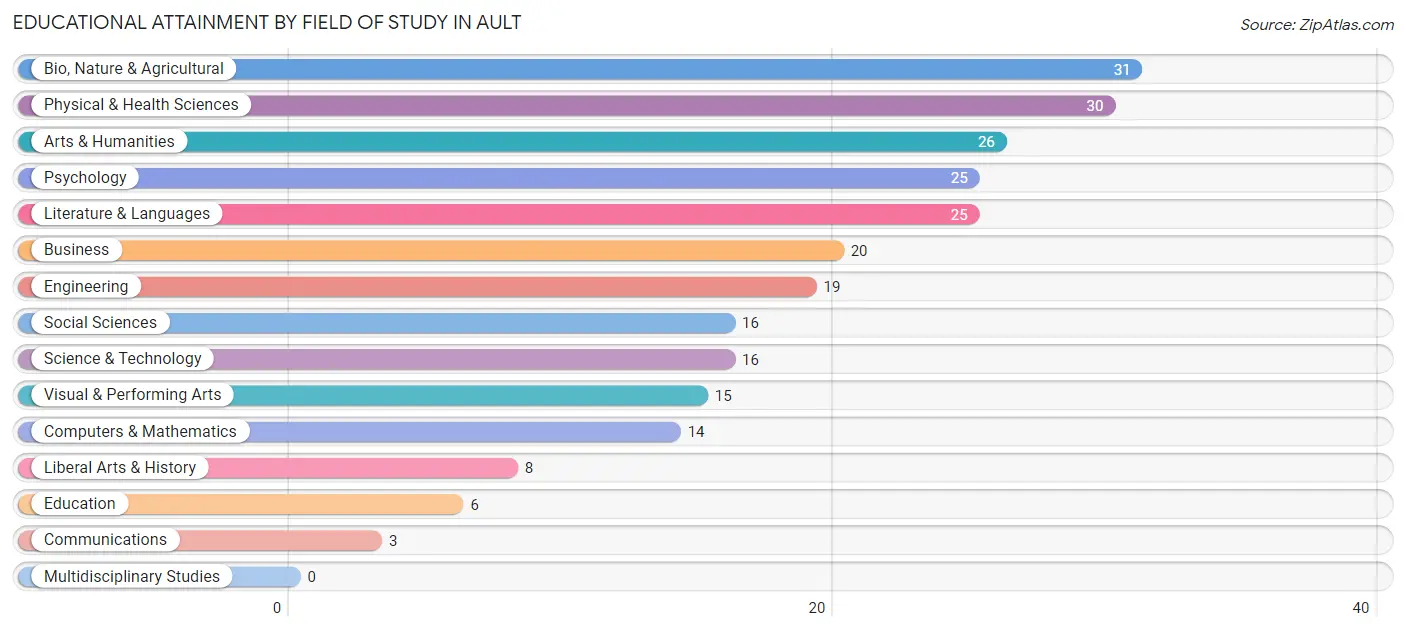
Educational Attainment by Field of Study in Ault
Bio, nature & agricultural (31 | 12.2%), physical & health sciences (30 | 11.8%), arts & humanities (26 | 10.2%), psychology (25 | 9.8%), and literature & languages (25 | 9.8%) are the most common fields of study among 254 individuals in Ault who have obtained a bachelor's degree or higher.
| Field of Study | # Graduates | % Graduates |
| Computers & Mathematics | 14 | 5.5% |
| Bio, Nature & Agricultural | 31 | 12.2% |
| Physical & Health Sciences | 30 | 11.8% |
| Psychology | 25 | 9.8% |
| Social Sciences | 16 | 6.3% |
| Engineering | 19 | 7.5% |
| Multidisciplinary Studies | 0 | 0.0% |
| Science & Technology | 16 | 6.3% |
| Business | 20 | 7.9% |
| Education | 6 | 2.4% |
| Literature & Languages | 25 | 9.8% |
| Liberal Arts & History | 8 | 3.2% |
| Visual & Performing Arts | 15 | 5.9% |
| Communications | 3 | 1.2% |
| Arts & Humanities | 26 | 10.2% |
| Total | 254 | 100.0% |
Transportation & Commute in Ault
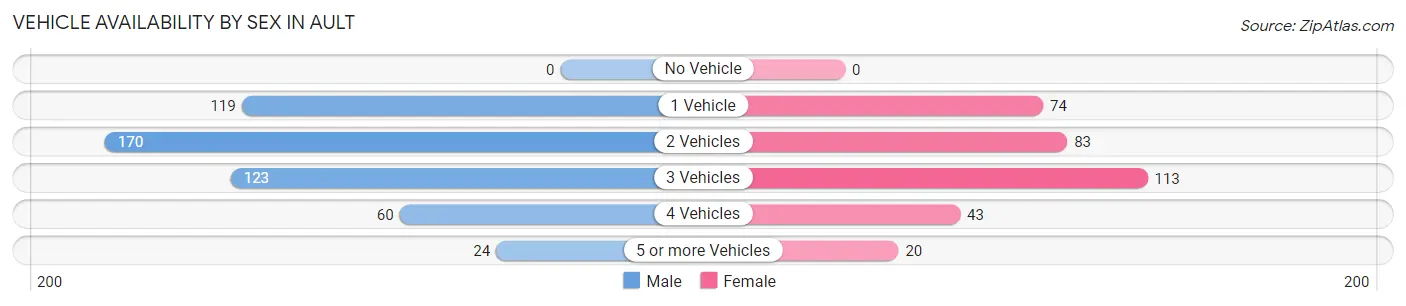
Vehicle Availability by Sex in Ault
The most prevalent vehicle ownership categories in Ault are males with 2 vehicles (170, accounting for 34.3%) and females with 2 vehicles (83, making up 51.0%).
| Vehicles Available | Male | Female |
| No Vehicle | 0 (0.0%) | 0 (0.0%) |
| 1 Vehicle | 119 (24.0%) | 74 (22.2%) |
| 2 Vehicles | 170 (34.3%) | 83 (24.9%) |
| 3 Vehicles | 123 (24.8%) | 113 (33.9%) |
| 4 Vehicles | 60 (12.1%) | 43 (12.9%) |
| 5 or more Vehicles | 24 (4.8%) | 20 (6.0%) |
| Total | 496 (100.0%) | 333 (100.0%) |
Commute Time in Ault
The most frequently occuring commute durations in Ault are 30 to 34 minutes (198 commuters, 26.2%), 20 to 24 minutes (104 commuters, 13.7%), and 60 to 89 minutes (82 commuters, 10.8%).
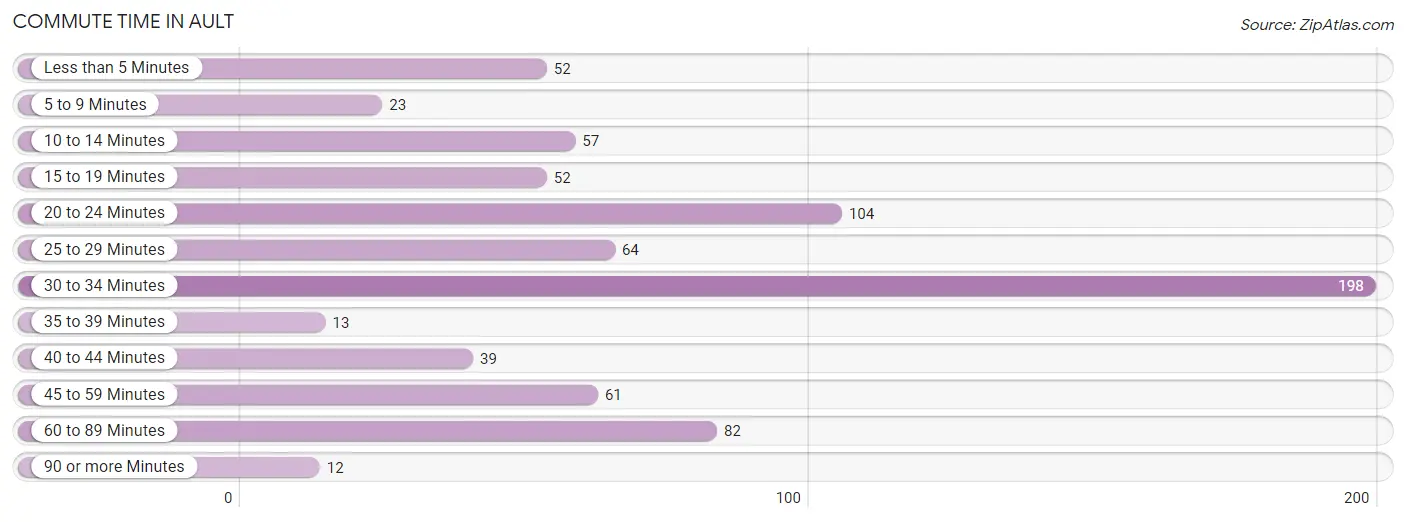
| Commute Time | # Commuters | % Commuters |
| Less than 5 Minutes | 52 | 6.9% |
| 5 to 9 Minutes | 23 | 3.0% |
| 10 to 14 Minutes | 57 | 7.5% |
| 15 to 19 Minutes | 52 | 6.9% |
| 20 to 24 Minutes | 104 | 13.7% |
| 25 to 29 Minutes | 64 | 8.5% |
| 30 to 34 Minutes | 198 | 26.2% |
| 35 to 39 Minutes | 13 | 1.7% |
| 40 to 44 Minutes | 39 | 5.1% |
| 45 to 59 Minutes | 61 | 8.1% |
| 60 to 89 Minutes | 82 | 10.8% |
| 90 or more Minutes | 12 | 1.6% |
Commute Time by Sex in Ault
The most common commute times in Ault are 30 to 34 minutes (101 commuters, 21.8%) for males and 30 to 34 minutes (97 commuters, 33.1%) for females.
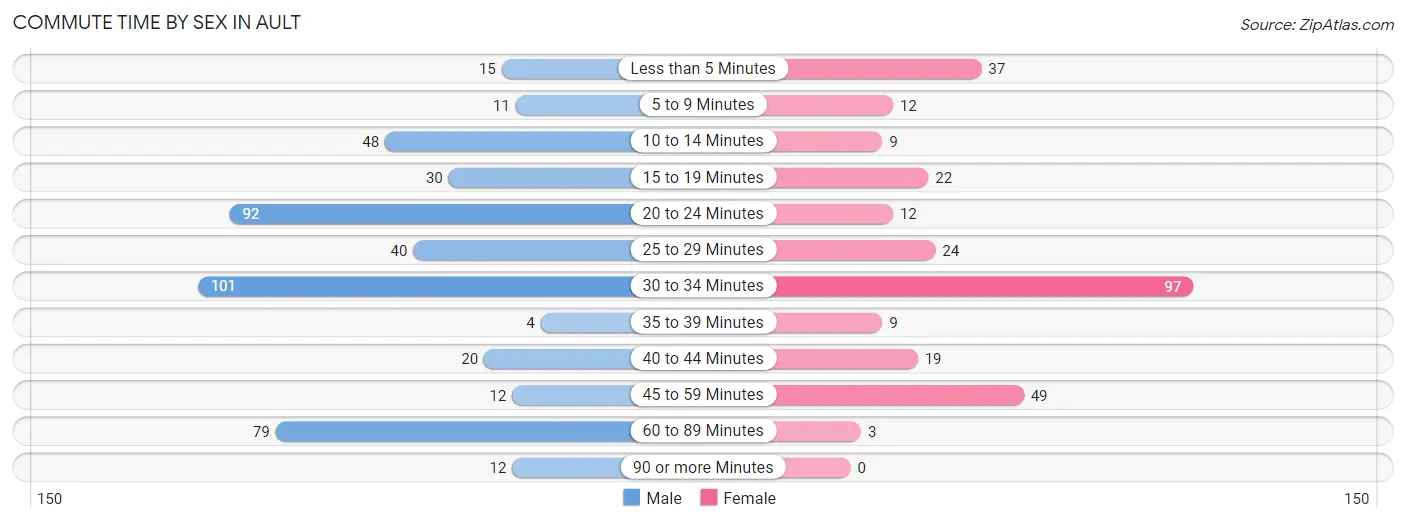
| Commute Time | Male | Female |
| Less than 5 Minutes | 15 (3.2%) | 37 (12.6%) |
| 5 to 9 Minutes | 11 (2.4%) | 12 (4.1%) |
| 10 to 14 Minutes | 48 (10.3%) | 9 (3.1%) |
| 15 to 19 Minutes | 30 (6.5%) | 22 (7.5%) |
| 20 to 24 Minutes | 92 (19.8%) | 12 (4.1%) |
| 25 to 29 Minutes | 40 (8.6%) | 24 (8.2%) |
| 30 to 34 Minutes | 101 (21.8%) | 97 (33.1%) |
| 35 to 39 Minutes | 4 (0.9%) | 9 (3.1%) |
| 40 to 44 Minutes | 20 (4.3%) | 19 (6.5%) |
| 45 to 59 Minutes | 12 (2.6%) | 49 (16.7%) |
| 60 to 89 Minutes | 79 (17.0%) | 3 (1.0%) |
| 90 or more Minutes | 12 (2.6%) | 0 (0.0%) |
Time of Departure to Work by Sex in Ault
The most frequent times of departure to work in Ault are 6:00 AM to 6:29 AM (80, 17.2%) for males and 7:30 AM to 7:59 AM (108, 36.9%) for females.
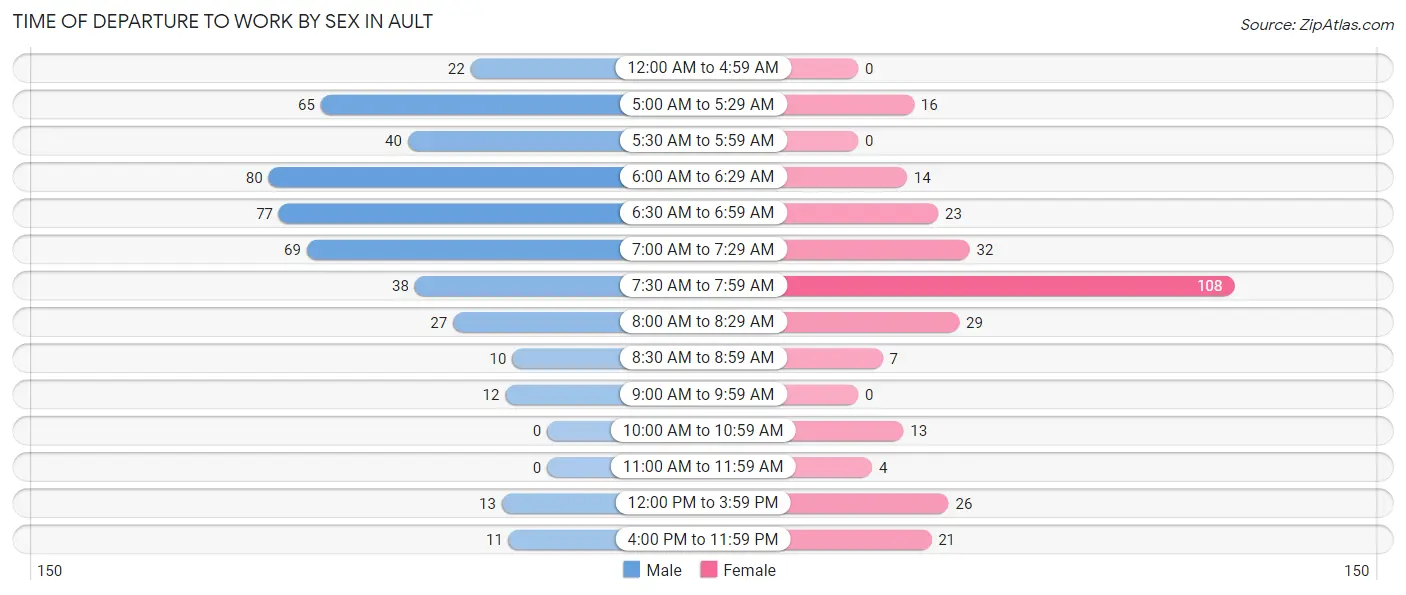
| Time of Departure | Male | Female |
| 12:00 AM to 4:59 AM | 22 (4.7%) | 0 (0.0%) |
| 5:00 AM to 5:29 AM | 65 (14.0%) | 16 (5.5%) |
| 5:30 AM to 5:59 AM | 40 (8.6%) | 0 (0.0%) |
| 6:00 AM to 6:29 AM | 80 (17.2%) | 14 (4.8%) |
| 6:30 AM to 6:59 AM | 77 (16.6%) | 23 (7.9%) |
| 7:00 AM to 7:29 AM | 69 (14.9%) | 32 (10.9%) |
| 7:30 AM to 7:59 AM | 38 (8.2%) | 108 (36.9%) |
| 8:00 AM to 8:29 AM | 27 (5.8%) | 29 (9.9%) |
| 8:30 AM to 8:59 AM | 10 (2.2%) | 7 (2.4%) |
| 9:00 AM to 9:59 AM | 12 (2.6%) | 0 (0.0%) |
| 10:00 AM to 10:59 AM | 0 (0.0%) | 13 (4.4%) |
| 11:00 AM to 11:59 AM | 0 (0.0%) | 4 (1.4%) |
| 12:00 PM to 3:59 PM | 13 (2.8%) | 26 (8.9%) |
| 4:00 PM to 11:59 PM | 11 (2.4%) | 21 (7.2%) |
| Total | 464 (100.0%) | 293 (100.0%) |
Housing Occupancy in Ault
Occupancy by Ownership in Ault
Of the total 612 dwellings in Ault, owner-occupied units account for 480 (78.4%), while renter-occupied units make up 132 (21.6%).
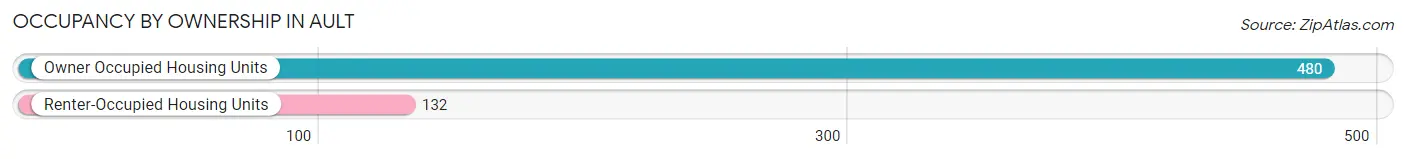
| Occupancy | # Housing Units | % Housing Units |
| Owner Occupied Housing Units | 480 | 78.4% |
| Renter-Occupied Housing Units | 132 | 21.6% |
| Total Occupied Housing Units | 612 | 100.0% |
Occupancy by Household Size in Ault
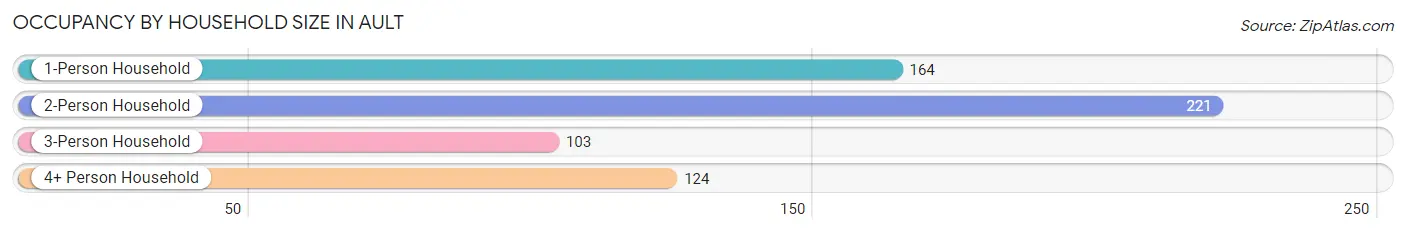
| Household Size | # Housing Units | % Housing Units |
| 1-Person Household | 164 | 26.8% |
| 2-Person Household | 221 | 36.1% |
| 3-Person Household | 103 | 16.8% |
| 4+ Person Household | 124 | 20.3% |
| Total Housing Units | 612 | 100.0% |
Occupancy by Ownership by Household Size in Ault
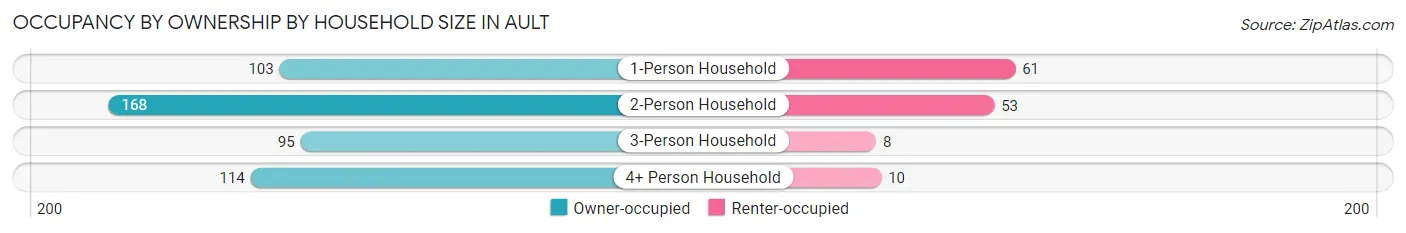
| Household Size | Owner-occupied | Renter-occupied |
| 1-Person Household | 103 (62.8%) | 61 (37.2%) |
| 2-Person Household | 168 (76.0%) | 53 (24.0%) |
| 3-Person Household | 95 (92.2%) | 8 (7.8%) |
| 4+ Person Household | 114 (91.9%) | 10 (8.1%) |
| Total Housing Units | 480 (78.4%) | 132 (21.6%) |
Occupancy by Educational Attainment in Ault
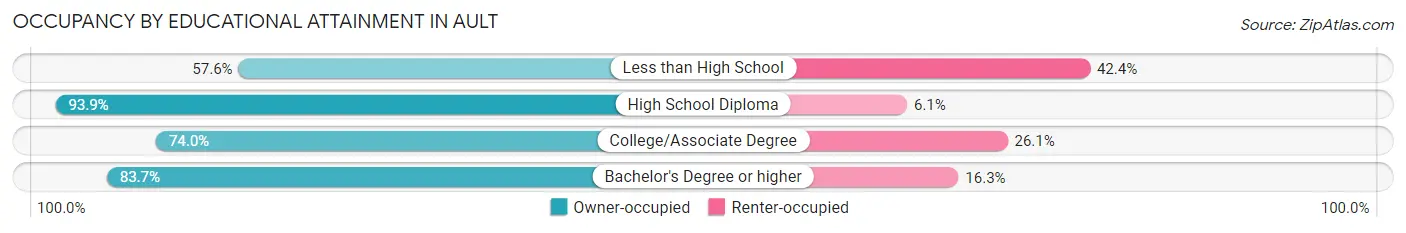
| Household Size | Owner-occupied | Renter-occupied |
| Less than High School | 53 (57.6%) | 39 (42.4%) |
| High School Diploma | 138 (93.9%) | 9 (6.1%) |
| College/Associate Degree | 176 (74.0%) | 62 (26.1%) |
| Bachelor's Degree or higher | 113 (83.7%) | 22 (16.3%) |
Occupancy by Age of Householder in Ault
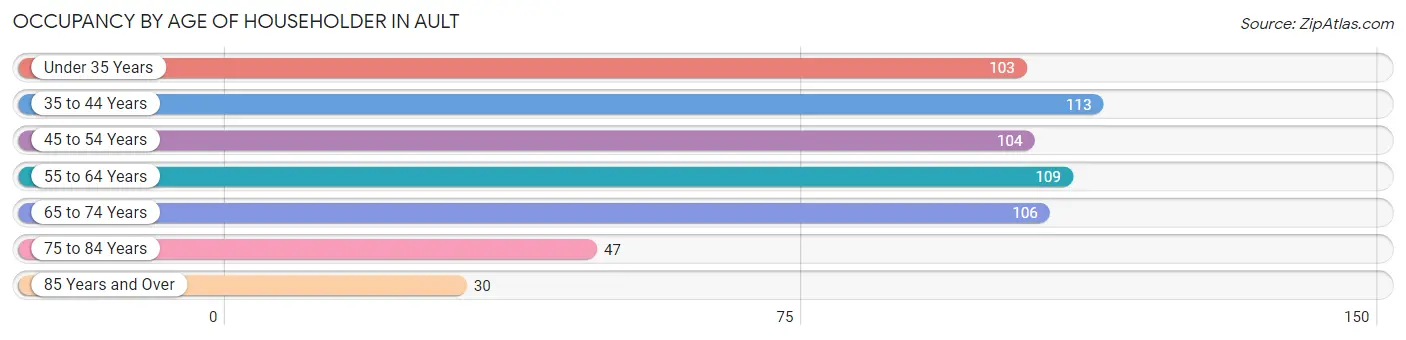
| Age Bracket | # Households | % Households |
| Under 35 Years | 103 | 16.8% |
| 35 to 44 Years | 113 | 18.5% |
| 45 to 54 Years | 104 | 17.0% |
| 55 to 64 Years | 109 | 17.8% |
| 65 to 74 Years | 106 | 17.3% |
| 75 to 84 Years | 47 | 7.7% |
| 85 Years and Over | 30 | 4.9% |
| Total | 612 | 100.0% |
Housing Finances in Ault
Median Income by Occupancy in Ault
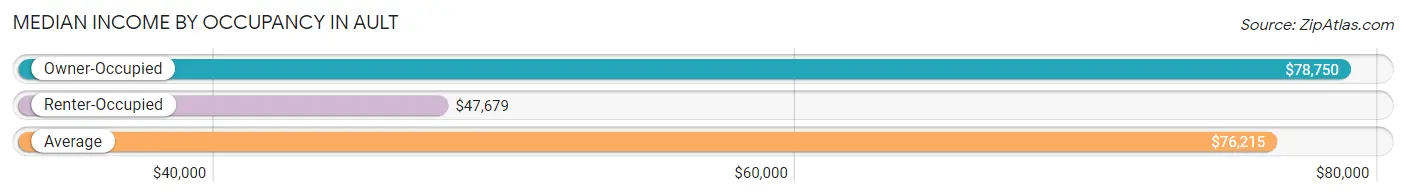
| Occupancy Type | # Households | Median Income |
| Owner-Occupied | 480 (78.4%) | $78,750 |
| Renter-Occupied | 132 (21.6%) | $47,679 |
| Average | 612 (100.0%) | $76,215 |
Occupancy by Householder Income Bracket in Ault
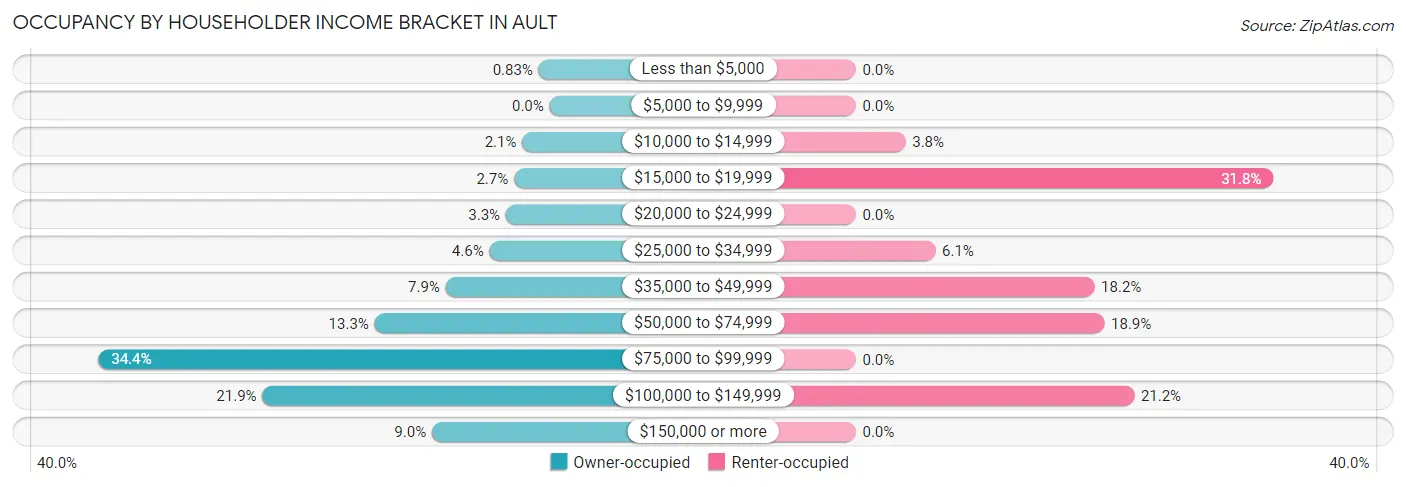
| Income Bracket | Owner-occupied | Renter-occupied |
| Less than $5,000 | 4 (0.8%) | 0 (0.0%) |
| $5,000 to $9,999 | 0 (0.0%) | 0 (0.0%) |
| $10,000 to $14,999 | 10 (2.1%) | 5 (3.8%) |
| $15,000 to $19,999 | 13 (2.7%) | 42 (31.8%) |
| $20,000 to $24,999 | 16 (3.3%) | 0 (0.0%) |
| $25,000 to $34,999 | 22 (4.6%) | 8 (6.1%) |
| $35,000 to $49,999 | 38 (7.9%) | 24 (18.2%) |
| $50,000 to $74,999 | 64 (13.3%) | 25 (18.9%) |
| $75,000 to $99,999 | 165 (34.4%) | 0 (0.0%) |
| $100,000 to $149,999 | 105 (21.9%) | 28 (21.2%) |
| $150,000 or more | 43 (9.0%) | 0 (0.0%) |
| Total | 480 (100.0%) | 132 (100.0%) |
Monthly Housing Cost Tiers in Ault
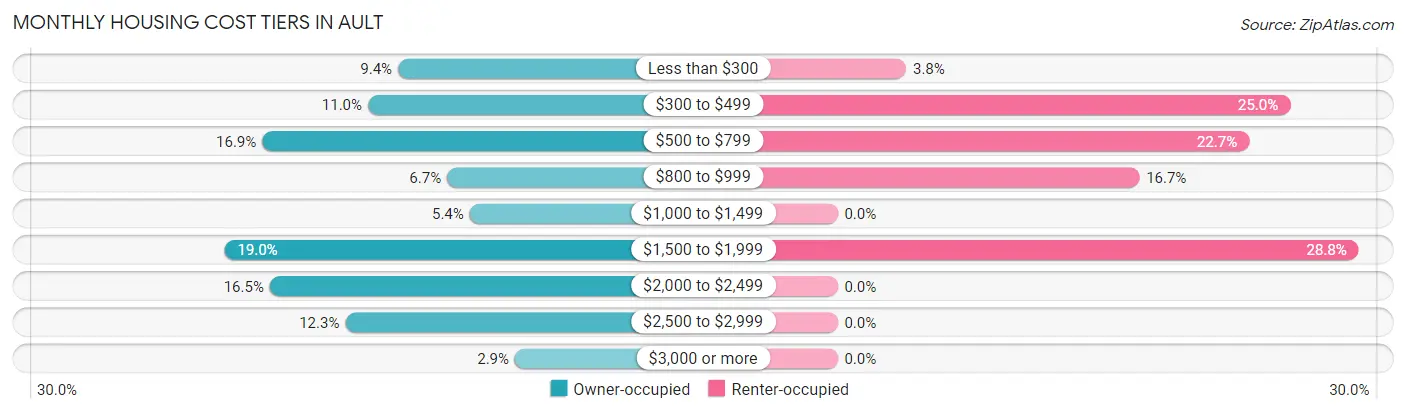
| Monthly Cost | Owner-occupied | Renter-occupied |
| Less than $300 | 45 (9.4%) | 5 (3.8%) |
| $300 to $499 | 53 (11.0%) | 33 (25.0%) |
| $500 to $799 | 81 (16.9%) | 30 (22.7%) |
| $800 to $999 | 32 (6.7%) | 22 (16.7%) |
| $1,000 to $1,499 | 26 (5.4%) | 0 (0.0%) |
| $1,500 to $1,999 | 91 (19.0%) | 38 (28.8%) |
| $2,000 to $2,499 | 79 (16.5%) | 0 (0.0%) |
| $2,500 to $2,999 | 59 (12.3%) | 0 (0.0%) |
| $3,000 or more | 14 (2.9%) | 0 (0.0%) |
| Total | 480 (100.0%) | 132 (100.0%) |
Physical Housing Characteristics in Ault
Housing Structures in Ault
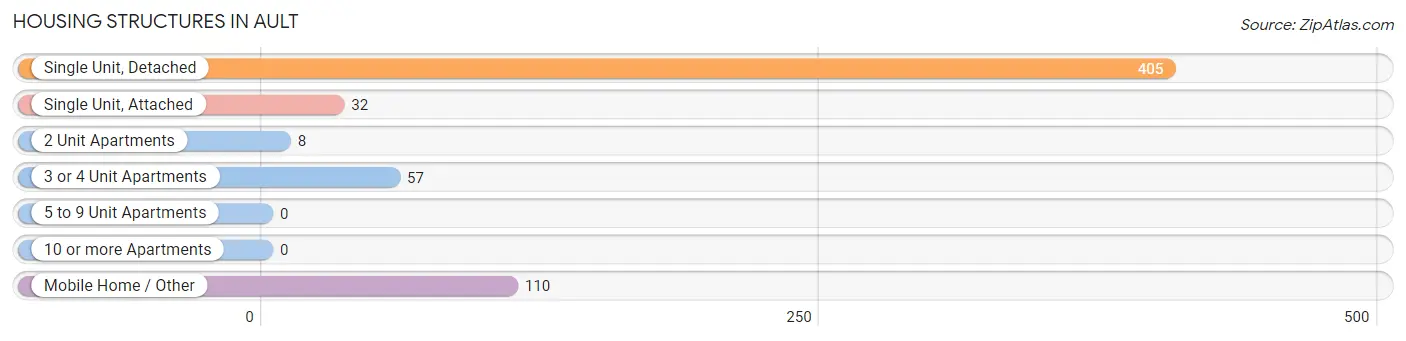
| Structure Type | # Housing Units | % Housing Units |
| Single Unit, Detached | 405 | 66.2% |
| Single Unit, Attached | 32 | 5.2% |
| 2 Unit Apartments | 8 | 1.3% |
| 3 or 4 Unit Apartments | 57 | 9.3% |
| 5 to 9 Unit Apartments | 0 | 0.0% |
| 10 or more Apartments | 0 | 0.0% |
| Mobile Home / Other | 110 | 18.0% |
| Total | 612 | 100.0% |
Housing Structures by Occupancy in Ault
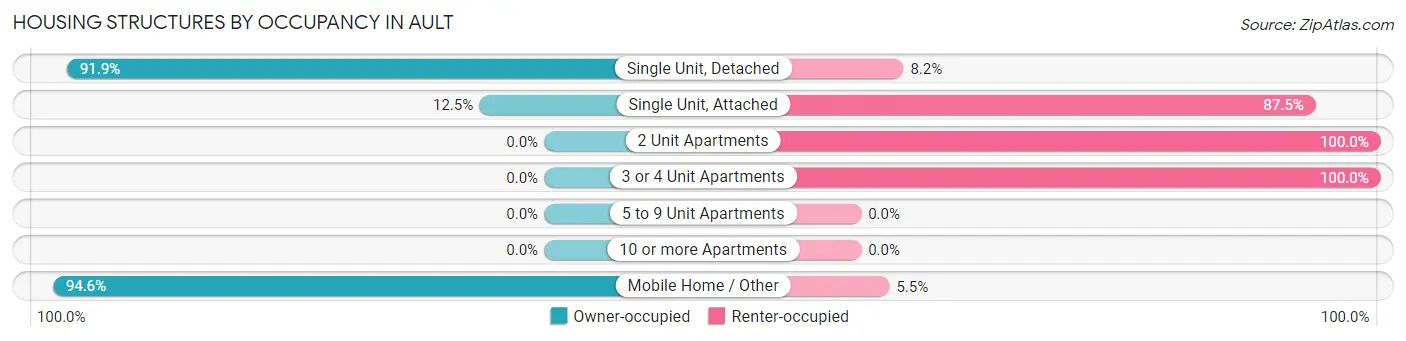
| Structure Type | Owner-occupied | Renter-occupied |
| Single Unit, Detached | 372 (91.8%) | 33 (8.2%) |
| Single Unit, Attached | 4 (12.5%) | 28 (87.5%) |
| 2 Unit Apartments | 0 (0.0%) | 8 (100.0%) |
| 3 or 4 Unit Apartments | 0 (0.0%) | 57 (100.0%) |
| 5 to 9 Unit Apartments | 0 (0.0%) | 0 (0.0%) |
| 10 or more Apartments | 0 (0.0%) | 0 (0.0%) |
| Mobile Home / Other | 104 (94.6%) | 6 (5.4%) |
| Total | 480 (78.4%) | 132 (21.6%) |
Housing Structures by Number of Rooms in Ault
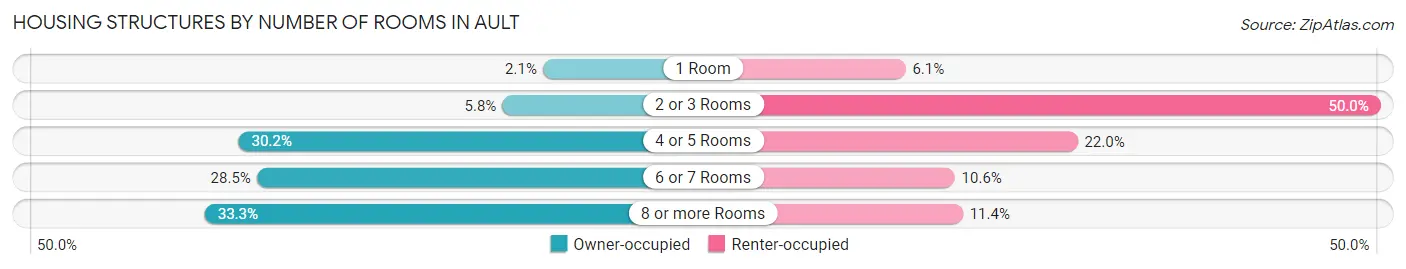
| Number of Rooms | Owner-occupied | Renter-occupied |
| 1 Room | 10 (2.1%) | 8 (6.1%) |
| 2 or 3 Rooms | 28 (5.8%) | 66 (50.0%) |
| 4 or 5 Rooms | 145 (30.2%) | 29 (22.0%) |
| 6 or 7 Rooms | 137 (28.5%) | 14 (10.6%) |
| 8 or more Rooms | 160 (33.3%) | 15 (11.4%) |
| Total | 480 (100.0%) | 132 (100.0%) |
Housing Structure by Heating Type in Ault
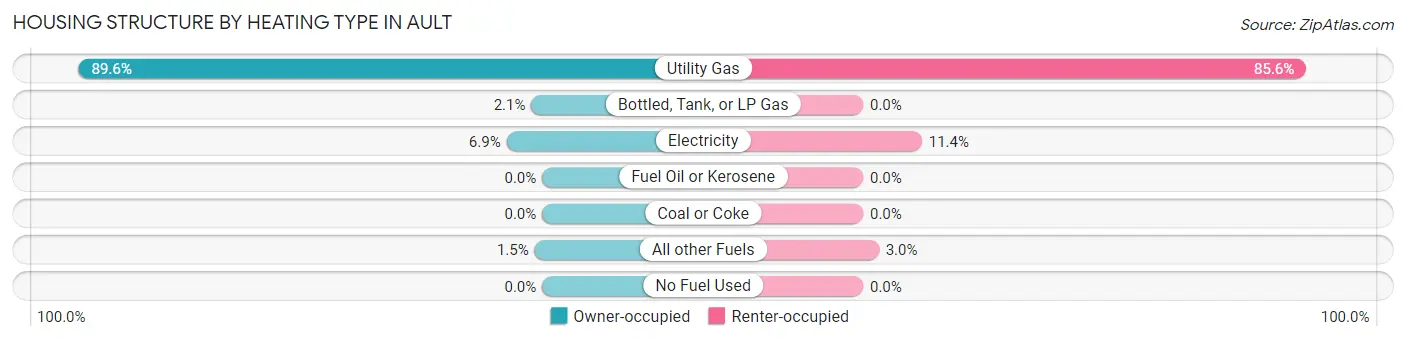
| Heating Type | Owner-occupied | Renter-occupied |
| Utility Gas | 430 (89.6%) | 113 (85.6%) |
| Bottled, Tank, or LP Gas | 10 (2.1%) | 0 (0.0%) |
| Electricity | 33 (6.9%) | 15 (11.4%) |
| Fuel Oil or Kerosene | 0 (0.0%) | 0 (0.0%) |
| Coal or Coke | 0 (0.0%) | 0 (0.0%) |
| All other Fuels | 7 (1.5%) | 4 (3.0%) |
| No Fuel Used | 0 (0.0%) | 0 (0.0%) |
| Total | 480 (100.0%) | 132 (100.0%) |
Household Vehicle Usage in Ault
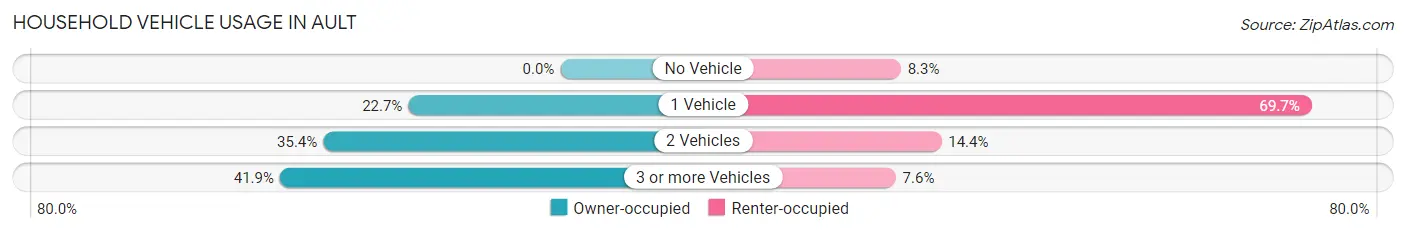
| Vehicles per Household | Owner-occupied | Renter-occupied |
| No Vehicle | 0 (0.0%) | 11 (8.3%) |
| 1 Vehicle | 109 (22.7%) | 92 (69.7%) |
| 2 Vehicles | 170 (35.4%) | 19 (14.4%) |
| 3 or more Vehicles | 201 (41.9%) | 10 (7.6%) |
| Total | 480 (100.0%) | 132 (100.0%) |
Real Estate & Mortgages in Ault
Real Estate and Mortgage Overview in Ault
| Characteristic | Without Mortgage | With Mortgage |
| Housing Units | 189 | 291 |
| Median Property Value | - | - |
| Median Household Income | $63,977 | $37 |
| Monthly Housing Costs | $483 | $14 |
| Real Estate Taxes | - | - |
Property Value by Mortgage Status in Ault
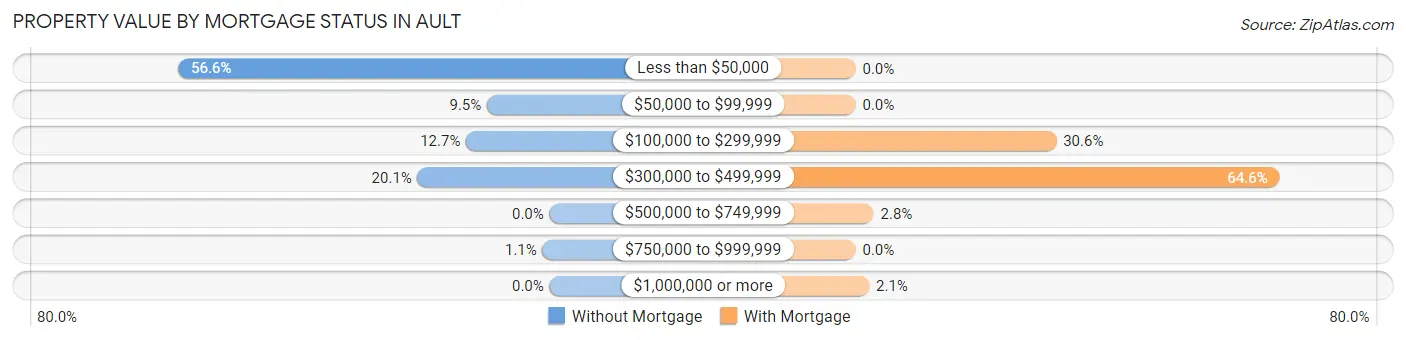
| Property Value | Without Mortgage | With Mortgage |
| Less than $50,000 | 107 (56.6%) | 0 (0.0%) |
| $50,000 to $99,999 | 18 (9.5%) | 0 (0.0%) |
| $100,000 to $299,999 | 24 (12.7%) | 89 (30.6%) |
| $300,000 to $499,999 | 38 (20.1%) | 188 (64.6%) |
| $500,000 to $749,999 | 0 (0.0%) | 8 (2.8%) |
| $750,000 to $999,999 | 2 (1.1%) | 0 (0.0%) |
| $1,000,000 or more | 0 (0.0%) | 6 (2.1%) |
| Total | 189 (100.0%) | 291 (100.0%) |
Household Income by Mortgage Status in Ault
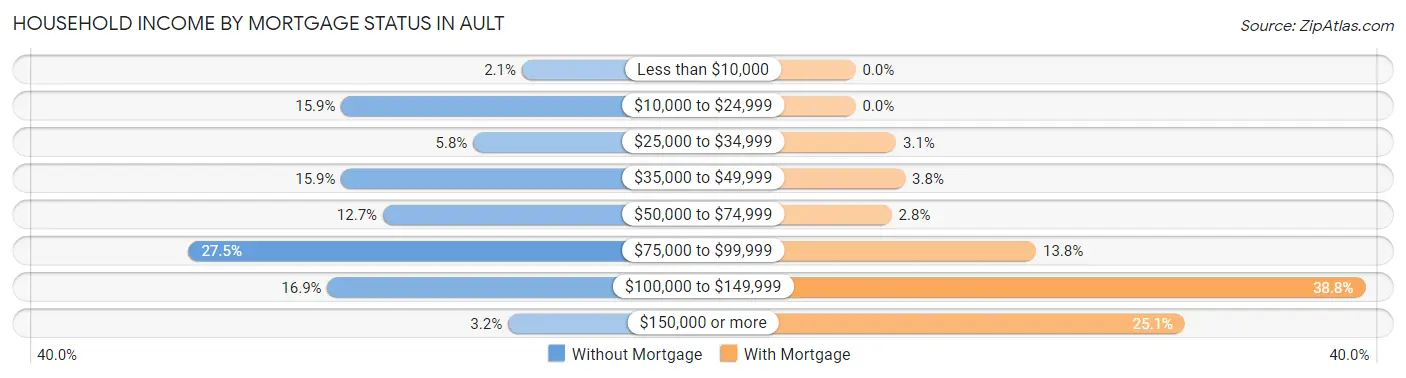
| Household Income | Without Mortgage | With Mortgage |
| Less than $10,000 | 4 (2.1%) | 0 (0.0%) |
| $10,000 to $24,999 | 30 (15.9%) | 0 (0.0%) |
| $25,000 to $34,999 | 11 (5.8%) | 9 (3.1%) |
| $35,000 to $49,999 | 30 (15.9%) | 11 (3.8%) |
| $50,000 to $74,999 | 24 (12.7%) | 8 (2.8%) |
| $75,000 to $99,999 | 52 (27.5%) | 40 (13.8%) |
| $100,000 to $149,999 | 32 (16.9%) | 113 (38.8%) |
| $150,000 or more | 6 (3.2%) | 73 (25.1%) |
| Total | 189 (100.0%) | 291 (100.0%) |
Property Value to Household Income Ratio in Ault
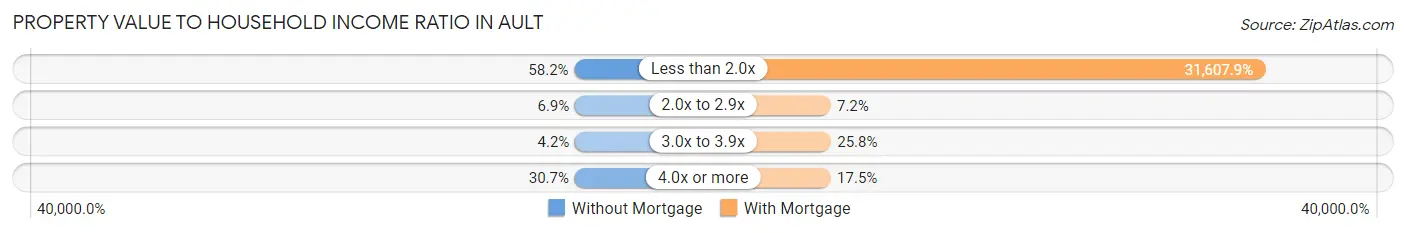
| Value-to-Income Ratio | Without Mortgage | With Mortgage |
| Less than 2.0x | 110 (58.2%) | 91,979 (31,607.9%) |
| 2.0x to 2.9x | 13 (6.9%) | 21 (7.2%) |
| 3.0x to 3.9x | 8 (4.2%) | 75 (25.8%) |
| 4.0x or more | 58 (30.7%) | 51 (17.5%) |
| Total | 189 (100.0%) | 291 (100.0%) |
Real Estate Taxes by Mortgage Status in Ault
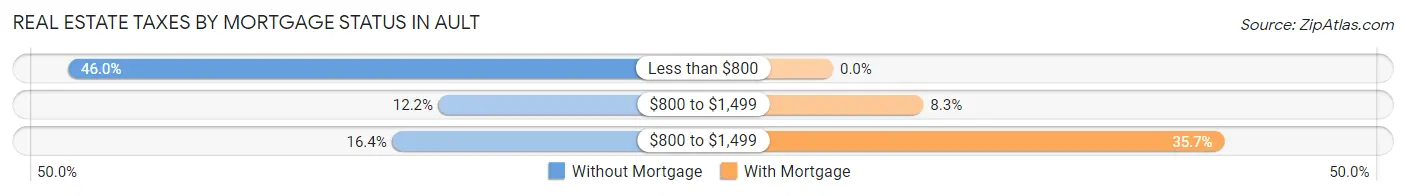
| Property Taxes | Without Mortgage | With Mortgage |
| Less than $800 | 87 (46.0%) | 0 (0.0%) |
| $800 to $1,499 | 23 (12.2%) | 24 (8.3%) |
| $800 to $1,499 | 31 (16.4%) | 104 (35.7%) |
| Total | 189 (100.0%) | 291 (100.0%) |
Health & Disability in Ault
Health Insurance Coverage by Age in Ault
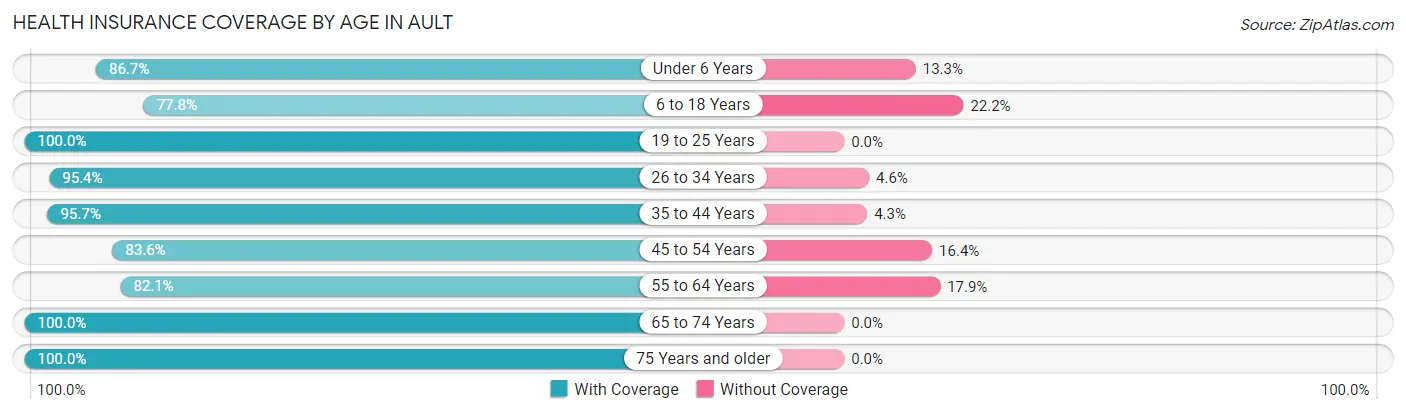
| Age Bracket | With Coverage | Without Coverage |
| Under 6 Years | 117 (86.7%) | 18 (13.3%) |
| 6 to 18 Years | 224 (77.8%) | 64 (22.2%) |
| 19 to 25 Years | 110 (100.0%) | 0 (0.0%) |
| 26 to 34 Years | 186 (95.4%) | 9 (4.6%) |
| 35 to 44 Years | 224 (95.7%) | 10 (4.3%) |
| 45 to 54 Years | 148 (83.6%) | 29 (16.4%) |
| 55 to 64 Years | 147 (82.1%) | 32 (17.9%) |
| 65 to 74 Years | 165 (100.0%) | 0 (0.0%) |
| 75 Years and older | 115 (100.0%) | 0 (0.0%) |
| Total | 1,436 (89.9%) | 162 (10.1%) |
Health Insurance Coverage by Citizenship Status in Ault
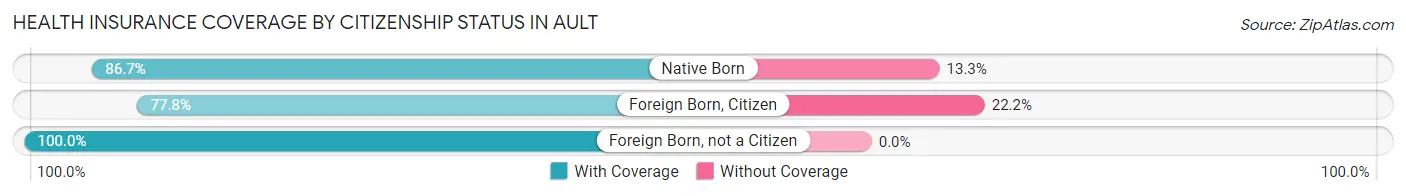
| Citizenship Status | With Coverage | Without Coverage |
| Native Born | 117 (86.7%) | 18 (13.3%) |
| Foreign Born, Citizen | 224 (77.8%) | 64 (22.2%) |
| Foreign Born, not a Citizen | 110 (100.0%) | 0 (0.0%) |
Health Insurance Coverage by Household Income in Ault
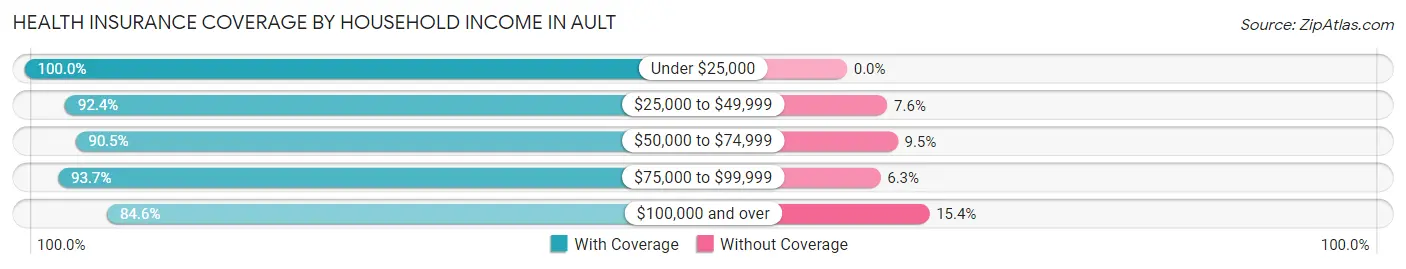
| Household Income | With Coverage | Without Coverage |
| Under $25,000 | 123 (100.0%) | 0 (0.0%) |
| $25,000 to $49,999 | 208 (92.4%) | 17 (7.6%) |
| $50,000 to $74,999 | 219 (90.5%) | 23 (9.5%) |
| $75,000 to $99,999 | 344 (93.7%) | 23 (6.3%) |
| $100,000 and over | 542 (84.6%) | 99 (15.4%) |
Public vs Private Health Insurance Coverage by Age in Ault
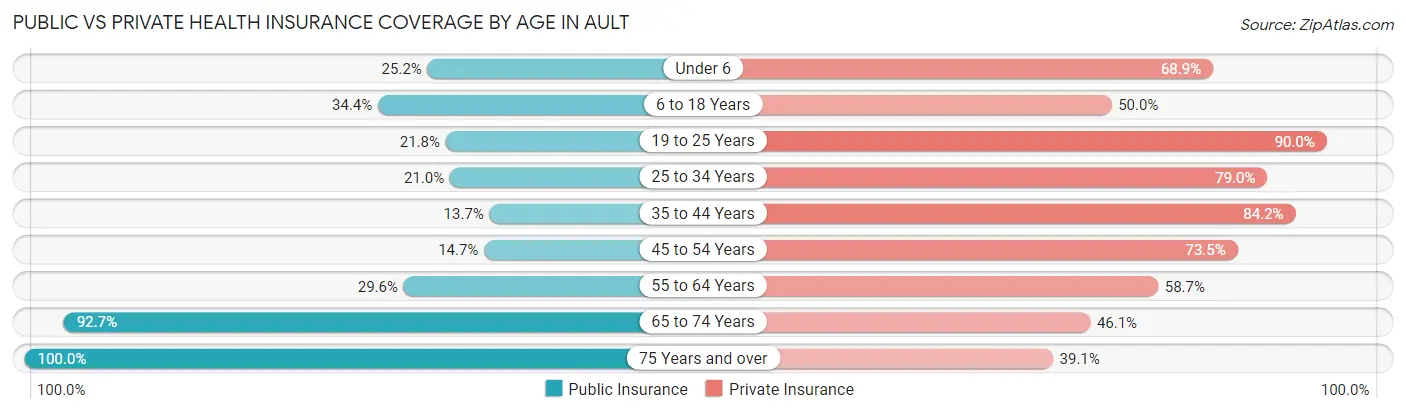
| Age Bracket | Public Insurance | Private Insurance |
| Under 6 | 34 (25.2%) | 93 (68.9%) |
| 6 to 18 Years | 99 (34.4%) | 144 (50.0%) |
| 19 to 25 Years | 24 (21.8%) | 99 (90.0%) |
| 25 to 34 Years | 41 (21.0%) | 154 (79.0%) |
| 35 to 44 Years | 32 (13.7%) | 197 (84.2%) |
| 45 to 54 Years | 26 (14.7%) | 130 (73.5%) |
| 55 to 64 Years | 53 (29.6%) | 105 (58.7%) |
| 65 to 74 Years | 153 (92.7%) | 76 (46.1%) |
| 75 Years and over | 115 (100.0%) | 45 (39.1%) |
| Total | 577 (36.1%) | 1,043 (65.3%) |
Disability Status by Sex by Age in Ault
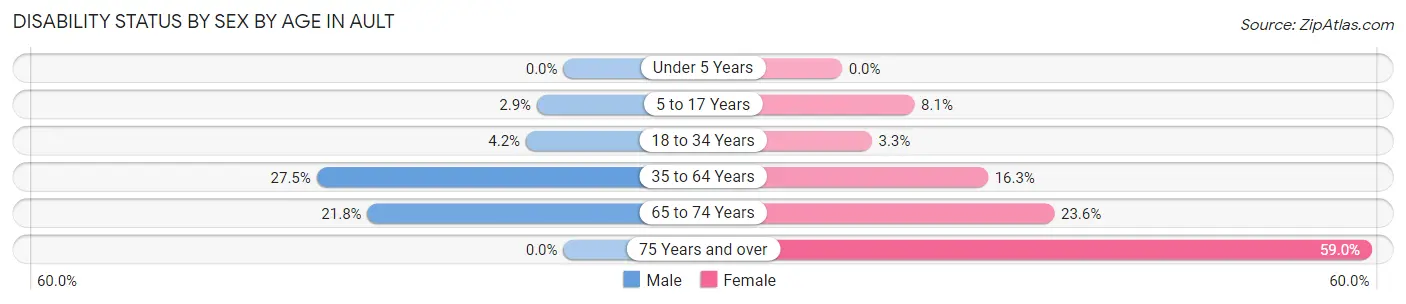
| Age Bracket | Male | Female |
| Under 5 Years | 0 (0.0%) | 0 (0.0%) |
| 5 to 17 Years | 3 (2.9%) | 17 (8.1%) |
| 18 to 34 Years | 8 (4.2%) | 4 (3.3%) |
| 35 to 64 Years | 86 (27.5%) | 45 (16.3%) |
| 65 to 74 Years | 24 (21.8%) | 13 (23.6%) |
| 75 Years and over | 0 (0.0%) | 49 (59.0%) |
Disability Class by Sex by Age in Ault
Disability Class: Hearing Difficulty
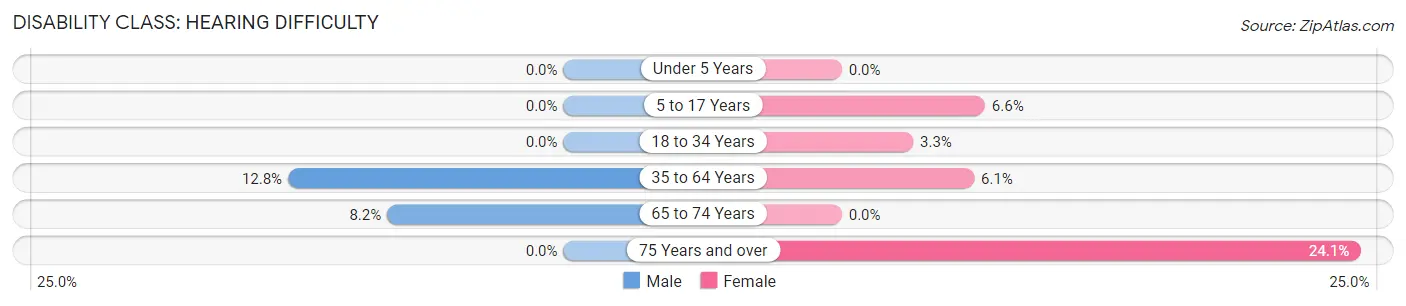
| Age Bracket | Male | Female |
| Under 5 Years | 0 (0.0%) | 0 (0.0%) |
| 5 to 17 Years | 0 (0.0%) | 14 (6.6%) |
| 18 to 34 Years | 0 (0.0%) | 4 (3.3%) |
| 35 to 64 Years | 40 (12.8%) | 17 (6.1%) |
| 65 to 74 Years | 9 (8.2%) | 0 (0.0%) |
| 75 Years and over | 0 (0.0%) | 20 (24.1%) |
Disability Class: Vision Difficulty
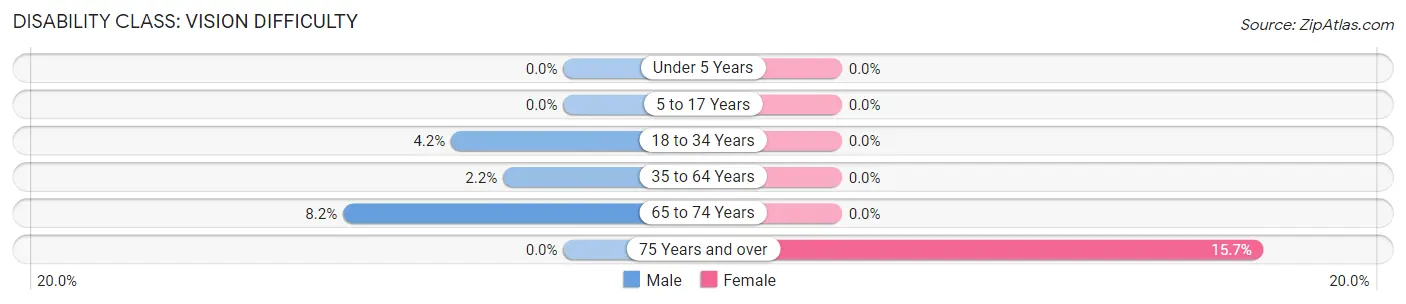
| Age Bracket | Male | Female |
| Under 5 Years | 0 (0.0%) | 0 (0.0%) |
| 5 to 17 Years | 0 (0.0%) | 0 (0.0%) |
| 18 to 34 Years | 8 (4.2%) | 0 (0.0%) |
| 35 to 64 Years | 7 (2.2%) | 0 (0.0%) |
| 65 to 74 Years | 9 (8.2%) | 0 (0.0%) |
| 75 Years and over | 0 (0.0%) | 13 (15.7%) |
Disability Class: Cognitive Difficulty
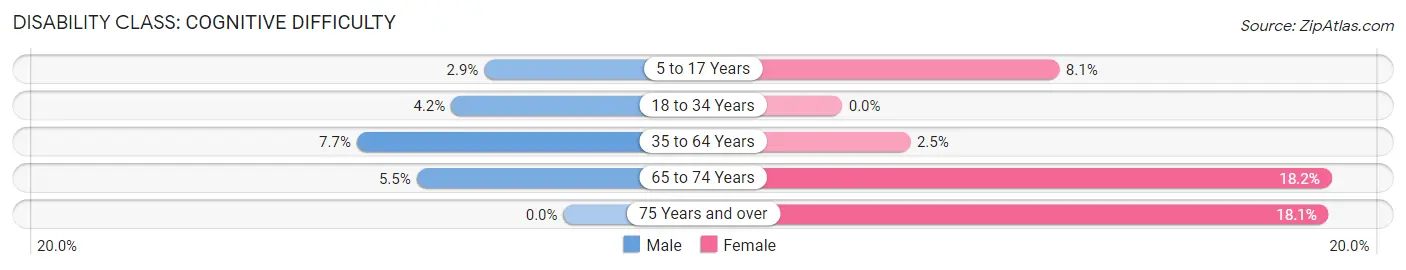
| Age Bracket | Male | Female |
| 5 to 17 Years | 3 (2.9%) | 17 (8.1%) |
| 18 to 34 Years | 8 (4.2%) | 0 (0.0%) |
| 35 to 64 Years | 24 (7.7%) | 7 (2.5%) |
| 65 to 74 Years | 6 (5.4%) | 10 (18.2%) |
| 75 Years and over | 0 (0.0%) | 15 (18.1%) |
Disability Class: Ambulatory Difficulty
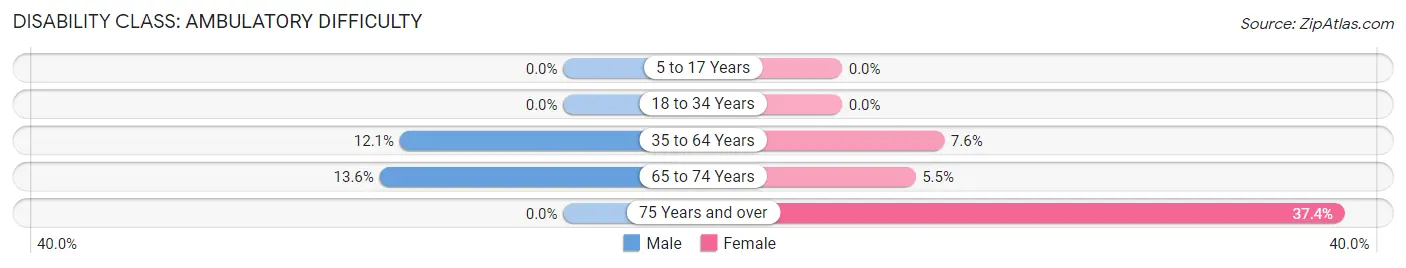
| Age Bracket | Male | Female |
| 5 to 17 Years | 0 (0.0%) | 0 (0.0%) |
| 18 to 34 Years | 0 (0.0%) | 0 (0.0%) |
| 35 to 64 Years | 38 (12.1%) | 21 (7.6%) |
| 65 to 74 Years | 15 (13.6%) | 3 (5.4%) |
| 75 Years and over | 0 (0.0%) | 31 (37.3%) |
Disability Class: Self-Care Difficulty
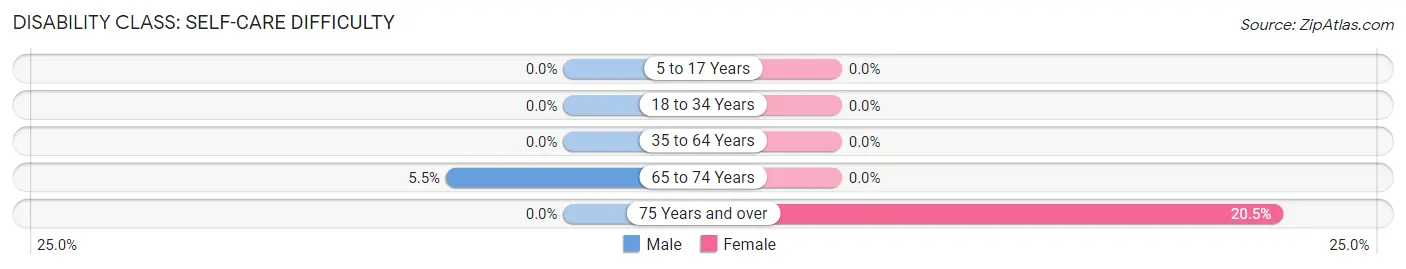
| Age Bracket | Male | Female |
| 5 to 17 Years | 0 (0.0%) | 0 (0.0%) |
| 18 to 34 Years | 0 (0.0%) | 0 (0.0%) |
| 35 to 64 Years | 0 (0.0%) | 0 (0.0%) |
| 65 to 74 Years | 6 (5.4%) | 0 (0.0%) |
| 75 Years and over | 0 (0.0%) | 17 (20.5%) |
Technology Access in Ault
Computing Device Access in Ault
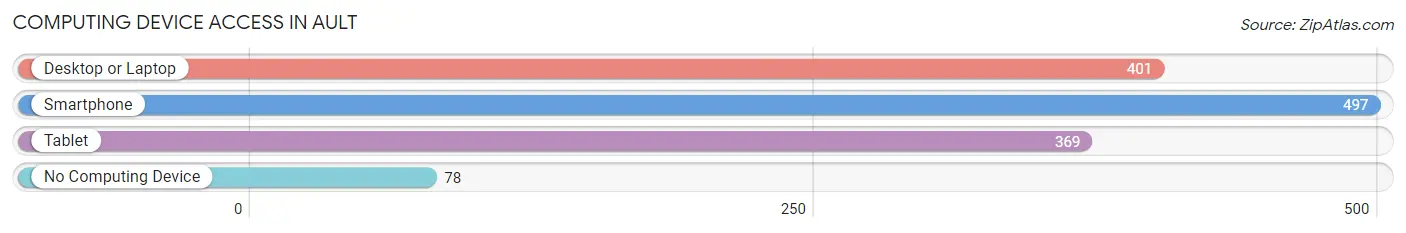
| Device Type | # Households | % Households |
| Desktop or Laptop | 401 | 65.5% |
| Smartphone | 497 | 81.2% |
| Tablet | 369 | 60.3% |
| No Computing Device | 78 | 12.8% |
| Total | 612 | 100.0% |
Internet Access in Ault
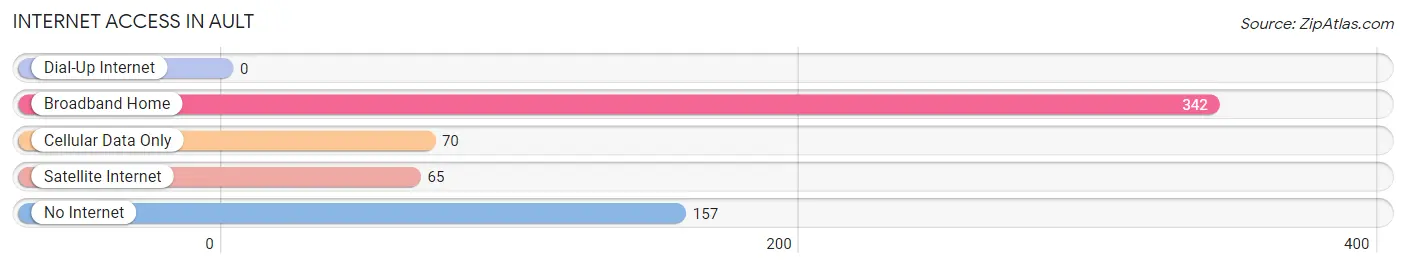
| Internet Type | # Households | % Households |
| Dial-Up Internet | 0 | 0.0% |
| Broadband Home | 342 | 55.9% |
| Cellular Data Only | 70 | 11.4% |
| Satellite Internet | 65 | 10.6% |
| No Internet | 157 | 25.7% |
| Total | 612 | 100.0% |
Ault Summary
Ault is a small town located in Weld County, Colorado, United States. It is situated along the South Platte River, approximately 25 miles east of Greeley and 40 miles northeast of Denver. The town was founded in 1885 and incorporated in 1906. As of the 2010 census, the population of Ault was 1,564.
History
The town of Ault was founded in 1885 by William Ault, a homesteader from Ohio. Ault was a small farming community until the arrival of the Union Pacific Railroad in 1887. The railroad brought with it a new wave of settlers and businesses, and Ault quickly grew into a thriving agricultural center.
In 1906, Ault was officially incorporated as a town. The town was named after William Ault, who had donated the land for the town.
In the early 20th century, Ault was a major center for sugar beet production. The town was home to several sugar beet processing plants, which provided employment for many of the town’s residents.
Geography
Ault is located in Weld County, Colorado, at an elevation of 4,845 feet. The town is situated along the South Platte River, approximately 25 miles east of Greeley and 40 miles northeast of Denver.
The town covers an area of 1.2 square miles, all of which is land. The town is bordered by the towns of Pierce to the north, Eaton to the east, and Greeley to the south.
Economy
The economy of Ault is largely based on agriculture. The town is home to several farms and ranches, which produce a variety of crops, including wheat, corn, and sugar beets.
The town is also home to several small businesses, including restaurants, retail stores, and service providers.
Demographics
As of the 2010 census, the population of Ault was 1,564. The racial makeup of the town was 94.3% White, 0.3% African American, 0.7% Native American, 0.3% Asian, 0.1% Pacific Islander, 2.2% from other races, and 2.3% from two or more races. Hispanic or Latino of any race were 8.2% of the population.
The median household income in Ault was $45,938, and the median family income was $51,250. The per capita income for the town was $20,945. About 8.3% of families and 10.2% of the population were below the poverty line, including 14.2% of those under age 18 and 6.2% of those age 65 or over.
Common Questions
What is Per Capita Income in Ault?
Per Capita income in Ault is $31,520.
What is the Median Family Income in Ault?
Median Family Income in Ault is $92,500.
What is the Median Household income in Ault?
Median Household Income in Ault is $76,215.
What is Income or Wage Gap in Ault?
Income or Wage Gap in Ault is 48.6%.
Women in Ault earn 51.4 cents for every dollar earned by a man.
What is Inequality or Gini Index in Ault?
Inequality or Gini Index in Ault is 0.32.
What is the Total Population of Ault?
Total Population of Ault is 1,601.
What is the Total Male Population of Ault?
Total Male Population of Ault is 829.
What is the Total Female Population of Ault?
Total Female Population of Ault is 772.
What is the Ratio of Males per 100 Females in Ault?
There are 107.38 Males per 100 Females in Ault.
What is the Ratio of Females per 100 Males in Ault?
There are 93.12 Females per 100 Males in Ault.
What is the Median Population Age in Ault?
Median Population Age in Ault is 37.8 Years.
What is the Average Family Size in Ault
Average Family Size in Ault is 3.2 People.
What is the Average Household Size in Ault
Average Household Size in Ault is 2.6 People.
How Large is the Labor Force in Ault?
There are 857 People in the Labor Forcein in Ault.
What is the Percentage of People in the Labor Force in Ault?
69.3% of People are in the Labor Force in Ault.
What is the Unemployment Rate in Ault?
Unemployment Rate in Ault is 1.6%.