Allenspark, CO Map & Demographics
Allenspark Map
Allenspark Overview
$63,291
PER CAPITA INCOME
$173,674
AVG FAMILY INCOME
$144,265
AVG HOUSEHOLD INCOME
22.3%
WAGE / INCOME GAP [ % ]
77.7¢/ $1
WAGE / INCOME GAP [ $ ]
$9,536
FAMILY INCOME DEFICIT
0.39
INEQUALITY / GINI INDEX
622
TOTAL POPULATION
332
MALE POPULATION
290
FEMALE POPULATION
114.48
MALES / 100 FEMALES
87.35
FEMALES / 100 MALES
51.0
MEDIAN AGE
2.9
AVG FAMILY SIZE
2.3
AVG HOUSEHOLD SIZE
385
LABOR FORCE [ PEOPLE ]
69.5%
PERCENT IN LABOR FORCE
3.6%
UNEMPLOYMENT RATE
Allenspark Zip Codes
Income in Allenspark
Income Overview in Allenspark
Per Capita Income in Allenspark is $63,291, while median incomes of families and households are $173,674 and $144,265 respectively.
| Characteristic | Number | Measure |
| Per Capita Income | 622 | $63,291 |
| Median Family Income | 161 | $173,674 |
| Mean Family Income | 161 | $183,242 |
| Median Household Income | 262 | $144,265 |
| Mean Household Income | 262 | $147,185 |
| Income Deficit | 161 | $9,536 |
| Wage / Income Gap (%) | 622 | 22.35% |
| Wage / Income Gap ($) | 622 | 77.65¢ per $1 |
| Gini / Inequality Index | 622 | 0.39 |
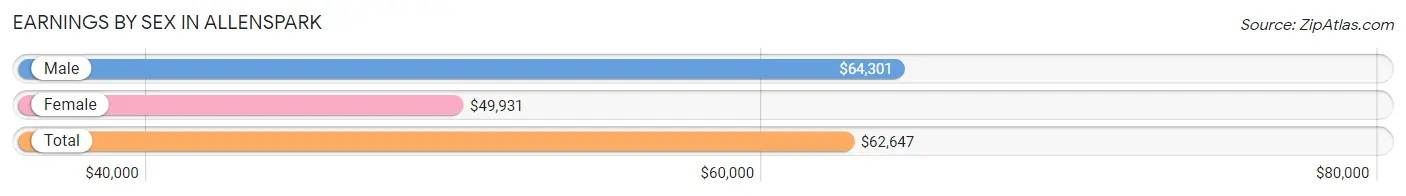
Earnings by Sex in Allenspark
Average Earnings in Allenspark are $62,647, $64,301 for men and $49,931 for women, a difference of 22.4%.
| Sex | Number | Average Earnings |
| Male | 215 (52.7%) | $64,301 |
| Female | 193 (47.3%) | $49,931 |
| Total | 408 (100.0%) | $62,647 |
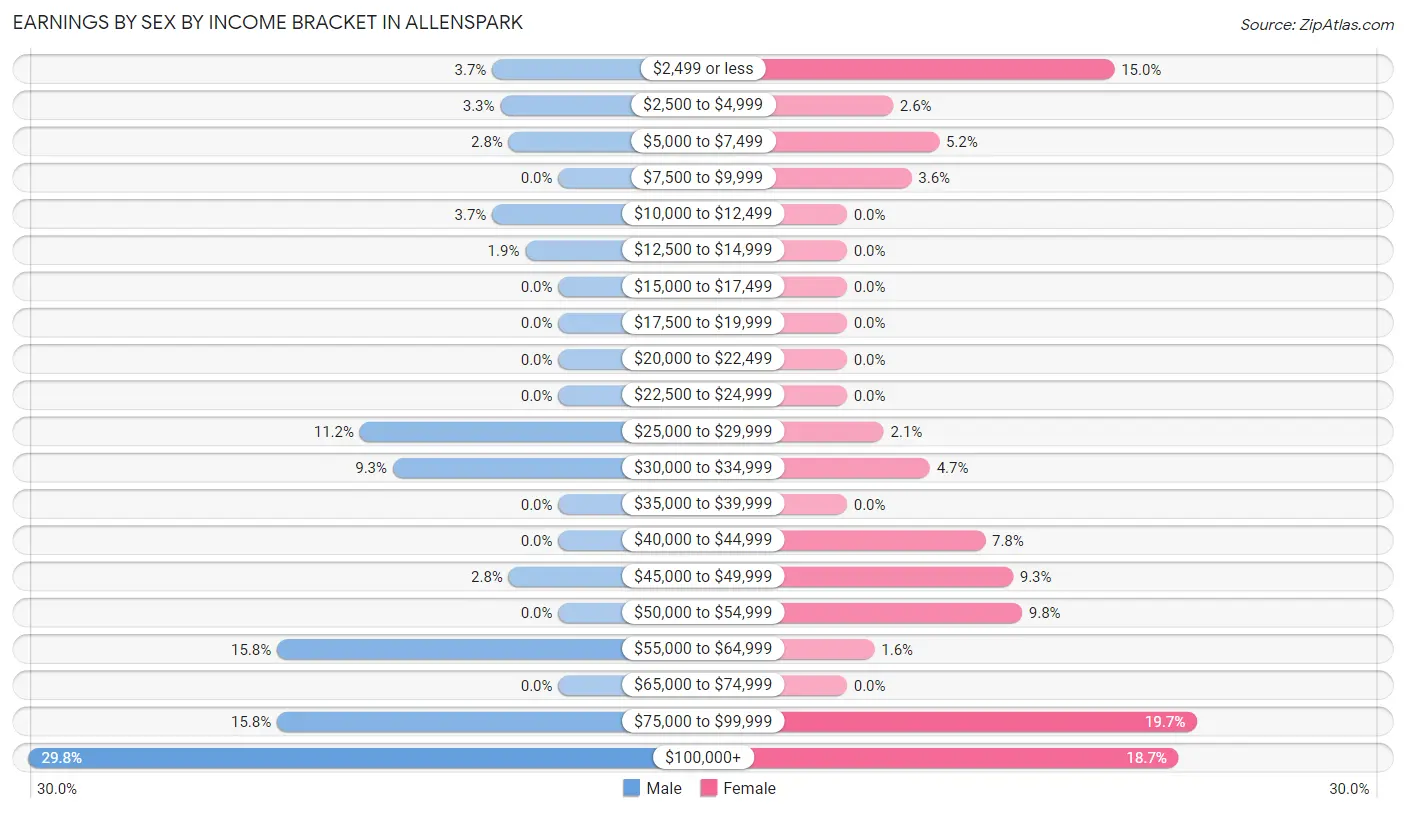
Earnings by Sex by Income Bracket in Allenspark
The most common earnings brackets in Allenspark are $100,000+ for men (64 | 29.8%) and $75,000 to $99,999 for women (38 | 19.7%).
| Income | Male | Female |
| $2,499 or less | 8 (3.7%) | 29 (15.0%) |
| $2,500 to $4,999 | 7 (3.3%) | 5 (2.6%) |
| $5,000 to $7,499 | 6 (2.8%) | 10 (5.2%) |
| $7,500 to $9,999 | 0 (0.0%) | 7 (3.6%) |
| $10,000 to $12,499 | 8 (3.7%) | 0 (0.0%) |
| $12,500 to $14,999 | 4 (1.9%) | 0 (0.0%) |
| $15,000 to $17,499 | 0 (0.0%) | 0 (0.0%) |
| $17,500 to $19,999 | 0 (0.0%) | 0 (0.0%) |
| $20,000 to $22,499 | 0 (0.0%) | 0 (0.0%) |
| $22,500 to $24,999 | 0 (0.0%) | 0 (0.0%) |
| $25,000 to $29,999 | 24 (11.2%) | 4 (2.1%) |
| $30,000 to $34,999 | 20 (9.3%) | 9 (4.7%) |
| $35,000 to $39,999 | 0 (0.0%) | 0 (0.0%) |
| $40,000 to $44,999 | 0 (0.0%) | 15 (7.8%) |
| $45,000 to $49,999 | 6 (2.8%) | 18 (9.3%) |
| $50,000 to $54,999 | 0 (0.0%) | 19 (9.8%) |
| $55,000 to $64,999 | 34 (15.8%) | 3 (1.5%) |
| $65,000 to $74,999 | 0 (0.0%) | 0 (0.0%) |
| $75,000 to $99,999 | 34 (15.8%) | 38 (19.7%) |
| $100,000+ | 64 (29.8%) | 36 (18.6%) |
| Total | 215 (100.0%) | 193 (100.0%) |
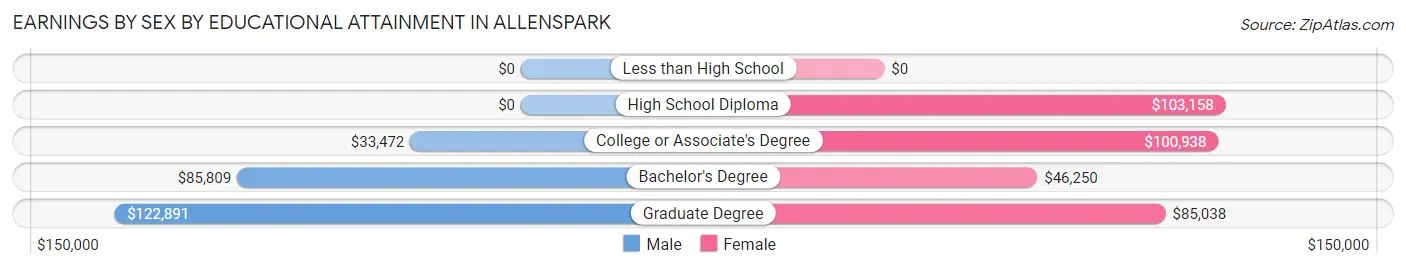
Earnings by Sex by Educational Attainment in Allenspark
| Educational Attainment | Male Income | Female Income |
| Less than High School | - | - |
| High School Diploma | - | - |
| College or Associate's Degree | $33,472 | $100,938 |
| Bachelor's Degree | $85,809 | $46,250 |
| Graduate Degree | $122,891 | $85,038 |
| Total | $64,779 | $0 |
Family Income in Allenspark
Family Income Brackets in Allenspark
According to the Allenspark family income data, there are 73 families falling into the $150,000 to $199,999 income range, which is the most common income bracket and makes up 45.3% of all families.
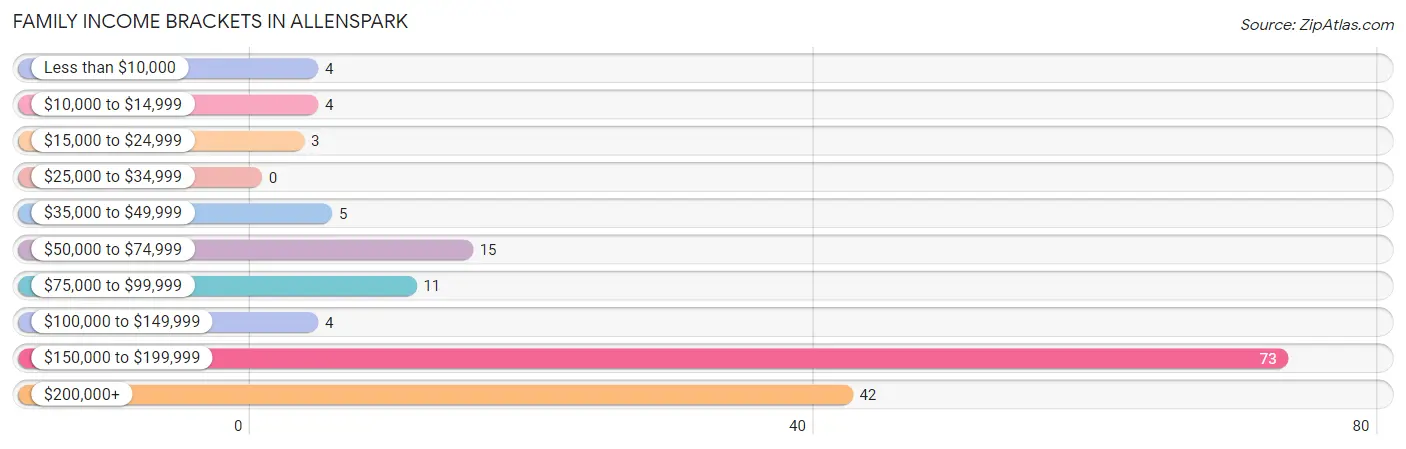
| Income Bracket | # Families | % Families |
| Less than $10,000 | 4 | 2.5% |
| $10,000 to $14,999 | 4 | 2.5% |
| $15,000 to $24,999 | 3 | 1.9% |
| $25,000 to $34,999 | 0 | 0.0% |
| $35,000 to $49,999 | 5 | 3.1% |
| $50,000 to $74,999 | 15 | 9.3% |
| $75,000 to $99,999 | 11 | 6.8% |
| $100,000 to $149,999 | 4 | 2.5% |
| $150,000 to $199,999 | 73 | 45.3% |
| $200,000+ | 42 | 26.1% |
Family Income by Famaliy Size in Allenspark
3-person families (33 | 20.5%) account for the highest median family income in Allenspark with $190,536 per family, while 3-person families (33 | 20.5%) have the highest median income of $63,512 per family member.
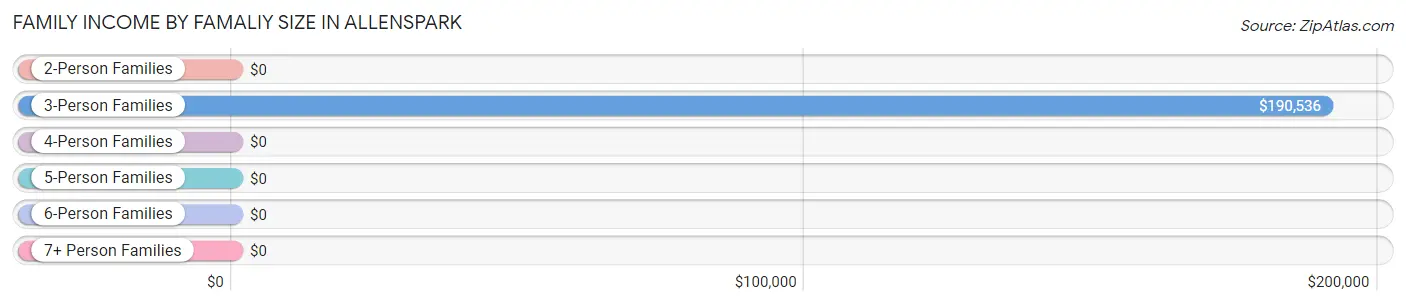
| Income Bracket | # Families | Median Income |
| 2-Person Families | 76 (47.2%) | $0 |
| 3-Person Families | 33 (20.5%) | $190,536 |
| 4-Person Families | 52 (32.3%) | $0 |
| 5-Person Families | 0 (0.0%) | $0 |
| 6-Person Families | 0 (0.0%) | $0 |
| 7+ Person Families | 0 (0.0%) | $0 |
| Total | 161 (100.0%) | $173,674 |
Family Income by Number of Earners in Allenspark
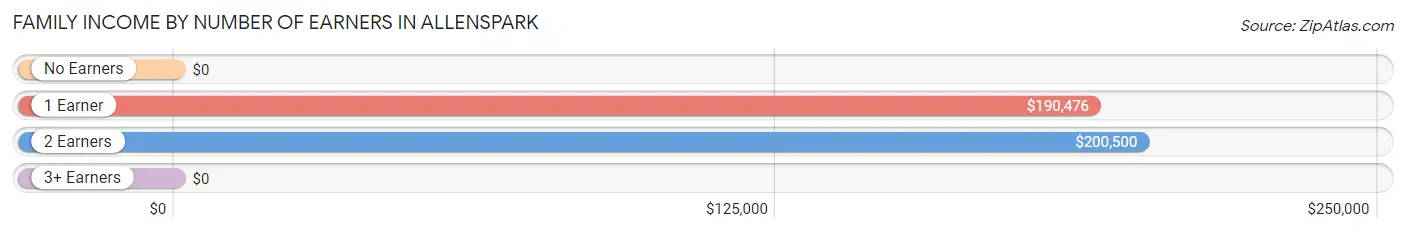
| Number of Earners | # Families | Median Income |
| No Earners | 8 (5.0%) | $0 |
| 1 Earner | 34 (21.1%) | $190,476 |
| 2 Earners | 82 (50.9%) | $200,500 |
| 3+ Earners | 37 (23.0%) | $0 |
| Total | 161 (100.0%) | $173,674 |
Household Income in Allenspark
Household Income Brackets in Allenspark
With 78 households falling in the category, the $150,000 to $199,999 income range is the most frequent in Allenspark, accounting for 29.8% of all households. In contrast, only 4 households (1.5%) fall into the $10,000 to $14,999 income bracket, making it the least populous group.
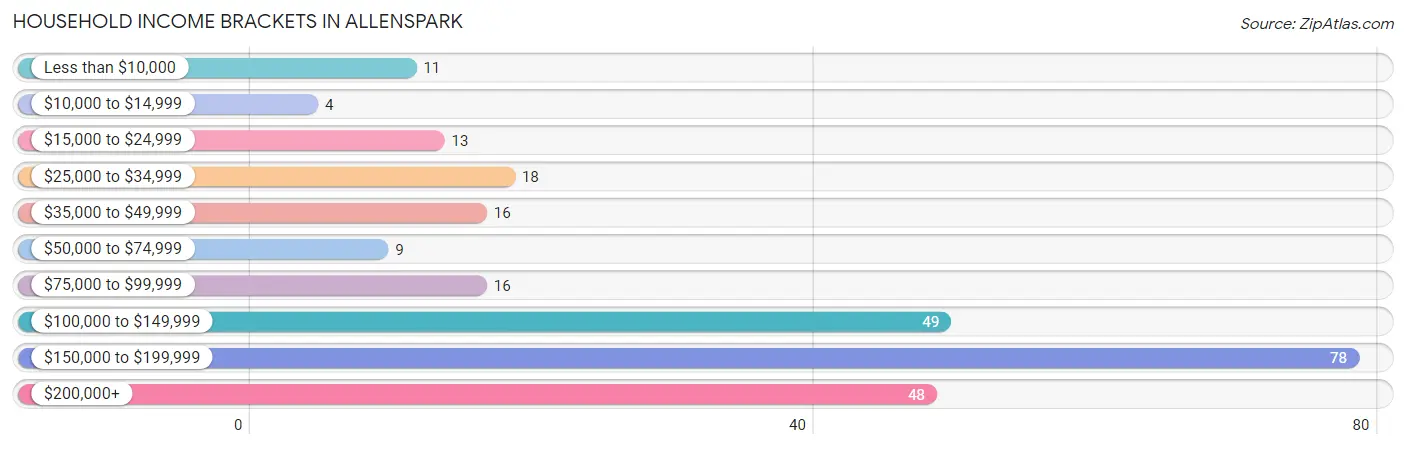
| Income Bracket | # Households | % Households |
| Less than $10,000 | 11 | 4.2% |
| $10,000 to $14,999 | 4 | 1.5% |
| $15,000 to $24,999 | 13 | 5.0% |
| $25,000 to $34,999 | 18 | 6.9% |
| $35,000 to $49,999 | 16 | 6.1% |
| $50,000 to $74,999 | 9 | 3.4% |
| $75,000 to $99,999 | 16 | 6.1% |
| $100,000 to $149,999 | 49 | 18.7% |
| $150,000 to $199,999 | 78 | 29.8% |
| $200,000+ | 48 | 18.3% |
Household Income by Householder Age in Allenspark
The median household income in Allenspark is $144,265, with the highest median household income of $174,015 found in the 45 to 64 years age bracket for the primary householder. A total of 146 households (55.7%) fall into this category.
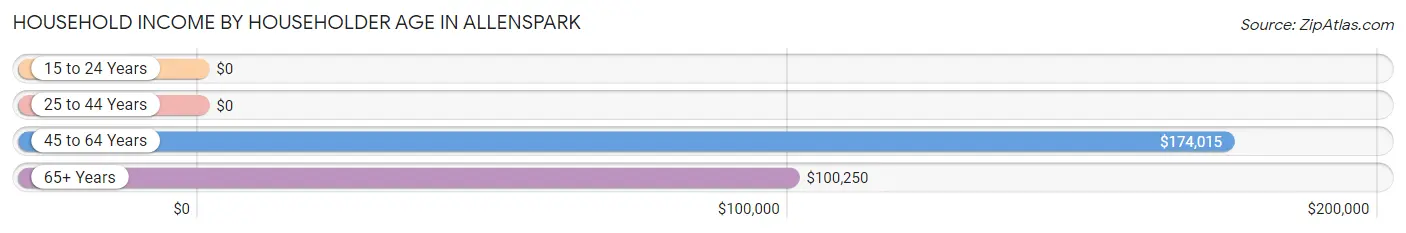
| Income Bracket | # Households | Median Income |
| 15 to 24 Years | 0 (0.0%) | $0 |
| 25 to 44 Years | 47 (17.9%) | $0 |
| 45 to 64 Years | 146 (55.7%) | $174,015 |
| 65+ Years | 69 (26.3%) | $100,250 |
| Total | 262 (100.0%) | $144,265 |
Poverty in Allenspark
Income Below Poverty by Sex and Age in Allenspark
With 10.3% poverty level for males and 6.6% for females among the residents of Allenspark, 16 and 17 year old males and 25 to 34 year old females are the most vulnerable to poverty, with 8 males (100.0%) and 7 females (22.6%) in their respective age groups living below the poverty level.
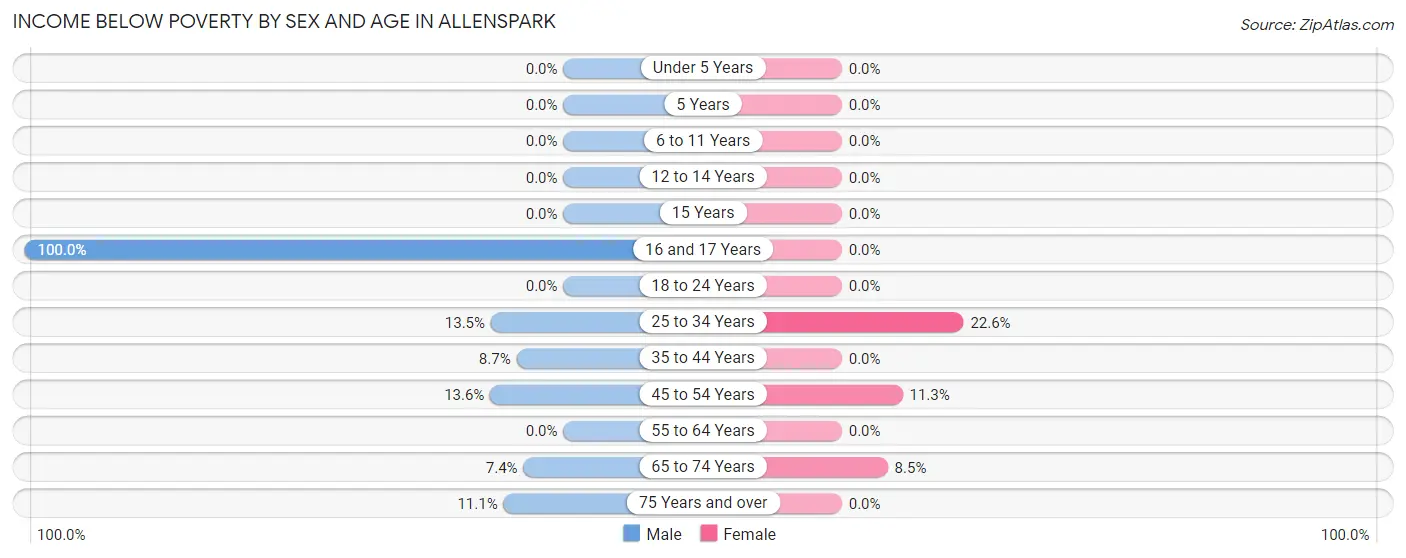
| Age Bracket | Male | Female |
| Under 5 Years | 0 (0.0%) | 0 (0.0%) |
| 5 Years | 0 (0.0%) | 0 (0.0%) |
| 6 to 11 Years | 0 (0.0%) | 0 (0.0%) |
| 12 to 14 Years | 0 (0.0%) | 0 (0.0%) |
| 15 Years | 0 (0.0%) | 0 (0.0%) |
| 16 and 17 Years | 8 (100.0%) | 0 (0.0%) |
| 18 to 24 Years | 0 (0.0%) | 0 (0.0%) |
| 25 to 34 Years | 7 (13.5%) | 7 (22.6%) |
| 35 to 44 Years | 2 (8.7%) | 0 (0.0%) |
| 45 to 54 Years | 11 (13.6%) | 8 (11.3%) |
| 55 to 64 Years | 0 (0.0%) | 0 (0.0%) |
| 65 to 74 Years | 2 (7.4%) | 4 (8.5%) |
| 75 Years and over | 4 (11.1%) | 0 (0.0%) |
| Total | 34 (10.3%) | 19 (6.6%) |
Income Above Poverty by Sex and Age in Allenspark
According to the poverty statistics in Allenspark, males aged 6 to 11 years and females aged 12 to 14 years are the age groups that are most secure financially, with 100.0% of males and 100.0% of females in these age groups living above the poverty line.
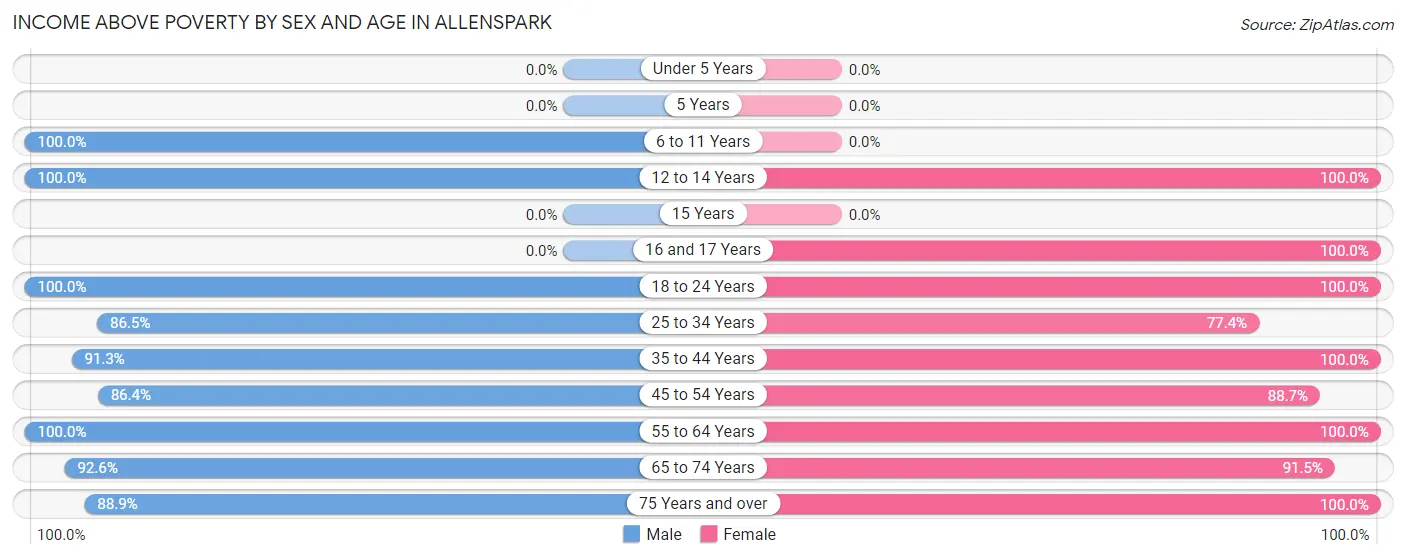
| Age Bracket | Male | Female |
| Under 5 Years | 0 (0.0%) | 0 (0.0%) |
| 5 Years | 0 (0.0%) | 0 (0.0%) |
| 6 to 11 Years | 20 (100.0%) | 0 (0.0%) |
| 12 to 14 Years | 26 (100.0%) | 20 (100.0%) |
| 15 Years | 0 (0.0%) | 0 (0.0%) |
| 16 and 17 Years | 0 (0.0%) | 29 (100.0%) |
| 18 to 24 Years | 5 (100.0%) | 7 (100.0%) |
| 25 to 34 Years | 45 (86.5%) | 24 (77.4%) |
| 35 to 44 Years | 21 (91.3%) | 6 (100.0%) |
| 45 to 54 Years | 70 (86.4%) | 63 (88.7%) |
| 55 to 64 Years | 52 (100.0%) | 64 (100.0%) |
| 65 to 74 Years | 25 (92.6%) | 43 (91.5%) |
| 75 Years and over | 32 (88.9%) | 15 (100.0%) |
| Total | 296 (89.7%) | 271 (93.4%) |
Income Below Poverty Among Married-Couple Families in Allenspark
The poverty statistics for married-couple families in Allenspark show that 7.3% or 11 of the total 150 families live below the poverty line. Families with no children have the highest poverty rate of 8.4%, comprising of 8 families. On the other hand, families with 1 or 2 children have the lowest poverty rate of 5.4%, which includes 3 families.
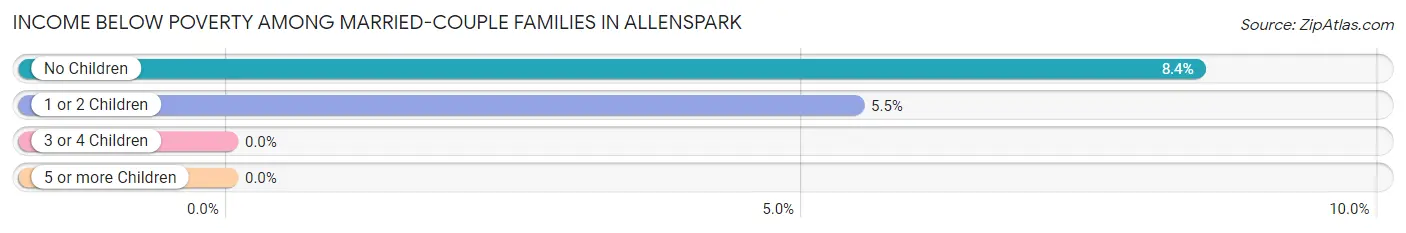
| Children | Above Poverty | Below Poverty |
| No Children | 87 (91.6%) | 8 (8.4%) |
| 1 or 2 Children | 52 (94.6%) | 3 (5.4%) |
| 3 or 4 Children | 0 (0.0%) | 0 (0.0%) |
| 5 or more Children | 0 (0.0%) | 0 (0.0%) |
| Total | 139 (92.7%) | 11 (7.3%) |
Income Below Poverty Among Single-Parent Households in Allenspark
| Children | Single Father | Single Mother |
| No Children | 0 (0.0%) | 0 (0.0%) |
| 1 or 2 Children | 0 (0.0%) | 0 (0.0%) |
| 3 or 4 Children | 0 (0.0%) | 0 (0.0%) |
| 5 or more Children | 0 (0.0%) | 0 (0.0%) |
| Total | 0 (0.0%) | 0 (0.0%) |
Income Below Poverty Among Married-Couple vs Single-Parent Households in Allenspark
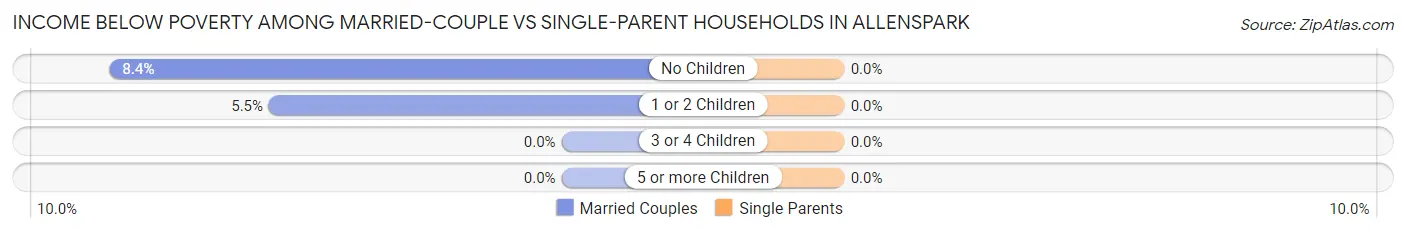
| Children | Married-Couple Families | Single-Parent Households |
| No Children | 8 (8.4%) | 0 (0.0%) |
| 1 or 2 Children | 3 (5.4%) | 0 (0.0%) |
| 3 or 4 Children | 0 (0.0%) | 0 (0.0%) |
| 5 or more Children | 0 (0.0%) | 0 (0.0%) |
| Total | 11 (7.3%) | 0 (0.0%) |
Race in Allenspark
The most populous races in Allenspark are White / Caucasian (543 | 87.3%), Two or more Races (77 | 12.4%), and Hispanic or Latino (38 | 6.1%).
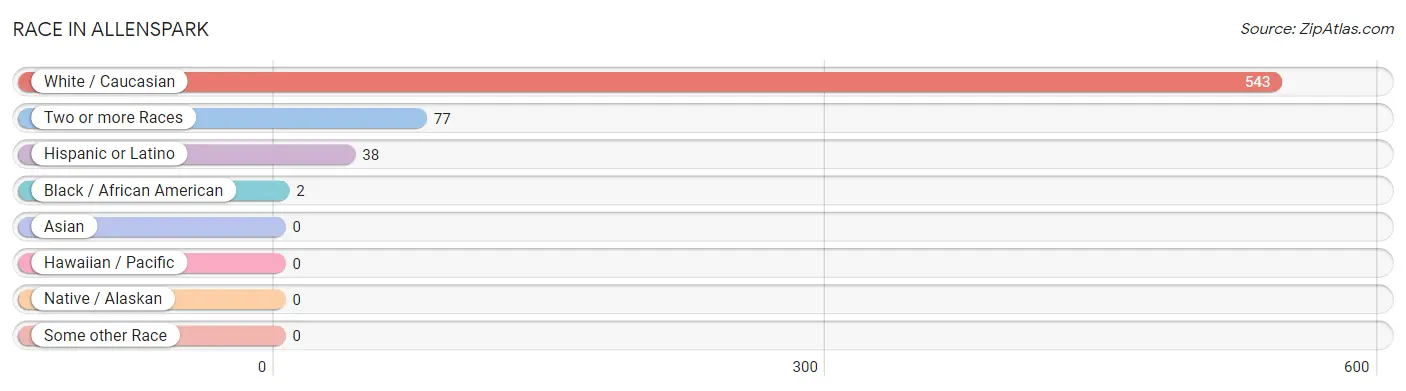
| Race | # Population | % Population |
| Asian | 0 | 0.0% |
| Black / African American | 2 | 0.3% |
| Hawaiian / Pacific | 0 | 0.0% |
| Hispanic or Latino | 38 | 6.1% |
| Native / Alaskan | 0 | 0.0% |
| White / Caucasian | 543 | 87.3% |
| Two or more Races | 77 | 12.4% |
| Some other Race | 0 | 0.0% |
| Total | 622 | 100.0% |
Ancestry in Allenspark
The most populous ancestries reported in Allenspark are Irish (161 | 25.9%), German (147 | 23.6%), English (139 | 22.4%), Swedish (41 | 6.6%), and Scandinavian (34 | 5.5%), together accounting for 83.9% of all Allenspark residents.
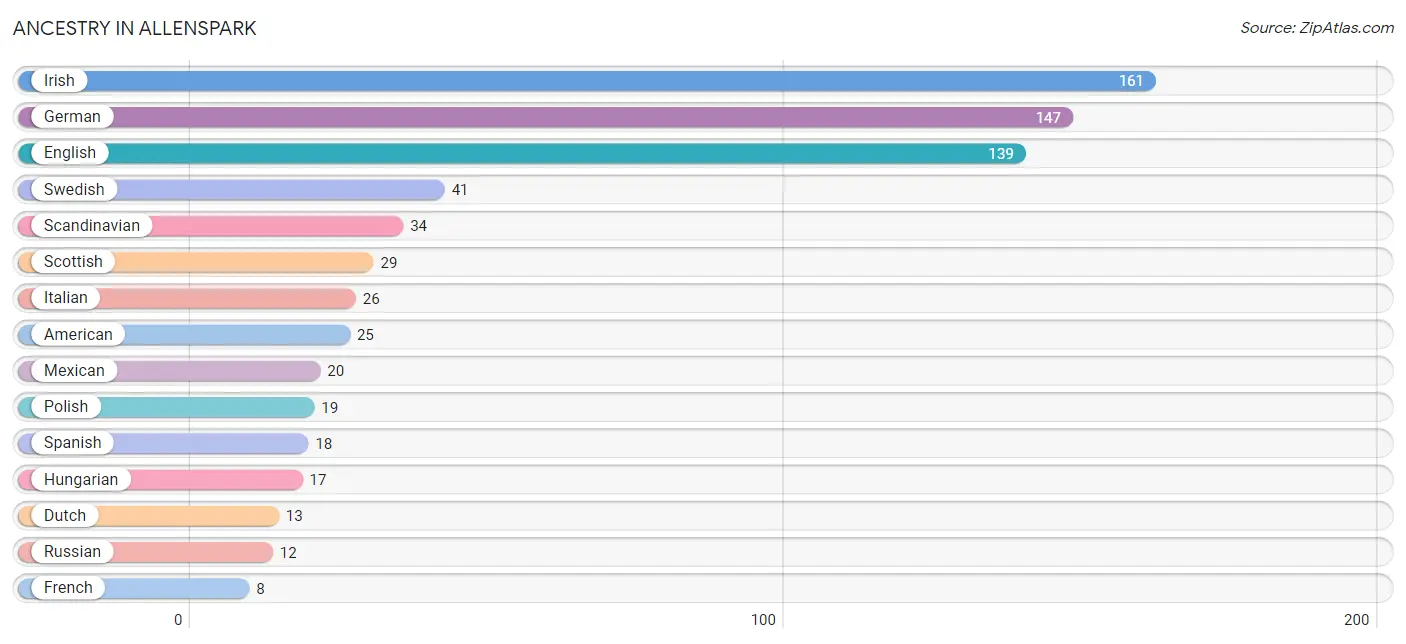
| Ancestry | # Population | % Population |
| American | 25 | 4.0% |
| Czech | 3 | 0.5% |
| Danish | 3 | 0.5% |
| Dutch | 13 | 2.1% |
| English | 139 | 22.4% |
| European | 3 | 0.5% |
| French | 8 | 1.3% |
| French American Indian | 3 | 0.5% |
| German | 147 | 23.6% |
| Hungarian | 17 | 2.7% |
| Irish | 161 | 25.9% |
| Italian | 26 | 4.2% |
| Mexican | 20 | 3.2% |
| Northern European | 4 | 0.6% |
| Norwegian | 5 | 0.8% |
| Polish | 19 | 3.0% |
| Russian | 12 | 1.9% |
| Scandinavian | 34 | 5.5% |
| Scottish | 29 | 4.7% |
| Slavic | 4 | 0.6% |
| Spanish | 18 | 2.9% |
| Swedish | 41 | 6.6% |
| Tlingit-Haida | 3 | 0.5% |
| Welsh | 6 | 1.0% | View All 24 Rows |
Immigrants in Allenspark
The most numerous immigrant groups reported in Allenspark came from Europe (8 | 1.3%), Eastern Europe (5 | 0.8%), Russia (5 | 0.8%), Northern Europe (3 | 0.5%), and Sweden (3 | 0.5%), together accounting for 3.8% of all Allenspark residents.
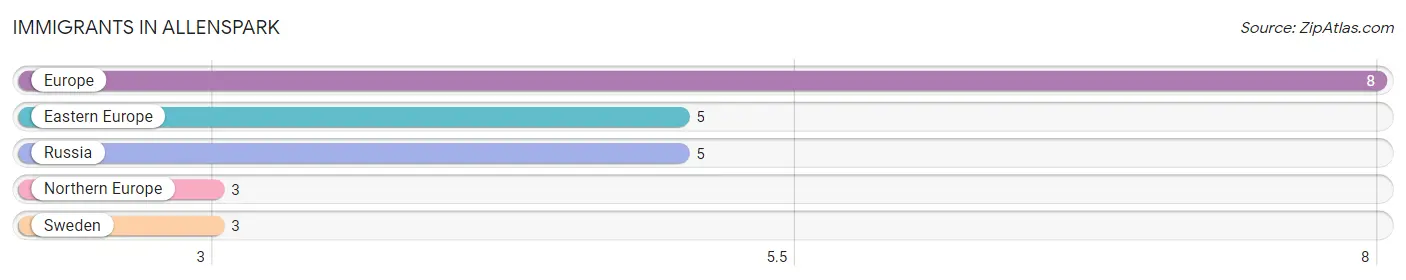
| Immigration Origin | # Population | % Population |
| Eastern Europe | 5 | 0.8% |
| Europe | 8 | 1.3% |
| Northern Europe | 3 | 0.5% |
| Russia | 5 | 0.8% |
| Sweden | 3 | 0.5% | View All 5 Rows |
Sex and Age in Allenspark
Sex and Age in Allenspark
The most populous age groups in Allenspark are 50 to 54 Years (56 | 16.9%) for men and 50 to 54 Years (52 | 17.9%) for women.
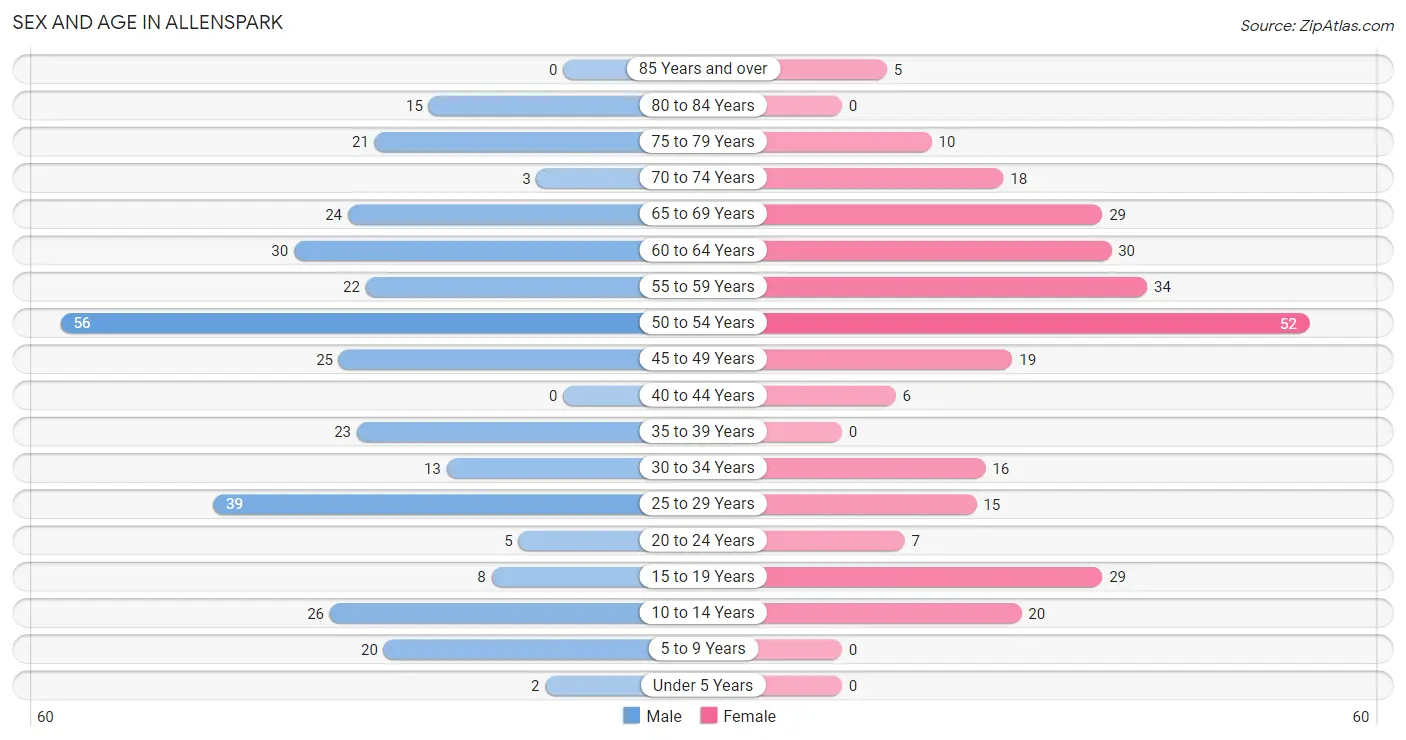
| Age Bracket | Male | Female |
| Under 5 Years | 2 (0.6%) | 0 (0.0%) |
| 5 to 9 Years | 20 (6.0%) | 0 (0.0%) |
| 10 to 14 Years | 26 (7.8%) | 20 (6.9%) |
| 15 to 19 Years | 8 (2.4%) | 29 (10.0%) |
| 20 to 24 Years | 5 (1.5%) | 7 (2.4%) |
| 25 to 29 Years | 39 (11.7%) | 15 (5.2%) |
| 30 to 34 Years | 13 (3.9%) | 16 (5.5%) |
| 35 to 39 Years | 23 (6.9%) | 0 (0.0%) |
| 40 to 44 Years | 0 (0.0%) | 6 (2.1%) |
| 45 to 49 Years | 25 (7.5%) | 19 (6.6%) |
| 50 to 54 Years | 56 (16.9%) | 52 (17.9%) |
| 55 to 59 Years | 22 (6.6%) | 34 (11.7%) |
| 60 to 64 Years | 30 (9.0%) | 30 (10.3%) |
| 65 to 69 Years | 24 (7.2%) | 29 (10.0%) |
| 70 to 74 Years | 3 (0.9%) | 18 (6.2%) |
| 75 to 79 Years | 21 (6.3%) | 10 (3.5%) |
| 80 to 84 Years | 15 (4.5%) | 0 (0.0%) |
| 85 Years and over | 0 (0.0%) | 5 (1.7%) |
| Total | 332 (100.0%) | 290 (100.0%) |
Families and Households in Allenspark
Median Family Size in Allenspark
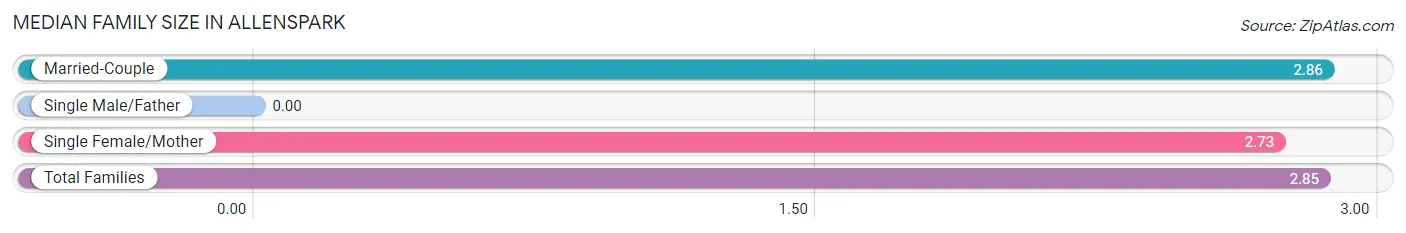
| Family Type | # Families | Family Size |
| Married-Couple | 150 (93.2%) | 2.86 |
| Single Male/Father | 0 (0.0%) | - |
| Single Female/Mother | 11 (6.8%) | 2.73 |
| Total Families | 161 (100.0%) | 2.85 |
Median Household Size in Allenspark
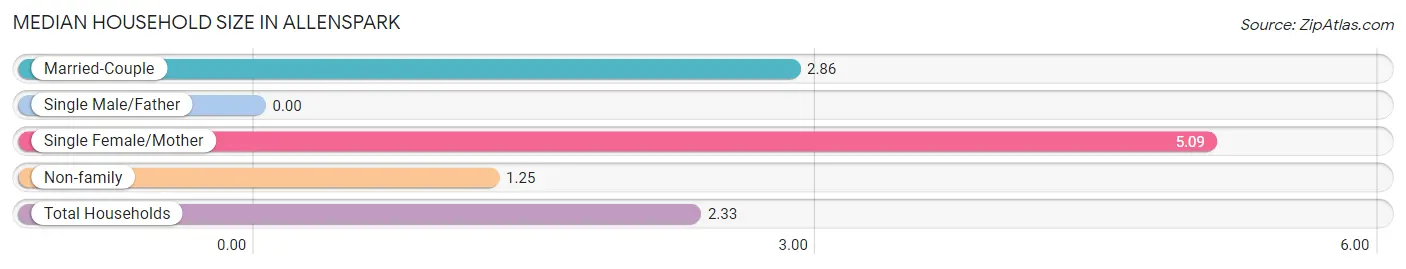
| Household Type | # Households | Household Size |
| Married-Couple | 150 (57.3%) | 2.86 |
| Single Male/Father | 0 (0.0%) | - |
| Single Female/Mother | 11 (4.2%) | 5.09 |
| Non-family | 101 (38.6%) | 1.25 |
| Total Households | 262 (100.0%) | 2.33 |
Household Size by Marriage Status in Allenspark
Out of a total of 262 households in Allenspark, 161 (61.5%) are family households, while 101 (38.6%) are nonfamily households. The most numerous type of family households are 2-person households, comprising 70, and the most common type of nonfamily households are 1-person households, comprising 76.
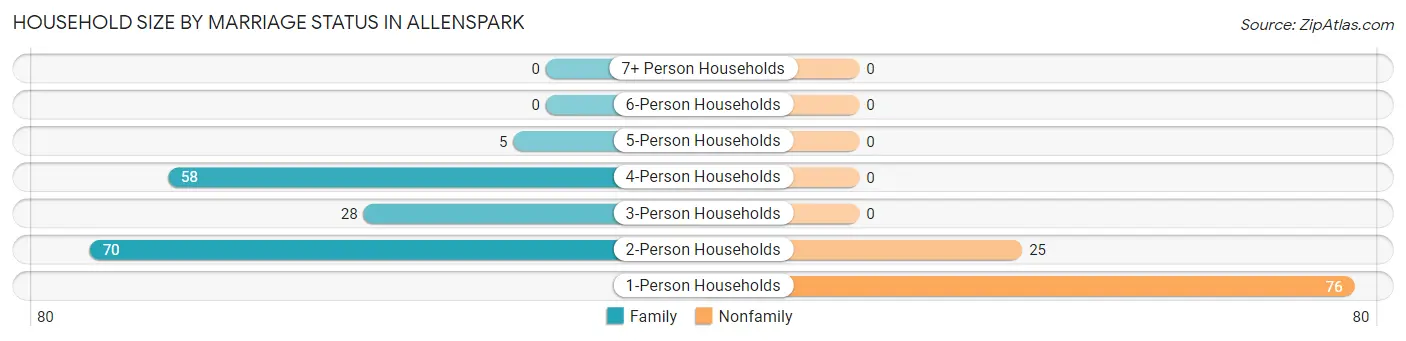
| Household Size | Family Households | Nonfamily Households |
| 1-Person Households | - | 76 (29.0%) |
| 2-Person Households | 70 (26.7%) | 25 (9.5%) |
| 3-Person Households | 28 (10.7%) | 0 (0.0%) |
| 4-Person Households | 58 (22.1%) | 0 (0.0%) |
| 5-Person Households | 5 (1.9%) | 0 (0.0%) |
| 6-Person Households | 0 (0.0%) | 0 (0.0%) |
| 7+ Person Households | 0 (0.0%) | 0 (0.0%) |
| Total | 161 (61.5%) | 101 (38.6%) |
Female Fertility in Allenspark
Fertility by Age in Allenspark
| Age Bracket | Women with Births | Births / 1,000 Women |
| 15 to 19 years | 0 (0.0%) | 0.0 |
| 20 to 34 years | 0 (0.0%) | 0.0 |
| 35 to 50 years | 0 (0.0%) | 0.0 |
| Total | 0 (0.0%) | 0.0 |
Fertility by Age by Marriage Status in Allenspark
| Age Bracket | Married | Unmarried |
| 15 to 19 years | 0 (0.0%) | 0 (0.0%) |
| 20 to 34 years | 0 (0.0%) | 0 (0.0%) |
| 35 to 50 years | 0 (0.0%) | 0 (0.0%) |
| Total | 0 (0.0%) | 0 (0.0%) |
Fertility by Education in Allenspark
| Educational Attainment | Women with Births | Births / 1,000 Women |
| Less than High School | 0 (0.0%) | 0.0 |
| High School Diploma | 0 (0.0%) | 0.0 |
| College or Associate's Degree | 0 (0.0%) | 0.0 |
| Bachelor's Degree | 0 (0.0%) | 0.0 |
| Graduate Degree | 0 (0.0%) | 0.0 |
| Total | 0 (0.0%) | 0.0 |
Fertility by Education by Marriage Status in Allenspark
| Educational Attainment | Married | Unmarried |
| Less than High School | 0 (0.0%) | 0 (0.0%) |
| High School Diploma | 0 (0.0%) | 0 (0.0%) |
| College or Associate's Degree | 0 (0.0%) | 0 (0.0%) |
| Bachelor's Degree | 0 (0.0%) | 0 (0.0%) |
| Graduate Degree | 0 (0.0%) | 0 (0.0%) |
| Total | 0 (0.0%) | 0 (0.0%) |
Employment Characteristics in Allenspark
Employment by Class of Employer in Allenspark
Among the 358 employed individuals in Allenspark, private company employees (191 | 53.3%), local government employees (63 | 17.6%), and not-for-profit organizations (39 | 10.9%) make up the most common classes of employment.
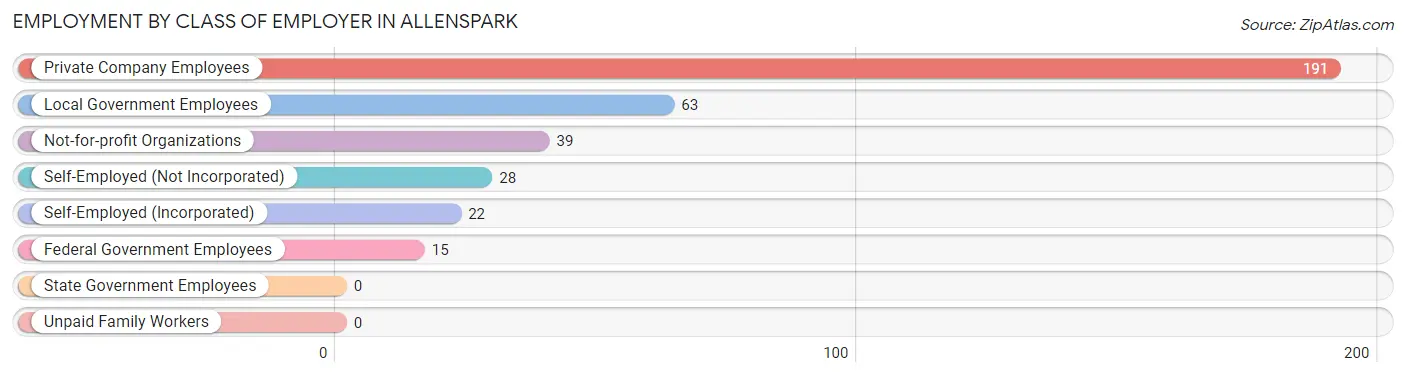
| Employer Class | # Employees | % Employees |
| Private Company Employees | 191 | 53.3% |
| Self-Employed (Incorporated) | 22 | 6.1% |
| Self-Employed (Not Incorporated) | 28 | 7.8% |
| Not-for-profit Organizations | 39 | 10.9% |
| Local Government Employees | 63 | 17.6% |
| State Government Employees | 0 | 0.0% |
| Federal Government Employees | 15 | 4.2% |
| Unpaid Family Workers | 0 | 0.0% |
| Total | 358 | 100.0% |
Employment Status by Age in Allenspark
According to the labor force statistics for Allenspark, out of the total population over 16 years of age (554), 69.5% or 385 individuals are in the labor force, with 3.6% or 14 of them unemployed. The age group with the highest labor force participation rate is 30 to 34 years, with 100.0% or 29 individuals in the labor force. Within the labor force, the 25 to 29 years age range has the highest percentage of unemployed individuals, with 46.7% or 14 of them being unemployed.
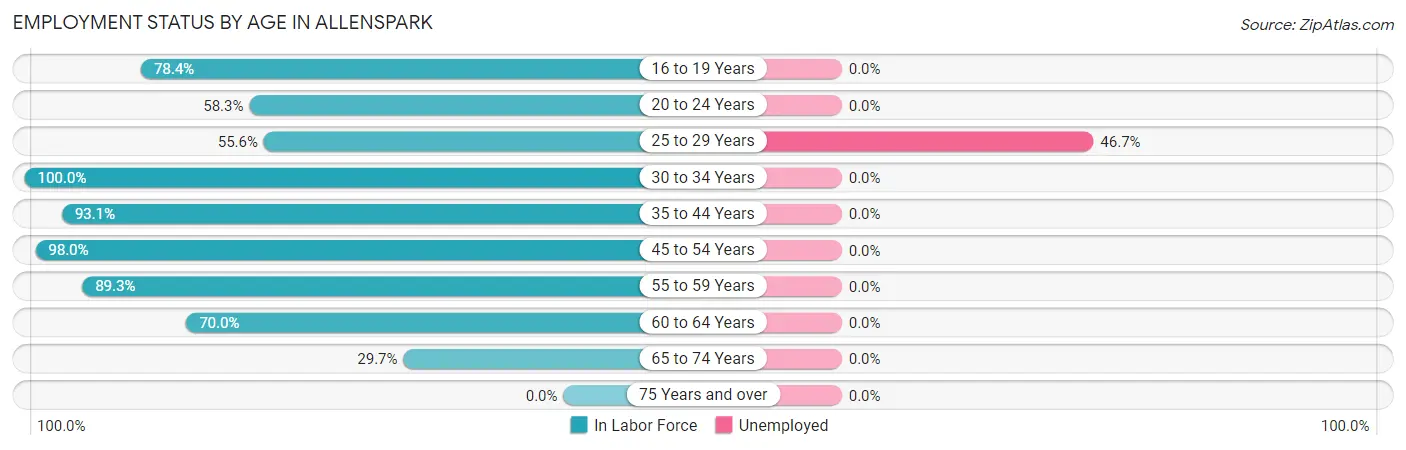
| Age Bracket | In Labor Force | Unemployed |
| 16 to 19 Years | 29 (78.4%) | 0 (0.0%) |
| 20 to 24 Years | 7 (58.3%) | 0 (0.0%) |
| 25 to 29 Years | 30 (55.6%) | 14 (46.7%) |
| 30 to 34 Years | 29 (100.0%) | 0 (0.0%) |
| 35 to 44 Years | 27 (93.1%) | 0 (0.0%) |
| 45 to 54 Years | 149 (98.0%) | 0 (0.0%) |
| 55 to 59 Years | 50 (89.3%) | 0 (0.0%) |
| 60 to 64 Years | 42 (70.0%) | 0 (0.0%) |
| 65 to 74 Years | 22 (29.7%) | 0 (0.0%) |
| 75 Years and over | 0 (0.0%) | 0 (0.0%) |
| Total | 385 (69.5%) | 14 (3.6%) |
Employment Status by Educational Attainment in Allenspark
According to labor force statistics for Allenspark, 86.1% of individuals (327) out of the total population between 25 and 64 years of age (380) are in the labor force, with 4.3% or 14 of them being unemployed. The group with the highest labor force participation rate are those with the educational attainment of high school diploma, with 92.5% or 37 individuals in the labor force. Within the labor force, individuals with college / associate degree education have the highest percentage of unemployment, with 26.4% or 14 of them being unemployed.
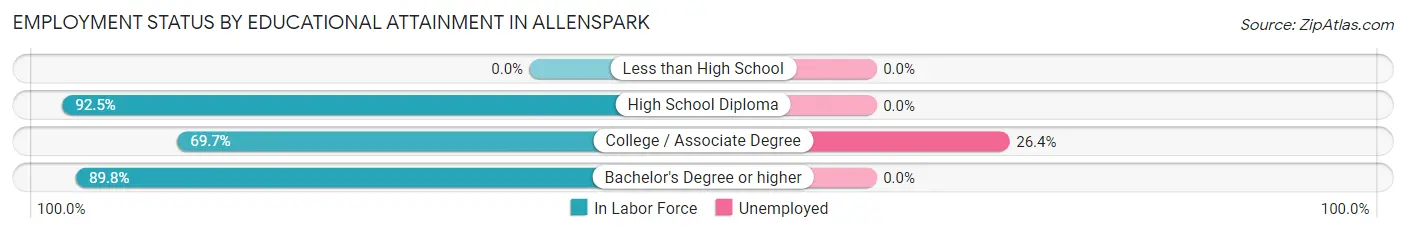
| Educational Attainment | In Labor Force | Unemployed |
| Less than High School | 0 (0.0%) | 0 (0.0%) |
| High School Diploma | 37 (92.5%) | 0 (0.0%) |
| College / Associate Degree | 53 (69.7%) | 20 (26.4%) |
| Bachelor's Degree or higher | 237 (89.8%) | 0 (0.0%) |
| Total | 327 (86.1%) | 16 (4.3%) |
Employment Occupations by Sex in Allenspark
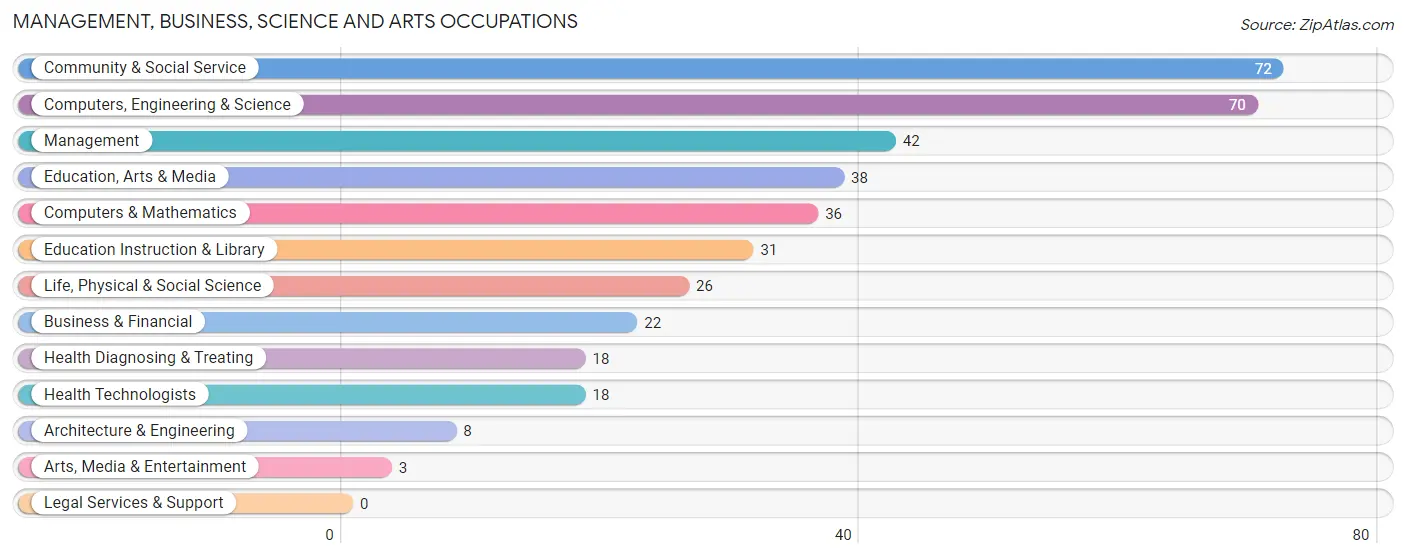
Management, Business, Science and Arts Occupations
The most common Management, Business, Science and Arts occupations in Allenspark are Community & Social Service (72 | 19.4%), Computers, Engineering & Science (70 | 18.9%), Management (42 | 11.3%), Education, Arts & Media (38 | 10.2%), and Computers & Mathematics (36 | 9.7%).
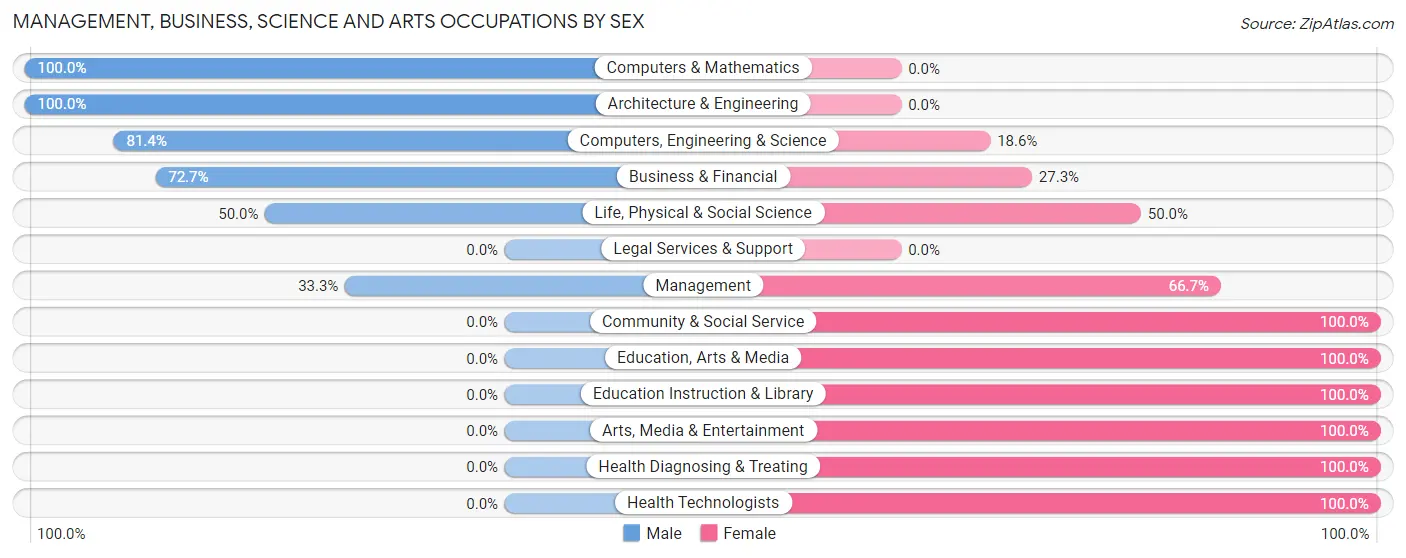
Management, Business, Science and Arts Occupations by Sex
Within the Management, Business, Science and Arts occupations in Allenspark, the most male-oriented occupations are Computers & Mathematics (100.0%), Architecture & Engineering (100.0%), and Computers, Engineering & Science (81.4%), while the most female-oriented occupations are Community & Social Service (100.0%), Education, Arts & Media (100.0%), and Education Instruction & Library (100.0%).
| Occupation | Male | Female |
| Management | 14 (33.3%) | 28 (66.7%) |
| Business & Financial | 16 (72.7%) | 6 (27.3%) |
| Computers, Engineering & Science | 57 (81.4%) | 13 (18.6%) |
| Computers & Mathematics | 36 (100.0%) | 0 (0.0%) |
| Architecture & Engineering | 8 (100.0%) | 0 (0.0%) |
| Life, Physical & Social Science | 13 (50.0%) | 13 (50.0%) |
| Community & Social Service | 0 (0.0%) | 72 (100.0%) |
| Education, Arts & Media | 0 (0.0%) | 38 (100.0%) |
| Legal Services & Support | 0 (0.0%) | 0 (0.0%) |
| Education Instruction & Library | 0 (0.0%) | 31 (100.0%) |
| Arts, Media & Entertainment | 0 (0.0%) | 3 (100.0%) |
| Health Diagnosing & Treating | 0 (0.0%) | 18 (100.0%) |
| Health Technologists | 0 (0.0%) | 18 (100.0%) |
| Total (Category) | 87 (38.8%) | 137 (61.2%) |
| Total (Overall) | 187 (50.4%) | 184 (49.6%) |
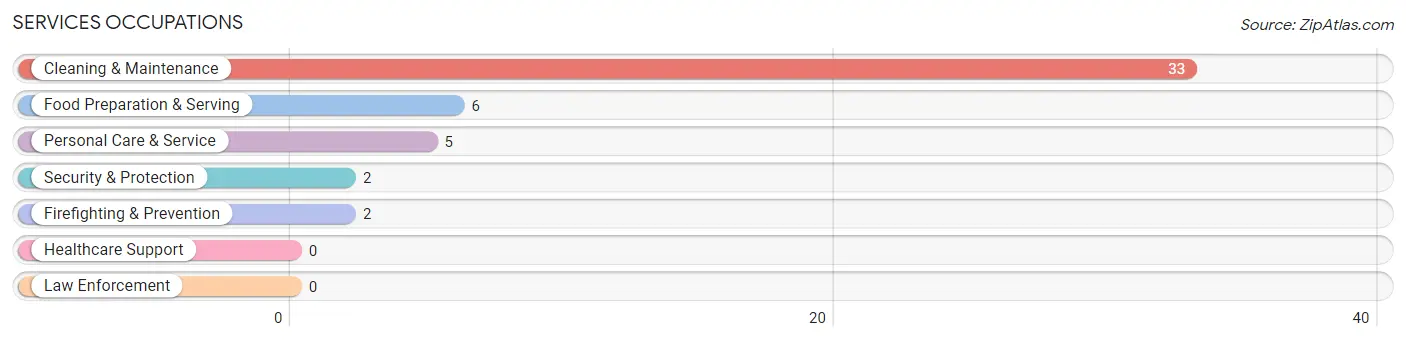
Services Occupations
The most common Services occupations in Allenspark are Cleaning & Maintenance (33 | 8.9%), Food Preparation & Serving (6 | 1.6%), Personal Care & Service (5 | 1.3%), Security & Protection (2 | 0.5%), and Firefighting & Prevention (2 | 0.5%).
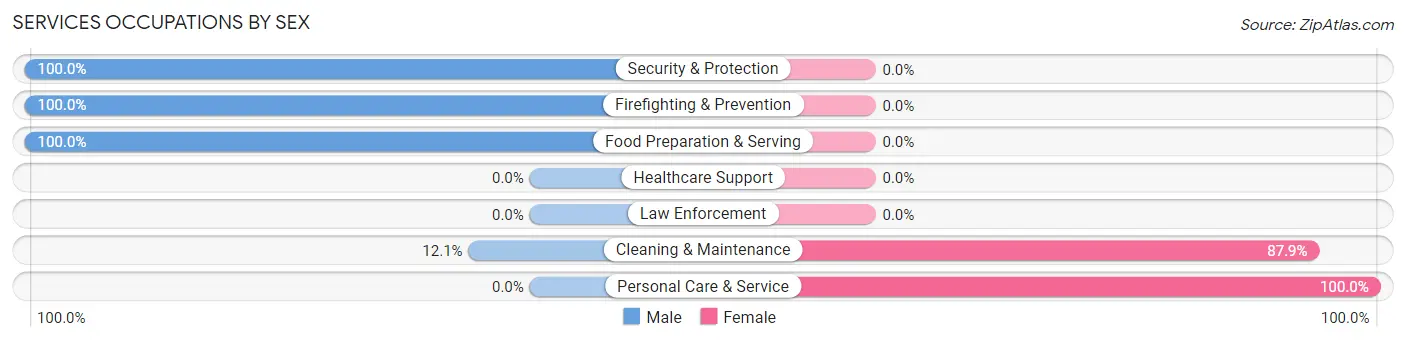
Services Occupations by Sex
Within the Services occupations in Allenspark, the most male-oriented occupations are Security & Protection (100.0%), Firefighting & Prevention (100.0%), and Food Preparation & Serving (100.0%), while the most female-oriented occupations are Personal Care & Service (100.0%), and Cleaning & Maintenance (87.9%).
| Occupation | Male | Female |
| Healthcare Support | 0 (0.0%) | 0 (0.0%) |
| Security & Protection | 2 (100.0%) | 0 (0.0%) |
| Firefighting & Prevention | 2 (100.0%) | 0 (0.0%) |
| Law Enforcement | 0 (0.0%) | 0 (0.0%) |
| Food Preparation & Serving | 6 (100.0%) | 0 (0.0%) |
| Cleaning & Maintenance | 4 (12.1%) | 29 (87.9%) |
| Personal Care & Service | 0 (0.0%) | 5 (100.0%) |
| Total (Category) | 12 (26.1%) | 34 (73.9%) |
| Total (Overall) | 187 (50.4%) | 184 (49.6%) |
Sales and Office Occupations
The most common Sales and Office occupations in Allenspark are Office & Administration (28 | 7.5%), and Sales & Related (7 | 1.9%).
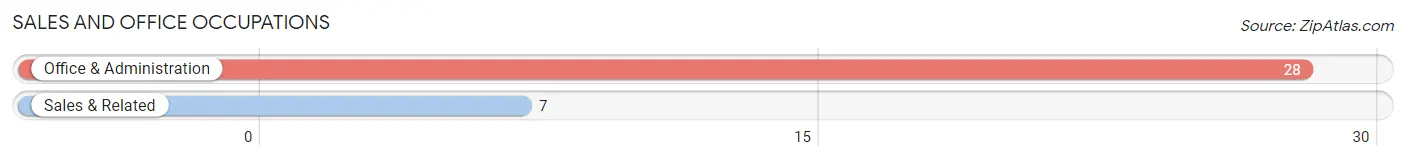
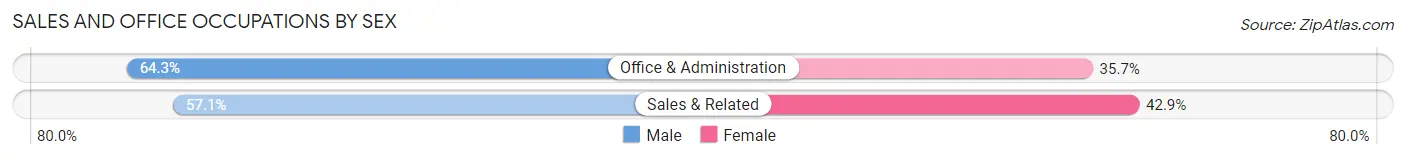
Sales and Office Occupations by Sex
| Occupation | Male | Female |
| Sales & Related | 4 (57.1%) | 3 (42.9%) |
| Office & Administration | 18 (64.3%) | 10 (35.7%) |
| Total (Category) | 22 (62.9%) | 13 (37.1%) |
| Total (Overall) | 187 (50.4%) | 184 (49.6%) |
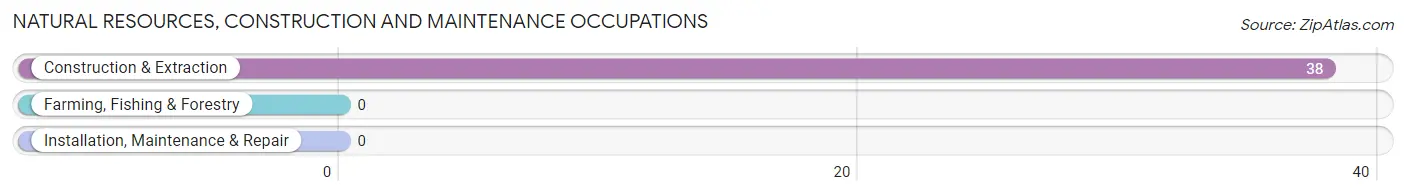
Natural Resources, Construction and Maintenance Occupations
The most common Natural Resources, Construction and Maintenance occupations in Allenspark are , and Construction & Extraction (38 | 10.2%).
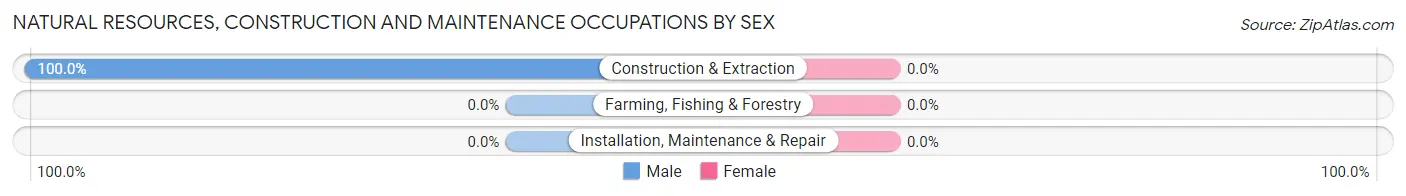
Natural Resources, Construction and Maintenance Occupations by Sex
| Occupation | Male | Female |
| Farming, Fishing & Forestry | 0 (0.0%) | 0 (0.0%) |
| Construction & Extraction | 38 (100.0%) | 0 (0.0%) |
| Installation, Maintenance & Repair | 0 (0.0%) | 0 (0.0%) |
| Total (Category) | 38 (100.0%) | 0 (0.0%) |
| Total (Overall) | 187 (50.4%) | 184 (49.6%) |
Production, Transportation and Moving Occupations
The most common Production, Transportation and Moving occupations in Allenspark are , and Transportation (28 | 7.5%).
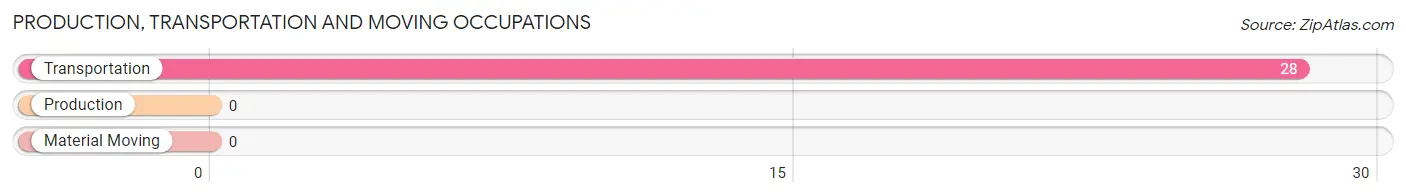
Production, Transportation and Moving Occupations by Sex
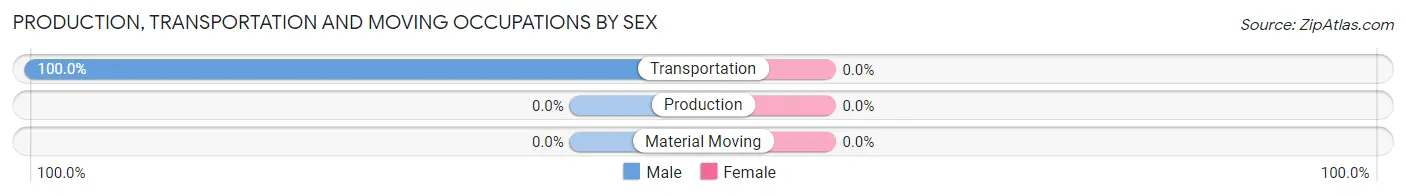
| Occupation | Male | Female |
| Production | 0 (0.0%) | 0 (0.0%) |
| Transportation | 28 (100.0%) | 0 (0.0%) |
| Material Moving | 0 (0.0%) | 0 (0.0%) |
| Total (Category) | 28 (100.0%) | 0 (0.0%) |
| Total (Overall) | 187 (50.4%) | 184 (49.6%) |
Employment Industries by Sex in Allenspark
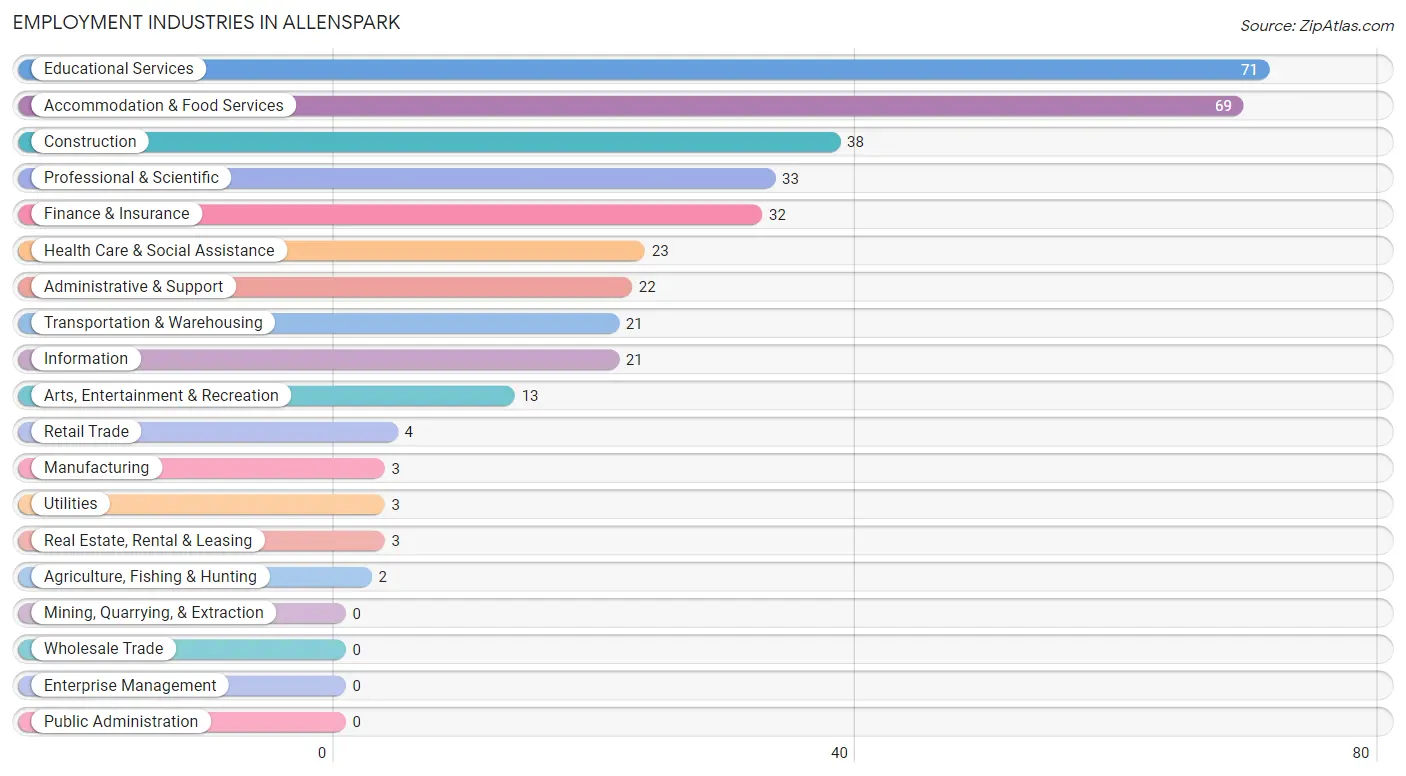
Employment Industries in Allenspark
The major employment industries in Allenspark include Educational Services (71 | 19.1%), Accommodation & Food Services (69 | 18.6%), Construction (38 | 10.2%), Professional & Scientific (33 | 8.9%), and Finance & Insurance (32 | 8.6%).
Employment Industries by Sex in Allenspark
The Allenspark industries that see more men than women are Agriculture, Fishing & Hunting (100.0%), Construction (100.0%), and Manufacturing (100.0%), whereas the industries that tend to have a higher number of women are Utilities (100.0%), Real Estate, Rental & Leasing (100.0%), and Health Care & Social Assistance (100.0%).
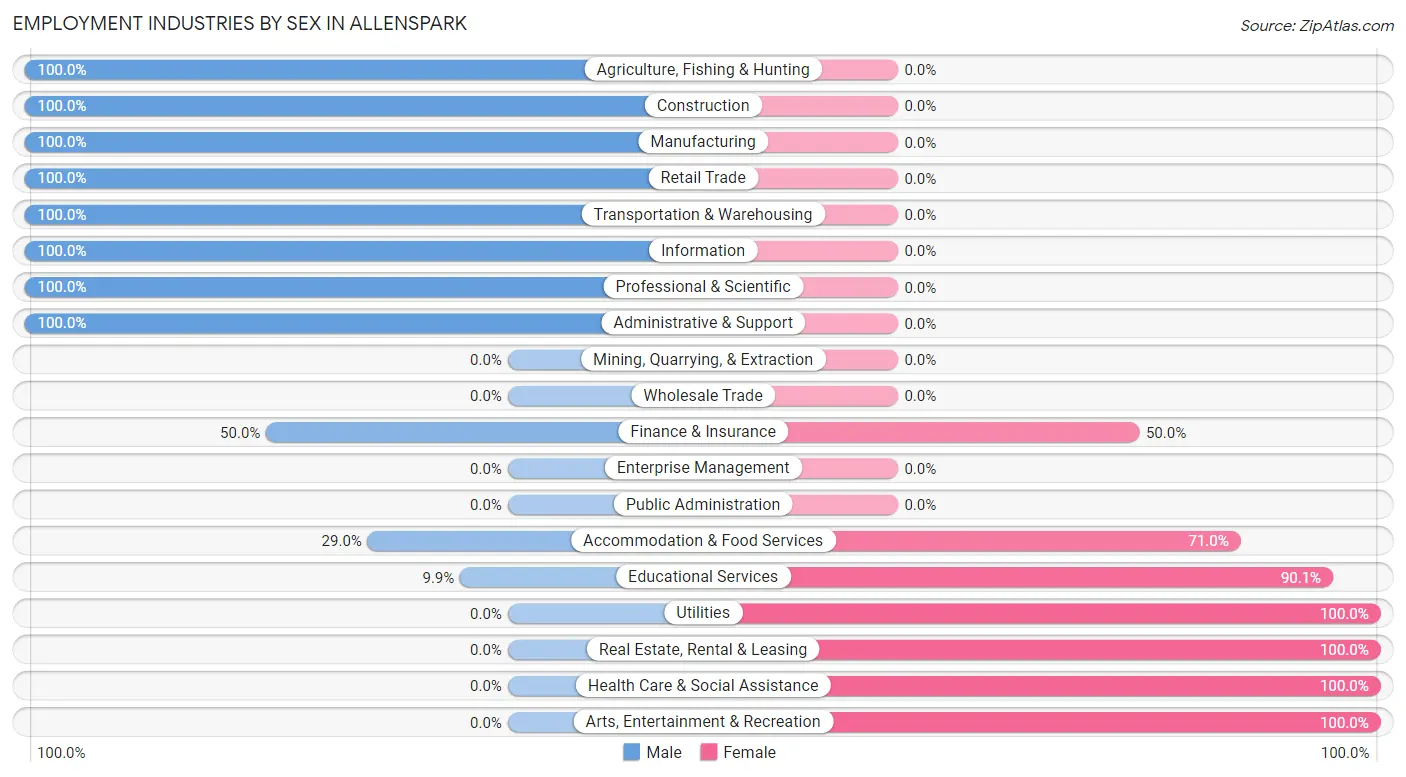
| Industry | Male | Female |
| Agriculture, Fishing & Hunting | 2 (100.0%) | 0 (0.0%) |
| Mining, Quarrying, & Extraction | 0 (0.0%) | 0 (0.0%) |
| Construction | 38 (100.0%) | 0 (0.0%) |
| Manufacturing | 3 (100.0%) | 0 (0.0%) |
| Wholesale Trade | 0 (0.0%) | 0 (0.0%) |
| Retail Trade | 4 (100.0%) | 0 (0.0%) |
| Transportation & Warehousing | 21 (100.0%) | 0 (0.0%) |
| Utilities | 0 (0.0%) | 3 (100.0%) |
| Information | 21 (100.0%) | 0 (0.0%) |
| Finance & Insurance | 16 (50.0%) | 16 (50.0%) |
| Real Estate, Rental & Leasing | 0 (0.0%) | 3 (100.0%) |
| Professional & Scientific | 33 (100.0%) | 0 (0.0%) |
| Enterprise Management | 0 (0.0%) | 0 (0.0%) |
| Administrative & Support | 22 (100.0%) | 0 (0.0%) |
| Educational Services | 7 (9.9%) | 64 (90.1%) |
| Health Care & Social Assistance | 0 (0.0%) | 23 (100.0%) |
| Arts, Entertainment & Recreation | 0 (0.0%) | 13 (100.0%) |
| Accommodation & Food Services | 20 (29.0%) | 49 (71.0%) |
| Public Administration | 0 (0.0%) | 0 (0.0%) |
| Total | 187 (50.4%) | 184 (49.6%) |
Education in Allenspark
School Enrollment in Allenspark
The most common levels of schooling among the 139 students in Allenspark are middle school (46 | 33.1%), high school (37 | 26.6%), and college / undergraduate (36 | 25.9%).
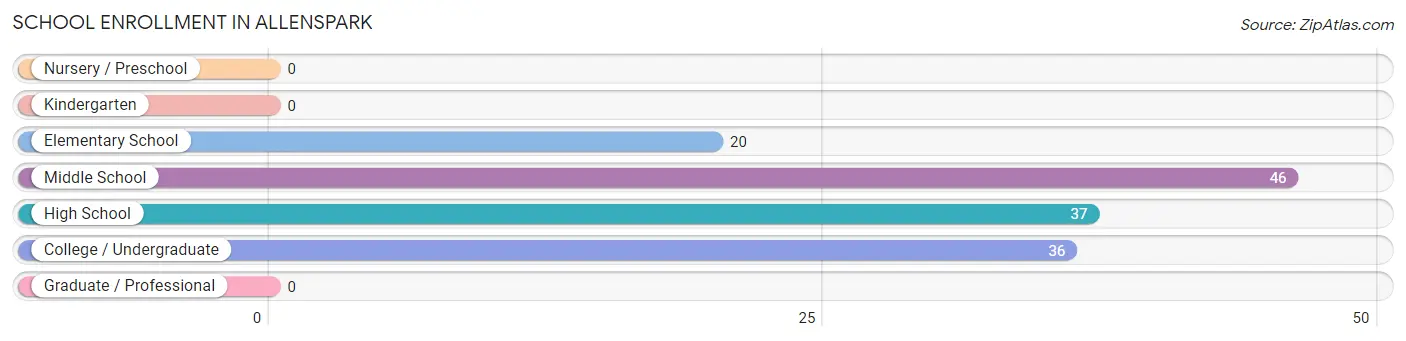
| School Level | # Students | % Students |
| Nursery / Preschool | 0 | 0.0% |
| Kindergarten | 0 | 0.0% |
| Elementary School | 20 | 14.4% |
| Middle School | 46 | 33.1% |
| High School | 37 | 26.6% |
| College / Undergraduate | 36 | 25.9% |
| Graduate / Professional | 0 | 0.0% |
| Total | 139 | 100.0% |
School Enrollment by Age by Funding Source in Allenspark
Out of a total of 139 students who are enrolled in schools in Allenspark, 8 (5.8%) attend a private institution, while the remaining 131 (94.2%) are enrolled in public schools. The age group of 10 to 14 year olds has the highest likelihood of being enrolled in private schools, with 6 (13.0% in the age bracket) enrolled. Conversely, the age group of 5 to 9 year old has the lowest likelihood of being enrolled in a private school, with 20 (100.0% in the age bracket) attending a public institution.
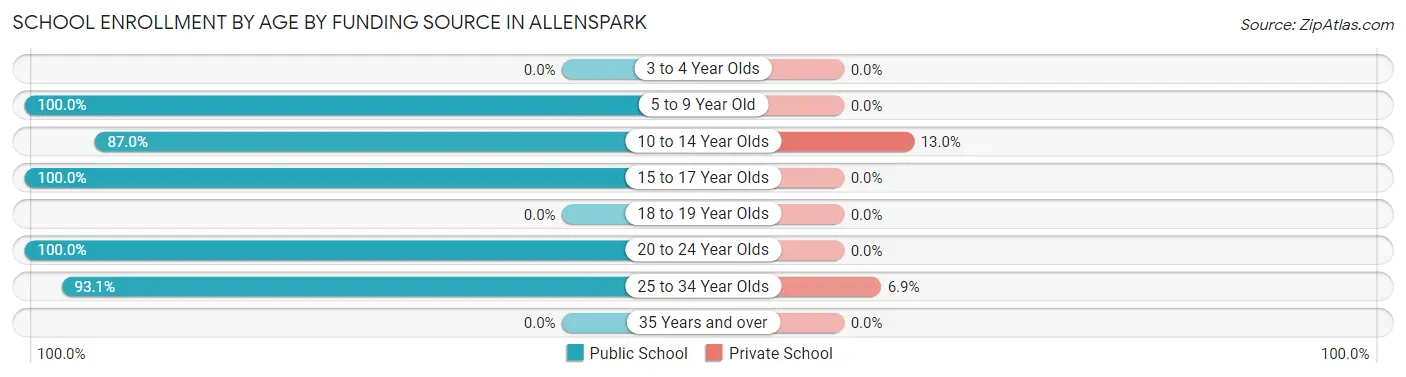
| Age Bracket | Public School | Private School |
| 3 to 4 Year Olds | 0 (0.0%) | 0 (0.0%) |
| 5 to 9 Year Old | 20 (100.0%) | 0 (0.0%) |
| 10 to 14 Year Olds | 40 (87.0%) | 6 (13.0%) |
| 15 to 17 Year Olds | 37 (100.0%) | 0 (0.0%) |
| 18 to 19 Year Olds | 0 (0.0%) | 0 (0.0%) |
| 20 to 24 Year Olds | 7 (100.0%) | 0 (0.0%) |
| 25 to 34 Year Olds | 27 (93.1%) | 2 (6.9%) |
| 35 Years and over | 0 (0.0%) | 0 (0.0%) |
| Total | 131 (94.2%) | 8 (5.8%) |
Educational Attainment by Field of Study in Allenspark
Business (93 | 26.4%), communications (77 | 21.9%), science & technology (39 | 11.1%), bio, nature & agricultural (36 | 10.2%), and physical & health sciences (25 | 7.1%) are the most common fields of study among 352 individuals in Allenspark who have obtained a bachelor's degree or higher.
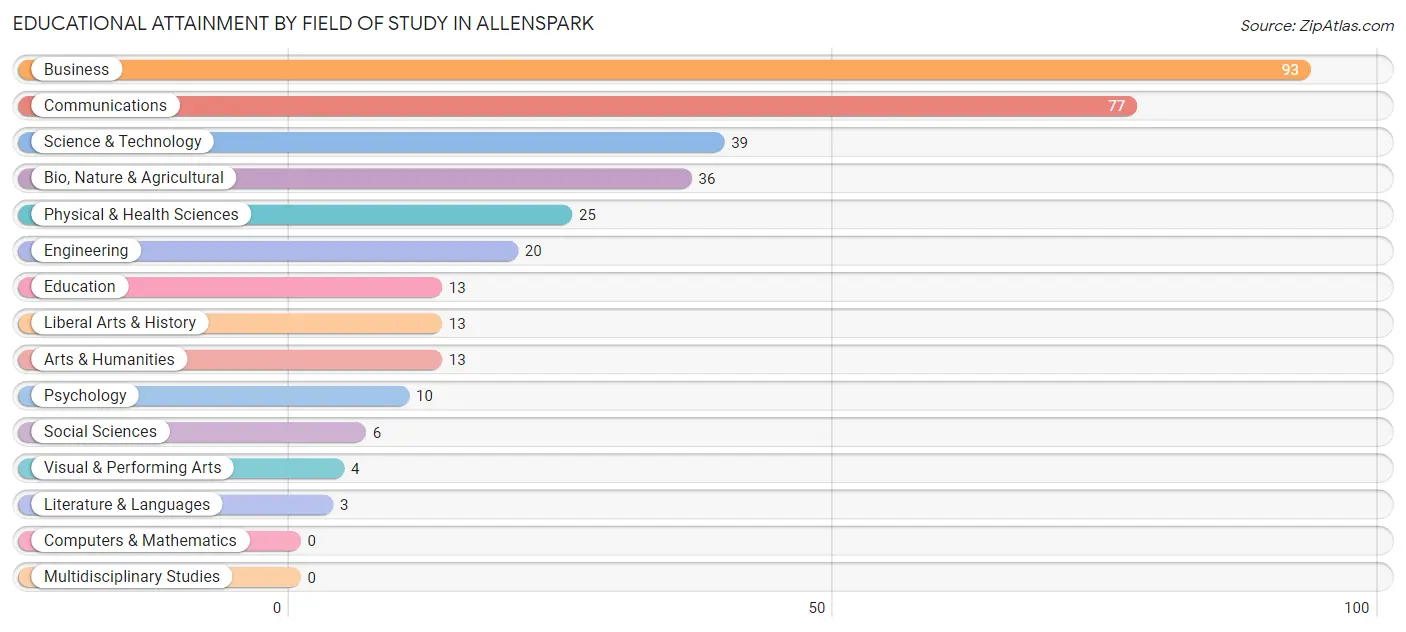
| Field of Study | # Graduates | % Graduates |
| Computers & Mathematics | 0 | 0.0% |
| Bio, Nature & Agricultural | 36 | 10.2% |
| Physical & Health Sciences | 25 | 7.1% |
| Psychology | 10 | 2.8% |
| Social Sciences | 6 | 1.7% |
| Engineering | 20 | 5.7% |
| Multidisciplinary Studies | 0 | 0.0% |
| Science & Technology | 39 | 11.1% |
| Business | 93 | 26.4% |
| Education | 13 | 3.7% |
| Literature & Languages | 3 | 0.9% |
| Liberal Arts & History | 13 | 3.7% |
| Visual & Performing Arts | 4 | 1.1% |
| Communications | 77 | 21.9% |
| Arts & Humanities | 13 | 3.7% |
| Total | 352 | 100.0% |
Transportation & Commute in Allenspark
Vehicle Availability by Sex in Allenspark
The most prevalent vehicle ownership categories in Allenspark are males with 3 vehicles (112, accounting for 65.1%) and females with 3 vehicles (135, making up 60.9%).
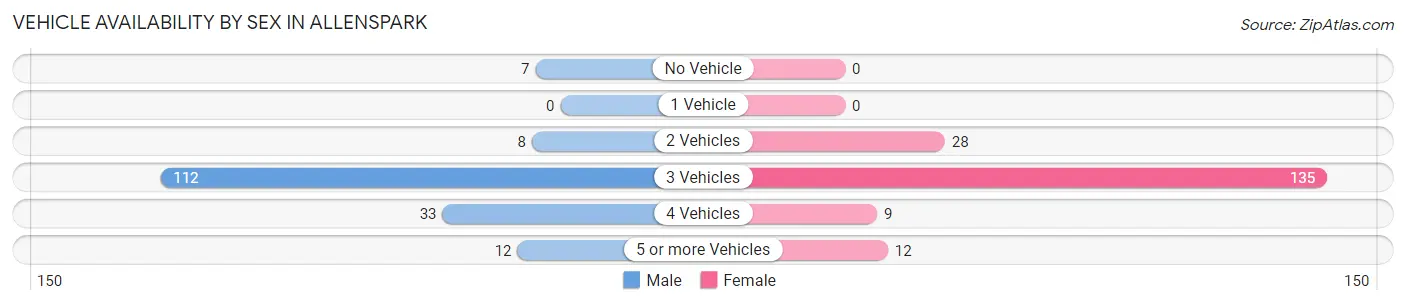
| Vehicles Available | Male | Female |
| No Vehicle | 7 (4.1%) | 0 (0.0%) |
| 1 Vehicle | 0 (0.0%) | 0 (0.0%) |
| 2 Vehicles | 8 (4.6%) | 28 (15.2%) |
| 3 Vehicles | 112 (65.1%) | 135 (73.4%) |
| 4 Vehicles | 33 (19.2%) | 9 (4.9%) |
| 5 or more Vehicles | 12 (7.0%) | 12 (6.5%) |
| Total | 172 (100.0%) | 184 (100.0%) |
Commute Time in Allenspark
The most frequently occuring commute durations in Allenspark are 30 to 34 minutes (74 commuters, 26.1%), 25 to 29 minutes (55 commuters, 19.4%), and 20 to 24 minutes (41 commuters, 14.4%).
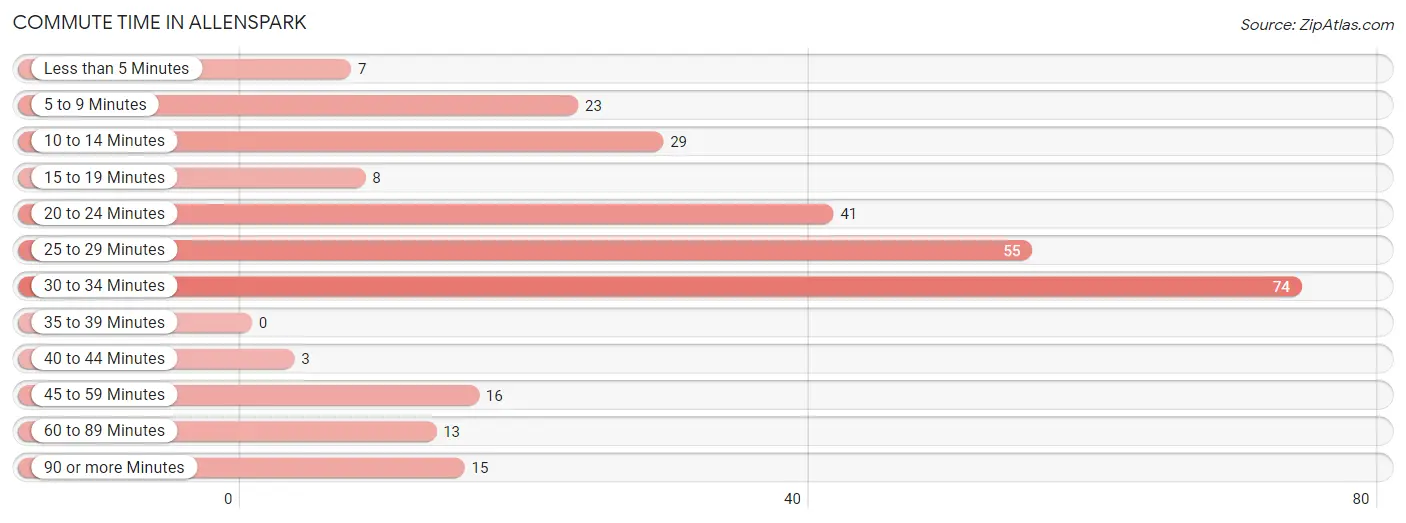
| Commute Time | # Commuters | % Commuters |
| Less than 5 Minutes | 7 | 2.5% |
| 5 to 9 Minutes | 23 | 8.1% |
| 10 to 14 Minutes | 29 | 10.2% |
| 15 to 19 Minutes | 8 | 2.8% |
| 20 to 24 Minutes | 41 | 14.4% |
| 25 to 29 Minutes | 55 | 19.4% |
| 30 to 34 Minutes | 74 | 26.1% |
| 35 to 39 Minutes | 0 | 0.0% |
| 40 to 44 Minutes | 3 | 1.1% |
| 45 to 59 Minutes | 16 | 5.6% |
| 60 to 89 Minutes | 13 | 4.6% |
| 90 or more Minutes | 15 | 5.3% |
Commute Time by Sex in Allenspark
The most common commute times in Allenspark are 25 to 29 minutes (55 commuters, 41.3%) for males and 30 to 34 minutes (59 commuters, 39.1%) for females.
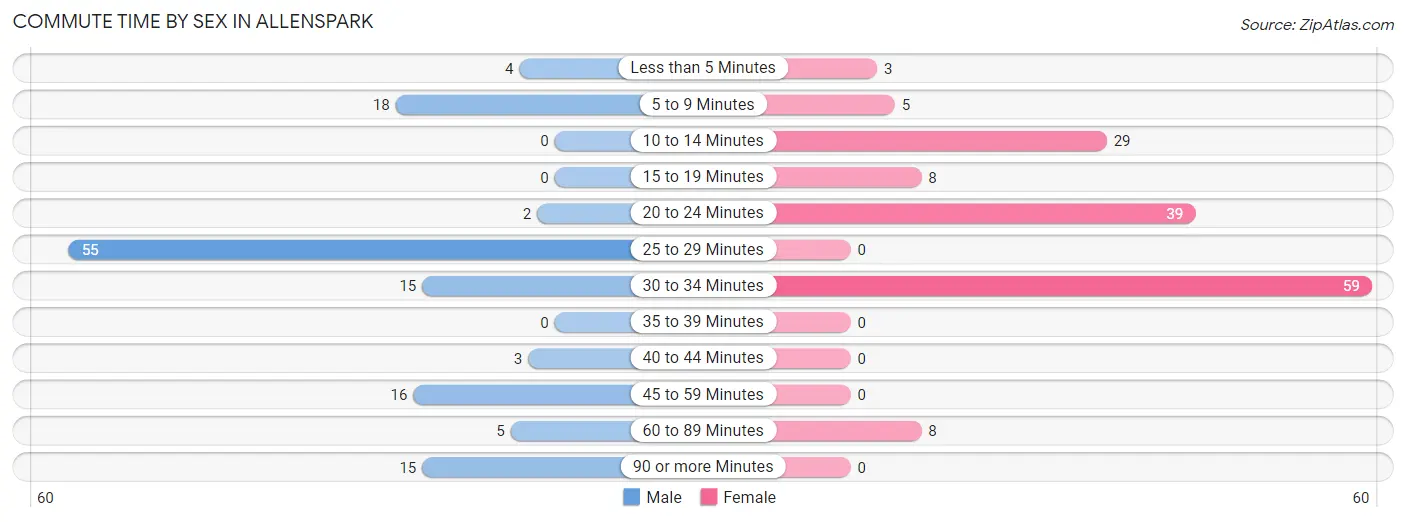
| Commute Time | Male | Female |
| Less than 5 Minutes | 4 (3.0%) | 3 (2.0%) |
| 5 to 9 Minutes | 18 (13.5%) | 5 (3.3%) |
| 10 to 14 Minutes | 0 (0.0%) | 29 (19.2%) |
| 15 to 19 Minutes | 0 (0.0%) | 8 (5.3%) |
| 20 to 24 Minutes | 2 (1.5%) | 39 (25.8%) |
| 25 to 29 Minutes | 55 (41.3%) | 0 (0.0%) |
| 30 to 34 Minutes | 15 (11.3%) | 59 (39.1%) |
| 35 to 39 Minutes | 0 (0.0%) | 0 (0.0%) |
| 40 to 44 Minutes | 3 (2.3%) | 0 (0.0%) |
| 45 to 59 Minutes | 16 (12.0%) | 0 (0.0%) |
| 60 to 89 Minutes | 5 (3.8%) | 8 (5.3%) |
| 90 or more Minutes | 15 (11.3%) | 0 (0.0%) |
Time of Departure to Work by Sex in Allenspark
The most frequent times of departure to work in Allenspark are 7:30 AM to 7:59 AM (37, 27.8%) for males and 7:00 AM to 7:29 AM (37, 24.5%) for females.
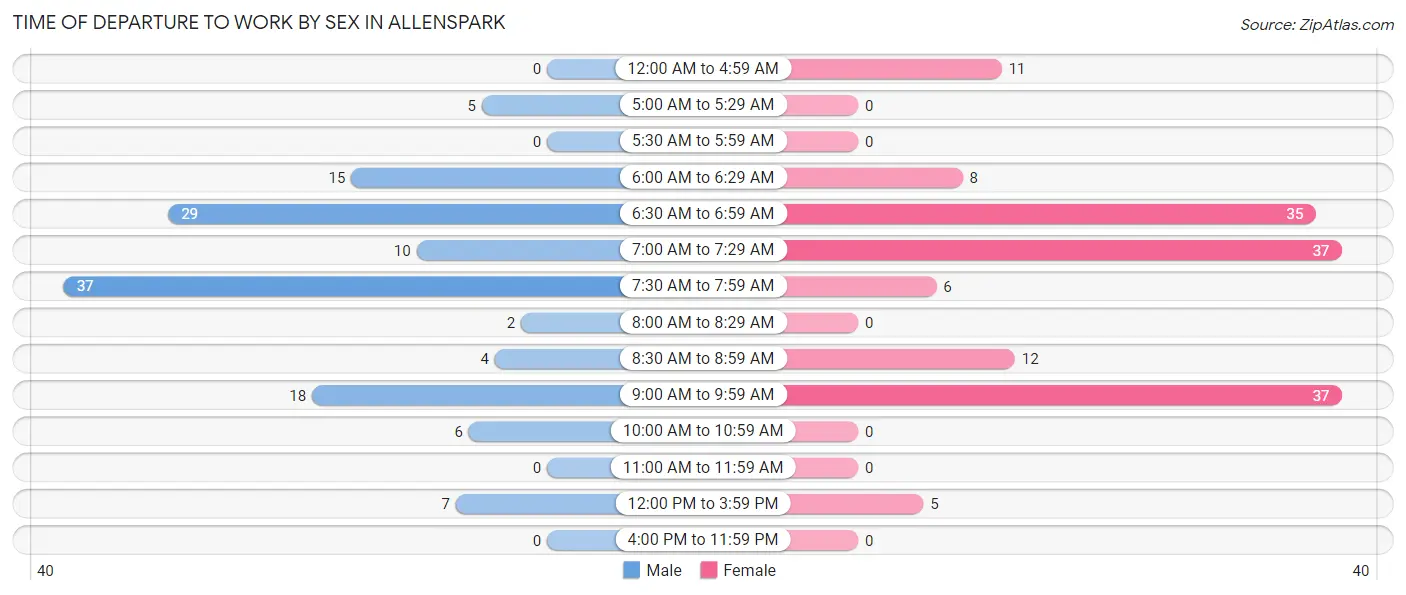
| Time of Departure | Male | Female |
| 12:00 AM to 4:59 AM | 0 (0.0%) | 11 (7.3%) |
| 5:00 AM to 5:29 AM | 5 (3.8%) | 0 (0.0%) |
| 5:30 AM to 5:59 AM | 0 (0.0%) | 0 (0.0%) |
| 6:00 AM to 6:29 AM | 15 (11.3%) | 8 (5.3%) |
| 6:30 AM to 6:59 AM | 29 (21.8%) | 35 (23.2%) |
| 7:00 AM to 7:29 AM | 10 (7.5%) | 37 (24.5%) |
| 7:30 AM to 7:59 AM | 37 (27.8%) | 6 (4.0%) |
| 8:00 AM to 8:29 AM | 2 (1.5%) | 0 (0.0%) |
| 8:30 AM to 8:59 AM | 4 (3.0%) | 12 (8.0%) |
| 9:00 AM to 9:59 AM | 18 (13.5%) | 37 (24.5%) |
| 10:00 AM to 10:59 AM | 6 (4.5%) | 0 (0.0%) |
| 11:00 AM to 11:59 AM | 0 (0.0%) | 0 (0.0%) |
| 12:00 PM to 3:59 PM | 7 (5.3%) | 5 (3.3%) |
| 4:00 PM to 11:59 PM | 0 (0.0%) | 0 (0.0%) |
| Total | 133 (100.0%) | 151 (100.0%) |
Housing Occupancy in Allenspark
Occupancy by Ownership in Allenspark
Of the total 262 dwellings in Allenspark, owner-occupied units account for 210 (80.1%), while renter-occupied units make up 52 (19.9%).
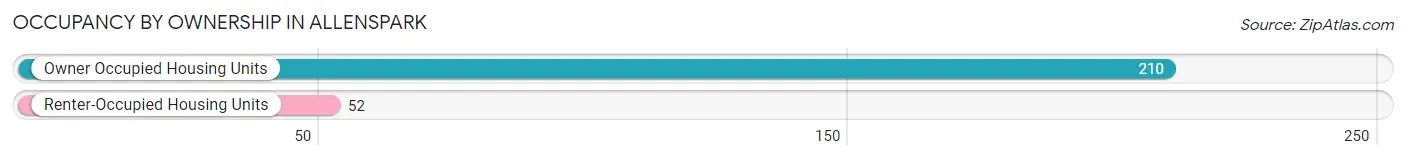
| Occupancy | # Housing Units | % Housing Units |
| Owner Occupied Housing Units | 210 | 80.1% |
| Renter-Occupied Housing Units | 52 | 19.9% |
| Total Occupied Housing Units | 262 | 100.0% |
Occupancy by Household Size in Allenspark
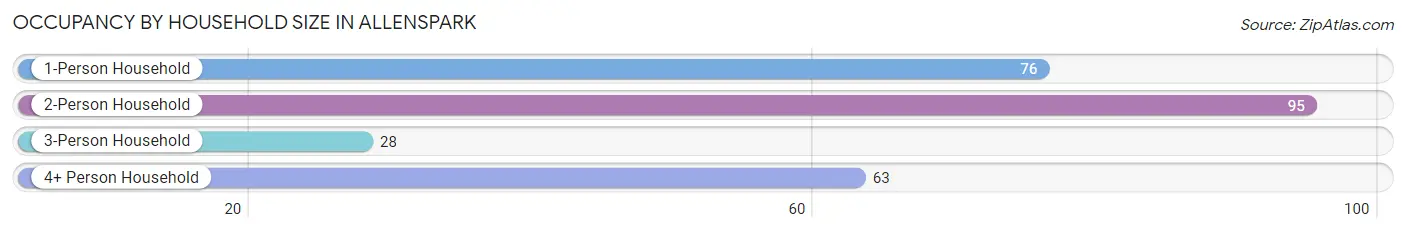
| Household Size | # Housing Units | % Housing Units |
| 1-Person Household | 76 | 29.0% |
| 2-Person Household | 95 | 36.3% |
| 3-Person Household | 28 | 10.7% |
| 4+ Person Household | 63 | 24.0% |
| Total Housing Units | 262 | 100.0% |
Occupancy by Ownership by Household Size in Allenspark
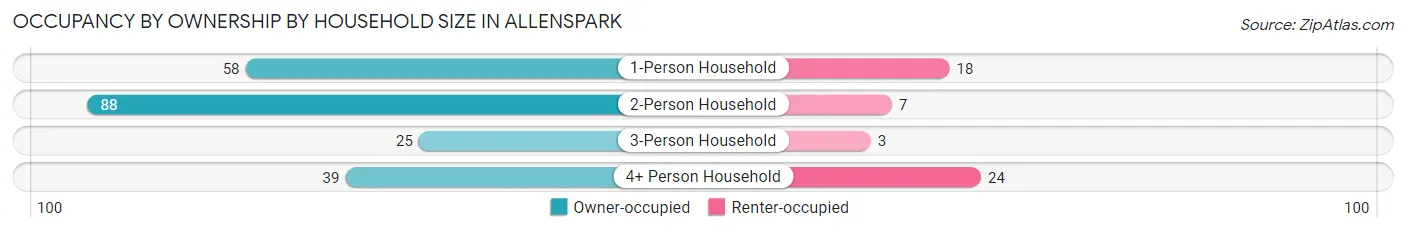
| Household Size | Owner-occupied | Renter-occupied |
| 1-Person Household | 58 (76.3%) | 18 (23.7%) |
| 2-Person Household | 88 (92.6%) | 7 (7.4%) |
| 3-Person Household | 25 (89.3%) | 3 (10.7%) |
| 4+ Person Household | 39 (61.9%) | 24 (38.1%) |
| Total Housing Units | 210 (80.1%) | 52 (19.9%) |
Occupancy by Educational Attainment in Allenspark
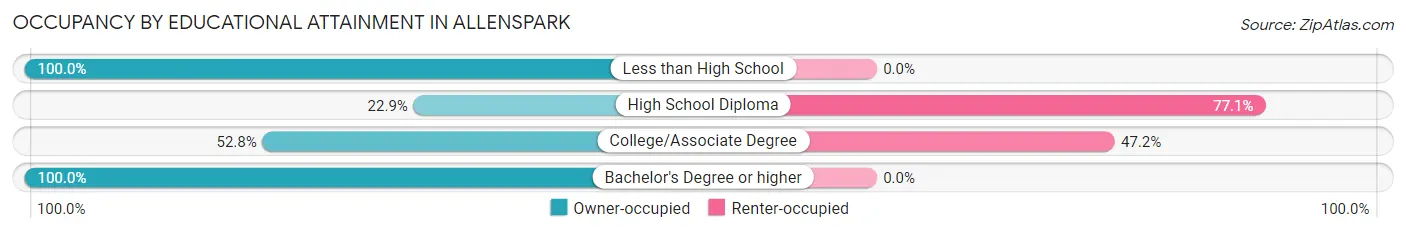
| Household Size | Owner-occupied | Renter-occupied |
| Less than High School | 10 (100.0%) | 0 (0.0%) |
| High School Diploma | 8 (22.9%) | 27 (77.1%) |
| College/Associate Degree | 28 (52.8%) | 25 (47.2%) |
| Bachelor's Degree or higher | 164 (100.0%) | 0 (0.0%) |
Occupancy by Age of Householder in Allenspark
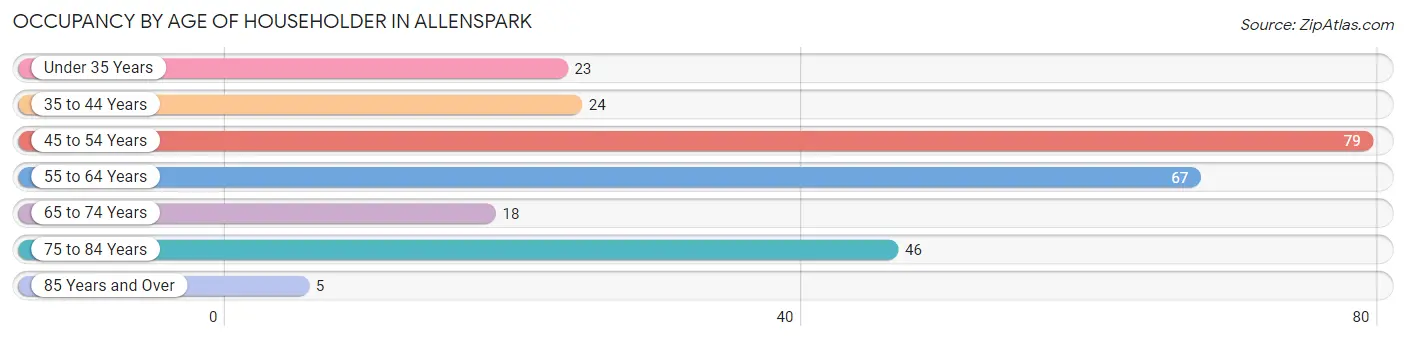
| Age Bracket | # Households | % Households |
| Under 35 Years | 23 | 8.8% |
| 35 to 44 Years | 24 | 9.2% |
| 45 to 54 Years | 79 | 30.1% |
| 55 to 64 Years | 67 | 25.6% |
| 65 to 74 Years | 18 | 6.9% |
| 75 to 84 Years | 46 | 17.6% |
| 85 Years and Over | 5 | 1.9% |
| Total | 262 | 100.0% |
Housing Finances in Allenspark
Median Income by Occupancy in Allenspark
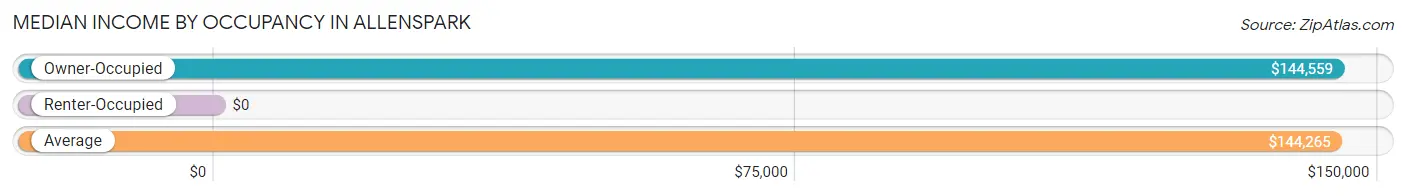
| Occupancy Type | # Households | Median Income |
| Owner-Occupied | 210 (80.1%) | $144,559 |
| Renter-Occupied | 52 (19.9%) | $0 |
| Average | 262 (100.0%) | $144,265 |
Occupancy by Householder Income Bracket in Allenspark
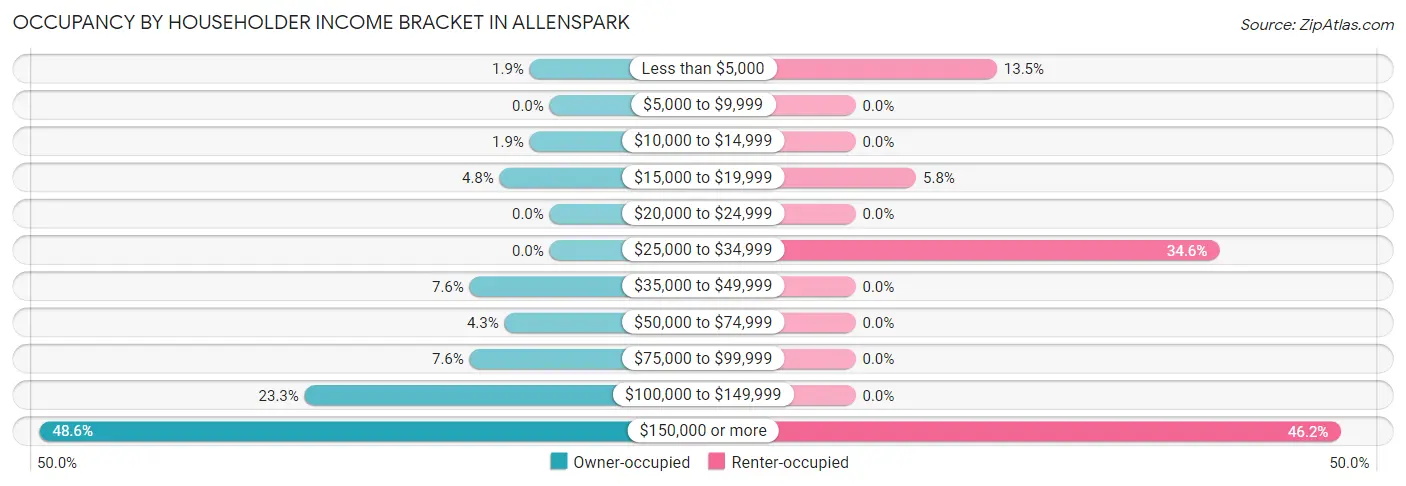
| Income Bracket | Owner-occupied | Renter-occupied |
| Less than $5,000 | 4 (1.9%) | 7 (13.5%) |
| $5,000 to $9,999 | 0 (0.0%) | 0 (0.0%) |
| $10,000 to $14,999 | 4 (1.9%) | 0 (0.0%) |
| $15,000 to $19,999 | 10 (4.8%) | 3 (5.8%) |
| $20,000 to $24,999 | 0 (0.0%) | 0 (0.0%) |
| $25,000 to $34,999 | 0 (0.0%) | 18 (34.6%) |
| $35,000 to $49,999 | 16 (7.6%) | 0 (0.0%) |
| $50,000 to $74,999 | 9 (4.3%) | 0 (0.0%) |
| $75,000 to $99,999 | 16 (7.6%) | 0 (0.0%) |
| $100,000 to $149,999 | 49 (23.3%) | 0 (0.0%) |
| $150,000 or more | 102 (48.6%) | 24 (46.2%) |
| Total | 210 (100.0%) | 52 (100.0%) |
Monthly Housing Cost Tiers in Allenspark
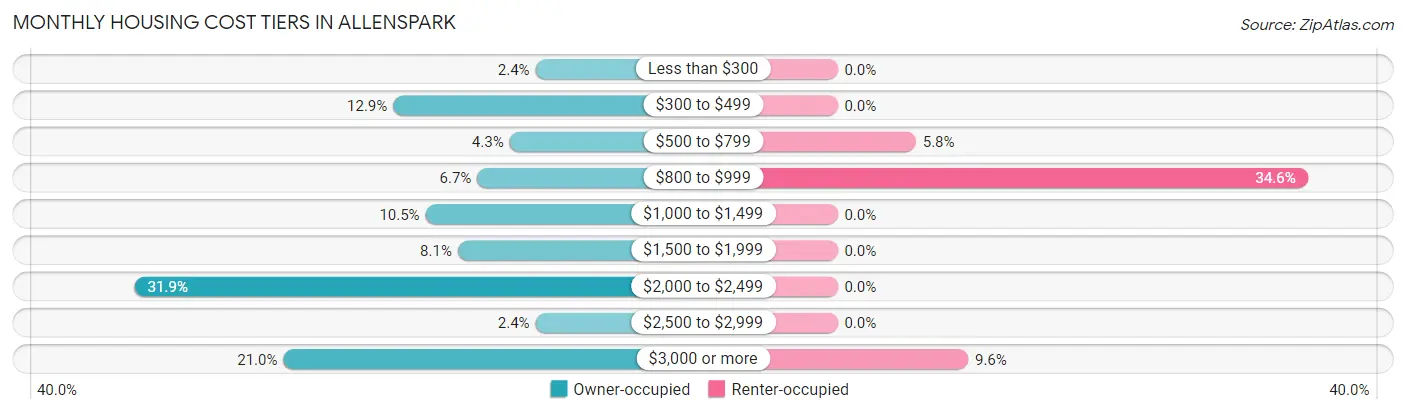
| Monthly Cost | Owner-occupied | Renter-occupied |
| Less than $300 | 5 (2.4%) | 0 (0.0%) |
| $300 to $499 | 27 (12.9%) | 0 (0.0%) |
| $500 to $799 | 9 (4.3%) | 3 (5.8%) |
| $800 to $999 | 14 (6.7%) | 18 (34.6%) |
| $1,000 to $1,499 | 22 (10.5%) | 0 (0.0%) |
| $1,500 to $1,999 | 17 (8.1%) | 0 (0.0%) |
| $2,000 to $2,499 | 67 (31.9%) | 0 (0.0%) |
| $2,500 to $2,999 | 5 (2.4%) | 0 (0.0%) |
| $3,000 or more | 44 (20.9%) | 5 (9.6%) |
| Total | 210 (100.0%) | 52 (100.0%) |
Physical Housing Characteristics in Allenspark
Housing Structures in Allenspark
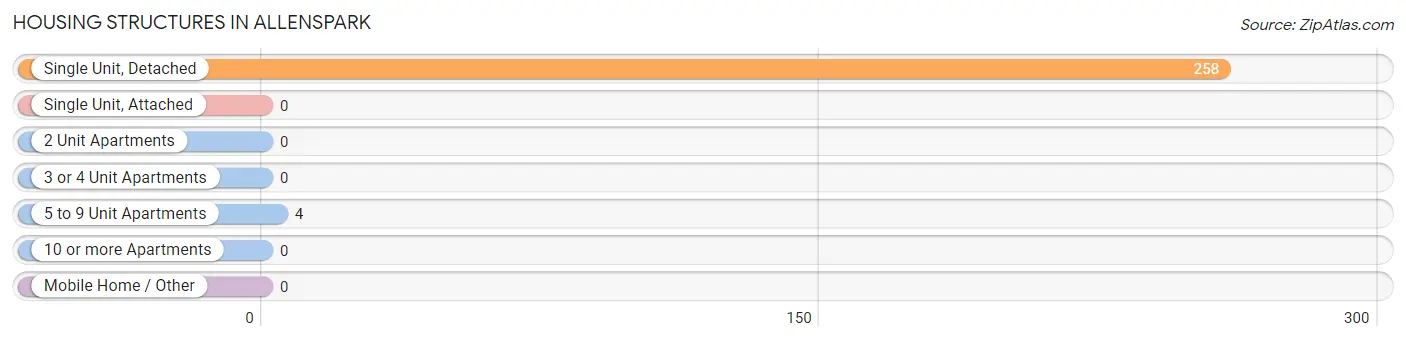
| Structure Type | # Housing Units | % Housing Units |
| Single Unit, Detached | 258 | 98.5% |
| Single Unit, Attached | 0 | 0.0% |
| 2 Unit Apartments | 0 | 0.0% |
| 3 or 4 Unit Apartments | 0 | 0.0% |
| 5 to 9 Unit Apartments | 4 | 1.5% |
| 10 or more Apartments | 0 | 0.0% |
| Mobile Home / Other | 0 | 0.0% |
| Total | 262 | 100.0% |
Housing Structures by Occupancy in Allenspark
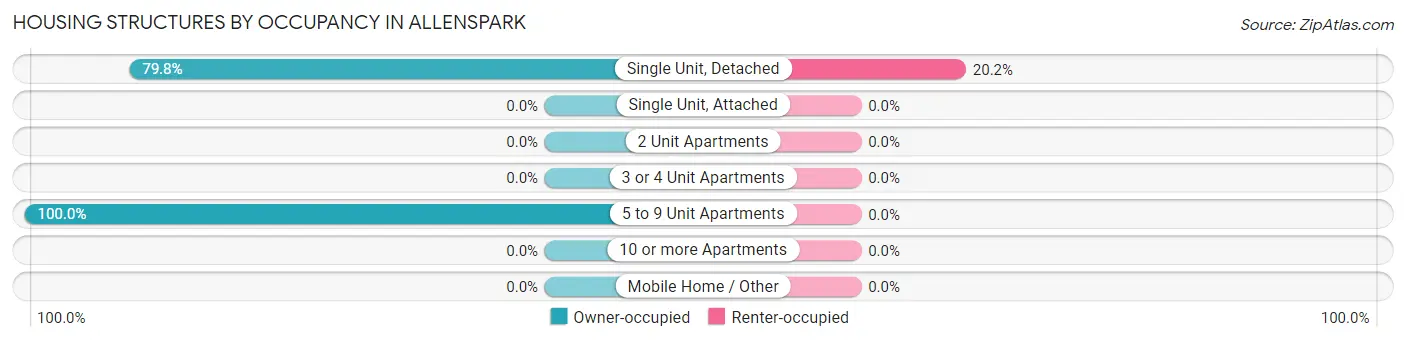
| Structure Type | Owner-occupied | Renter-occupied |
| Single Unit, Detached | 206 (79.8%) | 52 (20.2%) |
| Single Unit, Attached | 0 (0.0%) | 0 (0.0%) |
| 2 Unit Apartments | 0 (0.0%) | 0 (0.0%) |
| 3 or 4 Unit Apartments | 0 (0.0%) | 0 (0.0%) |
| 5 to 9 Unit Apartments | 4 (100.0%) | 0 (0.0%) |
| 10 or more Apartments | 0 (0.0%) | 0 (0.0%) |
| Mobile Home / Other | 0 (0.0%) | 0 (0.0%) |
| Total | 210 (80.1%) | 52 (19.9%) |
Housing Structures by Number of Rooms in Allenspark
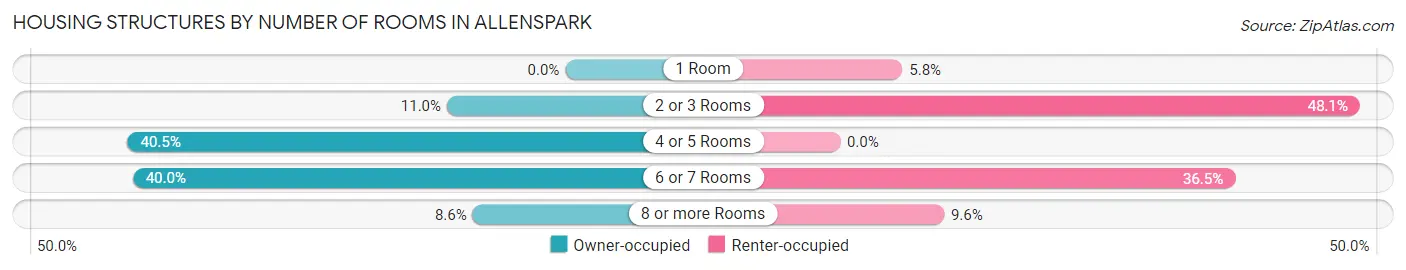
| Number of Rooms | Owner-occupied | Renter-occupied |
| 1 Room | 0 (0.0%) | 3 (5.8%) |
| 2 or 3 Rooms | 23 (11.0%) | 25 (48.1%) |
| 4 or 5 Rooms | 85 (40.5%) | 0 (0.0%) |
| 6 or 7 Rooms | 84 (40.0%) | 19 (36.5%) |
| 8 or more Rooms | 18 (8.6%) | 5 (9.6%) |
| Total | 210 (100.0%) | 52 (100.0%) |
Housing Structure by Heating Type in Allenspark
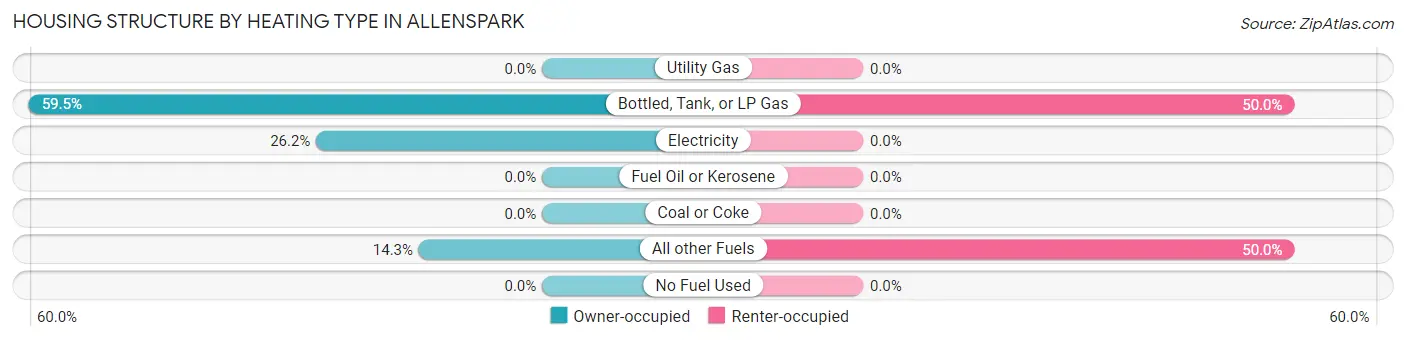
| Heating Type | Owner-occupied | Renter-occupied |
| Utility Gas | 0 (0.0%) | 0 (0.0%) |
| Bottled, Tank, or LP Gas | 125 (59.5%) | 26 (50.0%) |
| Electricity | 55 (26.2%) | 0 (0.0%) |
| Fuel Oil or Kerosene | 0 (0.0%) | 0 (0.0%) |
| Coal or Coke | 0 (0.0%) | 0 (0.0%) |
| All other Fuels | 30 (14.3%) | 26 (50.0%) |
| No Fuel Used | 0 (0.0%) | 0 (0.0%) |
| Total | 210 (100.0%) | 52 (100.0%) |
Household Vehicle Usage in Allenspark
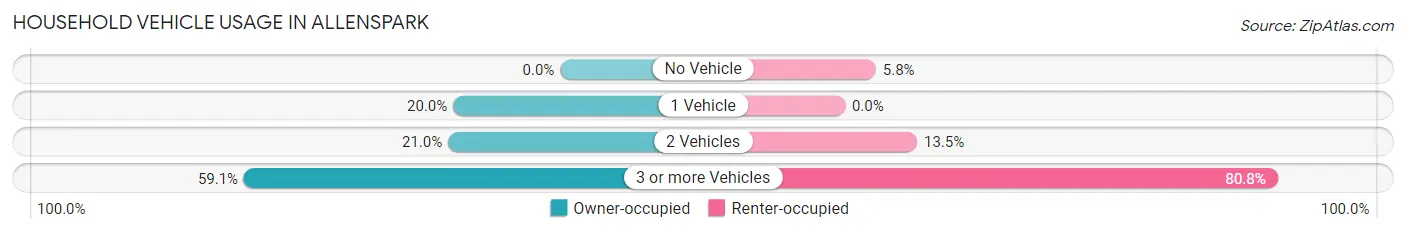
| Vehicles per Household | Owner-occupied | Renter-occupied |
| No Vehicle | 0 (0.0%) | 3 (5.8%) |
| 1 Vehicle | 42 (20.0%) | 0 (0.0%) |
| 2 Vehicles | 44 (20.9%) | 7 (13.5%) |
| 3 or more Vehicles | 124 (59.1%) | 42 (80.8%) |
| Total | 210 (100.0%) | 52 (100.0%) |
Real Estate & Mortgages in Allenspark
Real Estate and Mortgage Overview in Allenspark
| Characteristic | Without Mortgage | With Mortgage |
| Housing Units | 51 | 159 |
| Median Property Value | $598,200 | $586,100 |
| Median Household Income | - | - |
| Monthly Housing Costs | $469 | $44 |
| Real Estate Taxes | $2,380 | $0 |
Property Value by Mortgage Status in Allenspark
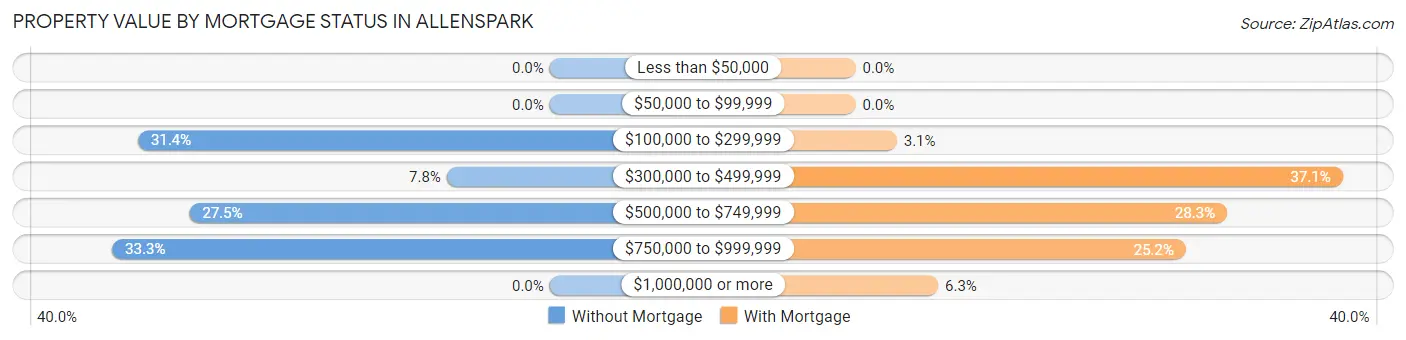
| Property Value | Without Mortgage | With Mortgage |
| Less than $50,000 | 0 (0.0%) | 0 (0.0%) |
| $50,000 to $99,999 | 0 (0.0%) | 0 (0.0%) |
| $100,000 to $299,999 | 16 (31.4%) | 5 (3.1%) |
| $300,000 to $499,999 | 4 (7.8%) | 59 (37.1%) |
| $500,000 to $749,999 | 14 (27.5%) | 45 (28.3%) |
| $750,000 to $999,999 | 17 (33.3%) | 40 (25.2%) |
| $1,000,000 or more | 0 (0.0%) | 10 (6.3%) |
| Total | 51 (100.0%) | 159 (100.0%) |
Household Income by Mortgage Status in Allenspark
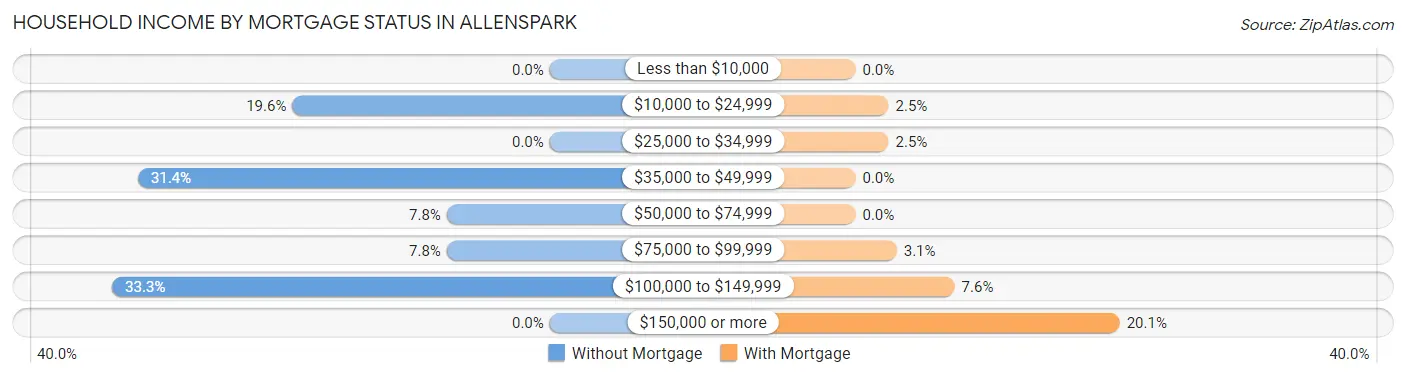
| Household Income | Without Mortgage | With Mortgage |
| Less than $10,000 | 0 (0.0%) | 0 (0.0%) |
| $10,000 to $24,999 | 10 (19.6%) | 4 (2.5%) |
| $25,000 to $34,999 | 0 (0.0%) | 4 (2.5%) |
| $35,000 to $49,999 | 16 (31.4%) | 0 (0.0%) |
| $50,000 to $74,999 | 4 (7.8%) | 0 (0.0%) |
| $75,000 to $99,999 | 4 (7.8%) | 5 (3.1%) |
| $100,000 to $149,999 | 17 (33.3%) | 12 (7.5%) |
| $150,000 or more | 0 (0.0%) | 32 (20.1%) |
| Total | 51 (100.0%) | 159 (100.0%) |
Property Value to Household Income Ratio in Allenspark
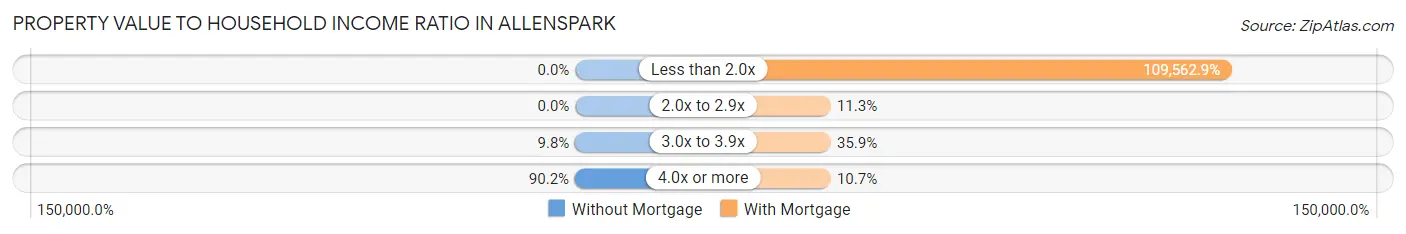
| Value-to-Income Ratio | Without Mortgage | With Mortgage |
| Less than 2.0x | 0 (0.0%) | 174,205 (109,562.9%) |
| 2.0x to 2.9x | 0 (0.0%) | 18 (11.3%) |
| 3.0x to 3.9x | 5 (9.8%) | 57 (35.8%) |
| 4.0x or more | 46 (90.2%) | 17 (10.7%) |
| Total | 51 (100.0%) | 159 (100.0%) |
Real Estate Taxes by Mortgage Status in Allenspark
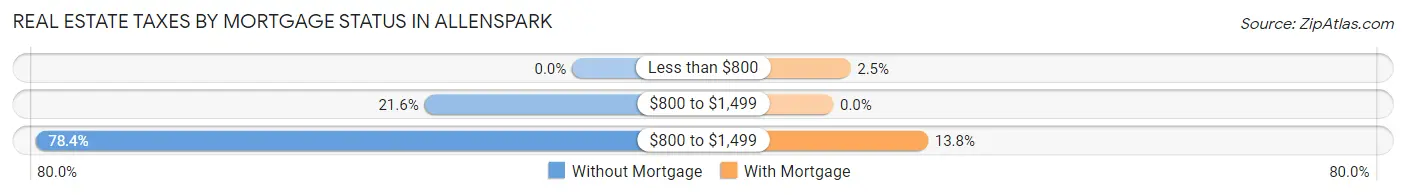
| Property Taxes | Without Mortgage | With Mortgage |
| Less than $800 | 0 (0.0%) | 4 (2.5%) |
| $800 to $1,499 | 11 (21.6%) | 0 (0.0%) |
| $800 to $1,499 | 40 (78.4%) | 22 (13.8%) |
| Total | 51 (100.0%) | 159 (100.0%) |
Health & Disability in Allenspark
Health Insurance Coverage by Age in Allenspark
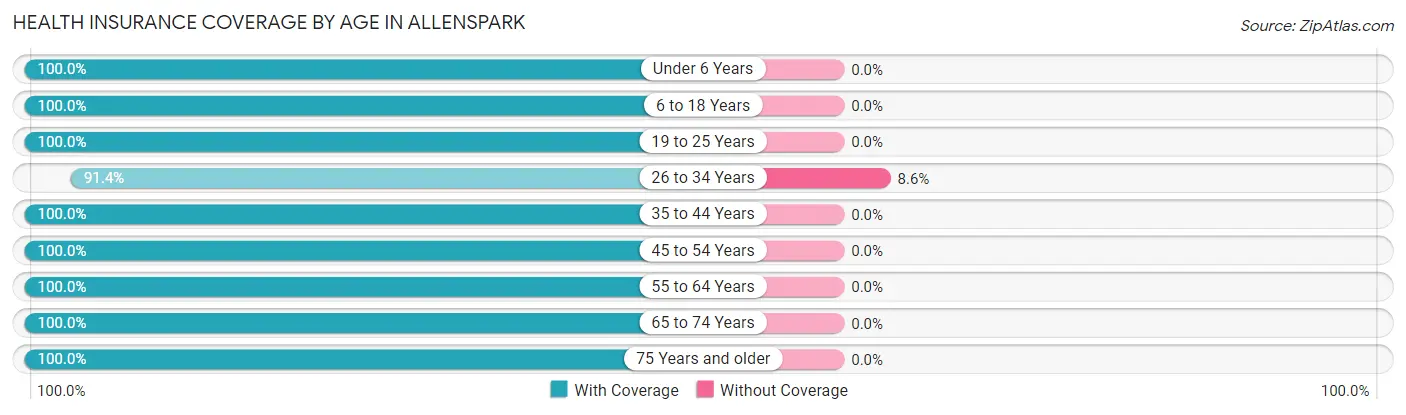
| Age Bracket | With Coverage | Without Coverage |
| Under 6 Years | 2 (100.0%) | 0 (0.0%) |
| 6 to 18 Years | 103 (100.0%) | 0 (0.0%) |
| 19 to 25 Years | 14 (100.0%) | 0 (0.0%) |
| 26 to 34 Years | 74 (91.4%) | 7 (8.6%) |
| 35 to 44 Years | 29 (100.0%) | 0 (0.0%) |
| 45 to 54 Years | 152 (100.0%) | 0 (0.0%) |
| 55 to 64 Years | 116 (100.0%) | 0 (0.0%) |
| 65 to 74 Years | 74 (100.0%) | 0 (0.0%) |
| 75 Years and older | 51 (100.0%) | 0 (0.0%) |
| Total | 615 (98.9%) | 7 (1.1%) |
Health Insurance Coverage by Citizenship Status in Allenspark
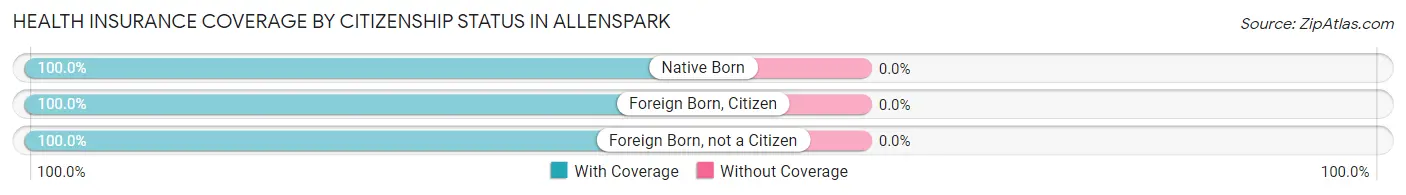
| Citizenship Status | With Coverage | Without Coverage |
| Native Born | 2 (100.0%) | 0 (0.0%) |
| Foreign Born, Citizen | 103 (100.0%) | 0 (0.0%) |
| Foreign Born, not a Citizen | 14 (100.0%) | 0 (0.0%) |
Health Insurance Coverage by Household Income in Allenspark
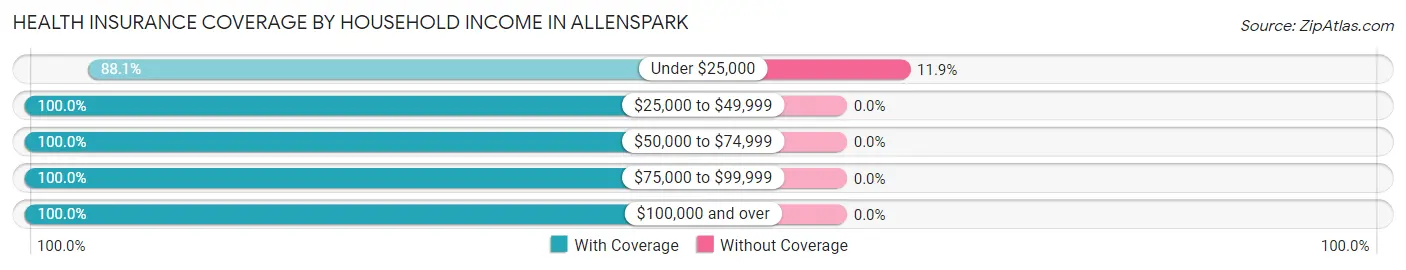
| Household Income | With Coverage | Without Coverage |
| Under $25,000 | 52 (88.1%) | 7 (11.9%) |
| $25,000 to $49,999 | 38 (100.0%) | 0 (0.0%) |
| $50,000 to $74,999 | 18 (100.0%) | 0 (0.0%) |
| $75,000 to $99,999 | 35 (100.0%) | 0 (0.0%) |
| $100,000 and over | 461 (100.0%) | 0 (0.0%) |
Public vs Private Health Insurance Coverage by Age in Allenspark
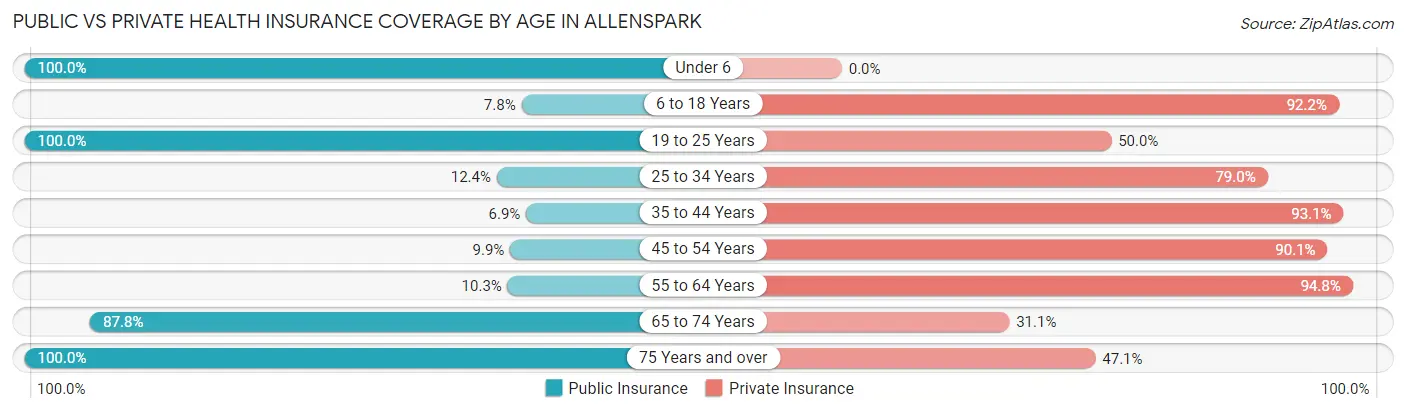
| Age Bracket | Public Insurance | Private Insurance |
| Under 6 | 2 (100.0%) | 0 (0.0%) |
| 6 to 18 Years | 8 (7.8%) | 95 (92.2%) |
| 19 to 25 Years | 14 (100.0%) | 7 (50.0%) |
| 25 to 34 Years | 10 (12.3%) | 64 (79.0%) |
| 35 to 44 Years | 2 (6.9%) | 27 (93.1%) |
| 45 to 54 Years | 15 (9.9%) | 137 (90.1%) |
| 55 to 64 Years | 12 (10.3%) | 110 (94.8%) |
| 65 to 74 Years | 65 (87.8%) | 23 (31.1%) |
| 75 Years and over | 51 (100.0%) | 24 (47.1%) |
| Total | 179 (28.8%) | 487 (78.3%) |
Disability Status by Sex by Age in Allenspark
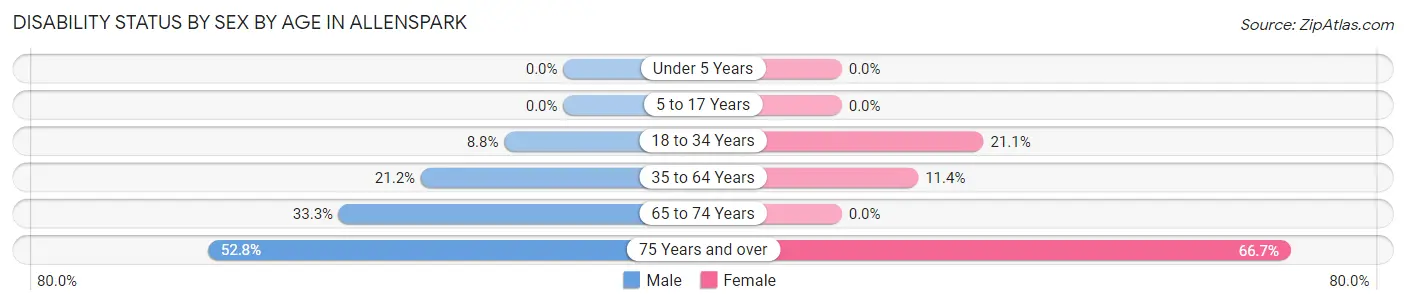
| Age Bracket | Male | Female |
| Under 5 Years | 0 (0.0%) | 0 (0.0%) |
| 5 to 17 Years | 0 (0.0%) | 0 (0.0%) |
| 18 to 34 Years | 5 (8.8%) | 8 (21.0%) |
| 35 to 64 Years | 33 (21.1%) | 16 (11.4%) |
| 65 to 74 Years | 9 (33.3%) | 0 (0.0%) |
| 75 Years and over | 19 (52.8%) | 10 (66.7%) |
Disability Class by Sex by Age in Allenspark
Disability Class: Hearing Difficulty
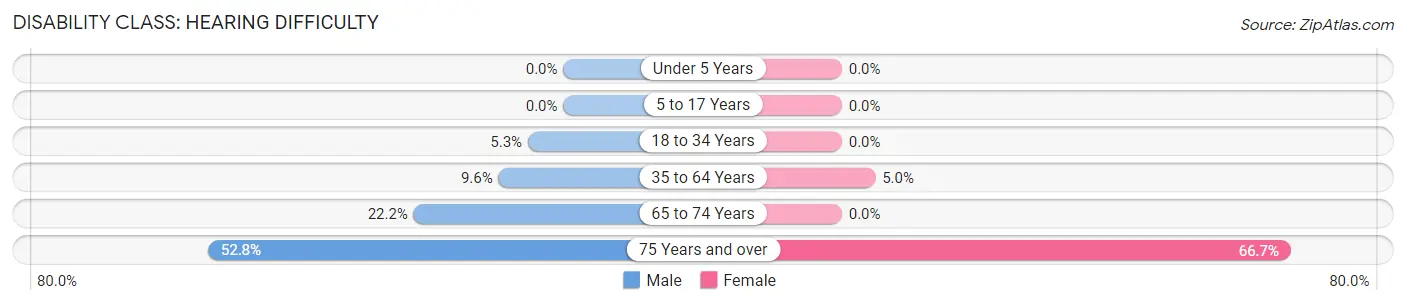
| Age Bracket | Male | Female |
| Under 5 Years | 0 (0.0%) | 0 (0.0%) |
| 5 to 17 Years | 0 (0.0%) | 0 (0.0%) |
| 18 to 34 Years | 3 (5.3%) | 0 (0.0%) |
| 35 to 64 Years | 15 (9.6%) | 7 (5.0%) |
| 65 to 74 Years | 6 (22.2%) | 0 (0.0%) |
| 75 Years and over | 19 (52.8%) | 10 (66.7%) |
Disability Class: Vision Difficulty
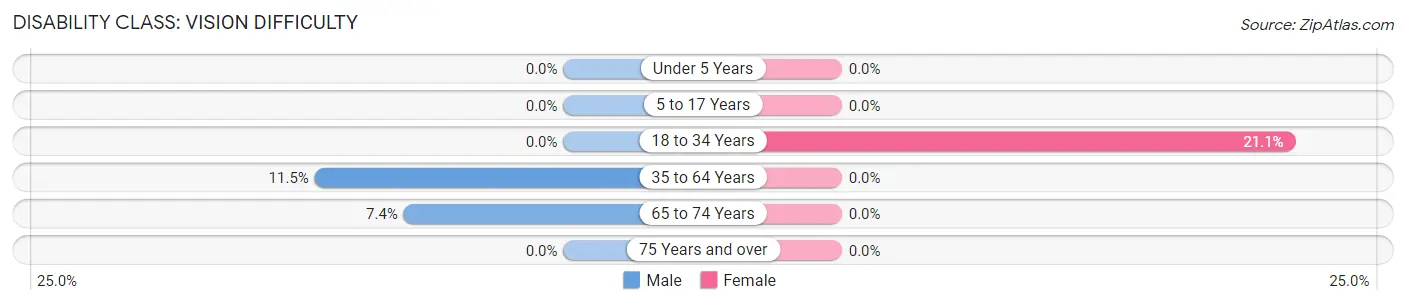
| Age Bracket | Male | Female |
| Under 5 Years | 0 (0.0%) | 0 (0.0%) |
| 5 to 17 Years | 0 (0.0%) | 0 (0.0%) |
| 18 to 34 Years | 0 (0.0%) | 8 (21.0%) |
| 35 to 64 Years | 18 (11.5%) | 0 (0.0%) |
| 65 to 74 Years | 2 (7.4%) | 0 (0.0%) |
| 75 Years and over | 0 (0.0%) | 0 (0.0%) |
Disability Class: Cognitive Difficulty
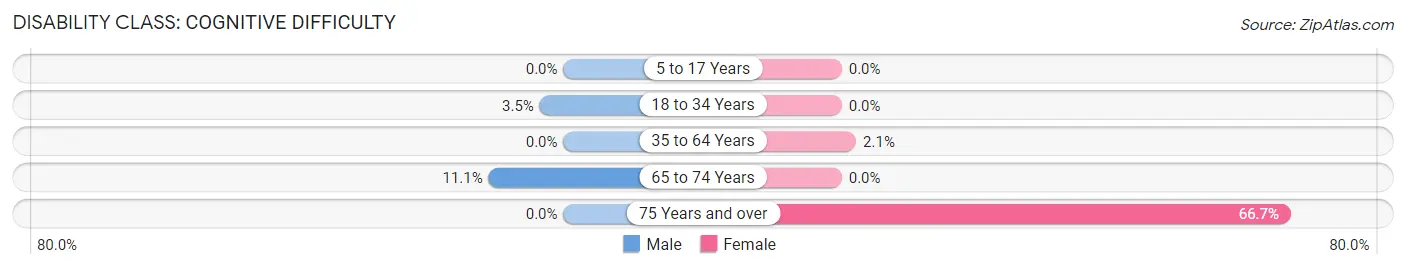
| Age Bracket | Male | Female |
| 5 to 17 Years | 0 (0.0%) | 0 (0.0%) |
| 18 to 34 Years | 2 (3.5%) | 0 (0.0%) |
| 35 to 64 Years | 0 (0.0%) | 3 (2.1%) |
| 65 to 74 Years | 3 (11.1%) | 0 (0.0%) |
| 75 Years and over | 0 (0.0%) | 10 (66.7%) |
Disability Class: Ambulatory Difficulty
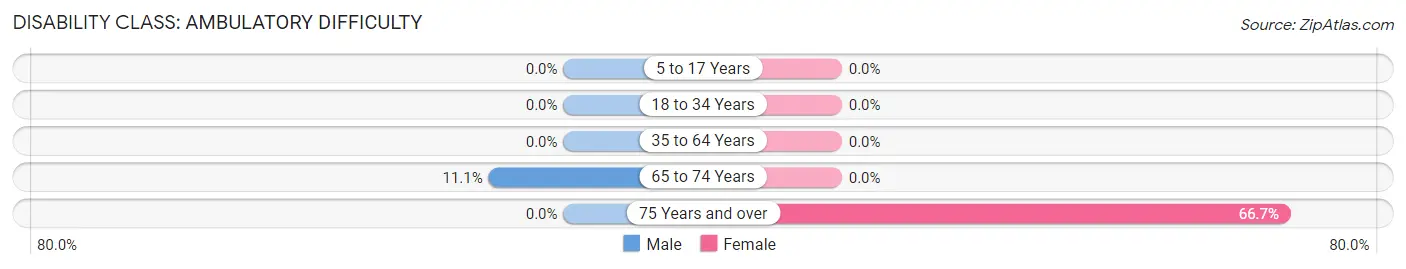
| Age Bracket | Male | Female |
| 5 to 17 Years | 0 (0.0%) | 0 (0.0%) |
| 18 to 34 Years | 0 (0.0%) | 0 (0.0%) |
| 35 to 64 Years | 0 (0.0%) | 0 (0.0%) |
| 65 to 74 Years | 3 (11.1%) | 0 (0.0%) |
| 75 Years and over | 0 (0.0%) | 10 (66.7%) |
Disability Class: Self-Care Difficulty
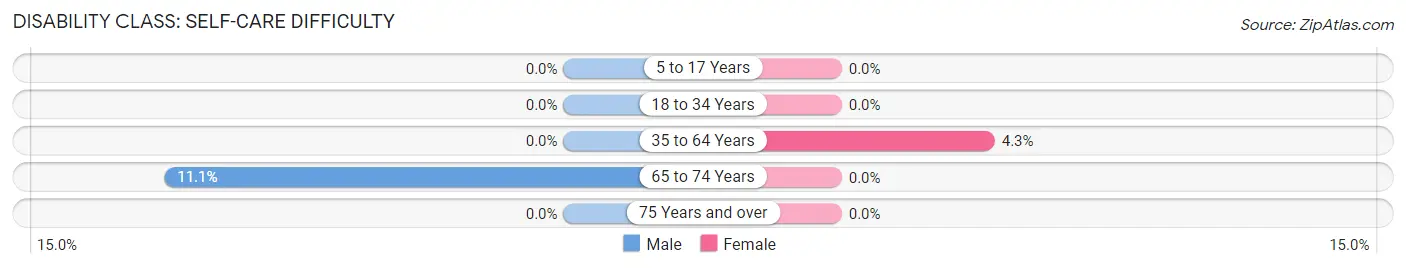
| Age Bracket | Male | Female |
| 5 to 17 Years | 0 (0.0%) | 0 (0.0%) |
| 18 to 34 Years | 0 (0.0%) | 0 (0.0%) |
| 35 to 64 Years | 0 (0.0%) | 6 (4.3%) |
| 65 to 74 Years | 3 (11.1%) | 0 (0.0%) |
| 75 Years and over | 0 (0.0%) | 0 (0.0%) |
Technology Access in Allenspark
Computing Device Access in Allenspark
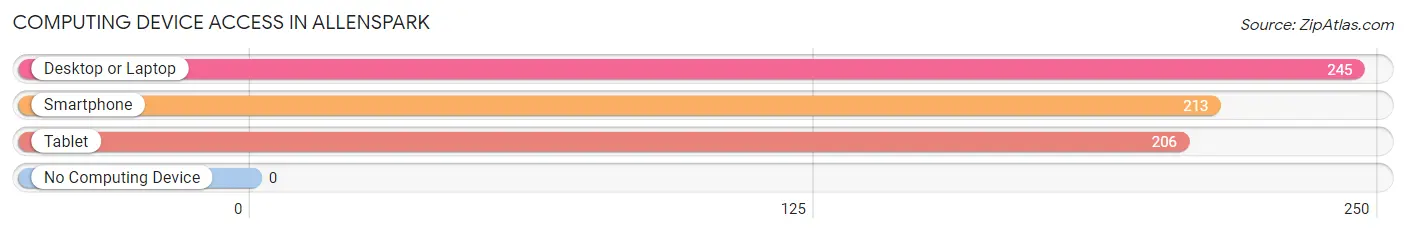
| Device Type | # Households | % Households |
| Desktop or Laptop | 245 | 93.5% |
| Smartphone | 213 | 81.3% |
| Tablet | 206 | 78.6% |
| No Computing Device | 0 | 0.0% |
| Total | 262 | 100.0% |
Internet Access in Allenspark
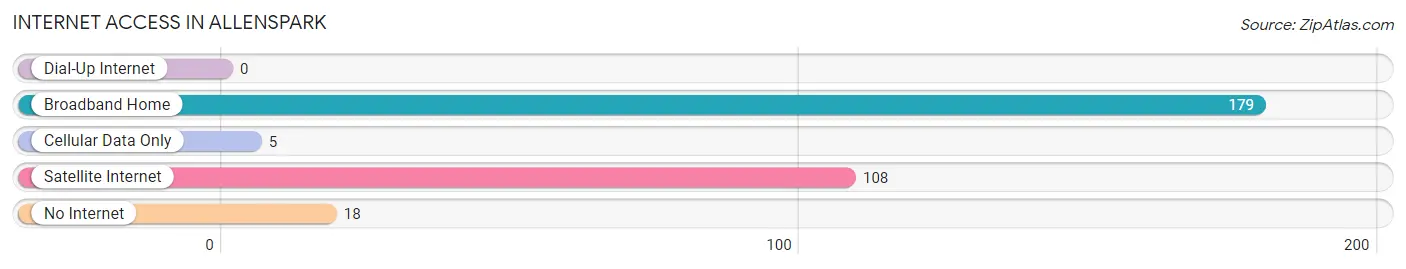
| Internet Type | # Households | % Households |
| Dial-Up Internet | 0 | 0.0% |
| Broadband Home | 179 | 68.3% |
| Cellular Data Only | 5 | 1.9% |
| Satellite Internet | 108 | 41.2% |
| No Internet | 18 | 6.9% |
| Total | 262 | 100.0% |
Allenspark Summary
Allenspark is a small unincorporated community located in Boulder County, Colorado, United States. It is situated in the foothills of the Rocky Mountains, approximately 9 miles (14 km) southwest of Estes Park. The community is named after John Allen, who homesteaded the area in 1874.
History
The area that is now Allenspark was first inhabited by the Ute Native American tribe. The Ute people lived in the area for centuries before the arrival of European settlers.
In 1874, John Allen homesteaded the area and established a small ranch. He named the area Allenspark after himself. The area quickly became a popular destination for tourists and outdoor enthusiasts.
In the early 1900s, the area was home to a number of summer camps, including Camp St. Malo, Camp St. Vrain, and Camp St. Vrain. These camps provided a variety of activities for children, including horseback riding, swimming, and hiking.
In the 1920s, the area was home to a number of resorts, including the Allenspark Lodge, the Allenspark Inn, and the Allenspark Hotel. These resorts provided lodging and entertainment for visitors to the area.
In the 1950s, the area was home to a number of ski resorts, including the Allenspark Ski Area. The ski area was popular with locals and tourists alike.
Geography
Allenspark is located in the foothills of the Rocky Mountains, approximately 9 miles (14 km) southwest of Estes Park. The area is characterized by rolling hills, dense forests, and numerous streams and creeks.
The area is home to a variety of wildlife, including elk, deer, bears, and mountain lions. The area is also home to a variety of birds, including bald eagles, hawks, and owls.
The climate in Allenspark is generally mild, with warm summers and cold winters. The average temperature in the summer is around 70°F (21°C), and the average temperature in the winter is around 30°F (-1°C).
Economy
The economy of Allenspark is largely based on tourism. The area is home to a number of resorts, restaurants, and other businesses that cater to visitors.
The area is also home to a number of small businesses, including a general store, a post office, and a gas station.
Demographics
As of the 2010 census, the population of Allenspark was 545. The racial makeup of the town was 97.3% White, 0.2% African American, 0.4% Native American, 0.4% Asian, 0.2% from other races, and 1.5% from two or more races.
The median household income in Allenspark was $50,000, and the median family income was $54,000. The per capita income in Allenspark was $25,000.
Conclusion
Allenspark is a small unincorporated community located in Boulder County, Colorado. It is situated in the foothills of the Rocky Mountains, approximately 9 miles (14 km) southwest of Estes Park. The area was first inhabited by the Ute Native American tribe, and was later homesteaded by John Allen in 1874. The economy of Allenspark is largely based on tourism, and the area is home to a number of resorts, restaurants, and other businesses that cater to visitors. As of the 2010 census, the population of Allenspark was 545. The median household income in Allenspark was $50,000, and the median family income was $54,000.
Common Questions
What is Per Capita Income in Allenspark?
Per Capita income in Allenspark is $63,291.
What is the Median Family Income in Allenspark?
Median Family Income in Allenspark is $173,674.
What is the Median Household income in Allenspark?
Median Household Income in Allenspark is $144,265.
What is Income or Wage Gap in Allenspark?
Income or Wage Gap in Allenspark is 22.3%.
Women in Allenspark earn 77.7 cents for every dollar earned by a man.
What is Family Income Deficit in Allenspark?
Family Income Deficit in Allenspark is $9,536.
Families that are below poverty line in Allenspark earn $9,536 less on average than the poverty threshold level.
What is Inequality or Gini Index in Allenspark?
Inequality or Gini Index in Allenspark is 0.39.
What is the Total Population of Allenspark?
Total Population of Allenspark is 622.
What is the Total Male Population of Allenspark?
Total Male Population of Allenspark is 332.
What is the Total Female Population of Allenspark?
Total Female Population of Allenspark is 290.
What is the Ratio of Males per 100 Females in Allenspark?
There are 114.48 Males per 100 Females in Allenspark.
What is the Ratio of Females per 100 Males in Allenspark?
There are 87.35 Females per 100 Males in Allenspark.
What is the Median Population Age in Allenspark?
Median Population Age in Allenspark is 51.0 Years.
What is the Average Family Size in Allenspark
Average Family Size in Allenspark is 2.9 People.
What is the Average Household Size in Allenspark
Average Household Size in Allenspark is 2.3 People.
How Large is the Labor Force in Allenspark?
There are 385 People in the Labor Forcein in Allenspark.
What is the Percentage of People in the Labor Force in Allenspark?
69.5% of People are in the Labor Force in Allenspark.
What is the Unemployment Rate in Allenspark?
Unemployment Rate in Allenspark is 3.6%.