Acres Green, CO Map & Demographics
Acres Green Map
Acres Green Overview
$47,458
PER CAPITA INCOME
$132,927
AVG FAMILY INCOME
$124,219
AVG HOUSEHOLD INCOME
19.3%
WAGE / INCOME GAP [ % ]
80.7¢/ $1
WAGE / INCOME GAP [ $ ]
0.31
INEQUALITY / GINI INDEX
2,627
TOTAL POPULATION
1,450
MALE POPULATION
1,177
FEMALE POPULATION
123.19
MALES / 100 FEMALES
81.17
FEMALES / 100 MALES
40.6
MEDIAN AGE
2.8
AVG FAMILY SIZE
2.5
AVG HOUSEHOLD SIZE
1,713
LABOR FORCE [ PEOPLE ]
76.7%
PERCENT IN LABOR FORCE
1.1%
UNEMPLOYMENT RATE
Income in Acres Green
Income Overview in Acres Green
Per Capita Income in Acres Green is $47,458, while median incomes of families and households are $132,927 and $124,219 respectively.
| Characteristic | Number | Measure |
| Per Capita Income | 2,627 | $47,458 |
| Median Family Income | 836 | $132,927 |
| Mean Family Income | 836 | $133,585 |
| Median Household Income | 1,035 | $124,219 |
| Mean Household Income | 1,035 | $122,185 |
| Income Deficit | 836 | $0 |
| Wage / Income Gap (%) | 2,627 | 19.28% |
| Wage / Income Gap ($) | 2,627 | 80.72¢ per $1 |
| Gini / Inequality Index | 2,627 | 0.31 |
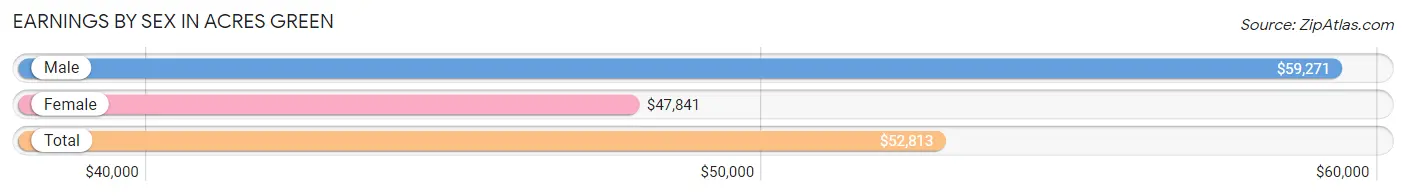
Earnings by Sex in Acres Green
Average Earnings in Acres Green are $52,813, $59,271 for men and $47,841 for women, a difference of 19.3%.
| Sex | Number | Average Earnings |
| Male | 1,041 (59.4%) | $59,271 |
| Female | 713 (40.6%) | $47,841 |
| Total | 1,754 (100.0%) | $52,813 |
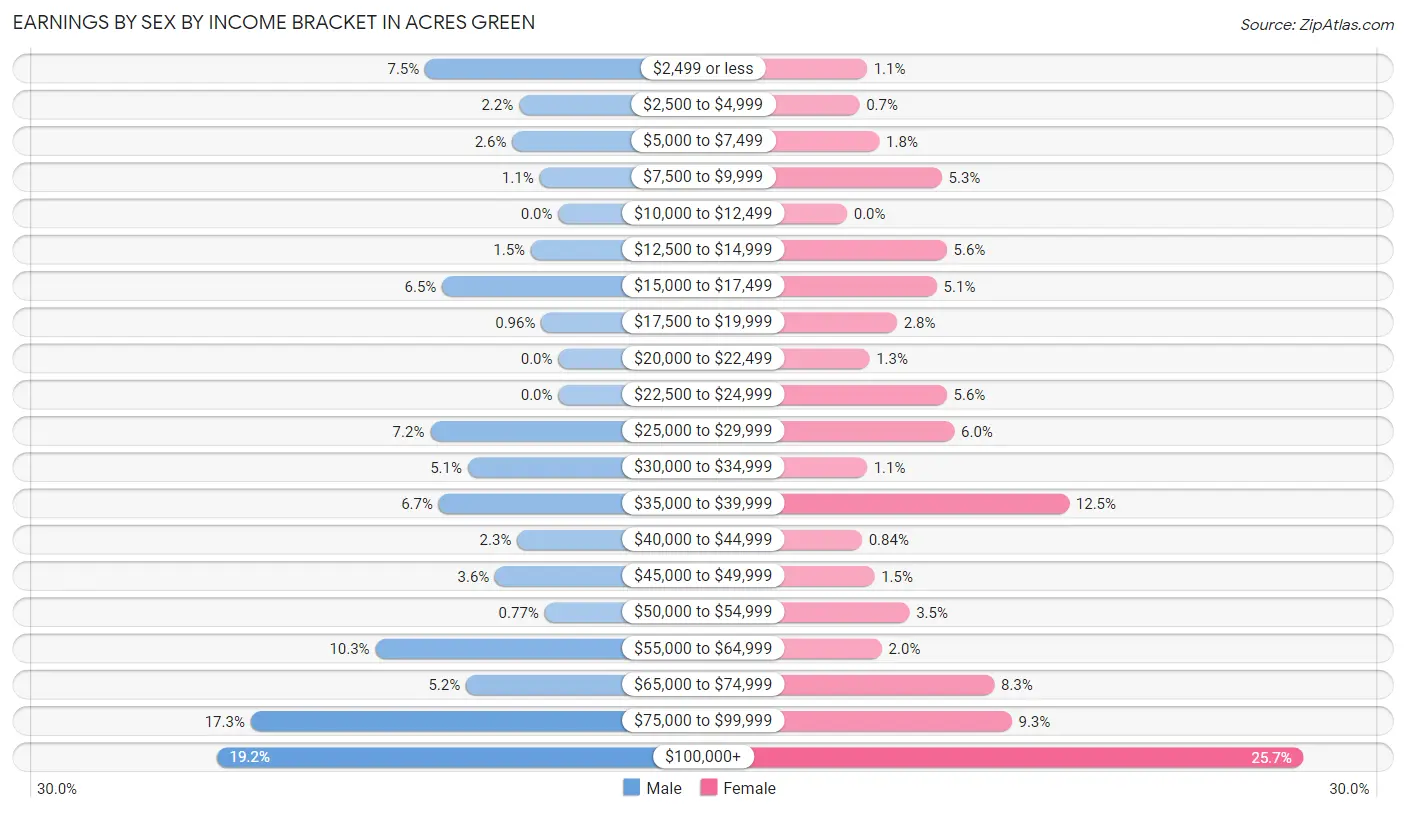
Earnings by Sex by Income Bracket in Acres Green
The most common earnings brackets in Acres Green are $100,000+ for men (200 | 19.2%) and $100,000+ for women (183 | 25.7%).
| Income | Male | Female |
| $2,499 or less | 78 (7.5%) | 8 (1.1%) |
| $2,500 to $4,999 | 23 (2.2%) | 5 (0.7%) |
| $5,000 to $7,499 | 27 (2.6%) | 13 (1.8%) |
| $7,500 to $9,999 | 11 (1.1%) | 38 (5.3%) |
| $10,000 to $12,499 | 0 (0.0%) | 0 (0.0%) |
| $12,500 to $14,999 | 16 (1.5%) | 40 (5.6%) |
| $15,000 to $17,499 | 68 (6.5%) | 36 (5.1%) |
| $17,500 to $19,999 | 10 (1.0%) | 20 (2.8%) |
| $20,000 to $22,499 | 0 (0.0%) | 9 (1.3%) |
| $22,500 to $24,999 | 0 (0.0%) | 40 (5.6%) |
| $25,000 to $29,999 | 75 (7.2%) | 43 (6.0%) |
| $30,000 to $34,999 | 53 (5.1%) | 8 (1.1%) |
| $35,000 to $39,999 | 70 (6.7%) | 89 (12.5%) |
| $40,000 to $44,999 | 24 (2.3%) | 6 (0.8%) |
| $45,000 to $49,999 | 37 (3.5%) | 11 (1.5%) |
| $50,000 to $54,999 | 8 (0.8%) | 25 (3.5%) |
| $55,000 to $64,999 | 107 (10.3%) | 14 (2.0%) |
| $65,000 to $74,999 | 54 (5.2%) | 59 (8.3%) |
| $75,000 to $99,999 | 180 (17.3%) | 66 (9.3%) |
| $100,000+ | 200 (19.2%) | 183 (25.7%) |
| Total | 1,041 (100.0%) | 713 (100.0%) |
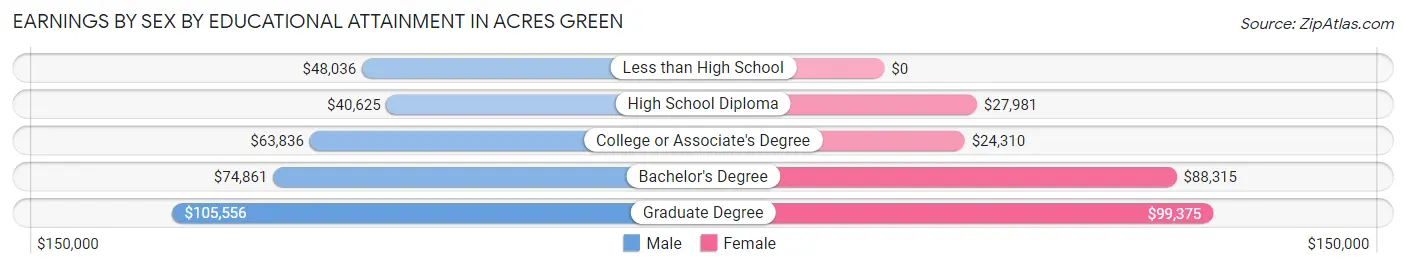
Earnings by Sex by Educational Attainment in Acres Green
Average earnings in Acres Green are $72,250 for men and $54,063 for women, a difference of 25.2%. Men with an educational attainment of graduate degree enjoy the highest average annual earnings of $105,556, while those with high school diploma education earn the least with $40,625. Women with an educational attainment of graduate degree earn the most with the average annual earnings of $99,375, while those with college or associate's degree education have the smallest earnings of $24,310.
| Educational Attainment | Male Income | Female Income |
| Less than High School | $48,036 | $0 |
| High School Diploma | $40,625 | $27,981 |
| College or Associate's Degree | $63,836 | $24,310 |
| Bachelor's Degree | $74,861 | $88,315 |
| Graduate Degree | $105,556 | $99,375 |
| Total | $72,250 | $54,063 |
Family Income in Acres Green
Family Income Brackets in Acres Green
According to the Acres Green family income data, there are 363 families falling into the $100,000 to $149,999 income range, which is the most common income bracket and makes up 43.4% of all families.
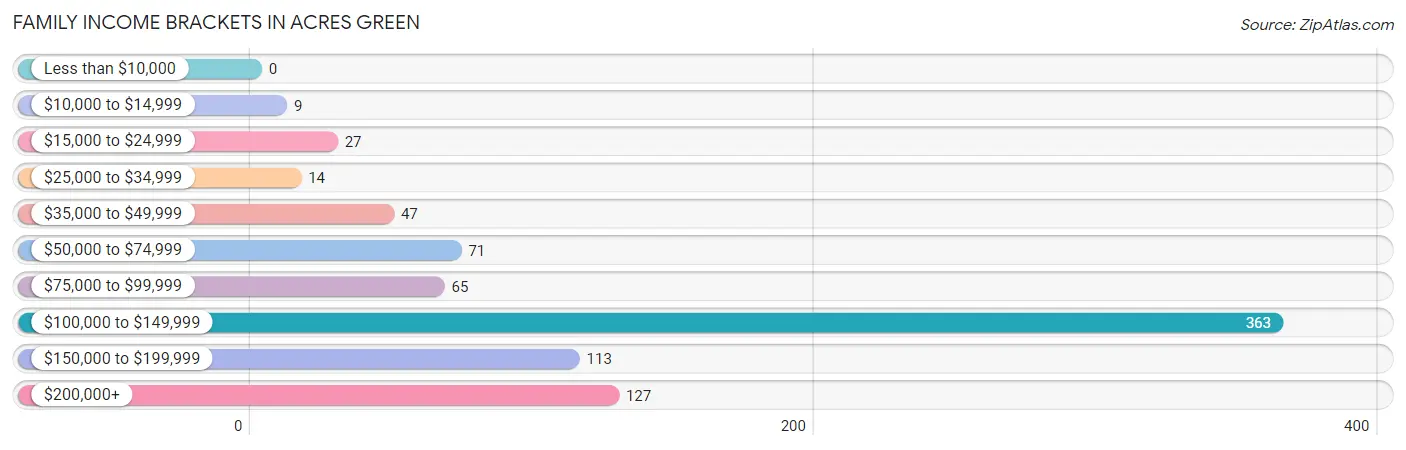
| Income Bracket | # Families | % Families |
| Less than $10,000 | 0 | 0.0% |
| $10,000 to $14,999 | 9 | 1.1% |
| $15,000 to $24,999 | 27 | 3.2% |
| $25,000 to $34,999 | 14 | 1.7% |
| $35,000 to $49,999 | 47 | 5.6% |
| $50,000 to $74,999 | 71 | 8.5% |
| $75,000 to $99,999 | 65 | 7.8% |
| $100,000 to $149,999 | 363 | 43.4% |
| $150,000 to $199,999 | 113 | 13.5% |
| $200,000+ | 127 | 15.2% |
Family Income by Famaliy Size in Acres Green
4-person families (143 | 17.1%) account for the highest median family income in Acres Green with $165,875 per family, while 2-person families (359 | 42.9%) have the highest median income of $56,597 per family member.
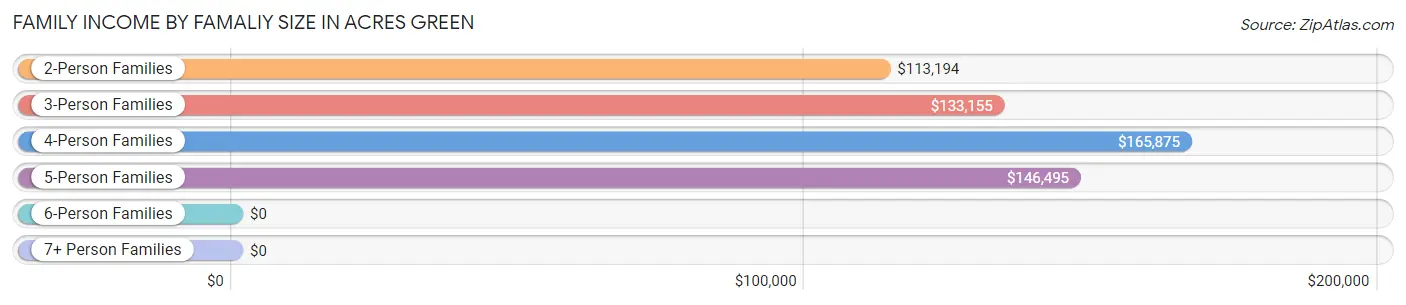
| Income Bracket | # Families | Median Income |
| 2-Person Families | 359 (42.9%) | $113,194 |
| 3-Person Families | 251 (30.0%) | $133,155 |
| 4-Person Families | 143 (17.1%) | $165,875 |
| 5-Person Families | 79 (9.5%) | $146,495 |
| 6-Person Families | 0 (0.0%) | $0 |
| 7+ Person Families | 4 (0.5%) | $0 |
| Total | 836 (100.0%) | $132,927 |
Family Income by Number of Earners in Acres Green
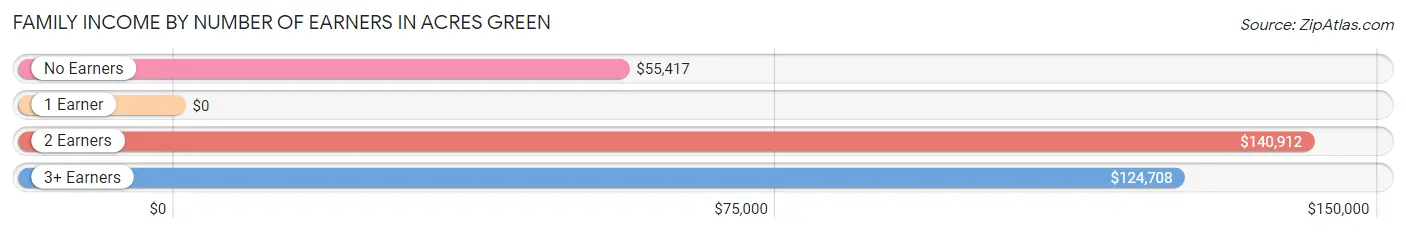
| Number of Earners | # Families | Median Income |
| No Earners | 64 (7.7%) | $55,417 |
| 1 Earner | 126 (15.1%) | $0 |
| 2 Earners | 495 (59.2%) | $140,912 |
| 3+ Earners | 151 (18.1%) | $124,708 |
| Total | 836 (100.0%) | $132,927 |
Household Income in Acres Green
Household Income Brackets in Acres Green
With 386 households falling in the category, the $100,000 to $149,999 income range is the most frequent in Acres Green, accounting for 37.3% of all households. In contrast, only 9 households (0.9%) fall into the $10,000 to $14,999 income bracket, making it the least populous group.
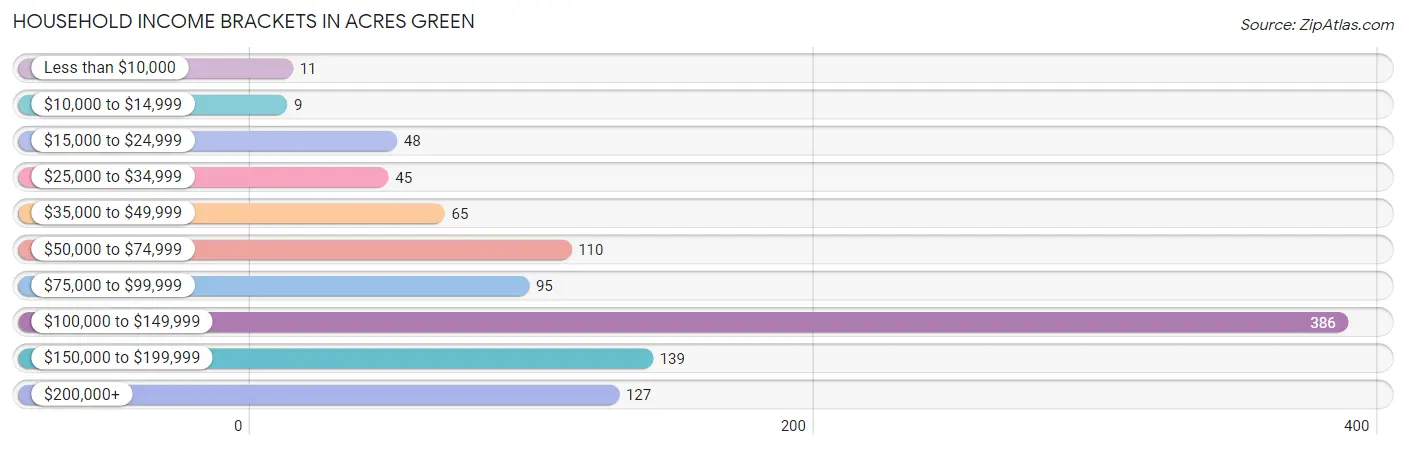
| Income Bracket | # Households | % Households |
| Less than $10,000 | 11 | 1.1% |
| $10,000 to $14,999 | 9 | 0.9% |
| $15,000 to $24,999 | 48 | 4.6% |
| $25,000 to $34,999 | 45 | 4.3% |
| $35,000 to $49,999 | 65 | 6.3% |
| $50,000 to $74,999 | 110 | 10.6% |
| $75,000 to $99,999 | 95 | 9.2% |
| $100,000 to $149,999 | 386 | 37.3% |
| $150,000 to $199,999 | 139 | 13.4% |
| $200,000+ | 127 | 12.3% |
Household Income by Householder Age in Acres Green
The median household income in Acres Green is $124,219, with the highest median household income of $146,544 found in the 25 to 44 years age bracket for the primary householder. A total of 367 households (35.5%) fall into this category. Meanwhile, the 15 to 24 years age bracket for the primary householder has the lowest median household income of $0, with 83 households (8.0%) in this group.
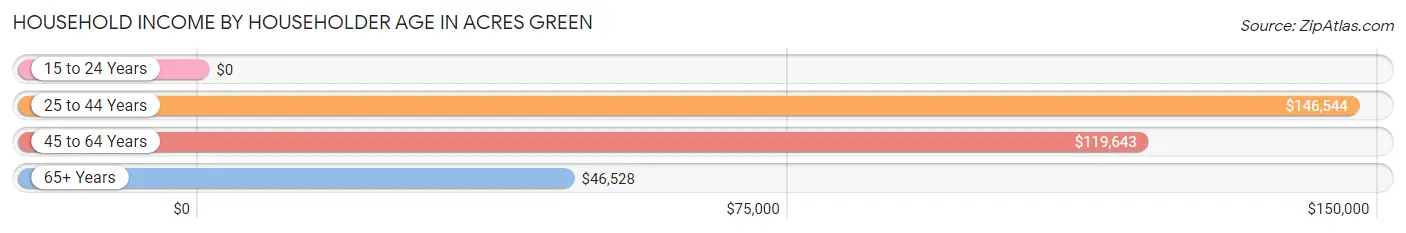
| Income Bracket | # Households | Median Income |
| 15 to 24 Years | 83 (8.0%) | $0 |
| 25 to 44 Years | 367 (35.5%) | $146,544 |
| 45 to 64 Years | 376 (36.3%) | $119,643 |
| 65+ Years | 209 (20.2%) | $46,528 |
| Total | 1,035 (100.0%) | $124,219 |
Poverty in Acres Green
Income Below Poverty by Sex and Age in Acres Green
With 2.7% poverty level for males and 2.5% for females among the residents of Acres Green, 55 to 64 year old males and 75 year old and over females are the most vulnerable to poverty, with 28 males (10.3%) and 9 females (25.7%) in their respective age groups living below the poverty level.
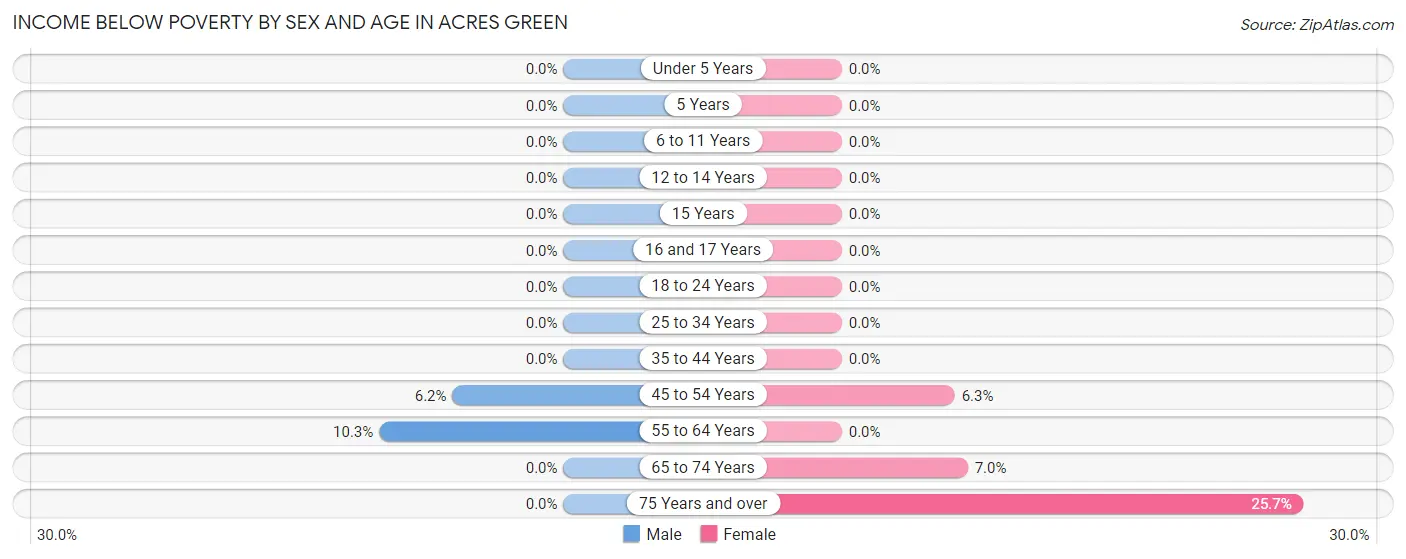
| Age Bracket | Male | Female |
| Under 5 Years | 0 (0.0%) | 0 (0.0%) |
| 5 Years | 0 (0.0%) | 0 (0.0%) |
| 6 to 11 Years | 0 (0.0%) | 0 (0.0%) |
| 12 to 14 Years | 0 (0.0%) | 0 (0.0%) |
| 15 Years | 0 (0.0%) | 0 (0.0%) |
| 16 and 17 Years | 0 (0.0%) | 0 (0.0%) |
| 18 to 24 Years | 0 (0.0%) | 0 (0.0%) |
| 25 to 34 Years | 0 (0.0%) | 0 (0.0%) |
| 35 to 44 Years | 0 (0.0%) | 0 (0.0%) |
| 45 to 54 Years | 11 (6.2%) | 9 (6.3%) |
| 55 to 64 Years | 28 (10.3%) | 0 (0.0%) |
| 65 to 74 Years | 0 (0.0%) | 11 (7.0%) |
| 75 Years and over | 0 (0.0%) | 9 (25.7%) |
| Total | 39 (2.7%) | 29 (2.5%) |
Income Above Poverty by Sex and Age in Acres Green
According to the poverty statistics in Acres Green, males aged under 5 years and females aged under 5 years are the age groups that are most secure financially, with 100.0% of males and 100.0% of females in these age groups living above the poverty line.
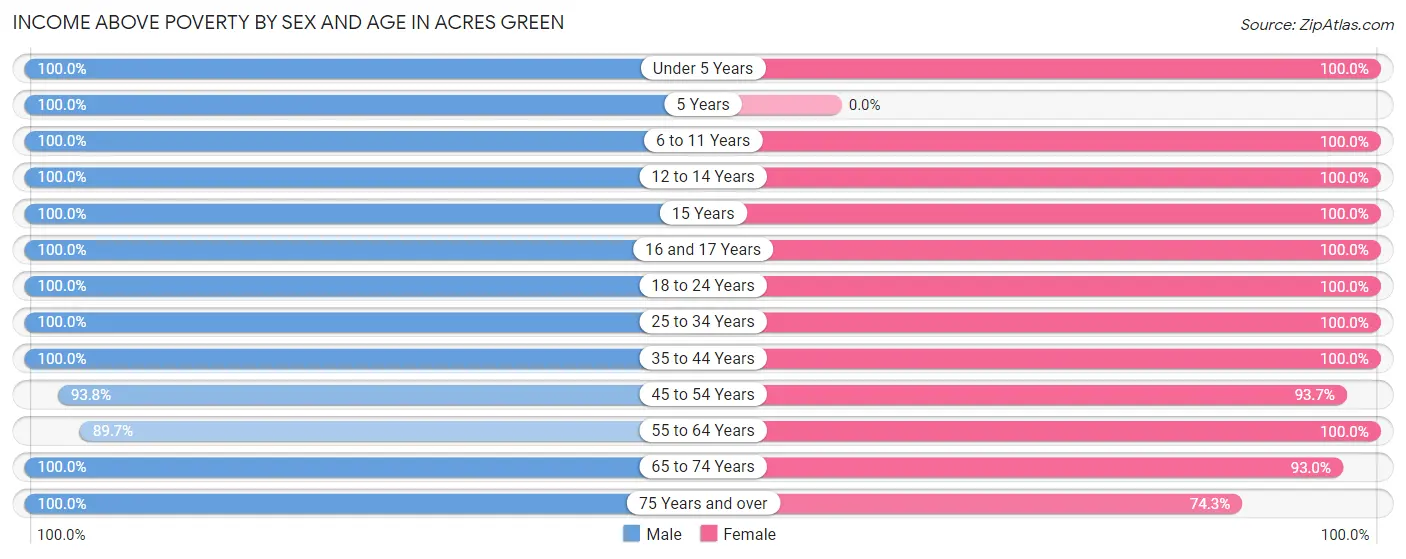
| Age Bracket | Male | Female |
| Under 5 Years | 92 (100.0%) | 46 (100.0%) |
| 5 Years | 37 (100.0%) | 0 (0.0%) |
| 6 to 11 Years | 66 (100.0%) | 65 (100.0%) |
| 12 to 14 Years | 15 (100.0%) | 37 (100.0%) |
| 15 Years | 11 (100.0%) | 25 (100.0%) |
| 16 and 17 Years | 51 (100.0%) | 89 (100.0%) |
| 18 to 24 Years | 152 (100.0%) | 101 (100.0%) |
| 25 to 34 Years | 271 (100.0%) | 134 (100.0%) |
| 35 to 44 Years | 159 (100.0%) | 209 (100.0%) |
| 45 to 54 Years | 167 (93.8%) | 134 (93.7%) |
| 55 to 64 Years | 245 (89.7%) | 136 (100.0%) |
| 65 to 74 Years | 102 (100.0%) | 146 (93.0%) |
| 75 Years and over | 43 (100.0%) | 26 (74.3%) |
| Total | 1,411 (97.3%) | 1,148 (97.5%) |
Income Below Poverty Among Married-Couple Families in Acres Green
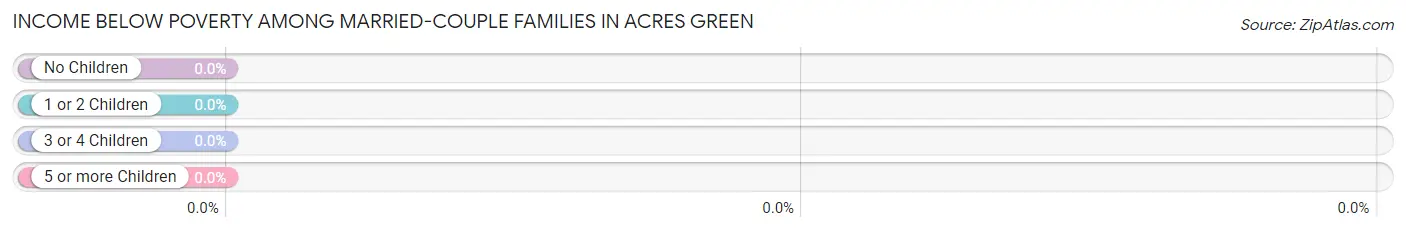
| Children | Above Poverty | Below Poverty |
| No Children | 332 (100.0%) | 0 (0.0%) |
| 1 or 2 Children | 331 (100.0%) | 0 (0.0%) |
| 3 or 4 Children | 70 (100.0%) | 0 (0.0%) |
| 5 or more Children | 4 (100.0%) | 0 (0.0%) |
| Total | 737 (100.0%) | 0 (0.0%) |
Income Below Poverty Among Single-Parent Households in Acres Green
According to the poverty data in Acres Green, 23.9% or 11 single-father households and 17.0% or 9 single-mother households are living below the poverty line. Among single-father households, those with no children have the highest poverty rate, with 11 households (28.2%) experiencing poverty. Likewise, among single-mother households, those with no children have the highest poverty rate, with 9 households (17.0%) falling below the poverty line.
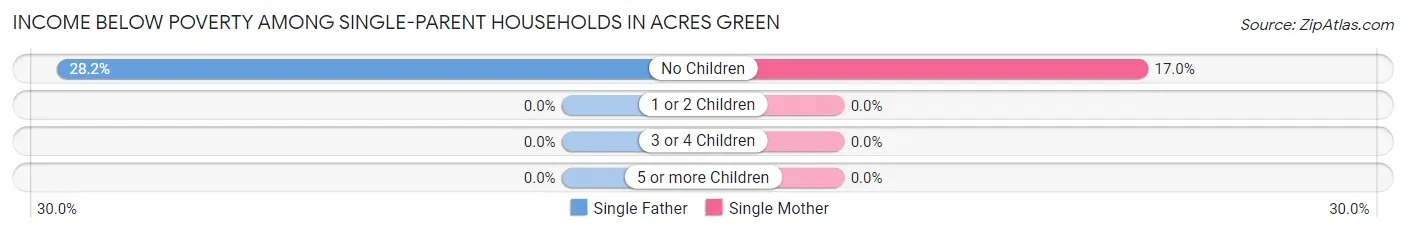
| Children | Single Father | Single Mother |
| No Children | 11 (28.2%) | 9 (17.0%) |
| 1 or 2 Children | 0 (0.0%) | 0 (0.0%) |
| 3 or 4 Children | 0 (0.0%) | 0 (0.0%) |
| 5 or more Children | 0 (0.0%) | 0 (0.0%) |
| Total | 11 (23.9%) | 9 (17.0%) |
Income Below Poverty Among Married-Couple vs Single-Parent Households in Acres Green
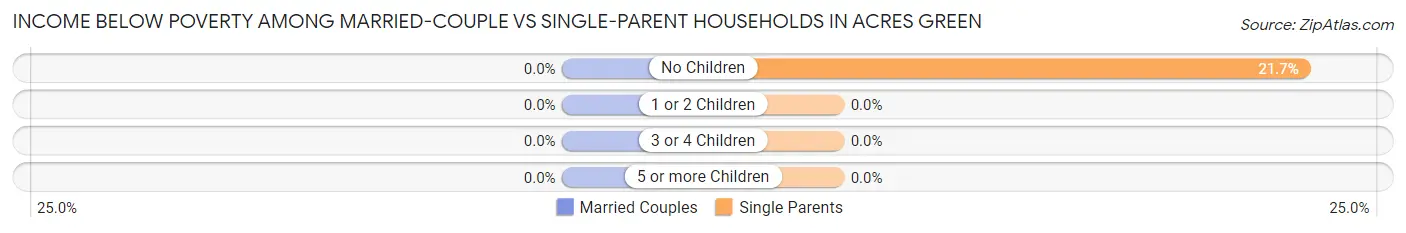
| Children | Married-Couple Families | Single-Parent Households |
| No Children | 0 (0.0%) | 20 (21.7%) |
| 1 or 2 Children | 0 (0.0%) | 0 (0.0%) |
| 3 or 4 Children | 0 (0.0%) | 0 (0.0%) |
| 5 or more Children | 0 (0.0%) | 0 (0.0%) |
| Total | 0 (0.0%) | 20 (20.2%) |
Race in Acres Green
The most populous races in Acres Green are White / Caucasian (2,155 | 82.0%), Hispanic or Latino (276 | 10.5%), and Asian (214 | 8.2%).
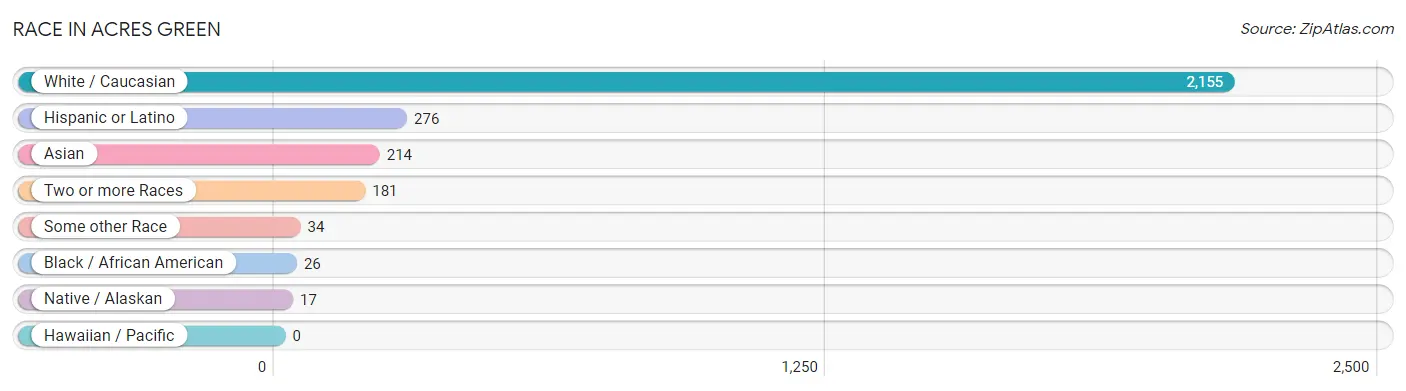
| Race | # Population | % Population |
| Asian | 214 | 8.2% |
| Black / African American | 26 | 1.0% |
| Hawaiian / Pacific | 0 | 0.0% |
| Hispanic or Latino | 276 | 10.5% |
| Native / Alaskan | 17 | 0.6% |
| White / Caucasian | 2,155 | 82.0% |
| Two or more Races | 181 | 6.9% |
| Some other Race | 34 | 1.3% |
| Total | 2,627 | 100.0% |
Ancestry in Acres Green
The most populous ancestries reported in Acres Green are German (634 | 24.1%), Irish (560 | 21.3%), English (376 | 14.3%), Mexican (265 | 10.1%), and Pakistani (132 | 5.0%), together accounting for 74.9% of all Acres Green residents.
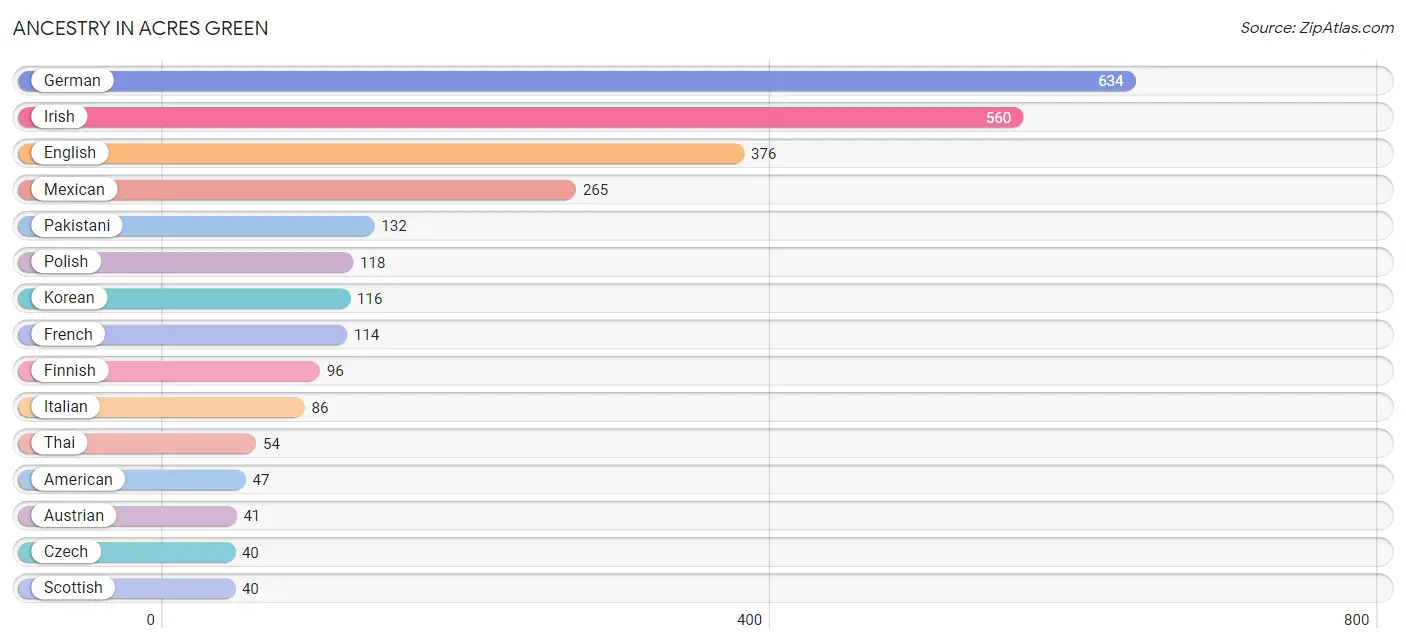
| Ancestry | # Population | % Population |
| American | 47 | 1.8% |
| Armenian | 19 | 0.7% |
| Austrian | 41 | 1.6% |
| Bhutanese | 36 | 1.4% |
| Burmese | 20 | 0.8% |
| Central American Indian | 17 | 0.6% |
| Cherokee | 9 | 0.3% |
| Czech | 40 | 1.5% |
| Danish | 18 | 0.7% |
| Eastern European | 27 | 1.0% |
| English | 376 | 14.3% |
| Estonian | 10 | 0.4% |
| European | 13 | 0.5% |
| Finnish | 96 | 3.6% |
| French | 114 | 4.3% |
| French Canadian | 14 | 0.5% |
| German | 634 | 24.1% |
| Hungarian | 8 | 0.3% |
| Irish | 560 | 21.3% |
| Italian | 86 | 3.3% |
| Korean | 116 | 4.4% |
| Lithuanian | 18 | 0.7% |
| Mexican | 265 | 10.1% |
| Northern European | 19 | 0.7% |
| Norwegian | 33 | 1.3% |
| Pakistani | 132 | 5.0% |
| Polish | 118 | 4.5% |
| Russian | 24 | 0.9% |
| Scotch-Irish | 6 | 0.2% |
| Scottish | 40 | 1.5% |
| Slovak | 16 | 0.6% |
| Swedish | 10 | 0.4% |
| Thai | 54 | 2.1% |
| Ukrainian | 18 | 0.7% | View All 34 Rows |
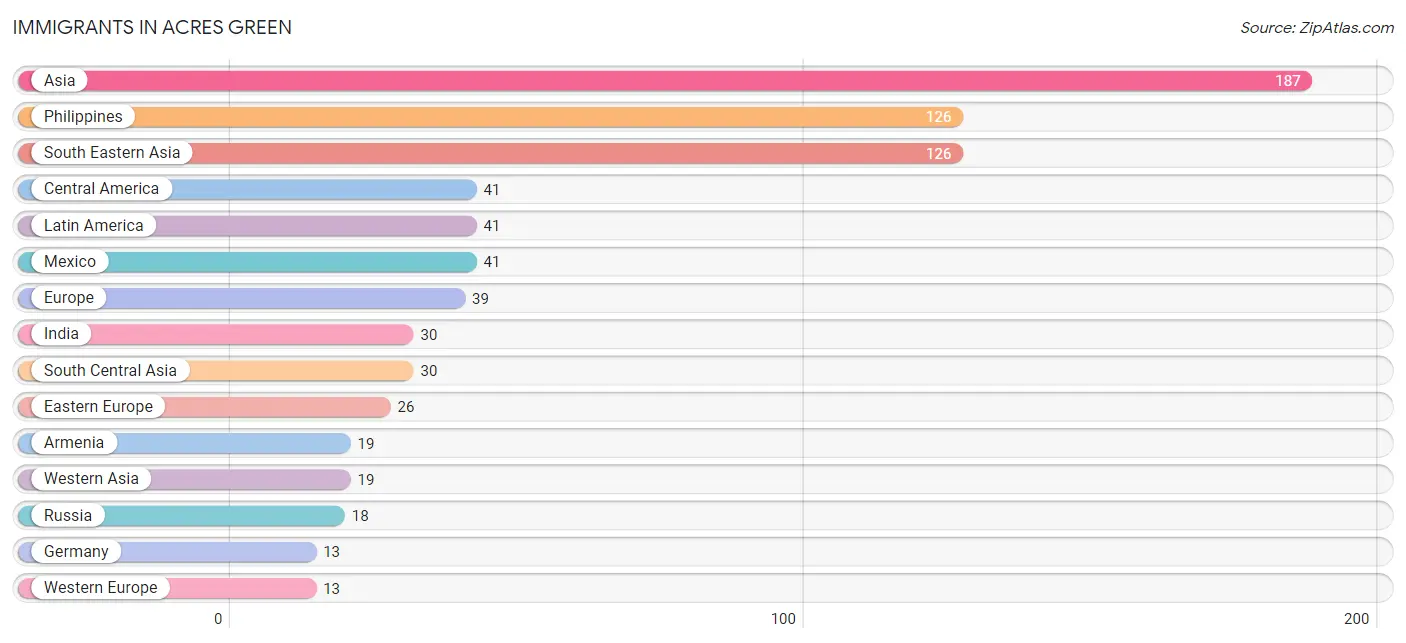
Immigrants in Acres Green
The most numerous immigrant groups reported in Acres Green came from Asia (187 | 7.1%), Philippines (126 | 4.8%), South Eastern Asia (126 | 4.8%), Central America (41 | 1.6%), and Latin America (41 | 1.6%), together accounting for 19.8% of all Acres Green residents.
| Immigration Origin | # Population | % Population |
| Armenia | 19 | 0.7% |
| Asia | 187 | 7.1% |
| Bulgaria | 8 | 0.3% |
| Canada | 10 | 0.4% |
| Central America | 41 | 1.6% |
| Eastern Asia | 7 | 0.3% |
| Eastern Europe | 26 | 1.0% |
| Europe | 39 | 1.5% |
| Germany | 13 | 0.5% |
| India | 30 | 1.1% |
| Korea | 7 | 0.3% |
| Latin America | 41 | 1.6% |
| Mexico | 41 | 1.6% |
| Philippines | 126 | 4.8% |
| Russia | 18 | 0.7% |
| South Central Asia | 30 | 1.1% |
| South Eastern Asia | 126 | 4.8% |
| Western Asia | 19 | 0.7% |
| Western Europe | 13 | 0.5% | View All 19 Rows |
Sex and Age in Acres Green
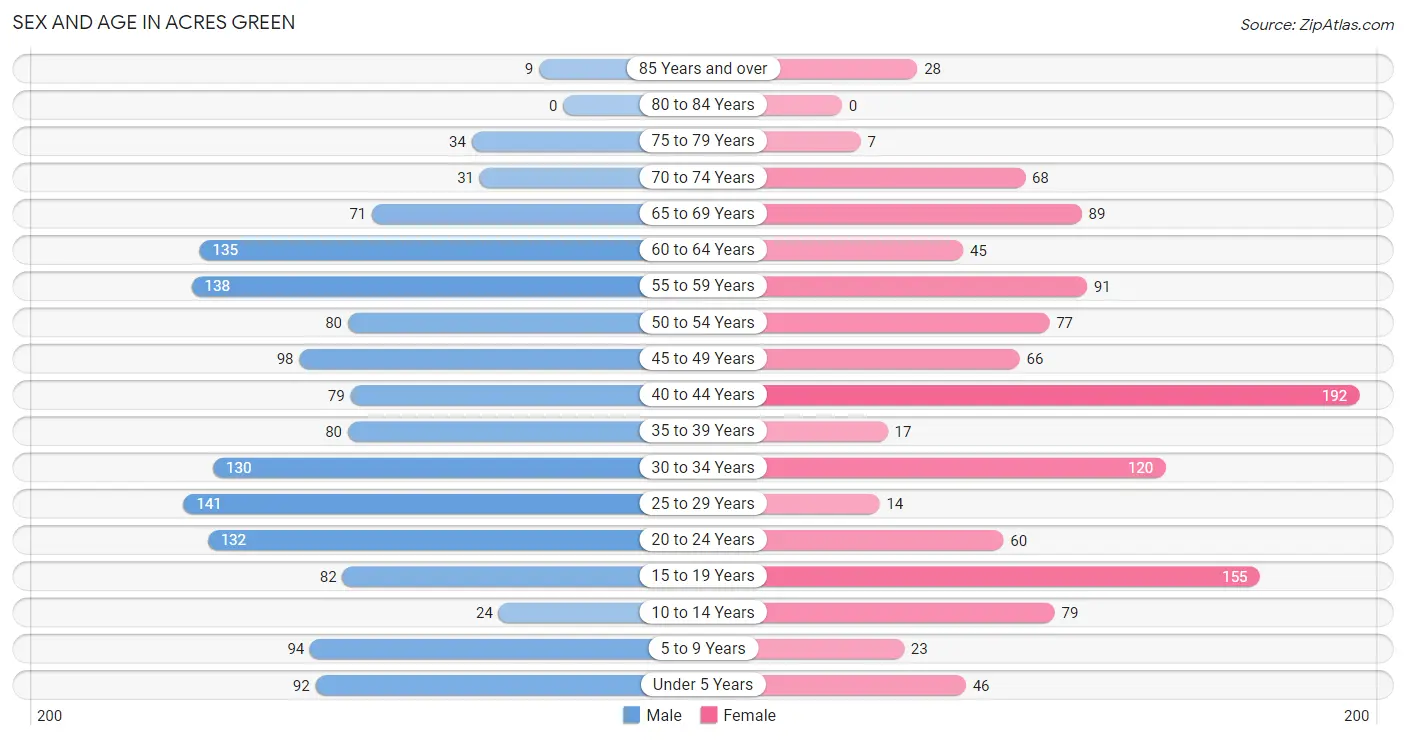
Sex and Age in Acres Green
The most populous age groups in Acres Green are 25 to 29 Years (141 | 9.7%) for men and 40 to 44 Years (192 | 16.3%) for women.
| Age Bracket | Male | Female |
| Under 5 Years | 92 (6.3%) | 46 (3.9%) |
| 5 to 9 Years | 94 (6.5%) | 23 (1.9%) |
| 10 to 14 Years | 24 (1.7%) | 79 (6.7%) |
| 15 to 19 Years | 82 (5.7%) | 155 (13.2%) |
| 20 to 24 Years | 132 (9.1%) | 60 (5.1%) |
| 25 to 29 Years | 141 (9.7%) | 14 (1.2%) |
| 30 to 34 Years | 130 (9.0%) | 120 (10.2%) |
| 35 to 39 Years | 80 (5.5%) | 17 (1.4%) |
| 40 to 44 Years | 79 (5.4%) | 192 (16.3%) |
| 45 to 49 Years | 98 (6.8%) | 66 (5.6%) |
| 50 to 54 Years | 80 (5.5%) | 77 (6.5%) |
| 55 to 59 Years | 138 (9.5%) | 91 (7.7%) |
| 60 to 64 Years | 135 (9.3%) | 45 (3.8%) |
| 65 to 69 Years | 71 (4.9%) | 89 (7.6%) |
| 70 to 74 Years | 31 (2.1%) | 68 (5.8%) |
| 75 to 79 Years | 34 (2.3%) | 7 (0.6%) |
| 80 to 84 Years | 0 (0.0%) | 0 (0.0%) |
| 85 Years and over | 9 (0.6%) | 28 (2.4%) |
| Total | 1,450 (100.0%) | 1,177 (100.0%) |
Families and Households in Acres Green
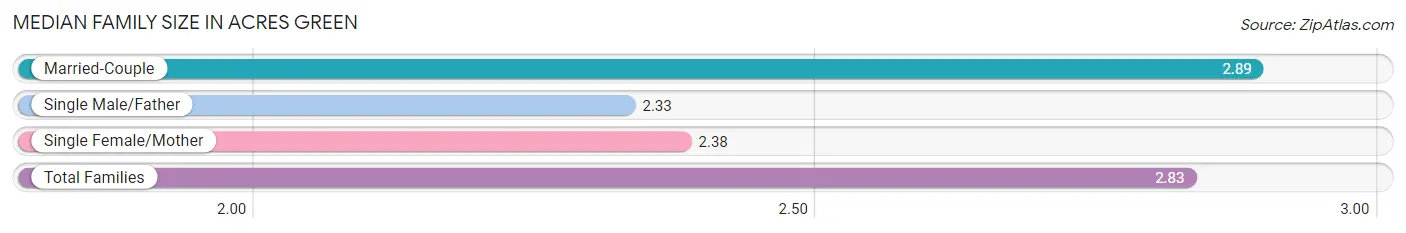
Median Family Size in Acres Green
The median family size in Acres Green is 2.83 persons per family, with married-couple families (737 | 88.2%) accounting for the largest median family size of 2.89 persons per family. On the other hand, single male/father families (46 | 5.5%) represent the smallest median family size with 2.33 persons per family.
| Family Type | # Families | Family Size |
| Married-Couple | 737 (88.2%) | 2.89 |
| Single Male/Father | 46 (5.5%) | 2.33 |
| Single Female/Mother | 53 (6.3%) | 2.38 |
| Total Families | 836 (100.0%) | 2.83 |
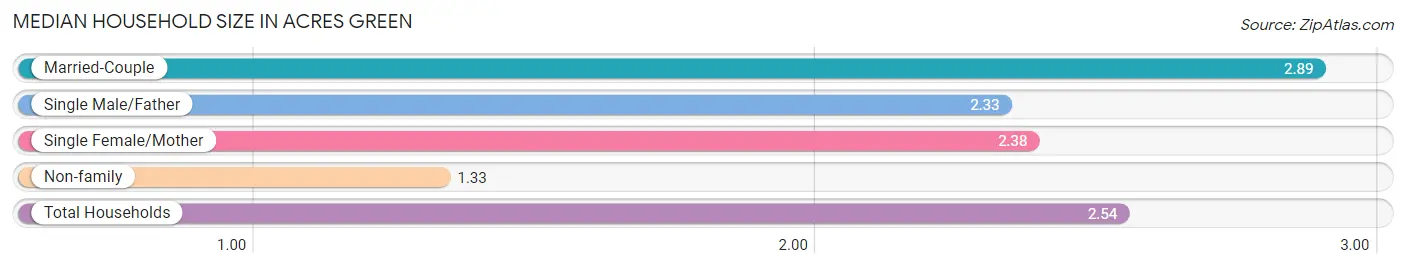
Median Household Size in Acres Green
The median household size in Acres Green is 2.54 persons per household, with married-couple households (737 | 71.2%) accounting for the largest median household size of 2.89 persons per household. non-family households (199 | 19.2%) represent the smallest median household size with 1.33 persons per household.
| Household Type | # Households | Household Size |
| Married-Couple | 737 (71.2%) | 2.89 |
| Single Male/Father | 46 (4.4%) | 2.33 |
| Single Female/Mother | 53 (5.1%) | 2.38 |
| Non-family | 199 (19.2%) | 1.33 |
| Total Households | 1,035 (100.0%) | 2.54 |
Household Size by Marriage Status in Acres Green
Out of a total of 1,035 households in Acres Green, 836 (80.8%) are family households, while 199 (19.2%) are nonfamily households. The most numerous type of family households are 2-person households, comprising 359, and the most common type of nonfamily households are 1-person households, comprising 132.
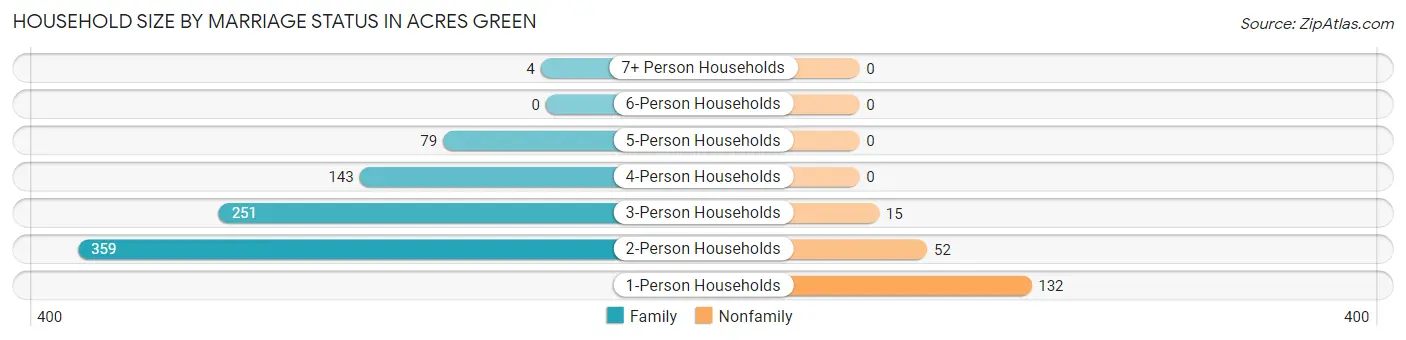
| Household Size | Family Households | Nonfamily Households |
| 1-Person Households | - | 132 (12.8%) |
| 2-Person Households | 359 (34.7%) | 52 (5.0%) |
| 3-Person Households | 251 (24.2%) | 15 (1.5%) |
| 4-Person Households | 143 (13.8%) | 0 (0.0%) |
| 5-Person Households | 79 (7.6%) | 0 (0.0%) |
| 6-Person Households | 0 (0.0%) | 0 (0.0%) |
| 7+ Person Households | 4 (0.4%) | 0 (0.0%) |
| Total | 836 (80.8%) | 199 (19.2%) |
Female Fertility in Acres Green
Fertility by Age in Acres Green
Average fertility rate in Acres Green is 74.0 births per 1,000 women. Women in the age bracket of 20 to 34 years have the highest fertility rate with 237.0 births per 1,000 women. Women in the age bracket of 20 to 34 years acount for 100.0% of all women with births.
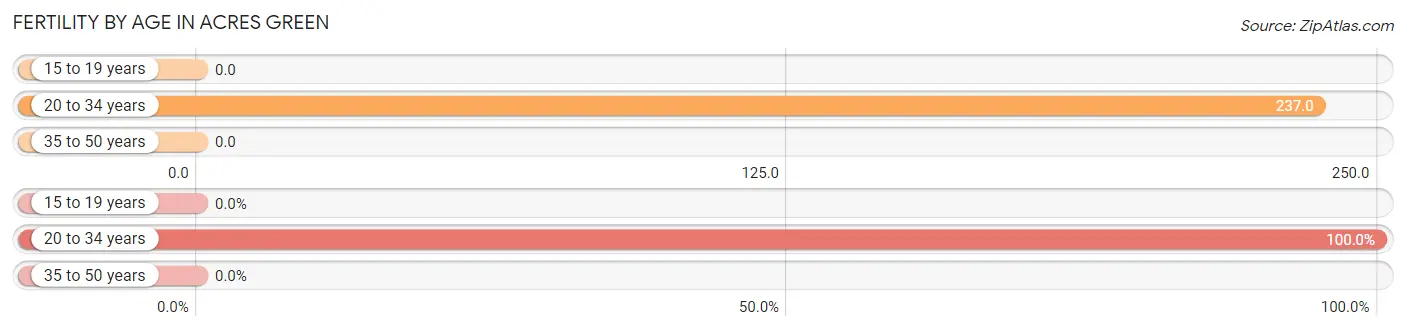
| Age Bracket | Women with Births | Births / 1,000 Women |
| 15 to 19 years | 0 (0.0%) | 0.0 |
| 20 to 34 years | 46 (100.0%) | 237.0 |
| 35 to 50 years | 0 (0.0%) | 0.0 |
| Total | 46 (100.0%) | 74.0 |
Fertility by Age by Marriage Status in Acres Green
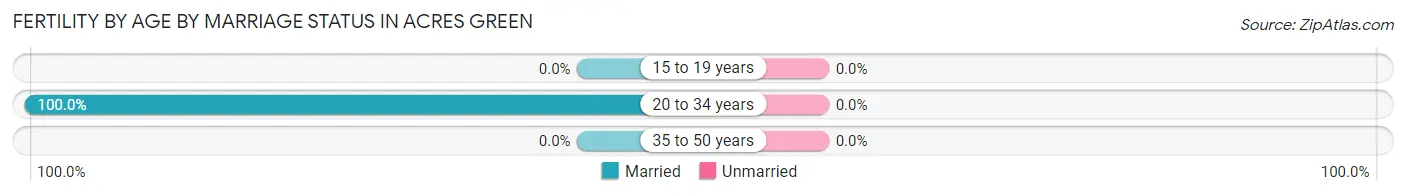
| Age Bracket | Married | Unmarried |
| 15 to 19 years | 0 (0.0%) | 0 (0.0%) |
| 20 to 34 years | 46 (100.0%) | 0 (0.0%) |
| 35 to 50 years | 0 (0.0%) | 0 (0.0%) |
| Total | 46 (100.0%) | 0 (0.0%) |
Fertility by Education in Acres Green
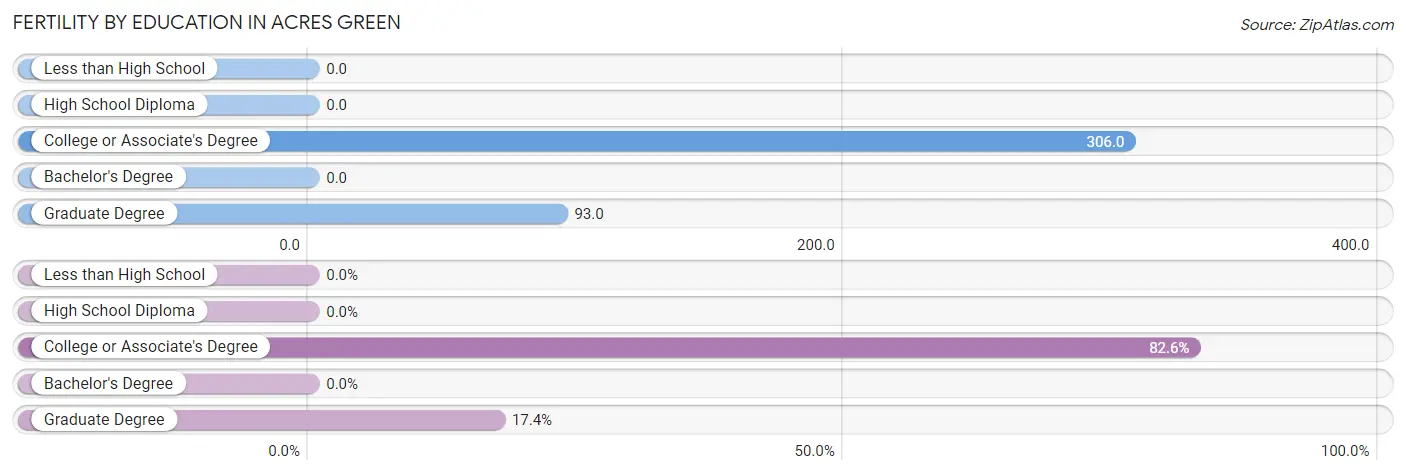
| Educational Attainment | Women with Births | Births / 1,000 Women |
| Less than High School | 0 (0.0%) | 0.0 |
| High School Diploma | 0 (0.0%) | 0.0 |
| College or Associate's Degree | 38 (82.6%) | 306.0 |
| Bachelor's Degree | 0 (0.0%) | 0.0 |
| Graduate Degree | 8 (17.4%) | 93.0 |
| Total | 46 (100.0%) | 74.0 |
Fertility by Education by Marriage Status in Acres Green
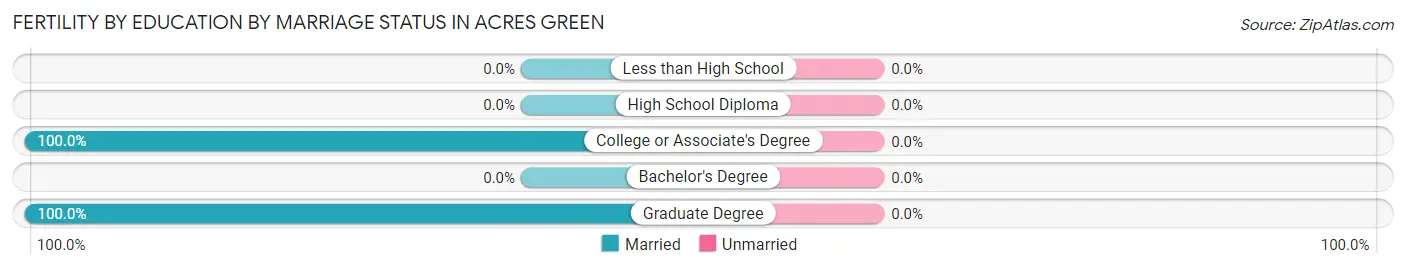
| Educational Attainment | Married | Unmarried |
| Less than High School | 0 (0.0%) | 0 (0.0%) |
| High School Diploma | 0 (0.0%) | 0 (0.0%) |
| College or Associate's Degree | 38 (100.0%) | 0 (0.0%) |
| Bachelor's Degree | 0 (0.0%) | 0 (0.0%) |
| Graduate Degree | 8 (100.0%) | 0 (0.0%) |
| Total | 46 (100.0%) | 0 (0.0%) |
Employment Characteristics in Acres Green
Employment by Class of Employer in Acres Green
Among the 1,652 employed individuals in Acres Green, private company employees (1,147 | 69.4%), self-employed (not incorporated) (194 | 11.7%), and local government employees (111 | 6.7%) make up the most common classes of employment.
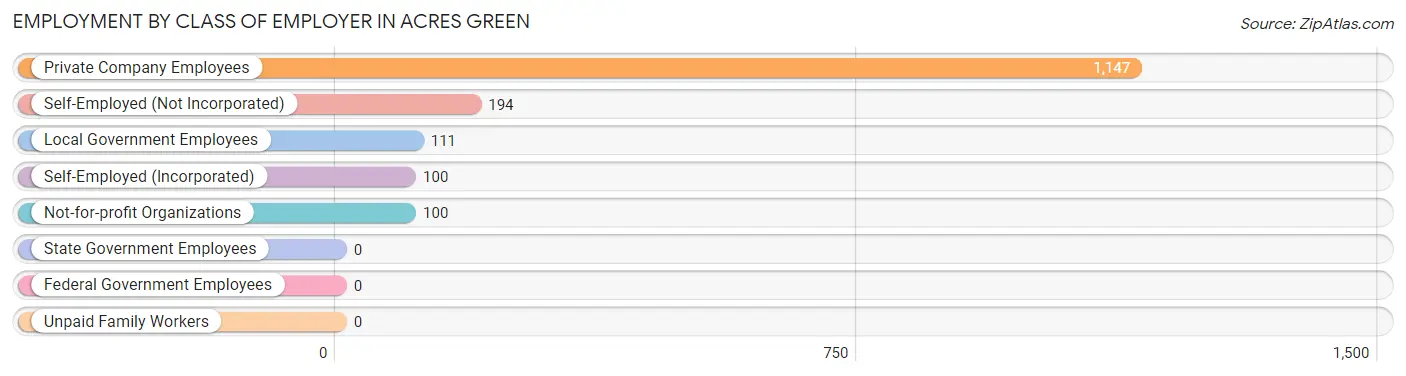
| Employer Class | # Employees | % Employees |
| Private Company Employees | 1,147 | 69.4% |
| Self-Employed (Incorporated) | 100 | 6.0% |
| Self-Employed (Not Incorporated) | 194 | 11.7% |
| Not-for-profit Organizations | 100 | 6.0% |
| Local Government Employees | 111 | 6.7% |
| State Government Employees | 0 | 0.0% |
| Federal Government Employees | 0 | 0.0% |
| Unpaid Family Workers | 0 | 0.0% |
| Total | 1,652 | 100.0% |
Employment Status by Age in Acres Green
According to the labor force statistics for Acres Green, out of the total population over 16 years of age (2,233), 76.7% or 1,713 individuals are in the labor force, with 1.1% or 19 of them unemployed. The age group with the highest labor force participation rate is 25 to 29 years, with 94.8% or 147 individuals in the labor force. Within the labor force, the 30 to 34 years age range has the highest percentage of unemployed individuals, with 3.7% or 8 of them being unemployed.
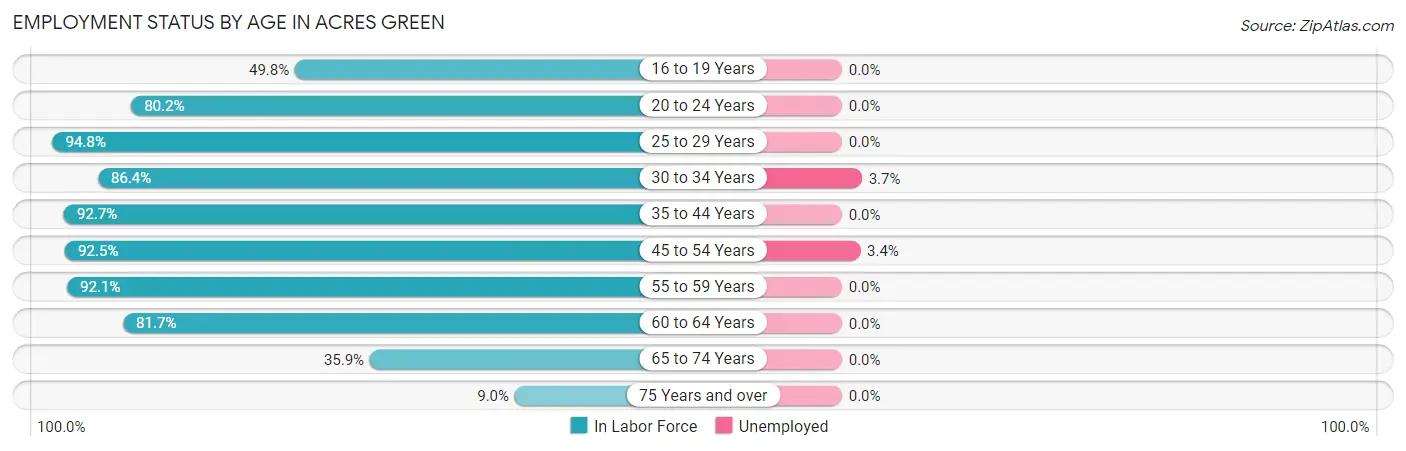
| Age Bracket | In Labor Force | Unemployed |
| 16 to 19 Years | 100 (49.8%) | 0 (0.0%) |
| 20 to 24 Years | 154 (80.2%) | 0 (0.0%) |
| 25 to 29 Years | 147 (94.8%) | 0 (0.0%) |
| 30 to 34 Years | 216 (86.4%) | 8 (3.7%) |
| 35 to 44 Years | 341 (92.7%) | 0 (0.0%) |
| 45 to 54 Years | 297 (92.5%) | 10 (3.4%) |
| 55 to 59 Years | 211 (92.1%) | 0 (0.0%) |
| 60 to 64 Years | 147 (81.7%) | 0 (0.0%) |
| 65 to 74 Years | 93 (35.9%) | 0 (0.0%) |
| 75 Years and over | 7 (9.0%) | 0 (0.0%) |
| Total | 1,713 (76.7%) | 19 (1.1%) |
Employment Status by Educational Attainment in Acres Green
According to labor force statistics for Acres Green, 90.4% of individuals (1,359) out of the total population between 25 and 64 years of age (1,503) are in the labor force, with 1.3% or 18 of them being unemployed. The group with the highest labor force participation rate are those with the educational attainment of college / associate degree, with 97.6% or 478 individuals in the labor force. Within the labor force, individuals with college / associate degree education have the highest percentage of unemployment, with 3.8% or 18 of them being unemployed.
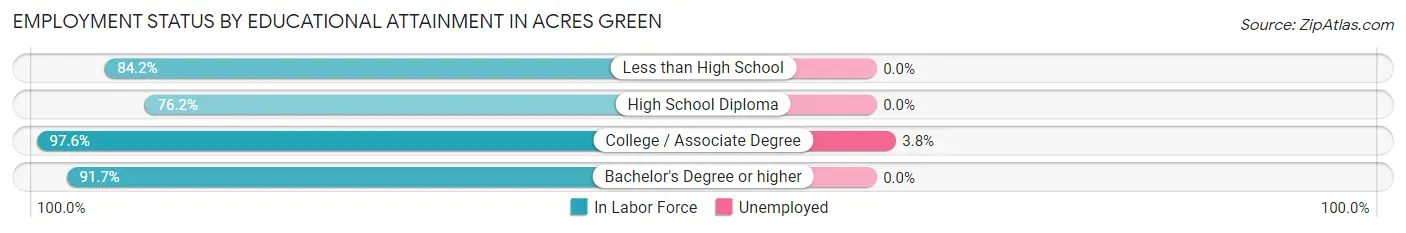
| Educational Attainment | In Labor Force | Unemployed |
| Less than High School | 48 (84.2%) | 0 (0.0%) |
| High School Diploma | 215 (76.2%) | 0 (0.0%) |
| College / Associate Degree | 478 (97.6%) | 19 (3.8%) |
| Bachelor's Degree or higher | 618 (91.7%) | 0 (0.0%) |
| Total | 1,359 (90.4%) | 20 (1.3%) |
Employment Occupations by Sex in Acres Green
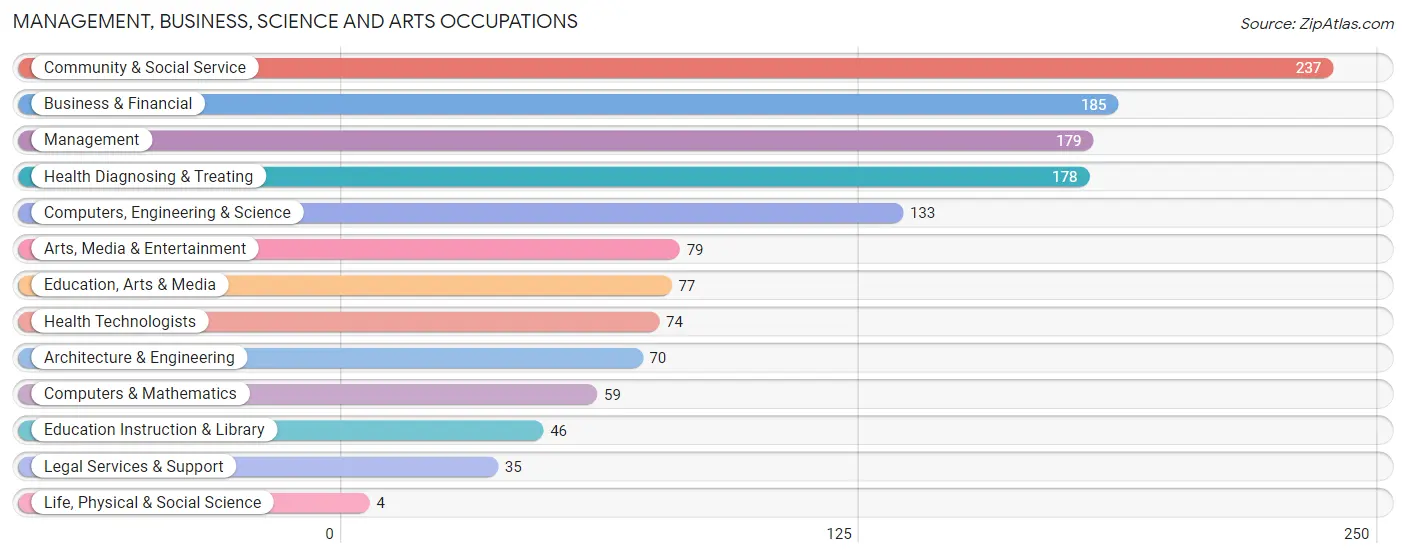
Management, Business, Science and Arts Occupations
The most common Management, Business, Science and Arts occupations in Acres Green are Community & Social Service (237 | 14.0%), Business & Financial (185 | 10.9%), Management (179 | 10.6%), Health Diagnosing & Treating (178 | 10.5%), and Computers, Engineering & Science (133 | 7.9%).
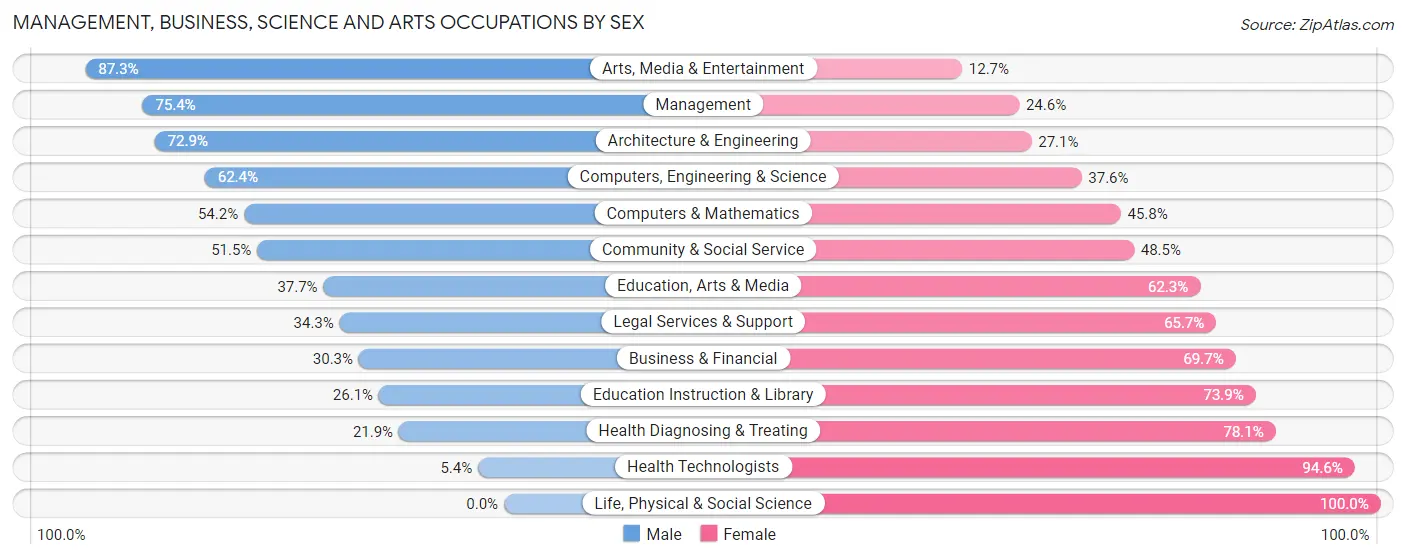
Management, Business, Science and Arts Occupations by Sex
Within the Management, Business, Science and Arts occupations in Acres Green, the most male-oriented occupations are Arts, Media & Entertainment (87.3%), Management (75.4%), and Architecture & Engineering (72.9%), while the most female-oriented occupations are Life, Physical & Social Science (100.0%), Health Technologists (94.6%), and Health Diagnosing & Treating (78.1%).
| Occupation | Male | Female |
| Management | 135 (75.4%) | 44 (24.6%) |
| Business & Financial | 56 (30.3%) | 129 (69.7%) |
| Computers, Engineering & Science | 83 (62.4%) | 50 (37.6%) |
| Computers & Mathematics | 32 (54.2%) | 27 (45.8%) |
| Architecture & Engineering | 51 (72.9%) | 19 (27.1%) |
| Life, Physical & Social Science | 0 (0.0%) | 4 (100.0%) |
| Community & Social Service | 122 (51.5%) | 115 (48.5%) |
| Education, Arts & Media | 29 (37.7%) | 48 (62.3%) |
| Legal Services & Support | 12 (34.3%) | 23 (65.7%) |
| Education Instruction & Library | 12 (26.1%) | 34 (73.9%) |
| Arts, Media & Entertainment | 69 (87.3%) | 10 (12.7%) |
| Health Diagnosing & Treating | 39 (21.9%) | 139 (78.1%) |
| Health Technologists | 4 (5.4%) | 70 (94.6%) |
| Total (Category) | 435 (47.7%) | 477 (52.3%) |
| Total (Overall) | 1,004 (59.2%) | 691 (40.8%) |
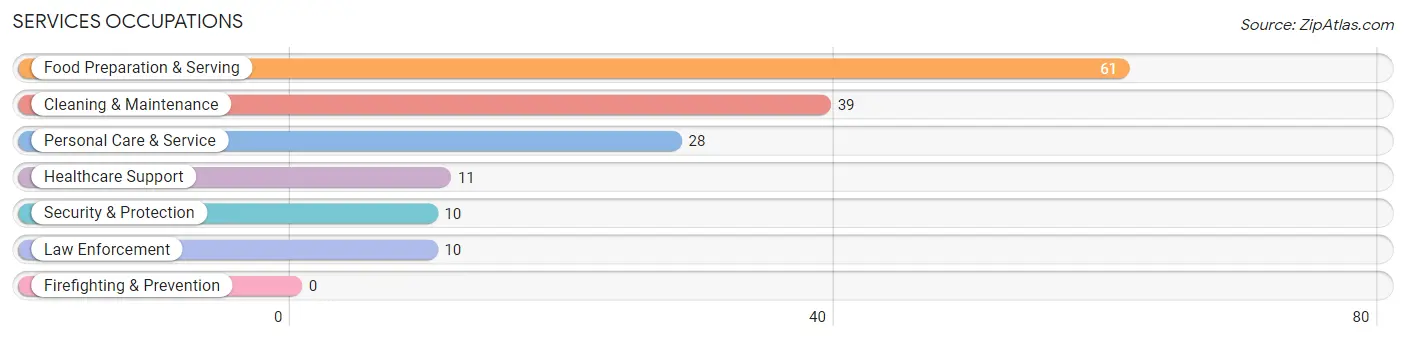
Services Occupations
The most common Services occupations in Acres Green are Food Preparation & Serving (61 | 3.6%), Cleaning & Maintenance (39 | 2.3%), Personal Care & Service (28 | 1.7%), Healthcare Support (11 | 0.6%), and Security & Protection (10 | 0.6%).
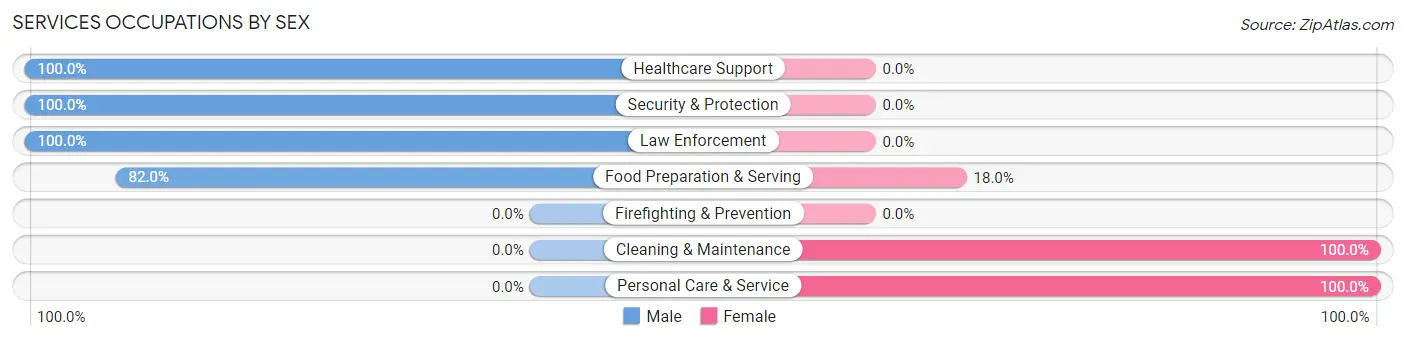
Services Occupations by Sex
Within the Services occupations in Acres Green, the most male-oriented occupations are Healthcare Support (100.0%), Security & Protection (100.0%), and Law Enforcement (100.0%), while the most female-oriented occupations are Cleaning & Maintenance (100.0%), Personal Care & Service (100.0%), and Food Preparation & Serving (18.0%).
| Occupation | Male | Female |
| Healthcare Support | 11 (100.0%) | 0 (0.0%) |
| Security & Protection | 10 (100.0%) | 0 (0.0%) |
| Firefighting & Prevention | 0 (0.0%) | 0 (0.0%) |
| Law Enforcement | 10 (100.0%) | 0 (0.0%) |
| Food Preparation & Serving | 50 (82.0%) | 11 (18.0%) |
| Cleaning & Maintenance | 0 (0.0%) | 39 (100.0%) |
| Personal Care & Service | 0 (0.0%) | 28 (100.0%) |
| Total (Category) | 71 (47.6%) | 78 (52.3%) |
| Total (Overall) | 1,004 (59.2%) | 691 (40.8%) |
Sales and Office Occupations
The most common Sales and Office occupations in Acres Green are Sales & Related (205 | 12.1%), and Office & Administration (143 | 8.4%).
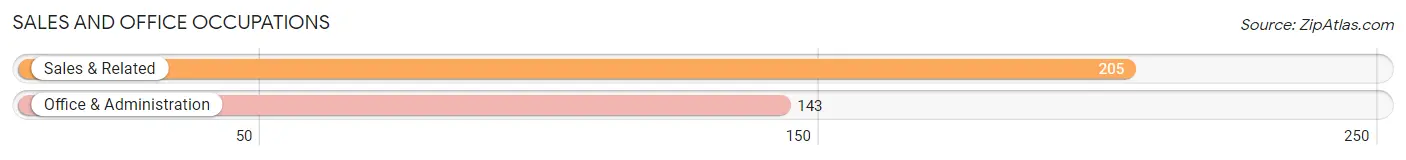
Sales and Office Occupations by Sex
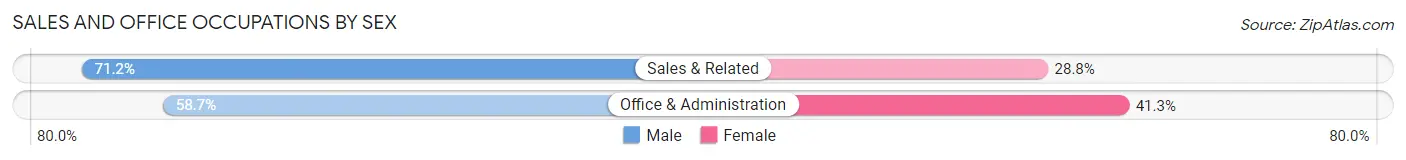
| Occupation | Male | Female |
| Sales & Related | 146 (71.2%) | 59 (28.8%) |
| Office & Administration | 84 (58.7%) | 59 (41.3%) |
| Total (Category) | 230 (66.1%) | 118 (33.9%) |
| Total (Overall) | 1,004 (59.2%) | 691 (40.8%) |
Natural Resources, Construction and Maintenance Occupations
The most common Natural Resources, Construction and Maintenance occupations in Acres Green are Installation, Maintenance & Repair (86 | 5.1%), and Construction & Extraction (42 | 2.5%).
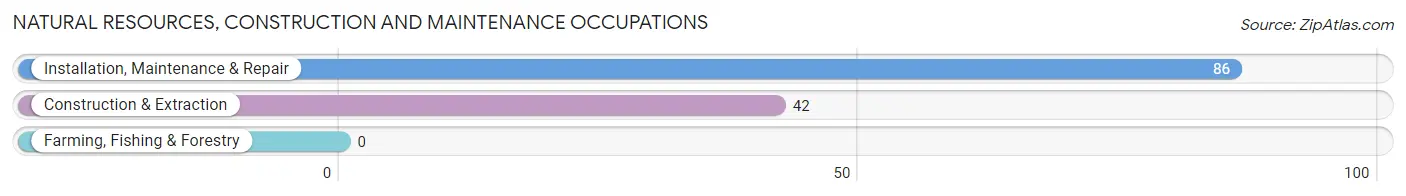
Natural Resources, Construction and Maintenance Occupations by Sex
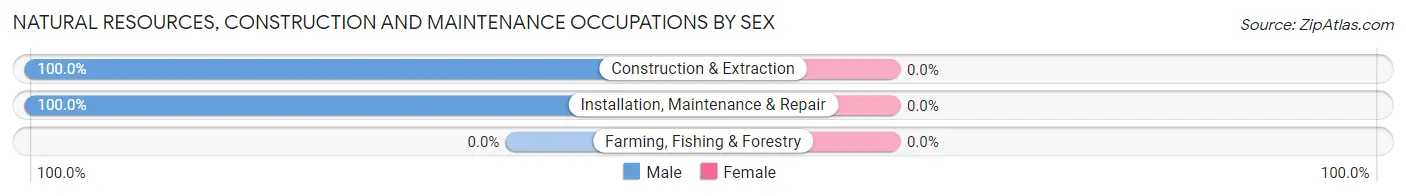
| Occupation | Male | Female |
| Farming, Fishing & Forestry | 0 (0.0%) | 0 (0.0%) |
| Construction & Extraction | 42 (100.0%) | 0 (0.0%) |
| Installation, Maintenance & Repair | 86 (100.0%) | 0 (0.0%) |
| Total (Category) | 128 (100.0%) | 0 (0.0%) |
| Total (Overall) | 1,004 (59.2%) | 691 (40.8%) |
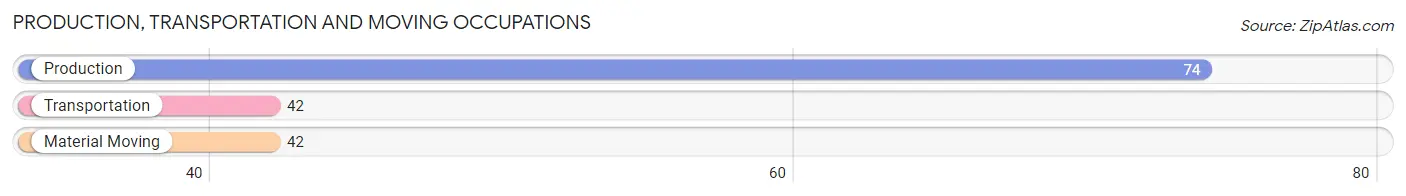
Production, Transportation and Moving Occupations
The most common Production, Transportation and Moving occupations in Acres Green are Production (74 | 4.4%), Transportation (42 | 2.5%), and Material Moving (42 | 2.5%).
Production, Transportation and Moving Occupations by Sex
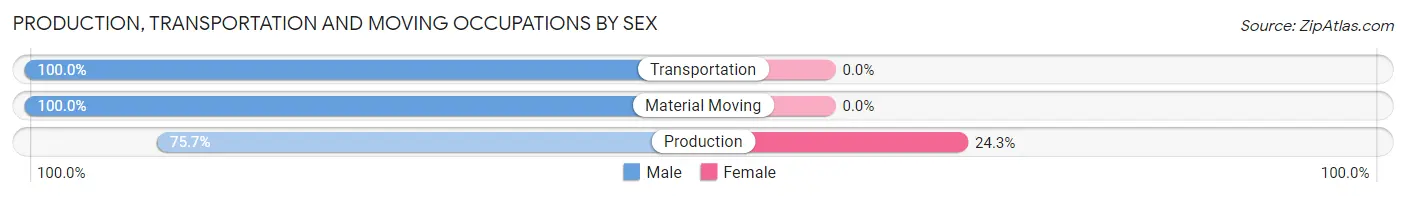
| Occupation | Male | Female |
| Production | 56 (75.7%) | 18 (24.3%) |
| Transportation | 42 (100.0%) | 0 (0.0%) |
| Material Moving | 42 (100.0%) | 0 (0.0%) |
| Total (Category) | 140 (88.6%) | 18 (11.4%) |
| Total (Overall) | 1,004 (59.2%) | 691 (40.8%) |
Employment Industries by Sex in Acres Green
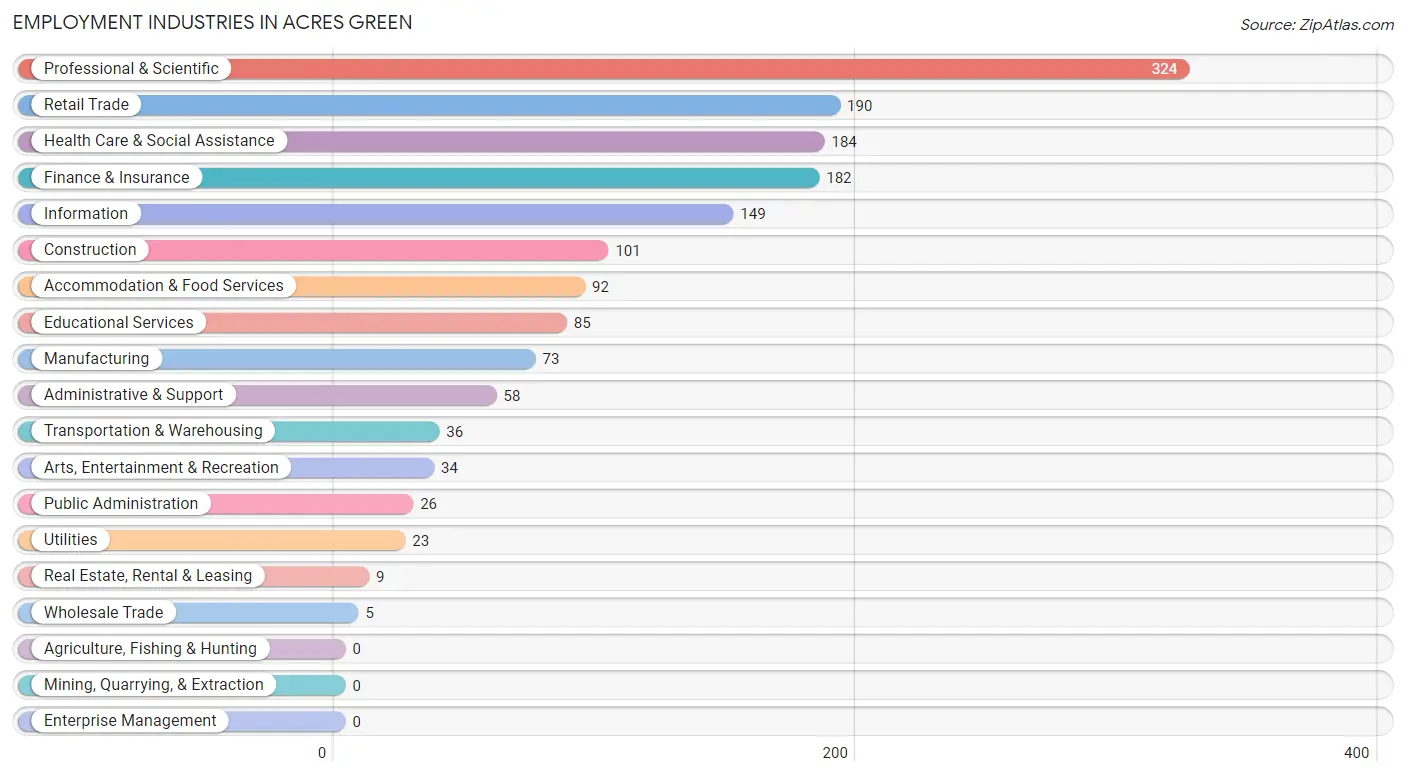
Employment Industries in Acres Green
The major employment industries in Acres Green include Professional & Scientific (324 | 19.1%), Retail Trade (190 | 11.2%), Health Care & Social Assistance (184 | 10.9%), Finance & Insurance (182 | 10.7%), and Information (149 | 8.8%).
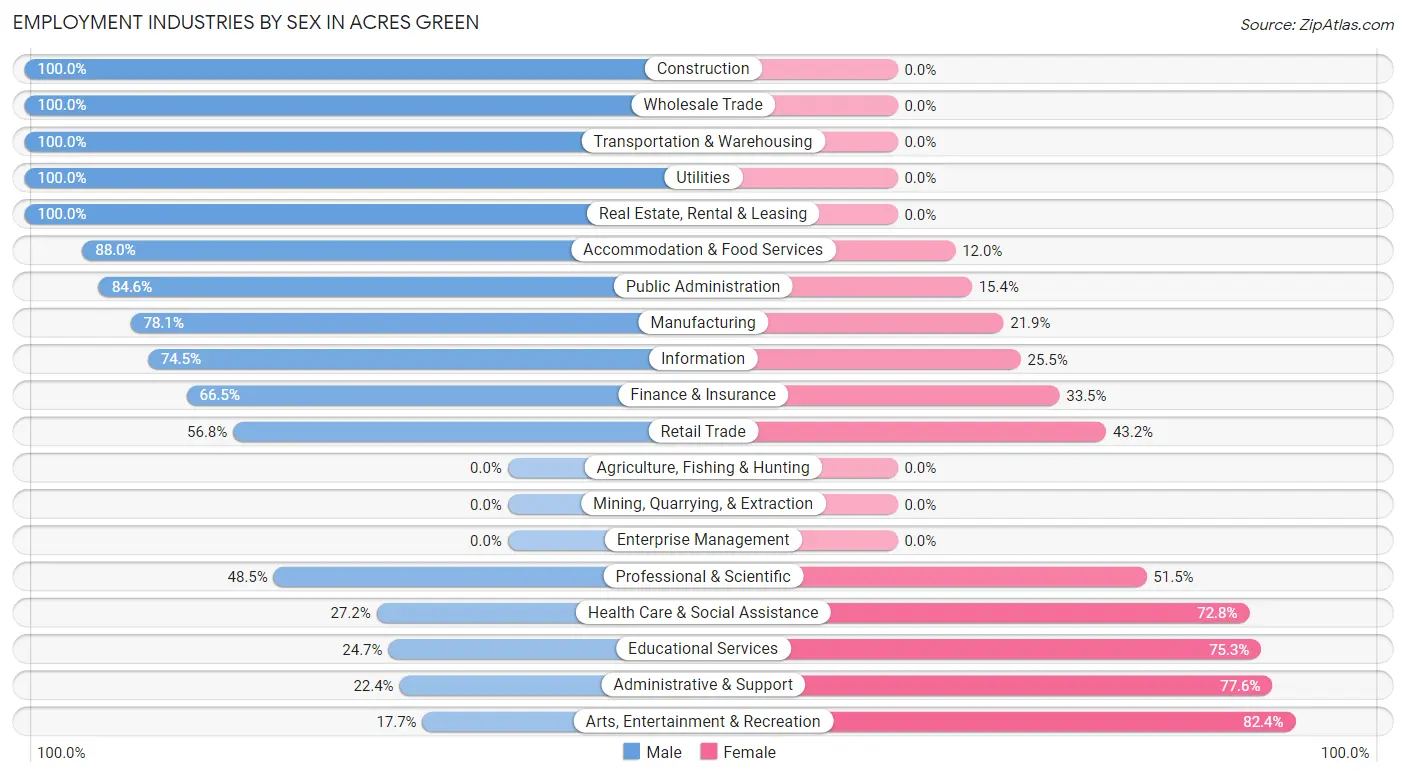
Employment Industries by Sex in Acres Green
The Acres Green industries that see more men than women are Construction (100.0%), Wholesale Trade (100.0%), and Transportation & Warehousing (100.0%), whereas the industries that tend to have a higher number of women are Arts, Entertainment & Recreation (82.4%), Administrative & Support (77.6%), and Educational Services (75.3%).
| Industry | Male | Female |
| Agriculture, Fishing & Hunting | 0 (0.0%) | 0 (0.0%) |
| Mining, Quarrying, & Extraction | 0 (0.0%) | 0 (0.0%) |
| Construction | 101 (100.0%) | 0 (0.0%) |
| Manufacturing | 57 (78.1%) | 16 (21.9%) |
| Wholesale Trade | 5 (100.0%) | 0 (0.0%) |
| Retail Trade | 108 (56.8%) | 82 (43.2%) |
| Transportation & Warehousing | 36 (100.0%) | 0 (0.0%) |
| Utilities | 23 (100.0%) | 0 (0.0%) |
| Information | 111 (74.5%) | 38 (25.5%) |
| Finance & Insurance | 121 (66.5%) | 61 (33.5%) |
| Real Estate, Rental & Leasing | 9 (100.0%) | 0 (0.0%) |
| Professional & Scientific | 157 (48.5%) | 167 (51.5%) |
| Enterprise Management | 0 (0.0%) | 0 (0.0%) |
| Administrative & Support | 13 (22.4%) | 45 (77.6%) |
| Educational Services | 21 (24.7%) | 64 (75.3%) |
| Health Care & Social Assistance | 50 (27.2%) | 134 (72.8%) |
| Arts, Entertainment & Recreation | 6 (17.6%) | 28 (82.4%) |
| Accommodation & Food Services | 81 (88.0%) | 11 (12.0%) |
| Public Administration | 22 (84.6%) | 4 (15.4%) |
| Total | 1,004 (59.2%) | 691 (40.8%) |
Education in Acres Green
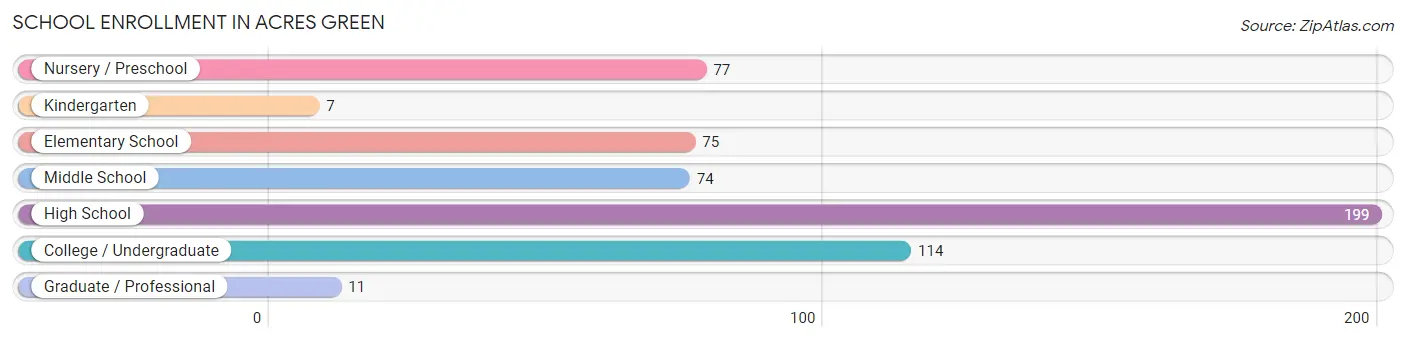
School Enrollment in Acres Green
The most common levels of schooling among the 557 students in Acres Green are high school (199 | 35.7%), college / undergraduate (114 | 20.5%), and nursery / preschool (77 | 13.8%).
| School Level | # Students | % Students |
| Nursery / Preschool | 77 | 13.8% |
| Kindergarten | 7 | 1.3% |
| Elementary School | 75 | 13.5% |
| Middle School | 74 | 13.3% |
| High School | 199 | 35.7% |
| College / Undergraduate | 114 | 20.5% |
| Graduate / Professional | 11 | 2.0% |
| Total | 557 | 100.0% |
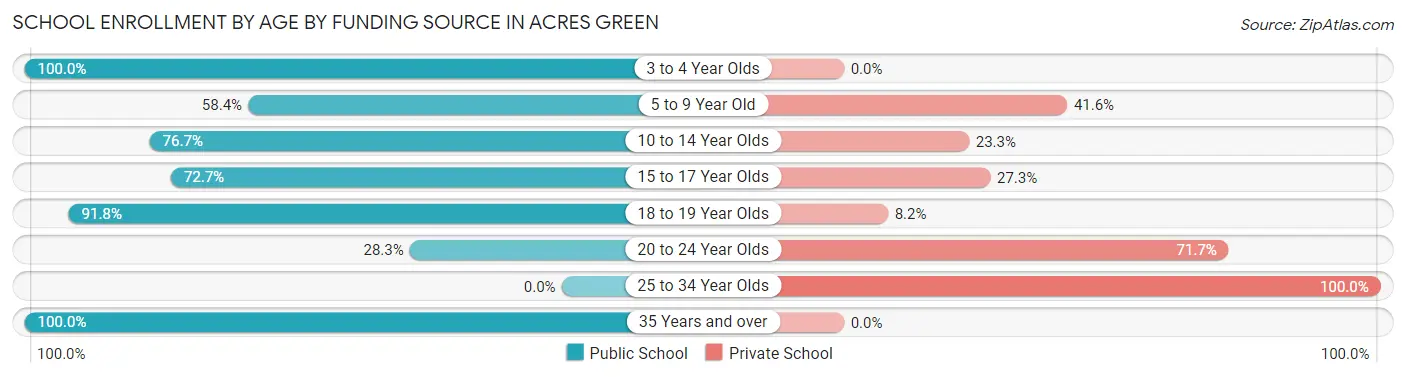
School Enrollment by Age by Funding Source in Acres Green
Out of a total of 557 students who are enrolled in schools in Acres Green, 167 (30.0%) attend a private institution, while the remaining 390 (70.0%) are enrolled in public schools. The age group of 25 to 34 year olds has the highest likelihood of being enrolled in private schools, with 5 (100.0% in the age bracket) enrolled. Conversely, the age group of 3 to 4 year olds has the lowest likelihood of being enrolled in a private school, with 40 (100.0% in the age bracket) attending a public institution.
| Age Bracket | Public School | Private School |
| 3 to 4 Year Olds | 40 (100.0%) | 0 (0.0%) |
| 5 to 9 Year Old | 66 (58.4%) | 47 (41.6%) |
| 10 to 14 Year Olds | 79 (76.7%) | 24 (23.3%) |
| 15 to 17 Year Olds | 128 (72.7%) | 48 (27.3%) |
| 18 to 19 Year Olds | 56 (91.8%) | 5 (8.2%) |
| 20 to 24 Year Olds | 15 (28.3%) | 38 (71.7%) |
| 25 to 34 Year Olds | 0 (0.0%) | 5 (100.0%) |
| 35 Years and over | 6 (100.0%) | 0 (0.0%) |
| Total | 390 (70.0%) | 167 (30.0%) |
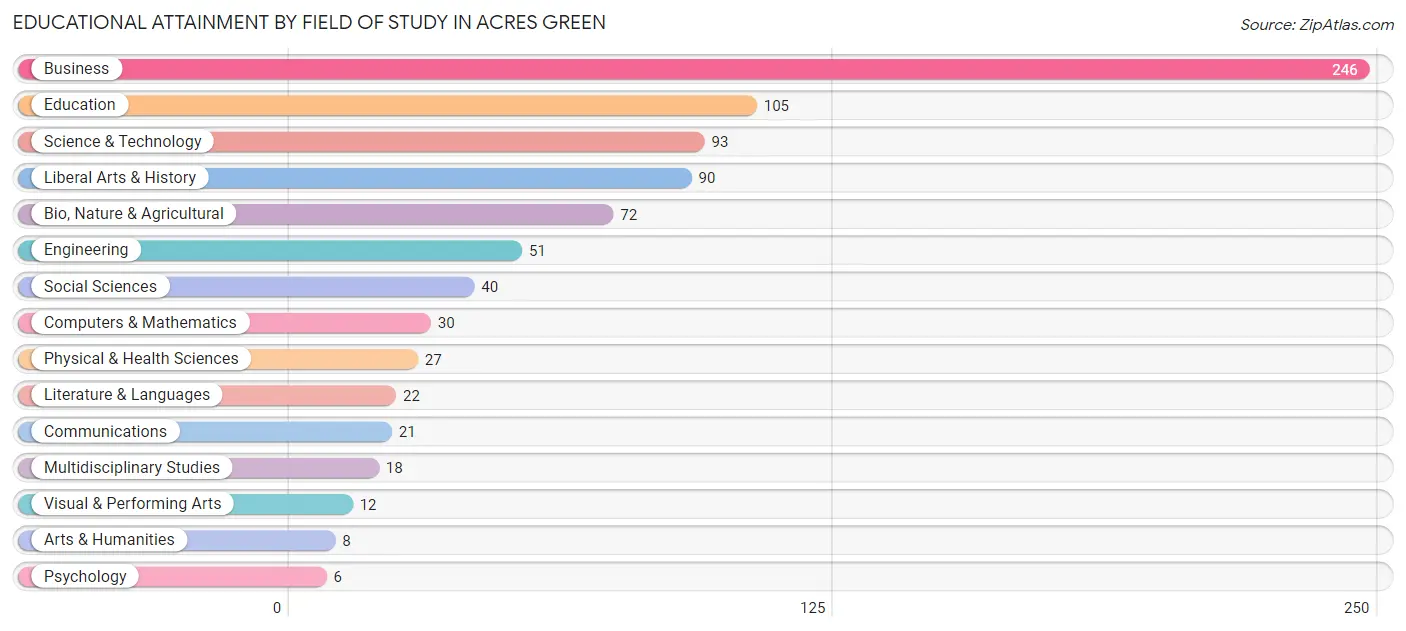
Educational Attainment by Field of Study in Acres Green
Business (246 | 29.2%), education (105 | 12.5%), science & technology (93 | 11.1%), liberal arts & history (90 | 10.7%), and bio, nature & agricultural (72 | 8.6%) are the most common fields of study among 841 individuals in Acres Green who have obtained a bachelor's degree or higher.
| Field of Study | # Graduates | % Graduates |
| Computers & Mathematics | 30 | 3.6% |
| Bio, Nature & Agricultural | 72 | 8.6% |
| Physical & Health Sciences | 27 | 3.2% |
| Psychology | 6 | 0.7% |
| Social Sciences | 40 | 4.8% |
| Engineering | 51 | 6.1% |
| Multidisciplinary Studies | 18 | 2.1% |
| Science & Technology | 93 | 11.1% |
| Business | 246 | 29.2% |
| Education | 105 | 12.5% |
| Literature & Languages | 22 | 2.6% |
| Liberal Arts & History | 90 | 10.7% |
| Visual & Performing Arts | 12 | 1.4% |
| Communications | 21 | 2.5% |
| Arts & Humanities | 8 | 0.9% |
| Total | 841 | 100.0% |
Transportation & Commute in Acres Green
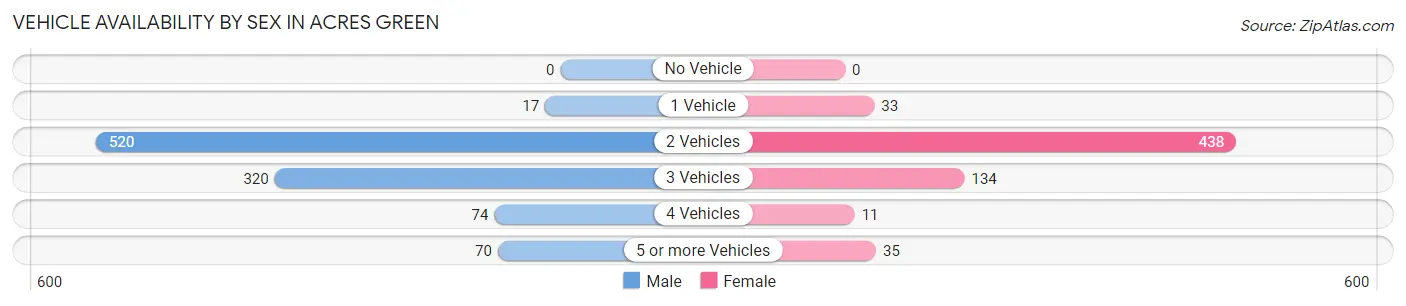
Vehicle Availability by Sex in Acres Green
The most prevalent vehicle ownership categories in Acres Green are males with 2 vehicles (520, accounting for 51.9%) and females with 2 vehicles (438, making up 79.9%).
| Vehicles Available | Male | Female |
| No Vehicle | 0 (0.0%) | 0 (0.0%) |
| 1 Vehicle | 17 (1.7%) | 33 (5.1%) |
| 2 Vehicles | 520 (51.9%) | 438 (67.3%) |
| 3 Vehicles | 320 (32.0%) | 134 (20.6%) |
| 4 Vehicles | 74 (7.4%) | 11 (1.7%) |
| 5 or more Vehicles | 70 (7.0%) | 35 (5.4%) |
| Total | 1,001 (100.0%) | 651 (100.0%) |
Commute Time in Acres Green
The most frequently occuring commute durations in Acres Green are 15 to 19 minutes (300 commuters, 24.3%), 5 to 9 minutes (186 commuters, 15.0%), and 20 to 24 minutes (168 commuters, 13.6%).
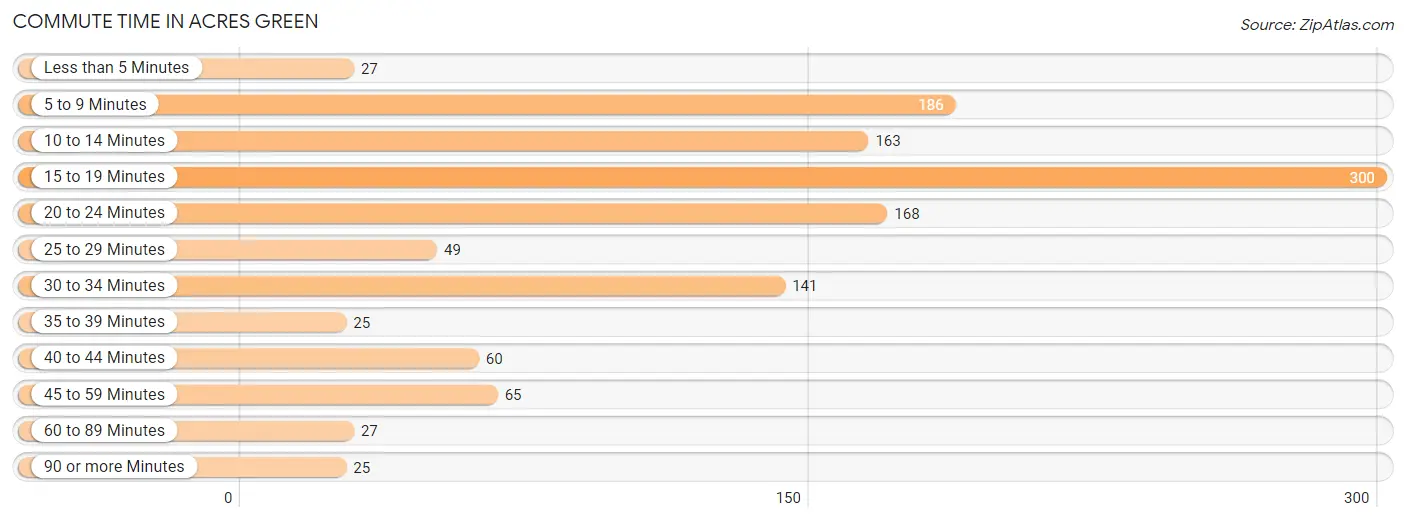
| Commute Time | # Commuters | % Commuters |
| Less than 5 Minutes | 27 | 2.2% |
| 5 to 9 Minutes | 186 | 15.0% |
| 10 to 14 Minutes | 163 | 13.2% |
| 15 to 19 Minutes | 300 | 24.3% |
| 20 to 24 Minutes | 168 | 13.6% |
| 25 to 29 Minutes | 49 | 4.0% |
| 30 to 34 Minutes | 141 | 11.4% |
| 35 to 39 Minutes | 25 | 2.0% |
| 40 to 44 Minutes | 60 | 4.9% |
| 45 to 59 Minutes | 65 | 5.3% |
| 60 to 89 Minutes | 27 | 2.2% |
| 90 or more Minutes | 25 | 2.0% |
Commute Time by Sex in Acres Green
The most common commute times in Acres Green are 15 to 19 minutes (135 commuters, 17.4%) for males and 15 to 19 minutes (165 commuters, 35.7%) for females.
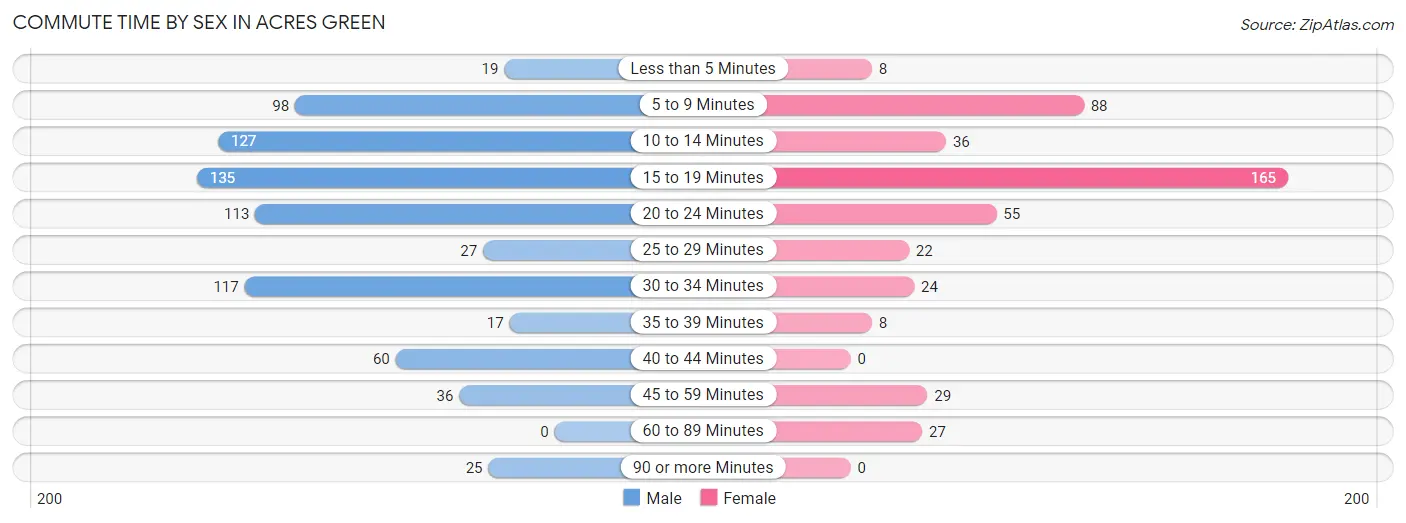
| Commute Time | Male | Female |
| Less than 5 Minutes | 19 (2.5%) | 8 (1.7%) |
| 5 to 9 Minutes | 98 (12.7%) | 88 (19.1%) |
| 10 to 14 Minutes | 127 (16.4%) | 36 (7.8%) |
| 15 to 19 Minutes | 135 (17.4%) | 165 (35.7%) |
| 20 to 24 Minutes | 113 (14.6%) | 55 (11.9%) |
| 25 to 29 Minutes | 27 (3.5%) | 22 (4.8%) |
| 30 to 34 Minutes | 117 (15.1%) | 24 (5.2%) |
| 35 to 39 Minutes | 17 (2.2%) | 8 (1.7%) |
| 40 to 44 Minutes | 60 (7.7%) | 0 (0.0%) |
| 45 to 59 Minutes | 36 (4.6%) | 29 (6.3%) |
| 60 to 89 Minutes | 0 (0.0%) | 27 (5.8%) |
| 90 or more Minutes | 25 (3.2%) | 0 (0.0%) |
Time of Departure to Work by Sex in Acres Green
The most frequent times of departure to work in Acres Green are 7:30 AM to 7:59 AM (133, 17.2%) for males and 7:00 AM to 7:29 AM (84, 18.2%) for females.
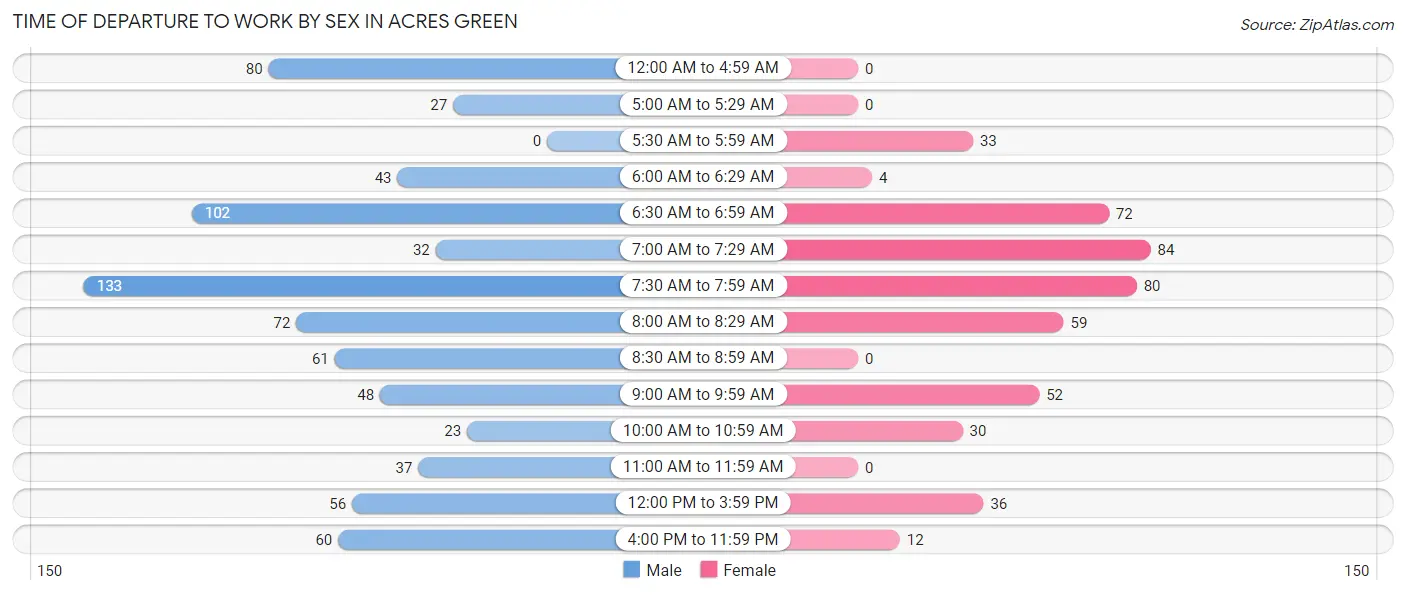
| Time of Departure | Male | Female |
| 12:00 AM to 4:59 AM | 80 (10.3%) | 0 (0.0%) |
| 5:00 AM to 5:29 AM | 27 (3.5%) | 0 (0.0%) |
| 5:30 AM to 5:59 AM | 0 (0.0%) | 33 (7.1%) |
| 6:00 AM to 6:29 AM | 43 (5.6%) | 4 (0.9%) |
| 6:30 AM to 6:59 AM | 102 (13.2%) | 72 (15.6%) |
| 7:00 AM to 7:29 AM | 32 (4.1%) | 84 (18.2%) |
| 7:30 AM to 7:59 AM | 133 (17.2%) | 80 (17.3%) |
| 8:00 AM to 8:29 AM | 72 (9.3%) | 59 (12.8%) |
| 8:30 AM to 8:59 AM | 61 (7.9%) | 0 (0.0%) |
| 9:00 AM to 9:59 AM | 48 (6.2%) | 52 (11.3%) |
| 10:00 AM to 10:59 AM | 23 (3.0%) | 30 (6.5%) |
| 11:00 AM to 11:59 AM | 37 (4.8%) | 0 (0.0%) |
| 12:00 PM to 3:59 PM | 56 (7.2%) | 36 (7.8%) |
| 4:00 PM to 11:59 PM | 60 (7.7%) | 12 (2.6%) |
| Total | 774 (100.0%) | 462 (100.0%) |
Housing Occupancy in Acres Green
Occupancy by Ownership in Acres Green
Of the total 1,035 dwellings in Acres Green, owner-occupied units account for 787 (76.0%), while renter-occupied units make up 248 (24.0%).
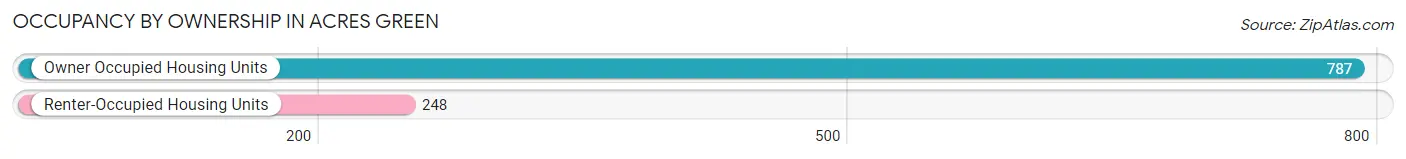
| Occupancy | # Housing Units | % Housing Units |
| Owner Occupied Housing Units | 787 | 76.0% |
| Renter-Occupied Housing Units | 248 | 24.0% |
| Total Occupied Housing Units | 1,035 | 100.0% |
Occupancy by Household Size in Acres Green
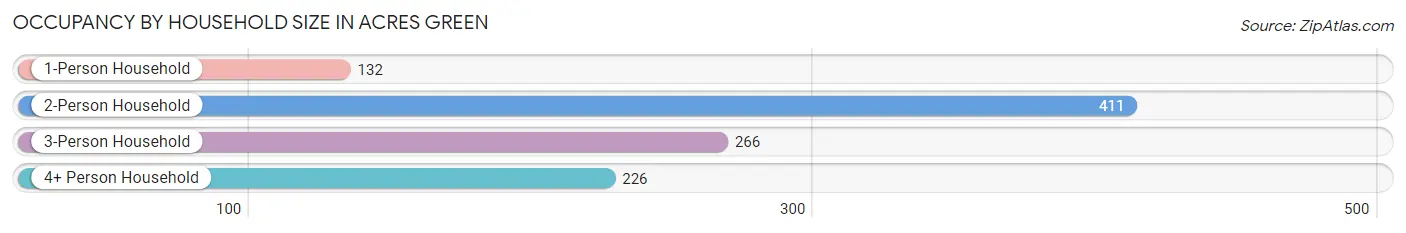
| Household Size | # Housing Units | % Housing Units |
| 1-Person Household | 132 | 12.8% |
| 2-Person Household | 411 | 39.7% |
| 3-Person Household | 266 | 25.7% |
| 4+ Person Household | 226 | 21.8% |
| Total Housing Units | 1,035 | 100.0% |
Occupancy by Ownership by Household Size in Acres Green
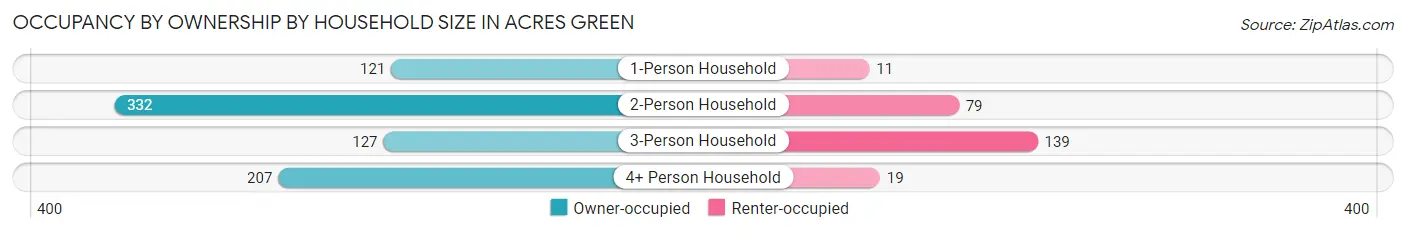
| Household Size | Owner-occupied | Renter-occupied |
| 1-Person Household | 121 (91.7%) | 11 (8.3%) |
| 2-Person Household | 332 (80.8%) | 79 (19.2%) |
| 3-Person Household | 127 (47.7%) | 139 (52.3%) |
| 4+ Person Household | 207 (91.6%) | 19 (8.4%) |
| Total Housing Units | 787 (76.0%) | 248 (24.0%) |
Occupancy by Educational Attainment in Acres Green
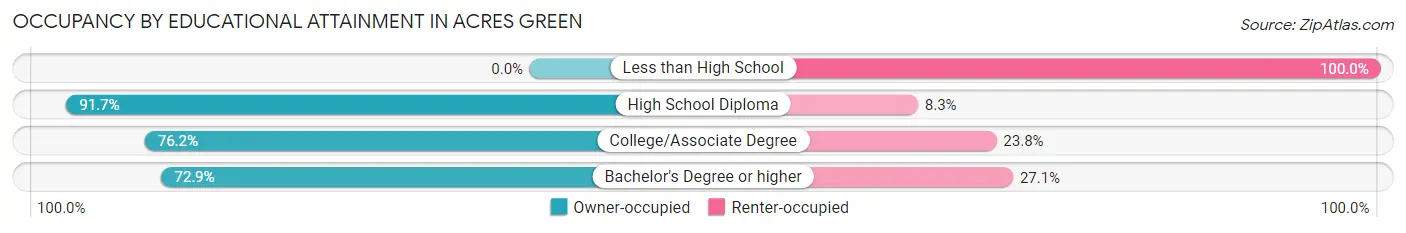
| Household Size | Owner-occupied | Renter-occupied |
| Less than High School | 0 (0.0%) | 8 (100.0%) |
| High School Diploma | 122 (91.7%) | 11 (8.3%) |
| College/Associate Degree | 313 (76.2%) | 98 (23.8%) |
| Bachelor's Degree or higher | 352 (72.9%) | 131 (27.1%) |
Occupancy by Age of Householder in Acres Green
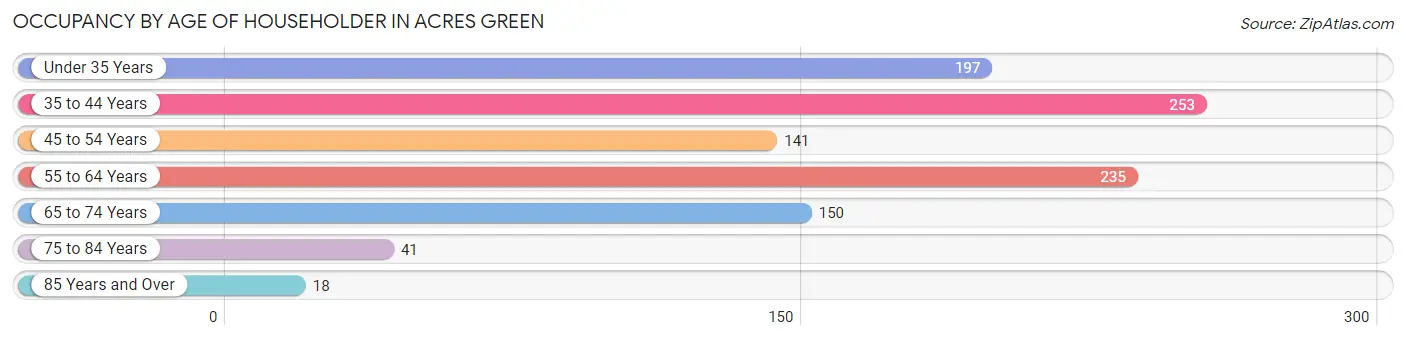
| Age Bracket | # Households | % Households |
| Under 35 Years | 197 | 19.0% |
| 35 to 44 Years | 253 | 24.4% |
| 45 to 54 Years | 141 | 13.6% |
| 55 to 64 Years | 235 | 22.7% |
| 65 to 74 Years | 150 | 14.5% |
| 75 to 84 Years | 41 | 4.0% |
| 85 Years and Over | 18 | 1.7% |
| Total | 1,035 | 100.0% |
Housing Finances in Acres Green
Median Income by Occupancy in Acres Green
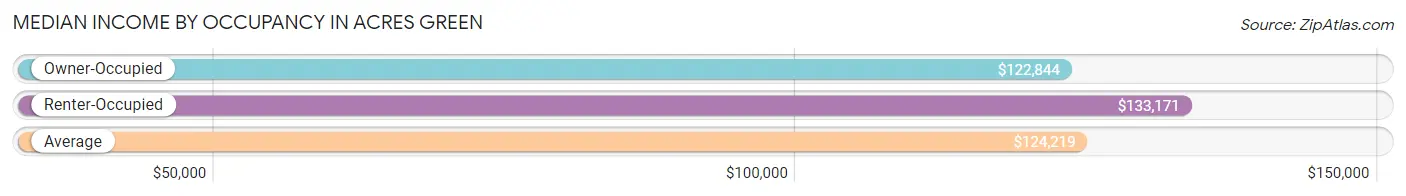
| Occupancy Type | # Households | Median Income |
| Owner-Occupied | 787 (76.0%) | $122,844 |
| Renter-Occupied | 248 (24.0%) | $133,171 |
| Average | 1,035 (100.0%) | $124,219 |
Occupancy by Householder Income Bracket in Acres Green
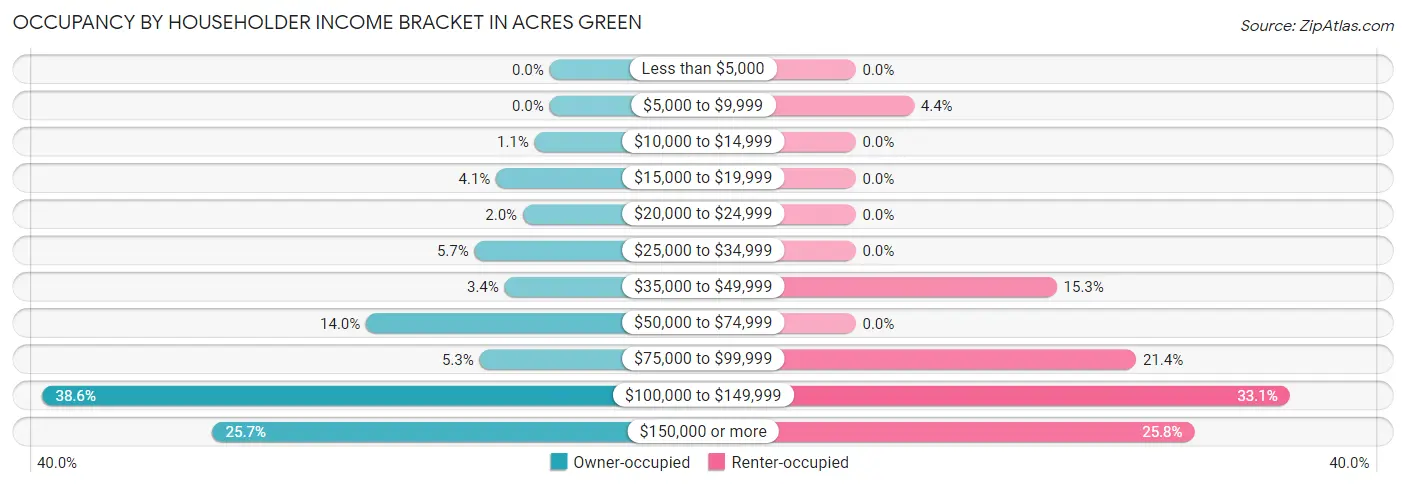
| Income Bracket | Owner-occupied | Renter-occupied |
| Less than $5,000 | 0 (0.0%) | 0 (0.0%) |
| $5,000 to $9,999 | 0 (0.0%) | 11 (4.4%) |
| $10,000 to $14,999 | 9 (1.1%) | 0 (0.0%) |
| $15,000 to $19,999 | 32 (4.1%) | 0 (0.0%) |
| $20,000 to $24,999 | 16 (2.0%) | 0 (0.0%) |
| $25,000 to $34,999 | 45 (5.7%) | 0 (0.0%) |
| $35,000 to $49,999 | 27 (3.4%) | 38 (15.3%) |
| $50,000 to $74,999 | 110 (14.0%) | 0 (0.0%) |
| $75,000 to $99,999 | 42 (5.3%) | 53 (21.4%) |
| $100,000 to $149,999 | 304 (38.6%) | 82 (33.1%) |
| $150,000 or more | 202 (25.7%) | 64 (25.8%) |
| Total | 787 (100.0%) | 248 (100.0%) |
Monthly Housing Cost Tiers in Acres Green
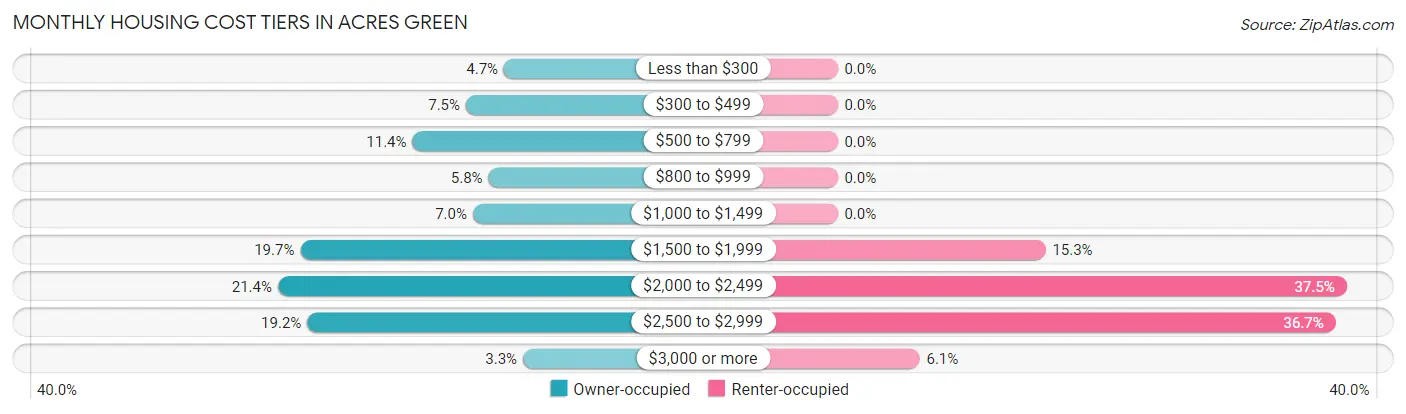
| Monthly Cost | Owner-occupied | Renter-occupied |
| Less than $300 | 37 (4.7%) | 0 (0.0%) |
| $300 to $499 | 59 (7.5%) | 0 (0.0%) |
| $500 to $799 | 90 (11.4%) | 0 (0.0%) |
| $800 to $999 | 46 (5.8%) | 0 (0.0%) |
| $1,000 to $1,499 | 55 (7.0%) | 0 (0.0%) |
| $1,500 to $1,999 | 155 (19.7%) | 38 (15.3%) |
| $2,000 to $2,499 | 168 (21.3%) | 93 (37.5%) |
| $2,500 to $2,999 | 151 (19.2%) | 91 (36.7%) |
| $3,000 or more | 26 (3.3%) | 15 (6.0%) |
| Total | 787 (100.0%) | 248 (100.0%) |
Physical Housing Characteristics in Acres Green
Housing Structures in Acres Green
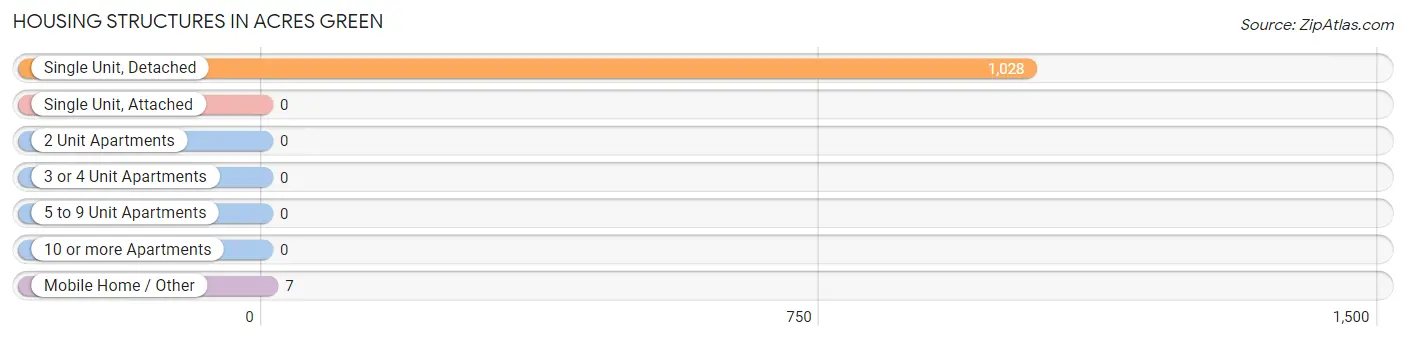
| Structure Type | # Housing Units | % Housing Units |
| Single Unit, Detached | 1,028 | 99.3% |
| Single Unit, Attached | 0 | 0.0% |
| 2 Unit Apartments | 0 | 0.0% |
| 3 or 4 Unit Apartments | 0 | 0.0% |
| 5 to 9 Unit Apartments | 0 | 0.0% |
| 10 or more Apartments | 0 | 0.0% |
| Mobile Home / Other | 7 | 0.7% |
| Total | 1,035 | 100.0% |
Housing Structures by Occupancy in Acres Green
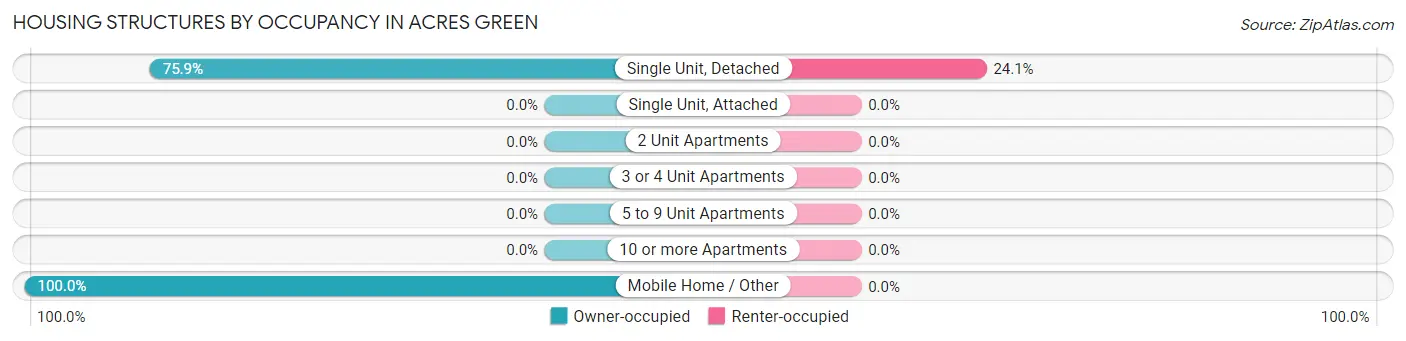
| Structure Type | Owner-occupied | Renter-occupied |
| Single Unit, Detached | 780 (75.9%) | 248 (24.1%) |
| Single Unit, Attached | 0 (0.0%) | 0 (0.0%) |
| 2 Unit Apartments | 0 (0.0%) | 0 (0.0%) |
| 3 or 4 Unit Apartments | 0 (0.0%) | 0 (0.0%) |
| 5 to 9 Unit Apartments | 0 (0.0%) | 0 (0.0%) |
| 10 or more Apartments | 0 (0.0%) | 0 (0.0%) |
| Mobile Home / Other | 7 (100.0%) | 0 (0.0%) |
| Total | 787 (76.0%) | 248 (24.0%) |
Housing Structures by Number of Rooms in Acres Green
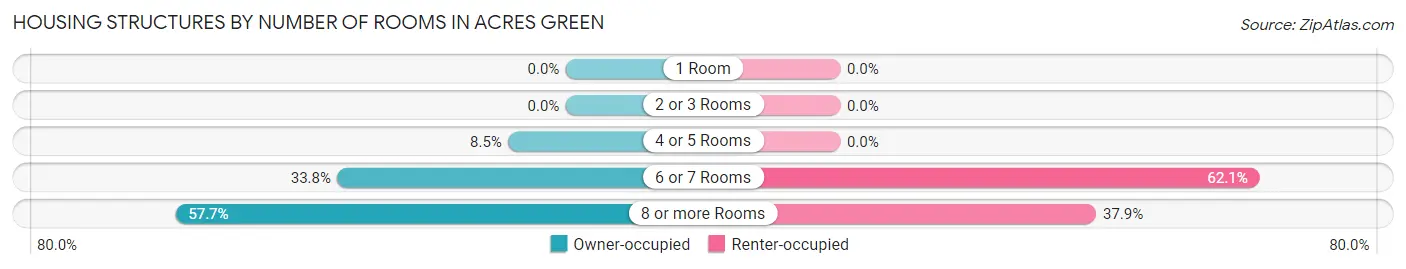
| Number of Rooms | Owner-occupied | Renter-occupied |
| 1 Room | 0 (0.0%) | 0 (0.0%) |
| 2 or 3 Rooms | 0 (0.0%) | 0 (0.0%) |
| 4 or 5 Rooms | 67 (8.5%) | 0 (0.0%) |
| 6 or 7 Rooms | 266 (33.8%) | 154 (62.1%) |
| 8 or more Rooms | 454 (57.7%) | 94 (37.9%) |
| Total | 787 (100.0%) | 248 (100.0%) |
Housing Structure by Heating Type in Acres Green
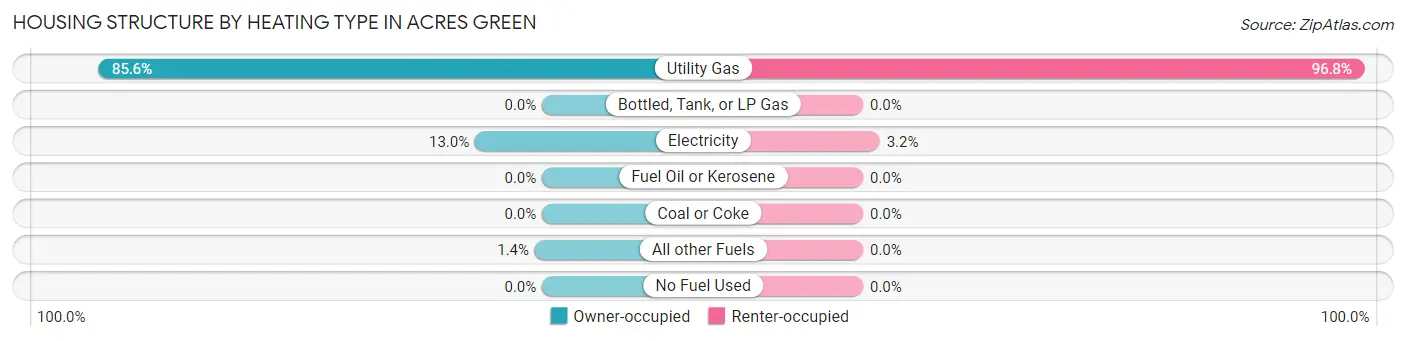
| Heating Type | Owner-occupied | Renter-occupied |
| Utility Gas | 674 (85.6%) | 240 (96.8%) |
| Bottled, Tank, or LP Gas | 0 (0.0%) | 0 (0.0%) |
| Electricity | 102 (13.0%) | 8 (3.2%) |
| Fuel Oil or Kerosene | 0 (0.0%) | 0 (0.0%) |
| Coal or Coke | 0 (0.0%) | 0 (0.0%) |
| All other Fuels | 11 (1.4%) | 0 (0.0%) |
| No Fuel Used | 0 (0.0%) | 0 (0.0%) |
| Total | 787 (100.0%) | 248 (100.0%) |
Household Vehicle Usage in Acres Green
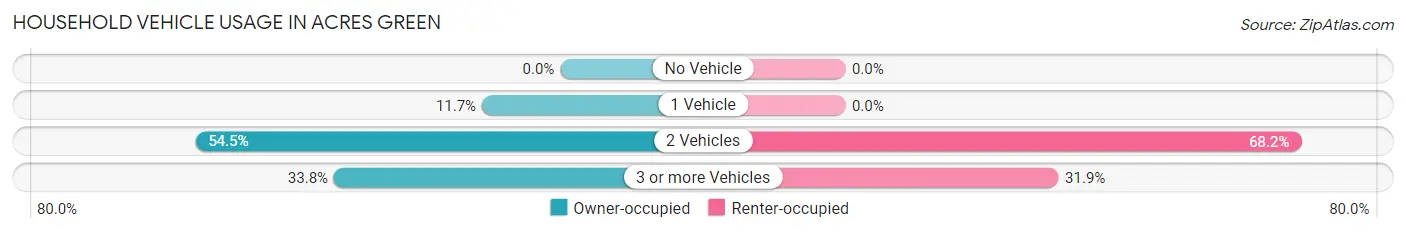
| Vehicles per Household | Owner-occupied | Renter-occupied |
| No Vehicle | 0 (0.0%) | 0 (0.0%) |
| 1 Vehicle | 92 (11.7%) | 0 (0.0%) |
| 2 Vehicles | 429 (54.5%) | 169 (68.1%) |
| 3 or more Vehicles | 266 (33.8%) | 79 (31.9%) |
| Total | 787 (100.0%) | 248 (100.0%) |
Real Estate & Mortgages in Acres Green
Real Estate and Mortgage Overview in Acres Green
| Characteristic | Without Mortgage | With Mortgage |
| Housing Units | 226 | 561 |
| Median Property Value | $464,100 | $483,200 |
| Median Household Income | $56,667 | $180 |
| Monthly Housing Costs | $552 | $26 |
| Real Estate Taxes | $2,232 | $0 |
Property Value by Mortgage Status in Acres Green
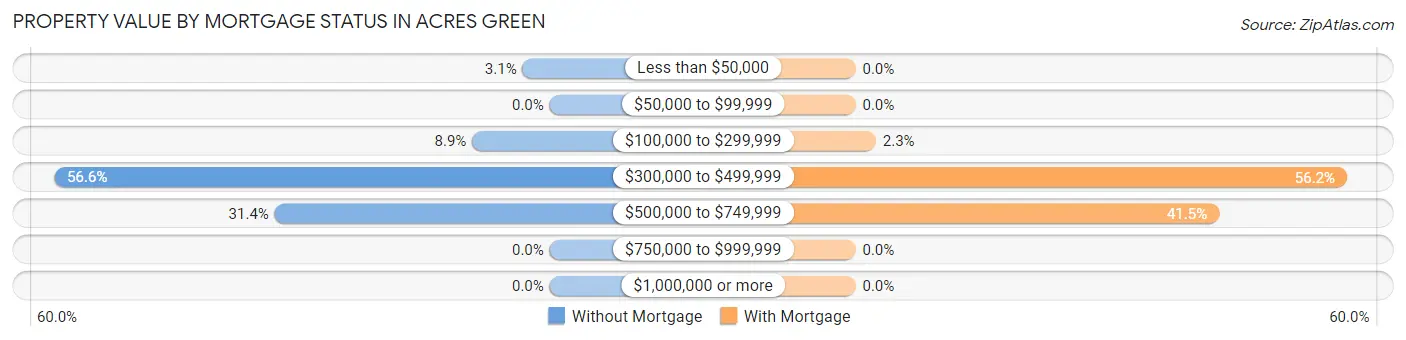
| Property Value | Without Mortgage | With Mortgage |
| Less than $50,000 | 7 (3.1%) | 0 (0.0%) |
| $50,000 to $99,999 | 0 (0.0%) | 0 (0.0%) |
| $100,000 to $299,999 | 20 (8.8%) | 13 (2.3%) |
| $300,000 to $499,999 | 128 (56.6%) | 315 (56.1%) |
| $500,000 to $749,999 | 71 (31.4%) | 233 (41.5%) |
| $750,000 to $999,999 | 0 (0.0%) | 0 (0.0%) |
| $1,000,000 or more | 0 (0.0%) | 0 (0.0%) |
| Total | 226 (100.0%) | 561 (100.0%) |
Household Income by Mortgage Status in Acres Green
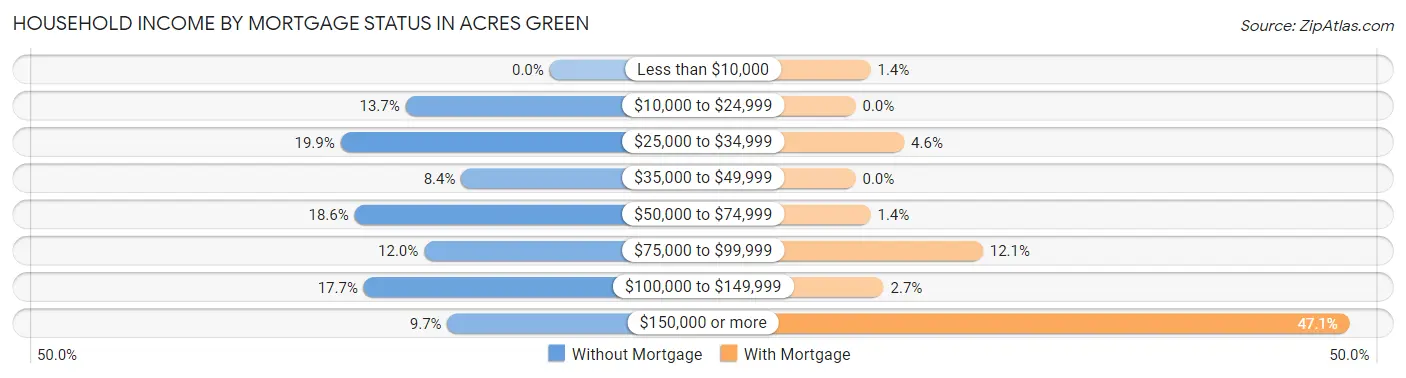
| Household Income | Without Mortgage | With Mortgage |
| Less than $10,000 | 0 (0.0%) | 8 (1.4%) |
| $10,000 to $24,999 | 31 (13.7%) | 0 (0.0%) |
| $25,000 to $34,999 | 45 (19.9%) | 26 (4.6%) |
| $35,000 to $49,999 | 19 (8.4%) | 0 (0.0%) |
| $50,000 to $74,999 | 42 (18.6%) | 8 (1.4%) |
| $75,000 to $99,999 | 27 (11.9%) | 68 (12.1%) |
| $100,000 to $149,999 | 40 (17.7%) | 15 (2.7%) |
| $150,000 or more | 22 (9.7%) | 264 (47.1%) |
| Total | 226 (100.0%) | 561 (100.0%) |
Property Value to Household Income Ratio in Acres Green
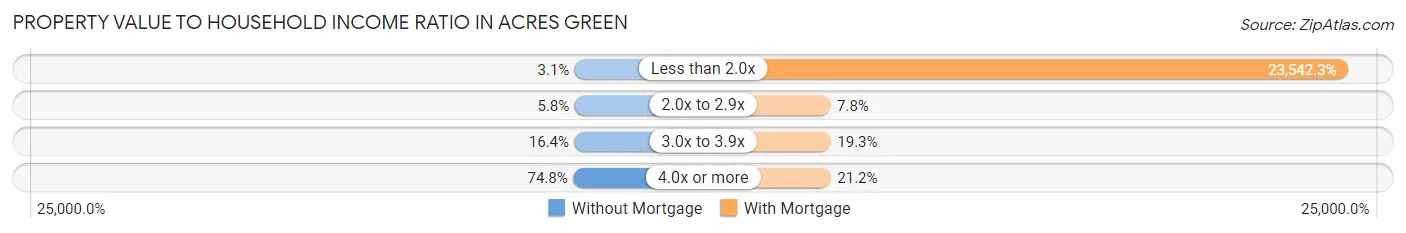
| Value-to-Income Ratio | Without Mortgage | With Mortgage |
| Less than 2.0x | 7 (3.1%) | 132,072 (23,542.3%) |
| 2.0x to 2.9x | 13 (5.8%) | 44 (7.8%) |
| 3.0x to 3.9x | 37 (16.4%) | 108 (19.3%) |
| 4.0x or more | 169 (74.8%) | 119 (21.2%) |
| Total | 226 (100.0%) | 561 (100.0%) |
Real Estate Taxes by Mortgage Status in Acres Green
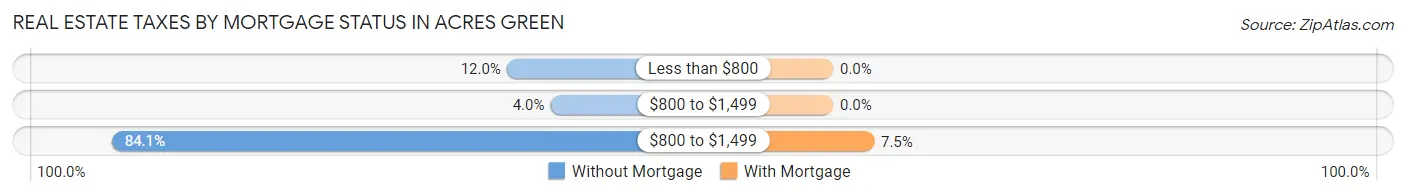
| Property Taxes | Without Mortgage | With Mortgage |
| Less than $800 | 27 (11.9%) | 0 (0.0%) |
| $800 to $1,499 | 9 (4.0%) | 0 (0.0%) |
| $800 to $1,499 | 190 (84.1%) | 42 (7.5%) |
| Total | 226 (100.0%) | 561 (100.0%) |
Health & Disability in Acres Green
Health Insurance Coverage by Age in Acres Green
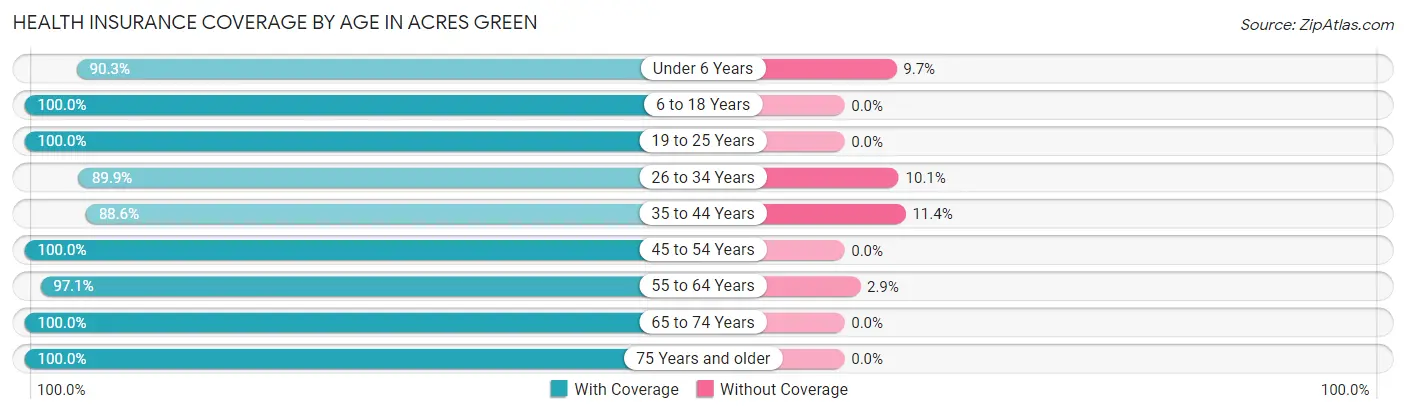
| Age Bracket | With Coverage | Without Coverage |
| Under 6 Years | 158 (90.3%) | 17 (9.7%) |
| 6 to 18 Years | 415 (100.0%) | 0 (0.0%) |
| 19 to 25 Years | 227 (100.0%) | 0 (0.0%) |
| 26 to 34 Years | 337 (89.9%) | 38 (10.1%) |
| 35 to 44 Years | 326 (88.6%) | 42 (11.4%) |
| 45 to 54 Years | 321 (100.0%) | 0 (0.0%) |
| 55 to 64 Years | 397 (97.1%) | 12 (2.9%) |
| 65 to 74 Years | 259 (100.0%) | 0 (0.0%) |
| 75 Years and older | 78 (100.0%) | 0 (0.0%) |
| Total | 2,518 (95.9%) | 109 (4.2%) |
Health Insurance Coverage by Citizenship Status in Acres Green
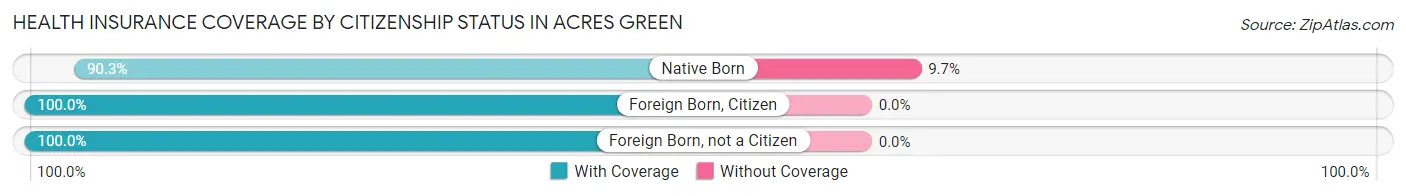
| Citizenship Status | With Coverage | Without Coverage |
| Native Born | 158 (90.3%) | 17 (9.7%) |
| Foreign Born, Citizen | 415 (100.0%) | 0 (0.0%) |
| Foreign Born, not a Citizen | 227 (100.0%) | 0 (0.0%) |
Health Insurance Coverage by Household Income in Acres Green
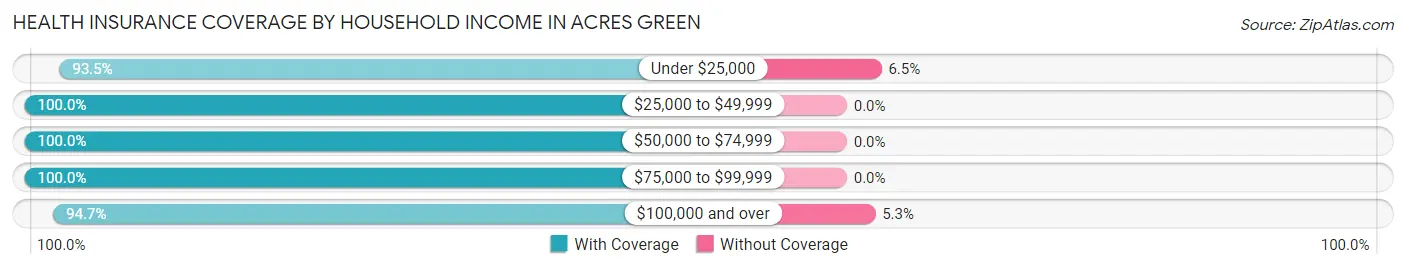
| Household Income | With Coverage | Without Coverage |
| Under $25,000 | 115 (93.5%) | 8 (6.5%) |
| $25,000 to $49,999 | 186 (100.0%) | 0 (0.0%) |
| $50,000 to $74,999 | 214 (100.0%) | 0 (0.0%) |
| $75,000 to $99,999 | 209 (100.0%) | 0 (0.0%) |
| $100,000 and over | 1,794 (94.7%) | 101 (5.3%) |
Public vs Private Health Insurance Coverage by Age in Acres Green
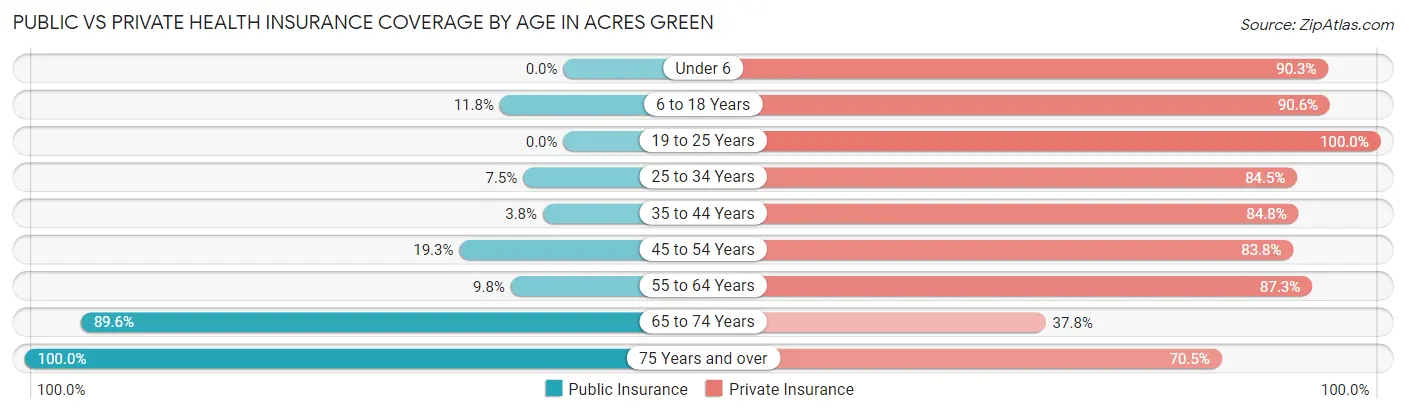
| Age Bracket | Public Insurance | Private Insurance |
| Under 6 | 0 (0.0%) | 158 (90.3%) |
| 6 to 18 Years | 49 (11.8%) | 376 (90.6%) |
| 19 to 25 Years | 0 (0.0%) | 227 (100.0%) |
| 25 to 34 Years | 28 (7.5%) | 317 (84.5%) |
| 35 to 44 Years | 14 (3.8%) | 312 (84.8%) |
| 45 to 54 Years | 62 (19.3%) | 269 (83.8%) |
| 55 to 64 Years | 40 (9.8%) | 357 (87.3%) |
| 65 to 74 Years | 232 (89.6%) | 98 (37.8%) |
| 75 Years and over | 78 (100.0%) | 55 (70.5%) |
| Total | 503 (19.2%) | 2,169 (82.6%) |
Disability Status by Sex by Age in Acres Green
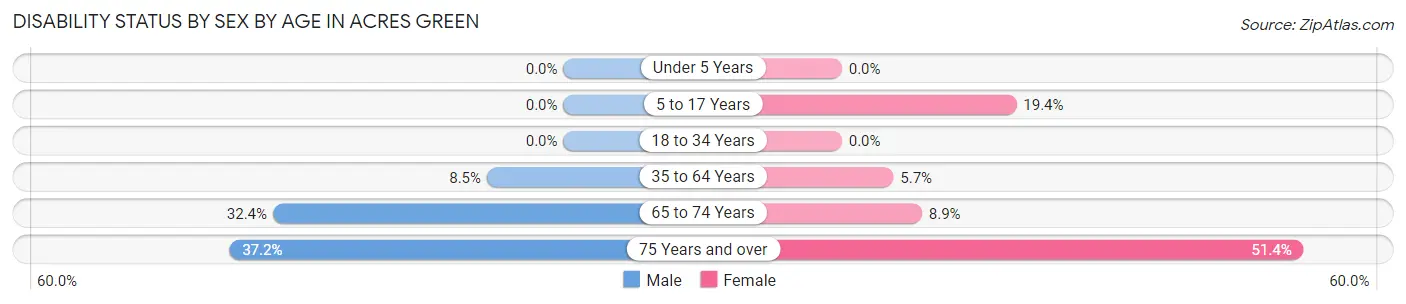
| Age Bracket | Male | Female |
| Under 5 Years | 0 (0.0%) | 0 (0.0%) |
| 5 to 17 Years | 0 (0.0%) | 42 (19.4%) |
| 18 to 34 Years | 0 (0.0%) | 0 (0.0%) |
| 35 to 64 Years | 52 (8.5%) | 28 (5.7%) |
| 65 to 74 Years | 33 (32.4%) | 14 (8.9%) |
| 75 Years and over | 16 (37.2%) | 18 (51.4%) |
Disability Class by Sex by Age in Acres Green
Disability Class: Hearing Difficulty
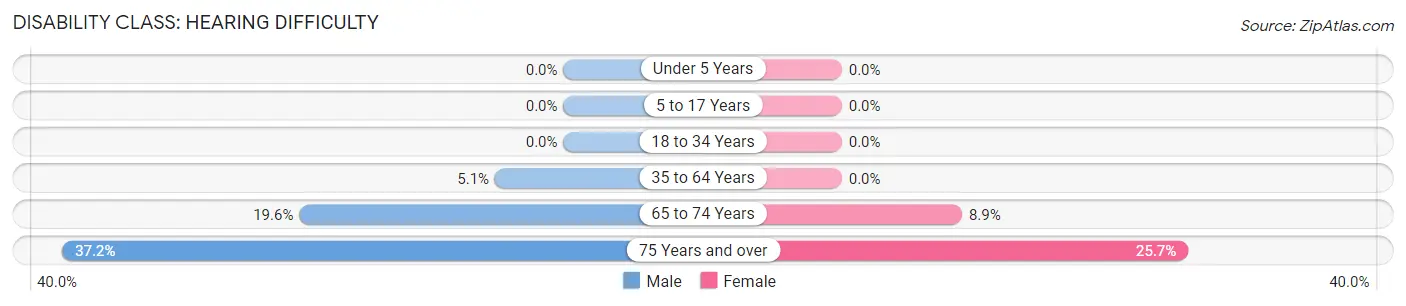
| Age Bracket | Male | Female |
| Under 5 Years | 0 (0.0%) | 0 (0.0%) |
| 5 to 17 Years | 0 (0.0%) | 0 (0.0%) |
| 18 to 34 Years | 0 (0.0%) | 0 (0.0%) |
| 35 to 64 Years | 31 (5.1%) | 0 (0.0%) |
| 65 to 74 Years | 20 (19.6%) | 14 (8.9%) |
| 75 Years and over | 16 (37.2%) | 9 (25.7%) |
Disability Class: Vision Difficulty
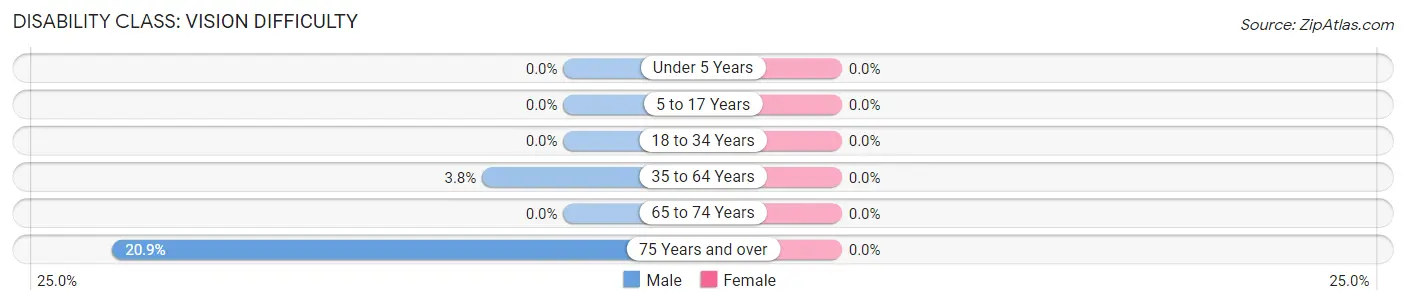
| Age Bracket | Male | Female |
| Under 5 Years | 0 (0.0%) | 0 (0.0%) |
| 5 to 17 Years | 0 (0.0%) | 0 (0.0%) |
| 18 to 34 Years | 0 (0.0%) | 0 (0.0%) |
| 35 to 64 Years | 23 (3.8%) | 0 (0.0%) |
| 65 to 74 Years | 0 (0.0%) | 0 (0.0%) |
| 75 Years and over | 9 (20.9%) | 0 (0.0%) |
Disability Class: Cognitive Difficulty
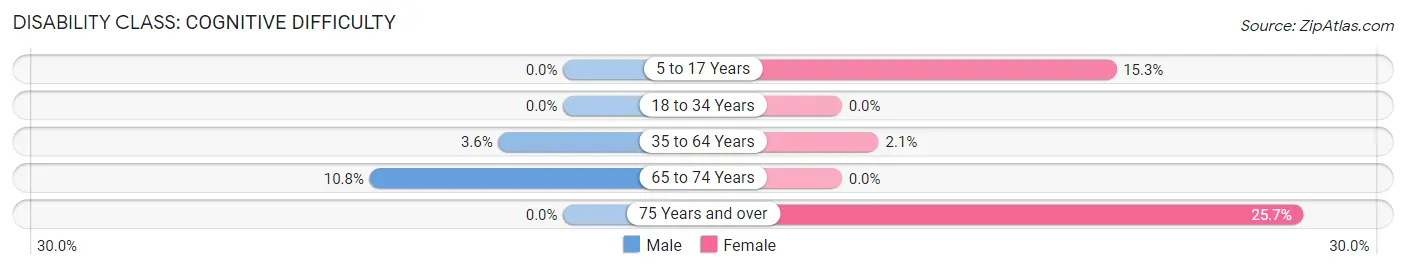
| Age Bracket | Male | Female |
| 5 to 17 Years | 0 (0.0%) | 33 (15.3%) |
| 18 to 34 Years | 0 (0.0%) | 0 (0.0%) |
| 35 to 64 Years | 22 (3.6%) | 10 (2.1%) |
| 65 to 74 Years | 11 (10.8%) | 0 (0.0%) |
| 75 Years and over | 0 (0.0%) | 9 (25.7%) |
Disability Class: Ambulatory Difficulty
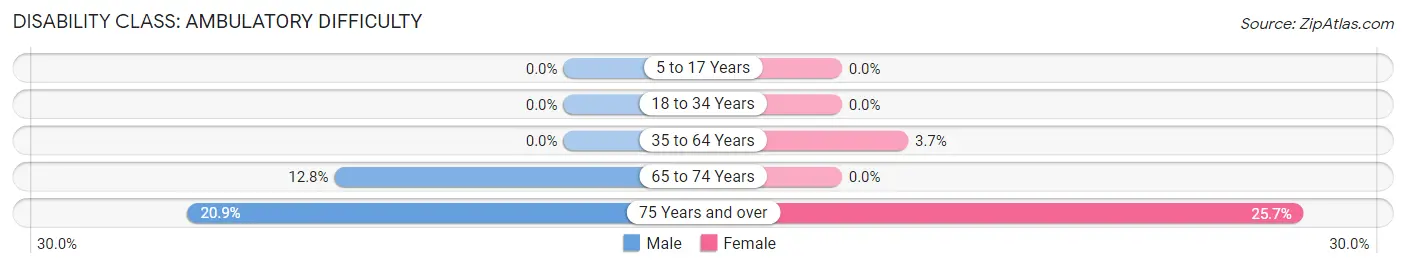
| Age Bracket | Male | Female |
| 5 to 17 Years | 0 (0.0%) | 0 (0.0%) |
| 18 to 34 Years | 0 (0.0%) | 0 (0.0%) |
| 35 to 64 Years | 0 (0.0%) | 18 (3.7%) |
| 65 to 74 Years | 13 (12.8%) | 0 (0.0%) |
| 75 Years and over | 9 (20.9%) | 9 (25.7%) |
Disability Class: Self-Care Difficulty
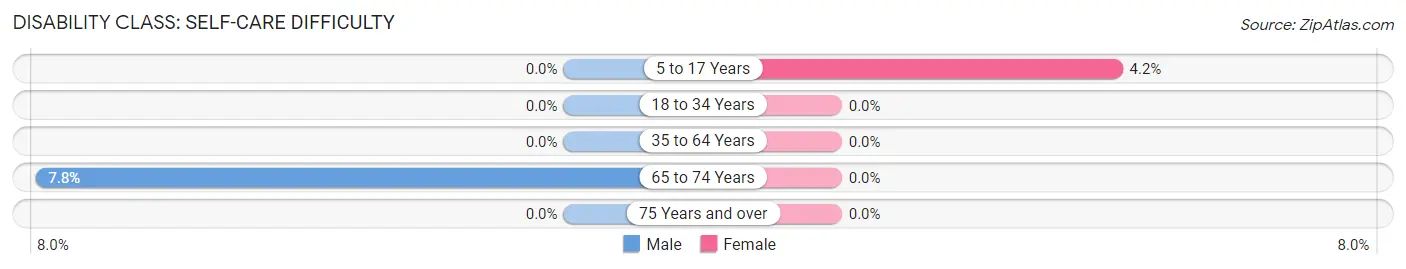
| Age Bracket | Male | Female |
| 5 to 17 Years | 0 (0.0%) | 9 (4.2%) |
| 18 to 34 Years | 0 (0.0%) | 0 (0.0%) |
| 35 to 64 Years | 0 (0.0%) | 0 (0.0%) |
| 65 to 74 Years | 8 (7.8%) | 0 (0.0%) |
| 75 Years and over | 0 (0.0%) | 0 (0.0%) |
Technology Access in Acres Green
Computing Device Access in Acres Green
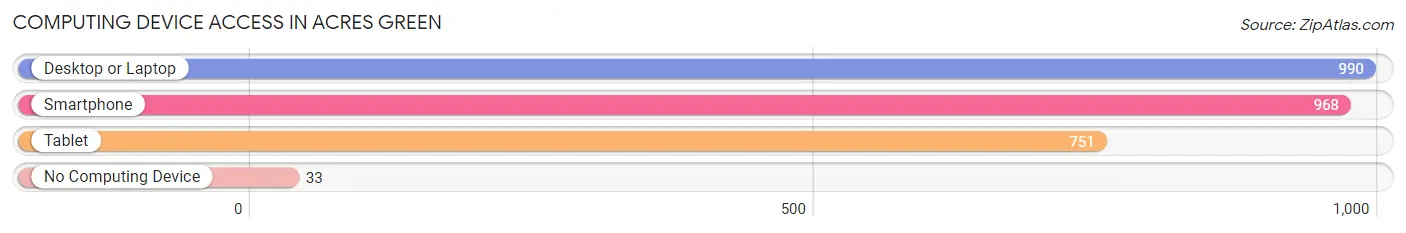
| Device Type | # Households | % Households |
| Desktop or Laptop | 990 | 95.7% |
| Smartphone | 968 | 93.5% |
| Tablet | 751 | 72.6% |
| No Computing Device | 33 | 3.2% |
| Total | 1,035 | 100.0% |
Internet Access in Acres Green
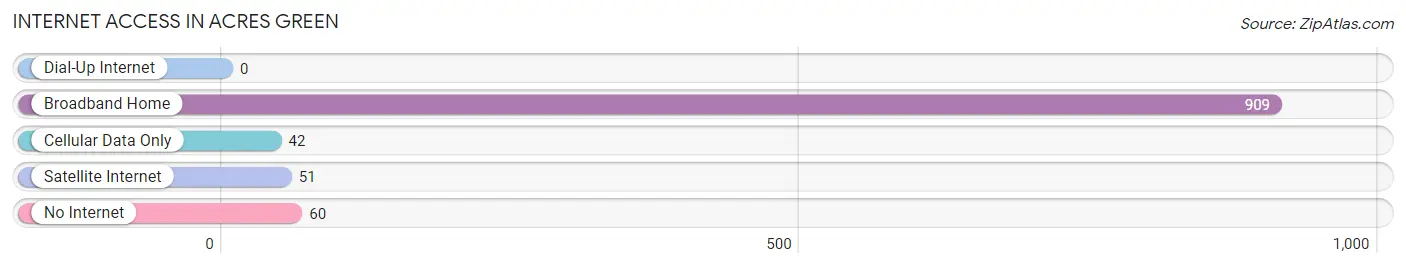
| Internet Type | # Households | % Households |
| Dial-Up Internet | 0 | 0.0% |
| Broadband Home | 909 | 87.8% |
| Cellular Data Only | 42 | 4.1% |
| Satellite Internet | 51 | 4.9% |
| No Internet | 60 | 5.8% |
| Total | 1,035 | 100.0% |
Acres Green Summary
Acres Green is a small unincorporated community located in Douglas County, Colorado, United States. It is situated in the foothills of the Rocky Mountains, approximately 20 miles south of Denver. The community is bordered by the cities of Lone Tree and Highlands Ranch to the north, and the towns of Castle Rock and Parker to the south. Acres Green is a rural community with a population of approximately 1,500 people.
History
Acres Green was first settled in the late 1800s by homesteaders who were attracted to the area by its abundant natural resources. The community was named after the Acres Green Ranch, which was established in 1881 by the Acres family. The ranch was a popular destination for travelers and settlers, and the Acres family was well-known for their hospitality.
In the early 1900s, the community began to grow as more people moved to the area. The Acres Green School was built in 1910, and the Acres Green Post Office was established in 1912. The community continued to grow throughout the 20th century, and by the 1990s, Acres Green had become a popular destination for commuters who wanted to live in a rural setting while still having easy access to the amenities of nearby cities.
Geography
Acres Green is located in the foothills of the Rocky Mountains, approximately 20 miles south of Denver. The community is bordered by the cities of Lone Tree and Highlands Ranch to the north, and the towns of Castle Rock and Parker to the south. The area is characterized by rolling hills, open meadows, and dense forests. The climate is mild, with warm summers and cold winters.
Economy
The economy of Acres Green is largely based on agriculture and tourism. The area is home to several farms and ranches, which produce a variety of crops and livestock. The community is also a popular destination for outdoor recreation, and there are several parks and trails in the area. In addition, Acres Green is home to several small businesses, including restaurants, shops, and services.
Demographics
As of the 2010 census, the population of Acres Green was 1,500. The racial makeup of the community was 94.7% White, 1.3% African American, 0.7% Native American, 0.7% Asian, 0.3% Pacific Islander, and 2.0% from other races. The median household income was $60,000, and the median home value was $400,000.
Conclusion
Acres Green is a small unincorporated community located in Douglas County, Colorado. It is situated in the foothills of the Rocky Mountains, approximately 20 miles south of Denver. The community is bordered by the cities of Lone Tree and Highlands Ranch to the north, and the towns of Castle Rock and Parker to the south. Acres Green is a rural community with a population of approximately 1,500 people. The economy of Acres Green is largely based on agriculture and tourism, and the area is home to several farms and ranches, as well as small businesses. The racial makeup of the community is predominantly White, with a small percentage of African American, Native American, Asian, and Pacific Islander residents.
Common Questions
What is Per Capita Income in Acres Green?
Per Capita income in Acres Green is $47,458.
What is the Median Family Income in Acres Green?
Median Family Income in Acres Green is $132,927.
What is the Median Household income in Acres Green?
Median Household Income in Acres Green is $124,219.
What is Income or Wage Gap in Acres Green?
Income or Wage Gap in Acres Green is 19.3%.
Women in Acres Green earn 80.7 cents for every dollar earned by a man.
What is Inequality or Gini Index in Acres Green?
Inequality or Gini Index in Acres Green is 0.31.
What is the Total Population of Acres Green?
Total Population of Acres Green is 2,627.
What is the Total Male Population of Acres Green?
Total Male Population of Acres Green is 1,450.
What is the Total Female Population of Acres Green?
Total Female Population of Acres Green is 1,177.
What is the Ratio of Males per 100 Females in Acres Green?
There are 123.19 Males per 100 Females in Acres Green.
What is the Ratio of Females per 100 Males in Acres Green?
There are 81.17 Females per 100 Males in Acres Green.
What is the Median Population Age in Acres Green?
Median Population Age in Acres Green is 40.6 Years.
What is the Average Family Size in Acres Green
Average Family Size in Acres Green is 2.8 People.
What is the Average Household Size in Acres Green
Average Household Size in Acres Green is 2.5 People.
How Large is the Labor Force in Acres Green?
There are 1,713 People in the Labor Forcein in Acres Green.
What is the Percentage of People in the Labor Force in Acres Green?
76.7% of People are in the Labor Force in Acres Green.
What is the Unemployment Rate in Acres Green?
Unemployment Rate in Acres Green is 1.1%.