Zip Codes with the Highest Percentage of Population Employed in Farming, Fishing & Forestry in Yuba City, CA
RELATED REPORTS & OPTIONS
Farming, Fishing & Forestry
Yuba City
Compare Zip Codes
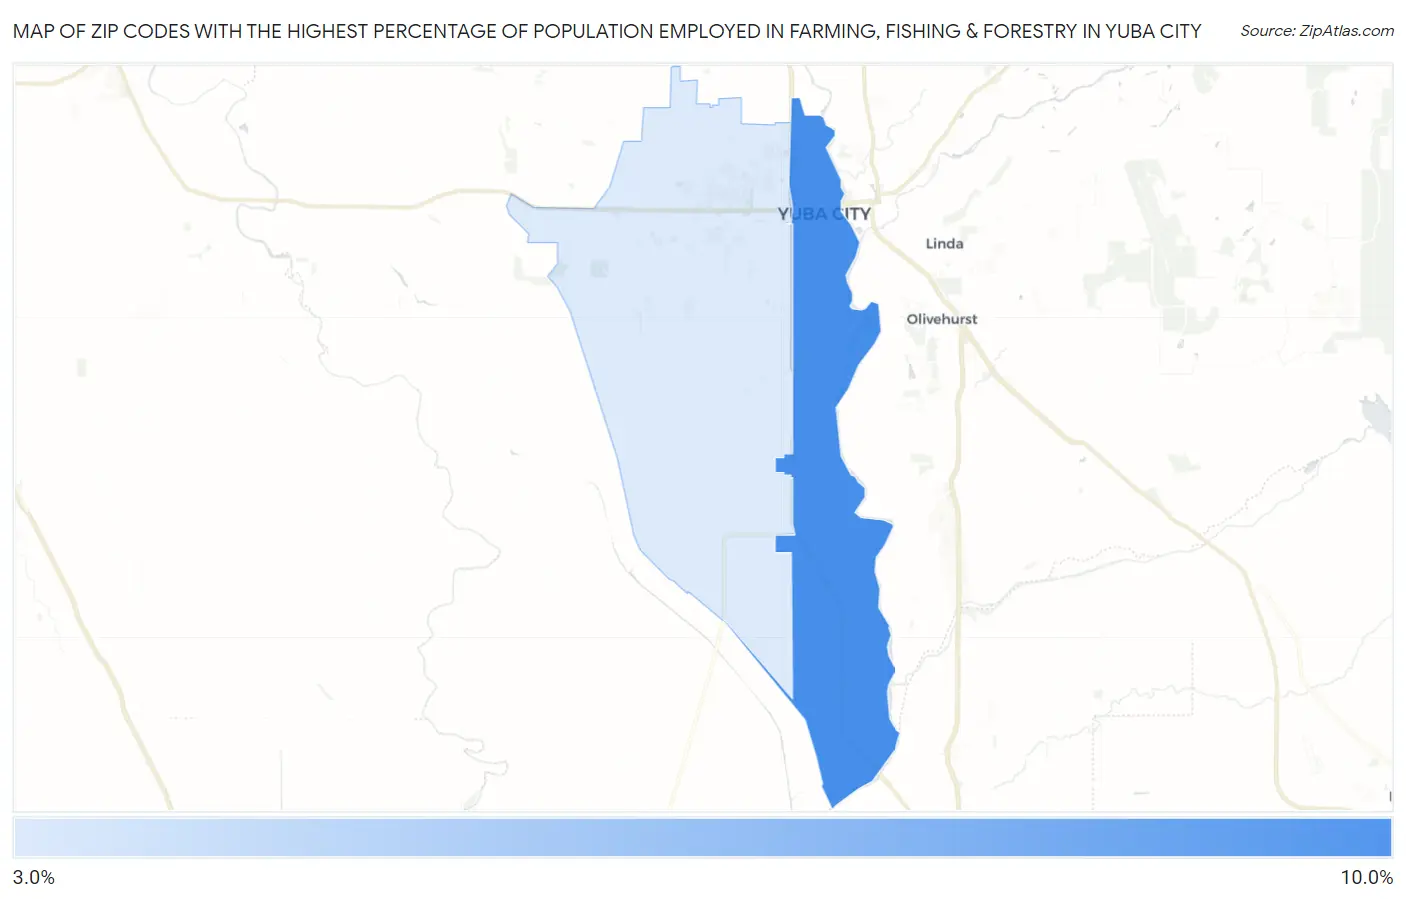
Map of Zip Codes with the Highest Percentage of Population Employed in Farming, Fishing & Forestry in Yuba City
0.0%
10.0%
Zip Codes with the Highest Percentage of Population Employed in Farming, Fishing & Forestry in Yuba City, CA
| Zip Code | % Employed | vs State | vs National | |
| 1. | 95991 | 8.2% | 1.4%(+6.82)#183 | 0.61%(+7.62)#1,594 |
| 2. | 95993 | 3.4% | 1.4%(+1.97)#294 | 0.61%(+2.78)#4,350 |
1
Common Questions
What are the Top Zip Codes with the Highest Percentage of Population Employed in Farming, Fishing & Forestry in Yuba City, CA?
Top Zip Codes with the Highest Percentage of Population Employed in Farming, Fishing & Forestry in Yuba City, CA are:
What zip code has the Highest Percentage of Population Employed in Farming, Fishing & Forestry in Yuba City, CA?
95991 has the Highest Percentage of Population Employed in Farming, Fishing & Forestry in Yuba City, CA with 8.2%.
What is the Percentage of Population Employed in Farming, Fishing & Forestry in Yuba City, CA?
Percentage of Population Employed in Farming, Fishing & Forestry in Yuba City is 5.9%.
What is the Percentage of Population Employed in Farming, Fishing & Forestry in California?
Percentage of Population Employed in Farming, Fishing & Forestry in California is 1.4%.
What is the Percentage of Population Employed in Farming, Fishing & Forestry in the United States?
Percentage of Population Employed in Farming, Fishing & Forestry in the United States is 0.61%.