Zip Codes with the Highest Percentage of Population Employed in Arts, Entertainment & Recreation in Woodland, CA
RELATED REPORTS & OPTIONS
Arts, Entertainment & Recreation
Woodland
Compare Zip Codes
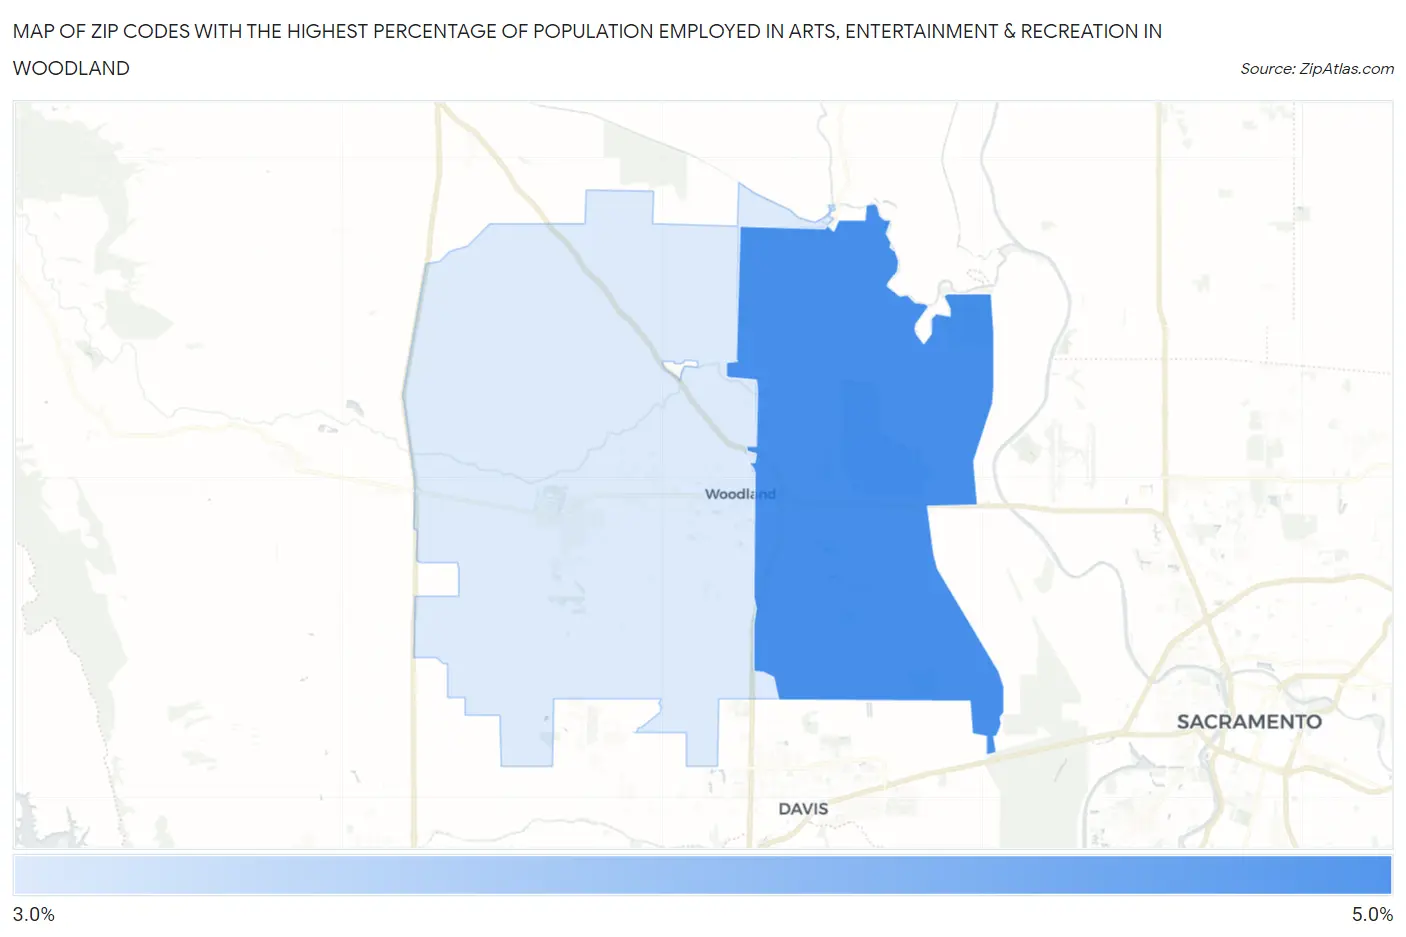
Map of Zip Codes with the Highest Percentage of Population Employed in Arts, Entertainment & Recreation in Woodland
0.0%
5.0%
Zip Codes with the Highest Percentage of Population Employed in Arts, Entertainment & Recreation in Woodland, CA
| Zip Code | % Employed | vs State | vs National | |
| 1. | 95776 | 4.9% | 2.6%(+2.31)#228 | 2.1%(+2.79)#2,386 |
| 2. | 95695 | 3.5% | 2.6%(+0.921)#419 | 2.1%(+1.39)#4,184 |
1
Common Questions
What are the Top Zip Codes with the Highest Percentage of Population Employed in Arts, Entertainment & Recreation in Woodland, CA?
Top Zip Codes with the Highest Percentage of Population Employed in Arts, Entertainment & Recreation in Woodland, CA are:
What zip code has the Highest Percentage of Population Employed in Arts, Entertainment & Recreation in Woodland, CA?
95776 has the Highest Percentage of Population Employed in Arts, Entertainment & Recreation in Woodland, CA with 4.9%.
What is the Percentage of Population Employed in Arts, Entertainment & Recreation in Woodland, CA?
Percentage of Population Employed in Arts, Entertainment & Recreation in Woodland is 4.2%.
What is the Percentage of Population Employed in Arts, Entertainment & Recreation in California?
Percentage of Population Employed in Arts, Entertainment & Recreation in California is 2.6%.
What is the Percentage of Population Employed in Arts, Entertainment & Recreation in the United States?
Percentage of Population Employed in Arts, Entertainment & Recreation in the United States is 2.1%.