Willits, CA Map & Demographics
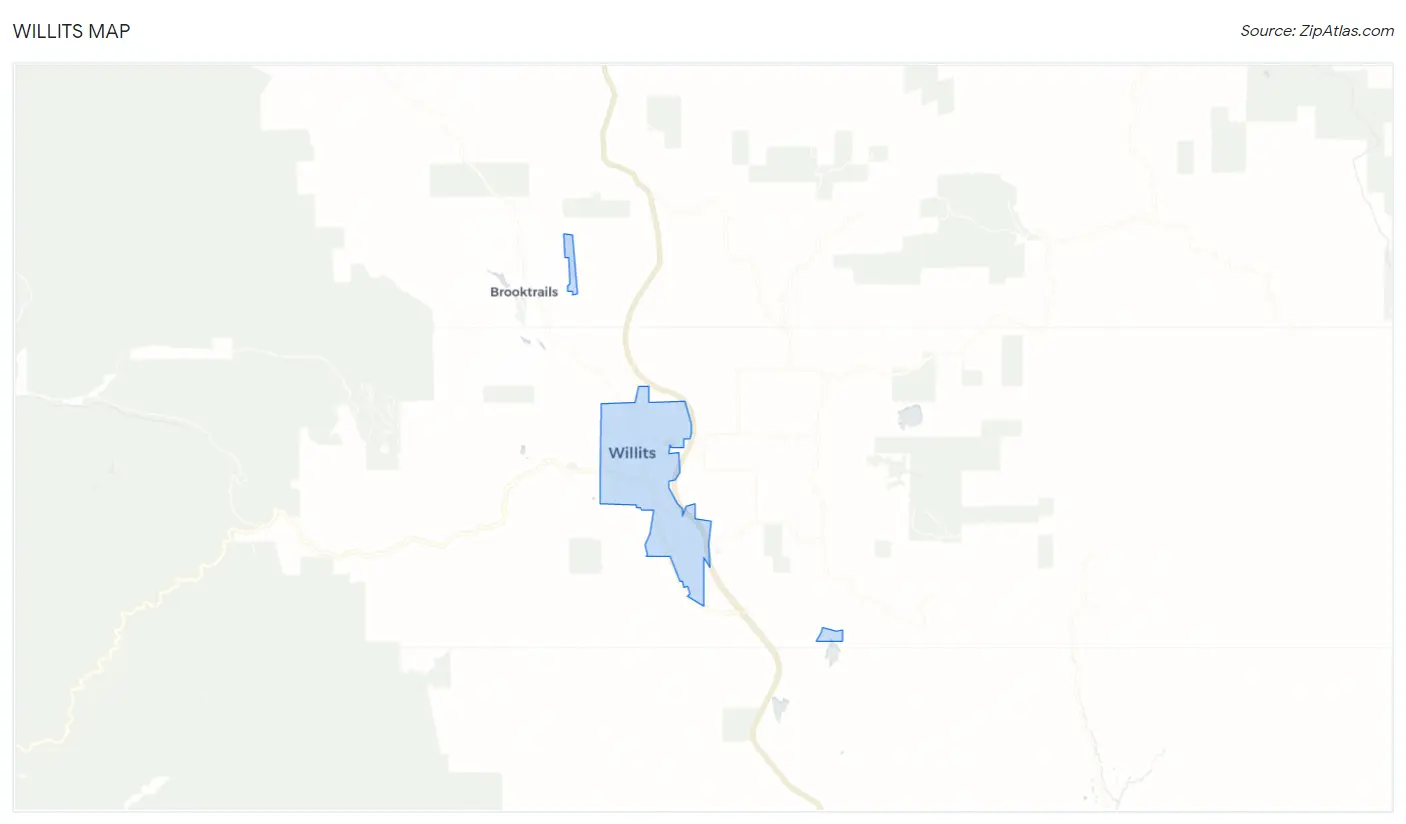
Willits Map
Willits Overview
$30,460
PER CAPITA INCOME
$57,374
AVG FAMILY INCOME
$45,592
AVG HOUSEHOLD INCOME
35.9%
WAGE / INCOME GAP [ % ]
64.1¢/ $1
WAGE / INCOME GAP [ $ ]
0.50
INEQUALITY / GINI INDEX
4,968
TOTAL POPULATION
2,200
MALE POPULATION
2,768
FEMALE POPULATION
79.48
MALES / 100 FEMALES
125.82
FEMALES / 100 MALES
40.4
MEDIAN AGE
3.3
AVG FAMILY SIZE
2.3
AVG HOUSEHOLD SIZE
1,925
LABOR FORCE [ PEOPLE ]
48.4%
PERCENT IN LABOR FORCE
13.8%
UNEMPLOYMENT RATE
Willits Zip Codes
Willits Area Codes
Income in Willits
Income Overview in Willits
Per Capita Income in Willits is $30,460, while median incomes of families and households are $57,374 and $45,592 respectively.
| Characteristic | Number | Measure |
| Per Capita Income | 4,968 | $30,460 |
| Median Family Income | 1,009 | $57,374 |
| Mean Family Income | 1,009 | $81,833 |
| Median Household Income | 2,107 | $45,592 |
| Mean Household Income | 2,107 | $65,677 |
| Income Deficit | 1,009 | $0 |
| Wage / Income Gap (%) | 4,968 | 35.92% |
| Wage / Income Gap ($) | 4,968 | 64.08¢ per $1 |
| Gini / Inequality Index | 4,968 | 0.50 |
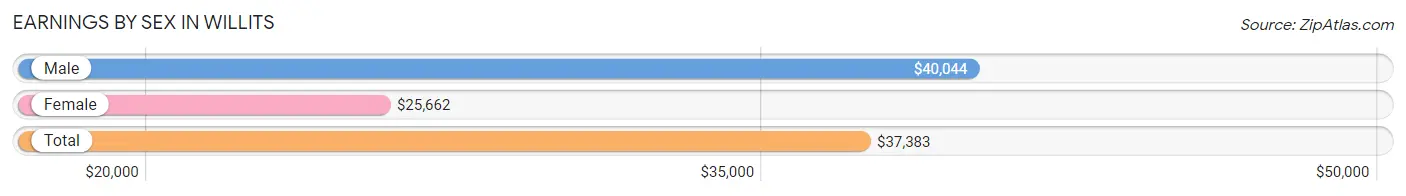
Earnings by Sex in Willits
Average Earnings in Willits are $37,383, $40,044 for men and $25,662 for women, a difference of 35.9%.
| Sex | Number | Average Earnings |
| Male | 998 (45.5%) | $40,044 |
| Female | 1,197 (54.5%) | $25,662 |
| Total | 2,195 (100.0%) | $37,383 |
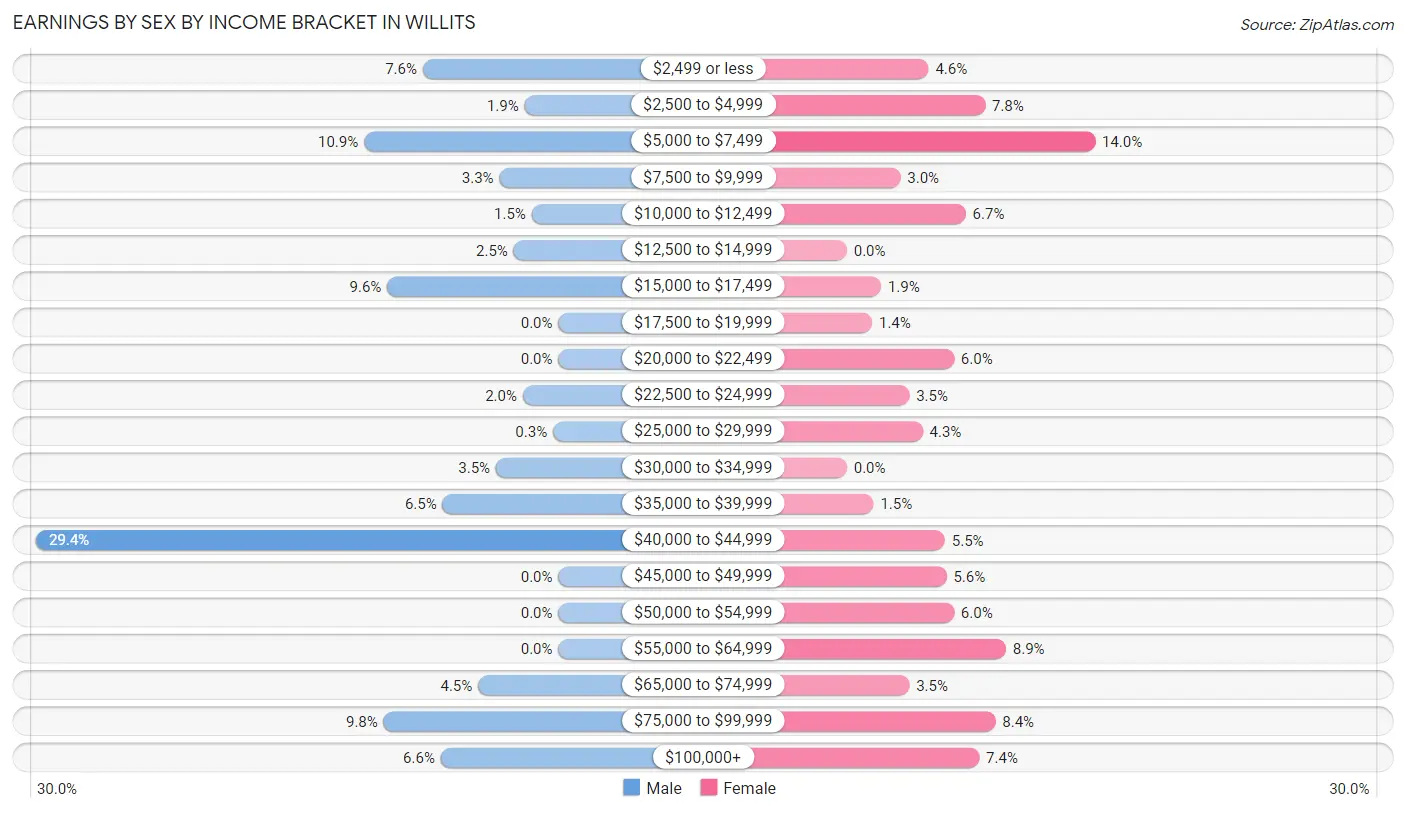
Earnings by Sex by Income Bracket in Willits
The most common earnings brackets in Willits are $40,000 to $44,999 for men (293 | 29.4%) and $5,000 to $7,499 for women (167 | 14.0%).
| Income | Male | Female |
| $2,499 or less | 76 (7.6%) | 55 (4.6%) |
| $2,500 to $4,999 | 19 (1.9%) | 93 (7.8%) |
| $5,000 to $7,499 | 109 (10.9%) | 167 (14.0%) |
| $7,500 to $9,999 | 33 (3.3%) | 36 (3.0%) |
| $10,000 to $12,499 | 15 (1.5%) | 80 (6.7%) |
| $12,500 to $14,999 | 25 (2.5%) | 0 (0.0%) |
| $15,000 to $17,499 | 96 (9.6%) | 23 (1.9%) |
| $17,500 to $19,999 | 0 (0.0%) | 17 (1.4%) |
| $20,000 to $22,499 | 0 (0.0%) | 72 (6.0%) |
| $22,500 to $24,999 | 20 (2.0%) | 42 (3.5%) |
| $25,000 to $29,999 | 3 (0.3%) | 51 (4.3%) |
| $30,000 to $34,999 | 35 (3.5%) | 0 (0.0%) |
| $35,000 to $39,999 | 65 (6.5%) | 18 (1.5%) |
| $40,000 to $44,999 | 293 (29.4%) | 66 (5.5%) |
| $45,000 to $49,999 | 0 (0.0%) | 67 (5.6%) |
| $50,000 to $54,999 | 0 (0.0%) | 72 (6.0%) |
| $55,000 to $64,999 | 0 (0.0%) | 107 (8.9%) |
| $65,000 to $74,999 | 45 (4.5%) | 42 (3.5%) |
| $75,000 to $99,999 | 98 (9.8%) | 100 (8.4%) |
| $100,000+ | 66 (6.6%) | 89 (7.4%) |
| Total | 998 (100.0%) | 1,197 (100.0%) |
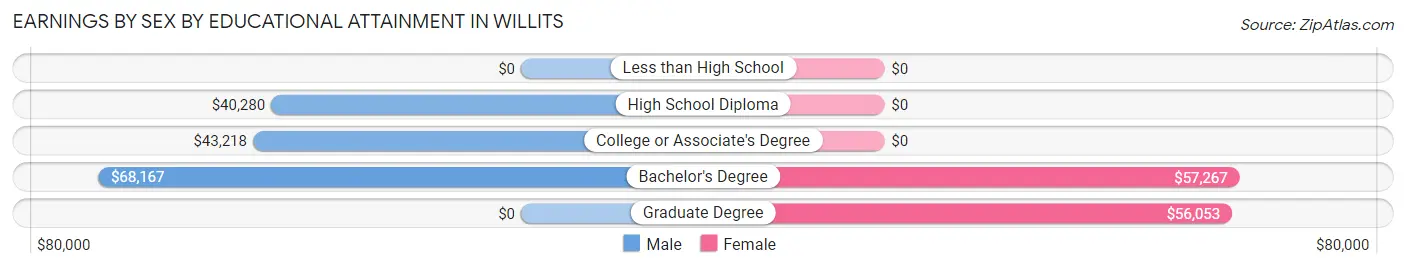
Earnings by Sex by Educational Attainment in Willits
Average earnings in Willits are $40,547 for men and $44,028 for women, a difference of 7.9%. Men with an educational attainment of bachelor's degree enjoy the highest average annual earnings of $68,167, while those with high school diploma education earn the least with $40,280. Women with an educational attainment of bachelor's degree earn the most with the average annual earnings of $57,267, while those with graduate degree education have the smallest earnings of $56,053.
| Educational Attainment | Male Income | Female Income |
| Less than High School | - | - |
| High School Diploma | $40,280 | $0 |
| College or Associate's Degree | $43,218 | $0 |
| Bachelor's Degree | $68,167 | $57,267 |
| Graduate Degree | - | - |
| Total | $40,547 | $44,028 |
Family Income in Willits
Family Income Brackets in Willits
According to the Willits family income data, there are 256 families falling into the $50,000 to $74,999 income range, which is the most common income bracket and makes up 25.4% of all families. Conversely, the less than $10,000 income bracket is the least frequent group with only 34 families (3.4%) belonging to this category.
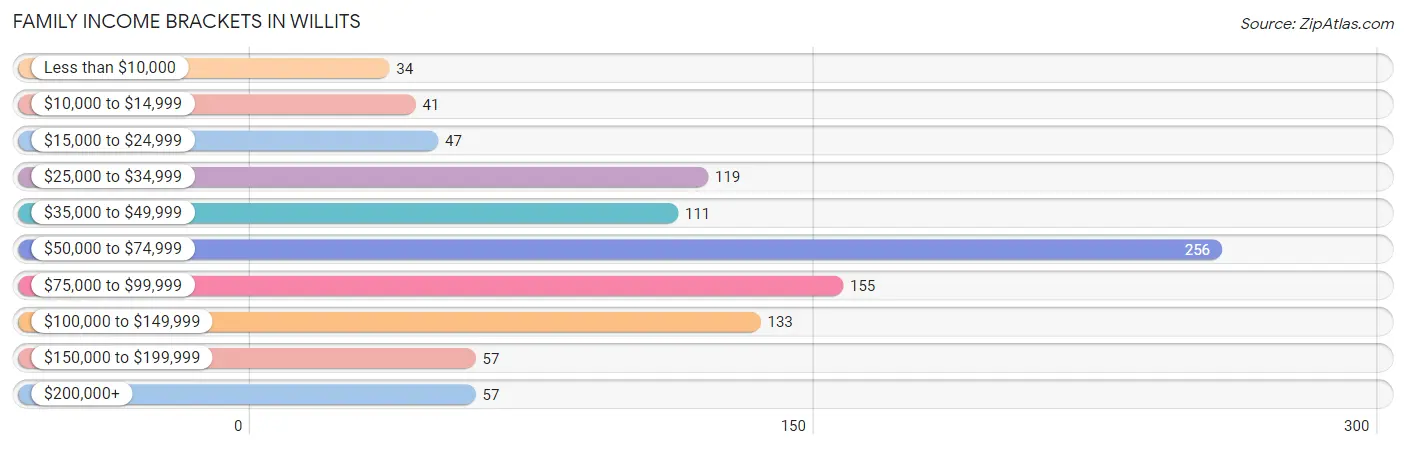
| Income Bracket | # Families | % Families |
| Less than $10,000 | 34 | 3.4% |
| $10,000 to $14,999 | 41 | 4.1% |
| $15,000 to $24,999 | 47 | 4.7% |
| $25,000 to $34,999 | 119 | 11.8% |
| $35,000 to $49,999 | 111 | 11.0% |
| $50,000 to $74,999 | 256 | 25.4% |
| $75,000 to $99,999 | 155 | 15.4% |
| $100,000 to $149,999 | 133 | 13.2% |
| $150,000 to $199,999 | 57 | 5.6% |
| $200,000+ | 57 | 5.6% |
Family Income by Famaliy Size in Willits
4-person families (181 | 17.9%) account for the highest median family income in Willits with $100,742 per family, while 2-person families (515 | 51.0%) have the highest median income of $27,610 per family member.
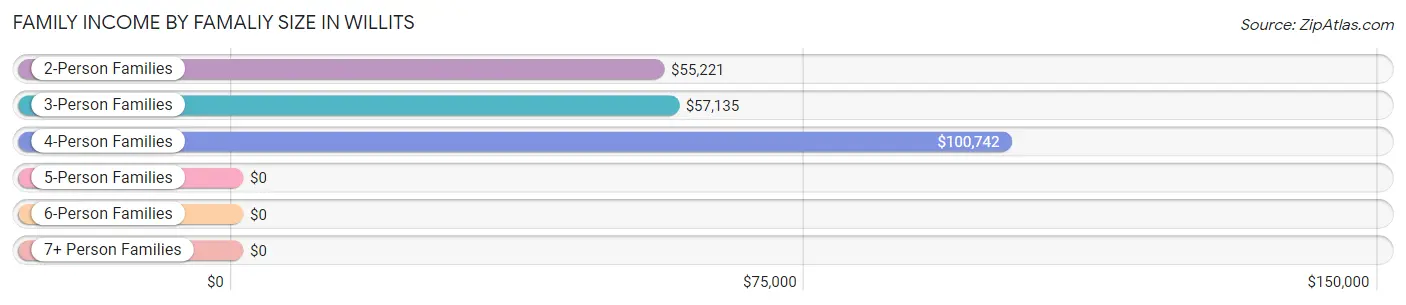
| Income Bracket | # Families | Median Income |
| 2-Person Families | 515 (51.0%) | $55,221 |
| 3-Person Families | 245 (24.3%) | $57,135 |
| 4-Person Families | 181 (17.9%) | $100,742 |
| 5-Person Families | 15 (1.5%) | $0 |
| 6-Person Families | 53 (5.2%) | $0 |
| 7+ Person Families | 0 (0.0%) | $0 |
| Total | 1,009 (100.0%) | $57,374 |
Family Income by Number of Earners in Willits
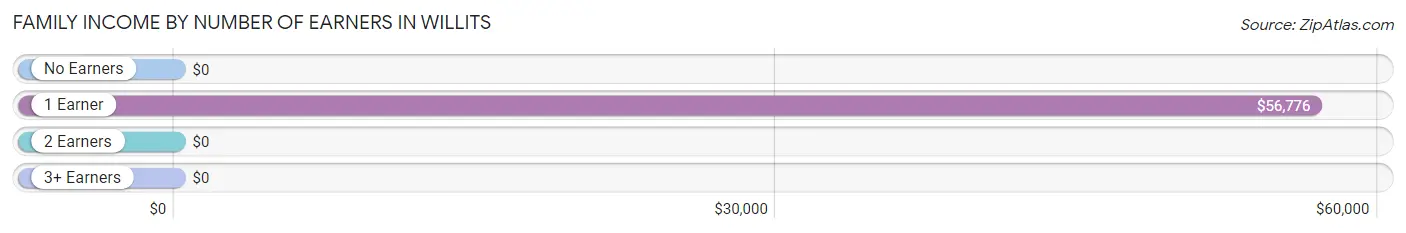
| Number of Earners | # Families | Median Income |
| No Earners | 221 (21.9%) | $0 |
| 1 Earner | 356 (35.3%) | $56,776 |
| 2 Earners | 342 (33.9%) | $0 |
| 3+ Earners | 90 (8.9%) | $0 |
| Total | 1,009 (100.0%) | $57,374 |
Household Income in Willits
Household Income Brackets in Willits
With 388 households falling in the category, the $50,000 to $74,999 income range is the most frequent in Willits, accounting for 18.4% of all households. In contrast, only 86 households (4.1%) fall into the $200,000+ income bracket, making it the least populous group.
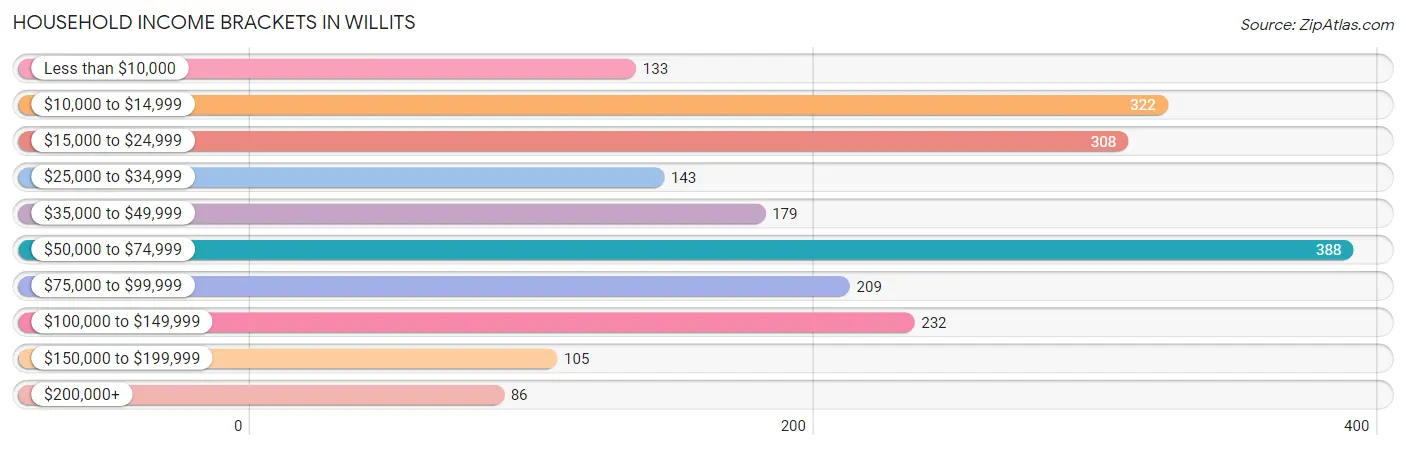
| Income Bracket | # Households | % Households |
| Less than $10,000 | 133 | 6.3% |
| $10,000 to $14,999 | 322 | 15.3% |
| $15,000 to $24,999 | 308 | 14.6% |
| $25,000 to $34,999 | 143 | 6.8% |
| $35,000 to $49,999 | 179 | 8.5% |
| $50,000 to $74,999 | 388 | 18.4% |
| $75,000 to $99,999 | 209 | 9.9% |
| $100,000 to $149,999 | 232 | 11.0% |
| $150,000 to $199,999 | 105 | 5.0% |
| $200,000+ | 86 | 4.1% |
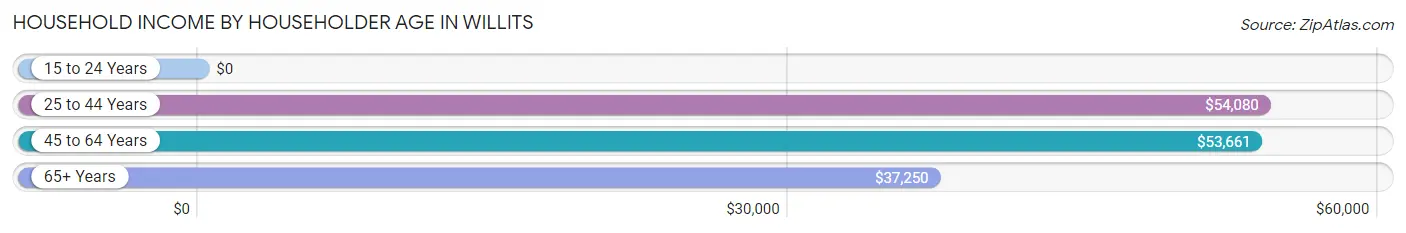
Household Income by Householder Age in Willits
The median household income in Willits is $45,592, with the highest median household income of $54,080 found in the 25 to 44 years age bracket for the primary householder. A total of 647 households (30.7%) fall into this category. Meanwhile, the 15 to 24 years age bracket for the primary householder has the lowest median household income of $0, with 66 households (3.1%) in this group.
| Income Bracket | # Households | Median Income |
| 15 to 24 Years | 66 (3.1%) | $0 |
| 25 to 44 Years | 647 (30.7%) | $54,080 |
| 45 to 64 Years | 449 (21.3%) | $53,661 |
| 65+ Years | 945 (44.9%) | $37,250 |
| Total | 2,107 (100.0%) | $45,592 |
Poverty in Willits
Income Below Poverty by Sex and Age in Willits
With 18.6% poverty level for males and 15.4% for females among the residents of Willits, 16 and 17 year old males and under 5 year old females are the most vulnerable to poverty, with 46 males (70.8%) and 20 females (100.0%) in their respective age groups living below the poverty level.
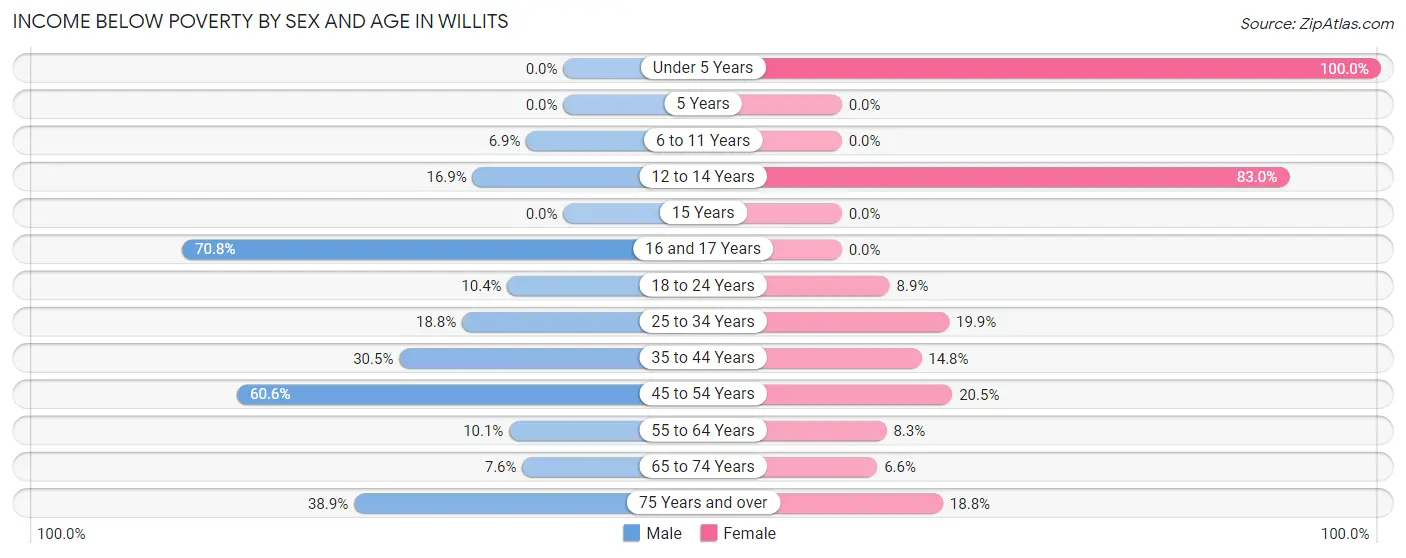
| Age Bracket | Male | Female |
| Under 5 Years | 0 (0.0%) | 20 (100.0%) |
| 5 Years | 0 (0.0%) | 0 (0.0%) |
| 6 to 11 Years | 15 (6.9%) | 0 (0.0%) |
| 12 to 14 Years | 15 (16.9%) | 88 (83.0%) |
| 15 Years | 0 (0.0%) | 0 (0.0%) |
| 16 and 17 Years | 46 (70.8%) | 0 (0.0%) |
| 18 to 24 Years | 19 (10.4%) | 34 (8.9%) |
| 25 to 34 Years | 50 (18.8%) | 50 (19.9%) |
| 35 to 44 Years | 92 (30.5%) | 44 (14.8%) |
| 45 to 54 Years | 43 (60.6%) | 65 (20.5%) |
| 55 to 64 Years | 20 (10.1%) | 15 (8.3%) |
| 65 to 74 Years | 22 (7.6%) | 34 (6.6%) |
| 75 Years and over | 82 (38.9%) | 70 (18.8%) |
| Total | 404 (18.6%) | 420 (15.4%) |
Income Above Poverty by Sex and Age in Willits
According to the poverty statistics in Willits, males aged under 5 years and females aged 6 to 11 years are the age groups that are most secure financially, with 100.0% of males and 100.0% of females in these age groups living above the poverty line.
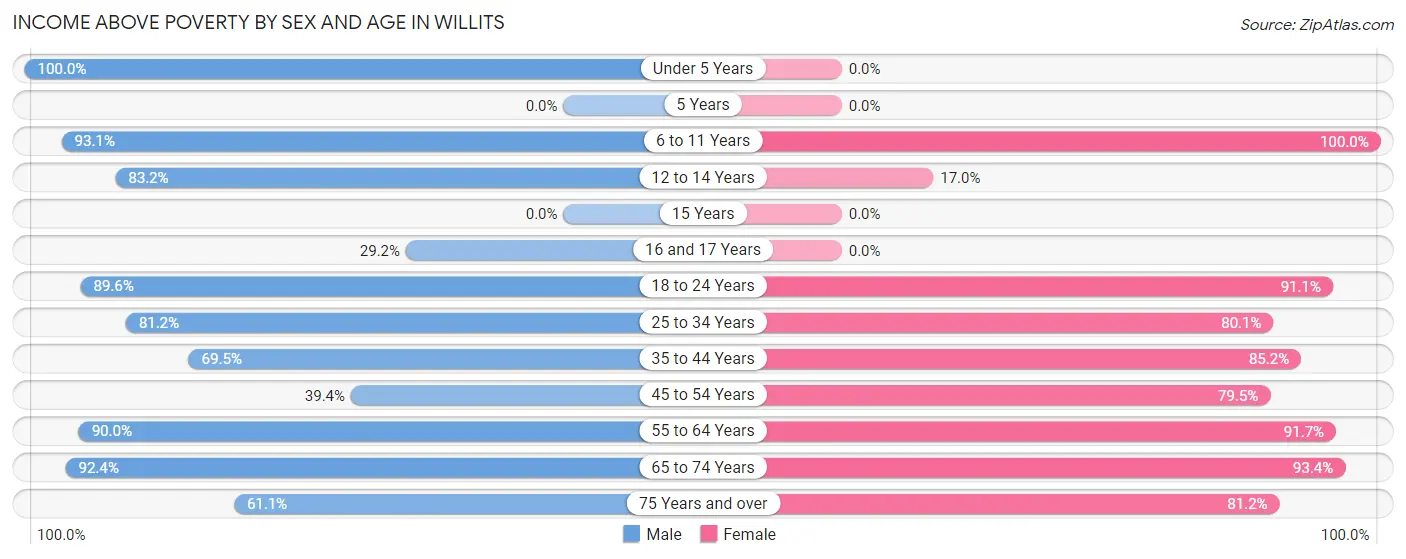
| Age Bracket | Male | Female |
| Under 5 Years | 280 (100.0%) | 0 (0.0%) |
| 5 Years | 0 (0.0%) | 0 (0.0%) |
| 6 to 11 Years | 203 (93.1%) | 276 (100.0%) |
| 12 to 14 Years | 74 (83.2%) | 18 (17.0%) |
| 15 Years | 0 (0.0%) | 0 (0.0%) |
| 16 and 17 Years | 19 (29.2%) | 0 (0.0%) |
| 18 to 24 Years | 164 (89.6%) | 349 (91.1%) |
| 25 to 34 Years | 216 (81.2%) | 201 (80.1%) |
| 35 to 44 Years | 210 (69.5%) | 254 (85.2%) |
| 45 to 54 Years | 28 (39.4%) | 252 (79.5%) |
| 55 to 64 Years | 179 (89.9%) | 166 (91.7%) |
| 65 to 74 Years | 267 (92.4%) | 483 (93.4%) |
| 75 Years and over | 129 (61.1%) | 303 (81.2%) |
| Total | 1,769 (81.4%) | 2,302 (84.6%) |
Income Below Poverty Among Married-Couple Families in Willits
The poverty statistics for married-couple families in Willits show that 4.0% or 20 of the total 497 families live below the poverty line. Families with 1 or 2 children have the highest poverty rate of 13.1%, comprising of 20 families. On the other hand, families with no children have the lowest poverty rate of 0.0%, which includes 0 families.
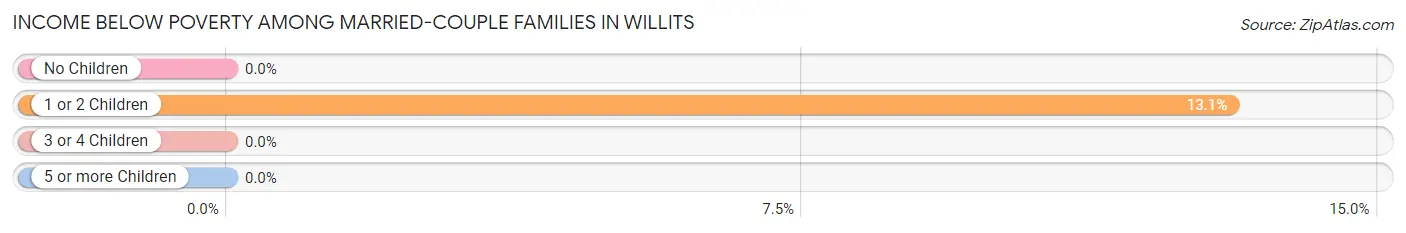
| Children | Above Poverty | Below Poverty |
| No Children | 276 (100.0%) | 0 (0.0%) |
| 1 or 2 Children | 133 (86.9%) | 20 (13.1%) |
| 3 or 4 Children | 68 (100.0%) | 0 (0.0%) |
| 5 or more Children | 0 (0.0%) | 0 (0.0%) |
| Total | 477 (96.0%) | 20 (4.0%) |
Income Below Poverty Among Single-Parent Households in Willits
According to the poverty data in Willits, 50.0% or 47 single-father households and 13.2% or 55 single-mother households are living below the poverty line. Among single-father households, those with 1 or 2 children have the highest poverty rate, with 47 households (73.4%) experiencing poverty. Likewise, among single-mother households, those with 1 or 2 children have the highest poverty rate, with 55 households (22.9%) falling below the poverty line.
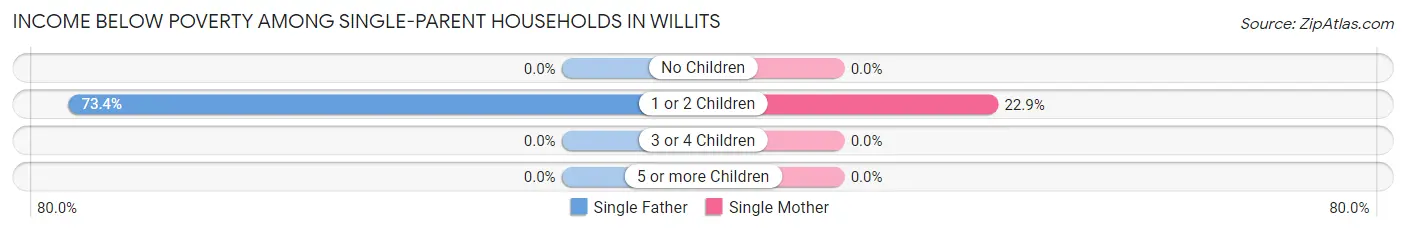
| Children | Single Father | Single Mother |
| No Children | 0 (0.0%) | 0 (0.0%) |
| 1 or 2 Children | 47 (73.4%) | 55 (22.9%) |
| 3 or 4 Children | 0 (0.0%) | 0 (0.0%) |
| 5 or more Children | 0 (0.0%) | 0 (0.0%) |
| Total | 47 (50.0%) | 55 (13.2%) |
Income Below Poverty Among Married-Couple vs Single-Parent Households in Willits
The poverty data for Willits shows that 20 of the married-couple family households (4.0%) and 102 of the single-parent households (19.9%) are living below the poverty level. Within the married-couple family households, those with 1 or 2 children have the highest poverty rate, with 20 households (13.1%) falling below the poverty line. Among the single-parent households, those with 1 or 2 children have the highest poverty rate, with 102 household (33.6%) living below poverty.
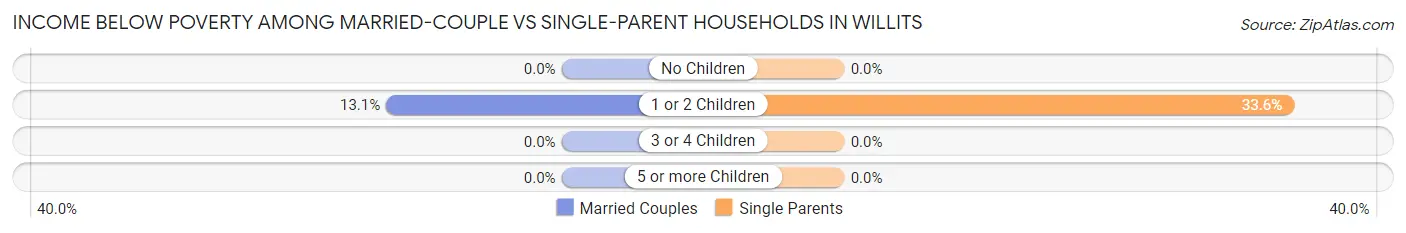
| Children | Married-Couple Families | Single-Parent Households |
| No Children | 0 (0.0%) | 0 (0.0%) |
| 1 or 2 Children | 20 (13.1%) | 102 (33.6%) |
| 3 or 4 Children | 0 (0.0%) | 0 (0.0%) |
| 5 or more Children | 0 (0.0%) | 0 (0.0%) |
| Total | 20 (4.0%) | 102 (19.9%) |
Race in Willits
The most populous races in Willits are White / Caucasian (3,795 | 76.4%), Hispanic or Latino (1,136 | 22.9%), and Two or more Races (605 | 12.2%).
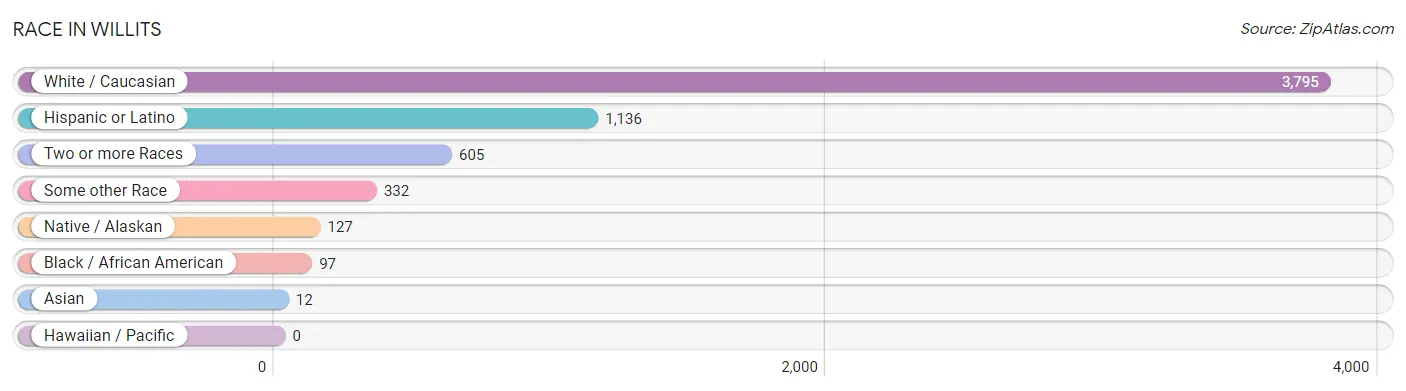
| Race | # Population | % Population |
| Asian | 12 | 0.2% |
| Black / African American | 97 | 1.9% |
| Hawaiian / Pacific | 0 | 0.0% |
| Hispanic or Latino | 1,136 | 22.9% |
| Native / Alaskan | 127 | 2.6% |
| White / Caucasian | 3,795 | 76.4% |
| Two or more Races | 605 | 12.2% |
| Some other Race | 332 | 6.7% |
| Total | 4,968 | 100.0% |
Ancestry in Willits
The most populous ancestries reported in Willits are Irish (779 | 15.7%), Mexican (749 | 15.1%), German (729 | 14.7%), English (451 | 9.1%), and Russian (300 | 6.0%), together accounting for 60.6% of all Willits residents.
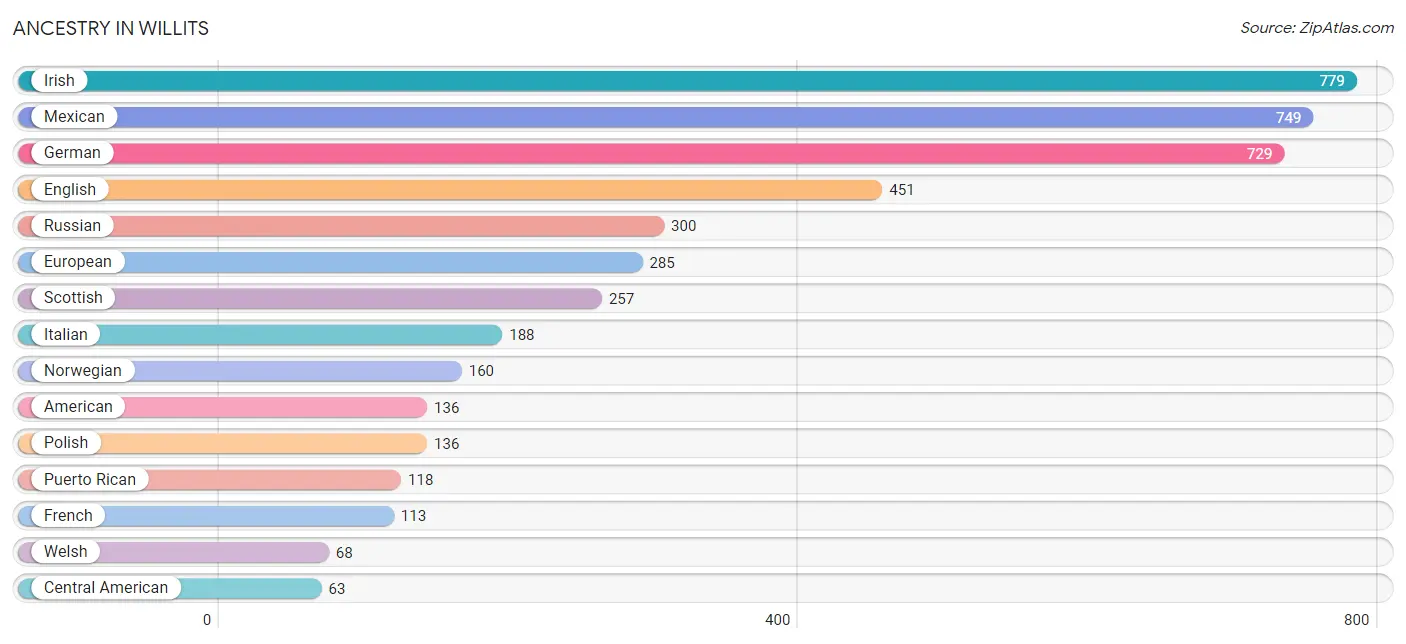
| Ancestry | # Population | % Population |
| American | 136 | 2.7% |
| Apache | 10 | 0.2% |
| Bangladeshi | 3 | 0.1% |
| Central American | 63 | 1.3% |
| Croatian | 16 | 0.3% |
| Czech | 16 | 0.3% |
| Delaware | 37 | 0.7% |
| Dutch | 30 | 0.6% |
| Eastern European | 20 | 0.4% |
| English | 451 | 9.1% |
| European | 285 | 5.7% |
| French | 113 | 2.3% |
| German | 729 | 14.7% |
| Indian (Asian) | 1 | 0.0% |
| Irish | 779 | 15.7% |
| Italian | 188 | 3.8% |
| Mexican | 749 | 15.1% |
| Nicaraguan | 63 | 1.3% |
| Northern European | 21 | 0.4% |
| Norwegian | 160 | 3.2% |
| Polish | 136 | 2.7% |
| Portuguese | 45 | 0.9% |
| Puerto Rican | 118 | 2.4% |
| Russian | 300 | 6.0% |
| Scandinavian | 15 | 0.3% |
| Scotch-Irish | 43 | 0.9% |
| Scottish | 257 | 5.2% |
| Sioux | 19 | 0.4% |
| Slovak | 47 | 0.9% |
| Spaniard | 49 | 1.0% |
| Spanish | 31 | 0.6% |
| Sri Lankan | 8 | 0.2% |
| Swedish | 45 | 0.9% |
| Swiss | 48 | 1.0% |
| Welsh | 68 | 1.4% | View All 35 Rows |
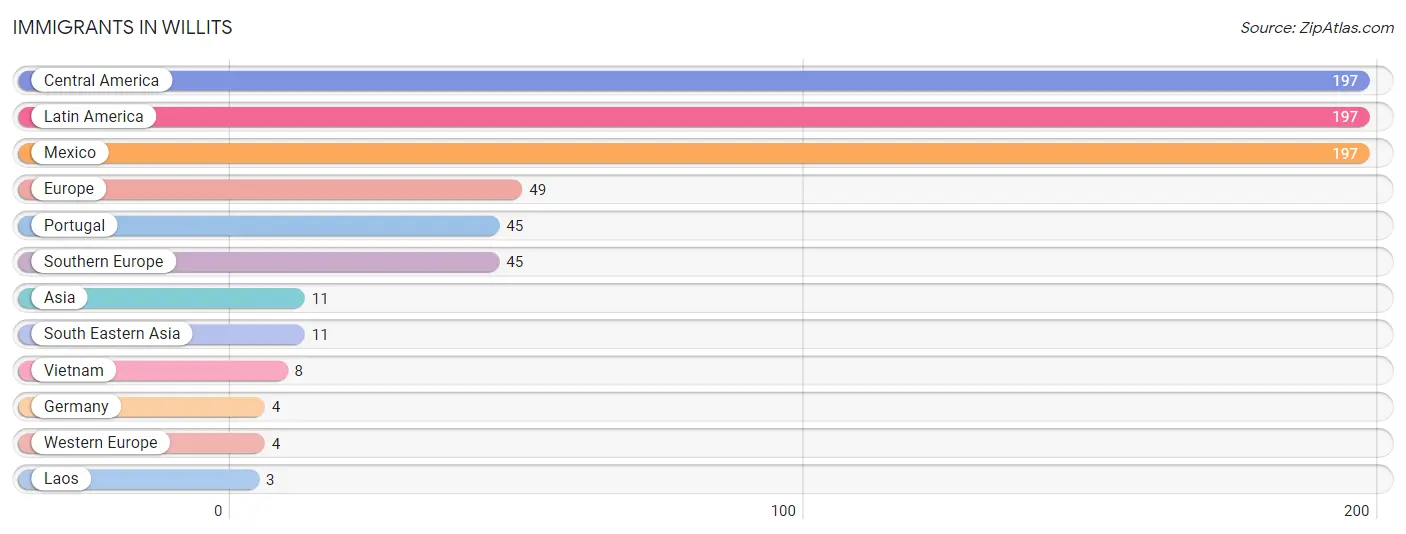
Immigrants in Willits
The most numerous immigrant groups reported in Willits came from Central America (197 | 4.0%), Latin America (197 | 4.0%), Mexico (197 | 4.0%), Europe (49 | 1.0%), and Portugal (45 | 0.9%), together accounting for 13.8% of all Willits residents.
| Immigration Origin | # Population | % Population |
| Asia | 11 | 0.2% |
| Central America | 197 | 4.0% |
| Europe | 49 | 1.0% |
| Germany | 4 | 0.1% |
| Laos | 3 | 0.1% |
| Latin America | 197 | 4.0% |
| Mexico | 197 | 4.0% |
| Portugal | 45 | 0.9% |
| South Eastern Asia | 11 | 0.2% |
| Southern Europe | 45 | 0.9% |
| Vietnam | 8 | 0.2% |
| Western Europe | 4 | 0.1% | View All 12 Rows |
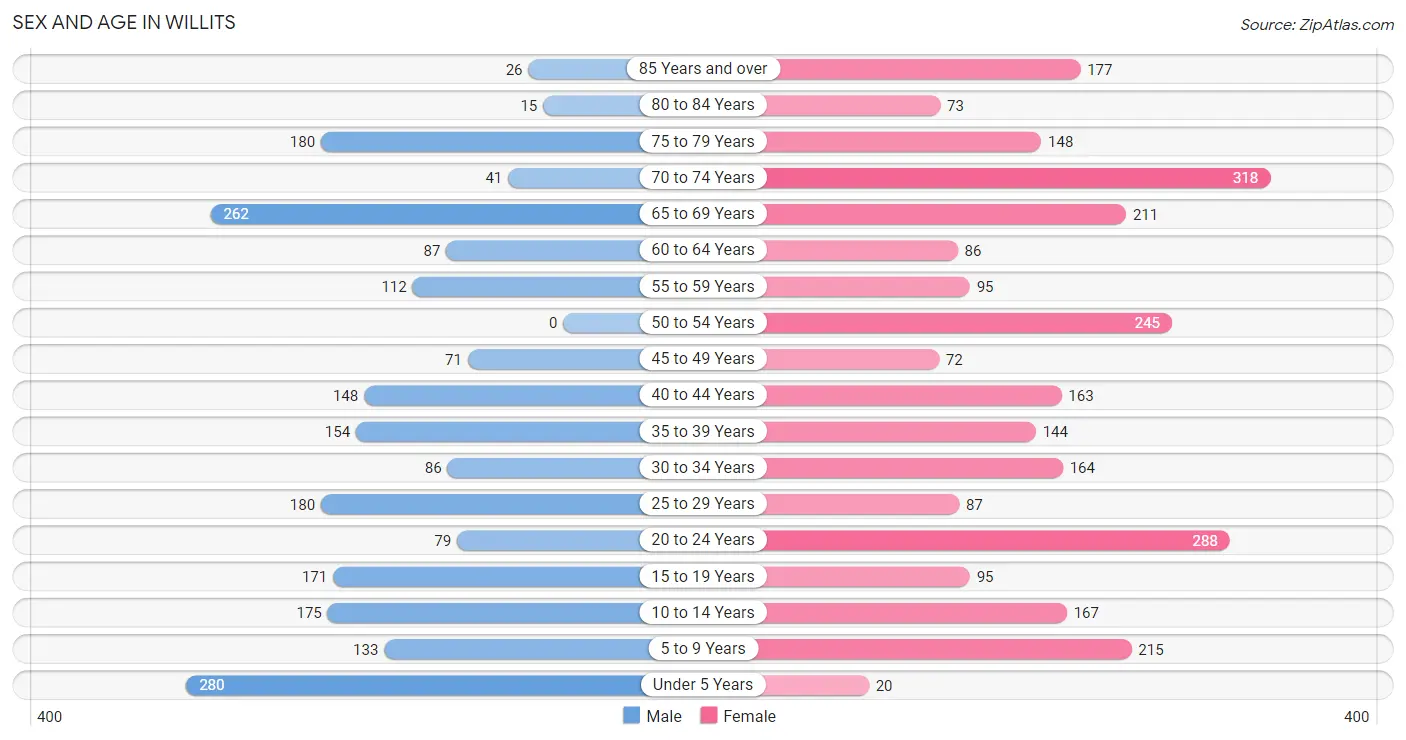
Sex and Age in Willits
Sex and Age in Willits
The most populous age groups in Willits are Under 5 Years (280 | 12.7%) for men and 70 to 74 Years (318 | 11.5%) for women.
| Age Bracket | Male | Female |
| Under 5 Years | 280 (12.7%) | 20 (0.7%) |
| 5 to 9 Years | 133 (6.0%) | 215 (7.8%) |
| 10 to 14 Years | 175 (8.0%) | 167 (6.0%) |
| 15 to 19 Years | 171 (7.8%) | 95 (3.4%) |
| 20 to 24 Years | 79 (3.6%) | 288 (10.4%) |
| 25 to 29 Years | 180 (8.2%) | 87 (3.1%) |
| 30 to 34 Years | 86 (3.9%) | 164 (5.9%) |
| 35 to 39 Years | 154 (7.0%) | 144 (5.2%) |
| 40 to 44 Years | 148 (6.7%) | 163 (5.9%) |
| 45 to 49 Years | 71 (3.2%) | 72 (2.6%) |
| 50 to 54 Years | 0 (0.0%) | 245 (8.8%) |
| 55 to 59 Years | 112 (5.1%) | 95 (3.4%) |
| 60 to 64 Years | 87 (4.0%) | 86 (3.1%) |
| 65 to 69 Years | 262 (11.9%) | 211 (7.6%) |
| 70 to 74 Years | 41 (1.9%) | 318 (11.5%) |
| 75 to 79 Years | 180 (8.2%) | 148 (5.3%) |
| 80 to 84 Years | 15 (0.7%) | 73 (2.6%) |
| 85 Years and over | 26 (1.2%) | 177 (6.4%) |
| Total | 2,200 (100.0%) | 2,768 (100.0%) |
Families and Households in Willits
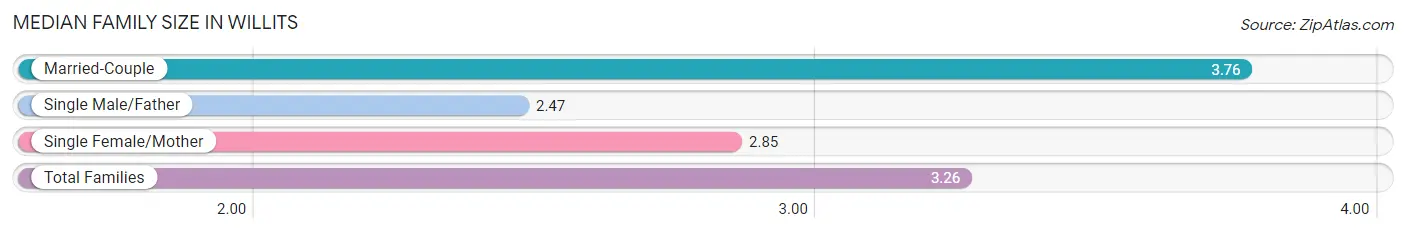
Median Family Size in Willits
The median family size in Willits is 3.26 persons per family, with married-couple families (497 | 49.3%) accounting for the largest median family size of 3.76 persons per family. On the other hand, single male/father families (94 | 9.3%) represent the smallest median family size with 2.47 persons per family.
| Family Type | # Families | Family Size |
| Married-Couple | 497 (49.3%) | 3.76 |
| Single Male/Father | 94 (9.3%) | 2.47 |
| Single Female/Mother | 418 (41.4%) | 2.85 |
| Total Families | 1,009 (100.0%) | 3.26 |
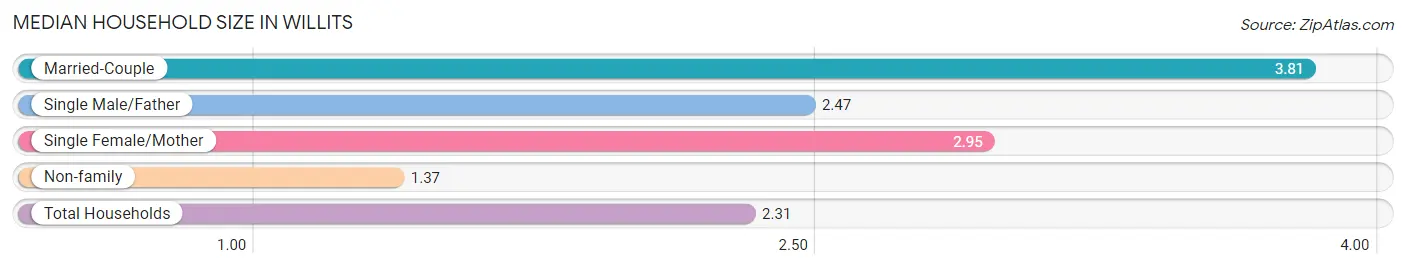
Median Household Size in Willits
The median household size in Willits is 2.31 persons per household, with married-couple households (497 | 23.6%) accounting for the largest median household size of 3.81 persons per household. non-family households (1,098 | 52.1%) represent the smallest median household size with 1.37 persons per household.
| Household Type | # Households | Household Size |
| Married-Couple | 497 (23.6%) | 3.81 |
| Single Male/Father | 94 (4.5%) | 2.47 |
| Single Female/Mother | 418 (19.8%) | 2.95 |
| Non-family | 1,098 (52.1%) | 1.37 |
| Total Households | 2,107 (100.0%) | 2.31 |
Household Size by Marriage Status in Willits
Out of a total of 2,107 households in Willits, 1,009 (47.9%) are family households, while 1,098 (52.1%) are nonfamily households. The most numerous type of family households are 2-person households, comprising 483, and the most common type of nonfamily households are 1-person households, comprising 837.
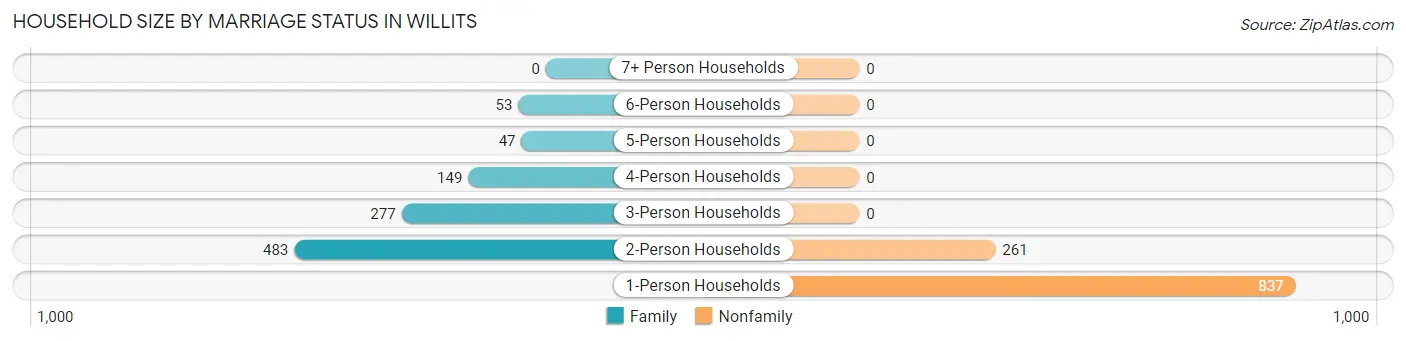
| Household Size | Family Households | Nonfamily Households |
| 1-Person Households | - | 837 (39.7%) |
| 2-Person Households | 483 (22.9%) | 261 (12.4%) |
| 3-Person Households | 277 (13.2%) | 0 (0.0%) |
| 4-Person Households | 149 (7.1%) | 0 (0.0%) |
| 5-Person Households | 47 (2.2%) | 0 (0.0%) |
| 6-Person Households | 53 (2.5%) | 0 (0.0%) |
| 7+ Person Households | 0 (0.0%) | 0 (0.0%) |
| Total | 1,009 (47.9%) | 1,098 (52.1%) |
Female Fertility in Willits
Fertility by Age in Willits
Average fertility rate in Willits is 47.0 births per 1,000 women. Women in the age bracket of 20 to 34 years have the highest fertility rate with 100.0 births per 1,000 women. Women in the age bracket of 20 to 34 years acount for 100.0% of all women with births.
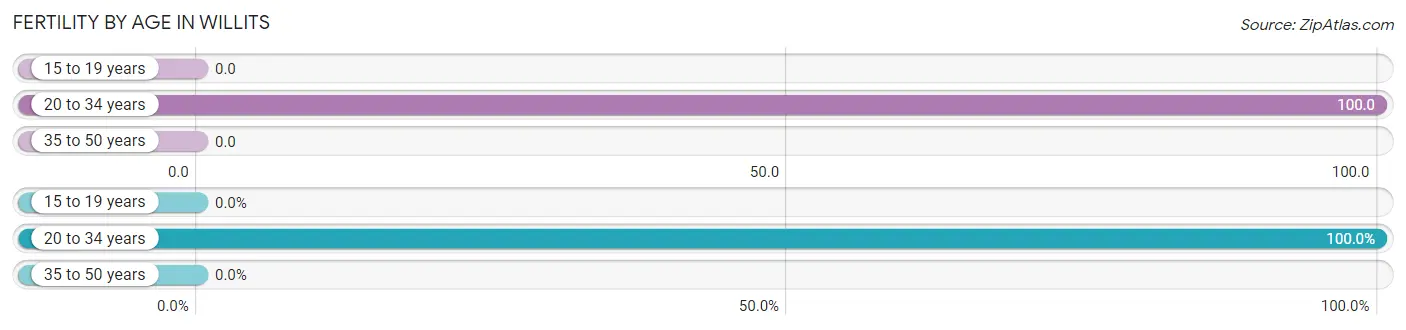
| Age Bracket | Women with Births | Births / 1,000 Women |
| 15 to 19 years | 0 (0.0%) | 0.0 |
| 20 to 34 years | 54 (100.0%) | 100.0 |
| 35 to 50 years | 0 (0.0%) | 0.0 |
| Total | 54 (100.0%) | 47.0 |
Fertility by Age by Marriage Status in Willits
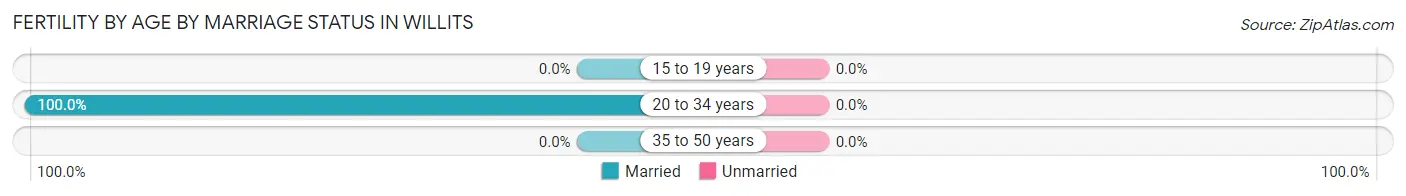
| Age Bracket | Married | Unmarried |
| 15 to 19 years | 0 (0.0%) | 0 (0.0%) |
| 20 to 34 years | 54 (100.0%) | 0 (0.0%) |
| 35 to 50 years | 0 (0.0%) | 0 (0.0%) |
| Total | 54 (100.0%) | 0 (0.0%) |
Fertility by Education in Willits

| Educational Attainment | Women with Births | Births / 1,000 Women |
| Less than High School | 0 (0.0%) | 0.0 |
| High School Diploma | 0 (0.0%) | 0.0 |
| College or Associate's Degree | 54 (100.0%) | 115.0 |
| Bachelor's Degree | 0 (0.0%) | 0.0 |
| Graduate Degree | 0 (0.0%) | 0.0 |
| Total | 54 (100.0%) | 47.0 |
Fertility by Education by Marriage Status in Willits
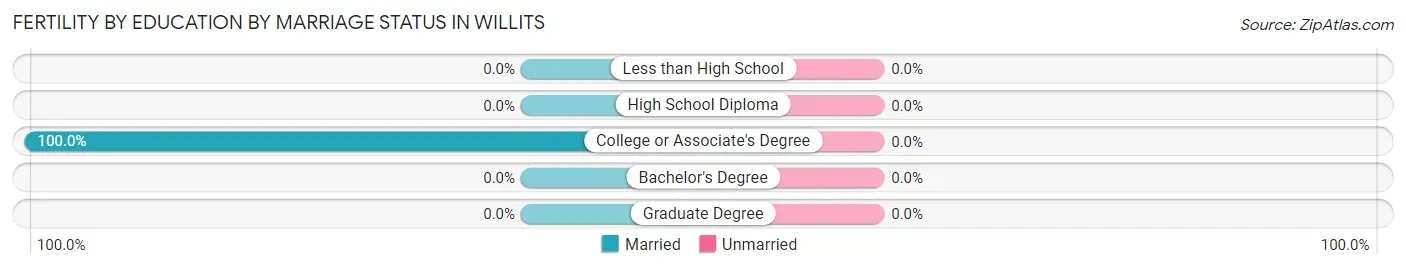
| Educational Attainment | Married | Unmarried |
| Less than High School | 0 (0.0%) | 0 (0.0%) |
| High School Diploma | 0 (0.0%) | 0 (0.0%) |
| College or Associate's Degree | 54 (100.0%) | 0 (0.0%) |
| Bachelor's Degree | 0 (0.0%) | 0 (0.0%) |
| Graduate Degree | 0 (0.0%) | 0 (0.0%) |
| Total | 54 (100.0%) | 0 (0.0%) |
Employment Characteristics in Willits
Employment by Class of Employer in Willits
Among the 1,555 employed individuals in Willits, private company employees (867 | 55.8%), not-for-profit organizations (370 | 23.8%), and self-employed (not incorporated) (105 | 6.8%) make up the most common classes of employment.
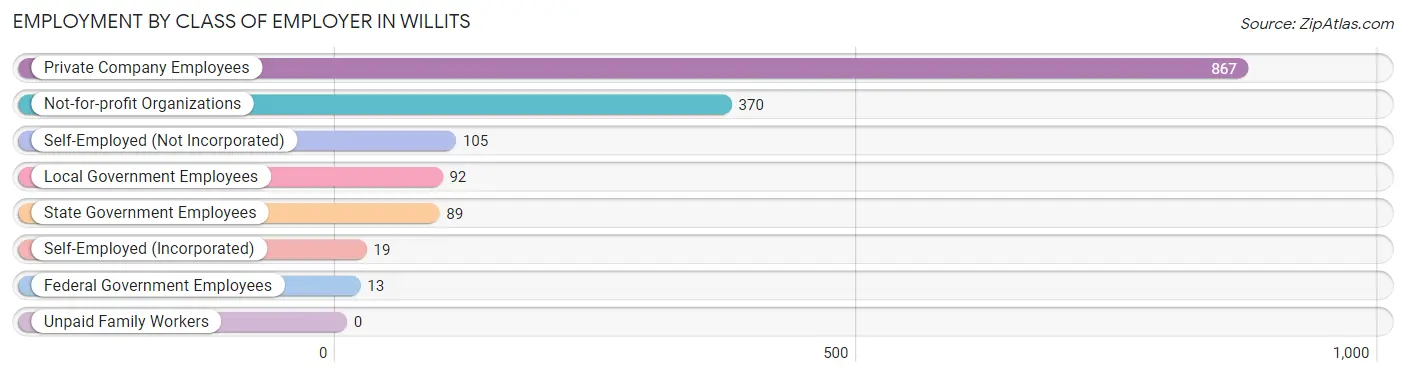
| Employer Class | # Employees | % Employees |
| Private Company Employees | 867 | 55.8% |
| Self-Employed (Incorporated) | 19 | 1.2% |
| Self-Employed (Not Incorporated) | 105 | 6.8% |
| Not-for-profit Organizations | 370 | 23.8% |
| Local Government Employees | 92 | 5.9% |
| State Government Employees | 89 | 5.7% |
| Federal Government Employees | 13 | 0.8% |
| Unpaid Family Workers | 0 | 0.0% |
| Total | 1,555 | 100.0% |
Employment Status by Age in Willits
According to the labor force statistics for Willits, out of the total population over 16 years of age (3,978), 48.4% or 1,925 individuals are in the labor force, with 13.8% or 266 of them unemployed. The age group with the highest labor force participation rate is 55 to 59 years, with 83.1% or 172 individuals in the labor force. Within the labor force, the 65 to 74 years age range has the highest percentage of unemployed individuals, with 46.5% or 139 of them being unemployed.
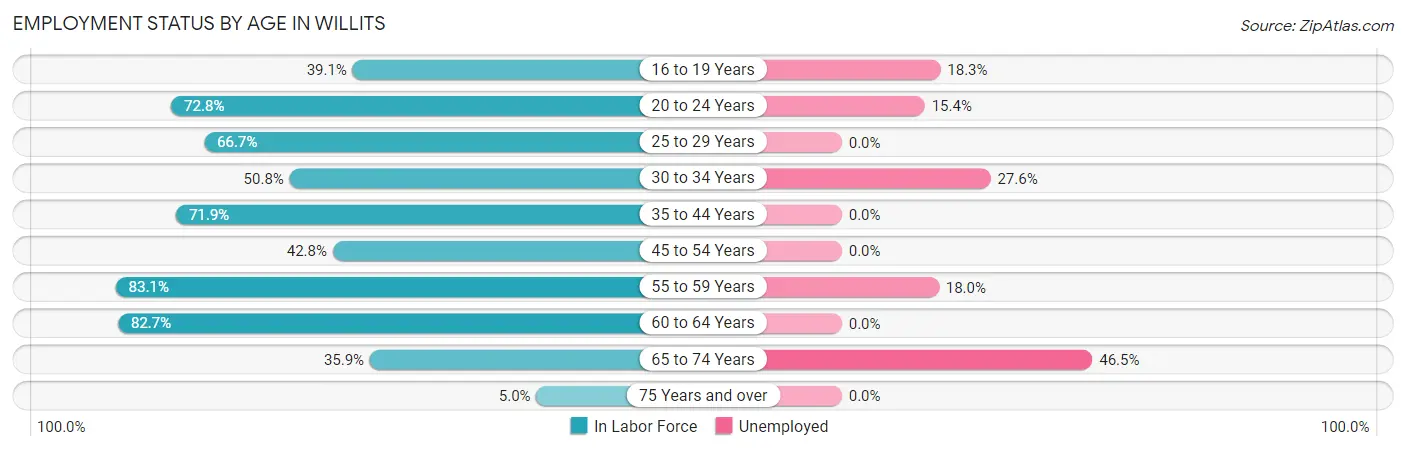
| Age Bracket | In Labor Force | Unemployed |
| 16 to 19 Years | 104 (39.1%) | 19 (18.3%) |
| 20 to 24 Years | 267 (72.8%) | 41 (15.4%) |
| 25 to 29 Years | 178 (66.7%) | 0 (0.0%) |
| 30 to 34 Years | 127 (50.8%) | 35 (27.6%) |
| 35 to 44 Years | 438 (71.9%) | 0 (0.0%) |
| 45 to 54 Years | 166 (42.8%) | 0 (0.0%) |
| 55 to 59 Years | 172 (83.1%) | 31 (18.0%) |
| 60 to 64 Years | 143 (82.7%) | 0 (0.0%) |
| 65 to 74 Years | 299 (35.9%) | 139 (46.5%) |
| 75 Years and over | 31 (5.0%) | 0 (0.0%) |
| Total | 1,925 (48.4%) | 266 (13.8%) |
Employment Status by Educational Attainment in Willits
According to labor force statistics for Willits, 64.6% of individuals (1,224) out of the total population between 25 and 64 years of age (1,894) are in the labor force, with 5.4% or 66 of them being unemployed. The group with the highest labor force participation rate are those with the educational attainment of bachelor's degree or higher, with 80.5% or 285 individuals in the labor force. Within the labor force, individuals with bachelor's degree or higher education have the highest percentage of unemployment, with 14.0% or 40 of them being unemployed.
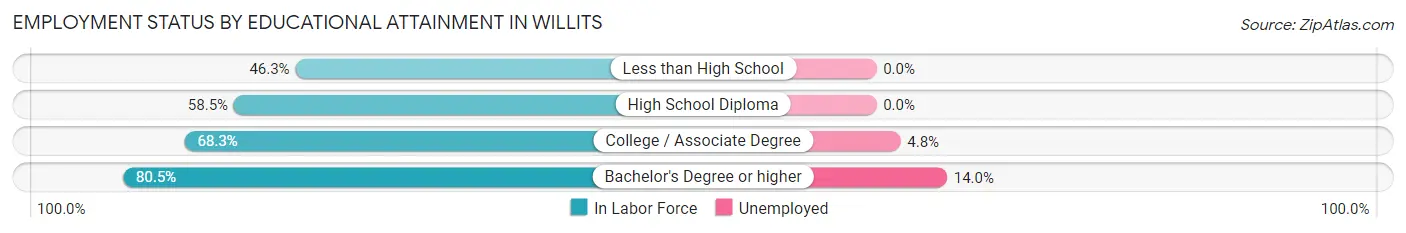
| Educational Attainment | In Labor Force | Unemployed |
| Less than High School | 148 (46.3%) | 0 (0.0%) |
| High School Diploma | 254 (58.5%) | 0 (0.0%) |
| College / Associate Degree | 537 (68.3%) | 38 (4.8%) |
| Bachelor's Degree or higher | 285 (80.5%) | 50 (14.0%) |
| Total | 1,224 (64.6%) | 102 (5.4%) |
Employment Occupations by Sex in Willits
Management, Business, Science and Arts Occupations
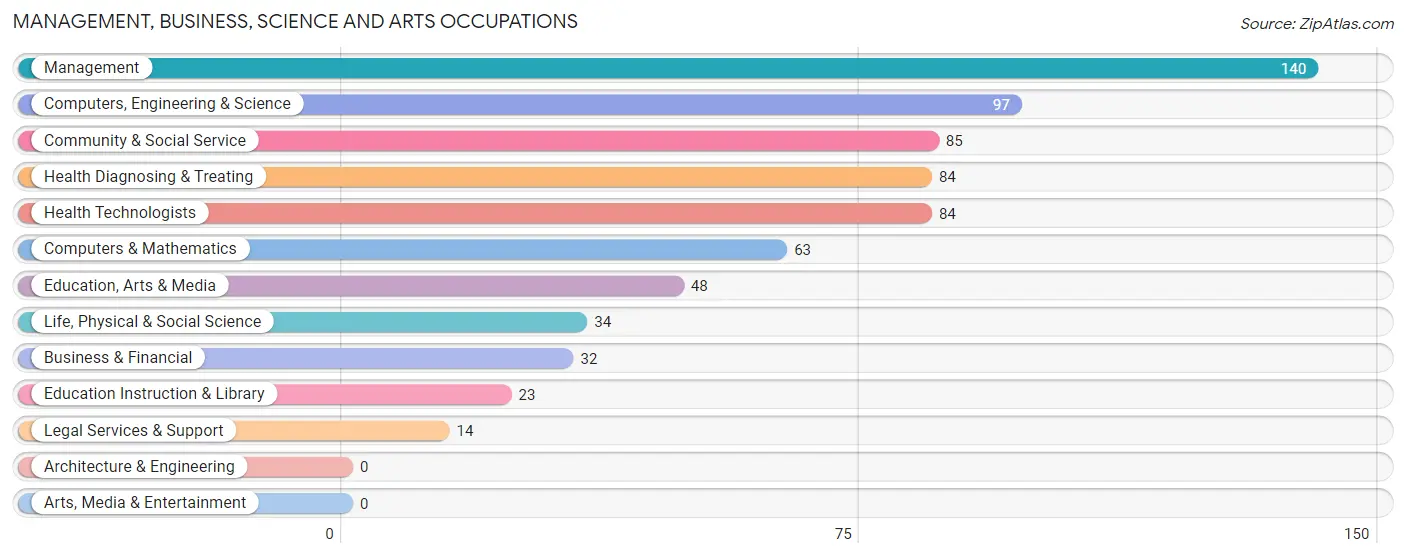
The most common Management, Business, Science and Arts occupations in Willits are Management (140 | 8.4%), Computers, Engineering & Science (97 | 5.8%), Community & Social Service (85 | 5.1%), Health Diagnosing & Treating (84 | 5.1%), and Health Technologists (84 | 5.1%).
Management, Business, Science and Arts Occupations by Sex
Within the Management, Business, Science and Arts occupations in Willits, the most male-oriented occupations are Legal Services & Support (100.0%), Management (70.0%), and Computers & Mathematics (55.6%), while the most female-oriented occupations are Education, Arts & Media (100.0%), Education Instruction & Library (100.0%), and Health Diagnosing & Treating (100.0%).
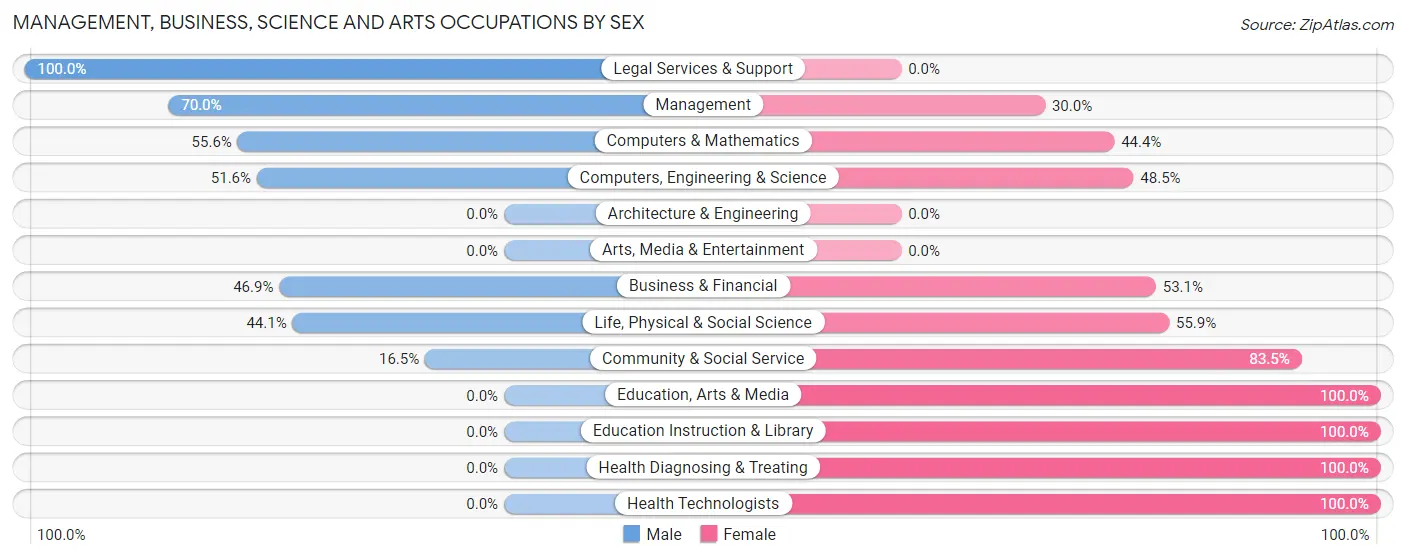
| Occupation | Male | Female |
| Management | 98 (70.0%) | 42 (30.0%) |
| Business & Financial | 15 (46.9%) | 17 (53.1%) |
| Computers, Engineering & Science | 50 (51.5%) | 47 (48.4%) |
| Computers & Mathematics | 35 (55.6%) | 28 (44.4%) |
| Architecture & Engineering | 0 (0.0%) | 0 (0.0%) |
| Life, Physical & Social Science | 15 (44.1%) | 19 (55.9%) |
| Community & Social Service | 14 (16.5%) | 71 (83.5%) |
| Education, Arts & Media | 0 (0.0%) | 48 (100.0%) |
| Legal Services & Support | 14 (100.0%) | 0 (0.0%) |
| Education Instruction & Library | 0 (0.0%) | 23 (100.0%) |
| Arts, Media & Entertainment | 0 (0.0%) | 0 (0.0%) |
| Health Diagnosing & Treating | 0 (0.0%) | 84 (100.0%) |
| Health Technologists | 0 (0.0%) | 84 (100.0%) |
| Total (Category) | 177 (40.4%) | 261 (59.6%) |
| Total (Overall) | 775 (46.7%) | 885 (53.3%) |
Services Occupations
The most common Services occupations in Willits are Healthcare Support (225 | 13.6%), Cleaning & Maintenance (153 | 9.2%), Personal Care & Service (59 | 3.5%), and Food Preparation & Serving (41 | 2.5%).
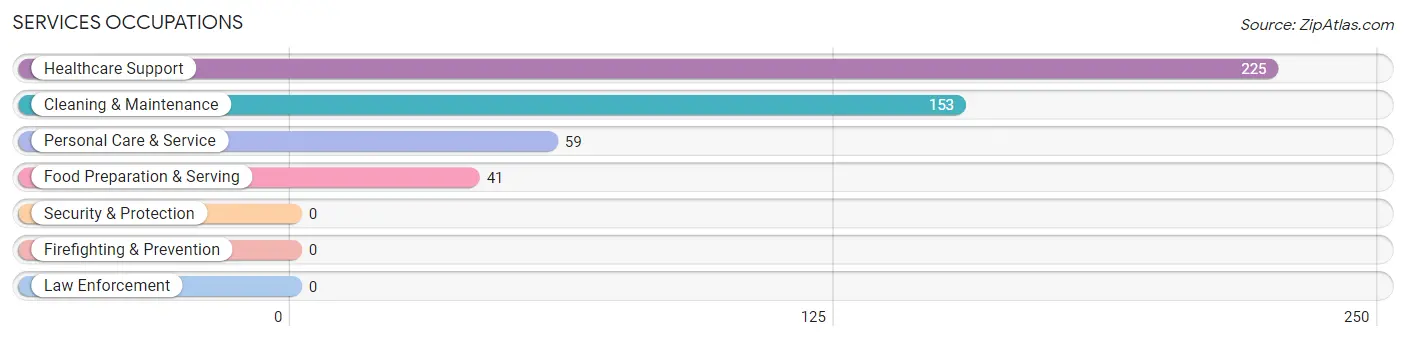
Services Occupations by Sex
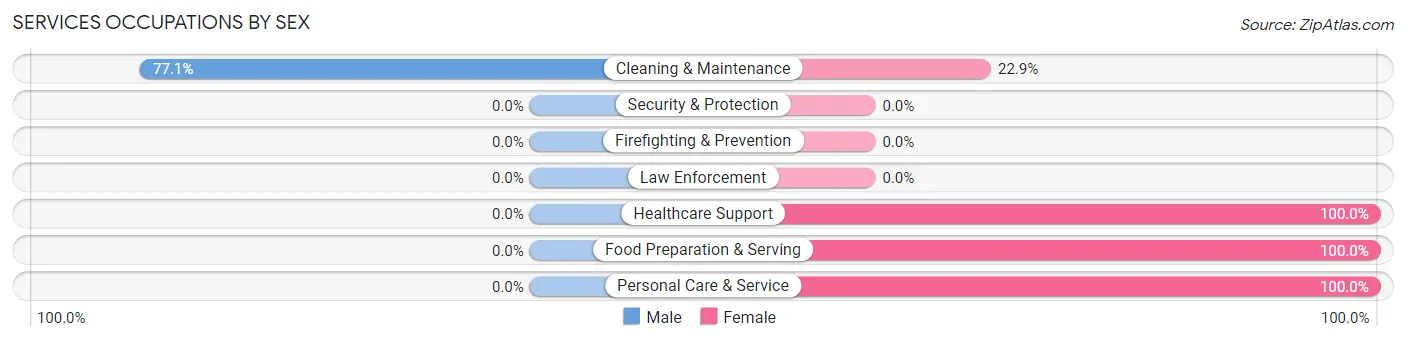
| Occupation | Male | Female |
| Healthcare Support | 0 (0.0%) | 225 (100.0%) |
| Security & Protection | 0 (0.0%) | 0 (0.0%) |
| Firefighting & Prevention | 0 (0.0%) | 0 (0.0%) |
| Law Enforcement | 0 (0.0%) | 0 (0.0%) |
| Food Preparation & Serving | 0 (0.0%) | 41 (100.0%) |
| Cleaning & Maintenance | 118 (77.1%) | 35 (22.9%) |
| Personal Care & Service | 0 (0.0%) | 59 (100.0%) |
| Total (Category) | 118 (24.7%) | 360 (75.3%) |
| Total (Overall) | 775 (46.7%) | 885 (53.3%) |
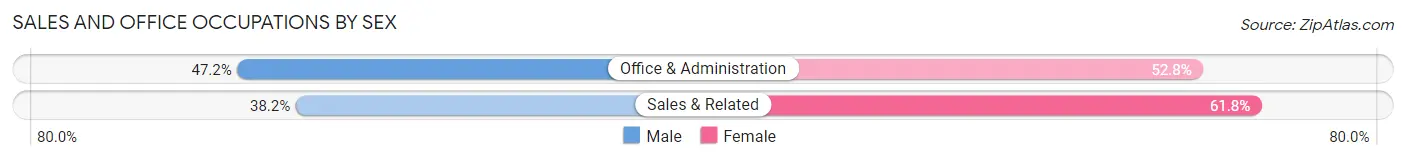
Sales and Office Occupations
The most common Sales and Office occupations in Willits are Office & Administration (381 | 23.0%), and Sales & Related (102 | 6.1%).
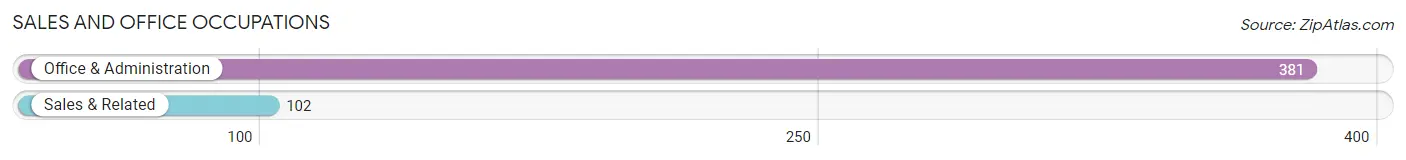
Sales and Office Occupations by Sex
| Occupation | Male | Female |
| Sales & Related | 39 (38.2%) | 63 (61.8%) |
| Office & Administration | 180 (47.2%) | 201 (52.8%) |
| Total (Category) | 219 (45.3%) | 264 (54.7%) |
| Total (Overall) | 775 (46.7%) | 885 (53.3%) |
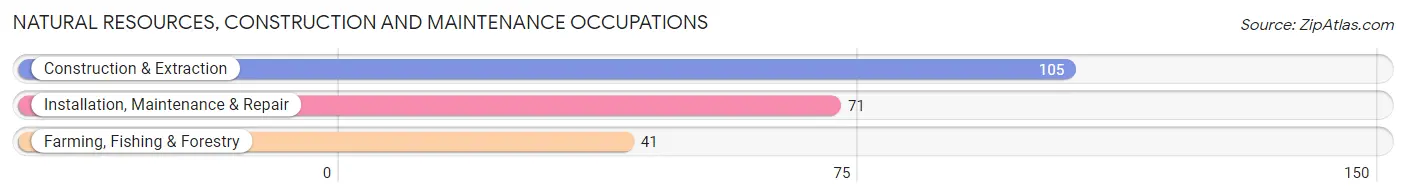
Natural Resources, Construction and Maintenance Occupations
The most common Natural Resources, Construction and Maintenance occupations in Willits are Construction & Extraction (105 | 6.3%), Installation, Maintenance & Repair (71 | 4.3%), and Farming, Fishing & Forestry (41 | 2.5%).
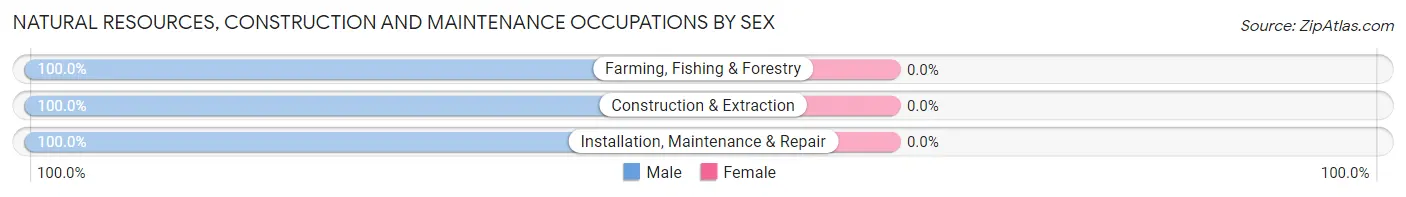
Natural Resources, Construction and Maintenance Occupations by Sex
| Occupation | Male | Female |
| Farming, Fishing & Forestry | 41 (100.0%) | 0 (0.0%) |
| Construction & Extraction | 105 (100.0%) | 0 (0.0%) |
| Installation, Maintenance & Repair | 71 (100.0%) | 0 (0.0%) |
| Total (Category) | 217 (100.0%) | 0 (0.0%) |
| Total (Overall) | 775 (46.7%) | 885 (53.3%) |
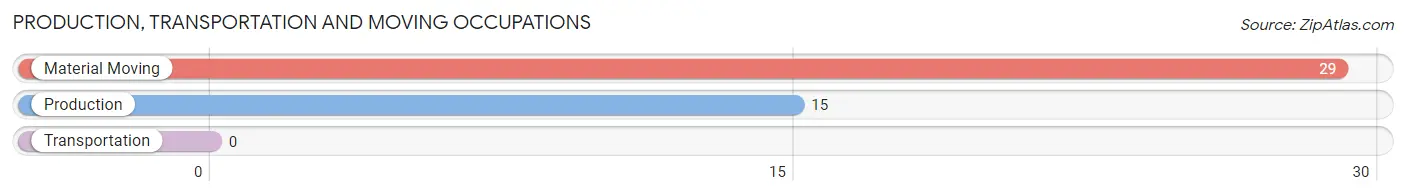
Production, Transportation and Moving Occupations
The most common Production, Transportation and Moving occupations in Willits are Material Moving (29 | 1.8%), and Production (15 | 0.9%).
Production, Transportation and Moving Occupations by Sex
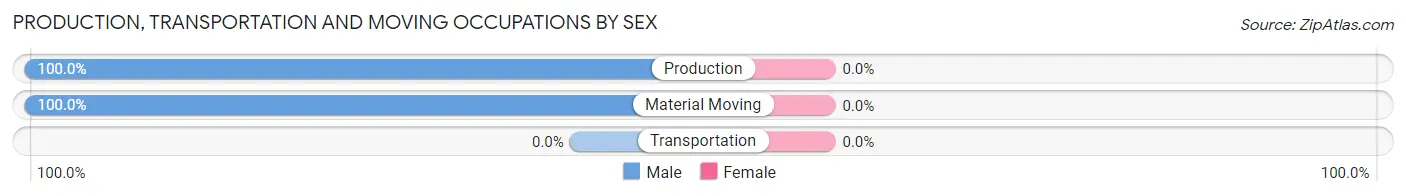
| Occupation | Male | Female |
| Production | 15 (100.0%) | 0 (0.0%) |
| Transportation | 0 (0.0%) | 0 (0.0%) |
| Material Moving | 29 (100.0%) | 0 (0.0%) |
| Total (Category) | 44 (100.0%) | 0 (0.0%) |
| Total (Overall) | 775 (46.7%) | 885 (53.3%) |
Employment Industries by Sex in Willits
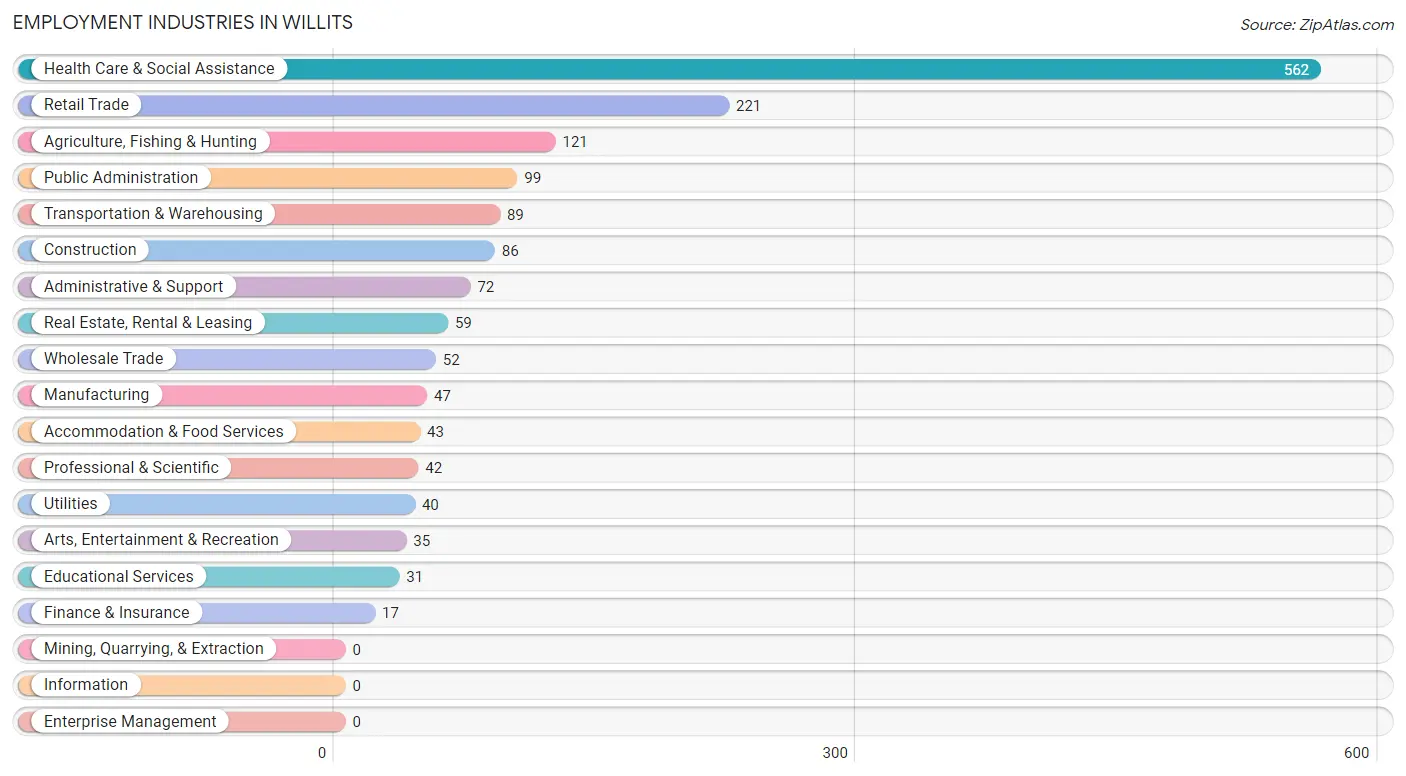
Employment Industries in Willits
The major employment industries in Willits include Health Care & Social Assistance (562 | 33.9%), Retail Trade (221 | 13.3%), Agriculture, Fishing & Hunting (121 | 7.3%), Public Administration (99 | 6.0%), and Transportation & Warehousing (89 | 5.4%).
Employment Industries by Sex in Willits
The Willits industries that see more men than women are Construction (100.0%), Manufacturing (100.0%), and Wholesale Trade (100.0%), whereas the industries that tend to have a higher number of women are Finance & Insurance (100.0%), Educational Services (100.0%), and Accommodation & Food Services (100.0%).
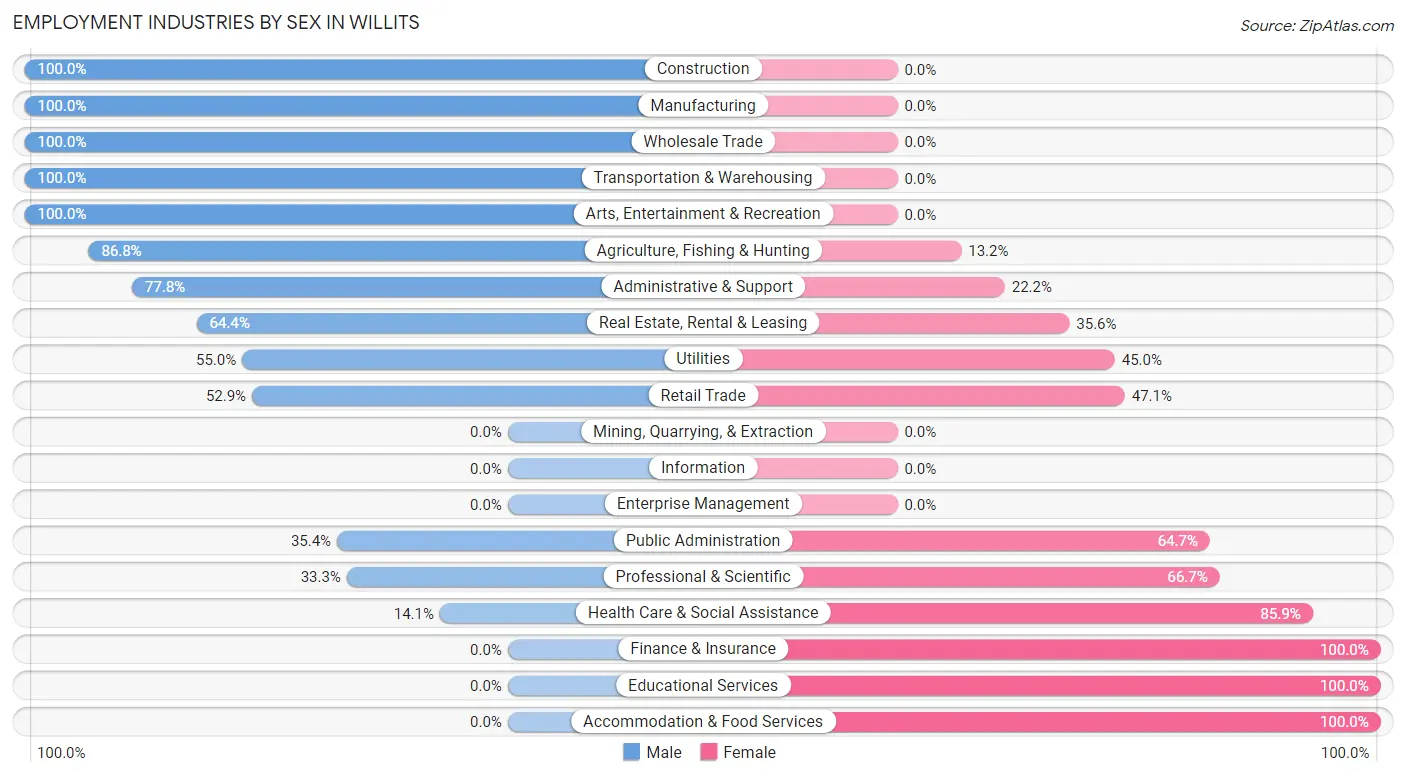
| Industry | Male | Female |
| Agriculture, Fishing & Hunting | 105 (86.8%) | 16 (13.2%) |
| Mining, Quarrying, & Extraction | 0 (0.0%) | 0 (0.0%) |
| Construction | 86 (100.0%) | 0 (0.0%) |
| Manufacturing | 47 (100.0%) | 0 (0.0%) |
| Wholesale Trade | 52 (100.0%) | 0 (0.0%) |
| Retail Trade | 117 (52.9%) | 104 (47.1%) |
| Transportation & Warehousing | 89 (100.0%) | 0 (0.0%) |
| Utilities | 22 (55.0%) | 18 (45.0%) |
| Information | 0 (0.0%) | 0 (0.0%) |
| Finance & Insurance | 0 (0.0%) | 17 (100.0%) |
| Real Estate, Rental & Leasing | 38 (64.4%) | 21 (35.6%) |
| Professional & Scientific | 14 (33.3%) | 28 (66.7%) |
| Enterprise Management | 0 (0.0%) | 0 (0.0%) |
| Administrative & Support | 56 (77.8%) | 16 (22.2%) |
| Educational Services | 0 (0.0%) | 31 (100.0%) |
| Health Care & Social Assistance | 79 (14.1%) | 483 (85.9%) |
| Arts, Entertainment & Recreation | 35 (100.0%) | 0 (0.0%) |
| Accommodation & Food Services | 0 (0.0%) | 43 (100.0%) |
| Public Administration | 35 (35.3%) | 64 (64.6%) |
| Total | 775 (46.7%) | 885 (53.3%) |
Education in Willits
School Enrollment in Willits
The most common levels of schooling among the 1,028 students in Willits are elementary school (285 | 27.7%), middle school (272 | 26.5%), and college / undergraduate (197 | 19.2%).
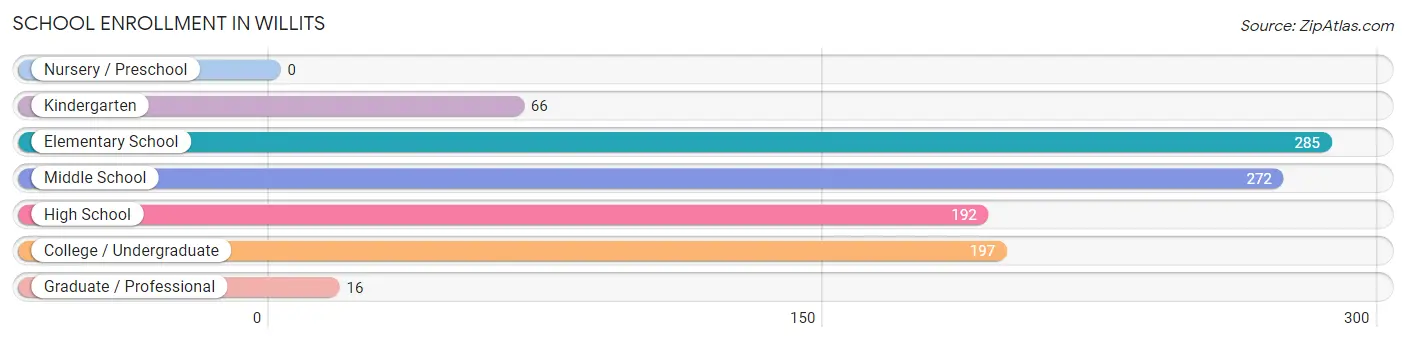
| School Level | # Students | % Students |
| Nursery / Preschool | 0 | 0.0% |
| Kindergarten | 66 | 6.4% |
| Elementary School | 285 | 27.7% |
| Middle School | 272 | 26.5% |
| High School | 192 | 18.7% |
| College / Undergraduate | 197 | 19.2% |
| Graduate / Professional | 16 | 1.6% |
| Total | 1,028 | 100.0% |
School Enrollment by Age by Funding Source in Willits
Out of a total of 1,028 students who are enrolled in schools in Willits, 71 (6.9%) attend a private institution, while the remaining 957 (93.1%) are enrolled in public schools. The age group of 20 to 24 year olds has the highest likelihood of being enrolled in private schools, with 54 (100.0% in the age bracket) enrolled. Conversely, the age group of 5 to 9 year old has the lowest likelihood of being enrolled in a private school, with 290 (100.0% in the age bracket) attending a public institution.
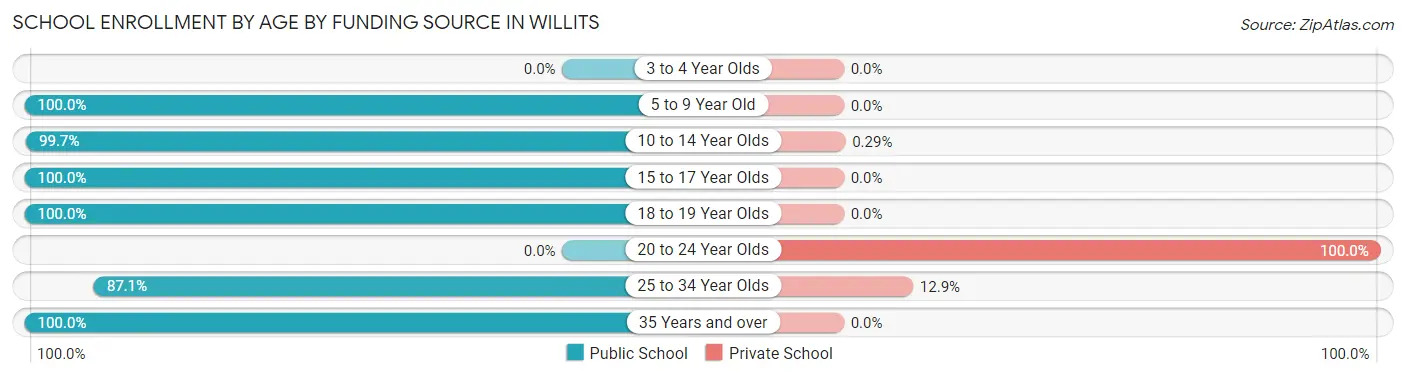
| Age Bracket | Public School | Private School |
| 3 to 4 Year Olds | 0 (0.0%) | 0 (0.0%) |
| 5 to 9 Year Old | 290 (100.0%) | 0 (0.0%) |
| 10 to 14 Year Olds | 341 (99.7%) | 1 (0.3%) |
| 15 to 17 Year Olds | 66 (100.0%) | 0 (0.0%) |
| 18 to 19 Year Olds | 117 (100.0%) | 0 (0.0%) |
| 20 to 24 Year Olds | 0 (0.0%) | 54 (100.0%) |
| 25 to 34 Year Olds | 108 (87.1%) | 16 (12.9%) |
| 35 Years and over | 35 (100.0%) | 0 (0.0%) |
| Total | 957 (93.1%) | 71 (6.9%) |
Educational Attainment by Field of Study in Willits
Business (190 | 28.7%), education (83 | 12.5%), science & technology (71 | 10.7%), computers & mathematics (62 | 9.3%), and psychology (48 | 7.2%) are the most common fields of study among 663 individuals in Willits who have obtained a bachelor's degree or higher.
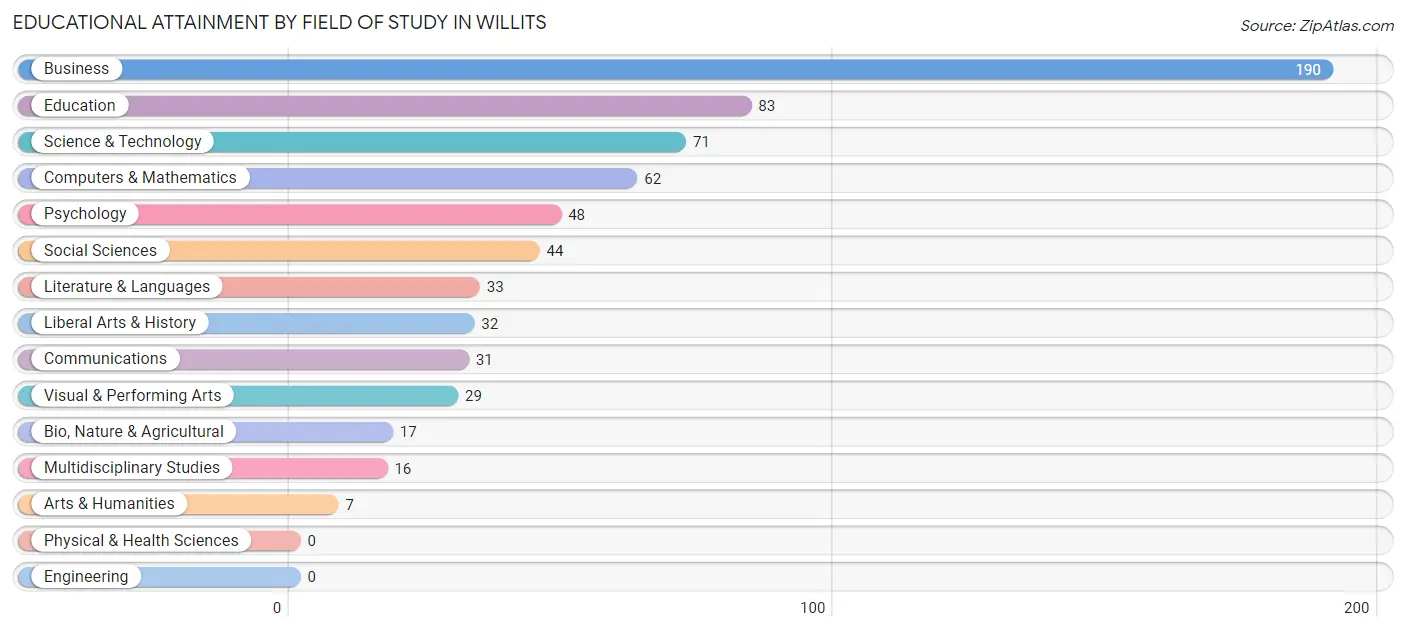
| Field of Study | # Graduates | % Graduates |
| Computers & Mathematics | 62 | 9.3% |
| Bio, Nature & Agricultural | 17 | 2.6% |
| Physical & Health Sciences | 0 | 0.0% |
| Psychology | 48 | 7.2% |
| Social Sciences | 44 | 6.6% |
| Engineering | 0 | 0.0% |
| Multidisciplinary Studies | 16 | 2.4% |
| Science & Technology | 71 | 10.7% |
| Business | 190 | 28.7% |
| Education | 83 | 12.5% |
| Literature & Languages | 33 | 5.0% |
| Liberal Arts & History | 32 | 4.8% |
| Visual & Performing Arts | 29 | 4.4% |
| Communications | 31 | 4.7% |
| Arts & Humanities | 7 | 1.1% |
| Total | 663 | 100.0% |
Transportation & Commute in Willits
Vehicle Availability by Sex in Willits
The most prevalent vehicle ownership categories in Willits are males with 1 vehicle (208, accounting for 27.7%) and females with 1 vehicle (364, making up 26.0%).
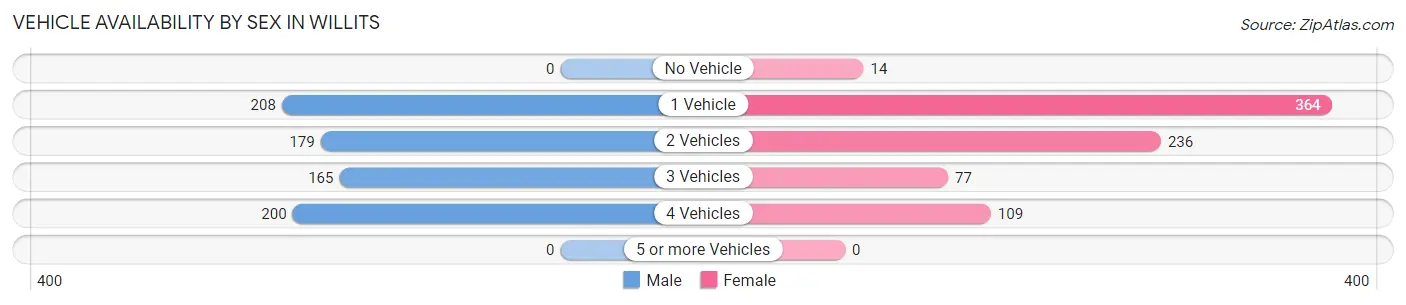
| Vehicles Available | Male | Female |
| No Vehicle | 0 (0.0%) | 14 (1.8%) |
| 1 Vehicle | 208 (27.7%) | 364 (45.5%) |
| 2 Vehicles | 179 (23.8%) | 236 (29.5%) |
| 3 Vehicles | 165 (21.9%) | 77 (9.6%) |
| 4 Vehicles | 200 (26.6%) | 109 (13.6%) |
| 5 or more Vehicles | 0 (0.0%) | 0 (0.0%) |
| Total | 752 (100.0%) | 800 (100.0%) |
Commute Time in Willits
The most frequently occuring commute durations in Willits are 5 to 9 minutes (380 commuters, 25.9%), 10 to 14 minutes (368 commuters, 25.1%), and 30 to 34 minutes (310 commuters, 21.1%).
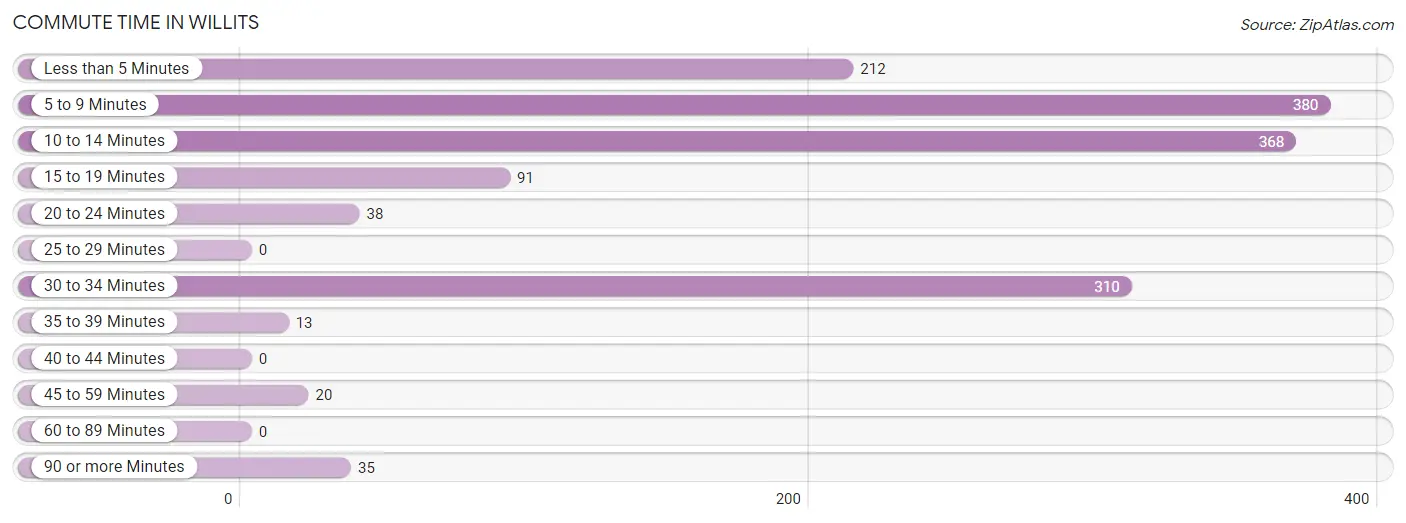
| Commute Time | # Commuters | % Commuters |
| Less than 5 Minutes | 212 | 14.4% |
| 5 to 9 Minutes | 380 | 25.9% |
| 10 to 14 Minutes | 368 | 25.1% |
| 15 to 19 Minutes | 91 | 6.2% |
| 20 to 24 Minutes | 38 | 2.6% |
| 25 to 29 Minutes | 0 | 0.0% |
| 30 to 34 Minutes | 310 | 21.1% |
| 35 to 39 Minutes | 13 | 0.9% |
| 40 to 44 Minutes | 0 | 0.0% |
| 45 to 59 Minutes | 20 | 1.4% |
| 60 to 89 Minutes | 0 | 0.0% |
| 90 or more Minutes | 35 | 2.4% |
Commute Time by Sex in Willits
The most common commute times in Willits are 30 to 34 minutes (257 commuters, 37.6%) for males and 5 to 9 minutes (259 commuters, 33.1%) for females.
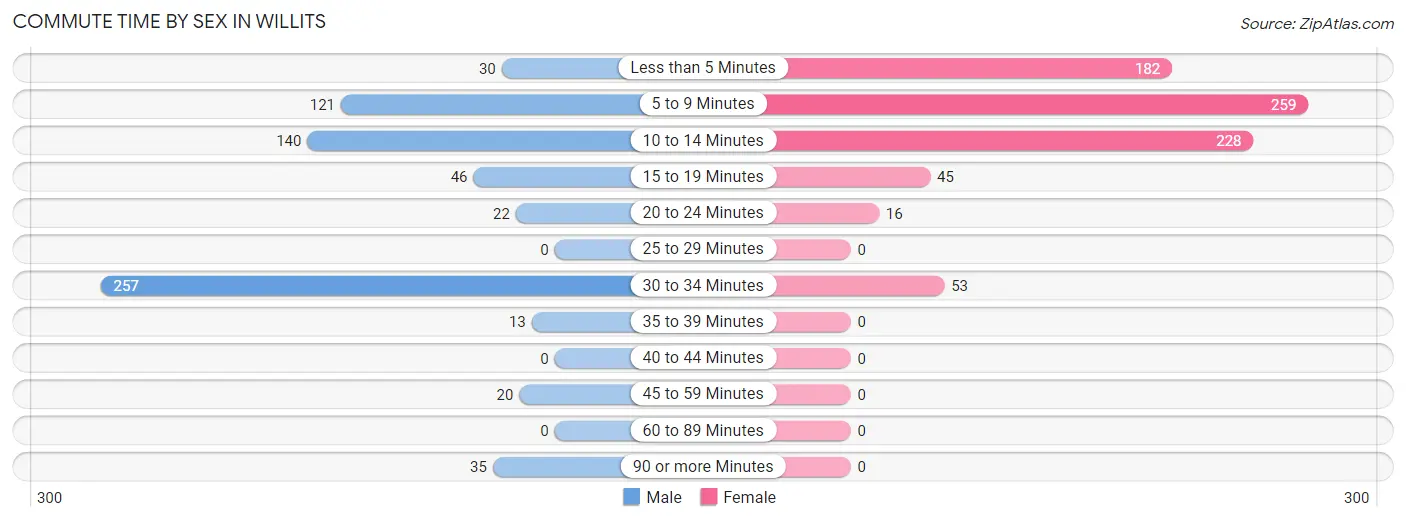
| Commute Time | Male | Female |
| Less than 5 Minutes | 30 (4.4%) | 182 (23.2%) |
| 5 to 9 Minutes | 121 (17.7%) | 259 (33.1%) |
| 10 to 14 Minutes | 140 (20.5%) | 228 (29.1%) |
| 15 to 19 Minutes | 46 (6.7%) | 45 (5.8%) |
| 20 to 24 Minutes | 22 (3.2%) | 16 (2.0%) |
| 25 to 29 Minutes | 0 (0.0%) | 0 (0.0%) |
| 30 to 34 Minutes | 257 (37.6%) | 53 (6.8%) |
| 35 to 39 Minutes | 13 (1.9%) | 0 (0.0%) |
| 40 to 44 Minutes | 0 (0.0%) | 0 (0.0%) |
| 45 to 59 Minutes | 20 (2.9%) | 0 (0.0%) |
| 60 to 89 Minutes | 0 (0.0%) | 0 (0.0%) |
| 90 or more Minutes | 35 (5.1%) | 0 (0.0%) |
Time of Departure to Work by Sex in Willits
The most frequent times of departure to work in Willits are 12:00 AM to 4:59 AM (211, 30.8%) for males and 8:00 AM to 8:29 AM (187, 23.9%) for females.
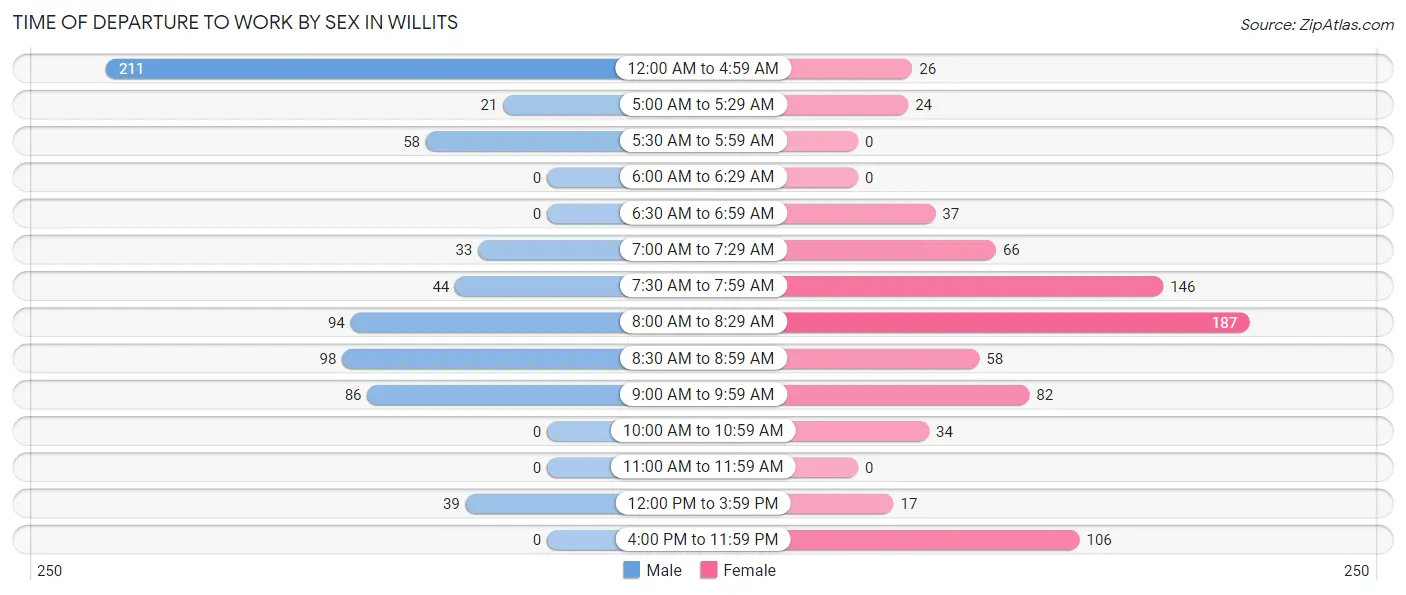
| Time of Departure | Male | Female |
| 12:00 AM to 4:59 AM | 211 (30.8%) | 26 (3.3%) |
| 5:00 AM to 5:29 AM | 21 (3.1%) | 24 (3.1%) |
| 5:30 AM to 5:59 AM | 58 (8.5%) | 0 (0.0%) |
| 6:00 AM to 6:29 AM | 0 (0.0%) | 0 (0.0%) |
| 6:30 AM to 6:59 AM | 0 (0.0%) | 37 (4.7%) |
| 7:00 AM to 7:29 AM | 33 (4.8%) | 66 (8.4%) |
| 7:30 AM to 7:59 AM | 44 (6.4%) | 146 (18.6%) |
| 8:00 AM to 8:29 AM | 94 (13.7%) | 187 (23.9%) |
| 8:30 AM to 8:59 AM | 98 (14.3%) | 58 (7.4%) |
| 9:00 AM to 9:59 AM | 86 (12.6%) | 82 (10.5%) |
| 10:00 AM to 10:59 AM | 0 (0.0%) | 34 (4.3%) |
| 11:00 AM to 11:59 AM | 0 (0.0%) | 0 (0.0%) |
| 12:00 PM to 3:59 PM | 39 (5.7%) | 17 (2.2%) |
| 4:00 PM to 11:59 PM | 0 (0.0%) | 106 (13.5%) |
| Total | 684 (100.0%) | 783 (100.0%) |
Housing Occupancy in Willits
Occupancy by Ownership in Willits
Of the total 2,107 dwellings in Willits, owner-occupied units account for 738 (35.0%), while renter-occupied units make up 1,369 (65.0%).
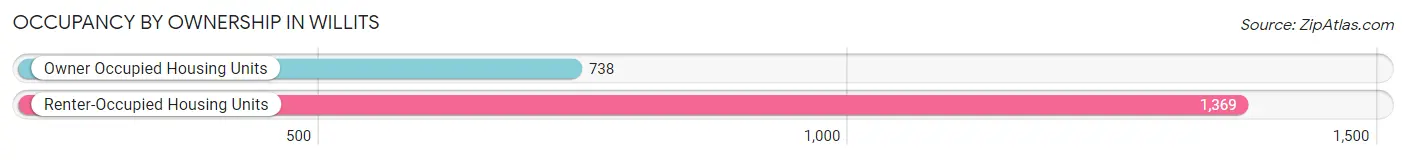
| Occupancy | # Housing Units | % Housing Units |
| Owner Occupied Housing Units | 738 | 35.0% |
| Renter-Occupied Housing Units | 1,369 | 65.0% |
| Total Occupied Housing Units | 2,107 | 100.0% |
Occupancy by Household Size in Willits
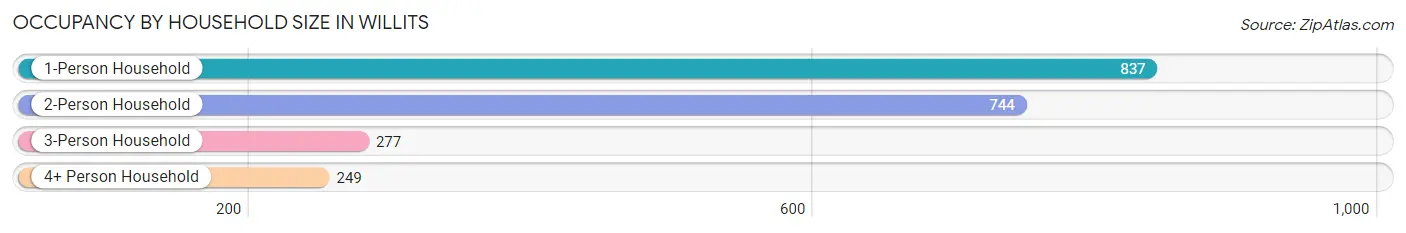
| Household Size | # Housing Units | % Housing Units |
| 1-Person Household | 837 | 39.7% |
| 2-Person Household | 744 | 35.3% |
| 3-Person Household | 277 | 13.2% |
| 4+ Person Household | 249 | 11.8% |
| Total Housing Units | 2,107 | 100.0% |
Occupancy by Ownership by Household Size in Willits
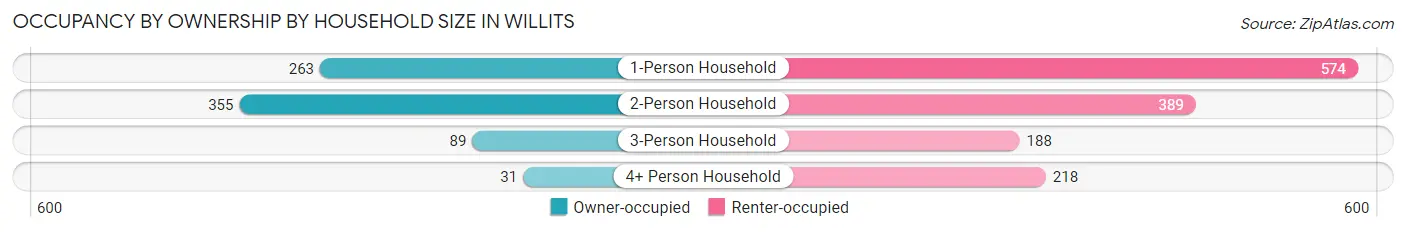
| Household Size | Owner-occupied | Renter-occupied |
| 1-Person Household | 263 (31.4%) | 574 (68.6%) |
| 2-Person Household | 355 (47.7%) | 389 (52.3%) |
| 3-Person Household | 89 (32.1%) | 188 (67.9%) |
| 4+ Person Household | 31 (12.4%) | 218 (87.5%) |
| Total Housing Units | 738 (35.0%) | 1,369 (65.0%) |
Occupancy by Educational Attainment in Willits
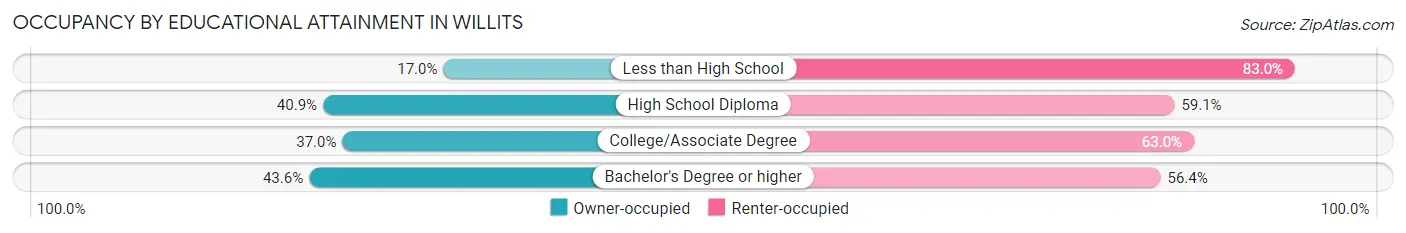
| Household Size | Owner-occupied | Renter-occupied |
| Less than High School | 62 (17.0%) | 303 (83.0%) |
| High School Diploma | 123 (40.9%) | 178 (59.1%) |
| College/Associate Degree | 423 (37.0%) | 720 (63.0%) |
| Bachelor's Degree or higher | 130 (43.6%) | 168 (56.4%) |
Occupancy by Age of Householder in Willits
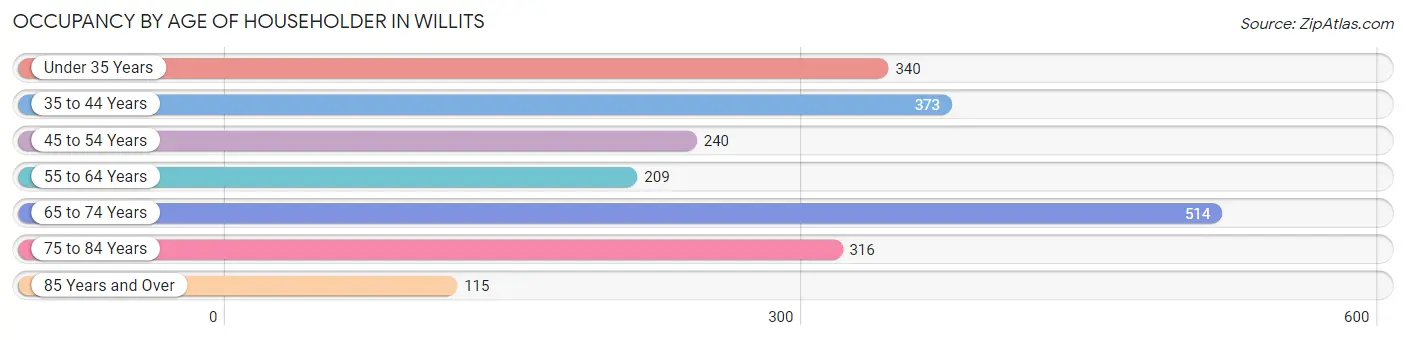
| Age Bracket | # Households | % Households |
| Under 35 Years | 340 | 16.1% |
| 35 to 44 Years | 373 | 17.7% |
| 45 to 54 Years | 240 | 11.4% |
| 55 to 64 Years | 209 | 9.9% |
| 65 to 74 Years | 514 | 24.4% |
| 75 to 84 Years | 316 | 15.0% |
| 85 Years and Over | 115 | 5.5% |
| Total | 2,107 | 100.0% |
Housing Finances in Willits
Median Income by Occupancy in Willits
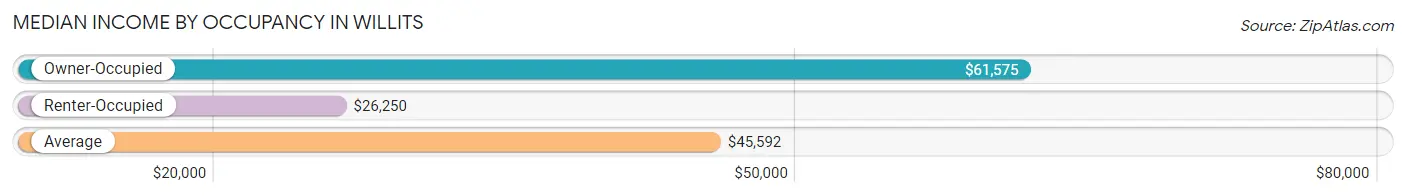
| Occupancy Type | # Households | Median Income |
| Owner-Occupied | 738 (35.0%) | $61,575 |
| Renter-Occupied | 1,369 (65.0%) | $26,250 |
| Average | 2,107 (100.0%) | $45,592 |
Occupancy by Householder Income Bracket in Willits
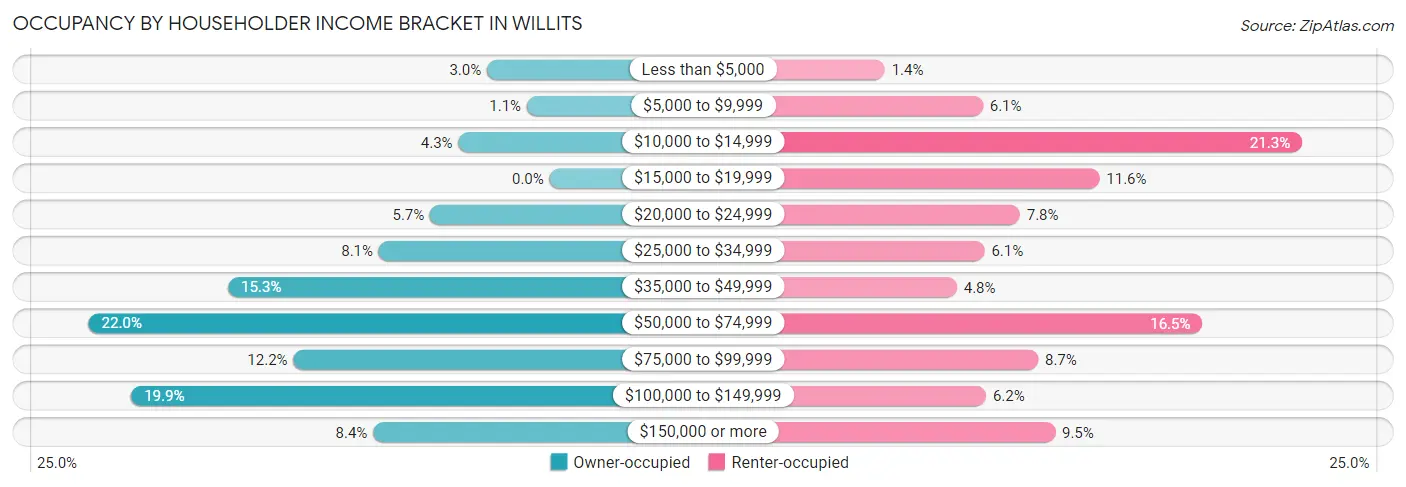
| Income Bracket | Owner-occupied | Renter-occupied |
| Less than $5,000 | 22 (3.0%) | 19 (1.4%) |
| $5,000 to $9,999 | 8 (1.1%) | 83 (6.1%) |
| $10,000 to $14,999 | 32 (4.3%) | 291 (21.3%) |
| $15,000 to $19,999 | 0 (0.0%) | 159 (11.6%) |
| $20,000 to $24,999 | 42 (5.7%) | 107 (7.8%) |
| $25,000 to $34,999 | 60 (8.1%) | 84 (6.1%) |
| $35,000 to $49,999 | 113 (15.3%) | 66 (4.8%) |
| $50,000 to $74,999 | 162 (22.0%) | 226 (16.5%) |
| $75,000 to $99,999 | 90 (12.2%) | 119 (8.7%) |
| $100,000 to $149,999 | 147 (19.9%) | 85 (6.2%) |
| $150,000 or more | 62 (8.4%) | 130 (9.5%) |
| Total | 738 (100.0%) | 1,369 (100.0%) |
Monthly Housing Cost Tiers in Willits
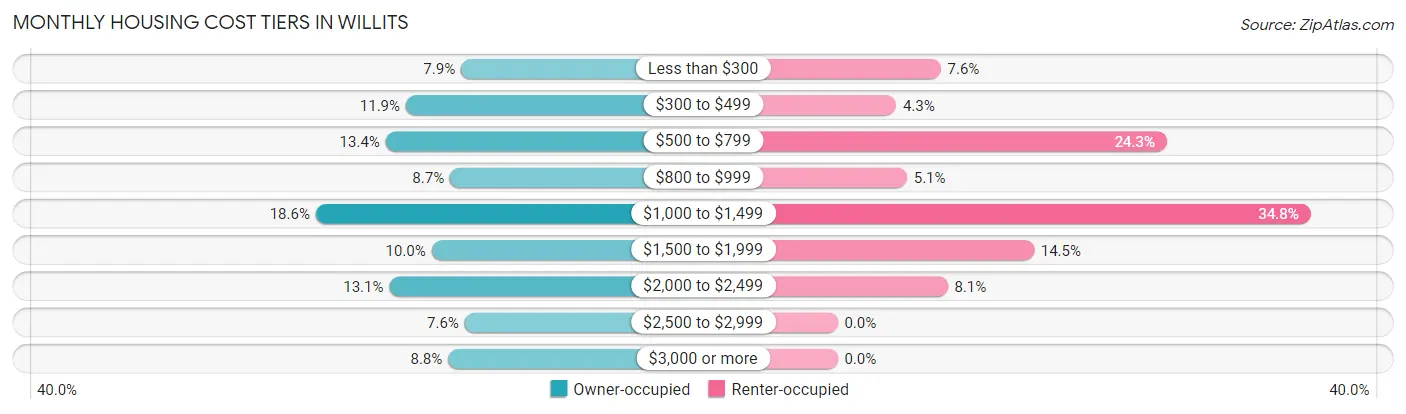
| Monthly Cost | Owner-occupied | Renter-occupied |
| Less than $300 | 58 (7.9%) | 104 (7.6%) |
| $300 to $499 | 88 (11.9%) | 59 (4.3%) |
| $500 to $799 | 99 (13.4%) | 332 (24.2%) |
| $800 to $999 | 64 (8.7%) | 70 (5.1%) |
| $1,000 to $1,499 | 137 (18.6%) | 477 (34.8%) |
| $1,500 to $1,999 | 74 (10.0%) | 198 (14.5%) |
| $2,000 to $2,499 | 97 (13.1%) | 111 (8.1%) |
| $2,500 to $2,999 | 56 (7.6%) | 0 (0.0%) |
| $3,000 or more | 65 (8.8%) | 0 (0.0%) |
| Total | 738 (100.0%) | 1,369 (100.0%) |
Physical Housing Characteristics in Willits
Housing Structures in Willits
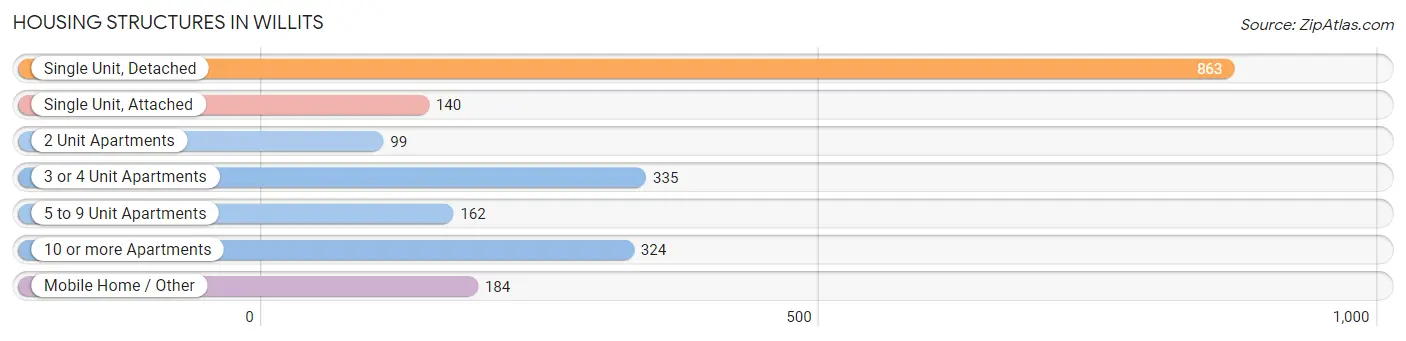
| Structure Type | # Housing Units | % Housing Units |
| Single Unit, Detached | 863 | 41.0% |
| Single Unit, Attached | 140 | 6.6% |
| 2 Unit Apartments | 99 | 4.7% |
| 3 or 4 Unit Apartments | 335 | 15.9% |
| 5 to 9 Unit Apartments | 162 | 7.7% |
| 10 or more Apartments | 324 | 15.4% |
| Mobile Home / Other | 184 | 8.7% |
| Total | 2,107 | 100.0% |
Housing Structures by Occupancy in Willits
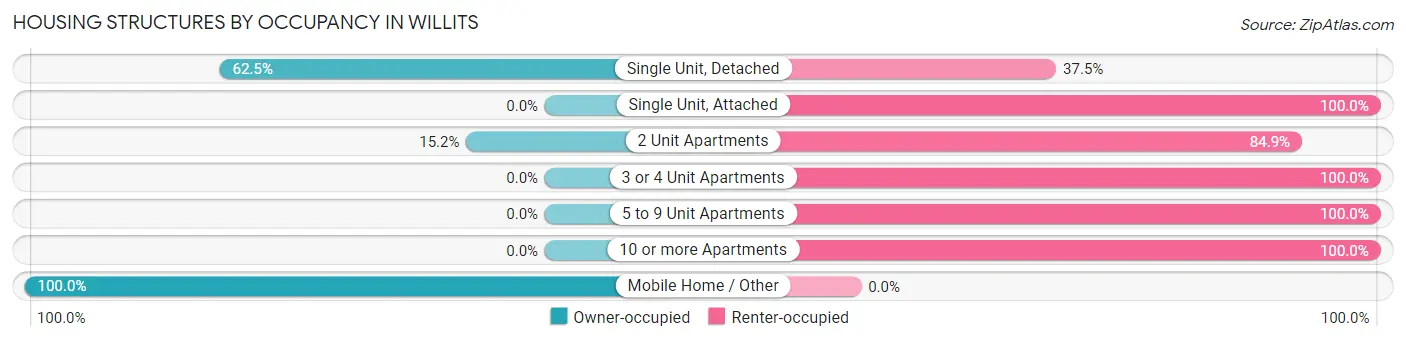
| Structure Type | Owner-occupied | Renter-occupied |
| Single Unit, Detached | 539 (62.5%) | 324 (37.5%) |
| Single Unit, Attached | 0 (0.0%) | 140 (100.0%) |
| 2 Unit Apartments | 15 (15.1%) | 84 (84.9%) |
| 3 or 4 Unit Apartments | 0 (0.0%) | 335 (100.0%) |
| 5 to 9 Unit Apartments | 0 (0.0%) | 162 (100.0%) |
| 10 or more Apartments | 0 (0.0%) | 324 (100.0%) |
| Mobile Home / Other | 184 (100.0%) | 0 (0.0%) |
| Total | 738 (35.0%) | 1,369 (65.0%) |
Housing Structures by Number of Rooms in Willits
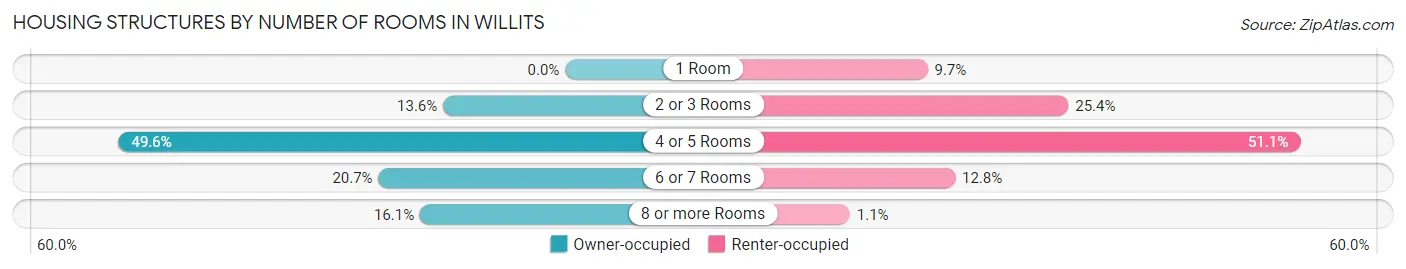
| Number of Rooms | Owner-occupied | Renter-occupied |
| 1 Room | 0 (0.0%) | 133 (9.7%) |
| 2 or 3 Rooms | 100 (13.6%) | 347 (25.4%) |
| 4 or 5 Rooms | 366 (49.6%) | 699 (51.1%) |
| 6 or 7 Rooms | 153 (20.7%) | 175 (12.8%) |
| 8 or more Rooms | 119 (16.1%) | 15 (1.1%) |
| Total | 738 (100.0%) | 1,369 (100.0%) |
Housing Structure by Heating Type in Willits
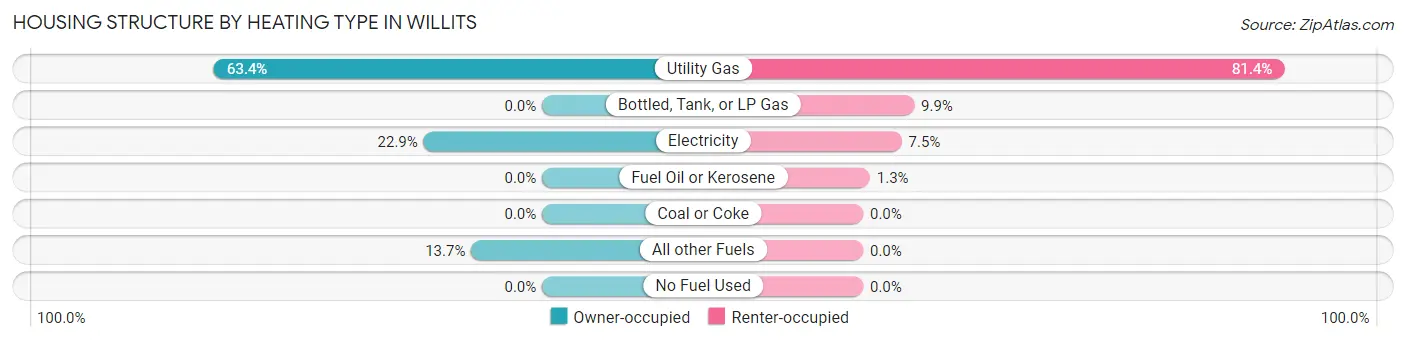
| Heating Type | Owner-occupied | Renter-occupied |
| Utility Gas | 468 (63.4%) | 1,114 (81.4%) |
| Bottled, Tank, or LP Gas | 0 (0.0%) | 135 (9.9%) |
| Electricity | 169 (22.9%) | 102 (7.4%) |
| Fuel Oil or Kerosene | 0 (0.0%) | 18 (1.3%) |
| Coal or Coke | 0 (0.0%) | 0 (0.0%) |
| All other Fuels | 101 (13.7%) | 0 (0.0%) |
| No Fuel Used | 0 (0.0%) | 0 (0.0%) |
| Total | 738 (100.0%) | 1,369 (100.0%) |
Household Vehicle Usage in Willits
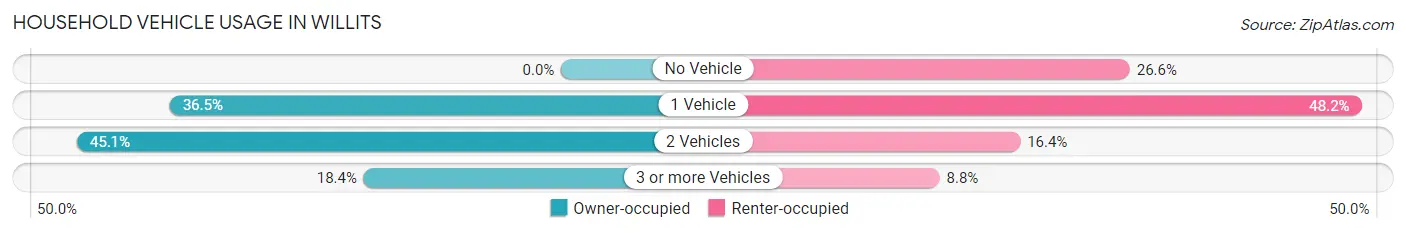
| Vehicles per Household | Owner-occupied | Renter-occupied |
| No Vehicle | 0 (0.0%) | 364 (26.6%) |
| 1 Vehicle | 269 (36.4%) | 660 (48.2%) |
| 2 Vehicles | 333 (45.1%) | 224 (16.4%) |
| 3 or more Vehicles | 136 (18.4%) | 121 (8.8%) |
| Total | 738 (100.0%) | 1,369 (100.0%) |
Real Estate & Mortgages in Willits
Real Estate and Mortgage Overview in Willits
| Characteristic | Without Mortgage | With Mortgage |
| Housing Units | 353 | 385 |
| Median Property Value | - | - |
| Median Household Income | $61,732 | $62 |
| Monthly Housing Costs | $546 | $65 |
| Real Estate Taxes | - | - |
Property Value by Mortgage Status in Willits
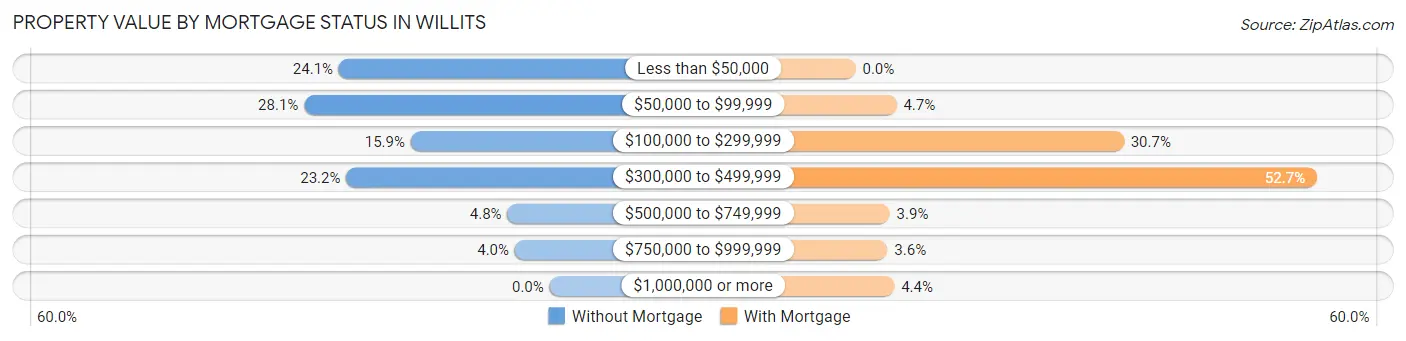
| Property Value | Without Mortgage | With Mortgage |
| Less than $50,000 | 85 (24.1%) | 0 (0.0%) |
| $50,000 to $99,999 | 99 (28.1%) | 18 (4.7%) |
| $100,000 to $299,999 | 56 (15.9%) | 118 (30.6%) |
| $300,000 to $499,999 | 82 (23.2%) | 203 (52.7%) |
| $500,000 to $749,999 | 17 (4.8%) | 15 (3.9%) |
| $750,000 to $999,999 | 14 (4.0%) | 14 (3.6%) |
| $1,000,000 or more | 0 (0.0%) | 17 (4.4%) |
| Total | 353 (100.0%) | 385 (100.0%) |
Household Income by Mortgage Status in Willits
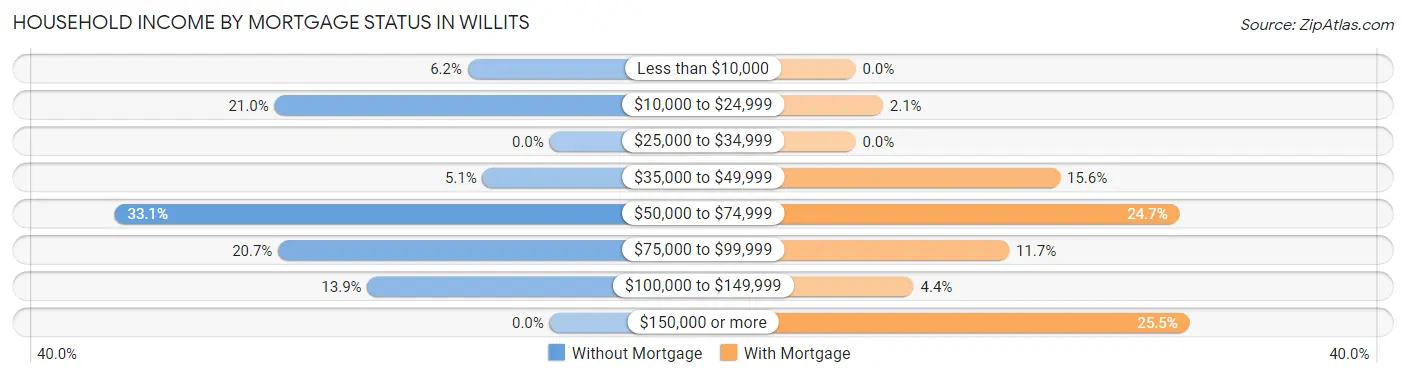
| Household Income | Without Mortgage | With Mortgage |
| Less than $10,000 | 22 (6.2%) | 0 (0.0%) |
| $10,000 to $24,999 | 74 (21.0%) | 8 (2.1%) |
| $25,000 to $34,999 | 0 (0.0%) | 0 (0.0%) |
| $35,000 to $49,999 | 18 (5.1%) | 60 (15.6%) |
| $50,000 to $74,999 | 117 (33.1%) | 95 (24.7%) |
| $75,000 to $99,999 | 73 (20.7%) | 45 (11.7%) |
| $100,000 to $149,999 | 49 (13.9%) | 17 (4.4%) |
| $150,000 or more | 0 (0.0%) | 98 (25.5%) |
| Total | 353 (100.0%) | 385 (100.0%) |
Property Value to Household Income Ratio in Willits
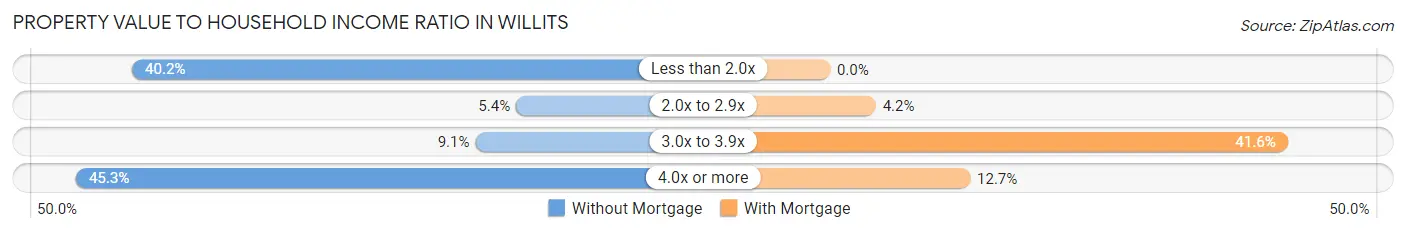
| Value-to-Income Ratio | Without Mortgage | With Mortgage |
| Less than 2.0x | 142 (40.2%) | 0 (0.0%) |
| 2.0x to 2.9x | 19 (5.4%) | 16 (4.2%) |
| 3.0x to 3.9x | 32 (9.1%) | 160 (41.6%) |
| 4.0x or more | 160 (45.3%) | 49 (12.7%) |
| Total | 353 (100.0%) | 385 (100.0%) |
Real Estate Taxes by Mortgage Status in Willits
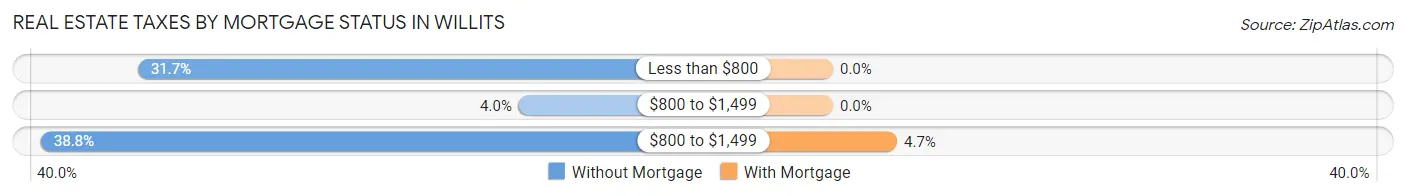
| Property Taxes | Without Mortgage | With Mortgage |
| Less than $800 | 112 (31.7%) | 0 (0.0%) |
| $800 to $1,499 | 14 (4.0%) | 0 (0.0%) |
| $800 to $1,499 | 137 (38.8%) | 18 (4.7%) |
| Total | 353 (100.0%) | 385 (100.0%) |
Health & Disability in Willits
Health Insurance Coverage by Age in Willits
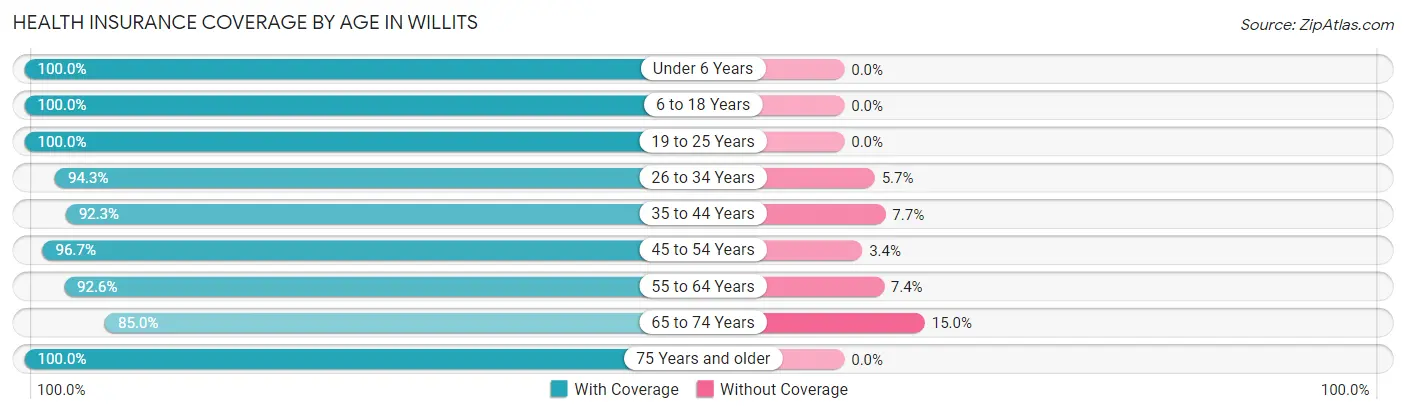
| Age Bracket | With Coverage | Without Coverage |
| Under 6 Years | 300 (100.0%) | 0 (0.0%) |
| 6 to 18 Years | 911 (100.0%) | 0 (0.0%) |
| 19 to 25 Years | 521 (100.0%) | 0 (0.0%) |
| 26 to 34 Years | 382 (94.3%) | 23 (5.7%) |
| 35 to 44 Years | 554 (92.3%) | 46 (7.7%) |
| 45 to 54 Years | 375 (96.7%) | 13 (3.4%) |
| 55 to 64 Years | 352 (92.6%) | 28 (7.4%) |
| 65 to 74 Years | 685 (85.0%) | 121 (15.0%) |
| 75 Years and older | 584 (100.0%) | 0 (0.0%) |
| Total | 4,664 (95.3%) | 231 (4.7%) |
Health Insurance Coverage by Citizenship Status in Willits
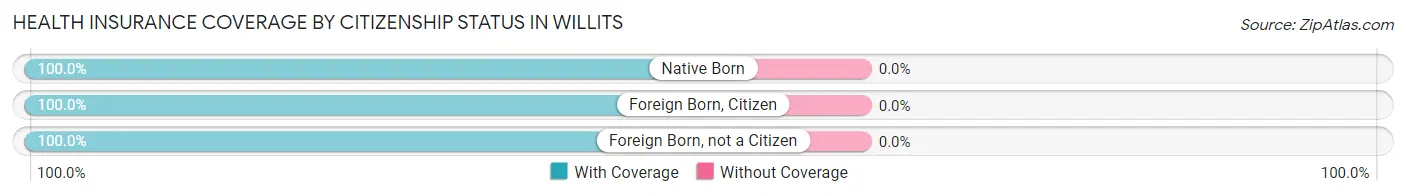
| Citizenship Status | With Coverage | Without Coverage |
| Native Born | 300 (100.0%) | 0 (0.0%) |
| Foreign Born, Citizen | 911 (100.0%) | 0 (0.0%) |
| Foreign Born, not a Citizen | 521 (100.0%) | 0 (0.0%) |
Health Insurance Coverage by Household Income in Willits
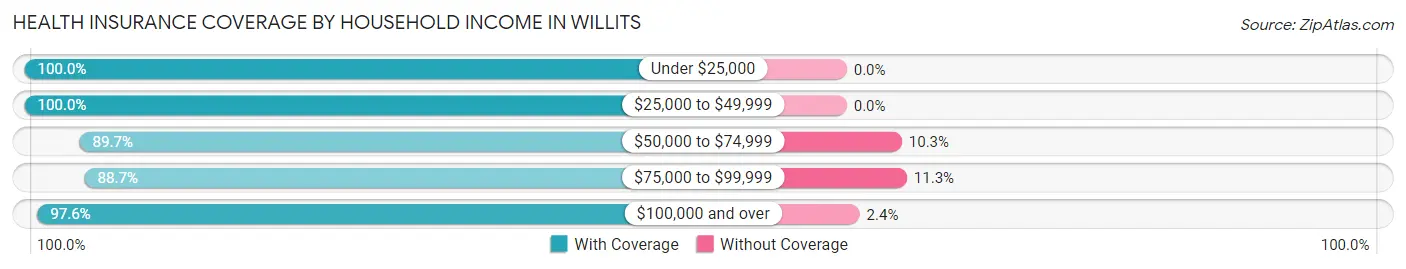
| Household Income | With Coverage | Without Coverage |
| Under $25,000 | 1,115 (100.0%) | 0 (0.0%) |
| $25,000 to $49,999 | 763 (100.0%) | 0 (0.0%) |
| $50,000 to $74,999 | 1,164 (89.7%) | 134 (10.3%) |
| $75,000 to $99,999 | 465 (88.7%) | 59 (11.3%) |
| $100,000 and over | 1,132 (97.6%) | 28 (2.4%) |
Public vs Private Health Insurance Coverage by Age in Willits
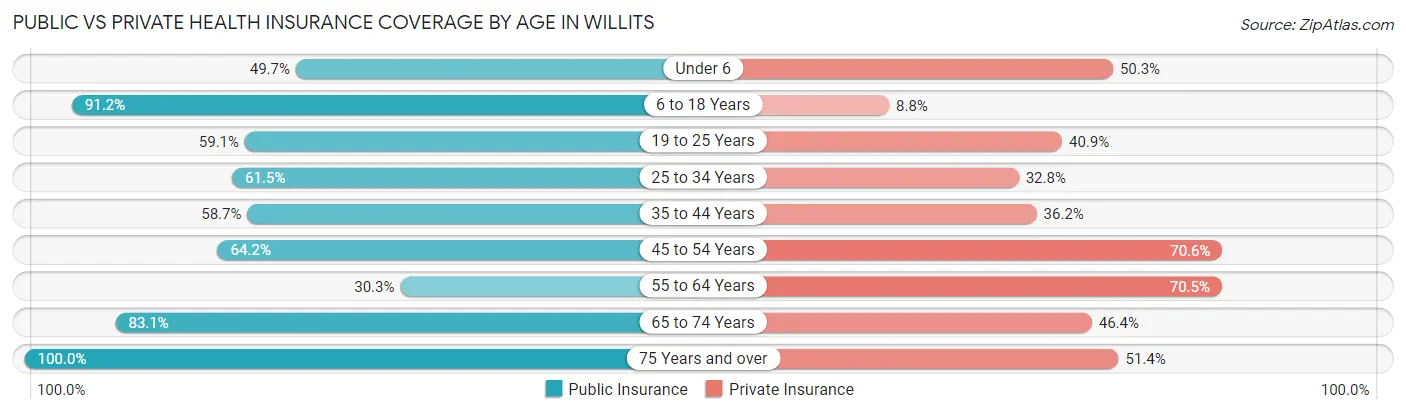
| Age Bracket | Public Insurance | Private Insurance |
| Under 6 | 149 (49.7%) | 151 (50.3%) |
| 6 to 18 Years | 831 (91.2%) | 80 (8.8%) |
| 19 to 25 Years | 308 (59.1%) | 213 (40.9%) |
| 25 to 34 Years | 249 (61.5%) | 133 (32.8%) |
| 35 to 44 Years | 352 (58.7%) | 217 (36.2%) |
| 45 to 54 Years | 249 (64.2%) | 274 (70.6%) |
| 55 to 64 Years | 115 (30.3%) | 268 (70.5%) |
| 65 to 74 Years | 670 (83.1%) | 374 (46.4%) |
| 75 Years and over | 584 (100.0%) | 300 (51.4%) |
| Total | 3,507 (71.6%) | 2,010 (41.1%) |
Disability Status by Sex by Age in Willits
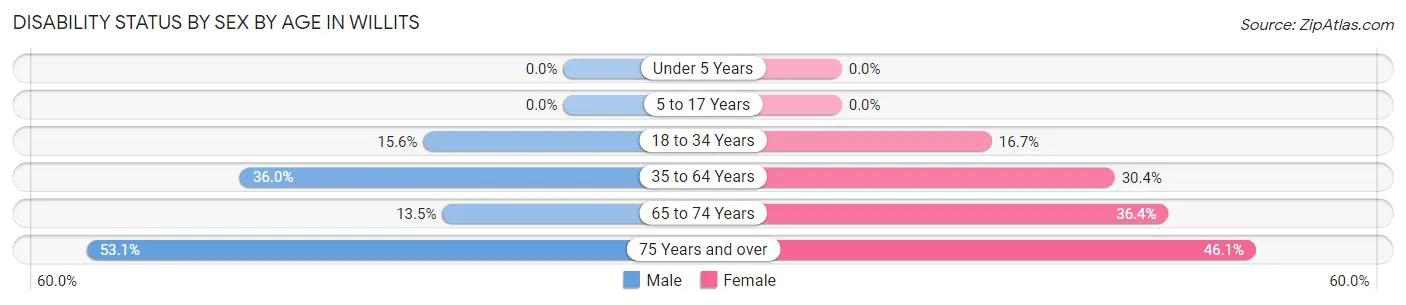
| Age Bracket | Male | Female |
| Under 5 Years | 0 (0.0%) | 0 (0.0%) |
| 5 to 17 Years | 0 (0.0%) | 0 (0.0%) |
| 18 to 34 Years | 70 (15.6%) | 106 (16.7%) |
| 35 to 64 Years | 206 (36.0%) | 242 (30.4%) |
| 65 to 74 Years | 39 (13.5%) | 188 (36.4%) |
| 75 Years and over | 112 (53.1%) | 172 (46.1%) |
Disability Class by Sex by Age in Willits
Disability Class: Hearing Difficulty
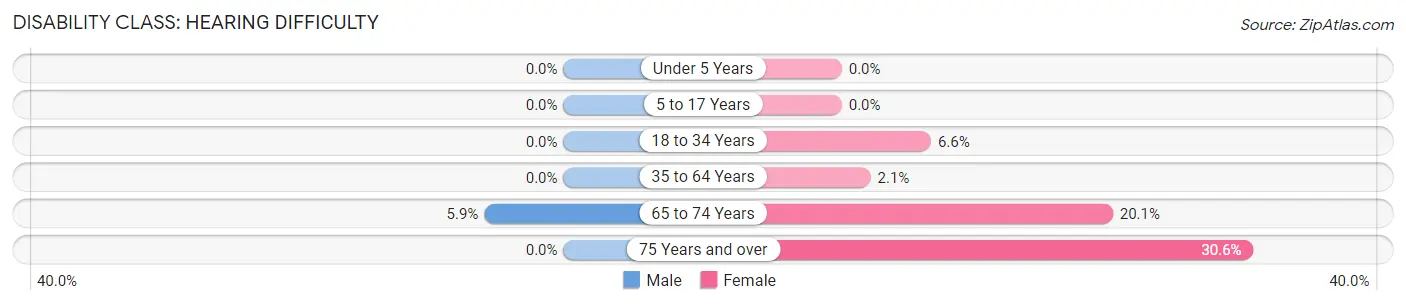
| Age Bracket | Male | Female |
| Under 5 Years | 0 (0.0%) | 0 (0.0%) |
| 5 to 17 Years | 0 (0.0%) | 0 (0.0%) |
| 18 to 34 Years | 0 (0.0%) | 42 (6.6%) |
| 35 to 64 Years | 0 (0.0%) | 17 (2.1%) |
| 65 to 74 Years | 17 (5.9%) | 104 (20.1%) |
| 75 Years and over | 0 (0.0%) | 114 (30.6%) |
Disability Class: Vision Difficulty
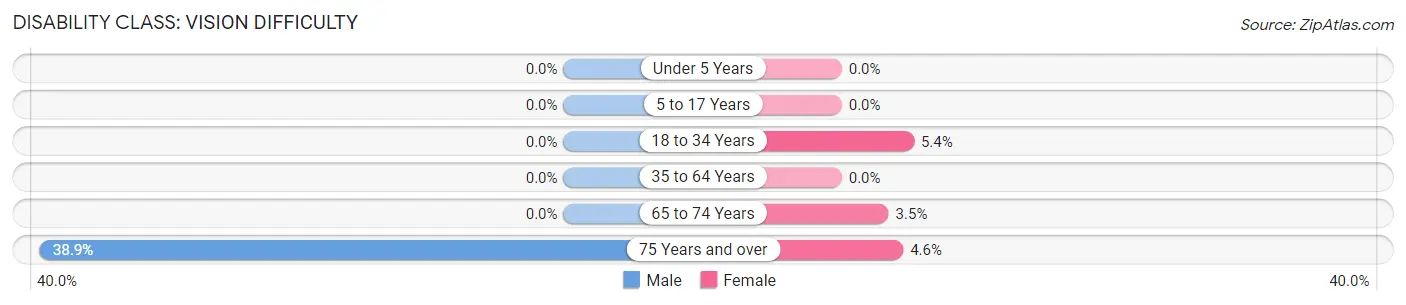
| Age Bracket | Male | Female |
| Under 5 Years | 0 (0.0%) | 0 (0.0%) |
| 5 to 17 Years | 0 (0.0%) | 0 (0.0%) |
| 18 to 34 Years | 0 (0.0%) | 34 (5.4%) |
| 35 to 64 Years | 0 (0.0%) | 0 (0.0%) |
| 65 to 74 Years | 0 (0.0%) | 18 (3.5%) |
| 75 Years and over | 82 (38.9%) | 17 (4.6%) |
Disability Class: Cognitive Difficulty
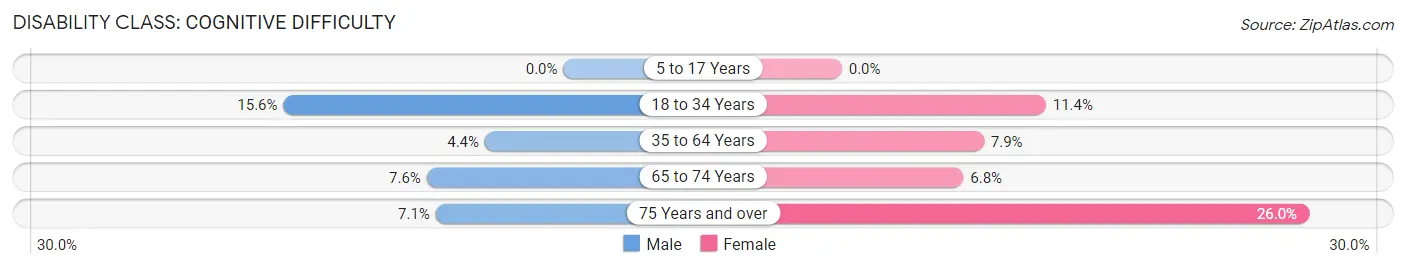
| Age Bracket | Male | Female |
| 5 to 17 Years | 0 (0.0%) | 0 (0.0%) |
| 18 to 34 Years | 70 (15.6%) | 72 (11.4%) |
| 35 to 64 Years | 25 (4.4%) | 63 (7.9%) |
| 65 to 74 Years | 22 (7.6%) | 35 (6.8%) |
| 75 Years and over | 15 (7.1%) | 97 (26.0%) |
Disability Class: Ambulatory Difficulty
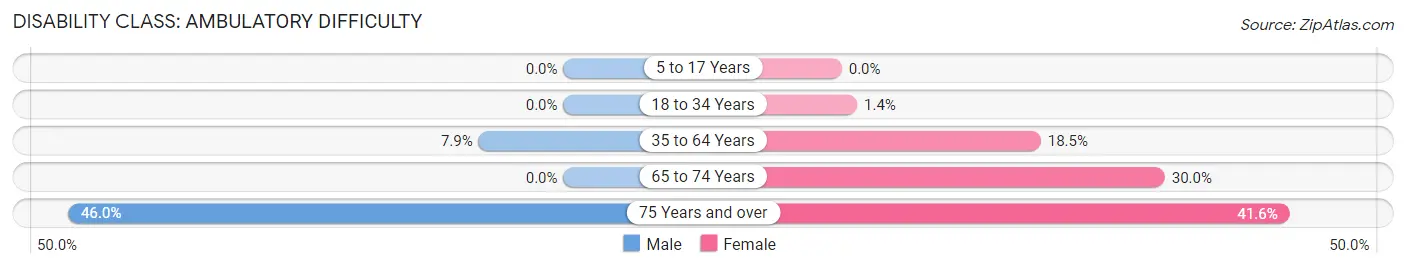
| Age Bracket | Male | Female |
| 5 to 17 Years | 0 (0.0%) | 0 (0.0%) |
| 18 to 34 Years | 0 (0.0%) | 9 (1.4%) |
| 35 to 64 Years | 45 (7.9%) | 147 (18.5%) |
| 65 to 74 Years | 0 (0.0%) | 155 (30.0%) |
| 75 Years and over | 97 (46.0%) | 155 (41.5%) |
Disability Class: Self-Care Difficulty
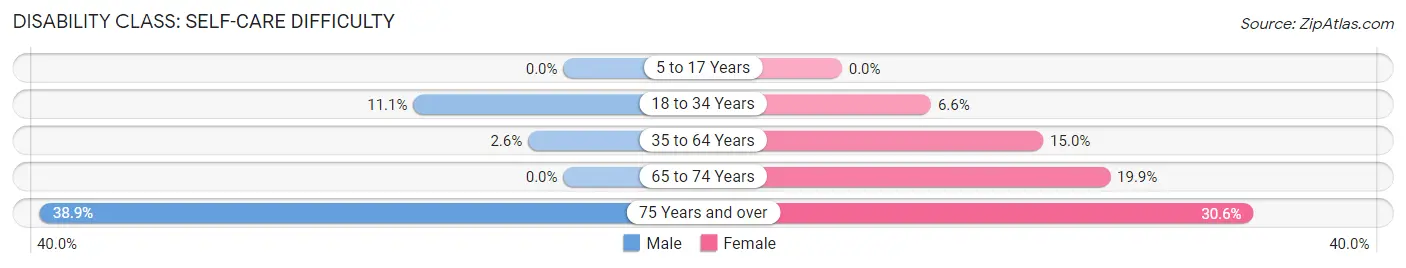
| Age Bracket | Male | Female |
| 5 to 17 Years | 0 (0.0%) | 0 (0.0%) |
| 18 to 34 Years | 50 (11.1%) | 42 (6.6%) |
| 35 to 64 Years | 15 (2.6%) | 119 (14.9%) |
| 65 to 74 Years | 0 (0.0%) | 103 (19.9%) |
| 75 Years and over | 82 (38.9%) | 114 (30.6%) |
Technology Access in Willits
Computing Device Access in Willits
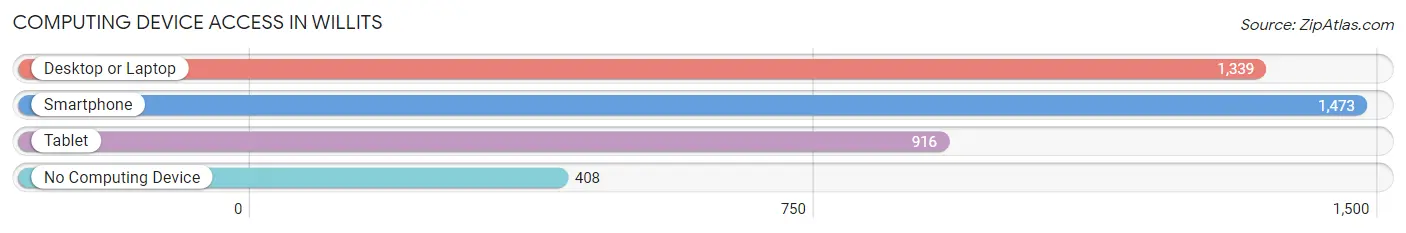
| Device Type | # Households | % Households |
| Desktop or Laptop | 1,339 | 63.5% |
| Smartphone | 1,473 | 69.9% |
| Tablet | 916 | 43.5% |
| No Computing Device | 408 | 19.4% |
| Total | 2,107 | 100.0% |
Internet Access in Willits
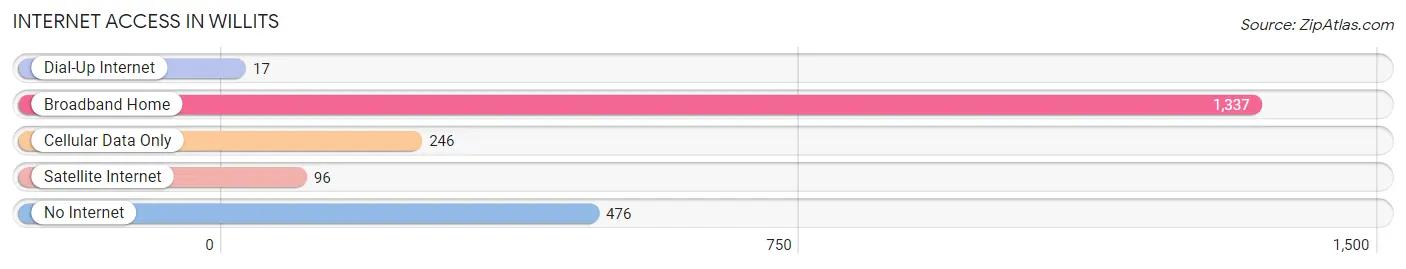
| Internet Type | # Households | % Households |
| Dial-Up Internet | 17 | 0.8% |
| Broadband Home | 1,337 | 63.5% |
| Cellular Data Only | 246 | 11.7% |
| Satellite Internet | 96 | 4.6% |
| No Internet | 476 | 22.6% |
| Total | 2,107 | 100.0% |
Willits Summary
Willits, California is a small city located in Mendocino County, in the northern part of the state. It is situated in the Little Lake Valley, at the base of the Coastal Range Mountains. The city is known for its rich history, diverse geography, and vibrant economy.
History
Willits was founded in 1857 by Isaac Willits, a settler from Indiana. He purchased the land from the Pomo Indians, who had inhabited the area for centuries. The city was originally called Willitsville, but the name was changed to Willits in 1874.
Willits was an important stop on the California and Oregon Railroad, which ran through the city from 1876 to 1942. The railroad brought many new settlers to the area, and the population of Willits grew rapidly.
The city was also an important center for the lumber industry. In the late 19th century, the Willits Lumber Company was one of the largest lumber mills in the state. The company was responsible for the construction of many of the city’s buildings, including the Willits Hotel.
Geography
Willits is located in the Little Lake Valley, at the base of the Coastal Range Mountains. The city is surrounded by rolling hills and lush forests. The nearby Eel River provides a source of water for the city.
Willits is located in a temperate climate zone, with mild winters and warm summers. The average annual temperature is around 55 degrees Fahrenheit.
Economy
Willits has a diverse economy, with a mix of agriculture, manufacturing, and tourism. The city is home to several large employers, including the Willits Lumber Company, the Willits Unified School District, and the Willits Unified Medical Center.
Agriculture is an important part of the local economy. The city is home to several farms, which produce a variety of crops, including apples, pears, and walnuts.
Tourism is also an important part of the local economy. Willits is home to several attractions, including the Willits Historical Museum, the Willits Skate Park, and the Willits Wildlife Refuge.
Demographics
As of the 2010 census, the population of Willits was 5,073. The city has a diverse population, with a mix of races and ethnicities. The largest racial group is White (77.3%), followed by Hispanic or Latino (14.2%), and Native American (3.2%).
Willits is a predominantly Christian city, with the largest religious group being Catholic (37.2%). Other religious groups include Protestant (25.2%), Other Christian (14.2%), and Other (13.2%).
Willits is a small city with a rich history, diverse geography, and vibrant economy. The city is home to a diverse population, with a mix of races and religions. Willits is an important center for agriculture, manufacturing, and tourism, and is a great place to live and work.
Common Questions
What is Per Capita Income in Willits?
Per Capita income in Willits is $30,460.
What is the Median Family Income in Willits?
Median Family Income in Willits is $57,374.
What is the Median Household income in Willits?
Median Household Income in Willits is $45,592.
What is Income or Wage Gap in Willits?
Income or Wage Gap in Willits is 35.9%.
Women in Willits earn 64.1 cents for every dollar earned by a man.
What is Inequality or Gini Index in Willits?
Inequality or Gini Index in Willits is 0.50.
What is the Total Population of Willits?
Total Population of Willits is 4,968.
What is the Total Male Population of Willits?
Total Male Population of Willits is 2,200.
What is the Total Female Population of Willits?
Total Female Population of Willits is 2,768.
What is the Ratio of Males per 100 Females in Willits?
There are 79.48 Males per 100 Females in Willits.
What is the Ratio of Females per 100 Males in Willits?
There are 125.82 Females per 100 Males in Willits.
What is the Median Population Age in Willits?
Median Population Age in Willits is 40.4 Years.
What is the Average Family Size in Willits
Average Family Size in Willits is 3.3 People.
What is the Average Household Size in Willits
Average Household Size in Willits is 2.3 People.
How Large is the Labor Force in Willits?
There are 1,925 People in the Labor Forcein in Willits.
What is the Percentage of People in the Labor Force in Willits?
48.4% of People are in the Labor Force in Willits.
What is the Unemployment Rate in Willits?
Unemployment Rate in Willits is 13.8%.