Zip Codes with the Highest Percentage of Population Employed in Farming, Fishing & Forestry in Victorville, CA
RELATED REPORTS & OPTIONS
Farming, Fishing & Forestry
Victorville
Compare Zip Codes
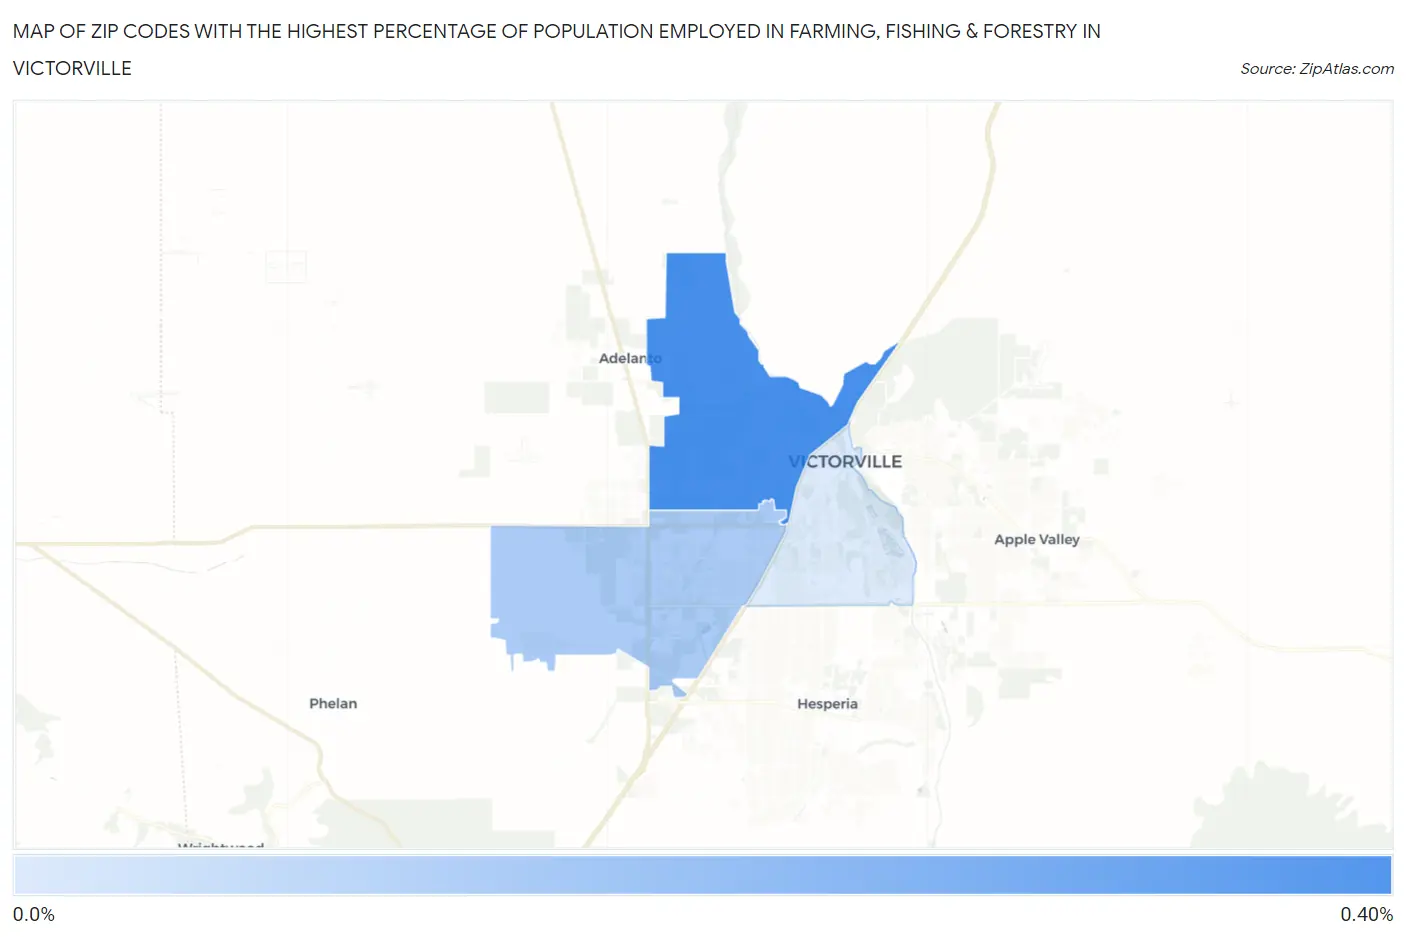
Map of Zip Codes with the Highest Percentage of Population Employed in Farming, Fishing & Forestry in Victorville
0.0%
0.40%
Zip Codes with the Highest Percentage of Population Employed in Farming, Fishing & Forestry in Victorville, CA
| Zip Code | % Employed | vs State | vs National | |
| 1. | 92394 | 0.35% | 1.4%(-1.06)#800 | 0.61%(-0.256)#14,271 |
| 2. | 92392 | 0.16% | 1.4%(-1.25)#996 | 0.61%(-0.446)#16,756 |
| 3. | 92395 | 0.063% | 1.4%(-1.35)#1,125 | 0.61%(-0.543)#18,425 |
1
Common Questions
What are the Top Zip Codes with the Highest Percentage of Population Employed in Farming, Fishing & Forestry in Victorville, CA?
Top Zip Codes with the Highest Percentage of Population Employed in Farming, Fishing & Forestry in Victorville, CA are:
What zip code has the Highest Percentage of Population Employed in Farming, Fishing & Forestry in Victorville, CA?
92394 has the Highest Percentage of Population Employed in Farming, Fishing & Forestry in Victorville, CA with 0.35%.
What is the Percentage of Population Employed in Farming, Fishing & Forestry in Victorville, CA?
Percentage of Population Employed in Farming, Fishing & Forestry in Victorville is 0.18%.
What is the Percentage of Population Employed in Farming, Fishing & Forestry in California?
Percentage of Population Employed in Farming, Fishing & Forestry in California is 1.4%.
What is the Percentage of Population Employed in Farming, Fishing & Forestry in the United States?
Percentage of Population Employed in Farming, Fishing & Forestry in the United States is 0.61%.