Valley Center, CA Map & Demographics
Valley Center Map
Valley Center Overview
$40,821
PER CAPITA INCOME
$112,574
AVG FAMILY INCOME
$104,115
AVG HOUSEHOLD INCOME
47.2%
WAGE / INCOME GAP [ % ]
52.8¢/ $1
WAGE / INCOME GAP [ $ ]
0.45
INEQUALITY / GINI INDEX
10,929
TOTAL POPULATION
5,078
MALE POPULATION
5,851
FEMALE POPULATION
86.79
MALES / 100 FEMALES
115.22
FEMALES / 100 MALES
39.2
MEDIAN AGE
3.5
AVG FAMILY SIZE
3.5
AVG HOUSEHOLD SIZE
4,838
LABOR FORCE [ PEOPLE ]
56.2%
PERCENT IN LABOR FORCE
3.1%
UNEMPLOYMENT RATE
Valley Center Zip Codes
Valley Center Area Codes
Income in Valley Center
Income Overview in Valley Center
Per Capita Income in Valley Center is $40,821, while median incomes of families and households are $112,574 and $104,115 respectively.
| Characteristic | Number | Measure |
| Per Capita Income | 10,929 | $40,821 |
| Median Family Income | 2,504 | $112,574 |
| Mean Family Income | 2,504 | $146,992 |
| Median Household Income | 3,121 | $104,115 |
| Mean Household Income | 3,121 | $136,342 |
| Income Deficit | 2,504 | $0 |
| Wage / Income Gap (%) | 10,929 | 47.24% |
| Wage / Income Gap ($) | 10,929 | 52.76¢ per $1 |
| Gini / Inequality Index | 10,929 | 0.45 |
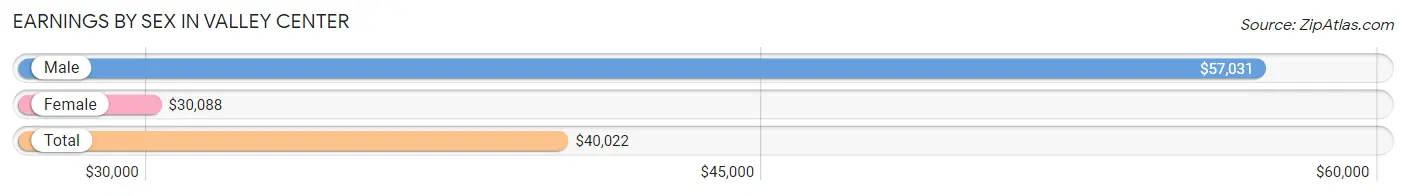
Earnings by Sex in Valley Center
Average Earnings in Valley Center are $40,022, $57,031 for men and $30,088 for women, a difference of 47.2%.
| Sex | Number | Average Earnings |
| Male | 2,634 (52.6%) | $57,031 |
| Female | 2,377 (47.4%) | $30,088 |
| Total | 5,011 (100.0%) | $40,022 |
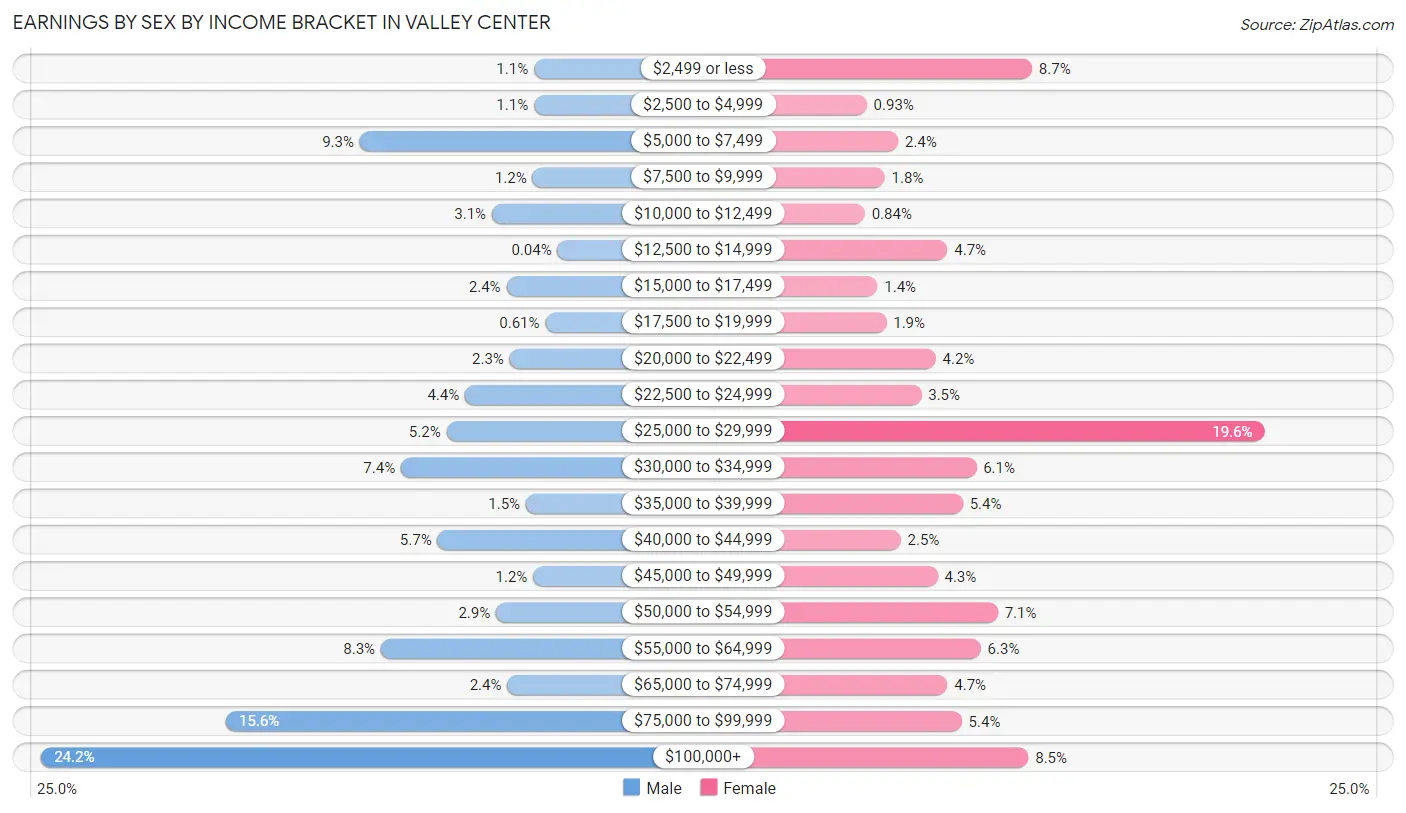
Earnings by Sex by Income Bracket in Valley Center
The most common earnings brackets in Valley Center are $100,000+ for men (638 | 24.2%) and $25,000 to $29,999 for women (465 | 19.6%).
| Income | Male | Female |
| $2,499 or less | 30 (1.1%) | 206 (8.7%) |
| $2,500 to $4,999 | 30 (1.1%) | 22 (0.9%) |
| $5,000 to $7,499 | 245 (9.3%) | 57 (2.4%) |
| $7,500 to $9,999 | 32 (1.2%) | 42 (1.8%) |
| $10,000 to $12,499 | 82 (3.1%) | 20 (0.8%) |
| $12,500 to $14,999 | 1 (0.0%) | 112 (4.7%) |
| $15,000 to $17,499 | 64 (2.4%) | 34 (1.4%) |
| $17,500 to $19,999 | 16 (0.6%) | 44 (1.8%) |
| $20,000 to $22,499 | 60 (2.3%) | 99 (4.2%) |
| $22,500 to $24,999 | 115 (4.4%) | 83 (3.5%) |
| $25,000 to $29,999 | 138 (5.2%) | 465 (19.6%) |
| $30,000 to $34,999 | 194 (7.4%) | 144 (6.1%) |
| $35,000 to $39,999 | 40 (1.5%) | 129 (5.4%) |
| $40,000 to $44,999 | 149 (5.7%) | 60 (2.5%) |
| $45,000 to $49,999 | 31 (1.2%) | 101 (4.3%) |
| $50,000 to $54,999 | 77 (2.9%) | 168 (7.1%) |
| $55,000 to $64,999 | 219 (8.3%) | 149 (6.3%) |
| $65,000 to $74,999 | 63 (2.4%) | 112 (4.7%) |
| $75,000 to $99,999 | 410 (15.6%) | 128 (5.4%) |
| $100,000+ | 638 (24.2%) | 202 (8.5%) |
| Total | 2,634 (100.0%) | 2,377 (100.0%) |
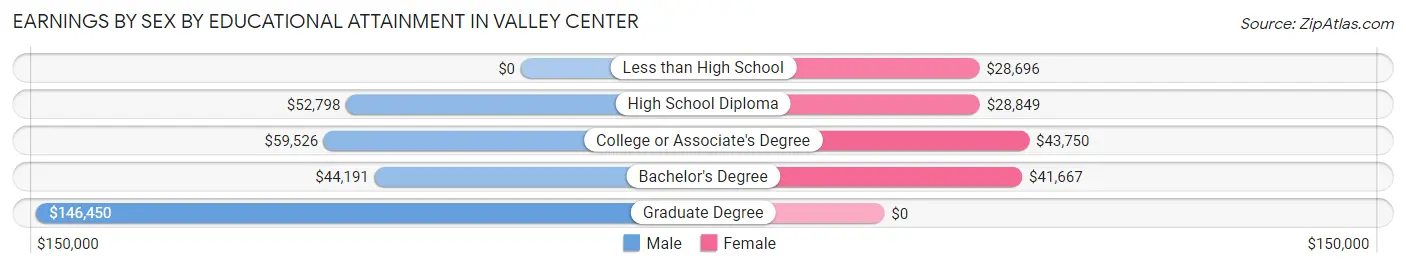
Earnings by Sex by Educational Attainment in Valley Center
Average earnings in Valley Center are $59,946 for men and $33,203 for women, a difference of 44.6%. Men with an educational attainment of graduate degree enjoy the highest average annual earnings of $146,450, while those with bachelor's degree education earn the least with $44,191. Women with an educational attainment of college or associate's degree earn the most with the average annual earnings of $43,750, while those with less than high school education have the smallest earnings of $28,696.
| Educational Attainment | Male Income | Female Income |
| Less than High School | - | - |
| High School Diploma | $52,798 | $28,849 |
| College or Associate's Degree | $59,526 | $43,750 |
| Bachelor's Degree | $44,191 | $41,667 |
| Graduate Degree | $146,450 | $0 |
| Total | $59,946 | $33,203 |
Family Income in Valley Center
Family Income Brackets in Valley Center
According to the Valley Center family income data, there are 586 families falling into the $200,000+ income range, which is the most common income bracket and makes up 23.4% of all families.
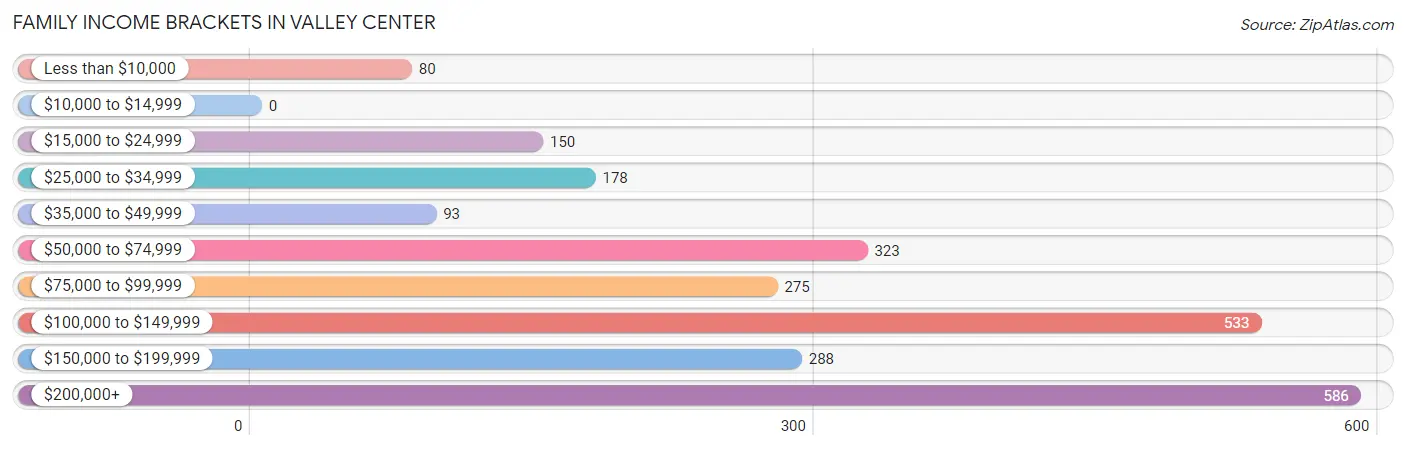
| Income Bracket | # Families | % Families |
| Less than $10,000 | 80 | 3.2% |
| $10,000 to $14,999 | 0 | 0.0% |
| $15,000 to $24,999 | 150 | 6.0% |
| $25,000 to $34,999 | 178 | 7.1% |
| $35,000 to $49,999 | 93 | 3.7% |
| $50,000 to $74,999 | 323 | 12.9% |
| $75,000 to $99,999 | 275 | 11.0% |
| $100,000 to $149,999 | 533 | 21.3% |
| $150,000 to $199,999 | 288 | 11.5% |
| $200,000+ | 586 | 23.4% |
Family Income by Famaliy Size in Valley Center
5-person families (300 | 12.0%) account for the highest median family income in Valley Center with $166,444 per family, while 2-person families (1,024 | 40.9%) have the highest median income of $64,423 per family member.
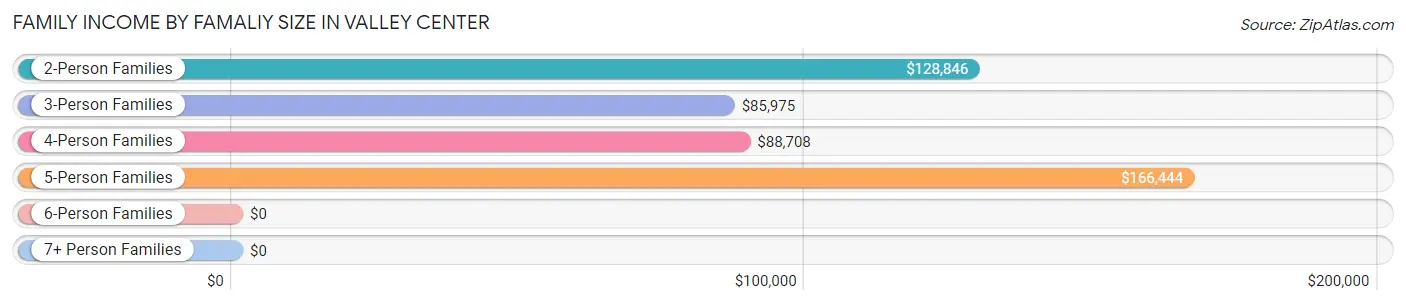
| Income Bracket | # Families | Median Income |
| 2-Person Families | 1,024 (40.9%) | $128,846 |
| 3-Person Families | 520 (20.8%) | $85,975 |
| 4-Person Families | 407 (16.3%) | $88,708 |
| 5-Person Families | 300 (12.0%) | $166,444 |
| 6-Person Families | 139 (5.6%) | $0 |
| 7+ Person Families | 114 (4.5%) | $0 |
| Total | 2,504 (100.0%) | $112,574 |
Family Income by Number of Earners in Valley Center
The median family income in Valley Center is $112,574, with families comprising 3+ earners (376) having the highest median family income of $232,935, while families with 1 earner (933) have the lowest median family income of $80,795, accounting for 15.0% and 37.3% of families, respectively.
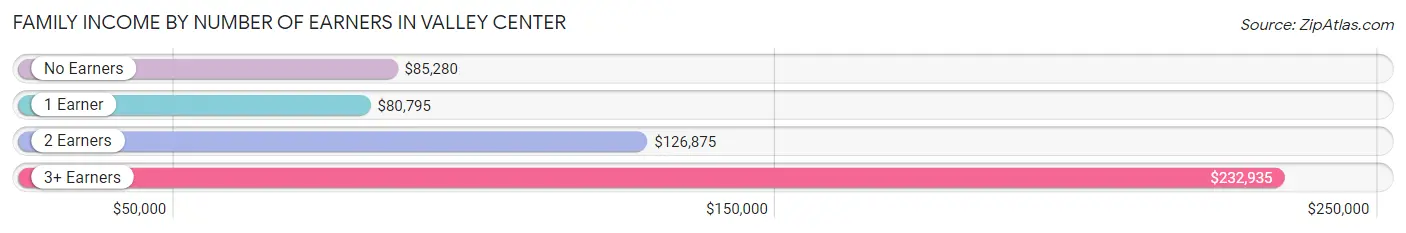
| Number of Earners | # Families | Median Income |
| No Earners | 425 (17.0%) | $85,280 |
| 1 Earner | 933 (37.3%) | $80,795 |
| 2 Earners | 770 (30.7%) | $126,875 |
| 3+ Earners | 376 (15.0%) | $232,935 |
| Total | 2,504 (100.0%) | $112,574 |
Household Income in Valley Center
Household Income Brackets in Valley Center
With 674 households falling in the category, the $200,000+ income range is the most frequent in Valley Center, accounting for 21.6% of all households. In contrast, only 44 households (1.4%) fall into the $10,000 to $14,999 income bracket, making it the least populous group.
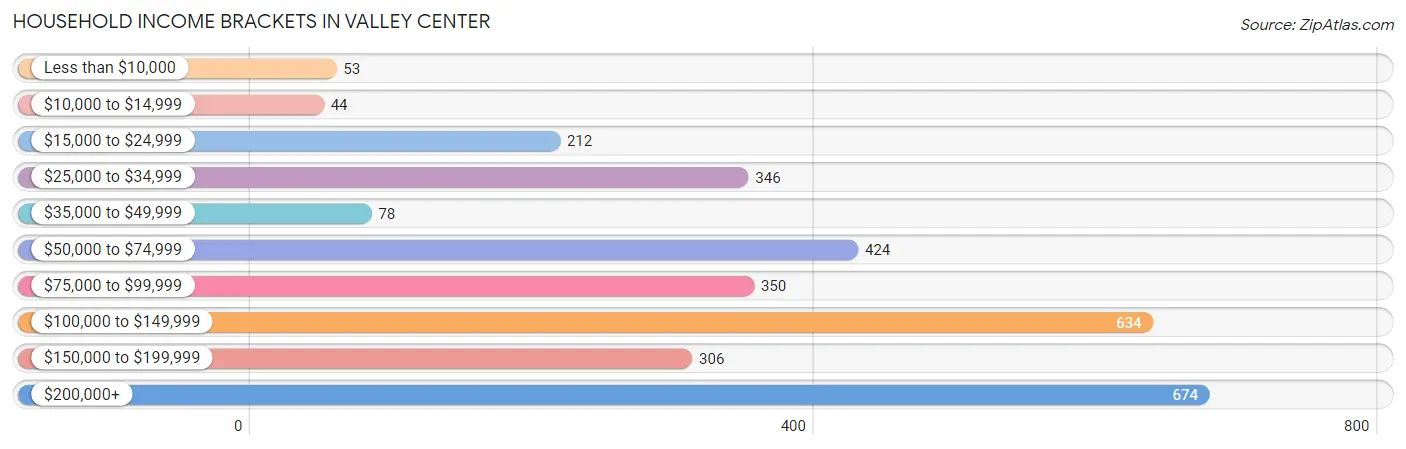
| Income Bracket | # Households | % Households |
| Less than $10,000 | 53 | 1.7% |
| $10,000 to $14,999 | 44 | 1.4% |
| $15,000 to $24,999 | 212 | 6.8% |
| $25,000 to $34,999 | 346 | 11.1% |
| $35,000 to $49,999 | 78 | 2.5% |
| $50,000 to $74,999 | 424 | 13.6% |
| $75,000 to $99,999 | 350 | 11.2% |
| $100,000 to $149,999 | 634 | 20.3% |
| $150,000 to $199,999 | 306 | 9.8% |
| $200,000+ | 674 | 21.6% |
Household Income by Householder Age in Valley Center
The median household income in Valley Center is $104,115, with the highest median household income of $125,673 found in the 45 to 64 years age bracket for the primary householder. A total of 1,161 households (37.2%) fall into this category. Meanwhile, the 15 to 24 years age bracket for the primary householder has the lowest median household income of $0, with 61 households (1.9%) in this group.
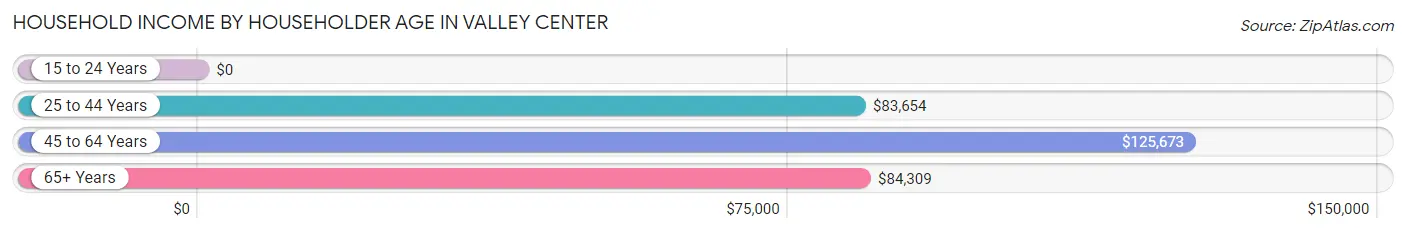
| Income Bracket | # Households | Median Income |
| 15 to 24 Years | 61 (1.9%) | $0 |
| 25 to 44 Years | 598 (19.2%) | $83,654 |
| 45 to 64 Years | 1,161 (37.2%) | $125,673 |
| 65+ Years | 1,301 (41.7%) | $84,309 |
| Total | 3,121 (100.0%) | $104,115 |
Poverty in Valley Center
Income Below Poverty by Sex and Age in Valley Center
With 11.0% poverty level for males and 17.1% for females among the residents of Valley Center, under 5 year old males and 6 to 11 year old females are the most vulnerable to poverty, with 170 males (48.6%) and 148 females (43.1%) in their respective age groups living below the poverty level.
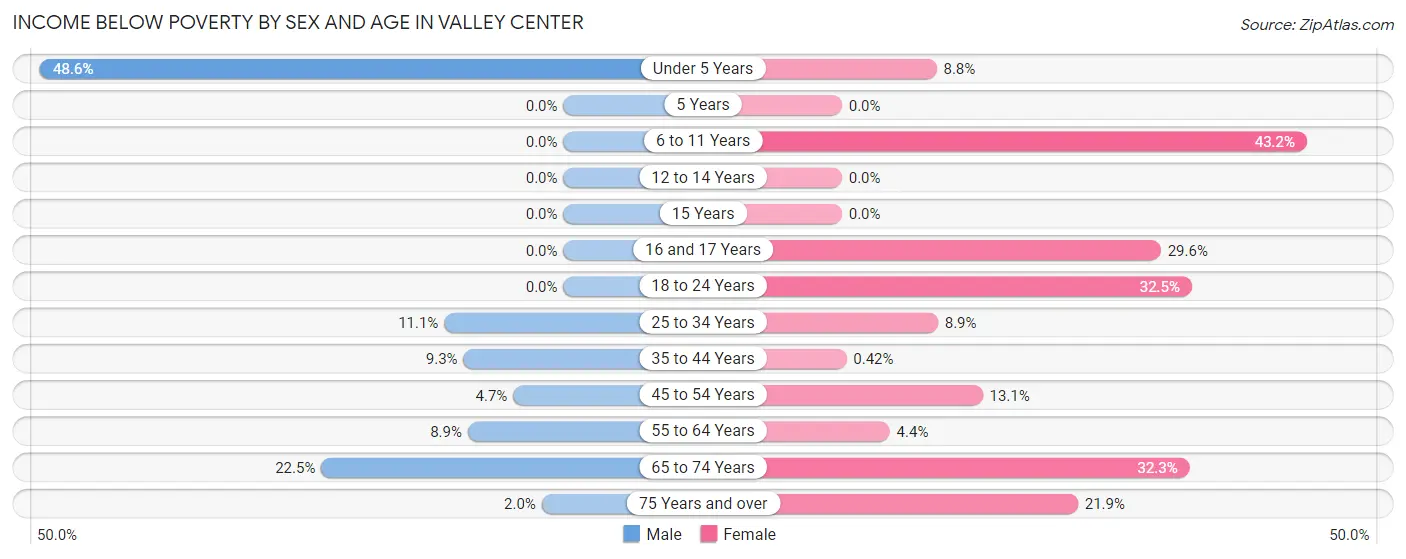
| Age Bracket | Male | Female |
| Under 5 Years | 170 (48.6%) | 35 (8.8%) |
| 5 Years | 0 (0.0%) | 0 (0.0%) |
| 6 to 11 Years | 0 (0.0%) | 148 (43.1%) |
| 12 to 14 Years | 0 (0.0%) | 0 (0.0%) |
| 15 Years | 0 (0.0%) | 0 (0.0%) |
| 16 and 17 Years | 0 (0.0%) | 37 (29.6%) |
| 18 to 24 Years | 0 (0.0%) | 202 (32.5%) |
| 25 to 34 Years | 97 (11.1%) | 58 (8.9%) |
| 35 to 44 Years | 48 (9.3%) | 2 (0.4%) |
| 45 to 54 Years | 23 (4.7%) | 76 (13.1%) |
| 55 to 64 Years | 51 (8.9%) | 34 (4.4%) |
| 65 to 74 Years | 153 (22.5%) | 263 (32.3%) |
| 75 Years and over | 8 (2.0%) | 113 (21.9%) |
| Total | 550 (11.0%) | 968 (17.1%) |
Income Above Poverty by Sex and Age in Valley Center
According to the poverty statistics in Valley Center, males aged 5 years and females aged 5 years are the age groups that are most secure financially, with 100.0% of males and 100.0% of females in these age groups living above the poverty line.
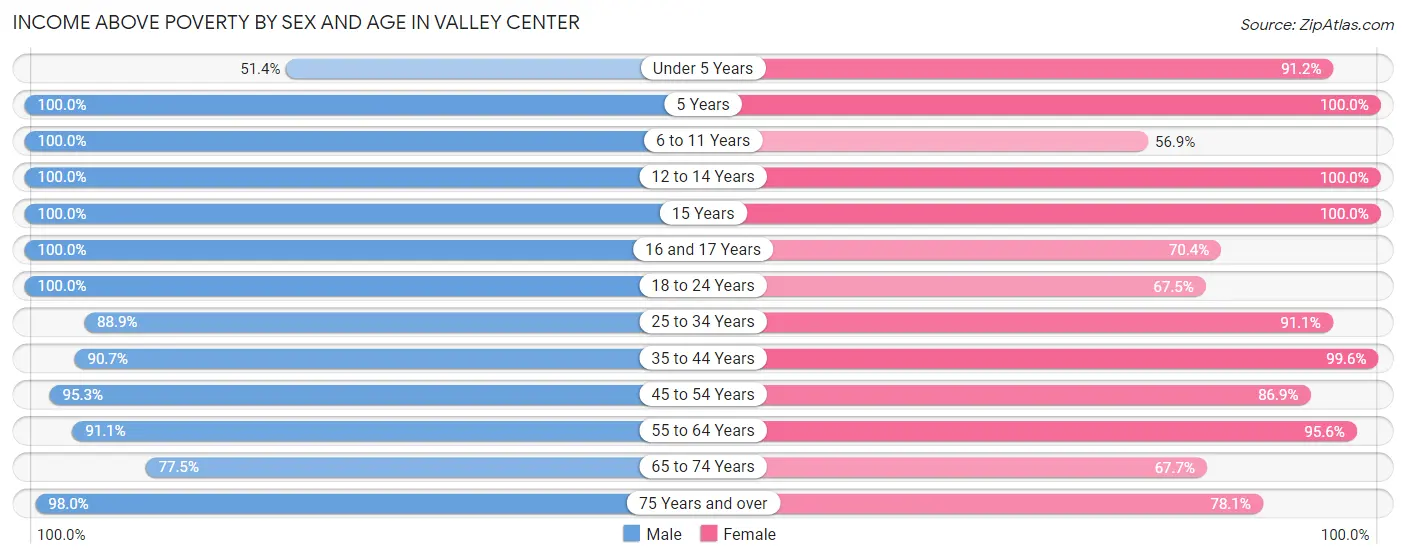
| Age Bracket | Male | Female |
| Under 5 Years | 180 (51.4%) | 363 (91.2%) |
| 5 Years | 37 (100.0%) | 11 (100.0%) |
| 6 to 11 Years | 301 (100.0%) | 195 (56.9%) |
| 12 to 14 Years | 213 (100.0%) | 286 (100.0%) |
| 15 Years | 31 (100.0%) | 80 (100.0%) |
| 16 and 17 Years | 155 (100.0%) | 88 (70.4%) |
| 18 to 24 Years | 357 (100.0%) | 420 (67.5%) |
| 25 to 34 Years | 780 (88.9%) | 593 (91.1%) |
| 35 to 44 Years | 470 (90.7%) | 472 (99.6%) |
| 45 to 54 Years | 471 (95.3%) | 506 (86.9%) |
| 55 to 64 Years | 524 (91.1%) | 732 (95.6%) |
| 65 to 74 Years | 528 (77.5%) | 552 (67.7%) |
| 75 Years and over | 390 (98.0%) | 403 (78.1%) |
| Total | 4,437 (89.0%) | 4,701 (82.9%) |
Income Below Poverty Among Married-Couple Families in Valley Center
The poverty statistics for married-couple families in Valley Center show that 11.1% or 216 of the total 1,954 families live below the poverty line. Families with 3 or 4 children have the highest poverty rate of 32.6%, comprising of 60 families. On the other hand, families with 1 or 2 children have the lowest poverty rate of 0.0%, which includes 0 families.
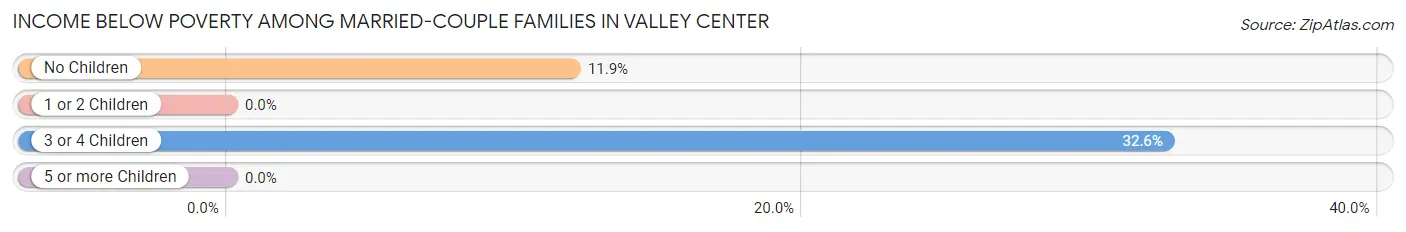
| Children | Above Poverty | Below Poverty |
| No Children | 1,151 (88.1%) | 156 (11.9%) |
| 1 or 2 Children | 404 (100.0%) | 0 (0.0%) |
| 3 or 4 Children | 124 (67.4%) | 60 (32.6%) |
| 5 or more Children | 59 (100.0%) | 0 (0.0%) |
| Total | 1,738 (88.9%) | 216 (11.1%) |
Income Below Poverty Among Single-Parent Households in Valley Center
According to the poverty data in Valley Center, 14.3% or 17 single-father households and 10.7% or 46 single-mother households are living below the poverty line. Among single-father households, those with no children have the highest poverty rate, with 17 households (23.9%) experiencing poverty. Likewise, among single-mother households, those with 3 or 4 children have the highest poverty rate, with 27 households (42.9%) falling below the poverty line.
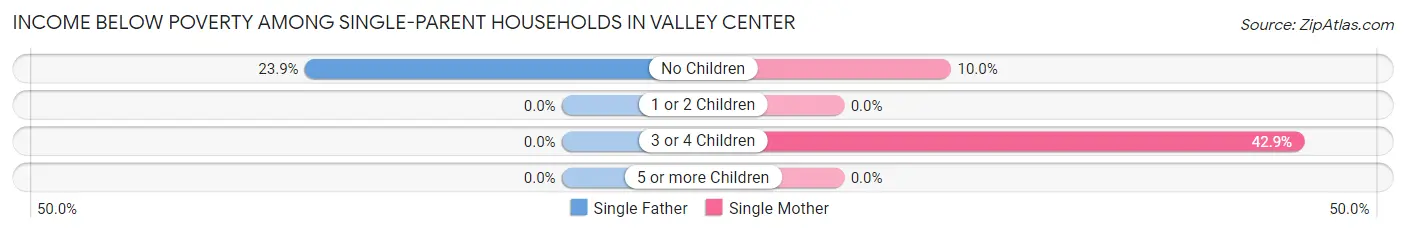
| Children | Single Father | Single Mother |
| No Children | 17 (23.9%) | 19 (10.0%) |
| 1 or 2 Children | 0 (0.0%) | 0 (0.0%) |
| 3 or 4 Children | 0 (0.0%) | 27 (42.9%) |
| 5 or more Children | 0 (0.0%) | 0 (0.0%) |
| Total | 17 (14.3%) | 46 (10.7%) |
Income Below Poverty Among Married-Couple vs Single-Parent Households in Valley Center
The poverty data for Valley Center shows that 216 of the married-couple family households (11.1%) and 63 of the single-parent households (11.5%) are living below the poverty level. Within the married-couple family households, those with 3 or 4 children have the highest poverty rate, with 60 households (32.6%) falling below the poverty line. Among the single-parent households, those with 3 or 4 children have the highest poverty rate, with 27 household (25.0%) living below poverty.
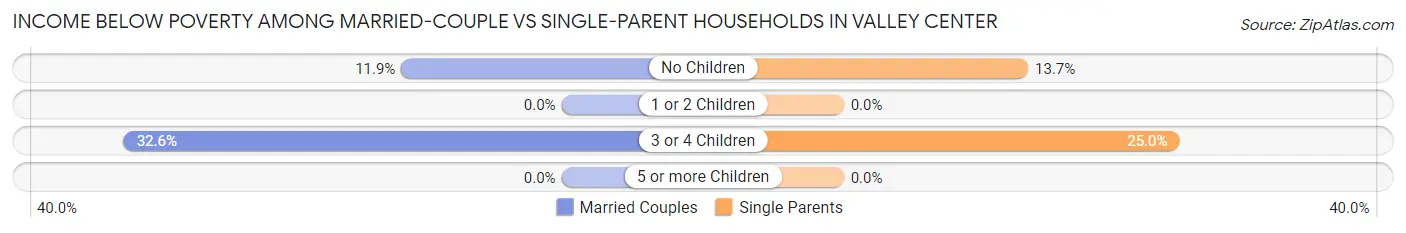
| Children | Married-Couple Families | Single-Parent Households |
| No Children | 156 (11.9%) | 36 (13.7%) |
| 1 or 2 Children | 0 (0.0%) | 0 (0.0%) |
| 3 or 4 Children | 60 (32.6%) | 27 (25.0%) |
| 5 or more Children | 0 (0.0%) | 0 (0.0%) |
| Total | 216 (11.1%) | 63 (11.5%) |
Race in Valley Center
The most populous races in Valley Center are White / Caucasian (7,292 | 66.7%), Hispanic or Latino (4,154 | 38.0%), and Two or more Races (2,305 | 21.1%).
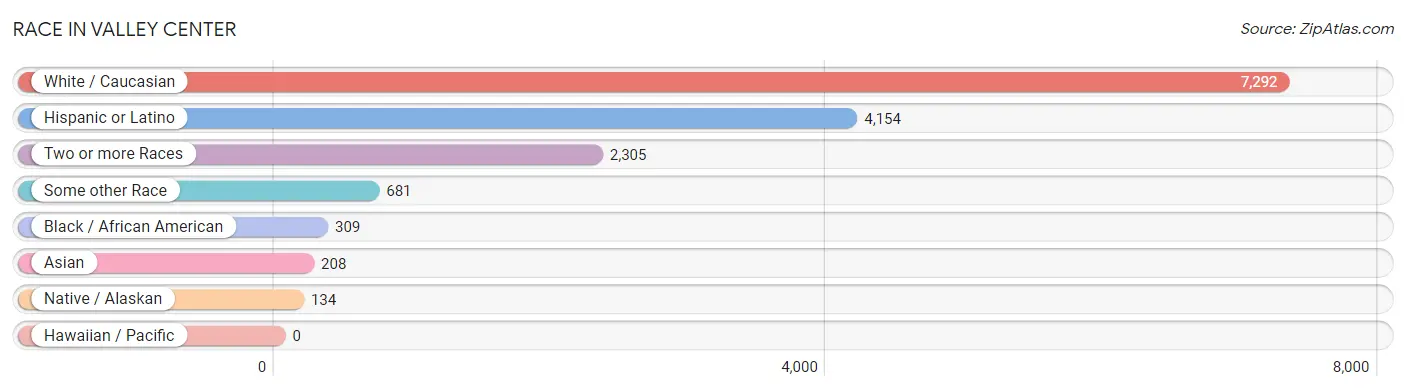
| Race | # Population | % Population |
| Asian | 208 | 1.9% |
| Black / African American | 309 | 2.8% |
| Hawaiian / Pacific | 0 | 0.0% |
| Hispanic or Latino | 4,154 | 38.0% |
| Native / Alaskan | 134 | 1.2% |
| White / Caucasian | 7,292 | 66.7% |
| Two or more Races | 2,305 | 21.1% |
| Some other Race | 681 | 6.2% |
| Total | 10,929 | 100.0% |
Ancestry in Valley Center
The most populous ancestries reported in Valley Center are Mexican (3,827 | 35.0%), German (1,401 | 12.8%), English (1,102 | 10.1%), Irish (896 | 8.2%), and American (467 | 4.3%), together accounting for 70.4% of all Valley Center residents.
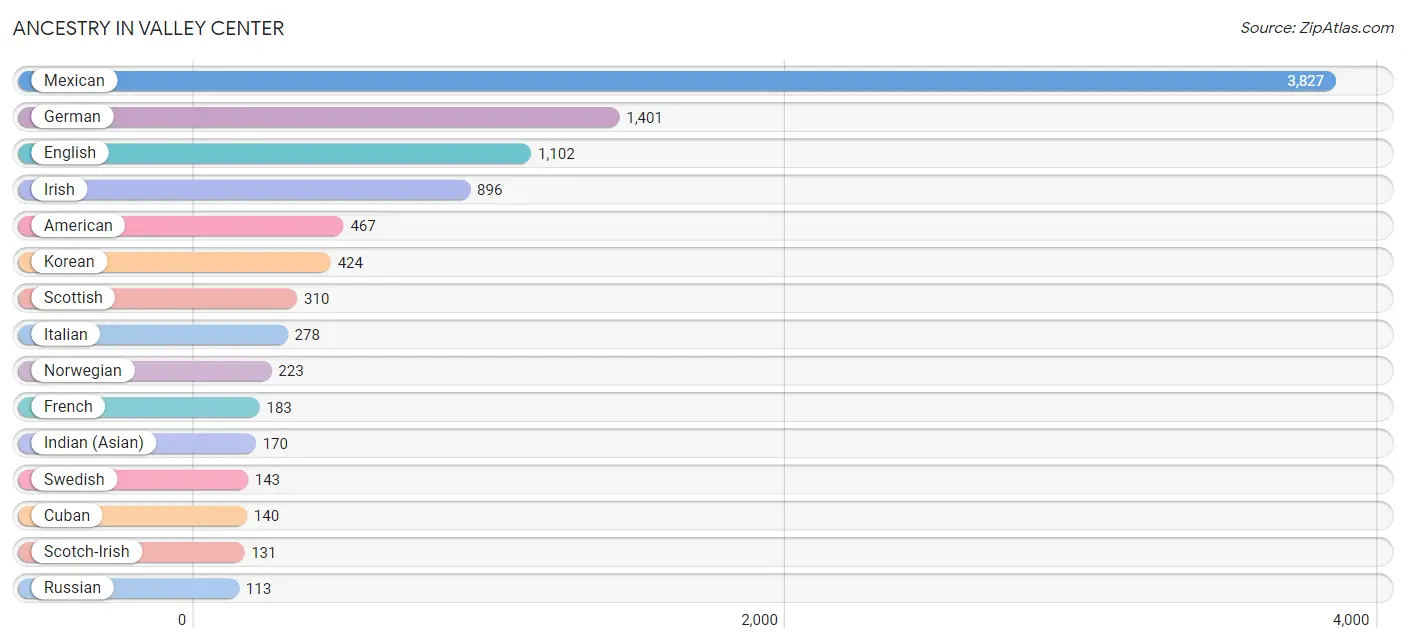
| Ancestry | # Population | % Population |
| American | 467 | 4.3% |
| Arab | 29 | 0.3% |
| Armenian | 12 | 0.1% |
| Bhutanese | 21 | 0.2% |
| British | 89 | 0.8% |
| Burmese | 31 | 0.3% |
| Canadian | 8 | 0.1% |
| Central American | 18 | 0.2% |
| Cherokee | 33 | 0.3% |
| Chickasaw | 37 | 0.3% |
| Croatian | 47 | 0.4% |
| Cuban | 140 | 1.3% |
| Czech | 3 | 0.0% |
| Danish | 91 | 0.8% |
| Dutch | 51 | 0.5% |
| English | 1,102 | 10.1% |
| European | 56 | 0.5% |
| Finnish | 34 | 0.3% |
| French | 183 | 1.7% |
| French Canadian | 88 | 0.8% |
| German | 1,401 | 12.8% |
| Greek | 47 | 0.4% |
| Guatemalan | 18 | 0.2% |
| Hungarian | 17 | 0.2% |
| Indian (Asian) | 170 | 1.6% |
| Iranian | 46 | 0.4% |
| Irish | 896 | 8.2% |
| Iroquois | 8 | 0.1% |
| Italian | 278 | 2.5% |
| Korean | 424 | 3.9% |
| Lithuanian | 36 | 0.3% |
| Mexican | 3,827 | 35.0% |
| Mexican American Indian | 37 | 0.3% |
| Native Hawaiian | 21 | 0.2% |
| Norwegian | 223 | 2.0% |
| Polish | 39 | 0.4% |
| Portuguese | 86 | 0.8% |
| Puerto Rican | 34 | 0.3% |
| Russian | 113 | 1.0% |
| Scandinavian | 38 | 0.4% |
| Scotch-Irish | 131 | 1.2% |
| Scottish | 310 | 2.8% |
| Shoshone | 16 | 0.2% |
| Spaniard | 47 | 0.4% |
| Spanish | 43 | 0.4% |
| Sri Lankan | 34 | 0.3% |
| Swedish | 143 | 1.3% |
| Syrian | 17 | 0.2% |
| Tlingit-Haida | 12 | 0.1% |
| Welsh | 33 | 0.3% | View All 50 Rows |
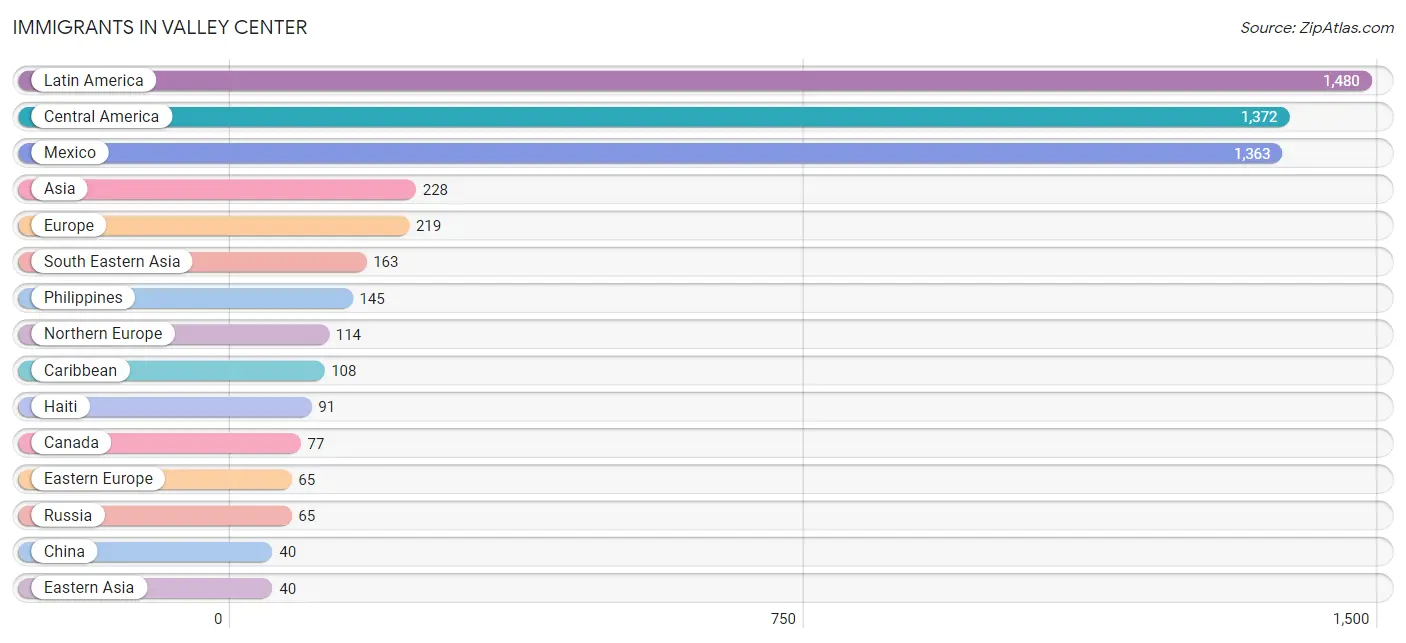
Immigrants in Valley Center
The most numerous immigrant groups reported in Valley Center came from Latin America (1,480 | 13.5%), Central America (1,372 | 12.6%), Mexico (1,363 | 12.5%), Asia (228 | 2.1%), and Europe (219 | 2.0%), together accounting for 42.7% of all Valley Center residents.
| Immigration Origin | # Population | % Population |
| Asia | 228 | 2.1% |
| Canada | 77 | 0.7% |
| Caribbean | 108 | 1.0% |
| Central America | 1,372 | 12.6% |
| China | 40 | 0.4% |
| Cuba | 17 | 0.2% |
| Eastern Asia | 40 | 0.4% |
| Eastern Europe | 65 | 0.6% |
| Europe | 219 | 2.0% |
| Germany | 15 | 0.1% |
| Greece | 25 | 0.2% |
| Guatemala | 9 | 0.1% |
| Haiti | 91 | 0.8% |
| Iran | 25 | 0.2% |
| Latin America | 1,480 | 13.5% |
| Mexico | 1,363 | 12.5% |
| Northern Europe | 114 | 1.0% |
| Norway | 24 | 0.2% |
| Philippines | 145 | 1.3% |
| Russia | 65 | 0.6% |
| South Central Asia | 25 | 0.2% |
| South Eastern Asia | 163 | 1.5% |
| Southern Europe | 25 | 0.2% |
| Vietnam | 18 | 0.2% |
| Western Europe | 15 | 0.1% | View All 25 Rows |
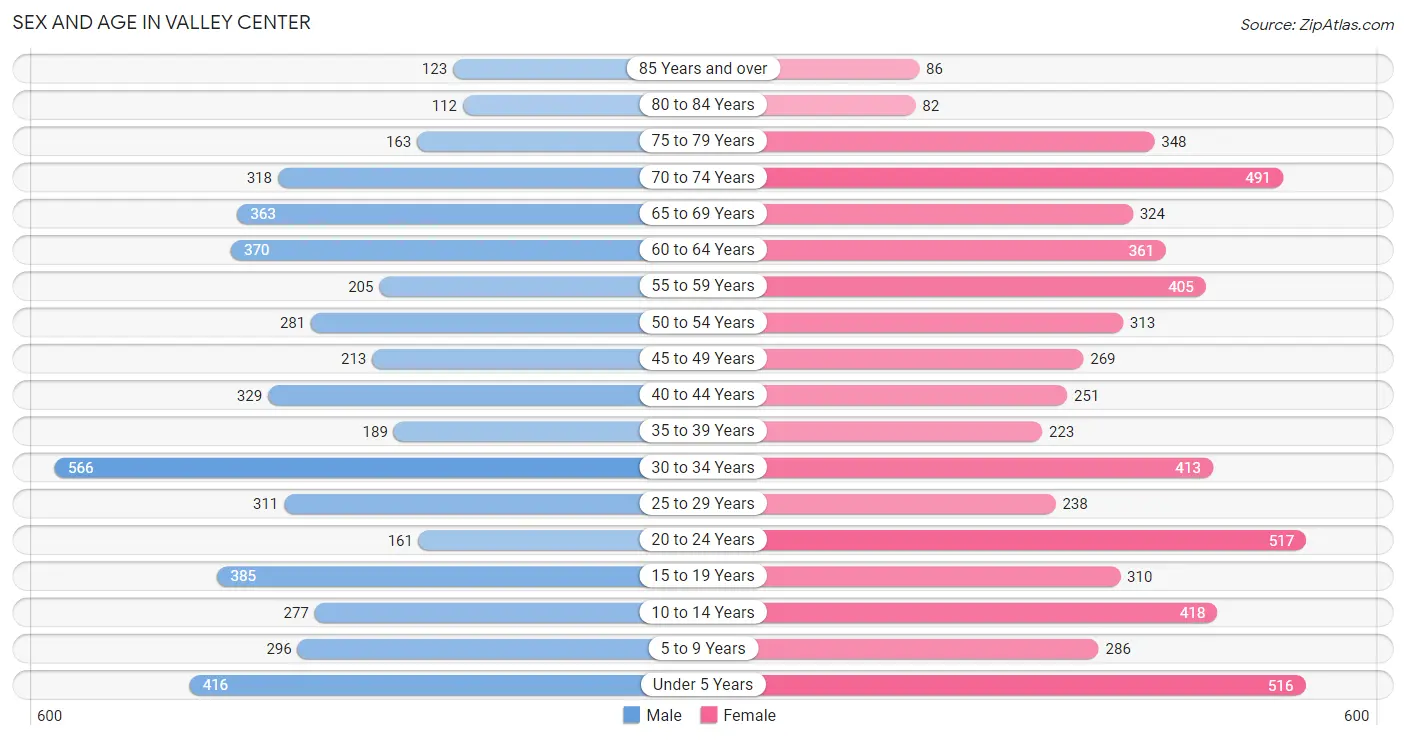
Sex and Age in Valley Center
Sex and Age in Valley Center
The most populous age groups in Valley Center are 30 to 34 Years (566 | 11.2%) for men and 20 to 24 Years (517 | 8.8%) for women.
| Age Bracket | Male | Female |
| Under 5 Years | 416 (8.2%) | 516 (8.8%) |
| 5 to 9 Years | 296 (5.8%) | 286 (4.9%) |
| 10 to 14 Years | 277 (5.4%) | 418 (7.1%) |
| 15 to 19 Years | 385 (7.6%) | 310 (5.3%) |
| 20 to 24 Years | 161 (3.2%) | 517 (8.8%) |
| 25 to 29 Years | 311 (6.1%) | 238 (4.1%) |
| 30 to 34 Years | 566 (11.2%) | 413 (7.1%) |
| 35 to 39 Years | 189 (3.7%) | 223 (3.8%) |
| 40 to 44 Years | 329 (6.5%) | 251 (4.3%) |
| 45 to 49 Years | 213 (4.2%) | 269 (4.6%) |
| 50 to 54 Years | 281 (5.5%) | 313 (5.3%) |
| 55 to 59 Years | 205 (4.0%) | 405 (6.9%) |
| 60 to 64 Years | 370 (7.3%) | 361 (6.2%) |
| 65 to 69 Years | 363 (7.1%) | 324 (5.5%) |
| 70 to 74 Years | 318 (6.3%) | 491 (8.4%) |
| 75 to 79 Years | 163 (3.2%) | 348 (5.9%) |
| 80 to 84 Years | 112 (2.2%) | 82 (1.4%) |
| 85 Years and over | 123 (2.4%) | 86 (1.5%) |
| Total | 5,078 (100.0%) | 5,851 (100.0%) |
Families and Households in Valley Center
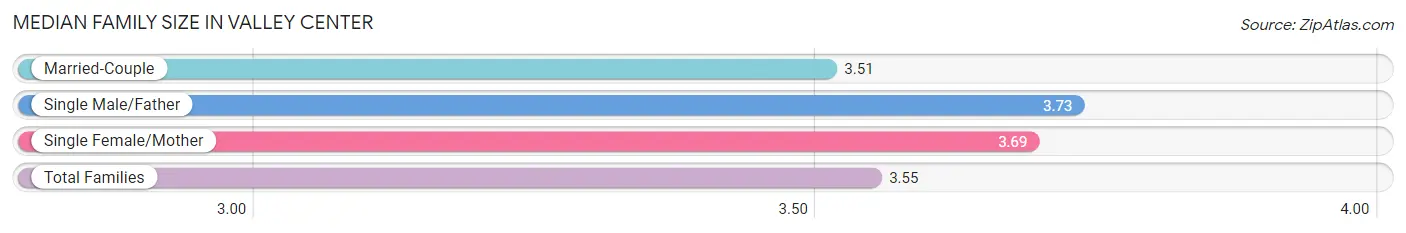
Median Family Size in Valley Center
The median family size in Valley Center is 3.55 persons per family, with single male/father families (119 | 4.8%) accounting for the largest median family size of 3.73 persons per family. On the other hand, married-couple families (1,954 | 78.0%) represent the smallest median family size with 3.51 persons per family.
| Family Type | # Families | Family Size |
| Married-Couple | 1,954 (78.0%) | 3.51 |
| Single Male/Father | 119 (4.8%) | 3.73 |
| Single Female/Mother | 431 (17.2%) | 3.69 |
| Total Families | 2,504 (100.0%) | 3.55 |
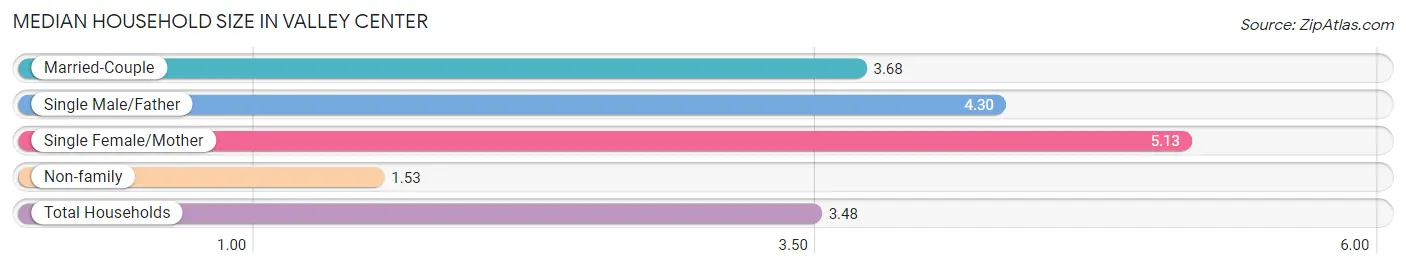
Median Household Size in Valley Center
The median household size in Valley Center is 3.48 persons per household, with single female/mother households (431 | 13.8%) accounting for the largest median household size of 5.13 persons per household. non-family households (617 | 19.8%) represent the smallest median household size with 1.53 persons per household.
| Household Type | # Households | Household Size |
| Married-Couple | 1,954 (62.6%) | 3.68 |
| Single Male/Father | 119 (3.8%) | 4.30 |
| Single Female/Mother | 431 (13.8%) | 5.13 |
| Non-family | 617 (19.8%) | 1.53 |
| Total Households | 3,121 (100.0%) | 3.48 |
Household Size by Marriage Status in Valley Center
Out of a total of 3,121 households in Valley Center, 2,504 (80.2%) are family households, while 617 (19.8%) are nonfamily households. The most numerous type of family households are 2-person households, comprising 855, and the most common type of nonfamily households are 1-person households, comprising 401.
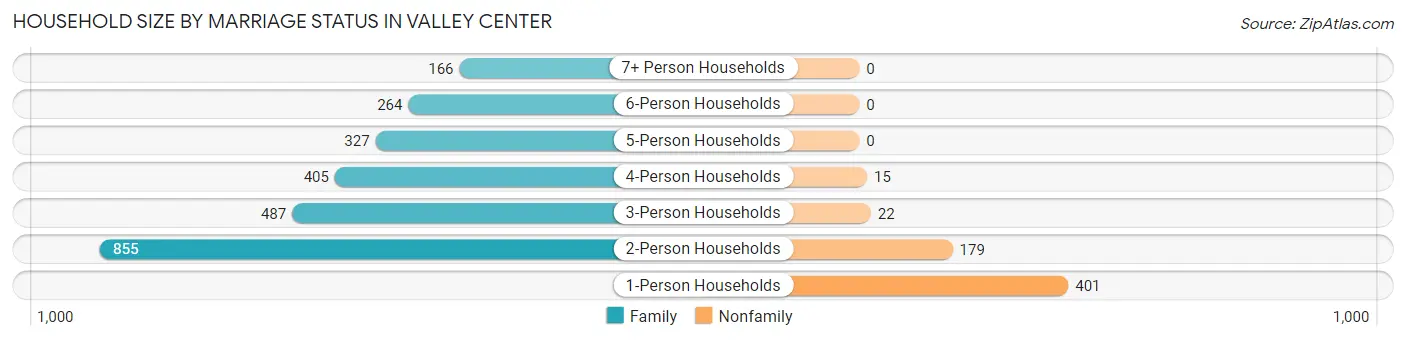
| Household Size | Family Households | Nonfamily Households |
| 1-Person Households | - | 401 (12.9%) |
| 2-Person Households | 855 (27.4%) | 179 (5.7%) |
| 3-Person Households | 487 (15.6%) | 22 (0.7%) |
| 4-Person Households | 405 (13.0%) | 15 (0.5%) |
| 5-Person Households | 327 (10.5%) | 0 (0.0%) |
| 6-Person Households | 264 (8.5%) | 0 (0.0%) |
| 7+ Person Households | 166 (5.3%) | 0 (0.0%) |
| Total | 2,504 (80.2%) | 617 (19.8%) |
Female Fertility in Valley Center
Fertility by Age in Valley Center
Average fertility rate in Valley Center is 48.0 births per 1,000 women. Women in the age bracket of 20 to 34 years have the highest fertility rate with 71.0 births per 1,000 women. Women in the age bracket of 20 to 34 years acount for 77.6% of all women with births.
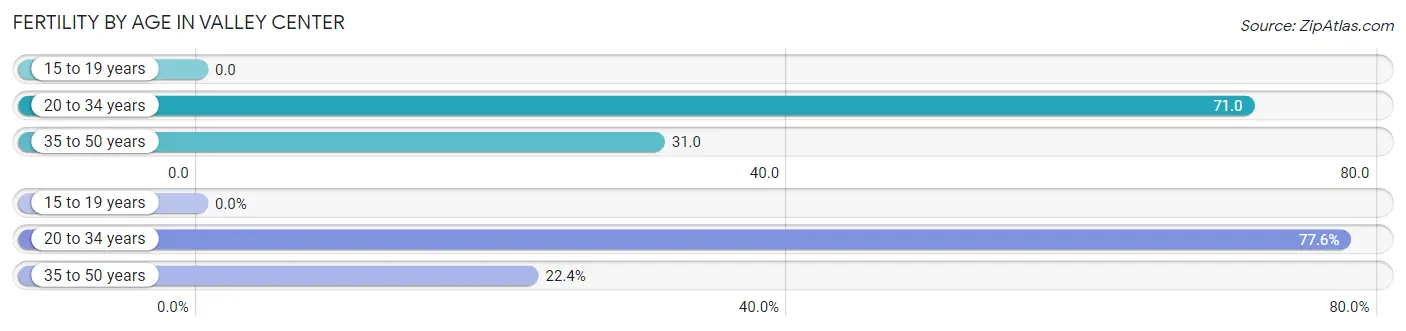
| Age Bracket | Women with Births | Births / 1,000 Women |
| 15 to 19 years | 0 (0.0%) | 0.0 |
| 20 to 34 years | 83 (77.6%) | 71.0 |
| 35 to 50 years | 24 (22.4%) | 31.0 |
| Total | 107 (100.0%) | 48.0 |
Fertility by Age by Marriage Status in Valley Center
74.8% of women with births (107) in Valley Center are married. The highest percentage of unmarried women with births falls into 20 to 34 years age bracket with 32.5% of them unmarried at the time of birth, while the lowest percentage of unmarried women with births belong to 35 to 50 years age bracket with 0.0% of them unmarried.
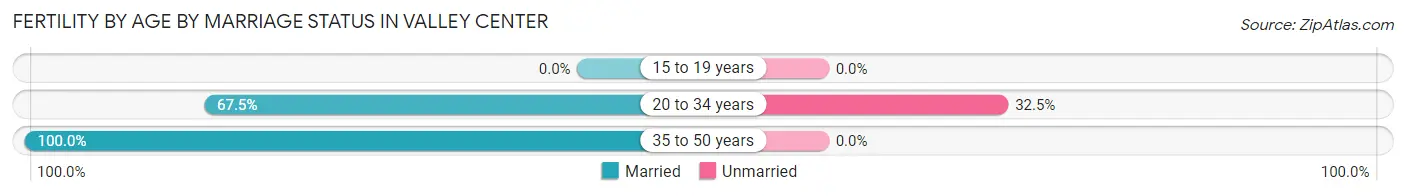
| Age Bracket | Married | Unmarried |
| 15 to 19 years | 0 (0.0%) | 0 (0.0%) |
| 20 to 34 years | 56 (67.5%) | 27 (32.5%) |
| 35 to 50 years | 24 (100.0%) | 0 (0.0%) |
| Total | 80 (74.8%) | 27 (25.2%) |
Fertility by Education in Valley Center
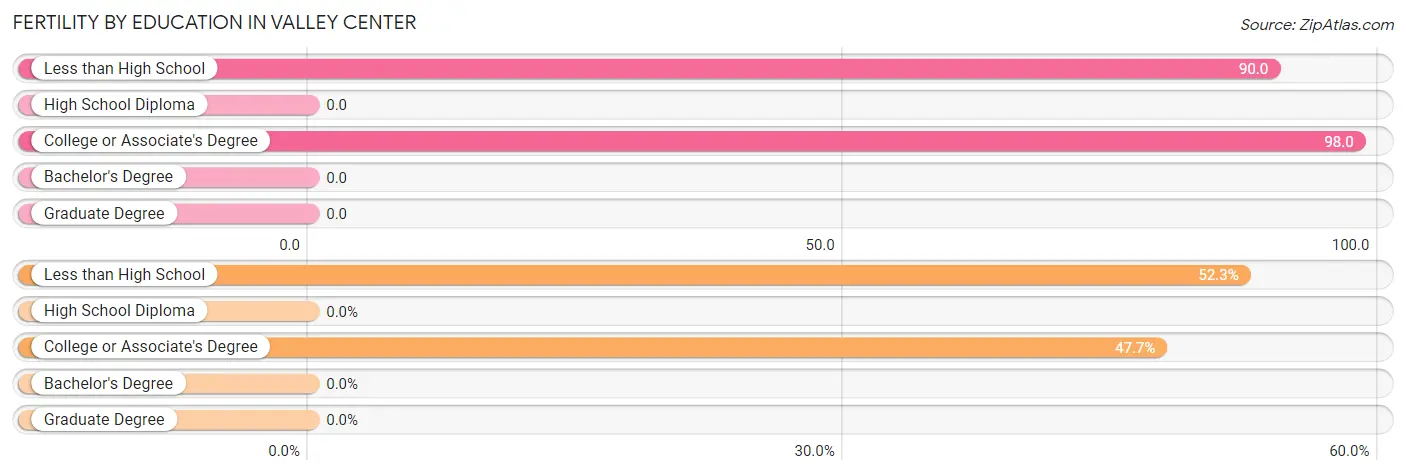
| Educational Attainment | Women with Births | Births / 1,000 Women |
| Less than High School | 56 (52.3%) | 90.0 |
| High School Diploma | 0 (0.0%) | 0.0 |
| College or Associate's Degree | 51 (47.7%) | 98.0 |
| Bachelor's Degree | 0 (0.0%) | 0.0 |
| Graduate Degree | 0 (0.0%) | 0.0 |
| Total | 107 (100.0%) | 48.0 |
Fertility by Education by Marriage Status in Valley Center
25.2% of women with births in Valley Center are unmarried. Women with the educational attainment of less than high school are most likely to be married with 100.0% of them married at childbirth, while women with the educational attainment of college or associate's degree are least likely to be married with 52.9% of them unmarried at childbirth.
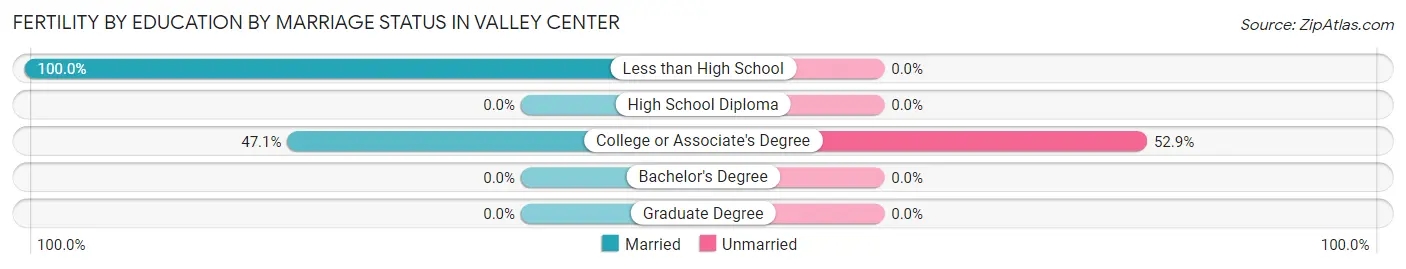
| Educational Attainment | Married | Unmarried |
| Less than High School | 56 (100.0%) | 0 (0.0%) |
| High School Diploma | 0 (0.0%) | 0 (0.0%) |
| College or Associate's Degree | 24 (47.1%) | 27 (52.9%) |
| Bachelor's Degree | 0 (0.0%) | 0 (0.0%) |
| Graduate Degree | 0 (0.0%) | 0 (0.0%) |
| Total | 80 (74.8%) | 27 (25.2%) |
Employment Characteristics in Valley Center
Employment by Class of Employer in Valley Center
Among the 4,623 employed individuals in Valley Center, private company employees (3,015 | 65.2%), self-employed (not incorporated) (598 | 12.9%), and self-employed (incorporated) (500 | 10.8%) make up the most common classes of employment.
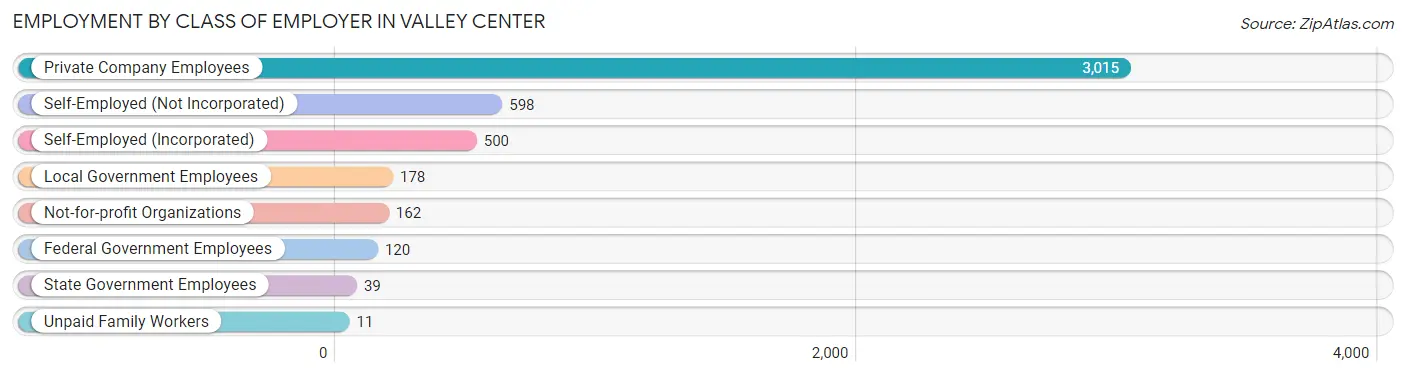
| Employer Class | # Employees | % Employees |
| Private Company Employees | 3,015 | 65.2% |
| Self-Employed (Incorporated) | 500 | 10.8% |
| Self-Employed (Not Incorporated) | 598 | 12.9% |
| Not-for-profit Organizations | 162 | 3.5% |
| Local Government Employees | 178 | 3.8% |
| State Government Employees | 39 | 0.8% |
| Federal Government Employees | 120 | 2.6% |
| Unpaid Family Workers | 11 | 0.2% |
| Total | 4,623 | 100.0% |
Employment Status by Age in Valley Center
According to the labor force statistics for Valley Center, out of the total population over 16 years of age (8,609), 56.2% or 4,838 individuals are in the labor force, with 3.1% or 150 of them unemployed. The age group with the highest labor force participation rate is 30 to 34 years, with 85.7% or 839 individuals in the labor force. Within the labor force, the 16 to 19 years age range has the highest percentage of unemployed individuals, with 8.2% or 16 of them being unemployed.
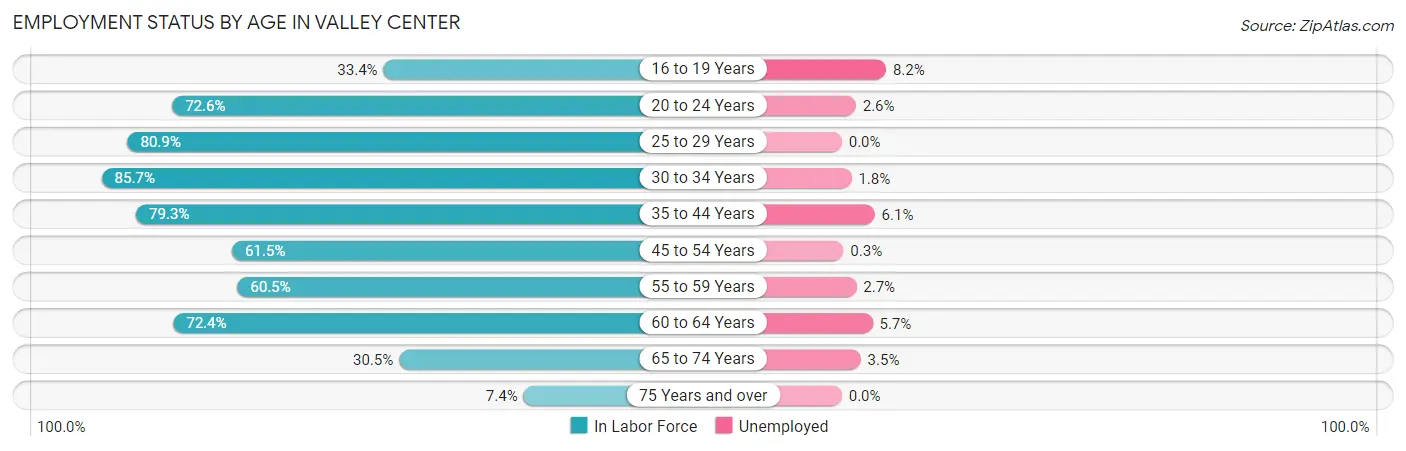
| Age Bracket | In Labor Force | Unemployed |
| 16 to 19 Years | 195 (33.4%) | 16 (8.2%) |
| 20 to 24 Years | 492 (72.6%) | 13 (2.6%) |
| 25 to 29 Years | 444 (80.9%) | 0 (0.0%) |
| 30 to 34 Years | 839 (85.7%) | 15 (1.8%) |
| 35 to 44 Years | 787 (79.3%) | 48 (6.1%) |
| 45 to 54 Years | 662 (61.5%) | 2 (0.3%) |
| 55 to 59 Years | 369 (60.5%) | 10 (2.7%) |
| 60 to 64 Years | 529 (72.4%) | 30 (5.7%) |
| 65 to 74 Years | 456 (30.5%) | 16 (3.5%) |
| 75 Years and over | 68 (7.4%) | 0 (0.0%) |
| Total | 4,838 (56.2%) | 150 (3.1%) |
Employment Status by Educational Attainment in Valley Center
According to labor force statistics for Valley Center, 73.5% of individuals (3,629) out of the total population between 25 and 64 years of age (4,937) are in the labor force, with 2.9% or 105 of them being unemployed. The group with the highest labor force participation rate are those with the educational attainment of college / associate degree, with 79.8% or 1,388 individuals in the labor force. Within the labor force, individuals with college / associate degree education have the highest percentage of unemployment, with 5.6% or 78 of them being unemployed.
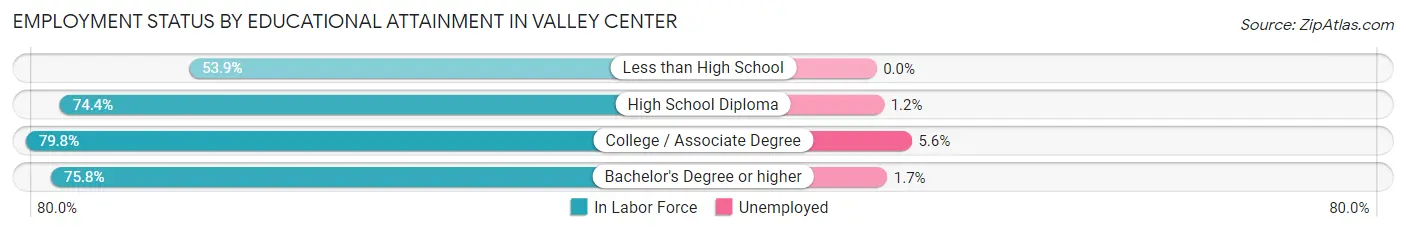
| Educational Attainment | In Labor Force | Unemployed |
| Less than High School | 405 (53.9%) | 0 (0.0%) |
| High School Diploma | 859 (74.4%) | 14 (1.2%) |
| College / Associate Degree | 1,388 (79.8%) | 97 (5.6%) |
| Bachelor's Degree or higher | 979 (75.8%) | 22 (1.7%) |
| Total | 3,629 (73.5%) | 143 (2.9%) |
Employment Occupations by Sex in Valley Center
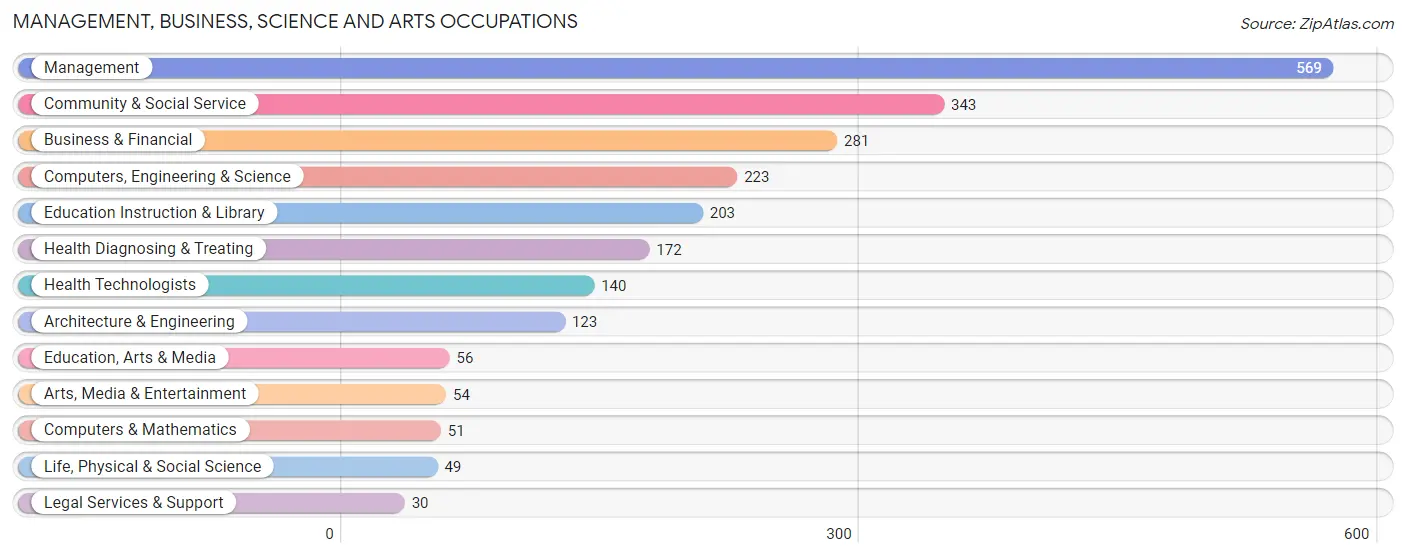
Management, Business, Science and Arts Occupations
The most common Management, Business, Science and Arts occupations in Valley Center are Management (569 | 12.1%), Community & Social Service (343 | 7.3%), Business & Financial (281 | 6.0%), Computers, Engineering & Science (223 | 4.8%), and Education Instruction & Library (203 | 4.3%).
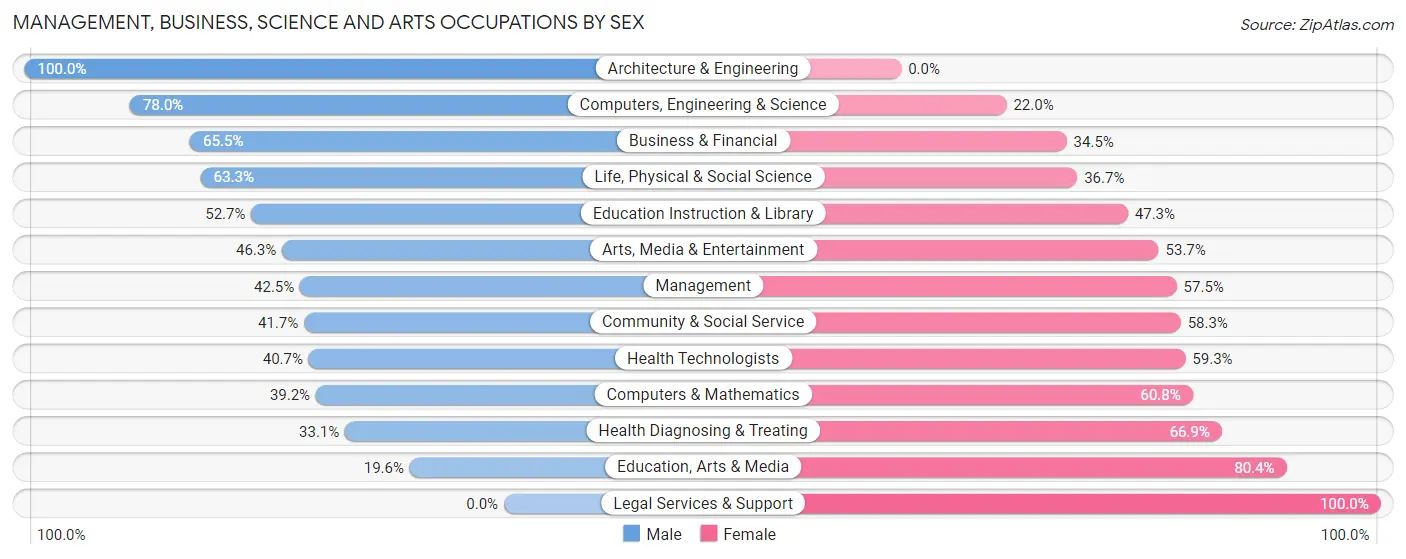
Management, Business, Science and Arts Occupations by Sex
Within the Management, Business, Science and Arts occupations in Valley Center, the most male-oriented occupations are Architecture & Engineering (100.0%), Computers, Engineering & Science (78.0%), and Business & Financial (65.5%), while the most female-oriented occupations are Legal Services & Support (100.0%), Education, Arts & Media (80.4%), and Health Diagnosing & Treating (66.9%).
| Occupation | Male | Female |
| Management | 242 (42.5%) | 327 (57.5%) |
| Business & Financial | 184 (65.5%) | 97 (34.5%) |
| Computers, Engineering & Science | 174 (78.0%) | 49 (22.0%) |
| Computers & Mathematics | 20 (39.2%) | 31 (60.8%) |
| Architecture & Engineering | 123 (100.0%) | 0 (0.0%) |
| Life, Physical & Social Science | 31 (63.3%) | 18 (36.7%) |
| Community & Social Service | 143 (41.7%) | 200 (58.3%) |
| Education, Arts & Media | 11 (19.6%) | 45 (80.4%) |
| Legal Services & Support | 0 (0.0%) | 30 (100.0%) |
| Education Instruction & Library | 107 (52.7%) | 96 (47.3%) |
| Arts, Media & Entertainment | 25 (46.3%) | 29 (53.7%) |
| Health Diagnosing & Treating | 57 (33.1%) | 115 (66.9%) |
| Health Technologists | 57 (40.7%) | 83 (59.3%) |
| Total (Category) | 800 (50.4%) | 788 (49.6%) |
| Total (Overall) | 2,569 (54.7%) | 2,123 (45.3%) |
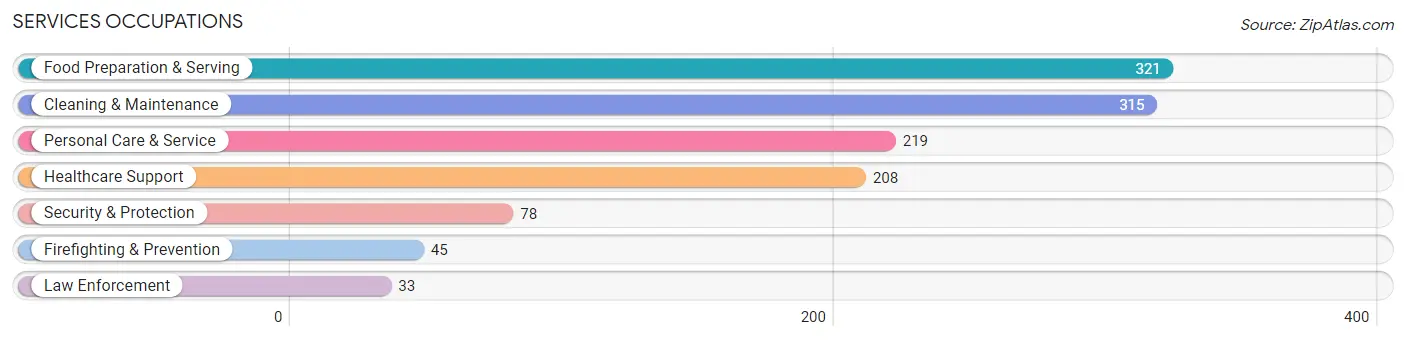
Services Occupations
The most common Services occupations in Valley Center are Food Preparation & Serving (321 | 6.8%), Cleaning & Maintenance (315 | 6.7%), Personal Care & Service (219 | 4.7%), Healthcare Support (208 | 4.4%), and Security & Protection (78 | 1.7%).
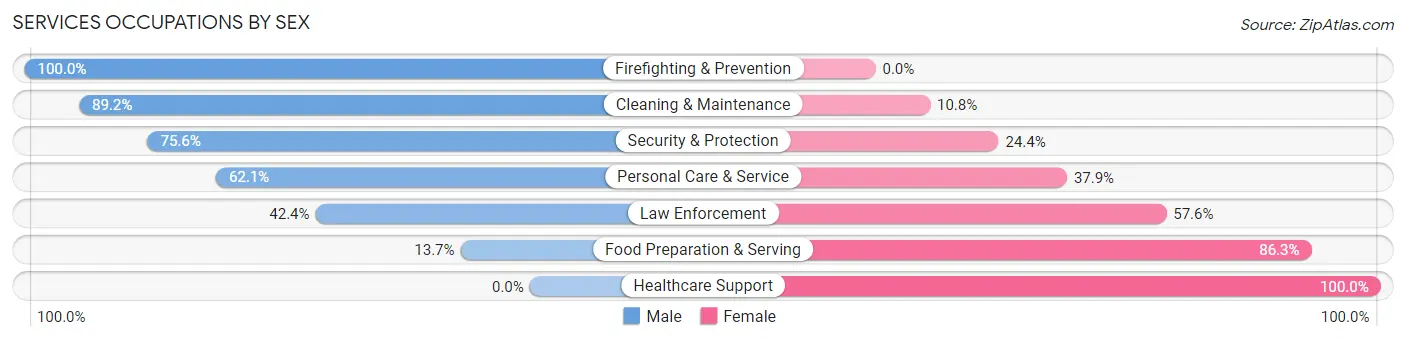
Services Occupations by Sex
Within the Services occupations in Valley Center, the most male-oriented occupations are Firefighting & Prevention (100.0%), Cleaning & Maintenance (89.2%), and Security & Protection (75.6%), while the most female-oriented occupations are Healthcare Support (100.0%), Food Preparation & Serving (86.3%), and Law Enforcement (57.6%).
| Occupation | Male | Female |
| Healthcare Support | 0 (0.0%) | 208 (100.0%) |
| Security & Protection | 59 (75.6%) | 19 (24.4%) |
| Firefighting & Prevention | 45 (100.0%) | 0 (0.0%) |
| Law Enforcement | 14 (42.4%) | 19 (57.6%) |
| Food Preparation & Serving | 44 (13.7%) | 277 (86.3%) |
| Cleaning & Maintenance | 281 (89.2%) | 34 (10.8%) |
| Personal Care & Service | 136 (62.1%) | 83 (37.9%) |
| Total (Category) | 520 (45.6%) | 621 (54.4%) |
| Total (Overall) | 2,569 (54.7%) | 2,123 (45.3%) |
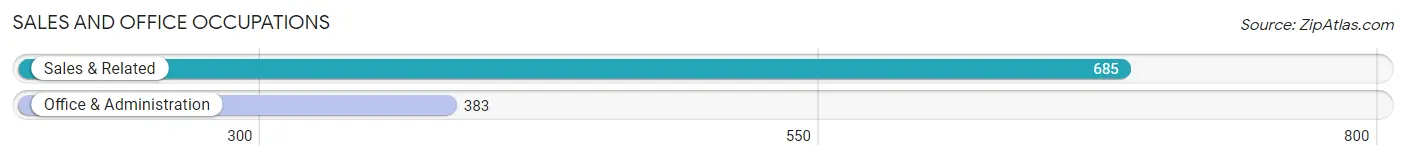
Sales and Office Occupations
The most common Sales and Office occupations in Valley Center are Sales & Related (685 | 14.6%), and Office & Administration (383 | 8.2%).
Sales and Office Occupations by Sex
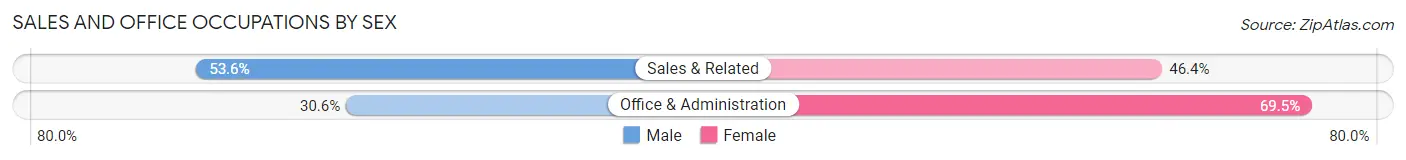
| Occupation | Male | Female |
| Sales & Related | 367 (53.6%) | 318 (46.4%) |
| Office & Administration | 117 (30.5%) | 266 (69.5%) |
| Total (Category) | 484 (45.3%) | 584 (54.7%) |
| Total (Overall) | 2,569 (54.7%) | 2,123 (45.3%) |
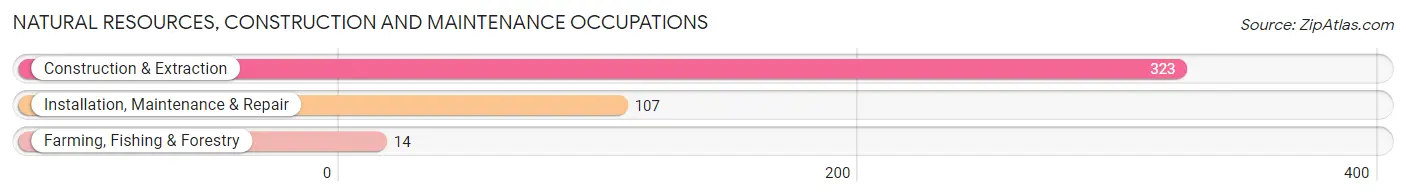
Natural Resources, Construction and Maintenance Occupations
The most common Natural Resources, Construction and Maintenance occupations in Valley Center are Construction & Extraction (323 | 6.9%), Installation, Maintenance & Repair (107 | 2.3%), and Farming, Fishing & Forestry (14 | 0.3%).
Natural Resources, Construction and Maintenance Occupations by Sex
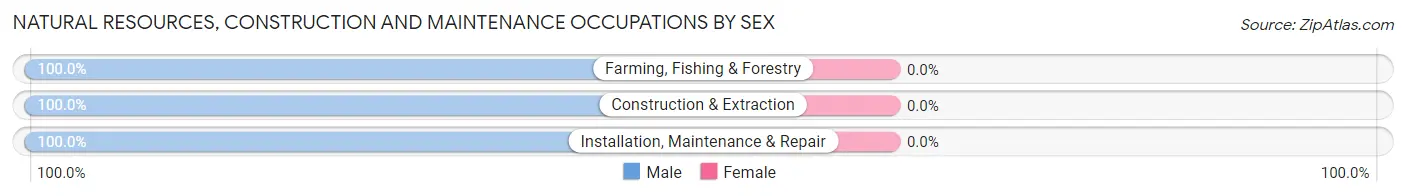
| Occupation | Male | Female |
| Farming, Fishing & Forestry | 14 (100.0%) | 0 (0.0%) |
| Construction & Extraction | 323 (100.0%) | 0 (0.0%) |
| Installation, Maintenance & Repair | 107 (100.0%) | 0 (0.0%) |
| Total (Category) | 444 (100.0%) | 0 (0.0%) |
| Total (Overall) | 2,569 (54.7%) | 2,123 (45.3%) |
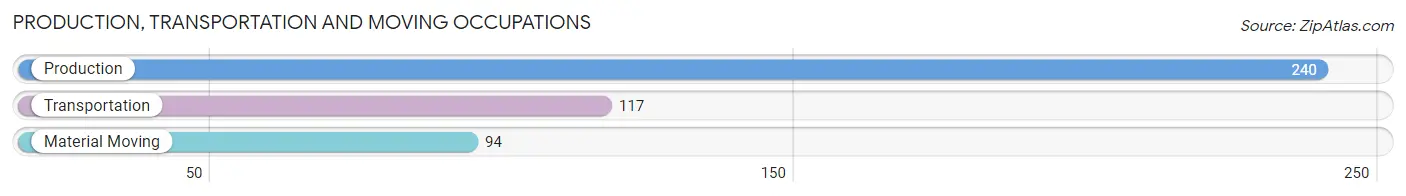
Production, Transportation and Moving Occupations
The most common Production, Transportation and Moving occupations in Valley Center are Production (240 | 5.1%), Transportation (117 | 2.5%), and Material Moving (94 | 2.0%).
Production, Transportation and Moving Occupations by Sex
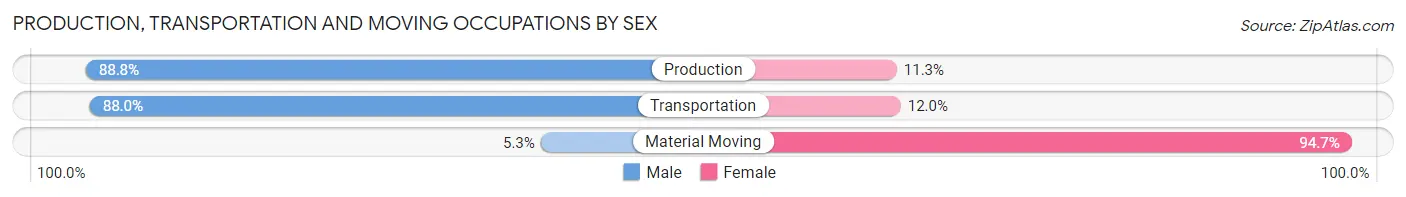
| Occupation | Male | Female |
| Production | 213 (88.7%) | 27 (11.3%) |
| Transportation | 103 (88.0%) | 14 (12.0%) |
| Material Moving | 5 (5.3%) | 89 (94.7%) |
| Total (Category) | 321 (71.2%) | 130 (28.8%) |
| Total (Overall) | 2,569 (54.7%) | 2,123 (45.3%) |
Employment Industries by Sex in Valley Center
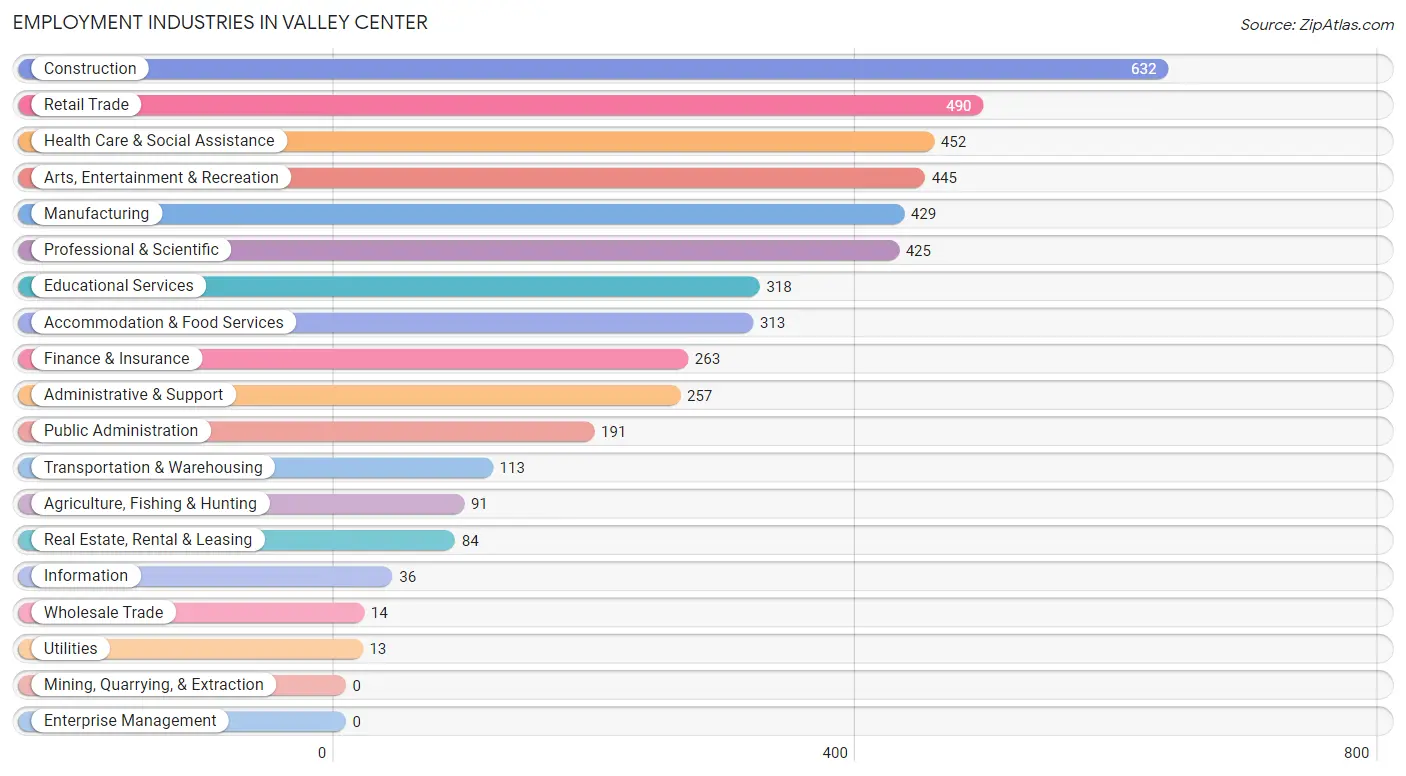
Employment Industries in Valley Center
The major employment industries in Valley Center include Construction (632 | 13.5%), Retail Trade (490 | 10.4%), Health Care & Social Assistance (452 | 9.6%), Arts, Entertainment & Recreation (445 | 9.5%), and Manufacturing (429 | 9.1%).
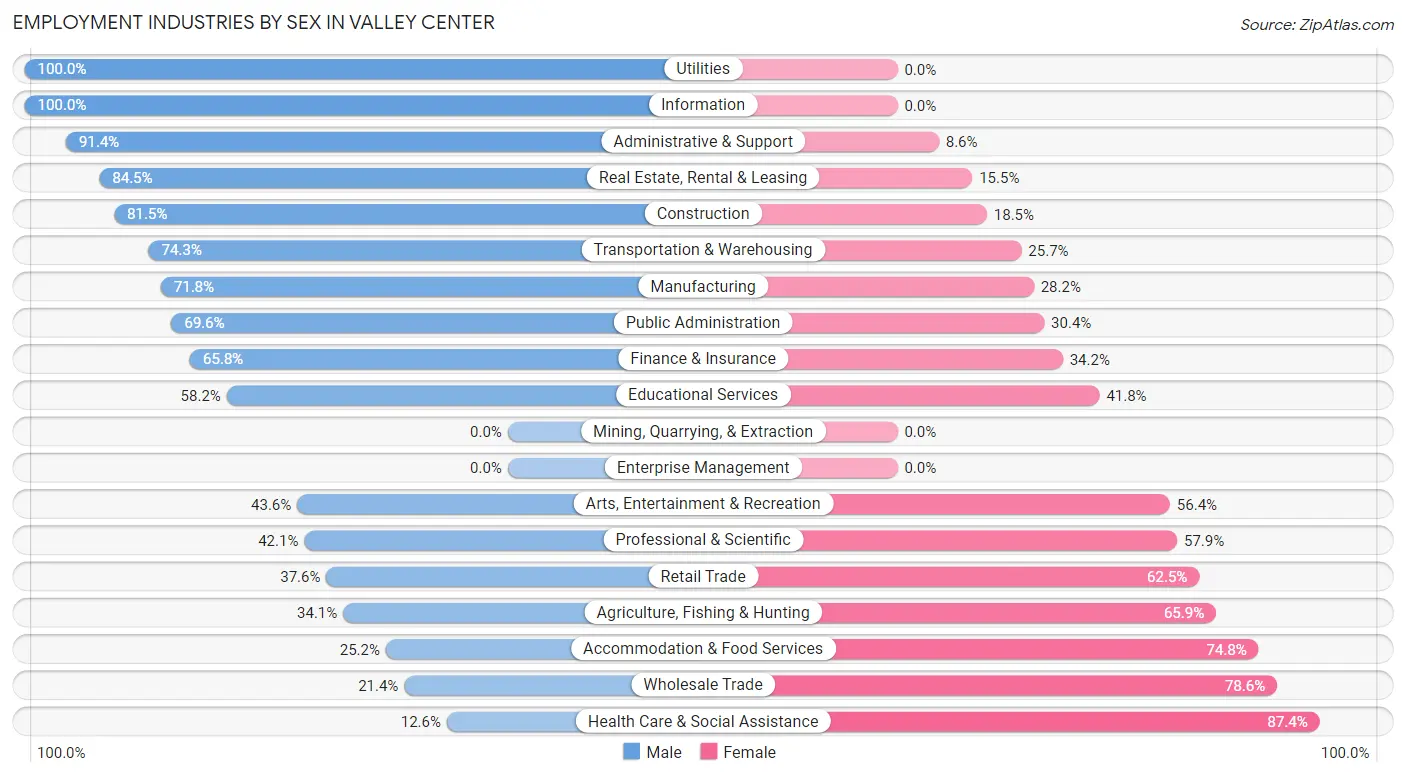
Employment Industries by Sex in Valley Center
The Valley Center industries that see more men than women are Utilities (100.0%), Information (100.0%), and Administrative & Support (91.4%), whereas the industries that tend to have a higher number of women are Health Care & Social Assistance (87.4%), Wholesale Trade (78.6%), and Accommodation & Food Services (74.8%).
| Industry | Male | Female |
| Agriculture, Fishing & Hunting | 31 (34.1%) | 60 (65.9%) |
| Mining, Quarrying, & Extraction | 0 (0.0%) | 0 (0.0%) |
| Construction | 515 (81.5%) | 117 (18.5%) |
| Manufacturing | 308 (71.8%) | 121 (28.2%) |
| Wholesale Trade | 3 (21.4%) | 11 (78.6%) |
| Retail Trade | 184 (37.6%) | 306 (62.5%) |
| Transportation & Warehousing | 84 (74.3%) | 29 (25.7%) |
| Utilities | 13 (100.0%) | 0 (0.0%) |
| Information | 36 (100.0%) | 0 (0.0%) |
| Finance & Insurance | 173 (65.8%) | 90 (34.2%) |
| Real Estate, Rental & Leasing | 71 (84.5%) | 13 (15.5%) |
| Professional & Scientific | 179 (42.1%) | 246 (57.9%) |
| Enterprise Management | 0 (0.0%) | 0 (0.0%) |
| Administrative & Support | 235 (91.4%) | 22 (8.6%) |
| Educational Services | 185 (58.2%) | 133 (41.8%) |
| Health Care & Social Assistance | 57 (12.6%) | 395 (87.4%) |
| Arts, Entertainment & Recreation | 194 (43.6%) | 251 (56.4%) |
| Accommodation & Food Services | 79 (25.2%) | 234 (74.8%) |
| Public Administration | 133 (69.6%) | 58 (30.4%) |
| Total | 2,569 (54.7%) | 2,123 (45.3%) |
Education in Valley Center
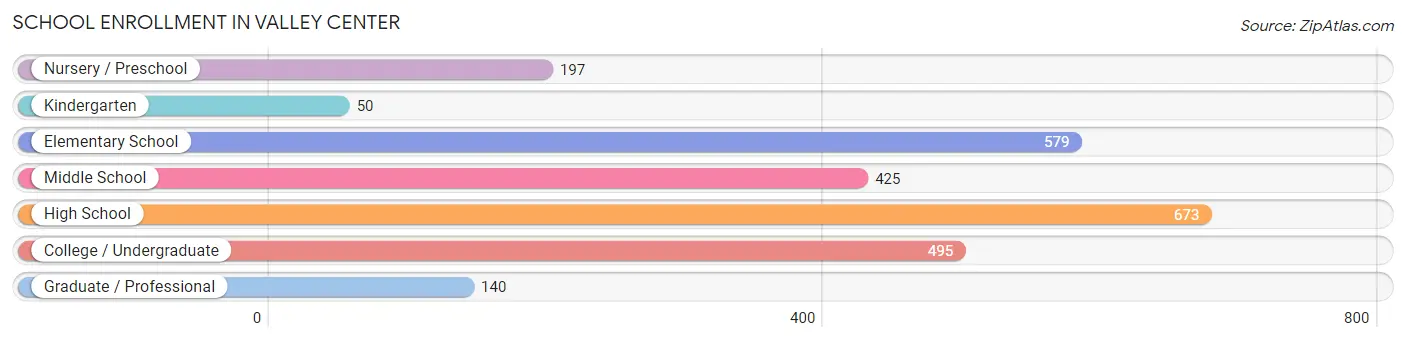
School Enrollment in Valley Center
The most common levels of schooling among the 2,559 students in Valley Center are high school (673 | 26.3%), elementary school (579 | 22.6%), and college / undergraduate (495 | 19.3%).
| School Level | # Students | % Students |
| Nursery / Preschool | 197 | 7.7% |
| Kindergarten | 50 | 1.9% |
| Elementary School | 579 | 22.6% |
| Middle School | 425 | 16.6% |
| High School | 673 | 26.3% |
| College / Undergraduate | 495 | 19.3% |
| Graduate / Professional | 140 | 5.5% |
| Total | 2,559 | 100.0% |
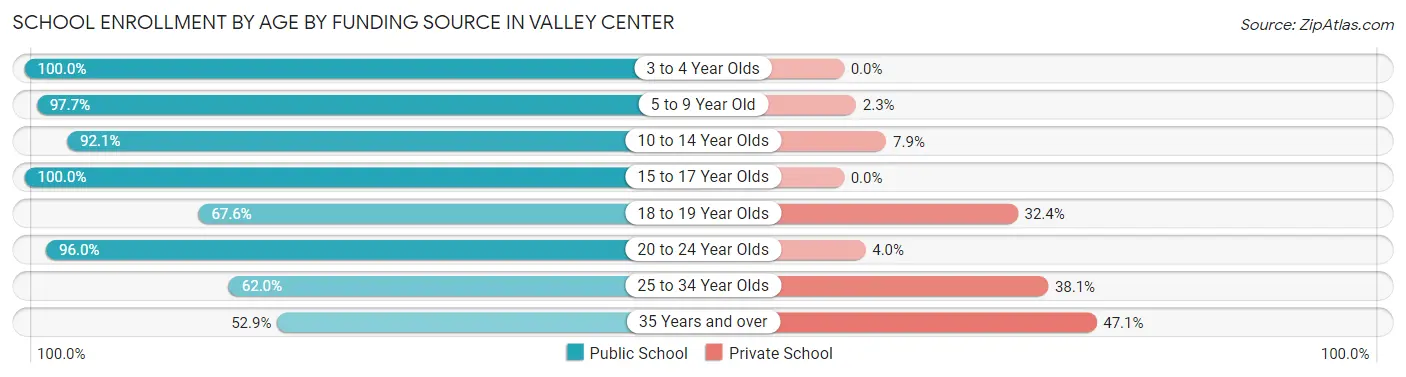
School Enrollment by Age by Funding Source in Valley Center
Out of a total of 2,559 students who are enrolled in schools in Valley Center, 261 (10.2%) attend a private institution, while the remaining 2,298 (89.8%) are enrolled in public schools. The age group of 35 years and over has the highest likelihood of being enrolled in private schools, with 48 (47.1% in the age bracket) enrolled. Conversely, the age group of 3 to 4 year olds has the lowest likelihood of being enrolled in a private school, with 175 (100.0% in the age bracket) attending a public institution.
| Age Bracket | Public School | Private School |
| 3 to 4 Year Olds | 175 (100.0%) | 0 (0.0%) |
| 5 to 9 Year Old | 559 (97.7%) | 13 (2.3%) |
| 10 to 14 Year Olds | 640 (92.1%) | 55 (7.9%) |
| 15 to 17 Year Olds | 394 (100.0%) | 0 (0.0%) |
| 18 to 19 Year Olds | 192 (67.6%) | 92 (32.4%) |
| 20 to 24 Year Olds | 215 (96.0%) | 9 (4.0%) |
| 25 to 34 Year Olds | 70 (62.0%) | 43 (38.1%) |
| 35 Years and over | 54 (52.9%) | 48 (47.1%) |
| Total | 2,298 (89.8%) | 261 (10.2%) |
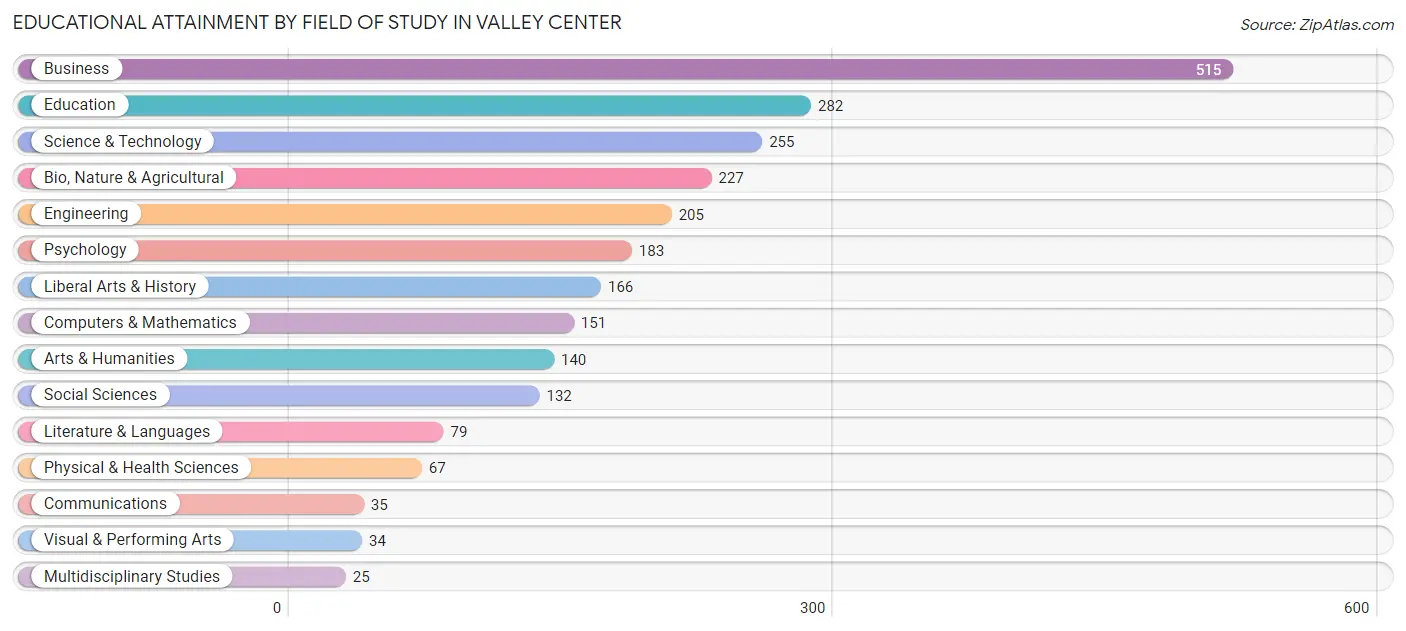
Educational Attainment by Field of Study in Valley Center
Business (515 | 20.6%), education (282 | 11.3%), science & technology (255 | 10.2%), bio, nature & agricultural (227 | 9.1%), and engineering (205 | 8.2%) are the most common fields of study among 2,496 individuals in Valley Center who have obtained a bachelor's degree or higher.
| Field of Study | # Graduates | % Graduates |
| Computers & Mathematics | 151 | 6.0% |
| Bio, Nature & Agricultural | 227 | 9.1% |
| Physical & Health Sciences | 67 | 2.7% |
| Psychology | 183 | 7.3% |
| Social Sciences | 132 | 5.3% |
| Engineering | 205 | 8.2% |
| Multidisciplinary Studies | 25 | 1.0% |
| Science & Technology | 255 | 10.2% |
| Business | 515 | 20.6% |
| Education | 282 | 11.3% |
| Literature & Languages | 79 | 3.2% |
| Liberal Arts & History | 166 | 6.7% |
| Visual & Performing Arts | 34 | 1.4% |
| Communications | 35 | 1.4% |
| Arts & Humanities | 140 | 5.6% |
| Total | 2,496 | 100.0% |
Transportation & Commute in Valley Center
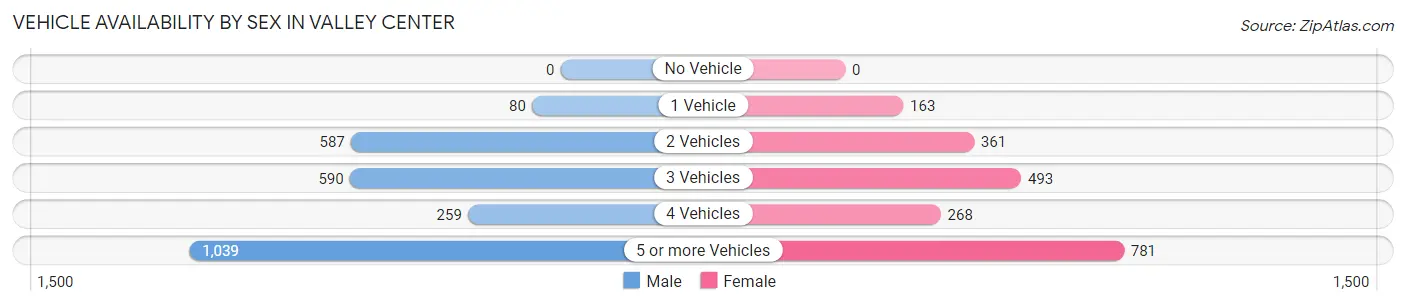
Vehicle Availability by Sex in Valley Center
The most prevalent vehicle ownership categories in Valley Center are males with 5 or more vehicles (1,039, accounting for 40.7%) and females with 5 or more vehicles (781, making up 50.3%).
| Vehicles Available | Male | Female |
| No Vehicle | 0 (0.0%) | 0 (0.0%) |
| 1 Vehicle | 80 (3.1%) | 163 (7.9%) |
| 2 Vehicles | 587 (23.0%) | 361 (17.5%) |
| 3 Vehicles | 590 (23.1%) | 493 (23.9%) |
| 4 Vehicles | 259 (10.1%) | 268 (13.0%) |
| 5 or more Vehicles | 1,039 (40.7%) | 781 (37.8%) |
| Total | 2,555 (100.0%) | 2,066 (100.0%) |
Commute Time in Valley Center
The most frequently occuring commute durations in Valley Center are 30 to 34 minutes (1,036 commuters, 26.1%), 45 to 59 minutes (889 commuters, 22.4%), and 15 to 19 minutes (373 commuters, 9.4%).
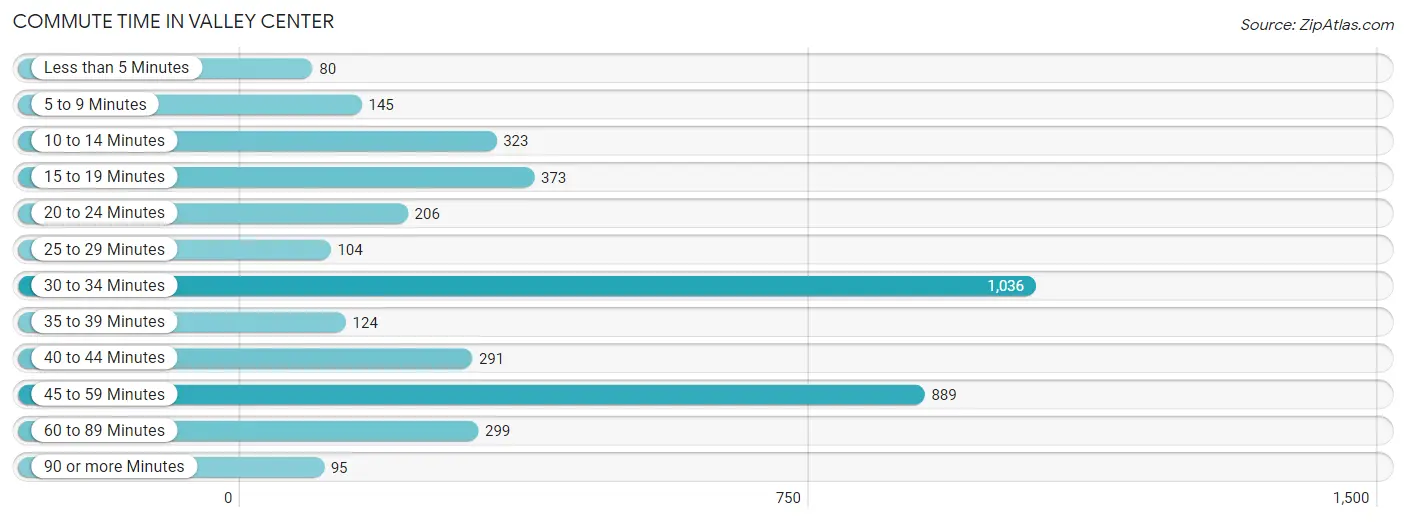
| Commute Time | # Commuters | % Commuters |
| Less than 5 Minutes | 80 | 2.0% |
| 5 to 9 Minutes | 145 | 3.7% |
| 10 to 14 Minutes | 323 | 8.2% |
| 15 to 19 Minutes | 373 | 9.4% |
| 20 to 24 Minutes | 206 | 5.2% |
| 25 to 29 Minutes | 104 | 2.6% |
| 30 to 34 Minutes | 1,036 | 26.1% |
| 35 to 39 Minutes | 124 | 3.1% |
| 40 to 44 Minutes | 291 | 7.3% |
| 45 to 59 Minutes | 889 | 22.4% |
| 60 to 89 Minutes | 299 | 7.5% |
| 90 or more Minutes | 95 | 2.4% |
Commute Time by Sex in Valley Center
The most common commute times in Valley Center are 45 to 59 minutes (632 commuters, 27.7%) for males and 30 to 34 minutes (437 commuters, 26.0%) for females.
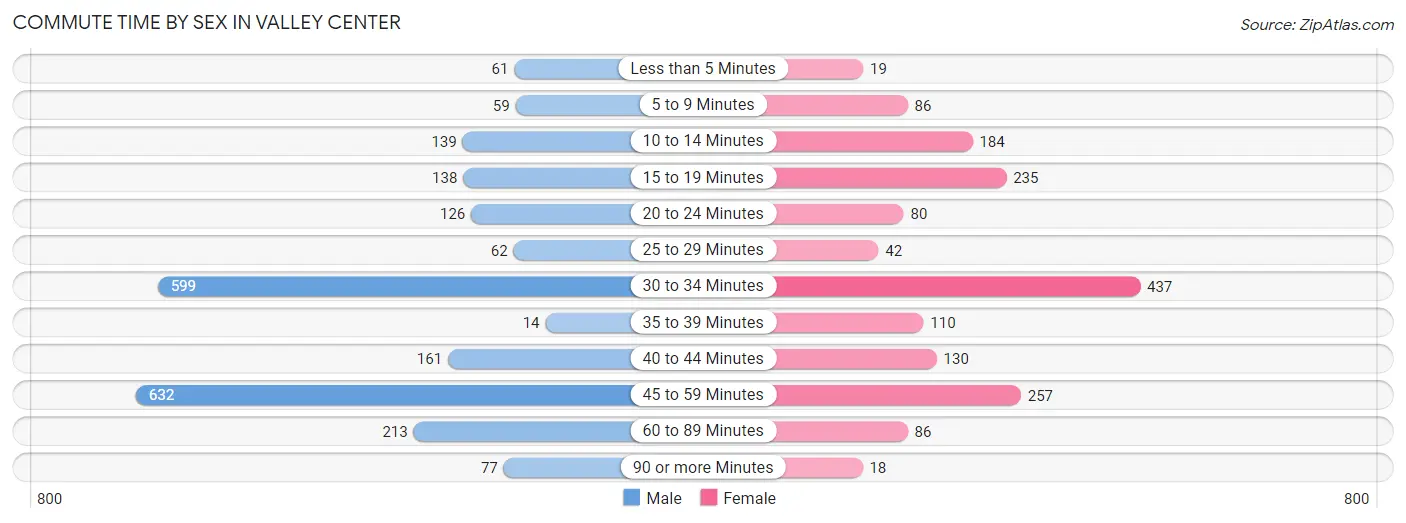
| Commute Time | Male | Female |
| Less than 5 Minutes | 61 (2.7%) | 19 (1.1%) |
| 5 to 9 Minutes | 59 (2.6%) | 86 (5.1%) |
| 10 to 14 Minutes | 139 (6.1%) | 184 (10.9%) |
| 15 to 19 Minutes | 138 (6.0%) | 235 (14.0%) |
| 20 to 24 Minutes | 126 (5.5%) | 80 (4.8%) |
| 25 to 29 Minutes | 62 (2.7%) | 42 (2.5%) |
| 30 to 34 Minutes | 599 (26.3%) | 437 (26.0%) |
| 35 to 39 Minutes | 14 (0.6%) | 110 (6.5%) |
| 40 to 44 Minutes | 161 (7.1%) | 130 (7.7%) |
| 45 to 59 Minutes | 632 (27.7%) | 257 (15.3%) |
| 60 to 89 Minutes | 213 (9.3%) | 86 (5.1%) |
| 90 or more Minutes | 77 (3.4%) | 18 (1.1%) |
Time of Departure to Work by Sex in Valley Center
The most frequent times of departure to work in Valley Center are 7:00 AM to 7:29 AM (434, 19.0%) for males and 5:30 AM to 5:59 AM (245, 14.5%) for females.
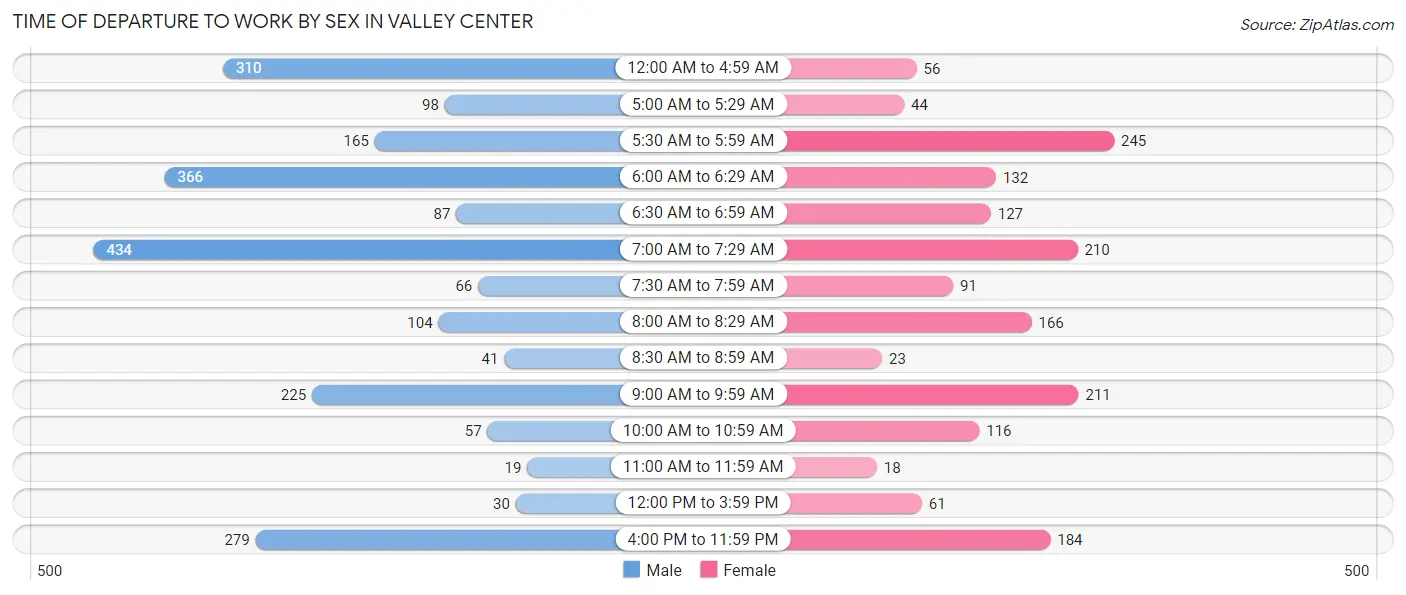
| Time of Departure | Male | Female |
| 12:00 AM to 4:59 AM | 310 (13.6%) | 56 (3.3%) |
| 5:00 AM to 5:29 AM | 98 (4.3%) | 44 (2.6%) |
| 5:30 AM to 5:59 AM | 165 (7.2%) | 245 (14.5%) |
| 6:00 AM to 6:29 AM | 366 (16.1%) | 132 (7.8%) |
| 6:30 AM to 6:59 AM | 87 (3.8%) | 127 (7.5%) |
| 7:00 AM to 7:29 AM | 434 (19.0%) | 210 (12.5%) |
| 7:30 AM to 7:59 AM | 66 (2.9%) | 91 (5.4%) |
| 8:00 AM to 8:29 AM | 104 (4.6%) | 166 (9.9%) |
| 8:30 AM to 8:59 AM | 41 (1.8%) | 23 (1.4%) |
| 9:00 AM to 9:59 AM | 225 (9.9%) | 211 (12.5%) |
| 10:00 AM to 10:59 AM | 57 (2.5%) | 116 (6.9%) |
| 11:00 AM to 11:59 AM | 19 (0.8%) | 18 (1.1%) |
| 12:00 PM to 3:59 PM | 30 (1.3%) | 61 (3.6%) |
| 4:00 PM to 11:59 PM | 279 (12.2%) | 184 (10.9%) |
| Total | 2,281 (100.0%) | 1,684 (100.0%) |
Housing Occupancy in Valley Center
Occupancy by Ownership in Valley Center
Of the total 3,121 dwellings in Valley Center, owner-occupied units account for 2,655 (85.1%), while renter-occupied units make up 466 (14.9%).
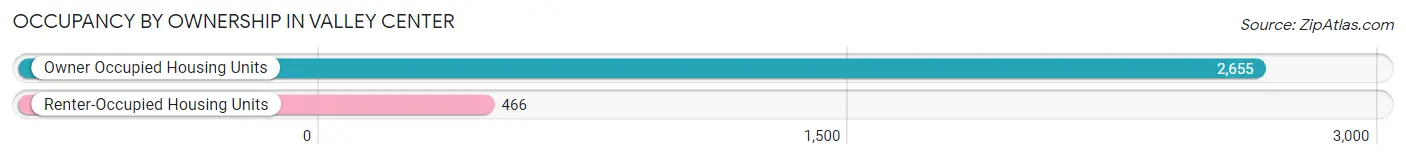
| Occupancy | # Housing Units | % Housing Units |
| Owner Occupied Housing Units | 2,655 | 85.1% |
| Renter-Occupied Housing Units | 466 | 14.9% |
| Total Occupied Housing Units | 3,121 | 100.0% |
Occupancy by Household Size in Valley Center
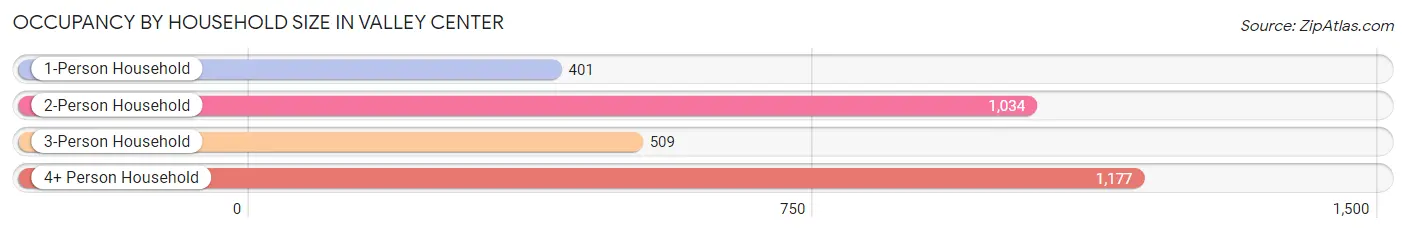
| Household Size | # Housing Units | % Housing Units |
| 1-Person Household | 401 | 12.9% |
| 2-Person Household | 1,034 | 33.1% |
| 3-Person Household | 509 | 16.3% |
| 4+ Person Household | 1,177 | 37.7% |
| Total Housing Units | 3,121 | 100.0% |
Occupancy by Ownership by Household Size in Valley Center
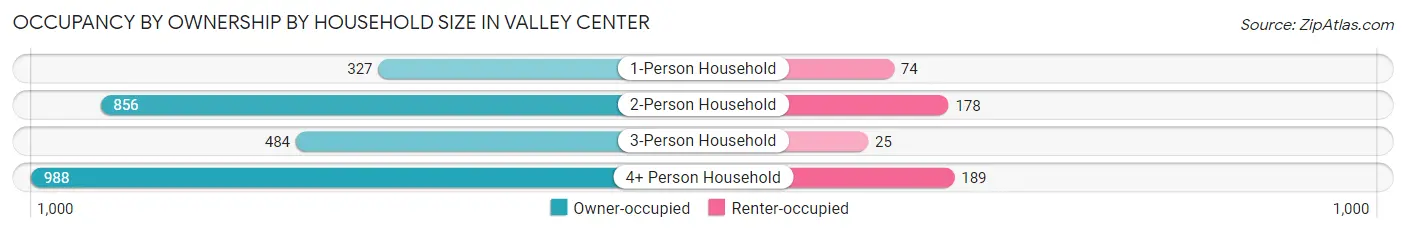
| Household Size | Owner-occupied | Renter-occupied |
| 1-Person Household | 327 (81.6%) | 74 (18.4%) |
| 2-Person Household | 856 (82.8%) | 178 (17.2%) |
| 3-Person Household | 484 (95.1%) | 25 (4.9%) |
| 4+ Person Household | 988 (83.9%) | 189 (16.1%) |
| Total Housing Units | 2,655 (85.1%) | 466 (14.9%) |
Occupancy by Educational Attainment in Valley Center
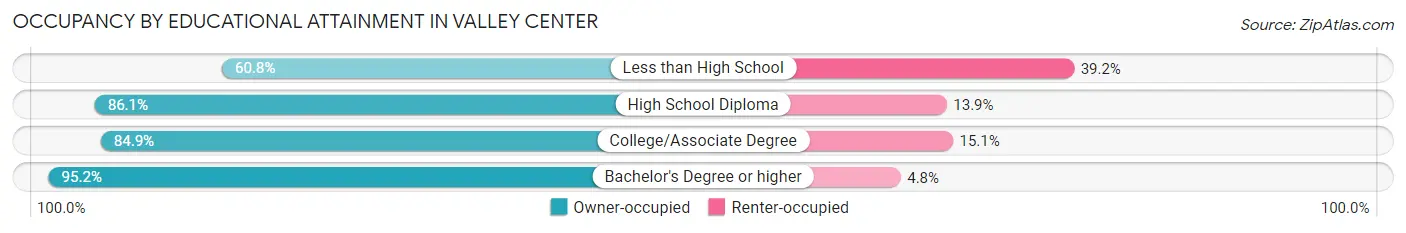
| Household Size | Owner-occupied | Renter-occupied |
| Less than High School | 275 (60.8%) | 177 (39.2%) |
| High School Diploma | 334 (86.1%) | 54 (13.9%) |
| College/Associate Degree | 1,031 (84.9%) | 184 (15.1%) |
| Bachelor's Degree or higher | 1,015 (95.2%) | 51 (4.8%) |
Occupancy by Age of Householder in Valley Center
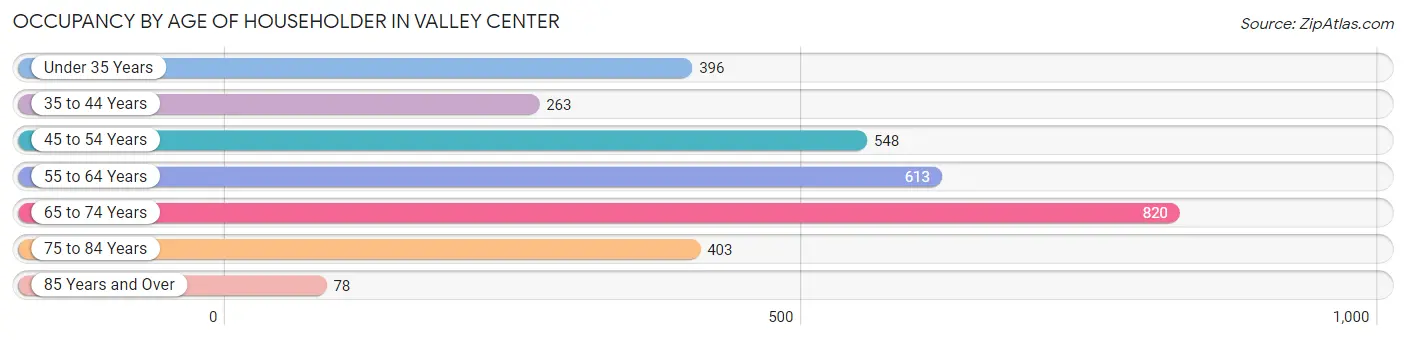
| Age Bracket | # Households | % Households |
| Under 35 Years | 396 | 12.7% |
| 35 to 44 Years | 263 | 8.4% |
| 45 to 54 Years | 548 | 17.6% |
| 55 to 64 Years | 613 | 19.6% |
| 65 to 74 Years | 820 | 26.3% |
| 75 to 84 Years | 403 | 12.9% |
| 85 Years and Over | 78 | 2.5% |
| Total | 3,121 | 100.0% |
Housing Finances in Valley Center
Median Income by Occupancy in Valley Center
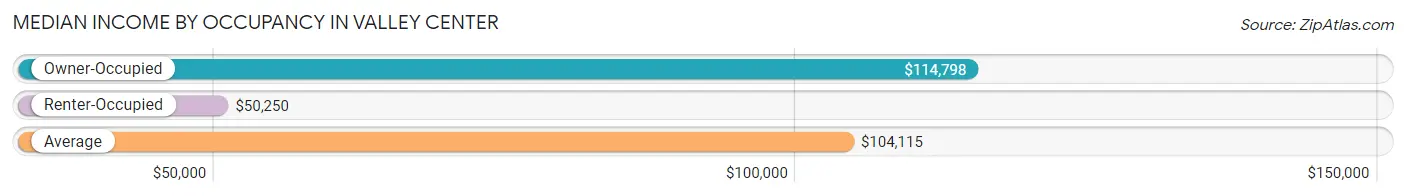
| Occupancy Type | # Households | Median Income |
| Owner-Occupied | 2,655 (85.1%) | $114,798 |
| Renter-Occupied | 466 (14.9%) | $50,250 |
| Average | 3,121 (100.0%) | $104,115 |
Occupancy by Householder Income Bracket in Valley Center
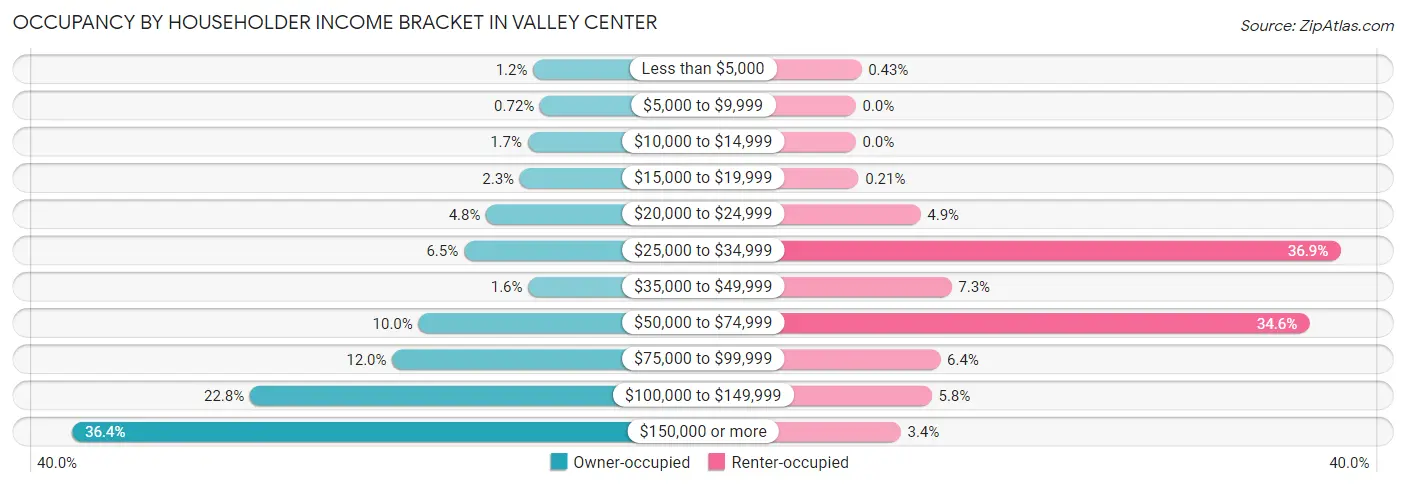
| Income Bracket | Owner-occupied | Renter-occupied |
| Less than $5,000 | 33 (1.2%) | 2 (0.4%) |
| $5,000 to $9,999 | 19 (0.7%) | 0 (0.0%) |
| $10,000 to $14,999 | 44 (1.7%) | 0 (0.0%) |
| $15,000 to $19,999 | 60 (2.3%) | 1 (0.2%) |
| $20,000 to $24,999 | 128 (4.8%) | 23 (4.9%) |
| $25,000 to $34,999 | 173 (6.5%) | 172 (36.9%) |
| $35,000 to $49,999 | 43 (1.6%) | 34 (7.3%) |
| $50,000 to $74,999 | 265 (10.0%) | 161 (34.5%) |
| $75,000 to $99,999 | 318 (12.0%) | 30 (6.4%) |
| $100,000 to $149,999 | 606 (22.8%) | 27 (5.8%) |
| $150,000 or more | 966 (36.4%) | 16 (3.4%) |
| Total | 2,655 (100.0%) | 466 (100.0%) |
Monthly Housing Cost Tiers in Valley Center
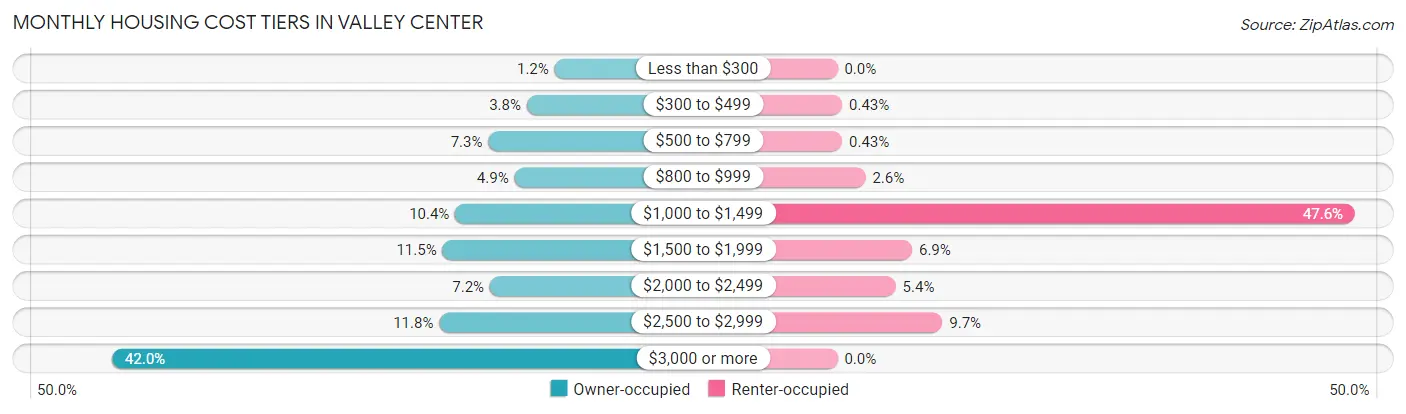
| Monthly Cost | Owner-occupied | Renter-occupied |
| Less than $300 | 32 (1.2%) | 0 (0.0%) |
| $300 to $499 | 100 (3.8%) | 2 (0.4%) |
| $500 to $799 | 194 (7.3%) | 2 (0.4%) |
| $800 to $999 | 130 (4.9%) | 12 (2.6%) |
| $1,000 to $1,499 | 275 (10.4%) | 222 (47.6%) |
| $1,500 to $1,999 | 306 (11.5%) | 32 (6.9%) |
| $2,000 to $2,499 | 190 (7.2%) | 25 (5.4%) |
| $2,500 to $2,999 | 314 (11.8%) | 45 (9.7%) |
| $3,000 or more | 1,114 (42.0%) | 0 (0.0%) |
| Total | 2,655 (100.0%) | 466 (100.0%) |
Physical Housing Characteristics in Valley Center
Housing Structures in Valley Center
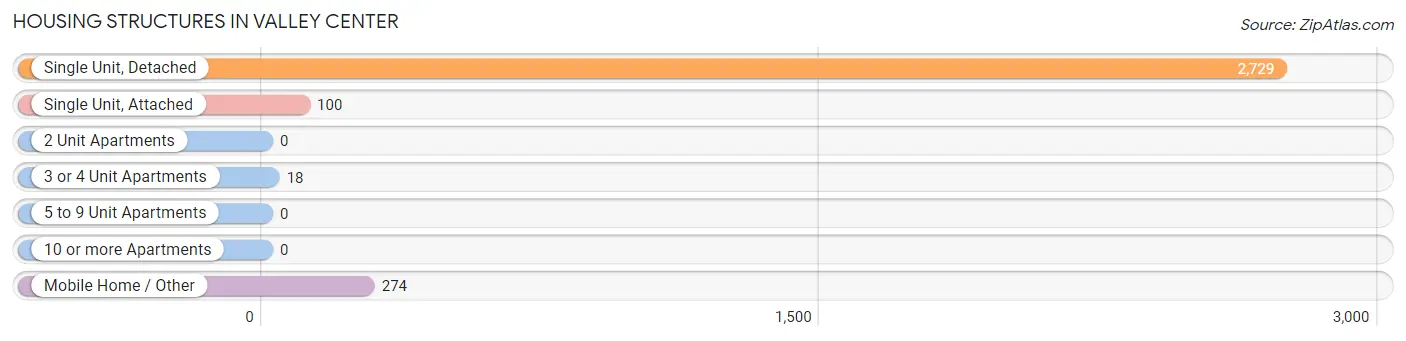
| Structure Type | # Housing Units | % Housing Units |
| Single Unit, Detached | 2,729 | 87.4% |
| Single Unit, Attached | 100 | 3.2% |
| 2 Unit Apartments | 0 | 0.0% |
| 3 or 4 Unit Apartments | 18 | 0.6% |
| 5 to 9 Unit Apartments | 0 | 0.0% |
| 10 or more Apartments | 0 | 0.0% |
| Mobile Home / Other | 274 | 8.8% |
| Total | 3,121 | 100.0% |
Housing Structures by Occupancy in Valley Center
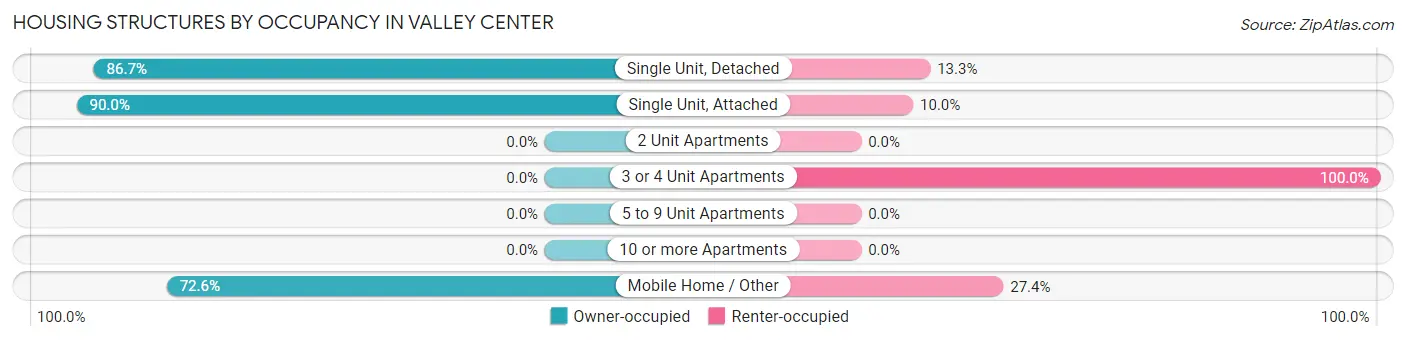
| Structure Type | Owner-occupied | Renter-occupied |
| Single Unit, Detached | 2,366 (86.7%) | 363 (13.3%) |
| Single Unit, Attached | 90 (90.0%) | 10 (10.0%) |
| 2 Unit Apartments | 0 (0.0%) | 0 (0.0%) |
| 3 or 4 Unit Apartments | 0 (0.0%) | 18 (100.0%) |
| 5 to 9 Unit Apartments | 0 (0.0%) | 0 (0.0%) |
| 10 or more Apartments | 0 (0.0%) | 0 (0.0%) |
| Mobile Home / Other | 199 (72.6%) | 75 (27.4%) |
| Total | 2,655 (85.1%) | 466 (14.9%) |
Housing Structures by Number of Rooms in Valley Center
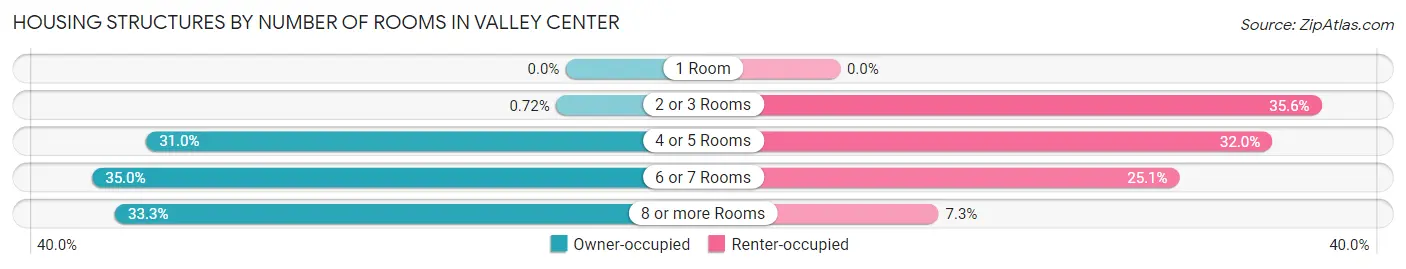
| Number of Rooms | Owner-occupied | Renter-occupied |
| 1 Room | 0 (0.0%) | 0 (0.0%) |
| 2 or 3 Rooms | 19 (0.7%) | 166 (35.6%) |
| 4 or 5 Rooms | 823 (31.0%) | 149 (32.0%) |
| 6 or 7 Rooms | 929 (35.0%) | 117 (25.1%) |
| 8 or more Rooms | 884 (33.3%) | 34 (7.3%) |
| Total | 2,655 (100.0%) | 466 (100.0%) |
Housing Structure by Heating Type in Valley Center
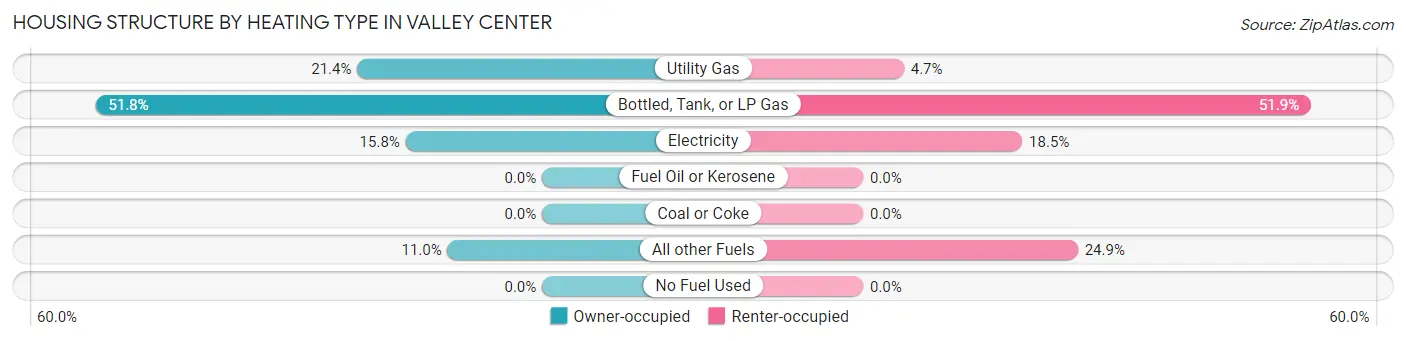
| Heating Type | Owner-occupied | Renter-occupied |
| Utility Gas | 569 (21.4%) | 22 (4.7%) |
| Bottled, Tank, or LP Gas | 1,375 (51.8%) | 242 (51.9%) |
| Electricity | 420 (15.8%) | 86 (18.4%) |
| Fuel Oil or Kerosene | 0 (0.0%) | 0 (0.0%) |
| Coal or Coke | 0 (0.0%) | 0 (0.0%) |
| All other Fuels | 291 (11.0%) | 116 (24.9%) |
| No Fuel Used | 0 (0.0%) | 0 (0.0%) |
| Total | 2,655 (100.0%) | 466 (100.0%) |
Household Vehicle Usage in Valley Center
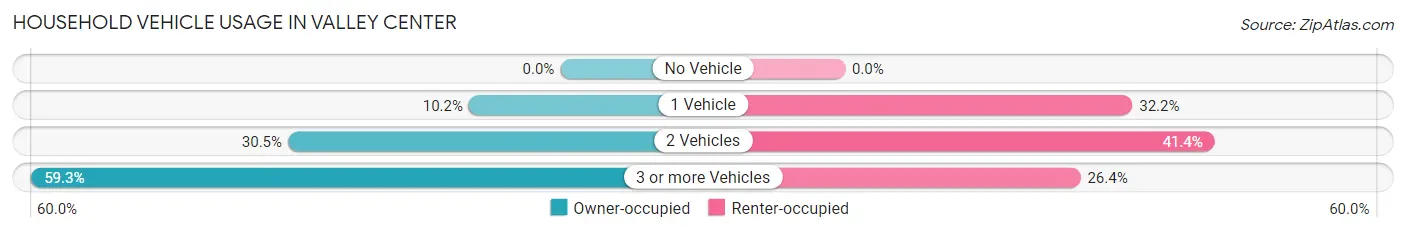
| Vehicles per Household | Owner-occupied | Renter-occupied |
| No Vehicle | 0 (0.0%) | 0 (0.0%) |
| 1 Vehicle | 272 (10.2%) | 150 (32.2%) |
| 2 Vehicles | 810 (30.5%) | 193 (41.4%) |
| 3 or more Vehicles | 1,573 (59.3%) | 123 (26.4%) |
| Total | 2,655 (100.0%) | 466 (100.0%) |
Real Estate & Mortgages in Valley Center
Real Estate and Mortgage Overview in Valley Center
| Characteristic | Without Mortgage | With Mortgage |
| Housing Units | 760 | 1,895 |
| Median Property Value | $637,800 | $797,300 |
| Median Household Income | $85,962 | $743 |
| Monthly Housing Costs | $939 | $1,114 |
| Real Estate Taxes | $3,873 | $107 |
Property Value by Mortgage Status in Valley Center
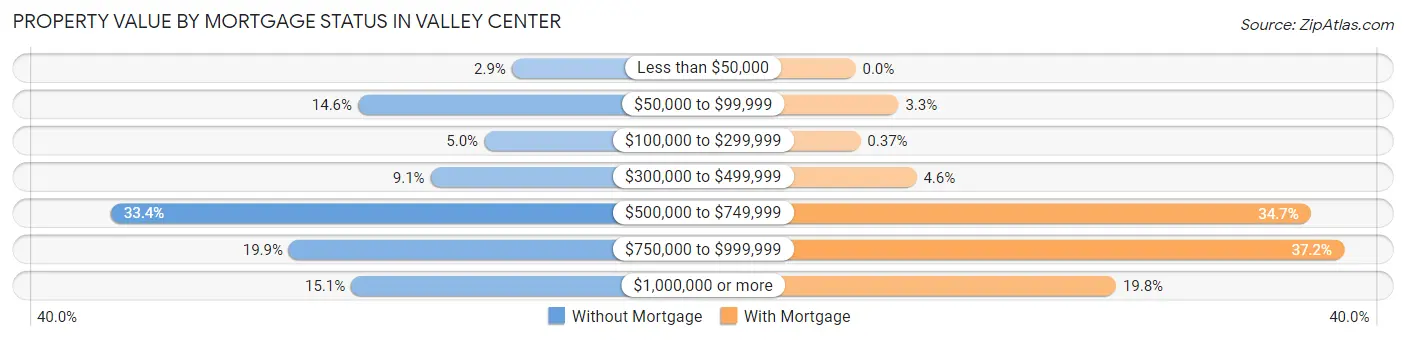
| Property Value | Without Mortgage | With Mortgage |
| Less than $50,000 | 22 (2.9%) | 0 (0.0%) |
| $50,000 to $99,999 | 111 (14.6%) | 62 (3.3%) |
| $100,000 to $299,999 | 38 (5.0%) | 7 (0.4%) |
| $300,000 to $499,999 | 69 (9.1%) | 88 (4.6%) |
| $500,000 to $749,999 | 254 (33.4%) | 657 (34.7%) |
| $750,000 to $999,999 | 151 (19.9%) | 705 (37.2%) |
| $1,000,000 or more | 115 (15.1%) | 376 (19.8%) |
| Total | 760 (100.0%) | 1,895 (100.0%) |
Household Income by Mortgage Status in Valley Center
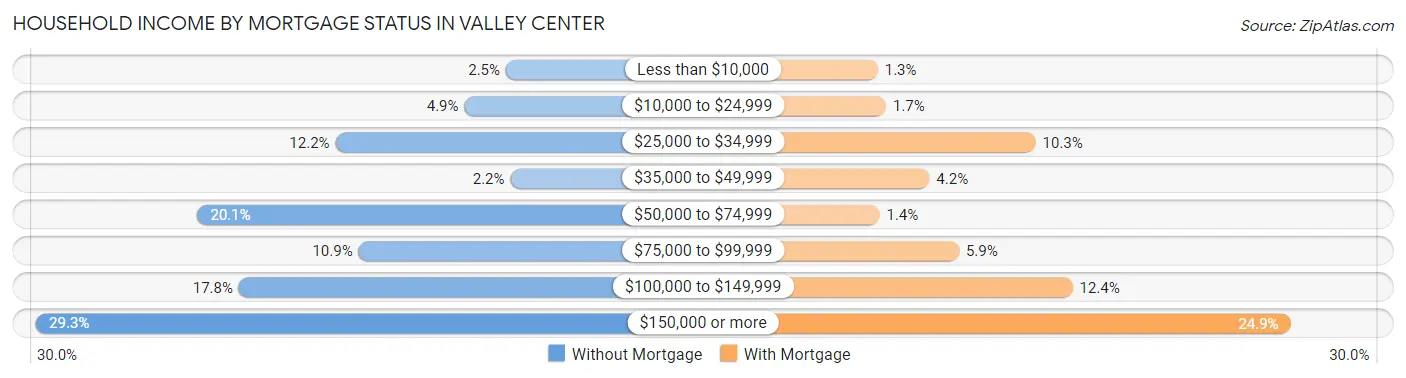
| Household Income | Without Mortgage | With Mortgage |
| Less than $10,000 | 19 (2.5%) | 24 (1.3%) |
| $10,000 to $24,999 | 37 (4.9%) | 33 (1.7%) |
| $25,000 to $34,999 | 93 (12.2%) | 195 (10.3%) |
| $35,000 to $49,999 | 17 (2.2%) | 80 (4.2%) |
| $50,000 to $74,999 | 153 (20.1%) | 26 (1.4%) |
| $75,000 to $99,999 | 83 (10.9%) | 112 (5.9%) |
| $100,000 to $149,999 | 135 (17.8%) | 235 (12.4%) |
| $150,000 or more | 223 (29.3%) | 471 (24.8%) |
| Total | 760 (100.0%) | 1,895 (100.0%) |
Property Value to Household Income Ratio in Valley Center
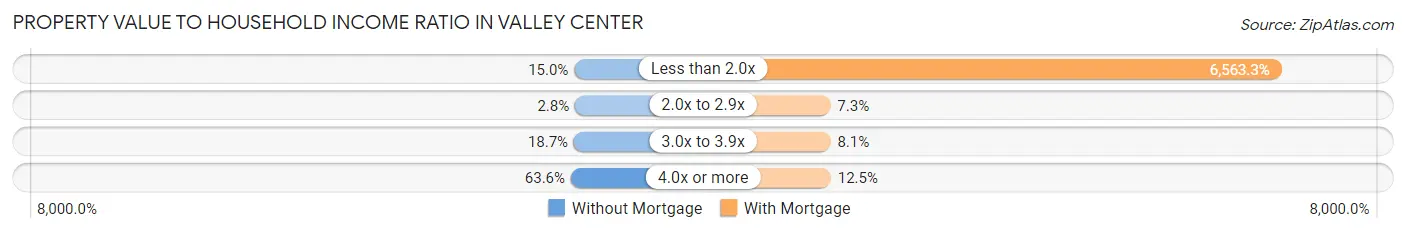
| Value-to-Income Ratio | Without Mortgage | With Mortgage |
| Less than 2.0x | 114 (15.0%) | 124,375 (6,563.3%) |
| 2.0x to 2.9x | 21 (2.8%) | 139 (7.3%) |
| 3.0x to 3.9x | 142 (18.7%) | 153 (8.1%) |
| 4.0x or more | 483 (63.5%) | 237 (12.5%) |
| Total | 760 (100.0%) | 1,895 (100.0%) |
Real Estate Taxes by Mortgage Status in Valley Center
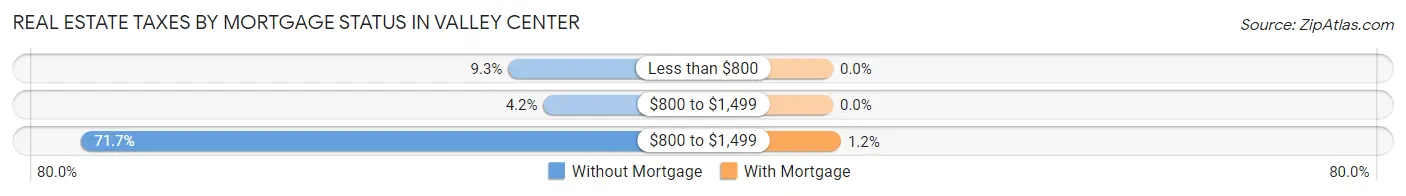
| Property Taxes | Without Mortgage | With Mortgage |
| Less than $800 | 71 (9.3%) | 0 (0.0%) |
| $800 to $1,499 | 32 (4.2%) | 0 (0.0%) |
| $800 to $1,499 | 545 (71.7%) | 22 (1.2%) |
| Total | 760 (100.0%) | 1,895 (100.0%) |
Health & Disability in Valley Center
Health Insurance Coverage by Age in Valley Center
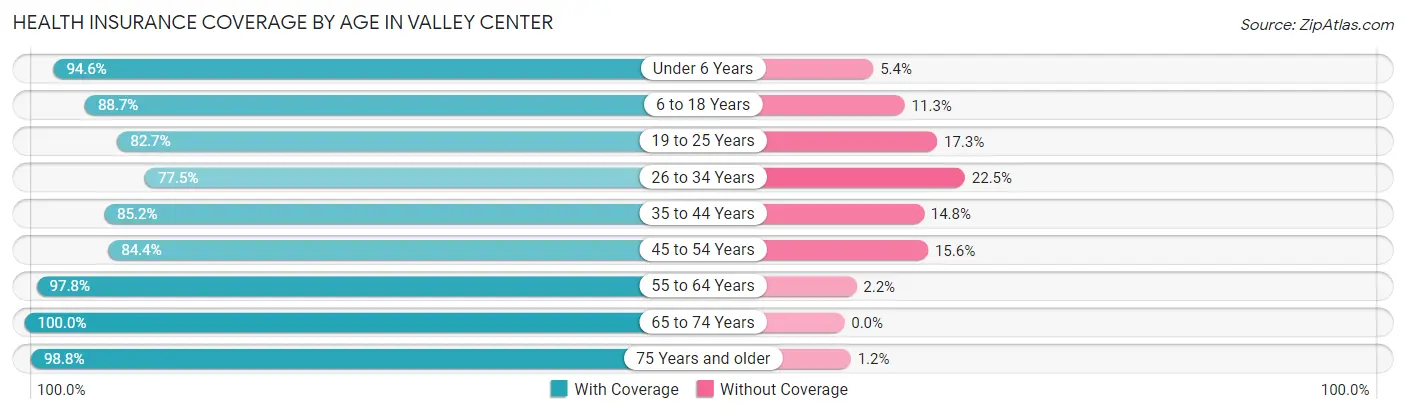
| Age Bracket | With Coverage | Without Coverage |
| Under 6 Years | 948 (94.6%) | 54 (5.4%) |
| 6 to 18 Years | 1,561 (88.7%) | 198 (11.3%) |
| 19 to 25 Years | 866 (82.7%) | 181 (17.3%) |
| 26 to 34 Years | 1,007 (77.5%) | 292 (22.5%) |
| 35 to 44 Years | 845 (85.2%) | 147 (14.8%) |
| 45 to 54 Years | 908 (84.4%) | 168 (15.6%) |
| 55 to 64 Years | 1,311 (97.8%) | 30 (2.2%) |
| 65 to 74 Years | 1,496 (100.0%) | 0 (0.0%) |
| 75 Years and older | 903 (98.8%) | 11 (1.2%) |
| Total | 9,845 (90.1%) | 1,081 (9.9%) |
Health Insurance Coverage by Citizenship Status in Valley Center
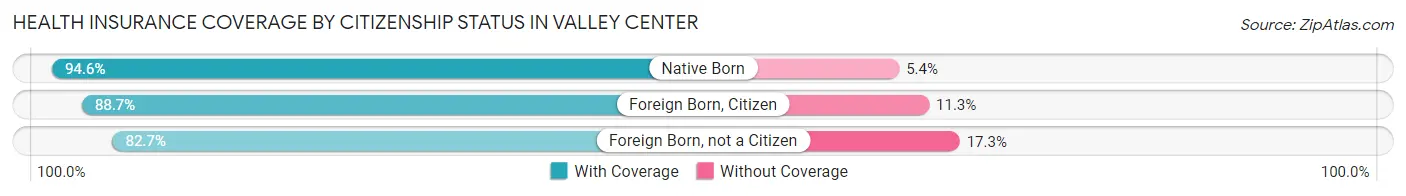
| Citizenship Status | With Coverage | Without Coverage |
| Native Born | 948 (94.6%) | 54 (5.4%) |
| Foreign Born, Citizen | 1,561 (88.7%) | 198 (11.3%) |
| Foreign Born, not a Citizen | 866 (82.7%) | 181 (17.3%) |
Health Insurance Coverage by Household Income in Valley Center
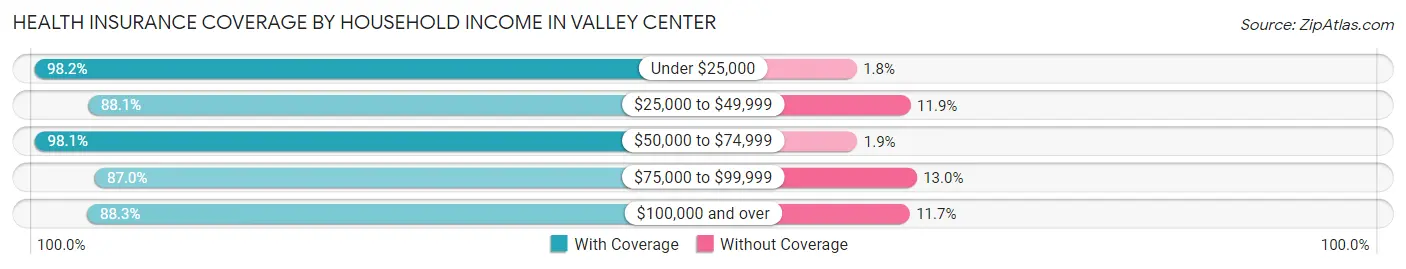
| Household Income | With Coverage | Without Coverage |
| Under $25,000 | 611 (98.2%) | 11 (1.8%) |
| $25,000 to $49,999 | 1,166 (88.1%) | 157 (11.9%) |
| $50,000 to $74,999 | 1,453 (98.1%) | 28 (1.9%) |
| $75,000 to $99,999 | 963 (87.0%) | 144 (13.0%) |
| $100,000 and over | 5,591 (88.3%) | 741 (11.7%) |
Public vs Private Health Insurance Coverage by Age in Valley Center
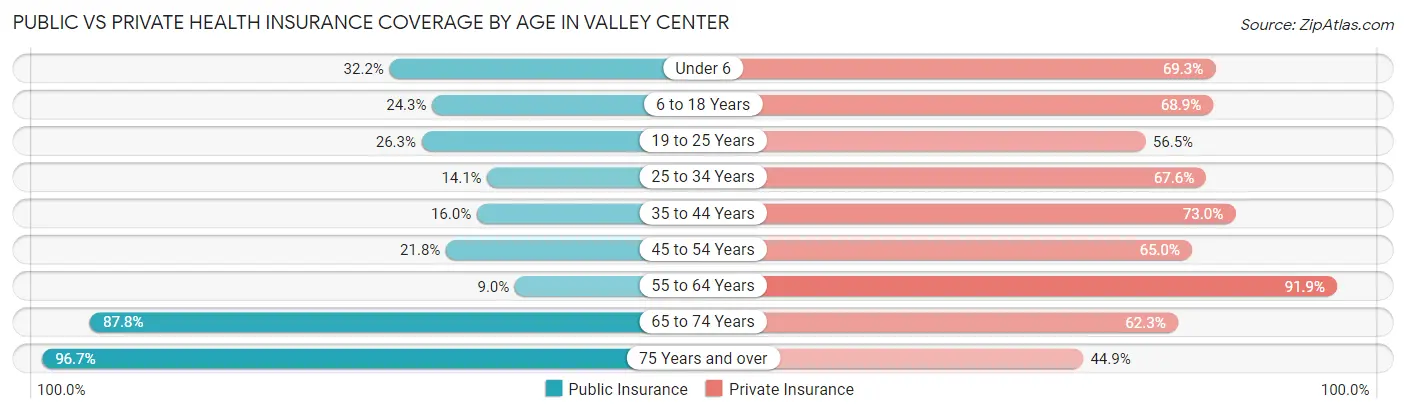
| Age Bracket | Public Insurance | Private Insurance |
| Under 6 | 323 (32.2%) | 694 (69.3%) |
| 6 to 18 Years | 428 (24.3%) | 1,212 (68.9%) |
| 19 to 25 Years | 275 (26.3%) | 591 (56.5%) |
| 25 to 34 Years | 183 (14.1%) | 878 (67.6%) |
| 35 to 44 Years | 159 (16.0%) | 724 (73.0%) |
| 45 to 54 Years | 234 (21.7%) | 699 (65.0%) |
| 55 to 64 Years | 120 (8.9%) | 1,232 (91.9%) |
| 65 to 74 Years | 1,314 (87.8%) | 932 (62.3%) |
| 75 Years and over | 884 (96.7%) | 410 (44.9%) |
| Total | 3,920 (35.9%) | 7,372 (67.5%) |
Disability Status by Sex by Age in Valley Center
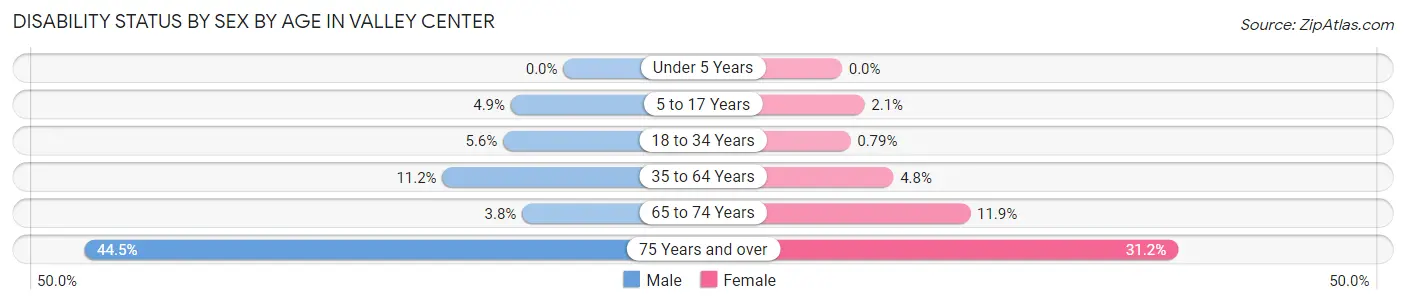
| Age Bracket | Male | Female |
| Under 5 Years | 0 (0.0%) | 0 (0.0%) |
| 5 to 17 Years | 37 (4.9%) | 19 (2.1%) |
| 18 to 34 Years | 69 (5.6%) | 10 (0.8%) |
| 35 to 64 Years | 178 (11.2%) | 87 (4.8%) |
| 65 to 74 Years | 26 (3.8%) | 97 (11.9%) |
| 75 Years and over | 177 (44.5%) | 161 (31.2%) |
Disability Class by Sex by Age in Valley Center
Disability Class: Hearing Difficulty
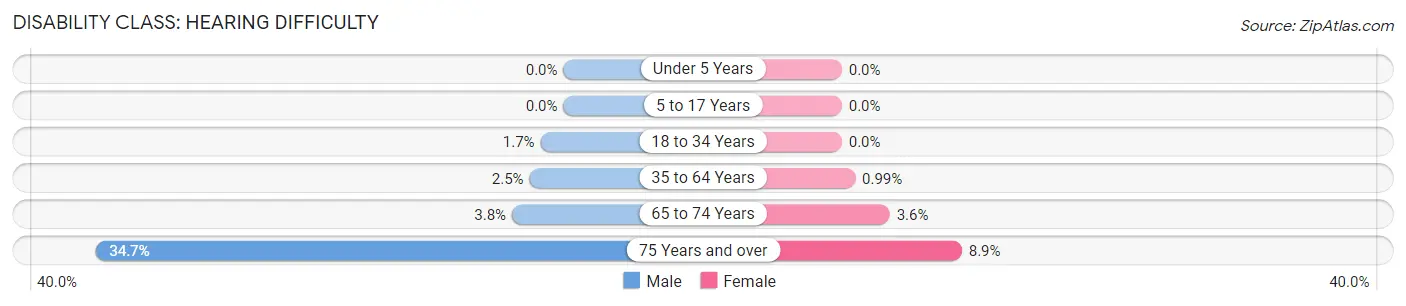
| Age Bracket | Male | Female |
| Under 5 Years | 0 (0.0%) | 0 (0.0%) |
| 5 to 17 Years | 0 (0.0%) | 0 (0.0%) |
| 18 to 34 Years | 21 (1.7%) | 0 (0.0%) |
| 35 to 64 Years | 40 (2.5%) | 18 (1.0%) |
| 65 to 74 Years | 26 (3.8%) | 29 (3.6%) |
| 75 Years and over | 138 (34.7%) | 46 (8.9%) |
Disability Class: Vision Difficulty
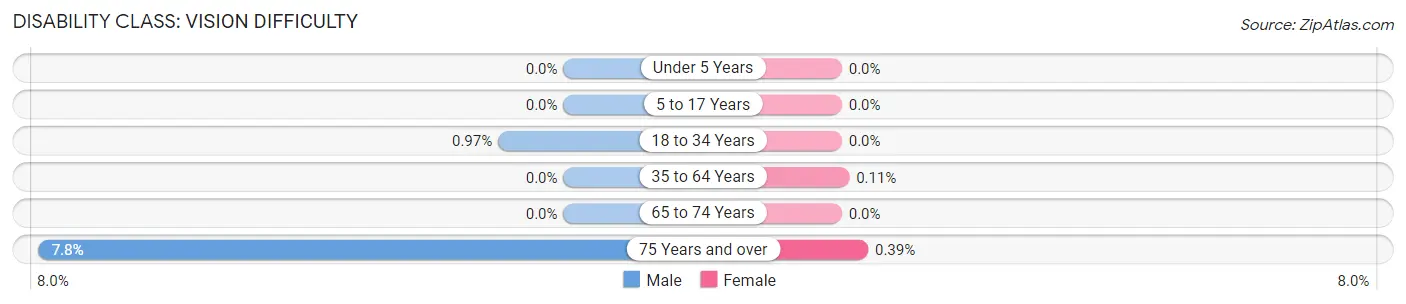
| Age Bracket | Male | Female |
| Under 5 Years | 0 (0.0%) | 0 (0.0%) |
| 5 to 17 Years | 0 (0.0%) | 0 (0.0%) |
| 18 to 34 Years | 12 (1.0%) | 0 (0.0%) |
| 35 to 64 Years | 0 (0.0%) | 2 (0.1%) |
| 65 to 74 Years | 0 (0.0%) | 0 (0.0%) |
| 75 Years and over | 31 (7.8%) | 2 (0.4%) |
Disability Class: Cognitive Difficulty
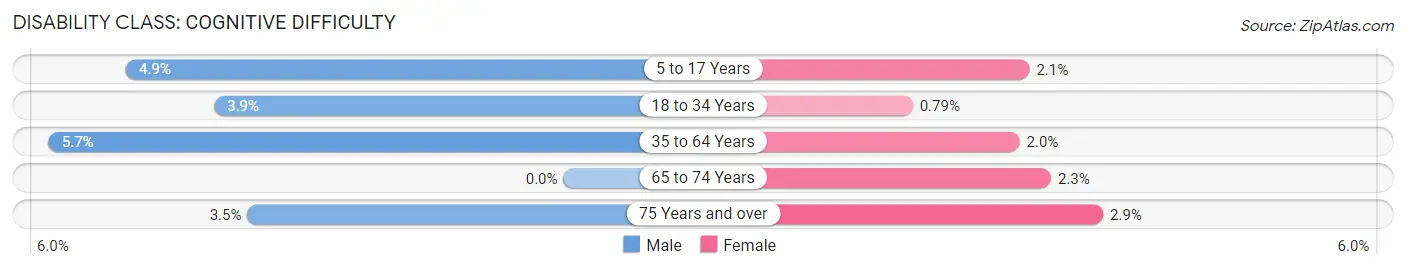
| Age Bracket | Male | Female |
| 5 to 17 Years | 37 (4.9%) | 19 (2.1%) |
| 18 to 34 Years | 48 (3.9%) | 10 (0.8%) |
| 35 to 64 Years | 91 (5.7%) | 36 (2.0%) |
| 65 to 74 Years | 0 (0.0%) | 19 (2.3%) |
| 75 Years and over | 14 (3.5%) | 15 (2.9%) |
Disability Class: Ambulatory Difficulty
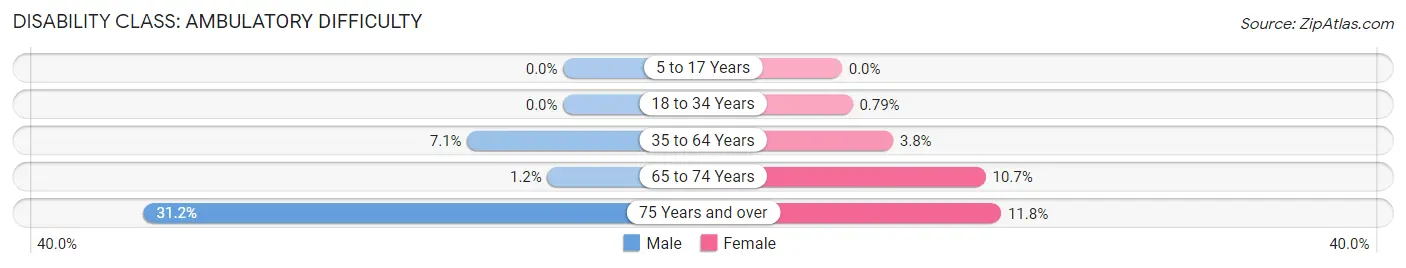
| Age Bracket | Male | Female |
| 5 to 17 Years | 0 (0.0%) | 0 (0.0%) |
| 18 to 34 Years | 0 (0.0%) | 10 (0.8%) |
| 35 to 64 Years | 113 (7.1%) | 69 (3.8%) |
| 65 to 74 Years | 8 (1.2%) | 87 (10.7%) |
| 75 Years and over | 124 (31.2%) | 61 (11.8%) |
Disability Class: Self-Care Difficulty
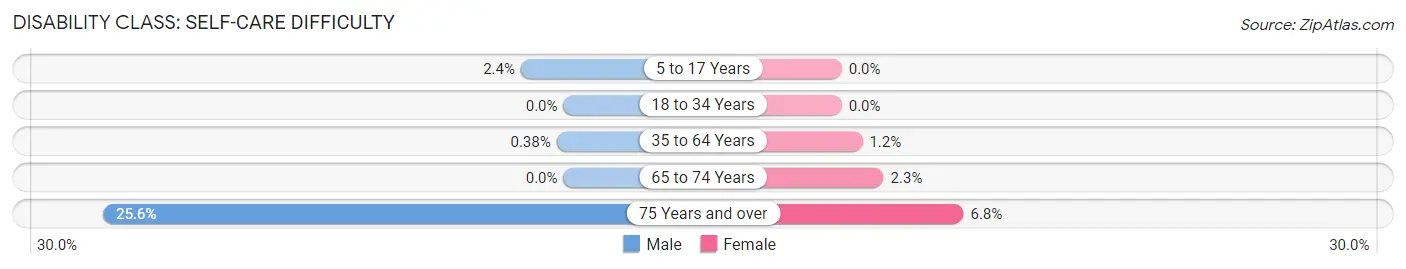
| Age Bracket | Male | Female |
| 5 to 17 Years | 18 (2.4%) | 0 (0.0%) |
| 18 to 34 Years | 0 (0.0%) | 0 (0.0%) |
| 35 to 64 Years | 6 (0.4%) | 21 (1.1%) |
| 65 to 74 Years | 0 (0.0%) | 19 (2.3%) |
| 75 Years and over | 102 (25.6%) | 35 (6.8%) |
Technology Access in Valley Center
Computing Device Access in Valley Center
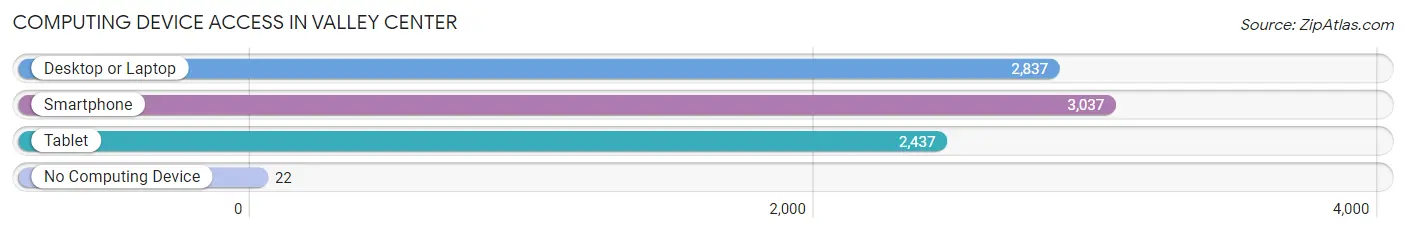
| Device Type | # Households | % Households |
| Desktop or Laptop | 2,837 | 90.9% |
| Smartphone | 3,037 | 97.3% |
| Tablet | 2,437 | 78.1% |
| No Computing Device | 22 | 0.7% |
| Total | 3,121 | 100.0% |
Internet Access in Valley Center
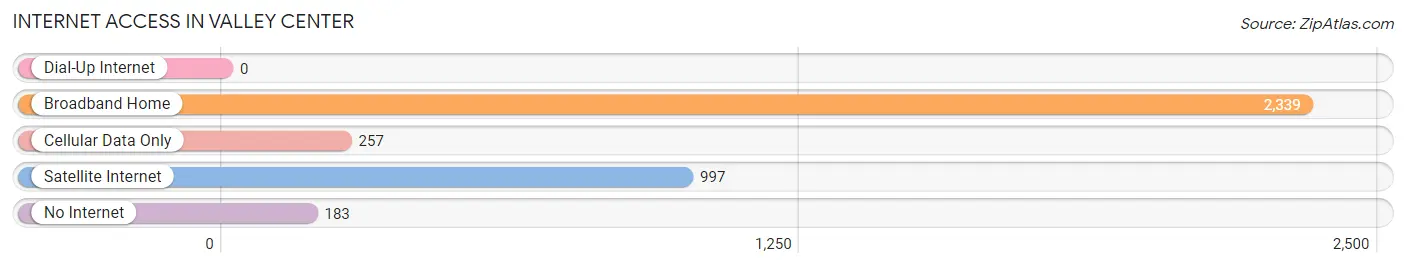
| Internet Type | # Households | % Households |
| Dial-Up Internet | 0 | 0.0% |
| Broadband Home | 2,339 | 74.9% |
| Cellular Data Only | 257 | 8.2% |
| Satellite Internet | 997 | 31.9% |
| No Internet | 183 | 5.9% |
| Total | 3,121 | 100.0% |
Valley Center Summary
Valley Center is a census-designated place (CDP) in San Diego County, California, United States. The population was 9,277 at the 2010 census, up from 7,323 at the 2000 census. Valley Center is located at the intersection of Valley Center Road and Cole Grade Road, about 5 miles (8 km) east of Interstate 15.
History
Valley Center was originally inhabited by the Luiseño Indians, who lived in the area for thousands of years. The first Europeans to settle in the area were Spanish missionaries, who established a mission in the area in 1798. The area was later settled by American pioneers in the mid-1800s. The town of Valley Center was established in 1845, and the first post office was established in 1876.
Geography
Valley Center is located at 33°14'25" North, 117°01'17" West (33.240278, -117.021389). According to the United States Census Bureau, the CDP has a total area of 16.2 square miles (41.8 km2), all of it land.
Economy
Valley Center is home to a variety of businesses, including agriculture, manufacturing, retail, and services. The area is known for its wineries, and is home to several wineries and vineyards. The area is also home to several golf courses, including the Valley Center Golf Course, which is one of the oldest courses in San Diego County.
Demographics
As of the census of 2000, there were 7,323 people, 2,541 households, and 2,039 families residing in the CDP. The population density was 454.3 people per square mile (175.6/km2). There were 2,637 housing units at an average density of 162.7 per square mile (62.7/km2). The racial makeup of the CDP was 81.2% White, 0.7% African American, 1.2% Native American, 0.7% Asian, 0.1% Pacific Islander, 13.2% from other races, and 3.0% from two or more races. Hispanic or Latino of any race were 24.2% of the population.
There were 2,541 households, out of which 37.2% had children under the age of 18 living with them, 65.2% were married couples living together, 9.2% had a female householder with no husband present, and 20.7% were non-families. 16.2% of all households were made up of individuals, and 6.2% had someone living alone who was 65 years of age or older. The average household size was 2.87 and the average family size was 3.20.
In the CDP, the population was spread out, with 27.2% under the age of 18, 7.2% from 18 to 24, 28.2% from 25 to 44, 25.2% from 45 to 64, and 12.2% who were 65 years of age or older. The median age was 38 years. For every 100 females, there were 99.2 males. For every 100 females age 18 and over, there were 97.2 males.
The median income for a household in the CDP was $54,846, and the median income for a family was $58,958. Males had a median income of $41,919 versus $30,917 for females. The per capita income for the CDP was $21,945. About 4.2% of families and 6.2% of the population were below the poverty line, including 7.2% of those under age 18 and 4.2% of those age 65 or over.
Common Questions
What is Per Capita Income in Valley Center?
Per Capita income in Valley Center is $40,821.
What is the Median Family Income in Valley Center?
Median Family Income in Valley Center is $112,574.
What is the Median Household income in Valley Center?
Median Household Income in Valley Center is $104,115.
What is Income or Wage Gap in Valley Center?
Income or Wage Gap in Valley Center is 47.2%.
Women in Valley Center earn 52.8 cents for every dollar earned by a man.
What is Inequality or Gini Index in Valley Center?
Inequality or Gini Index in Valley Center is 0.45.
What is the Total Population of Valley Center?
Total Population of Valley Center is 10,929.
What is the Total Male Population of Valley Center?
Total Male Population of Valley Center is 5,078.
What is the Total Female Population of Valley Center?
Total Female Population of Valley Center is 5,851.
What is the Ratio of Males per 100 Females in Valley Center?
There are 86.79 Males per 100 Females in Valley Center.
What is the Ratio of Females per 100 Males in Valley Center?
There are 115.22 Females per 100 Males in Valley Center.
What is the Median Population Age in Valley Center?
Median Population Age in Valley Center is 39.2 Years.
What is the Average Family Size in Valley Center
Average Family Size in Valley Center is 3.5 People.
What is the Average Household Size in Valley Center
Average Household Size in Valley Center is 3.5 People.
How Large is the Labor Force in Valley Center?
There are 4,838 People in the Labor Forcein in Valley Center.
What is the Percentage of People in the Labor Force in Valley Center?
56.2% of People are in the Labor Force in Valley Center.
What is the Unemployment Rate in Valley Center?
Unemployment Rate in Valley Center is 3.1%.