Upper Lake, CA Map & Demographics
Upper Lake Map
Upper Lake Overview
$47,046
PER CAPITA INCOME
$99,821
AVG FAMILY INCOME
$104,839
AVG HOUSEHOLD INCOME
5.9%
WAGE / INCOME GAP [ % ]
94.1¢/ $1
WAGE / INCOME GAP [ $ ]
0.28
INEQUALITY / GINI INDEX
954
TOTAL POPULATION
571
MALE POPULATION
383
FEMALE POPULATION
149.09
MALES / 100 FEMALES
67.08
FEMALES / 100 MALES
48.3
MEDIAN AGE
3.0
AVG FAMILY SIZE
2.3
AVG HOUSEHOLD SIZE
623
LABOR FORCE [ PEOPLE ]
73.1%
PERCENT IN LABOR FORCE
6.2%
UNEMPLOYMENT RATE
Upper Lake Zip Codes
Upper Lake Area Codes
Income in Upper Lake
Income Overview in Upper Lake
Per Capita Income in Upper Lake is $47,046, while median incomes of families and households are $99,821 and $104,839 respectively.
| Characteristic | Number | Measure |
| Per Capita Income | 954 | $47,046 |
| Median Family Income | 154 | $99,821 |
| Mean Family Income | 154 | $98,917 |
| Median Household Income | 398 | $104,839 |
| Mean Household Income | 398 | $102,501 |
| Income Deficit | 154 | $0 |
| Wage / Income Gap (%) | 954 | 5.85% |
| Wage / Income Gap ($) | 954 | 94.15¢ per $1 |
| Gini / Inequality Index | 954 | 0.28 |
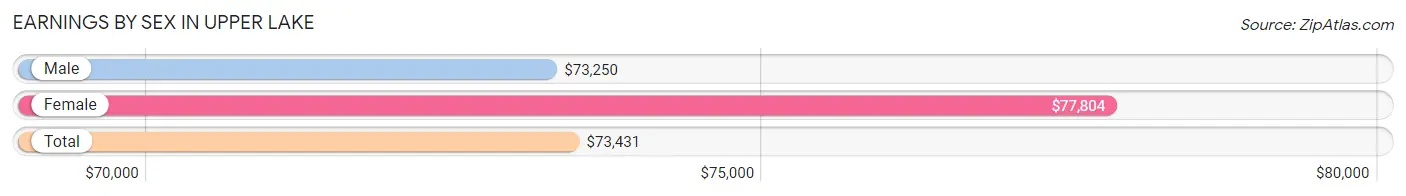
Earnings by Sex in Upper Lake
Average Earnings in Upper Lake are $73,431, $73,250 for men and $77,804 for women, a difference of 5.9%.
| Sex | Number | Average Earnings |
| Male | 378 (62.2%) | $73,250 |
| Female | 230 (37.8%) | $77,804 |
| Total | 608 (100.0%) | $73,431 |
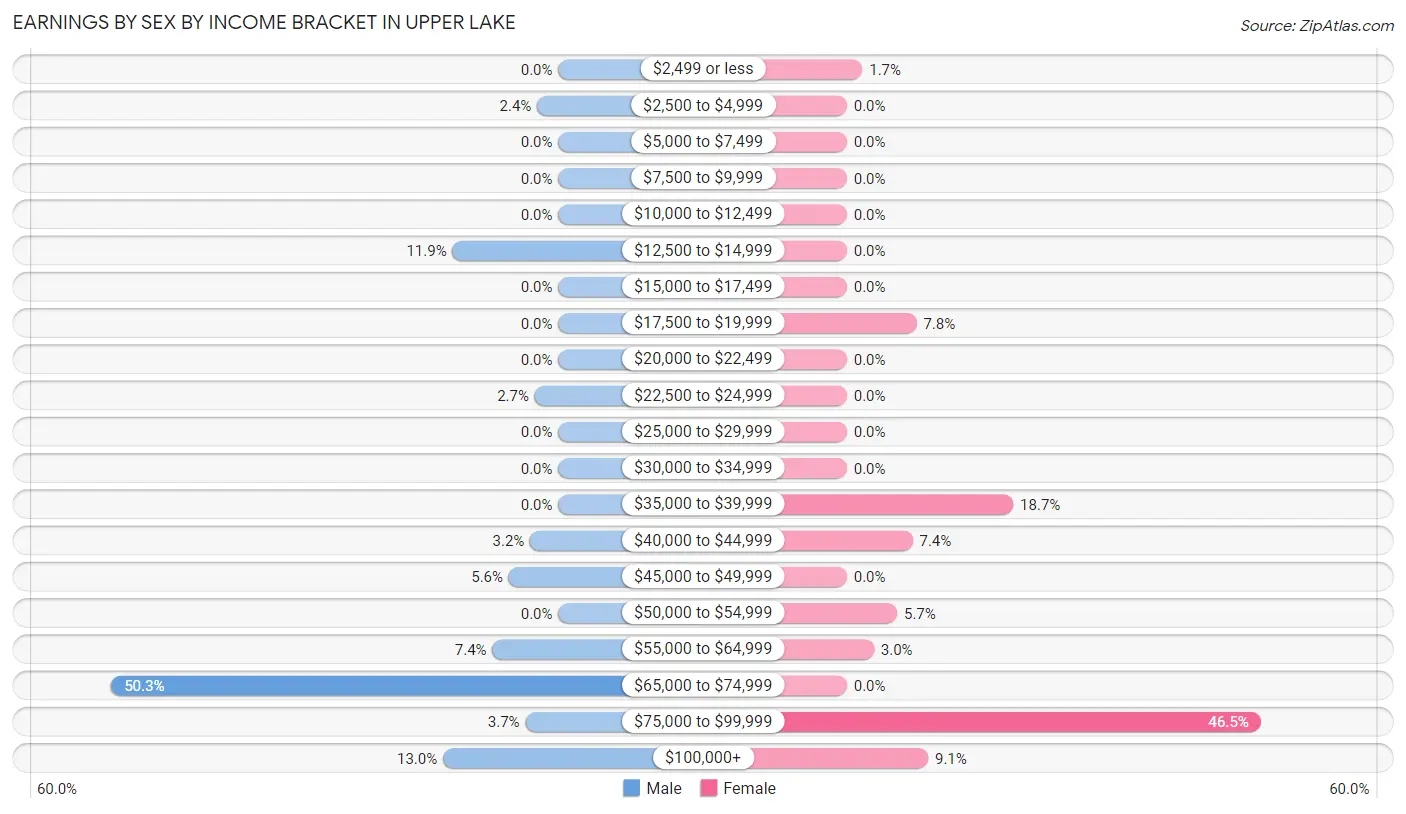
Earnings by Sex by Income Bracket in Upper Lake
The most common earnings brackets in Upper Lake are $65,000 to $74,999 for men (190 | 50.3%) and $75,000 to $99,999 for women (107 | 46.5%).
| Income | Male | Female |
| $2,499 or less | 0 (0.0%) | 4 (1.7%) |
| $2,500 to $4,999 | 9 (2.4%) | 0 (0.0%) |
| $5,000 to $7,499 | 0 (0.0%) | 0 (0.0%) |
| $7,500 to $9,999 | 0 (0.0%) | 0 (0.0%) |
| $10,000 to $12,499 | 0 (0.0%) | 0 (0.0%) |
| $12,500 to $14,999 | 45 (11.9%) | 0 (0.0%) |
| $15,000 to $17,499 | 0 (0.0%) | 0 (0.0%) |
| $17,500 to $19,999 | 0 (0.0%) | 18 (7.8%) |
| $20,000 to $22,499 | 0 (0.0%) | 0 (0.0%) |
| $22,500 to $24,999 | 10 (2.6%) | 0 (0.0%) |
| $25,000 to $29,999 | 0 (0.0%) | 0 (0.0%) |
| $30,000 to $34,999 | 0 (0.0%) | 0 (0.0%) |
| $35,000 to $39,999 | 0 (0.0%) | 43 (18.7%) |
| $40,000 to $44,999 | 12 (3.2%) | 17 (7.4%) |
| $45,000 to $49,999 | 21 (5.6%) | 0 (0.0%) |
| $50,000 to $54,999 | 0 (0.0%) | 13 (5.7%) |
| $55,000 to $64,999 | 28 (7.4%) | 7 (3.0%) |
| $65,000 to $74,999 | 190 (50.3%) | 0 (0.0%) |
| $75,000 to $99,999 | 14 (3.7%) | 107 (46.5%) |
| $100,000+ | 49 (13.0%) | 21 (9.1%) |
| Total | 378 (100.0%) | 230 (100.0%) |
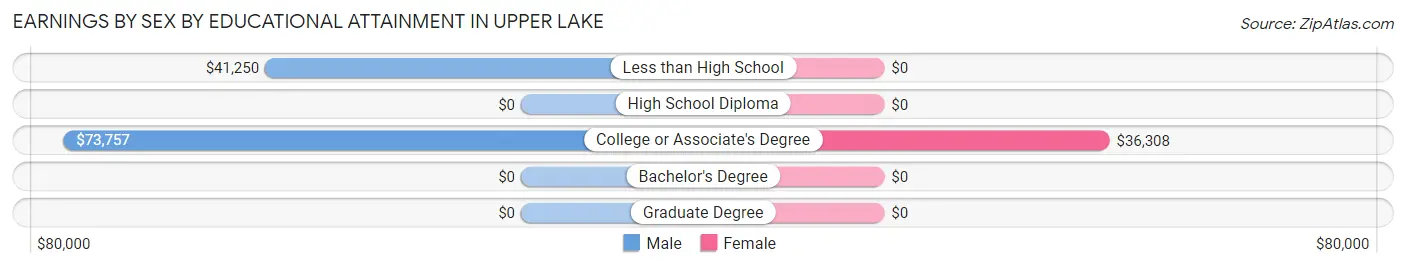
Earnings by Sex by Educational Attainment in Upper Lake
Average earnings in Upper Lake are $73,563 for men and $77,804 for women, a difference of 5.4%. Men with an educational attainment of college or associate's degree enjoy the highest average annual earnings of $73,757, while those with less than high school education earn the least with $41,250. Women with an educational attainment of college or associate's degree earn the most with the average annual earnings of $36,308, while those with college or associate's degree education have the smallest earnings of $36,308.
| Educational Attainment | Male Income | Female Income |
| Less than High School | $41,250 | $0 |
| High School Diploma | - | - |
| College or Associate's Degree | $73,757 | $36,308 |
| Bachelor's Degree | - | - |
| Graduate Degree | - | - |
| Total | $73,563 | $77,804 |
Family Income in Upper Lake
Family Income Brackets in Upper Lake
According to the Upper Lake family income data, there are 66 families falling into the $100,000 to $149,999 income range, which is the most common income bracket and makes up 42.9% of all families.
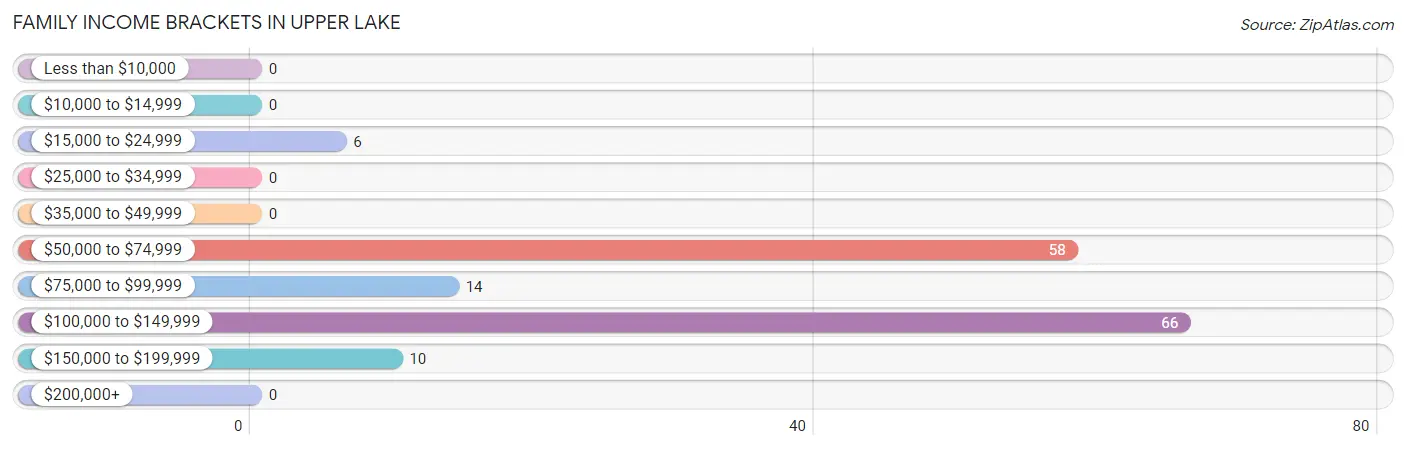
| Income Bracket | # Families | % Families |
| Less than $10,000 | 0 | 0.0% |
| $10,000 to $14,999 | 0 | 0.0% |
| $15,000 to $24,999 | 6 | 3.9% |
| $25,000 to $34,999 | 0 | 0.0% |
| $35,000 to $49,999 | 0 | 0.0% |
| $50,000 to $74,999 | 58 | 37.7% |
| $75,000 to $99,999 | 14 | 9.1% |
| $100,000 to $149,999 | 66 | 42.9% |
| $150,000 to $199,999 | 10 | 6.5% |
| $200,000+ | 0 | 0.0% |
Family Income by Famaliy Size in Upper Lake
3-person families (38 | 24.7%) account for the highest median family income in Upper Lake with $125,962 per family, while 3-person families (38 | 24.7%) have the highest median income of $41,987 per family member.
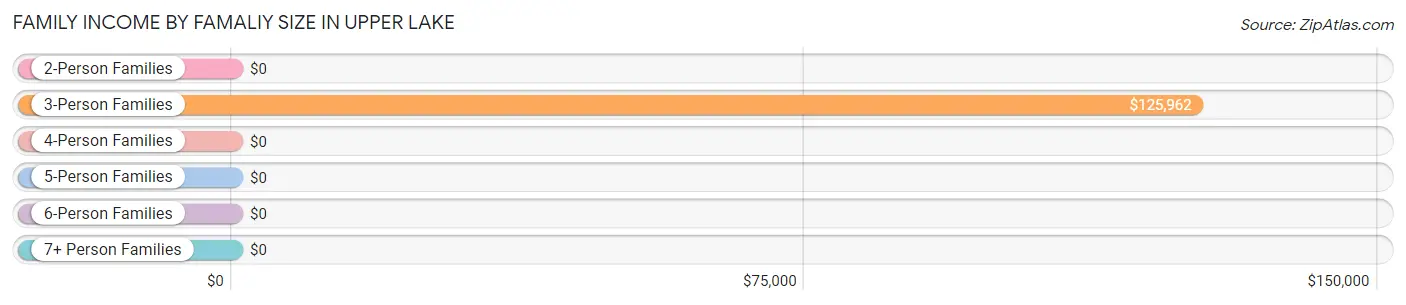
| Income Bracket | # Families | Median Income |
| 2-Person Families | 88 (57.1%) | $0 |
| 3-Person Families | 38 (24.7%) | $125,962 |
| 4-Person Families | 0 (0.0%) | $0 |
| 5-Person Families | 28 (18.2%) | $0 |
| 6-Person Families | 0 (0.0%) | $0 |
| 7+ Person Families | 0 (0.0%) | $0 |
| Total | 154 (100.0%) | $99,821 |
Family Income by Number of Earners in Upper Lake
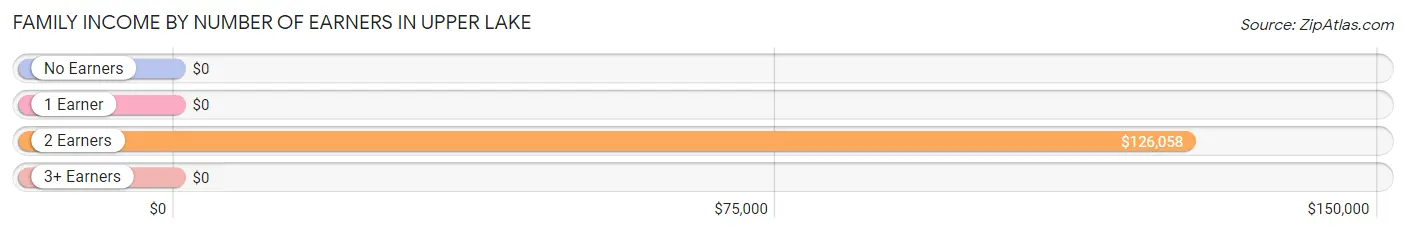
| Number of Earners | # Families | Median Income |
| No Earners | 21 (13.6%) | $0 |
| 1 Earner | 48 (31.2%) | $0 |
| 2 Earners | 57 (37.0%) | $126,058 |
| 3+ Earners | 28 (18.2%) | $0 |
| Total | 154 (100.0%) | $99,821 |
Household Income in Upper Lake
Household Income Brackets in Upper Lake
With 117 households falling in the category, the $150,000 to $199,999 income range is the most frequent in Upper Lake, accounting for 29.4% of all households.
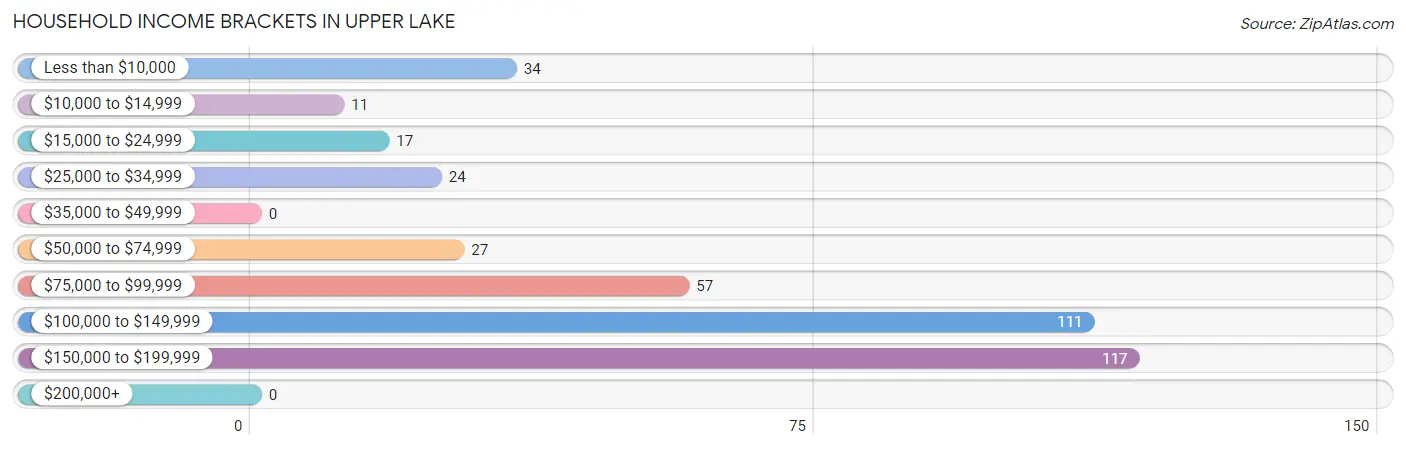
| Income Bracket | # Households | % Households |
| Less than $10,000 | 34 | 8.5% |
| $10,000 to $14,999 | 11 | 2.8% |
| $15,000 to $24,999 | 17 | 4.3% |
| $25,000 to $34,999 | 24 | 6.0% |
| $35,000 to $49,999 | 0 | 0.0% |
| $50,000 to $74,999 | 27 | 6.8% |
| $75,000 to $99,999 | 57 | 14.3% |
| $100,000 to $149,999 | 111 | 27.9% |
| $150,000 to $199,999 | 117 | 29.4% |
| $200,000+ | 0 | 0.0% |
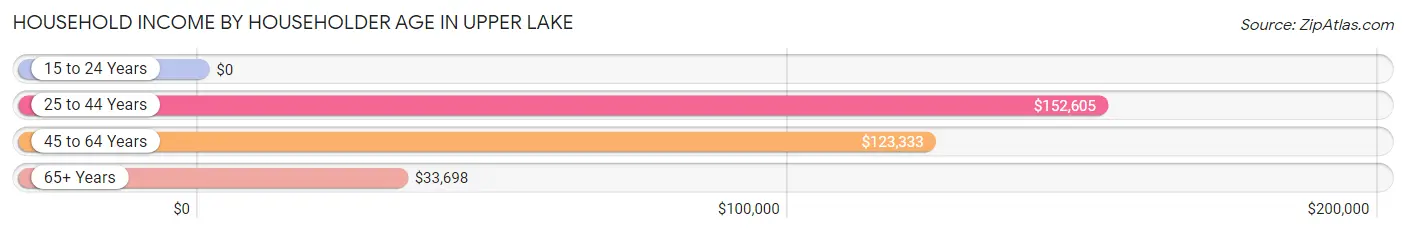
Household Income by Householder Age in Upper Lake
The median household income in Upper Lake is $104,839, with the highest median household income of $152,605 found in the 25 to 44 years age bracket for the primary householder. A total of 205 households (51.5%) fall into this category.
| Income Bracket | # Households | Median Income |
| 15 to 24 Years | 0 (0.0%) | $0 |
| 25 to 44 Years | 205 (51.5%) | $152,605 |
| 45 to 64 Years | 114 (28.6%) | $123,333 |
| 65+ Years | 79 (19.9%) | $33,698 |
| Total | 398 (100.0%) | $104,839 |
Poverty in Upper Lake
Income Below Poverty by Sex and Age in Upper Lake
With 10.0% poverty level for males and 7.5% for females among the residents of Upper Lake, 35 to 44 year old males and 18 to 24 year old females are the most vulnerable to poverty, with 14 males (30.4%) and 5 females (100.0%) in their respective age groups living below the poverty level.
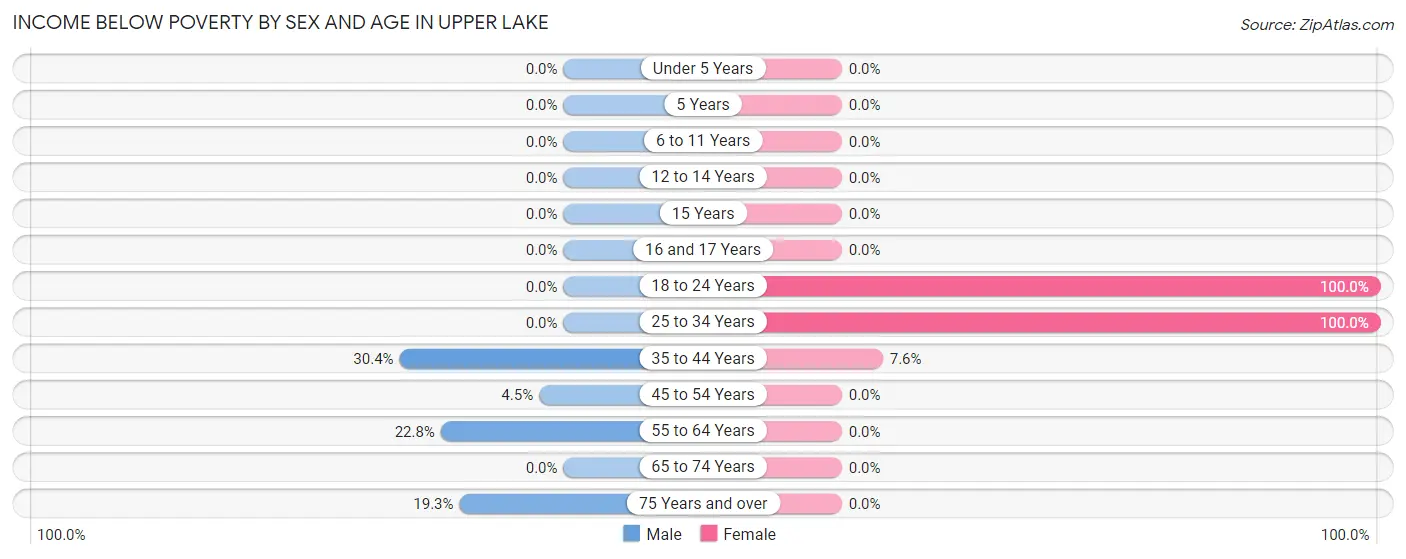
| Age Bracket | Male | Female |
| Under 5 Years | 0 (0.0%) | 0 (0.0%) |
| 5 Years | 0 (0.0%) | 0 (0.0%) |
| 6 to 11 Years | 0 (0.0%) | 0 (0.0%) |
| 12 to 14 Years | 0 (0.0%) | 0 (0.0%) |
| 15 Years | 0 (0.0%) | 0 (0.0%) |
| 16 and 17 Years | 0 (0.0%) | 0 (0.0%) |
| 18 to 24 Years | 0 (0.0%) | 5 (100.0%) |
| 25 to 34 Years | 0 (0.0%) | 9 (100.0%) |
| 35 to 44 Years | 14 (30.4%) | 14 (7.6%) |
| 45 to 54 Years | 9 (4.5%) | 0 (0.0%) |
| 55 to 64 Years | 23 (22.8%) | 0 (0.0%) |
| 65 to 74 Years | 0 (0.0%) | 0 (0.0%) |
| 75 Years and over | 11 (19.3%) | 0 (0.0%) |
| Total | 57 (10.0%) | 28 (7.5%) |
Income Above Poverty by Sex and Age in Upper Lake
According to the poverty statistics in Upper Lake, males aged under 5 years and females aged under 5 years are the age groups that are most secure financially, with 100.0% of males and 100.0% of females in these age groups living above the poverty line.
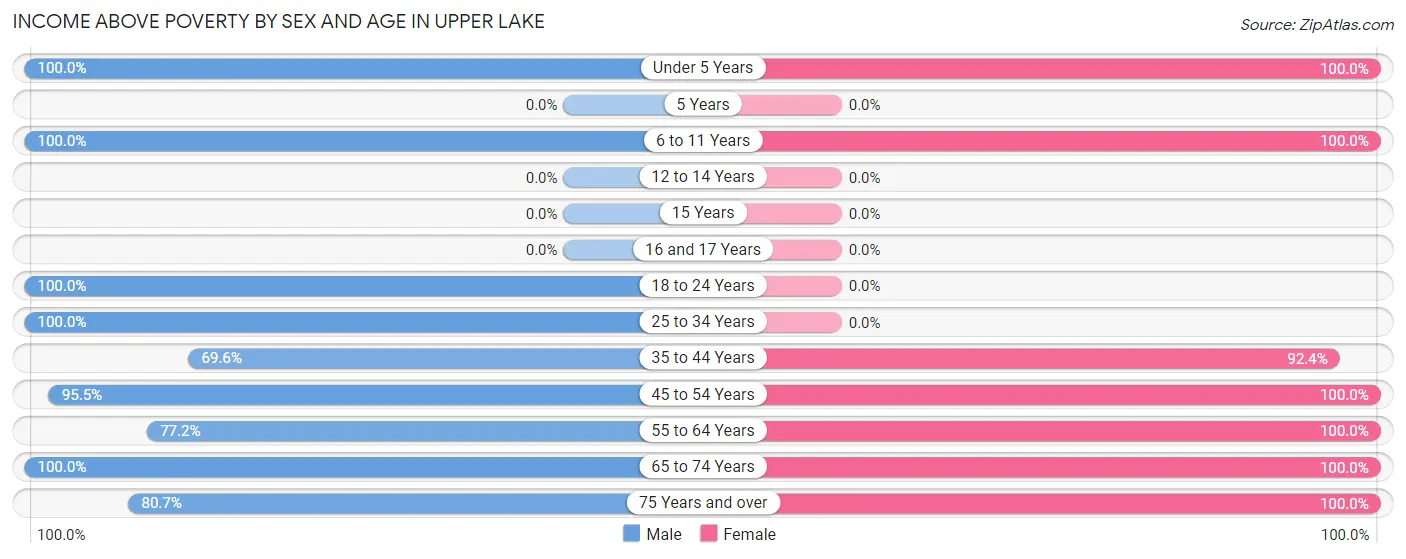
| Age Bracket | Male | Female |
| Under 5 Years | 47 (100.0%) | 16 (100.0%) |
| 5 Years | 0 (0.0%) | 0 (0.0%) |
| 6 to 11 Years | 16 (100.0%) | 13 (100.0%) |
| 12 to 14 Years | 0 (0.0%) | 0 (0.0%) |
| 15 Years | 0 (0.0%) | 0 (0.0%) |
| 16 and 17 Years | 0 (0.0%) | 0 (0.0%) |
| 18 to 24 Years | 45 (100.0%) | 0 (0.0%) |
| 25 to 34 Years | 33 (100.0%) | 0 (0.0%) |
| 35 to 44 Years | 32 (69.6%) | 170 (92.4%) |
| 45 to 54 Years | 190 (95.5%) | 48 (100.0%) |
| 55 to 64 Years | 78 (77.2%) | 17 (100.0%) |
| 65 to 74 Years | 27 (100.0%) | 39 (100.0%) |
| 75 Years and over | 46 (80.7%) | 41 (100.0%) |
| Total | 514 (90.0%) | 344 (92.5%) |
Income Below Poverty Among Married-Couple Families in Upper Lake
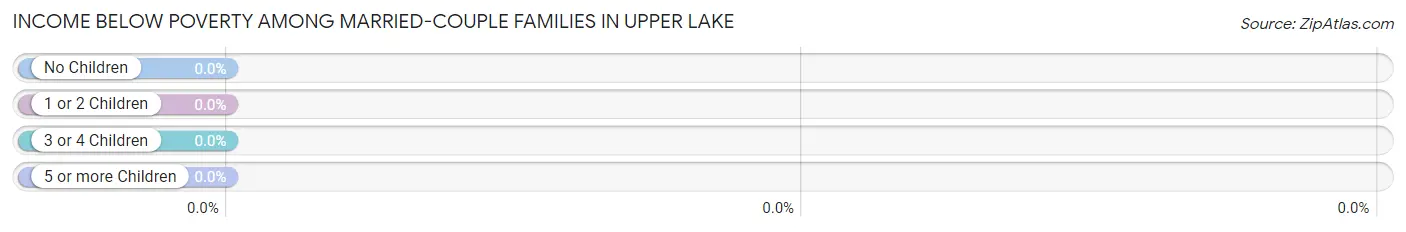
| Children | Above Poverty | Below Poverty |
| No Children | 73 (100.0%) | 0 (0.0%) |
| 1 or 2 Children | 38 (100.0%) | 0 (0.0%) |
| 3 or 4 Children | 0 (0.0%) | 0 (0.0%) |
| 5 or more Children | 0 (0.0%) | 0 (0.0%) |
| Total | 111 (100.0%) | 0 (0.0%) |
Income Below Poverty Among Single-Parent Households in Upper Lake
| Children | Single Father | Single Mother |
| No Children | 0 (0.0%) | 0 (0.0%) |
| 1 or 2 Children | 0 (0.0%) | 0 (0.0%) |
| 3 or 4 Children | 0 (0.0%) | 0 (0.0%) |
| 5 or more Children | 0 (0.0%) | 0 (0.0%) |
| Total | 0 (0.0%) | 0 (0.0%) |
Income Below Poverty Among Married-Couple vs Single-Parent Households in Upper Lake
| Children | Married-Couple Families | Single-Parent Households |
| No Children | 0 (0.0%) | 0 (0.0%) |
| 1 or 2 Children | 0 (0.0%) | 0 (0.0%) |
| 3 or 4 Children | 0 (0.0%) | 0 (0.0%) |
| 5 or more Children | 0 (0.0%) | 0 (0.0%) |
| Total | 0 (0.0%) | 0 (0.0%) |
Race in Upper Lake
The most populous races in Upper Lake are White / Caucasian (817 | 85.6%), Hispanic or Latino (77 | 8.1%), and Two or more Races (62 | 6.5%).
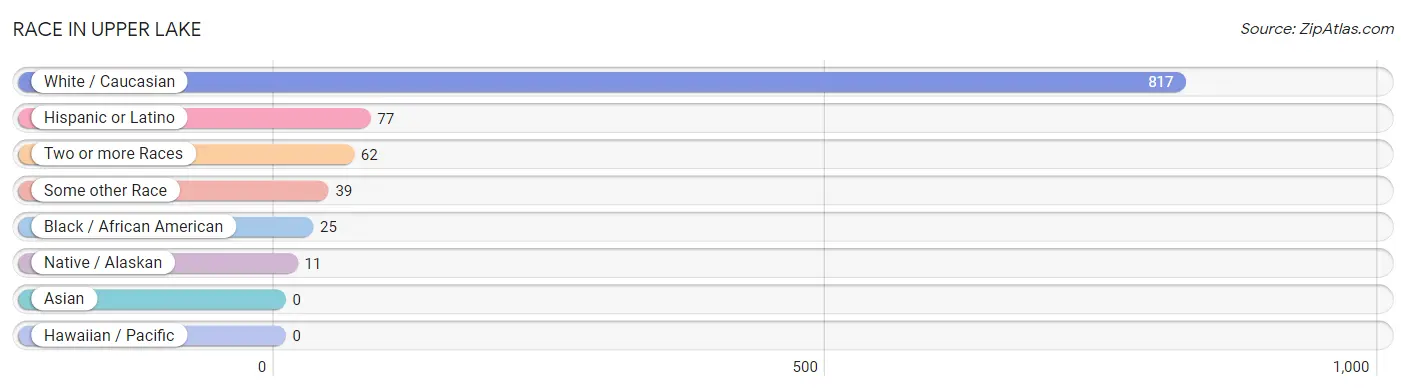
| Race | # Population | % Population |
| Asian | 0 | 0.0% |
| Black / African American | 25 | 2.6% |
| Hawaiian / Pacific | 0 | 0.0% |
| Hispanic or Latino | 77 | 8.1% |
| Native / Alaskan | 11 | 1.1% |
| White / Caucasian | 817 | 85.6% |
| Two or more Races | 62 | 6.5% |
| Some other Race | 39 | 4.1% |
| Total | 954 | 100.0% |
Ancestry in Upper Lake
The most populous ancestries reported in Upper Lake are Italian (221 | 23.2%), German (196 | 20.5%), Irish (107 | 11.2%), American (94 | 9.9%), and Mexican (77 | 8.1%), together accounting for 72.9% of all Upper Lake residents.
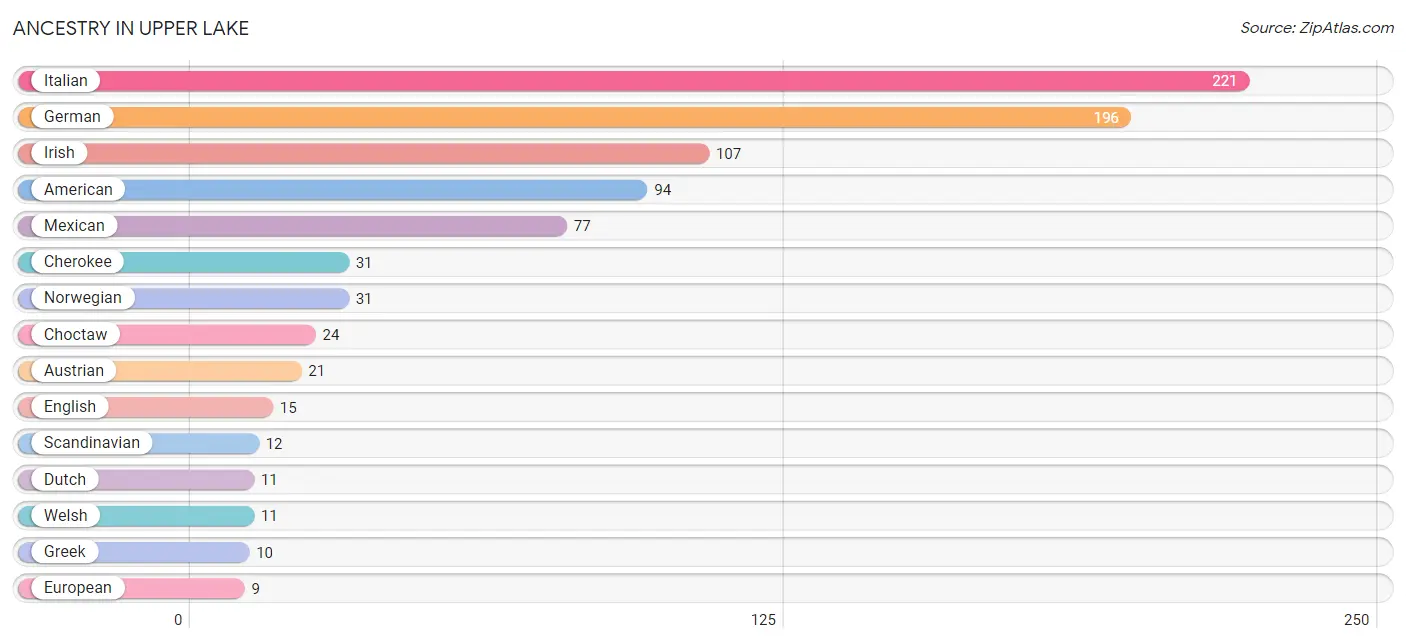
| Ancestry | # Population | % Population |
| African | 1 | 0.1% |
| American | 94 | 9.9% |
| Austrian | 21 | 2.2% |
| Cherokee | 31 | 3.3% |
| Choctaw | 24 | 2.5% |
| Dutch | 11 | 1.1% |
| English | 15 | 1.6% |
| European | 9 | 0.9% |
| German | 196 | 20.5% |
| Greek | 10 | 1.1% |
| Hungarian | 3 | 0.3% |
| Irish | 107 | 11.2% |
| Italian | 221 | 23.2% |
| Mexican | 77 | 8.1% |
| Norwegian | 31 | 3.3% |
| Scandinavian | 12 | 1.3% |
| Subsaharan African | 1 | 0.1% |
| Welsh | 11 | 1.1% | View All 18 Rows |
Immigrants in Upper Lake
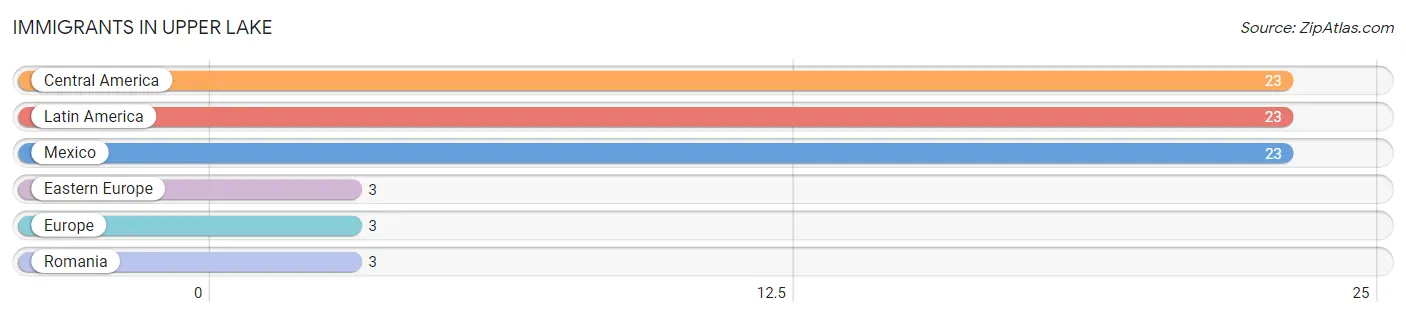
The most numerous immigrant groups reported in Upper Lake came from Central America (23 | 2.4%), Latin America (23 | 2.4%), Mexico (23 | 2.4%), Eastern Europe (3 | 0.3%), and Europe (3 | 0.3%), together accounting for 7.9% of all Upper Lake residents.
| Immigration Origin | # Population | % Population |
| Central America | 23 | 2.4% |
| Eastern Europe | 3 | 0.3% |
| Europe | 3 | 0.3% |
| Latin America | 23 | 2.4% |
| Mexico | 23 | 2.4% |
| Romania | 3 | 0.3% | View All 6 Rows |
Sex and Age in Upper Lake
Sex and Age in Upper Lake
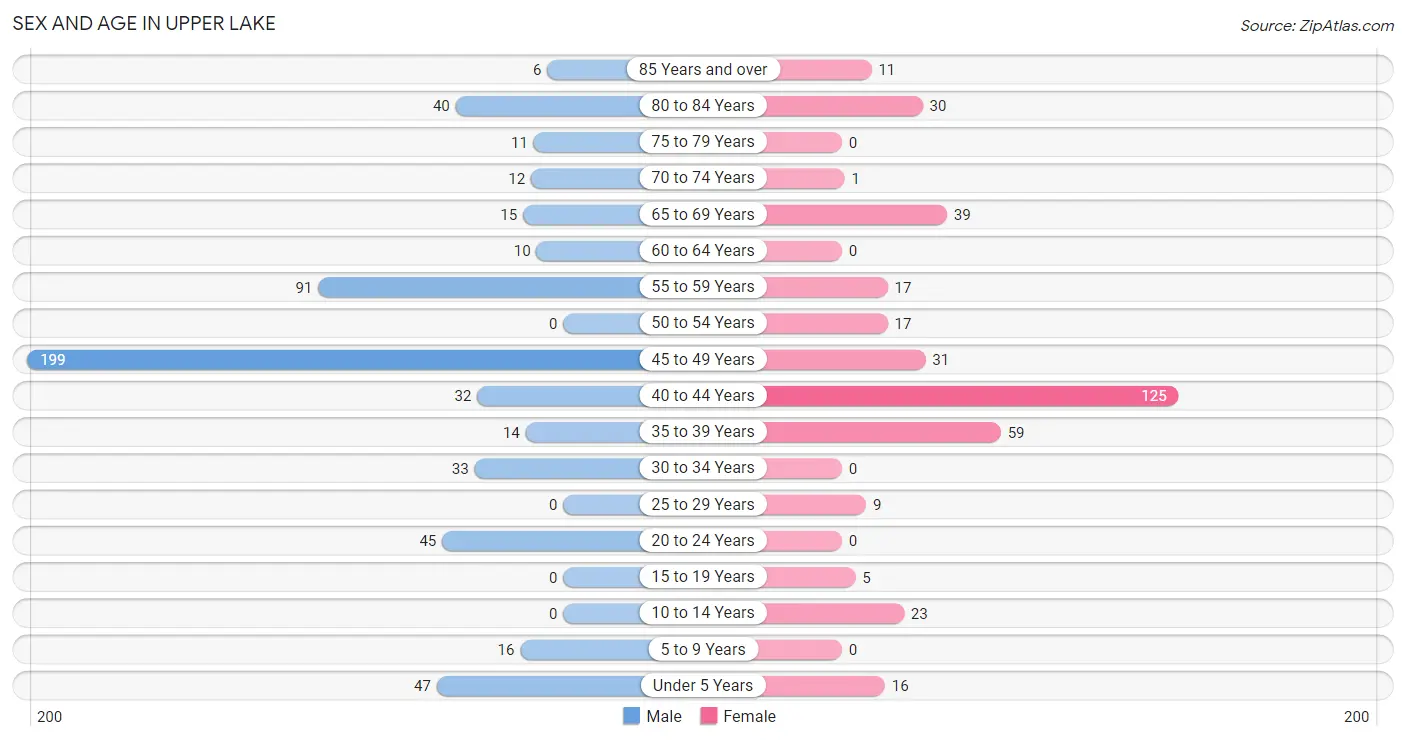
The most populous age groups in Upper Lake are 45 to 49 Years (199 | 34.8%) for men and 40 to 44 Years (125 | 32.6%) for women.
| Age Bracket | Male | Female |
| Under 5 Years | 47 (8.2%) | 16 (4.2%) |
| 5 to 9 Years | 16 (2.8%) | 0 (0.0%) |
| 10 to 14 Years | 0 (0.0%) | 23 (6.0%) |
| 15 to 19 Years | 0 (0.0%) | 5 (1.3%) |
| 20 to 24 Years | 45 (7.9%) | 0 (0.0%) |
| 25 to 29 Years | 0 (0.0%) | 9 (2.4%) |
| 30 to 34 Years | 33 (5.8%) | 0 (0.0%) |
| 35 to 39 Years | 14 (2.5%) | 59 (15.4%) |
| 40 to 44 Years | 32 (5.6%) | 125 (32.6%) |
| 45 to 49 Years | 199 (34.8%) | 31 (8.1%) |
| 50 to 54 Years | 0 (0.0%) | 17 (4.4%) |
| 55 to 59 Years | 91 (15.9%) | 17 (4.4%) |
| 60 to 64 Years | 10 (1.8%) | 0 (0.0%) |
| 65 to 69 Years | 15 (2.6%) | 39 (10.2%) |
| 70 to 74 Years | 12 (2.1%) | 1 (0.3%) |
| 75 to 79 Years | 11 (1.9%) | 0 (0.0%) |
| 80 to 84 Years | 40 (7.0%) | 30 (7.8%) |
| 85 Years and over | 6 (1.1%) | 11 (2.9%) |
| Total | 571 (100.0%) | 383 (100.0%) |
Families and Households in Upper Lake
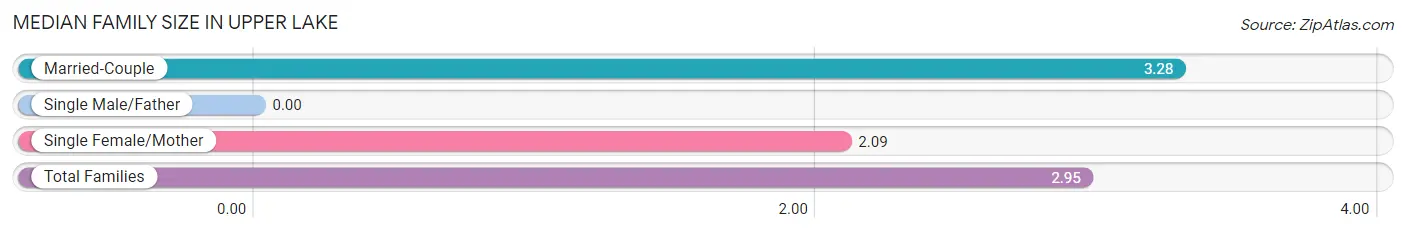
Median Family Size in Upper Lake
| Family Type | # Families | Family Size |
| Married-Couple | 111 (72.1%) | 3.28 |
| Single Male/Father | 0 (0.0%) | - |
| Single Female/Mother | 43 (27.9%) | 2.09 |
| Total Families | 154 (100.0%) | 2.95 |
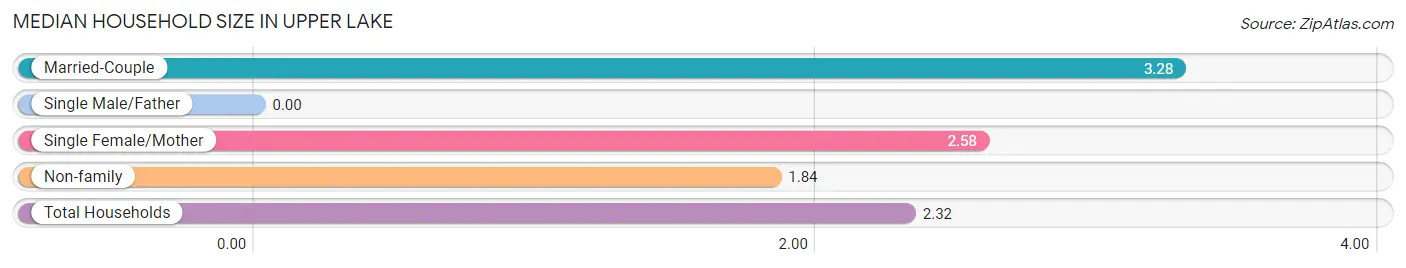
Median Household Size in Upper Lake
| Household Type | # Households | Household Size |
| Married-Couple | 111 (27.9%) | 3.28 |
| Single Male/Father | 0 (0.0%) | - |
| Single Female/Mother | 43 (10.8%) | 2.58 |
| Non-family | 244 (61.3%) | 1.84 |
| Total Households | 398 (100.0%) | 2.32 |
Household Size by Marriage Status in Upper Lake
Out of a total of 398 households in Upper Lake, 154 (38.7%) are family households, while 244 (61.3%) are nonfamily households. The most numerous type of family households are 3-person households, comprising 81, and the most common type of nonfamily households are 1-person households, comprising 123.
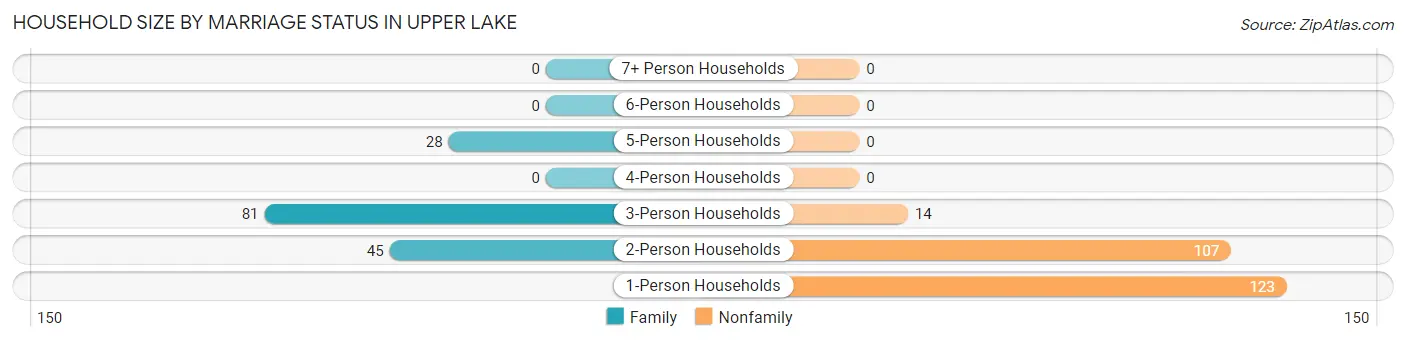
| Household Size | Family Households | Nonfamily Households |
| 1-Person Households | - | 123 (30.9%) |
| 2-Person Households | 45 (11.3%) | 107 (26.9%) |
| 3-Person Households | 81 (20.3%) | 14 (3.5%) |
| 4-Person Households | 0 (0.0%) | 0 (0.0%) |
| 5-Person Households | 28 (7.0%) | 0 (0.0%) |
| 6-Person Households | 0 (0.0%) | 0 (0.0%) |
| 7+ Person Households | 0 (0.0%) | 0 (0.0%) |
| Total | 154 (38.7%) | 244 (61.3%) |
Female Fertility in Upper Lake
Fertility by Age in Upper Lake
| Age Bracket | Women with Births | Births / 1,000 Women |
| 15 to 19 years | 0 (0.0%) | 0.0 |
| 20 to 34 years | 0 (0.0%) | 0.0 |
| 35 to 50 years | 0 (0.0%) | 0.0 |
| Total | 0 (0.0%) | 0.0 |
Fertility by Age by Marriage Status in Upper Lake
| Age Bracket | Married | Unmarried |
| 15 to 19 years | 0 (0.0%) | 0 (0.0%) |
| 20 to 34 years | 0 (0.0%) | 0 (0.0%) |
| 35 to 50 years | 0 (0.0%) | 0 (0.0%) |
| Total | 0 (0.0%) | 0 (0.0%) |
Fertility by Education in Upper Lake
| Educational Attainment | Women with Births | Births / 1,000 Women |
| Less than High School | 0 (0.0%) | 0.0 |
| High School Diploma | 0 (0.0%) | 0.0 |
| College or Associate's Degree | 0 (0.0%) | 0.0 |
| Bachelor's Degree | 0 (0.0%) | 0.0 |
| Graduate Degree | 0 (0.0%) | 0.0 |
| Total | 0 (0.0%) | 0.0 |
Fertility by Education by Marriage Status in Upper Lake
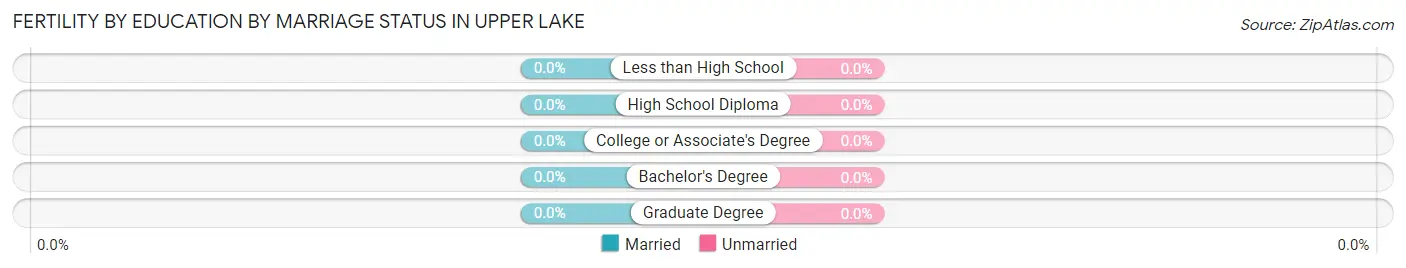
| Educational Attainment | Married | Unmarried |
| Less than High School | 0 (0.0%) | 0 (0.0%) |
| High School Diploma | 0 (0.0%) | 0 (0.0%) |
| College or Associate's Degree | 0 (0.0%) | 0 (0.0%) |
| Bachelor's Degree | 0 (0.0%) | 0 (0.0%) |
| Graduate Degree | 0 (0.0%) | 0 (0.0%) |
| Total | 0 (0.0%) | 0 (0.0%) |
Employment Characteristics in Upper Lake
Employment by Class of Employer in Upper Lake
Among the 585 employed individuals in Upper Lake, private company employees (470 | 80.3%), not-for-profit organizations (70 | 12.0%), and local government employees (21 | 3.6%) make up the most common classes of employment.
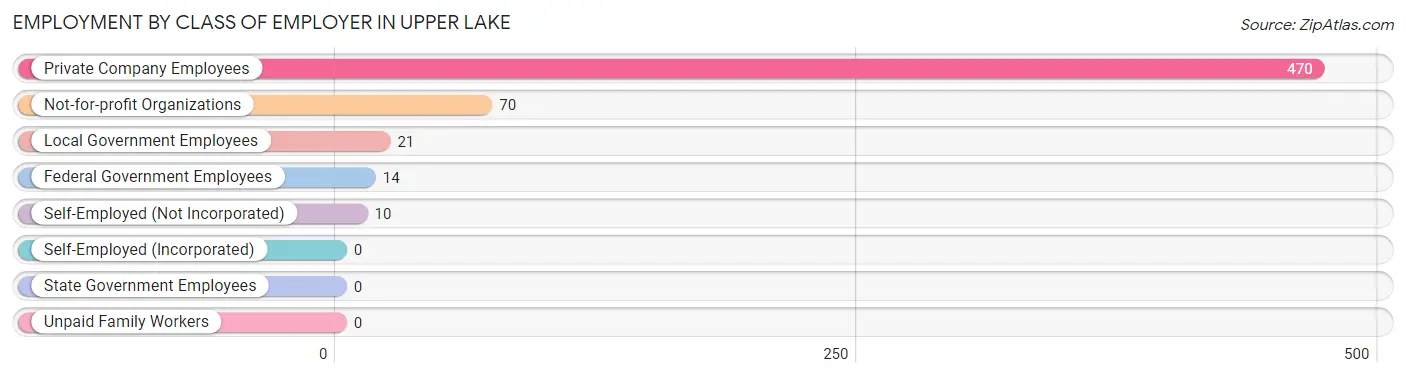
| Employer Class | # Employees | % Employees |
| Private Company Employees | 470 | 80.3% |
| Self-Employed (Incorporated) | 0 | 0.0% |
| Self-Employed (Not Incorporated) | 10 | 1.7% |
| Not-for-profit Organizations | 70 | 12.0% |
| Local Government Employees | 21 | 3.6% |
| State Government Employees | 0 | 0.0% |
| Federal Government Employees | 14 | 2.4% |
| Unpaid Family Workers | 0 | 0.0% |
| Total | 585 | 100.0% |
Employment Status by Age in Upper Lake
According to the labor force statistics for Upper Lake, out of the total population over 16 years of age (852), 73.1% or 623 individuals are in the labor force, with 6.2% or 39 of them unemployed. The age group with the highest labor force participation rate is 20 to 24 years, with 100.0% or 45 individuals in the labor force. Within the labor force, the 65 to 74 years age range has the highest percentage of unemployed individuals, with 100.0% or 24 of them being unemployed.
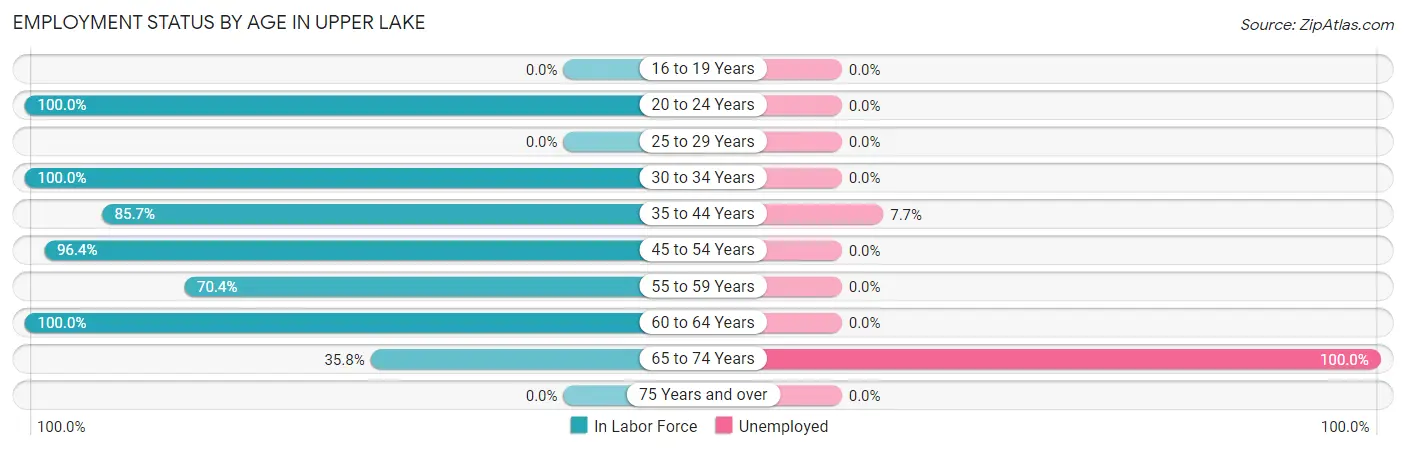
| Age Bracket | In Labor Force | Unemployed |
| 16 to 19 Years | 0 (0.0%) | 0 (0.0%) |
| 20 to 24 Years | 45 (100.0%) | 0 (0.0%) |
| 25 to 29 Years | 0 (0.0%) | 0 (0.0%) |
| 30 to 34 Years | 33 (100.0%) | 0 (0.0%) |
| 35 to 44 Years | 197 (85.7%) | 15 (7.7%) |
| 45 to 54 Years | 238 (96.4%) | 0 (0.0%) |
| 55 to 59 Years | 76 (70.4%) | 0 (0.0%) |
| 60 to 64 Years | 10 (100.0%) | 0 (0.0%) |
| 65 to 74 Years | 24 (35.8%) | 24 (100.0%) |
| 75 Years and over | 0 (0.0%) | 0 (0.0%) |
| Total | 623 (73.1%) | 39 (6.2%) |
Employment Status by Educational Attainment in Upper Lake
According to labor force statistics for Upper Lake, 87.0% of individuals (554) out of the total population between 25 and 64 years of age (637) are in the labor force, with 2.6% or 14 of them being unemployed. The group with the highest labor force participation rate are those with the educational attainment of high school diploma, with 93.2% or 124 individuals in the labor force. Within the labor force, individuals with college / associate degree education have the highest percentage of unemployment, with 3.9% or 15 of them being unemployed.
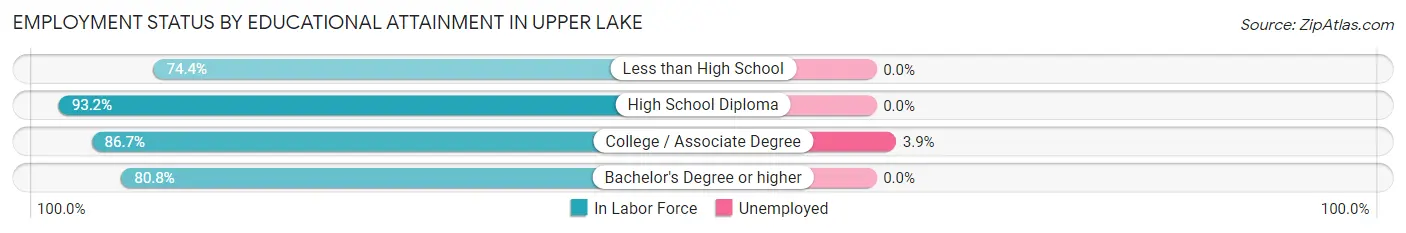
| Educational Attainment | In Labor Force | Unemployed |
| Less than High School | 32 (74.4%) | 0 (0.0%) |
| High School Diploma | 124 (93.2%) | 0 (0.0%) |
| College / Associate Degree | 377 (86.7%) | 17 (3.9%) |
| Bachelor's Degree or higher | 21 (80.8%) | 0 (0.0%) |
| Total | 554 (87.0%) | 17 (2.6%) |
Employment Occupations by Sex in Upper Lake
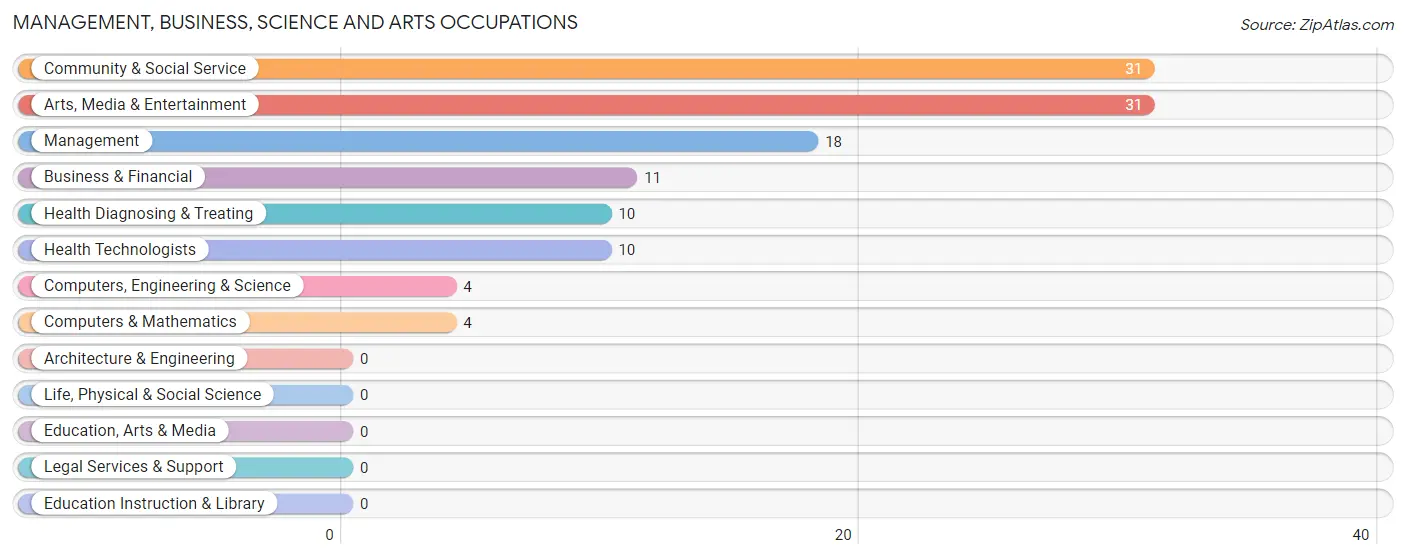
Management, Business, Science and Arts Occupations
The most common Management, Business, Science and Arts occupations in Upper Lake are Community & Social Service (31 | 5.4%), Arts, Media & Entertainment (31 | 5.4%), Management (18 | 3.2%), Business & Financial (11 | 1.9%), and Health Diagnosing & Treating (10 | 1.8%).
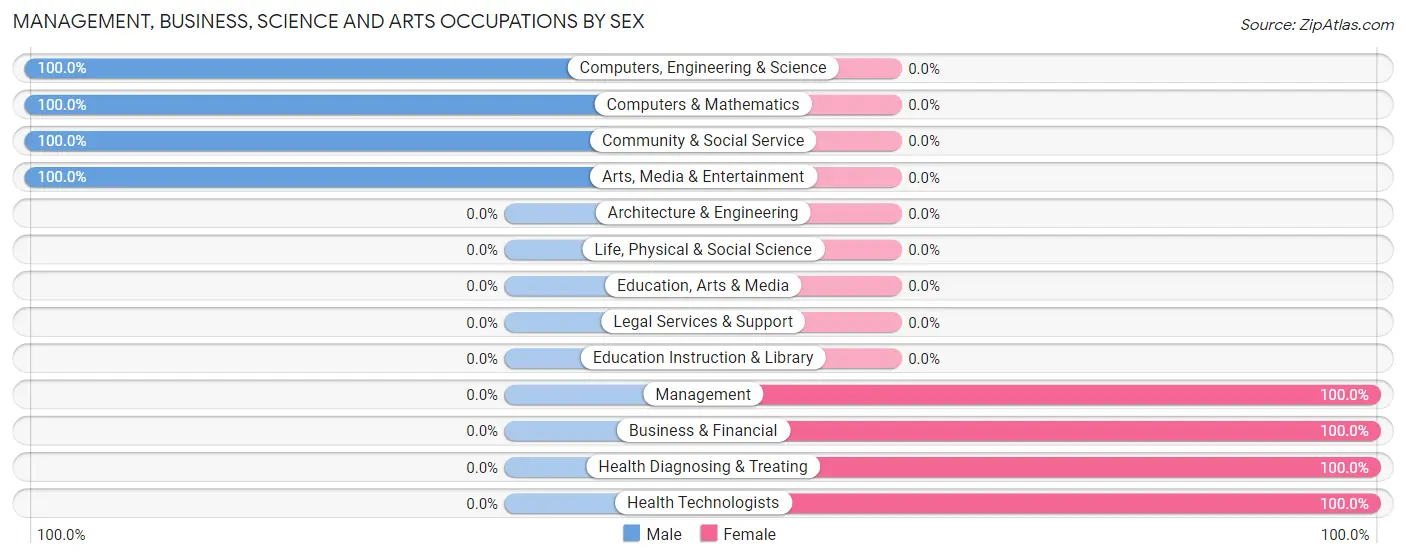
Management, Business, Science and Arts Occupations by Sex
Within the Management, Business, Science and Arts occupations in Upper Lake, the most male-oriented occupations are Computers, Engineering & Science (100.0%), Computers & Mathematics (100.0%), and Community & Social Service (100.0%), while the most female-oriented occupations are Management (100.0%), Business & Financial (100.0%), and Health Diagnosing & Treating (100.0%).
| Occupation | Male | Female |
| Management | 0 (0.0%) | 18 (100.0%) |
| Business & Financial | 0 (0.0%) | 11 (100.0%) |
| Computers, Engineering & Science | 4 (100.0%) | 0 (0.0%) |
| Computers & Mathematics | 4 (100.0%) | 0 (0.0%) |
| Architecture & Engineering | 0 (0.0%) | 0 (0.0%) |
| Life, Physical & Social Science | 0 (0.0%) | 0 (0.0%) |
| Community & Social Service | 31 (100.0%) | 0 (0.0%) |
| Education, Arts & Media | 0 (0.0%) | 0 (0.0%) |
| Legal Services & Support | 0 (0.0%) | 0 (0.0%) |
| Education Instruction & Library | 0 (0.0%) | 0 (0.0%) |
| Arts, Media & Entertainment | 31 (100.0%) | 0 (0.0%) |
| Health Diagnosing & Treating | 0 (0.0%) | 10 (100.0%) |
| Health Technologists | 0 (0.0%) | 10 (100.0%) |
| Total (Category) | 35 (47.3%) | 39 (52.7%) |
| Total (Overall) | 341 (59.7%) | 230 (40.3%) |
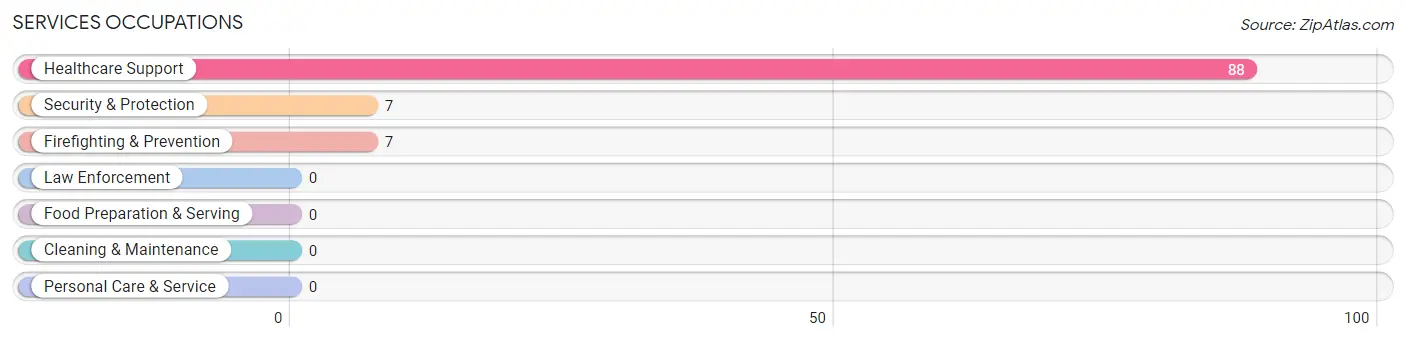
Services Occupations
The most common Services occupations in Upper Lake are Healthcare Support (88 | 15.4%), Security & Protection (7 | 1.2%), and Firefighting & Prevention (7 | 1.2%).
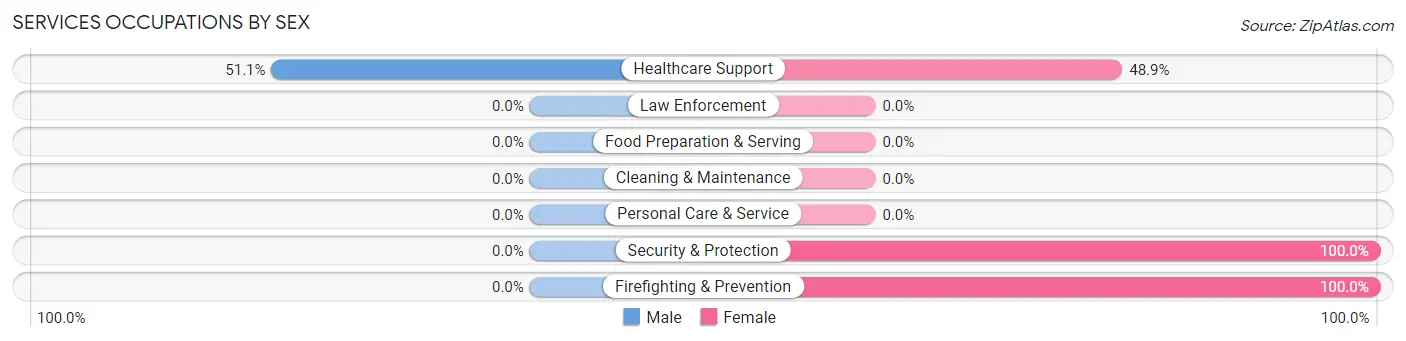
Services Occupations by Sex
| Occupation | Male | Female |
| Healthcare Support | 45 (51.1%) | 43 (48.9%) |
| Security & Protection | 0 (0.0%) | 7 (100.0%) |
| Firefighting & Prevention | 0 (0.0%) | 7 (100.0%) |
| Law Enforcement | 0 (0.0%) | 0 (0.0%) |
| Food Preparation & Serving | 0 (0.0%) | 0 (0.0%) |
| Cleaning & Maintenance | 0 (0.0%) | 0 (0.0%) |
| Personal Care & Service | 0 (0.0%) | 0 (0.0%) |
| Total (Category) | 45 (47.4%) | 50 (52.6%) |
| Total (Overall) | 341 (59.7%) | 230 (40.3%) |
Sales and Office Occupations
The most common Sales and Office occupations in Upper Lake are Office & Administration (30 | 5.2%), and Sales & Related (4 | 0.7%).
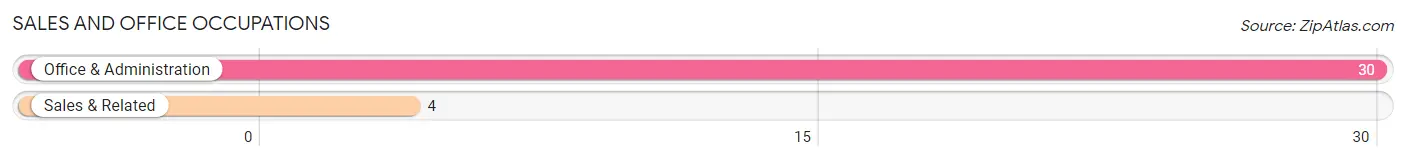
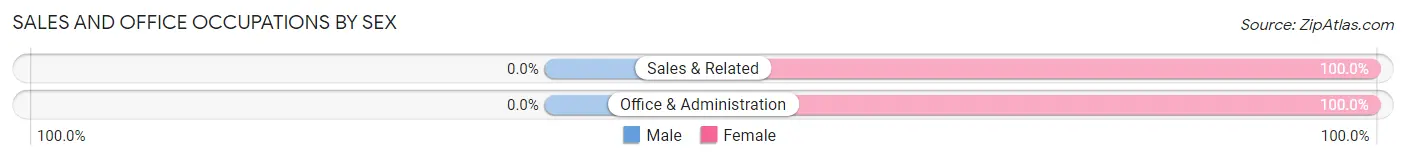
Sales and Office Occupations by Sex
| Occupation | Male | Female |
| Sales & Related | 0 (0.0%) | 4 (100.0%) |
| Office & Administration | 0 (0.0%) | 30 (100.0%) |
| Total (Category) | 0 (0.0%) | 34 (100.0%) |
| Total (Overall) | 341 (59.7%) | 230 (40.3%) |
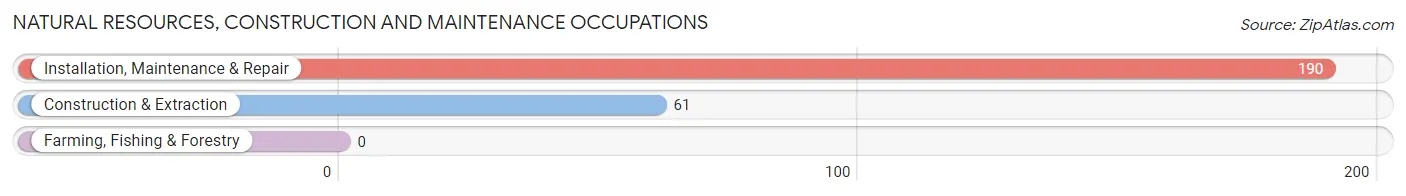
Natural Resources, Construction and Maintenance Occupations
The most common Natural Resources, Construction and Maintenance occupations in Upper Lake are Installation, Maintenance & Repair (190 | 33.3%), and Construction & Extraction (61 | 10.7%).
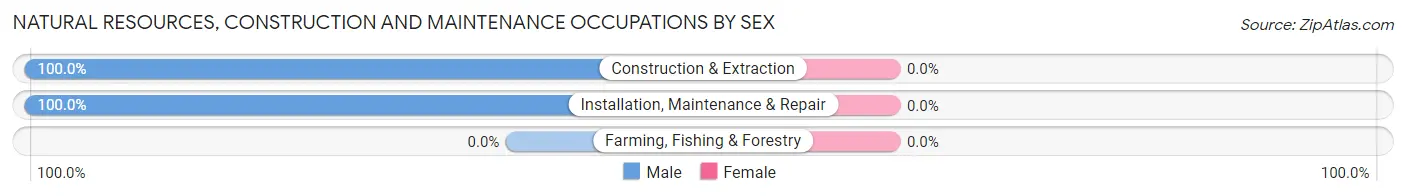
Natural Resources, Construction and Maintenance Occupations by Sex
| Occupation | Male | Female |
| Farming, Fishing & Forestry | 0 (0.0%) | 0 (0.0%) |
| Construction & Extraction | 61 (100.0%) | 0 (0.0%) |
| Installation, Maintenance & Repair | 190 (100.0%) | 0 (0.0%) |
| Total (Category) | 251 (100.0%) | 0 (0.0%) |
| Total (Overall) | 341 (59.7%) | 230 (40.3%) |
Production, Transportation and Moving Occupations
The most common Production, Transportation and Moving occupations in Upper Lake are , and Transportation (117 | 20.5%).
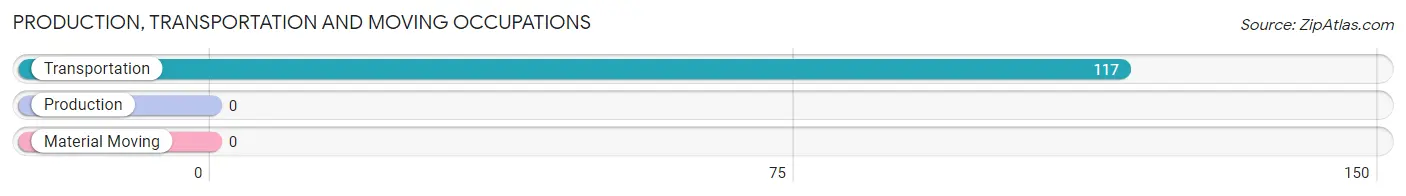
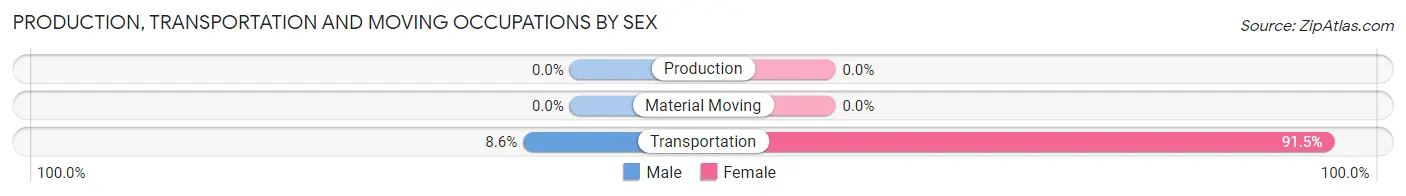
Production, Transportation and Moving Occupations by Sex
| Occupation | Male | Female |
| Production | 0 (0.0%) | 0 (0.0%) |
| Transportation | 10 (8.6%) | 107 (91.4%) |
| Material Moving | 0 (0.0%) | 0 (0.0%) |
| Total (Category) | 10 (8.6%) | 107 (91.4%) |
| Total (Overall) | 341 (59.7%) | 230 (40.3%) |
Employment Industries by Sex in Upper Lake
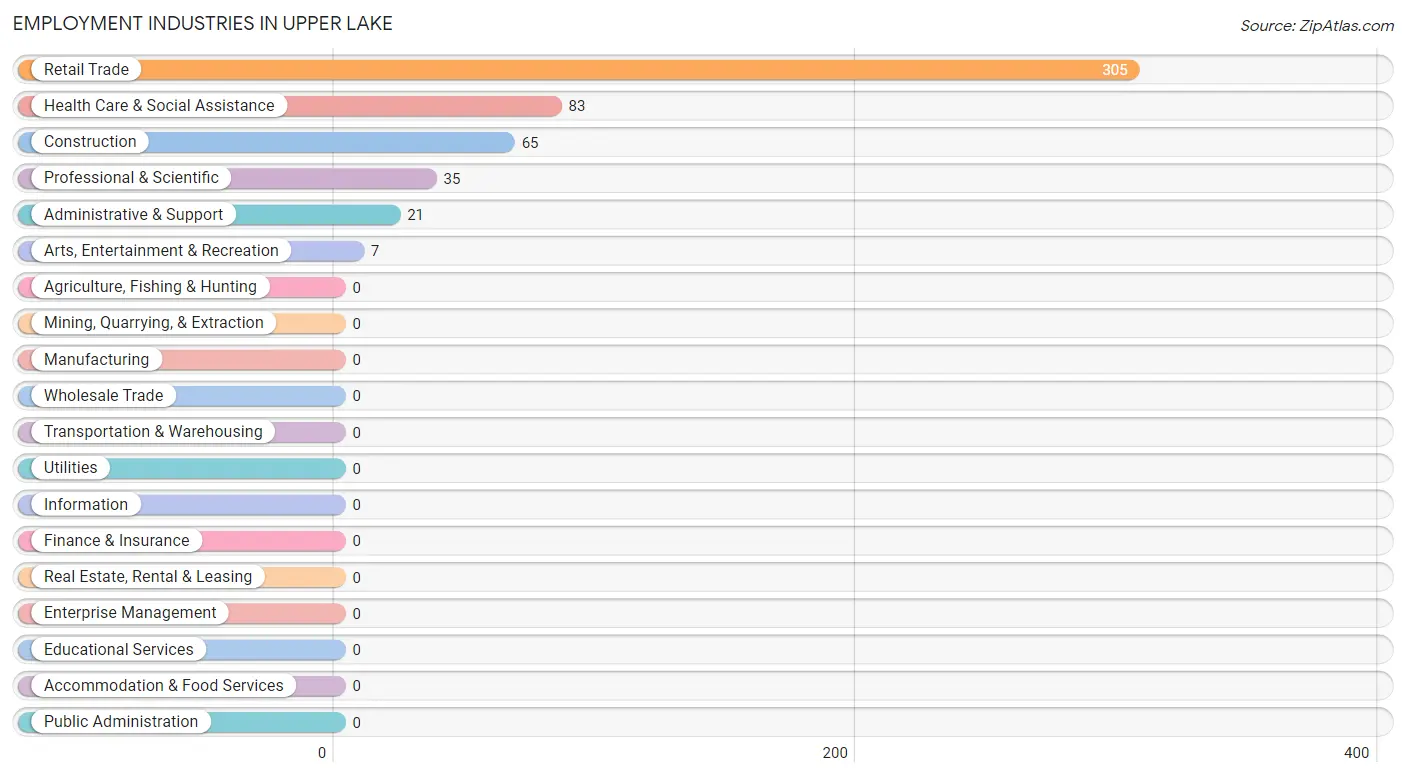
Employment Industries in Upper Lake
The major employment industries in Upper Lake include Retail Trade (305 | 53.4%), Health Care & Social Assistance (83 | 14.5%), Construction (65 | 11.4%), Professional & Scientific (35 | 6.1%), and Administrative & Support (21 | 3.7%).
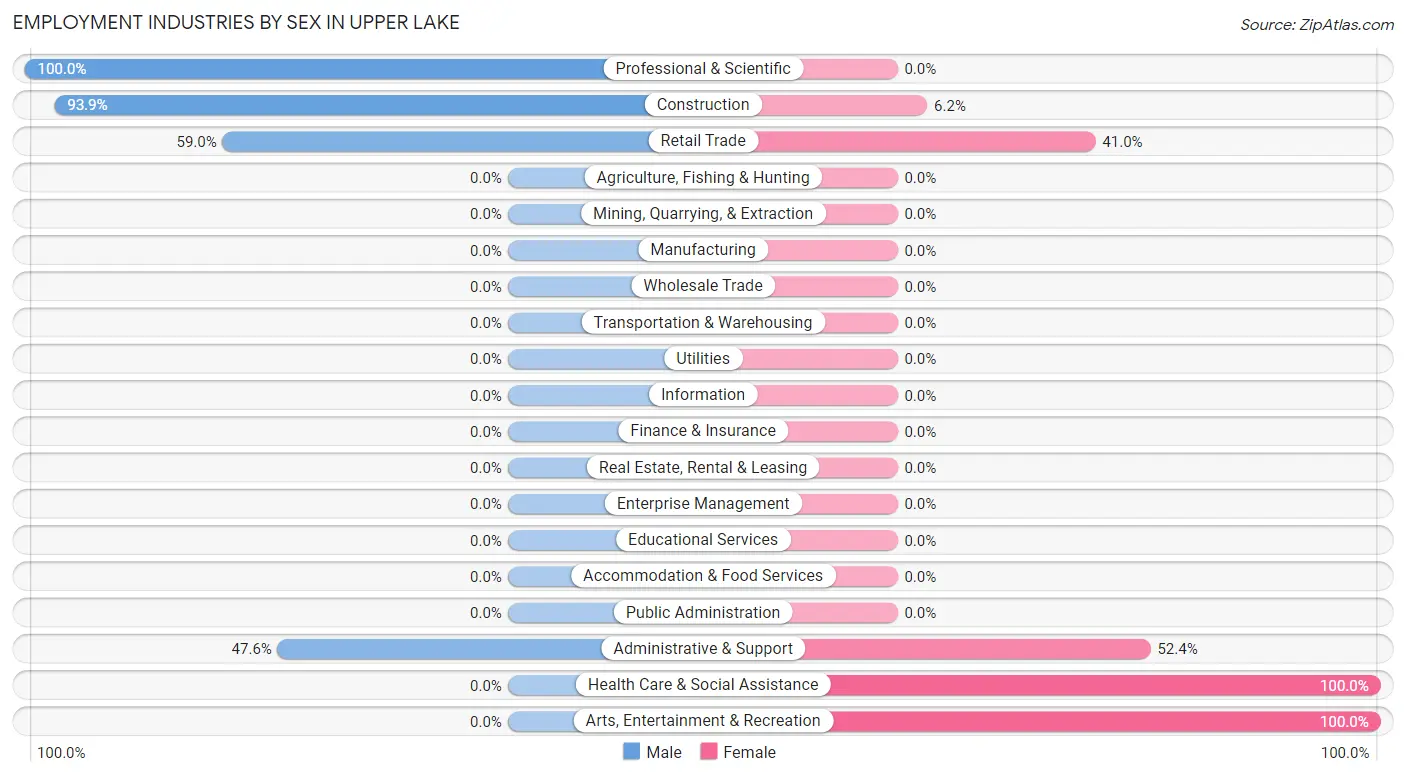
Employment Industries by Sex in Upper Lake
The Upper Lake industries that see more men than women are Professional & Scientific (100.0%), Construction (93.9%), and Retail Trade (59.0%), whereas the industries that tend to have a higher number of women are Health Care & Social Assistance (100.0%), Arts, Entertainment & Recreation (100.0%), and Administrative & Support (52.4%).
| Industry | Male | Female |
| Agriculture, Fishing & Hunting | 0 (0.0%) | 0 (0.0%) |
| Mining, Quarrying, & Extraction | 0 (0.0%) | 0 (0.0%) |
| Construction | 61 (93.9%) | 4 (6.1%) |
| Manufacturing | 0 (0.0%) | 0 (0.0%) |
| Wholesale Trade | 0 (0.0%) | 0 (0.0%) |
| Retail Trade | 180 (59.0%) | 125 (41.0%) |
| Transportation & Warehousing | 0 (0.0%) | 0 (0.0%) |
| Utilities | 0 (0.0%) | 0 (0.0%) |
| Information | 0 (0.0%) | 0 (0.0%) |
| Finance & Insurance | 0 (0.0%) | 0 (0.0%) |
| Real Estate, Rental & Leasing | 0 (0.0%) | 0 (0.0%) |
| Professional & Scientific | 35 (100.0%) | 0 (0.0%) |
| Enterprise Management | 0 (0.0%) | 0 (0.0%) |
| Administrative & Support | 10 (47.6%) | 11 (52.4%) |
| Educational Services | 0 (0.0%) | 0 (0.0%) |
| Health Care & Social Assistance | 0 (0.0%) | 83 (100.0%) |
| Arts, Entertainment & Recreation | 0 (0.0%) | 7 (100.0%) |
| Accommodation & Food Services | 0 (0.0%) | 0 (0.0%) |
| Public Administration | 0 (0.0%) | 0 (0.0%) |
| Total | 341 (59.7%) | 230 (40.3%) |
Education in Upper Lake
School Enrollment in Upper Lake
The most common levels of schooling among the 74 students in Upper Lake are middle school (23 | 31.1%), nursery / preschool (16 | 21.6%), and elementary school (16 | 21.6%).
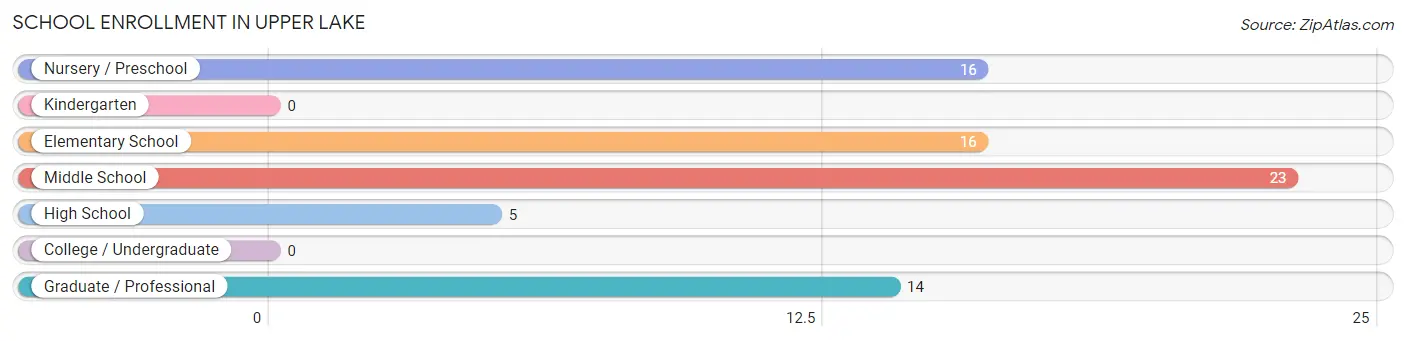
| School Level | # Students | % Students |
| Nursery / Preschool | 16 | 21.6% |
| Kindergarten | 0 | 0.0% |
| Elementary School | 16 | 21.6% |
| Middle School | 23 | 31.1% |
| High School | 5 | 6.8% |
| College / Undergraduate | 0 | 0.0% |
| Graduate / Professional | 14 | 18.9% |
| Total | 74 | 100.0% |
School Enrollment by Age by Funding Source in Upper Lake
Out of a total of 74 students who are enrolled in schools in Upper Lake, 42 (56.8%) attend a private institution, while the remaining 32 (43.2%) are enrolled in public schools. The age group of 3 to 4 year olds has the highest likelihood of being enrolled in private schools, with 16 (100.0% in the age bracket) enrolled. Conversely, the age group of 18 to 19 year olds has the lowest likelihood of being enrolled in a private school, with 5 (100.0% in the age bracket) attending a public institution.
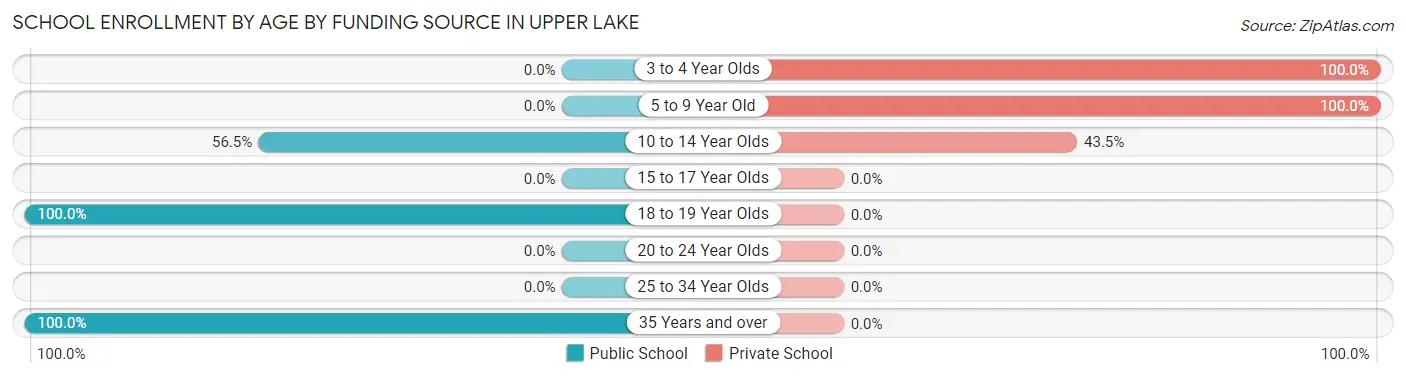
| Age Bracket | Public School | Private School |
| 3 to 4 Year Olds | 0 (0.0%) | 16 (100.0%) |
| 5 to 9 Year Old | 0 (0.0%) | 16 (100.0%) |
| 10 to 14 Year Olds | 13 (56.5%) | 10 (43.5%) |
| 15 to 17 Year Olds | 0 (0.0%) | 0 (0.0%) |
| 18 to 19 Year Olds | 5 (100.0%) | 0 (0.0%) |
| 20 to 24 Year Olds | 0 (0.0%) | 0 (0.0%) |
| 25 to 34 Year Olds | 0 (0.0%) | 0 (0.0%) |
| 35 Years and over | 14 (100.0%) | 0 (0.0%) |
| Total | 32 (43.2%) | 42 (56.8%) |
Educational Attainment by Field of Study in Upper Lake
Business (40 | 64.5%), visual & performing arts (12 | 19.4%), and science & technology (10 | 16.1%) are the most common fields of study among 62 individuals in Upper Lake who have obtained a bachelor's degree or higher.
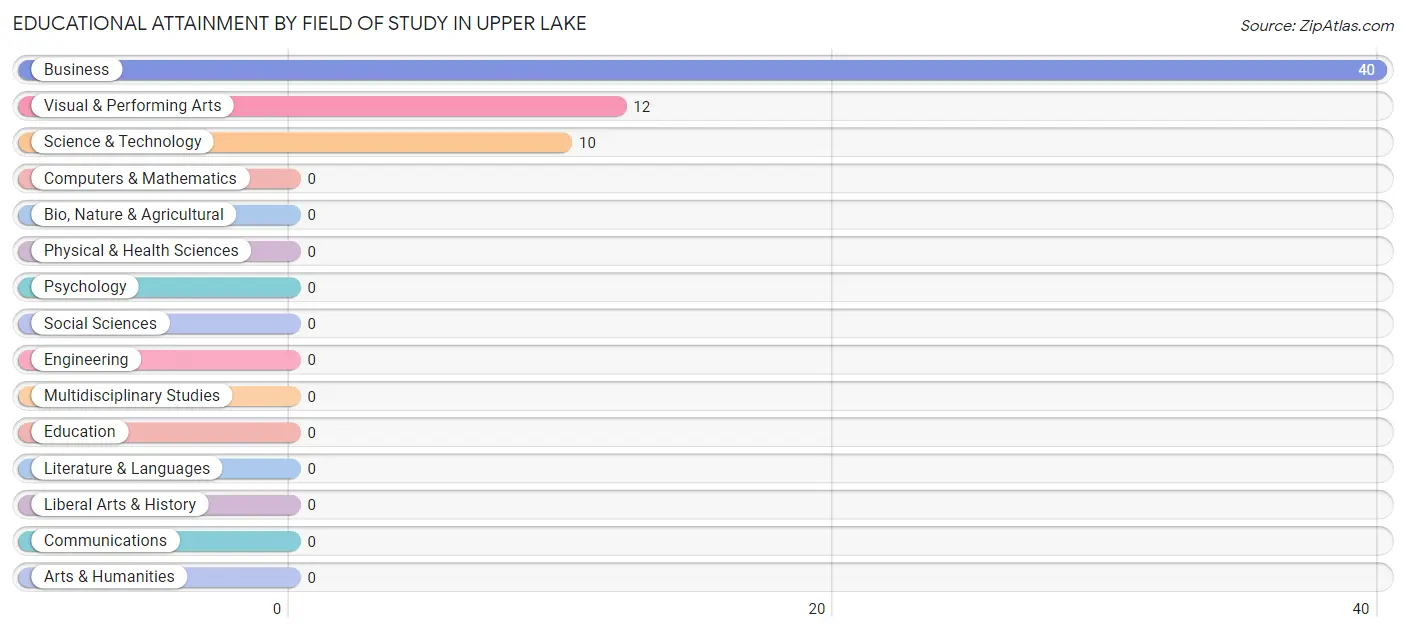
| Field of Study | # Graduates | % Graduates |
| Computers & Mathematics | 0 | 0.0% |
| Bio, Nature & Agricultural | 0 | 0.0% |
| Physical & Health Sciences | 0 | 0.0% |
| Psychology | 0 | 0.0% |
| Social Sciences | 0 | 0.0% |
| Engineering | 0 | 0.0% |
| Multidisciplinary Studies | 0 | 0.0% |
| Science & Technology | 10 | 16.1% |
| Business | 40 | 64.5% |
| Education | 0 | 0.0% |
| Literature & Languages | 0 | 0.0% |
| Liberal Arts & History | 0 | 0.0% |
| Visual & Performing Arts | 12 | 19.4% |
| Communications | 0 | 0.0% |
| Arts & Humanities | 0 | 0.0% |
| Total | 62 | 100.0% |
Transportation & Commute in Upper Lake
Vehicle Availability by Sex in Upper Lake
The most prevalent vehicle ownership categories in Upper Lake are males with 2 vehicles (227, accounting for 63.9%) and females with 2 vehicles (168, making up 100.4%).
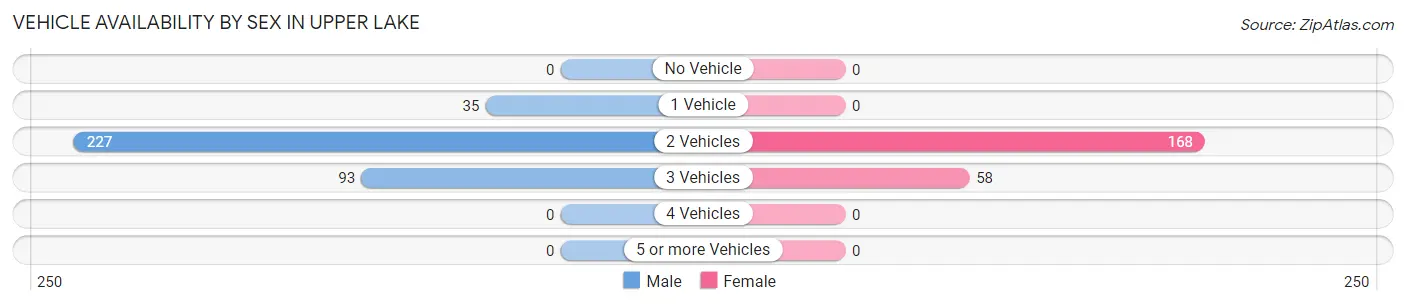
| Vehicles Available | Male | Female |
| No Vehicle | 0 (0.0%) | 0 (0.0%) |
| 1 Vehicle | 35 (9.9%) | 0 (0.0%) |
| 2 Vehicles | 227 (63.9%) | 168 (74.3%) |
| 3 Vehicles | 93 (26.2%) | 58 (25.7%) |
| 4 Vehicles | 0 (0.0%) | 0 (0.0%) |
| 5 or more Vehicles | 0 (0.0%) | 0 (0.0%) |
| Total | 355 (100.0%) | 226 (100.0%) |
Commute Time in Upper Lake
The most frequently occuring commute durations in Upper Lake are 30 to 34 minutes (287 commuters, 53.1%), 20 to 24 minutes (116 commuters, 21.5%), and 45 to 59 minutes (56 commuters, 10.4%).
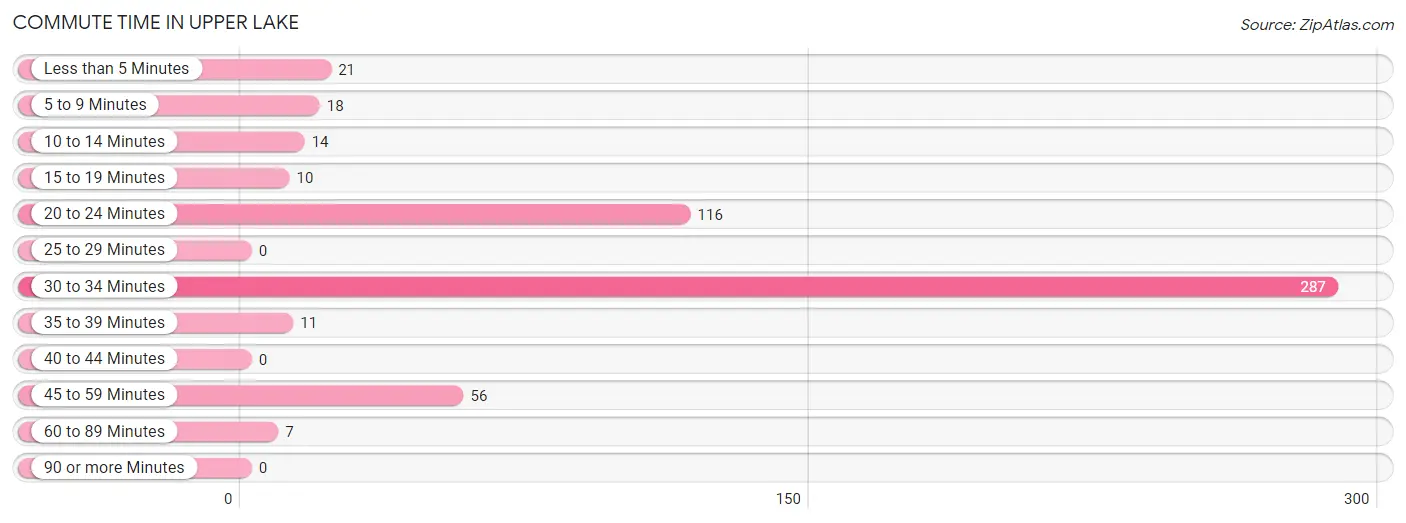
| Commute Time | # Commuters | % Commuters |
| Less than 5 Minutes | 21 | 3.9% |
| 5 to 9 Minutes | 18 | 3.3% |
| 10 to 14 Minutes | 14 | 2.6% |
| 15 to 19 Minutes | 10 | 1.8% |
| 20 to 24 Minutes | 116 | 21.5% |
| 25 to 29 Minutes | 0 | 0.0% |
| 30 to 34 Minutes | 287 | 53.1% |
| 35 to 39 Minutes | 11 | 2.0% |
| 40 to 44 Minutes | 0 | 0.0% |
| 45 to 59 Minutes | 56 | 10.4% |
| 60 to 89 Minutes | 7 | 1.3% |
| 90 or more Minutes | 0 | 0.0% |
Commute Time by Sex in Upper Lake
The most common commute times in Upper Lake are 30 to 34 minutes (180 commuters, 58.1%) for males and 30 to 34 minutes (107 commuters, 46.5%) for females.
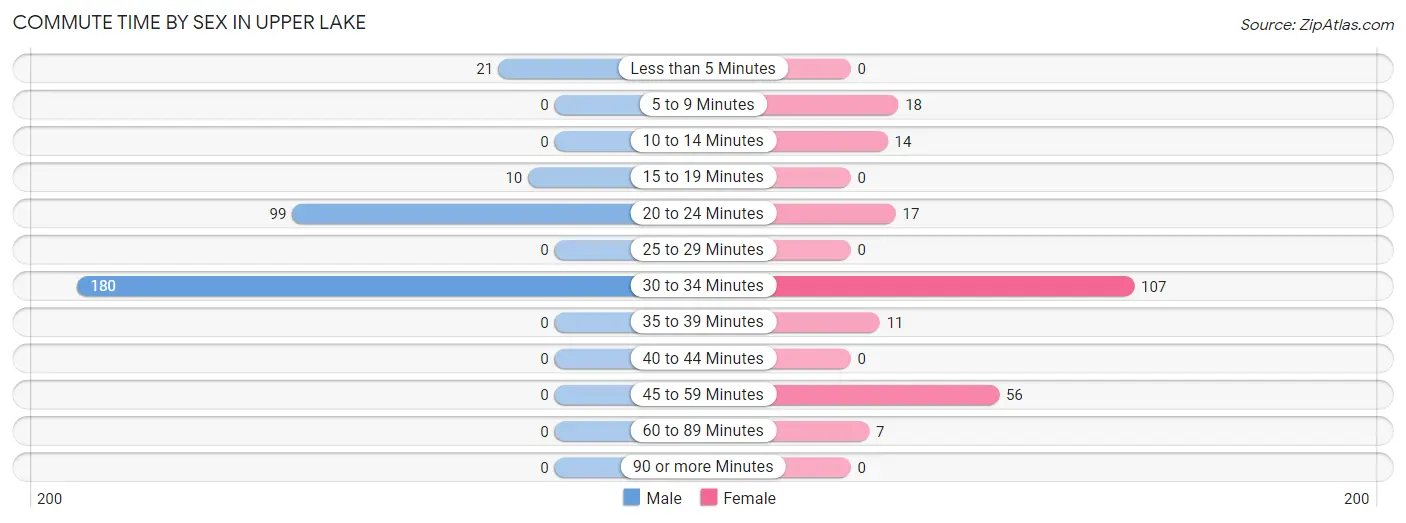
| Commute Time | Male | Female |
| Less than 5 Minutes | 21 (6.8%) | 0 (0.0%) |
| 5 to 9 Minutes | 0 (0.0%) | 18 (7.8%) |
| 10 to 14 Minutes | 0 (0.0%) | 14 (6.1%) |
| 15 to 19 Minutes | 10 (3.2%) | 0 (0.0%) |
| 20 to 24 Minutes | 99 (31.9%) | 17 (7.4%) |
| 25 to 29 Minutes | 0 (0.0%) | 0 (0.0%) |
| 30 to 34 Minutes | 180 (58.1%) | 107 (46.5%) |
| 35 to 39 Minutes | 0 (0.0%) | 11 (4.8%) |
| 40 to 44 Minutes | 0 (0.0%) | 0 (0.0%) |
| 45 to 59 Minutes | 0 (0.0%) | 56 (24.3%) |
| 60 to 89 Minutes | 0 (0.0%) | 7 (3.0%) |
| 90 or more Minutes | 0 (0.0%) | 0 (0.0%) |
Time of Departure to Work by Sex in Upper Lake
The most frequent times of departure to work in Upper Lake are 10:00 AM to 10:59 AM (225, 72.6%) for males and 12:00 PM to 3:59 PM (107, 46.5%) for females.
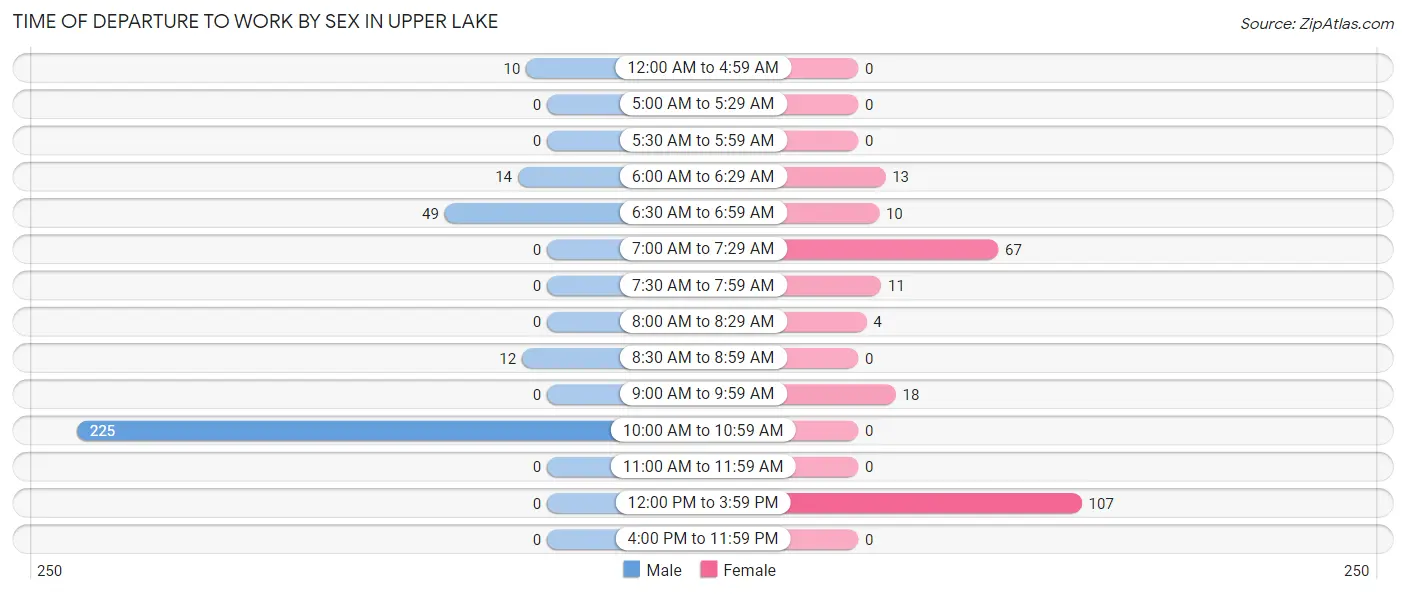
| Time of Departure | Male | Female |
| 12:00 AM to 4:59 AM | 10 (3.2%) | 0 (0.0%) |
| 5:00 AM to 5:29 AM | 0 (0.0%) | 0 (0.0%) |
| 5:30 AM to 5:59 AM | 0 (0.0%) | 0 (0.0%) |
| 6:00 AM to 6:29 AM | 14 (4.5%) | 13 (5.7%) |
| 6:30 AM to 6:59 AM | 49 (15.8%) | 10 (4.3%) |
| 7:00 AM to 7:29 AM | 0 (0.0%) | 67 (29.1%) |
| 7:30 AM to 7:59 AM | 0 (0.0%) | 11 (4.8%) |
| 8:00 AM to 8:29 AM | 0 (0.0%) | 4 (1.7%) |
| 8:30 AM to 8:59 AM | 12 (3.9%) | 0 (0.0%) |
| 9:00 AM to 9:59 AM | 0 (0.0%) | 18 (7.8%) |
| 10:00 AM to 10:59 AM | 225 (72.6%) | 0 (0.0%) |
| 11:00 AM to 11:59 AM | 0 (0.0%) | 0 (0.0%) |
| 12:00 PM to 3:59 PM | 0 (0.0%) | 107 (46.5%) |
| 4:00 PM to 11:59 PM | 0 (0.0%) | 0 (0.0%) |
| Total | 310 (100.0%) | 230 (100.0%) |
Housing Occupancy in Upper Lake
Occupancy by Ownership in Upper Lake
Of the total 398 dwellings in Upper Lake, owner-occupied units account for 369 (92.7%), while renter-occupied units make up 29 (7.3%).
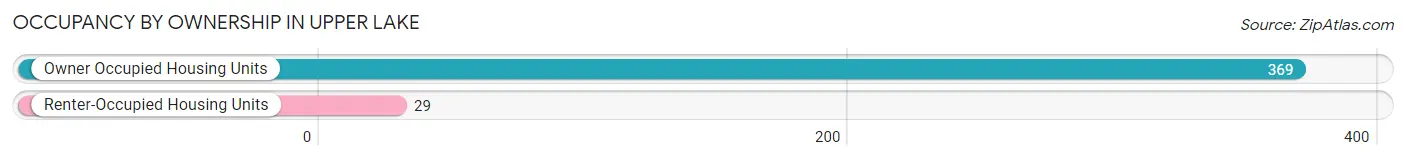
| Occupancy | # Housing Units | % Housing Units |
| Owner Occupied Housing Units | 369 | 92.7% |
| Renter-Occupied Housing Units | 29 | 7.3% |
| Total Occupied Housing Units | 398 | 100.0% |
Occupancy by Household Size in Upper Lake
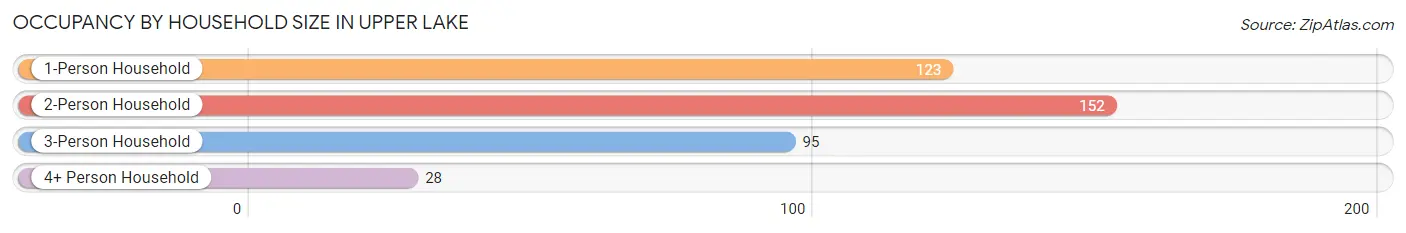
| Household Size | # Housing Units | % Housing Units |
| 1-Person Household | 123 | 30.9% |
| 2-Person Household | 152 | 38.2% |
| 3-Person Household | 95 | 23.9% |
| 4+ Person Household | 28 | 7.0% |
| Total Housing Units | 398 | 100.0% |
Occupancy by Ownership by Household Size in Upper Lake
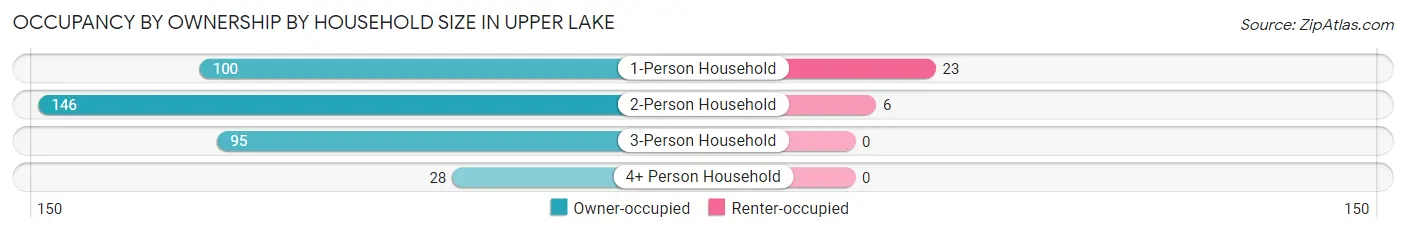
| Household Size | Owner-occupied | Renter-occupied |
| 1-Person Household | 100 (81.3%) | 23 (18.7%) |
| 2-Person Household | 146 (96.1%) | 6 (4.0%) |
| 3-Person Household | 95 (100.0%) | 0 (0.0%) |
| 4+ Person Household | 28 (100.0%) | 0 (0.0%) |
| Total Housing Units | 369 (92.7%) | 29 (7.3%) |
Occupancy by Educational Attainment in Upper Lake
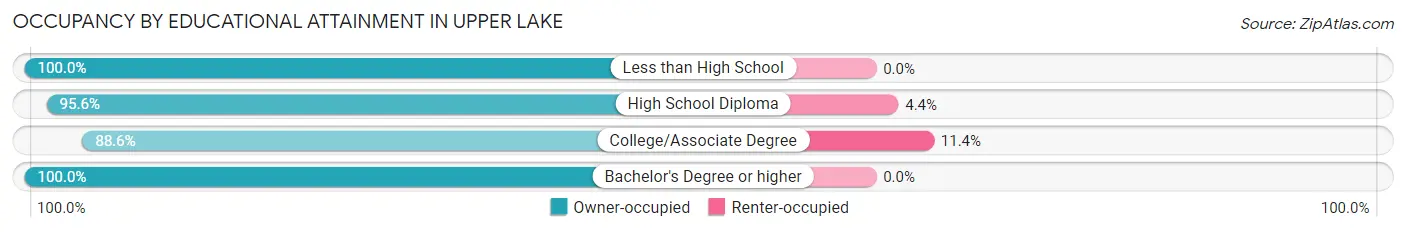
| Household Size | Owner-occupied | Renter-occupied |
| Less than High School | 22 (100.0%) | 0 (0.0%) |
| High School Diploma | 131 (95.6%) | 6 (4.4%) |
| College/Associate Degree | 178 (88.6%) | 23 (11.4%) |
| Bachelor's Degree or higher | 38 (100.0%) | 0 (0.0%) |
Occupancy by Age of Householder in Upper Lake
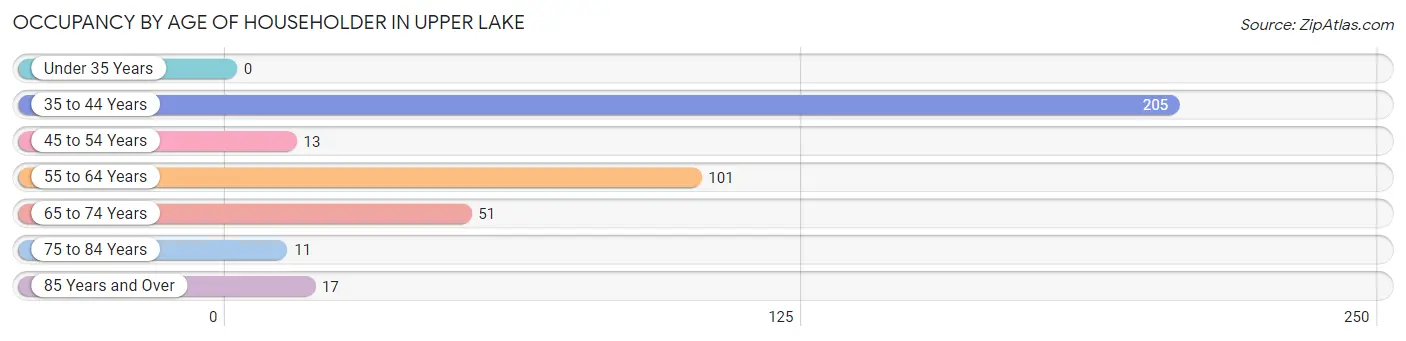
| Age Bracket | # Households | % Households |
| Under 35 Years | 0 | 0.0% |
| 35 to 44 Years | 205 | 51.5% |
| 45 to 54 Years | 13 | 3.3% |
| 55 to 64 Years | 101 | 25.4% |
| 65 to 74 Years | 51 | 12.8% |
| 75 to 84 Years | 11 | 2.8% |
| 85 Years and Over | 17 | 4.3% |
| Total | 398 | 100.0% |
Housing Finances in Upper Lake
Median Income by Occupancy in Upper Lake
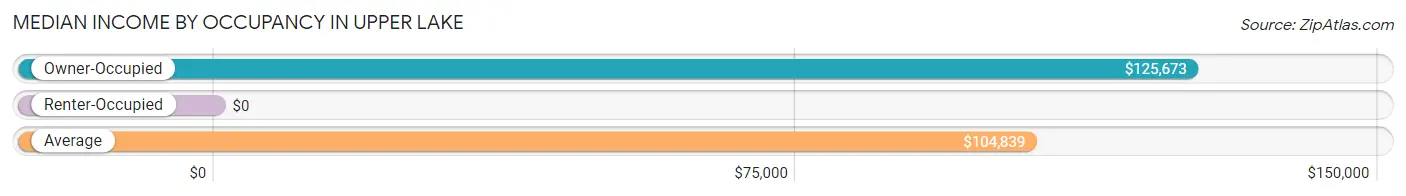
| Occupancy Type | # Households | Median Income |
| Owner-Occupied | 369 (92.7%) | $125,673 |
| Renter-Occupied | 29 (7.3%) | $0 |
| Average | 398 (100.0%) | $104,839 |
Occupancy by Householder Income Bracket in Upper Lake
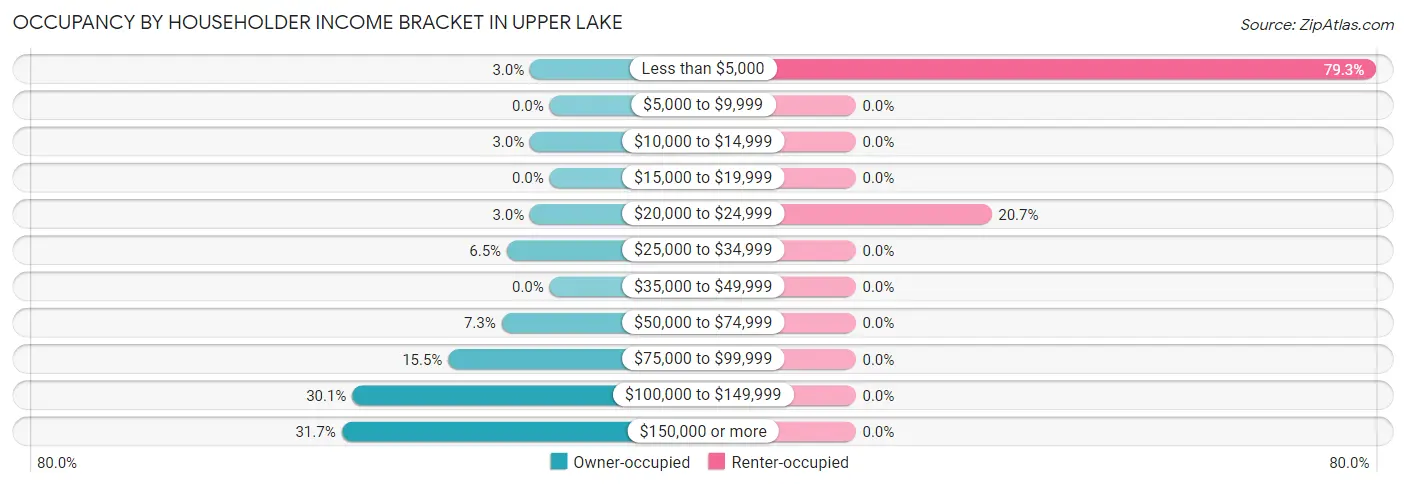
| Income Bracket | Owner-occupied | Renter-occupied |
| Less than $5,000 | 11 (3.0%) | 23 (79.3%) |
| $5,000 to $9,999 | 0 (0.0%) | 0 (0.0%) |
| $10,000 to $14,999 | 11 (3.0%) | 0 (0.0%) |
| $15,000 to $19,999 | 0 (0.0%) | 0 (0.0%) |
| $20,000 to $24,999 | 11 (3.0%) | 6 (20.7%) |
| $25,000 to $34,999 | 24 (6.5%) | 0 (0.0%) |
| $35,000 to $49,999 | 0 (0.0%) | 0 (0.0%) |
| $50,000 to $74,999 | 27 (7.3%) | 0 (0.0%) |
| $75,000 to $99,999 | 57 (15.4%) | 0 (0.0%) |
| $100,000 to $149,999 | 111 (30.1%) | 0 (0.0%) |
| $150,000 or more | 117 (31.7%) | 0 (0.0%) |
| Total | 369 (100.0%) | 29 (100.0%) |
Monthly Housing Cost Tiers in Upper Lake
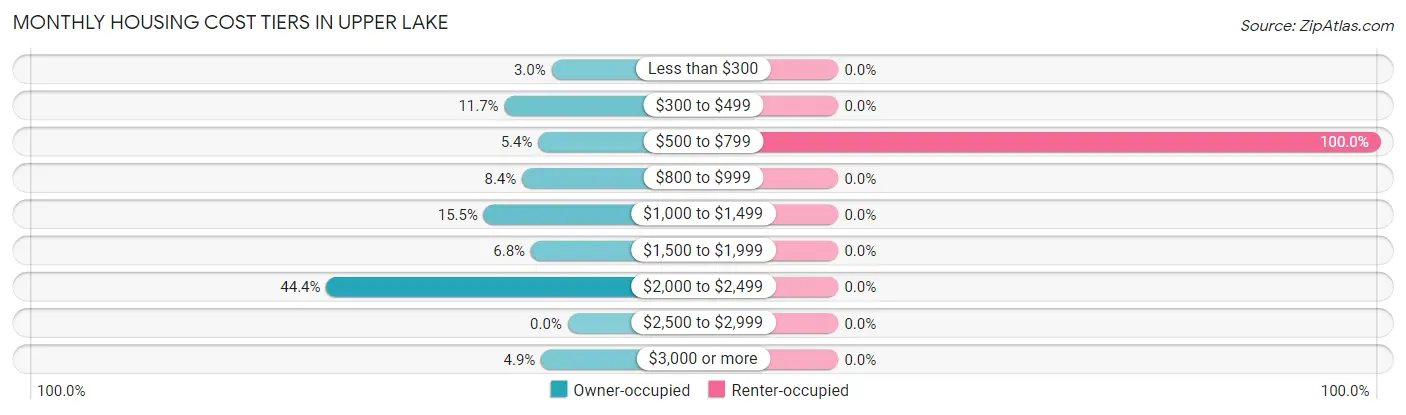
| Monthly Cost | Owner-occupied | Renter-occupied |
| Less than $300 | 11 (3.0%) | 0 (0.0%) |
| $300 to $499 | 43 (11.7%) | 0 (0.0%) |
| $500 to $799 | 20 (5.4%) | 29 (100.0%) |
| $800 to $999 | 31 (8.4%) | 0 (0.0%) |
| $1,000 to $1,499 | 57 (15.4%) | 0 (0.0%) |
| $1,500 to $1,999 | 25 (6.8%) | 0 (0.0%) |
| $2,000 to $2,499 | 164 (44.4%) | 0 (0.0%) |
| $2,500 to $2,999 | 0 (0.0%) | 0 (0.0%) |
| $3,000 or more | 18 (4.9%) | 0 (0.0%) |
| Total | 369 (100.0%) | 29 (100.0%) |
Physical Housing Characteristics in Upper Lake
Housing Structures in Upper Lake
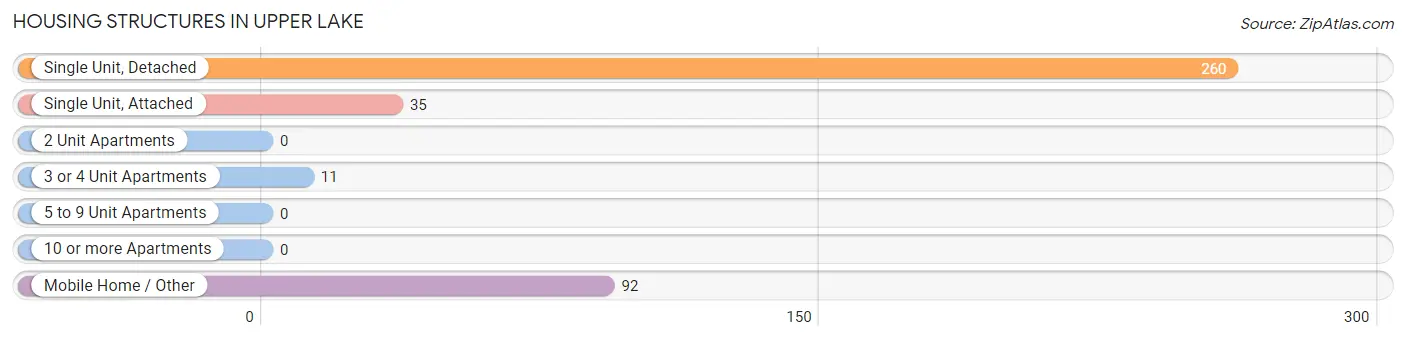
| Structure Type | # Housing Units | % Housing Units |
| Single Unit, Detached | 260 | 65.3% |
| Single Unit, Attached | 35 | 8.8% |
| 2 Unit Apartments | 0 | 0.0% |
| 3 or 4 Unit Apartments | 11 | 2.8% |
| 5 to 9 Unit Apartments | 0 | 0.0% |
| 10 or more Apartments | 0 | 0.0% |
| Mobile Home / Other | 92 | 23.1% |
| Total | 398 | 100.0% |
Housing Structures by Occupancy in Upper Lake
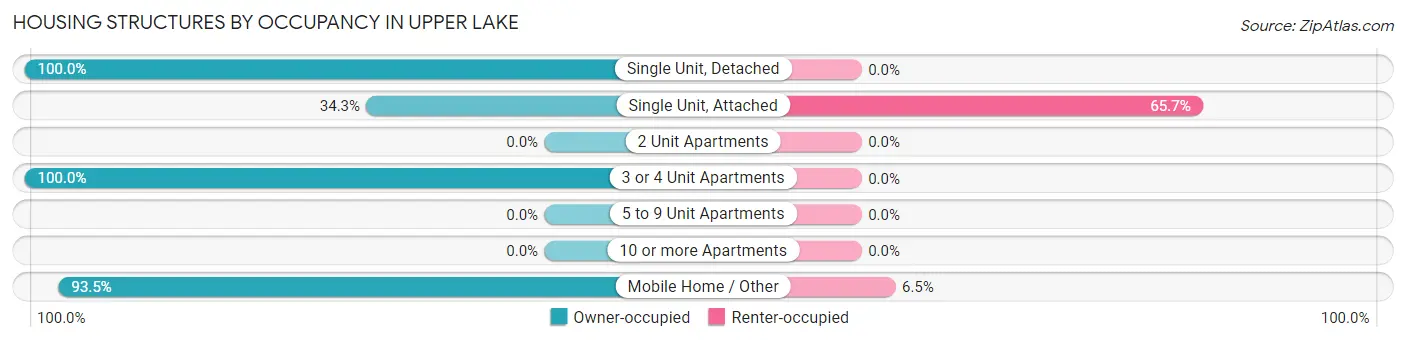
| Structure Type | Owner-occupied | Renter-occupied |
| Single Unit, Detached | 260 (100.0%) | 0 (0.0%) |
| Single Unit, Attached | 12 (34.3%) | 23 (65.7%) |
| 2 Unit Apartments | 0 (0.0%) | 0 (0.0%) |
| 3 or 4 Unit Apartments | 11 (100.0%) | 0 (0.0%) |
| 5 to 9 Unit Apartments | 0 (0.0%) | 0 (0.0%) |
| 10 or more Apartments | 0 (0.0%) | 0 (0.0%) |
| Mobile Home / Other | 86 (93.5%) | 6 (6.5%) |
| Total | 369 (92.7%) | 29 (7.3%) |
Housing Structures by Number of Rooms in Upper Lake
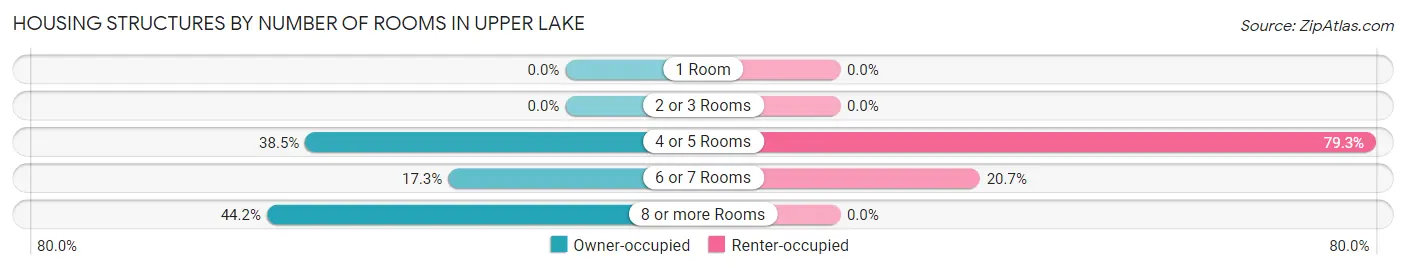
| Number of Rooms | Owner-occupied | Renter-occupied |
| 1 Room | 0 (0.0%) | 0 (0.0%) |
| 2 or 3 Rooms | 0 (0.0%) | 0 (0.0%) |
| 4 or 5 Rooms | 142 (38.5%) | 23 (79.3%) |
| 6 or 7 Rooms | 64 (17.3%) | 6 (20.7%) |
| 8 or more Rooms | 163 (44.2%) | 0 (0.0%) |
| Total | 369 (100.0%) | 29 (100.0%) |
Housing Structure by Heating Type in Upper Lake
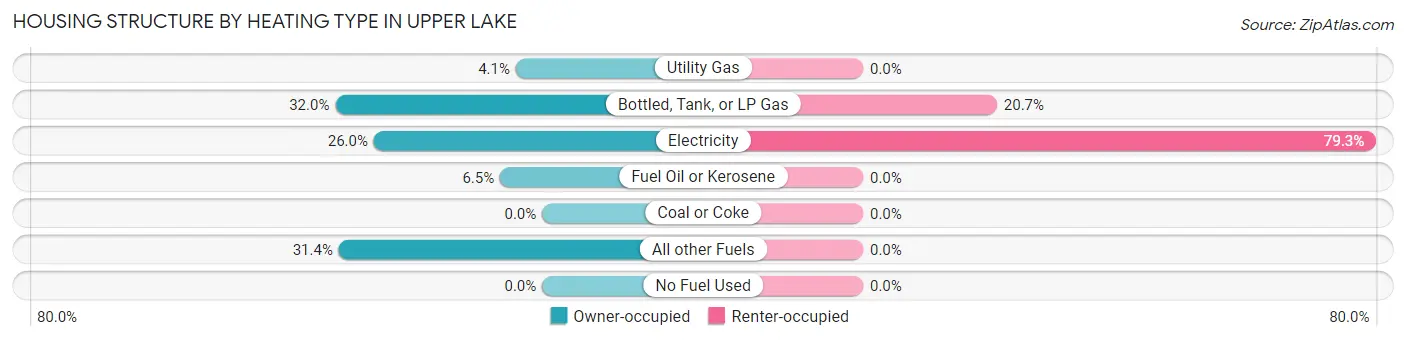
| Heating Type | Owner-occupied | Renter-occupied |
| Utility Gas | 15 (4.1%) | 0 (0.0%) |
| Bottled, Tank, or LP Gas | 118 (32.0%) | 6 (20.7%) |
| Electricity | 96 (26.0%) | 23 (79.3%) |
| Fuel Oil or Kerosene | 24 (6.5%) | 0 (0.0%) |
| Coal or Coke | 0 (0.0%) | 0 (0.0%) |
| All other Fuels | 116 (31.4%) | 0 (0.0%) |
| No Fuel Used | 0 (0.0%) | 0 (0.0%) |
| Total | 369 (100.0%) | 29 (100.0%) |
Household Vehicle Usage in Upper Lake
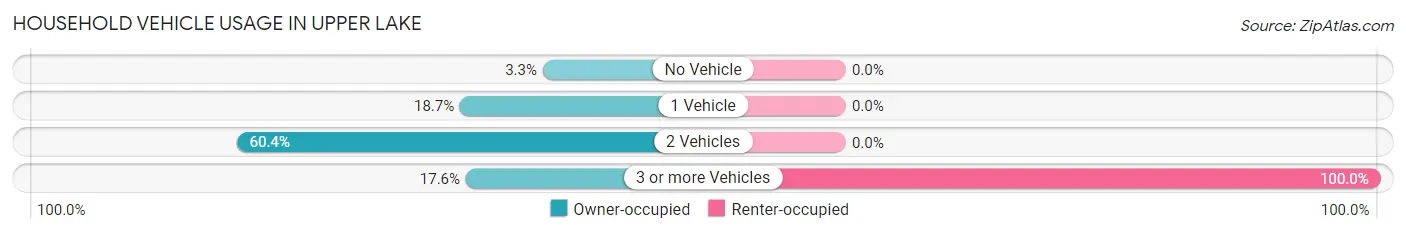
| Vehicles per Household | Owner-occupied | Renter-occupied |
| No Vehicle | 12 (3.3%) | 0 (0.0%) |
| 1 Vehicle | 69 (18.7%) | 0 (0.0%) |
| 2 Vehicles | 223 (60.4%) | 0 (0.0%) |
| 3 or more Vehicles | 65 (17.6%) | 29 (100.0%) |
| Total | 369 (100.0%) | 29 (100.0%) |
Real Estate & Mortgages in Upper Lake
Real Estate and Mortgage Overview in Upper Lake
| Characteristic | Without Mortgage | With Mortgage |
| Housing Units | 105 | 264 |
| Median Property Value | - | - |
| Median Household Income | $103,750 | $117 |
| Monthly Housing Costs | $497 | $18 |
| Real Estate Taxes | - | - |
Property Value by Mortgage Status in Upper Lake
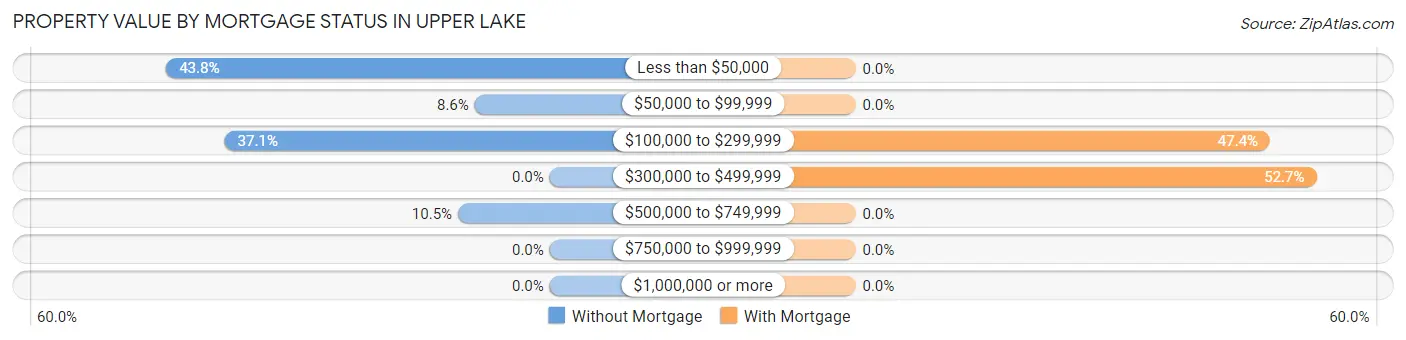
| Property Value | Without Mortgage | With Mortgage |
| Less than $50,000 | 46 (43.8%) | 0 (0.0%) |
| $50,000 to $99,999 | 9 (8.6%) | 0 (0.0%) |
| $100,000 to $299,999 | 39 (37.1%) | 125 (47.3%) |
| $300,000 to $499,999 | 0 (0.0%) | 139 (52.6%) |
| $500,000 to $749,999 | 11 (10.5%) | 0 (0.0%) |
| $750,000 to $999,999 | 0 (0.0%) | 0 (0.0%) |
| $1,000,000 or more | 0 (0.0%) | 0 (0.0%) |
| Total | 105 (100.0%) | 264 (100.0%) |
Household Income by Mortgage Status in Upper Lake
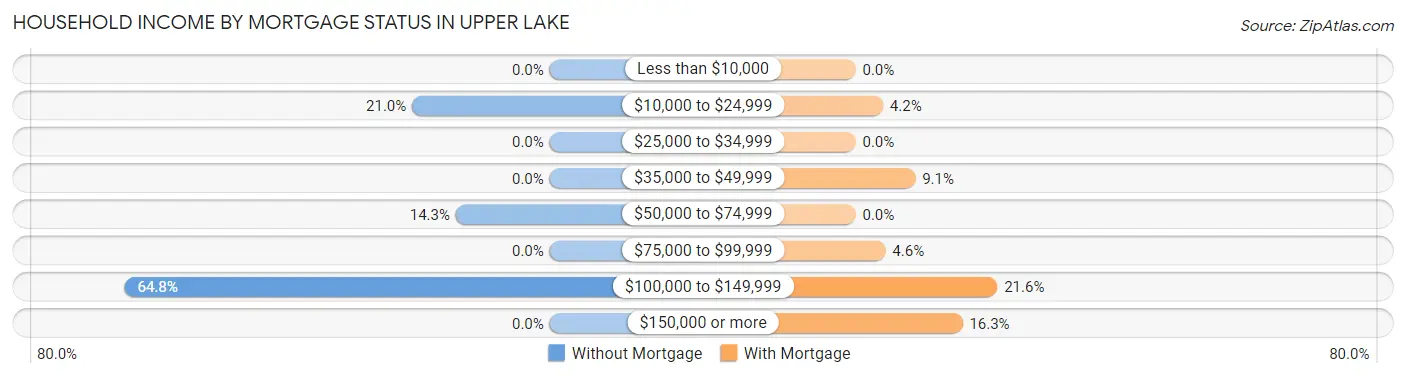
| Household Income | Without Mortgage | With Mortgage |
| Less than $10,000 | 0 (0.0%) | 0 (0.0%) |
| $10,000 to $24,999 | 22 (20.9%) | 11 (4.2%) |
| $25,000 to $34,999 | 0 (0.0%) | 0 (0.0%) |
| $35,000 to $49,999 | 0 (0.0%) | 24 (9.1%) |
| $50,000 to $74,999 | 15 (14.3%) | 0 (0.0%) |
| $75,000 to $99,999 | 0 (0.0%) | 12 (4.5%) |
| $100,000 to $149,999 | 68 (64.8%) | 57 (21.6%) |
| $150,000 or more | 0 (0.0%) | 43 (16.3%) |
| Total | 105 (100.0%) | 264 (100.0%) |
Property Value to Household Income Ratio in Upper Lake
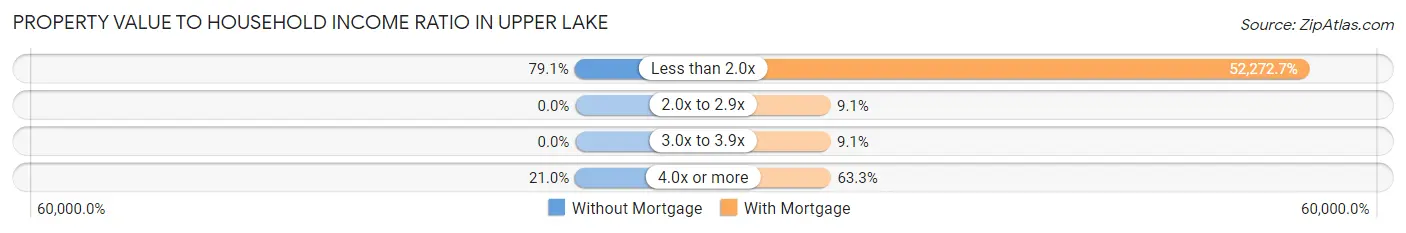
| Value-to-Income Ratio | Without Mortgage | With Mortgage |
| Less than 2.0x | 83 (79.0%) | 138,000 (52,272.7%) |
| 2.0x to 2.9x | 0 (0.0%) | 24 (9.1%) |
| 3.0x to 3.9x | 0 (0.0%) | 24 (9.1%) |
| 4.0x or more | 22 (20.9%) | 167 (63.3%) |
| Total | 105 (100.0%) | 264 (100.0%) |
Real Estate Taxes by Mortgage Status in Upper Lake
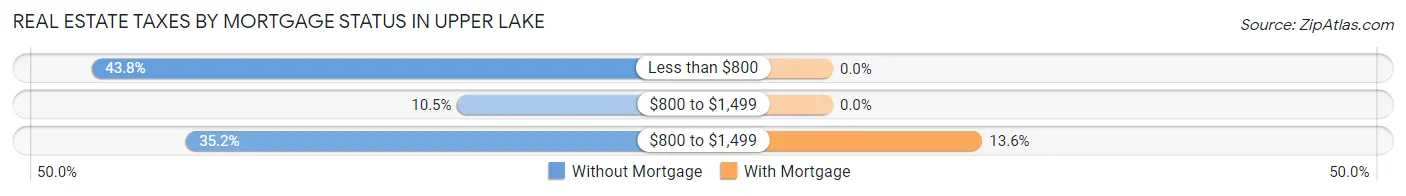
| Property Taxes | Without Mortgage | With Mortgage |
| Less than $800 | 46 (43.8%) | 0 (0.0%) |
| $800 to $1,499 | 11 (10.5%) | 0 (0.0%) |
| $800 to $1,499 | 37 (35.2%) | 36 (13.6%) |
| Total | 105 (100.0%) | 264 (100.0%) |
Health & Disability in Upper Lake
Health Insurance Coverage by Age in Upper Lake
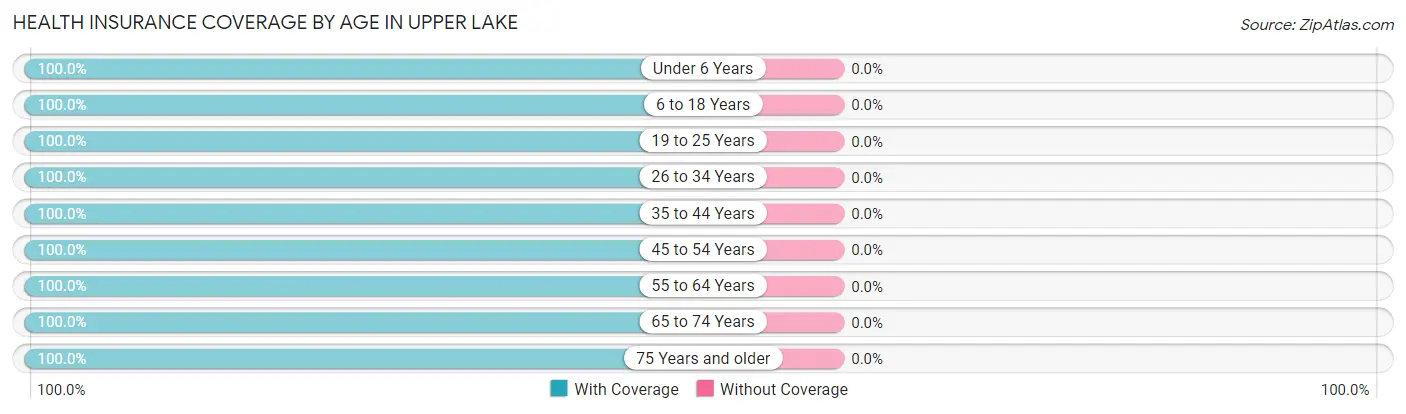
| Age Bracket | With Coverage | Without Coverage |
| Under 6 Years | 63 (100.0%) | 0 (0.0%) |
| 6 to 18 Years | 44 (100.0%) | 0 (0.0%) |
| 19 to 25 Years | 54 (100.0%) | 0 (0.0%) |
| 26 to 34 Years | 33 (100.0%) | 0 (0.0%) |
| 35 to 44 Years | 216 (100.0%) | 0 (0.0%) |
| 45 to 54 Years | 247 (100.0%) | 0 (0.0%) |
| 55 to 64 Years | 118 (100.0%) | 0 (0.0%) |
| 65 to 74 Years | 66 (100.0%) | 0 (0.0%) |
| 75 Years and older | 98 (100.0%) | 0 (0.0%) |
| Total | 939 (100.0%) | 0 (0.0%) |
Health Insurance Coverage by Citizenship Status in Upper Lake
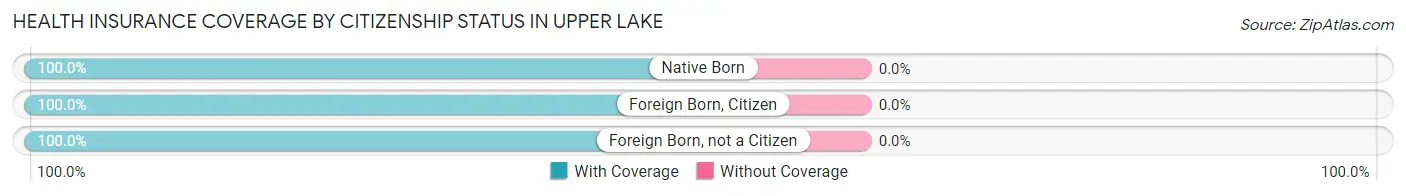
| Citizenship Status | With Coverage | Without Coverage |
| Native Born | 63 (100.0%) | 0 (0.0%) |
| Foreign Born, Citizen | 44 (100.0%) | 0 (0.0%) |
| Foreign Born, not a Citizen | 54 (100.0%) | 0 (0.0%) |
Health Insurance Coverage by Household Income in Upper Lake
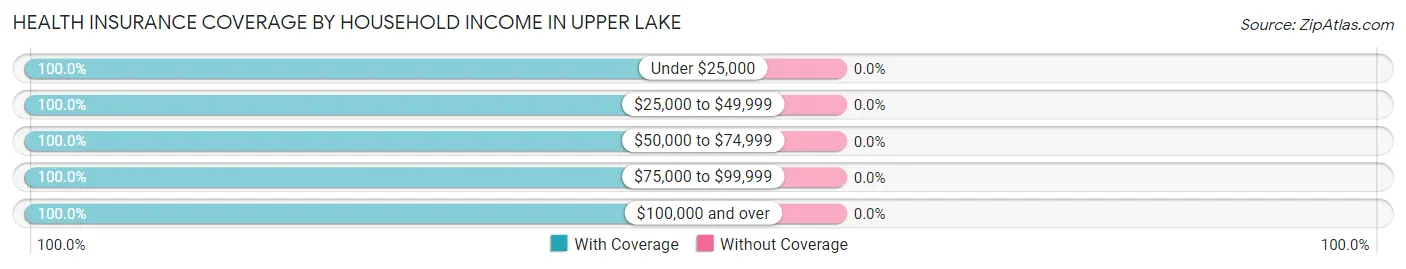
| Household Income | With Coverage | Without Coverage |
| Under $25,000 | 68 (100.0%) | 0 (0.0%) |
| $25,000 to $49,999 | 24 (100.0%) | 0 (0.0%) |
| $50,000 to $74,999 | 42 (100.0%) | 0 (0.0%) |
| $75,000 to $99,999 | 156 (100.0%) | 0 (0.0%) |
| $100,000 and over | 619 (100.0%) | 0 (0.0%) |
Public vs Private Health Insurance Coverage by Age in Upper Lake
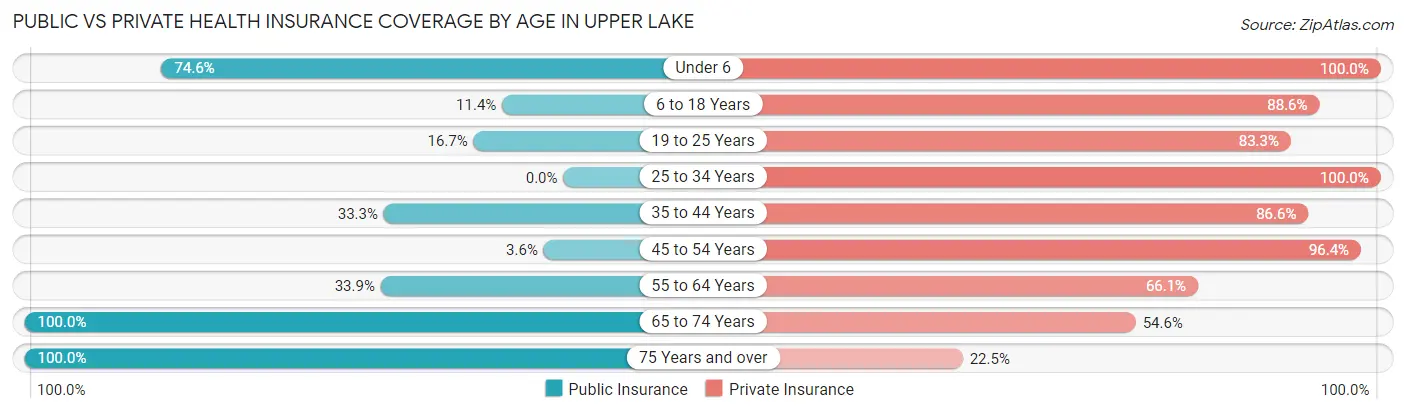
| Age Bracket | Public Insurance | Private Insurance |
| Under 6 | 47 (74.6%) | 63 (100.0%) |
| 6 to 18 Years | 5 (11.4%) | 39 (88.6%) |
| 19 to 25 Years | 9 (16.7%) | 45 (83.3%) |
| 25 to 34 Years | 0 (0.0%) | 33 (100.0%) |
| 35 to 44 Years | 72 (33.3%) | 187 (86.6%) |
| 45 to 54 Years | 9 (3.6%) | 238 (96.4%) |
| 55 to 64 Years | 40 (33.9%) | 78 (66.1%) |
| 65 to 74 Years | 66 (100.0%) | 36 (54.5%) |
| 75 Years and over | 98 (100.0%) | 22 (22.5%) |
| Total | 346 (36.8%) | 741 (78.9%) |
Disability Status by Sex by Age in Upper Lake
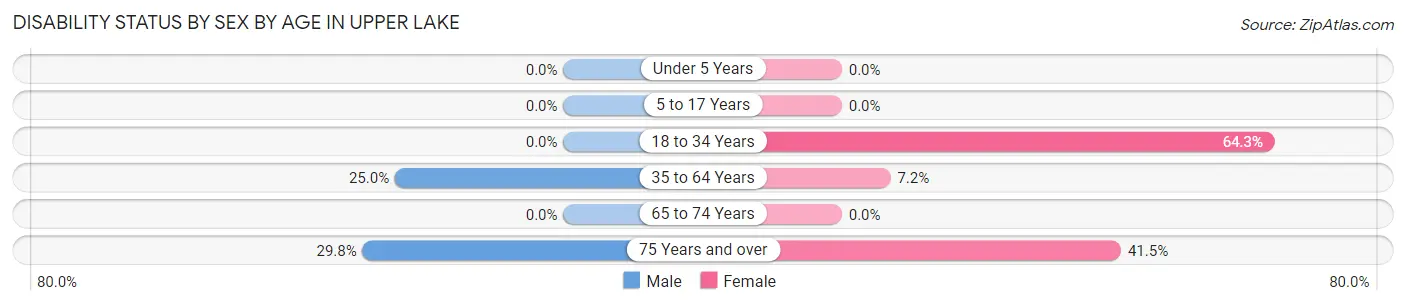
| Age Bracket | Male | Female |
| Under 5 Years | 0 (0.0%) | 0 (0.0%) |
| 5 to 17 Years | 0 (0.0%) | 0 (0.0%) |
| 18 to 34 Years | 0 (0.0%) | 9 (64.3%) |
| 35 to 64 Years | 83 (25.0%) | 18 (7.2%) |
| 65 to 74 Years | 0 (0.0%) | 0 (0.0%) |
| 75 Years and over | 17 (29.8%) | 17 (41.5%) |
Disability Class by Sex by Age in Upper Lake
Disability Class: Hearing Difficulty
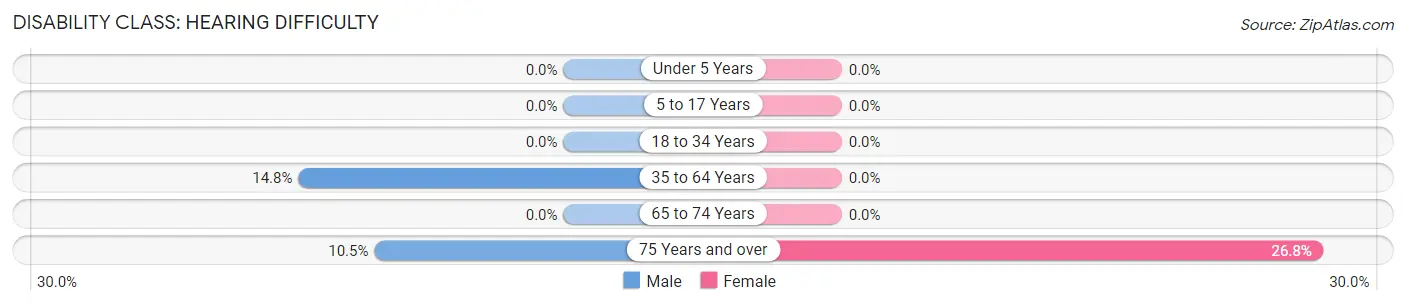
| Age Bracket | Male | Female |
| Under 5 Years | 0 (0.0%) | 0 (0.0%) |
| 5 to 17 Years | 0 (0.0%) | 0 (0.0%) |
| 18 to 34 Years | 0 (0.0%) | 0 (0.0%) |
| 35 to 64 Years | 49 (14.8%) | 0 (0.0%) |
| 65 to 74 Years | 0 (0.0%) | 0 (0.0%) |
| 75 Years and over | 6 (10.5%) | 11 (26.8%) |
Disability Class: Vision Difficulty
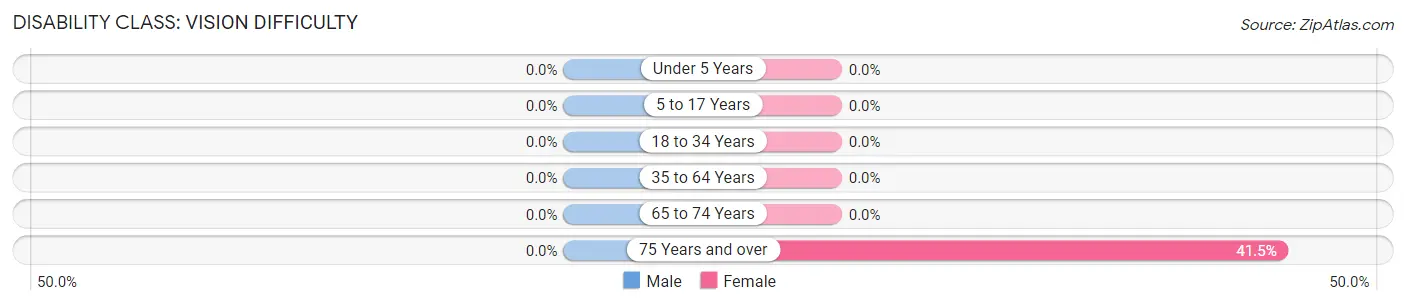
| Age Bracket | Male | Female |
| Under 5 Years | 0 (0.0%) | 0 (0.0%) |
| 5 to 17 Years | 0 (0.0%) | 0 (0.0%) |
| 18 to 34 Years | 0 (0.0%) | 0 (0.0%) |
| 35 to 64 Years | 0 (0.0%) | 0 (0.0%) |
| 65 to 74 Years | 0 (0.0%) | 0 (0.0%) |
| 75 Years and over | 0 (0.0%) | 17 (41.5%) |
Disability Class: Cognitive Difficulty
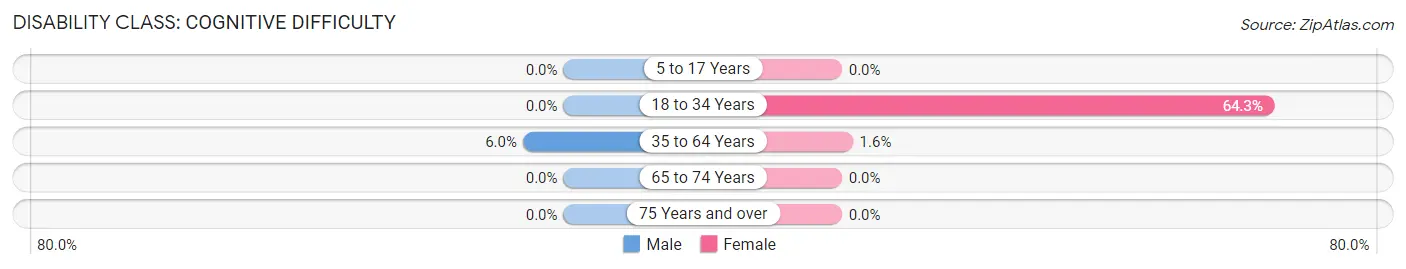
| Age Bracket | Male | Female |
| 5 to 17 Years | 0 (0.0%) | 0 (0.0%) |
| 18 to 34 Years | 0 (0.0%) | 9 (64.3%) |
| 35 to 64 Years | 20 (6.0%) | 4 (1.6%) |
| 65 to 74 Years | 0 (0.0%) | 0 (0.0%) |
| 75 Years and over | 0 (0.0%) | 0 (0.0%) |
Disability Class: Ambulatory Difficulty
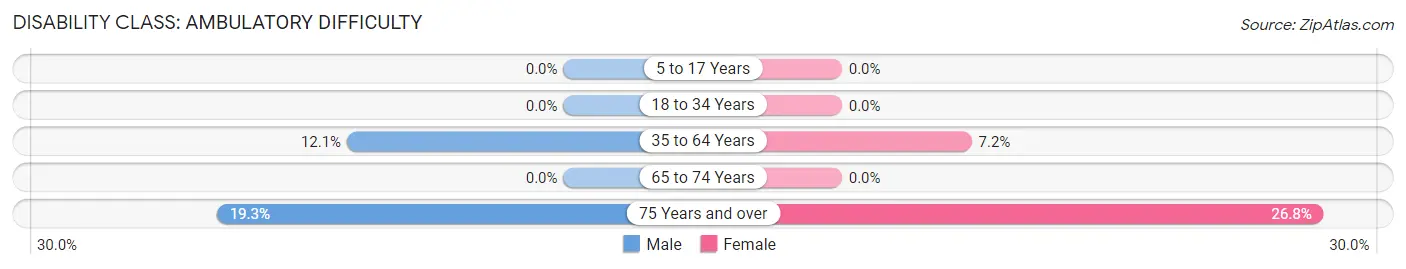
| Age Bracket | Male | Female |
| 5 to 17 Years | 0 (0.0%) | 0 (0.0%) |
| 18 to 34 Years | 0 (0.0%) | 0 (0.0%) |
| 35 to 64 Years | 40 (12.0%) | 18 (7.2%) |
| 65 to 74 Years | 0 (0.0%) | 0 (0.0%) |
| 75 Years and over | 11 (19.3%) | 11 (26.8%) |
Disability Class: Self-Care Difficulty
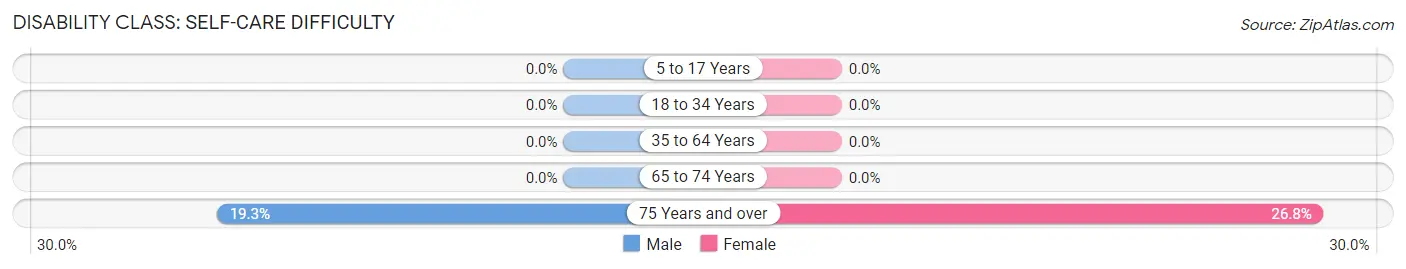
| Age Bracket | Male | Female |
| 5 to 17 Years | 0 (0.0%) | 0 (0.0%) |
| 18 to 34 Years | 0 (0.0%) | 0 (0.0%) |
| 35 to 64 Years | 0 (0.0%) | 0 (0.0%) |
| 65 to 74 Years | 0 (0.0%) | 0 (0.0%) |
| 75 Years and over | 11 (19.3%) | 11 (26.8%) |
Technology Access in Upper Lake
Computing Device Access in Upper Lake
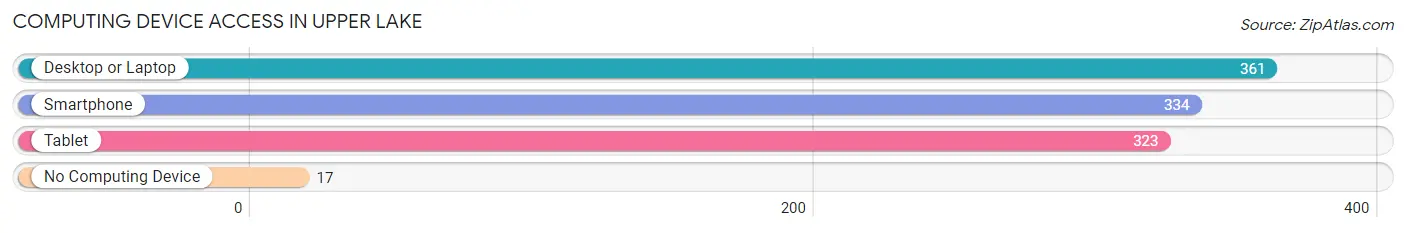
| Device Type | # Households | % Households |
| Desktop or Laptop | 361 | 90.7% |
| Smartphone | 334 | 83.9% |
| Tablet | 323 | 81.2% |
| No Computing Device | 17 | 4.3% |
| Total | 398 | 100.0% |
Internet Access in Upper Lake
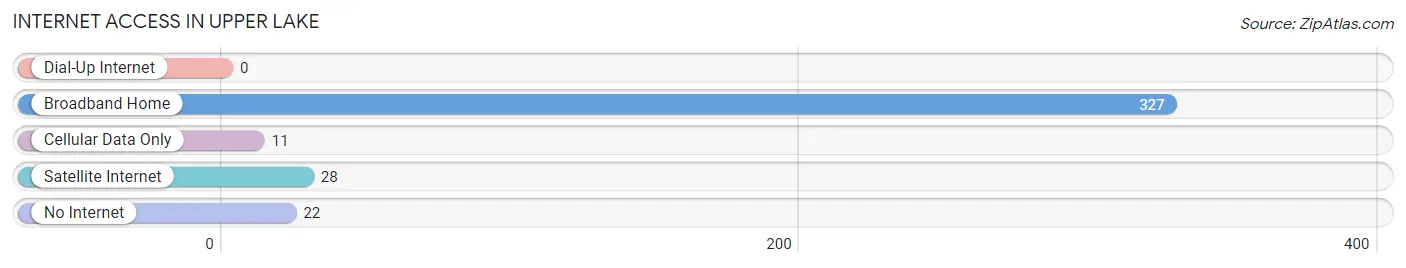
| Internet Type | # Households | % Households |
| Dial-Up Internet | 0 | 0.0% |
| Broadband Home | 327 | 82.2% |
| Cellular Data Only | 11 | 2.8% |
| Satellite Internet | 28 | 7.0% |
| No Internet | 22 | 5.5% |
| Total | 398 | 100.0% |
Upper Lake Summary
Upper Lake is a small town located in Lake County, California, United States. It is situated in the Clear Lake Valley, about 10 miles (16 km) north of Lakeport, the county seat. The population was 1,976 at the 2010 census, up from 1,818 at the 2000 census.
History
Upper Lake was originally inhabited by the Pomo people, who lived in the area for thousands of years before the arrival of European settlers. The first Europeans to settle in the area were the Spanish, who established a mission in nearby Clear Lake in 1823. The area was later settled by American pioneers in the 1850s, and the town of Upper Lake was founded in 1867.
The town was named for its location at the upper end of Clear Lake. It was originally a logging and mill town, and the lumber industry was the main source of employment for many years. In the late 19th century, the town was also a popular tourist destination, with visitors coming to enjoy the lake and the surrounding area.
Geography
Upper Lake is located in the Clear Lake Valley, about 10 miles (16 km) north of Lakeport, the county seat. It is situated at an elevation of 1,541 feet (469 m). The town is surrounded by rolling hills and is located on the western shore of Clear Lake, the largest natural lake in California.
The climate in Upper Lake is Mediterranean, with hot, dry summers and cool, wet winters. The average annual precipitation is 33.5 inches (850 mm).
Economy
The economy of Upper Lake is largely based on tourism and agriculture. The town is a popular destination for visitors who come to enjoy the lake and the surrounding area. The town is also home to several wineries, which produce a variety of wines.
Agriculture is also an important part of the local economy. The area is known for its production of walnuts, pears, apples, and other fruits and vegetables.
Demographics
As of the 2010 census, there were 1,976 people, 790 households, and 517 families residing in the town. The population density was 1,092.3 people per square mile (421.7/km2). There were 890 housing units at an average density of 488.3 per square mile (188.7/km2). The racial makeup of the town was 79.2% White, 0.7% African American, 4.2% Native American, 0.7% Asian, 0.1% Pacific Islander, 11.2% from other races, and 4.7% from two or more races. Hispanic or Latino of any race were 22.2% of the population.
The median income for a household in the town was $35,000, and the median income for a family was $41,250. Males had a median income of $31,250 versus $25,000 for females. The per capita income for the town was $17,845. About 11.2% of families and 15.2% of the population were below the poverty line, including 22.2% of those under age 18 and 8.2% of those age 65 or over.
Common Questions
What is Per Capita Income in Upper Lake?
Per Capita income in Upper Lake is $47,046.
What is the Median Family Income in Upper Lake?
Median Family Income in Upper Lake is $99,821.
What is the Median Household income in Upper Lake?
Median Household Income in Upper Lake is $104,839.
What is Income or Wage Gap in Upper Lake?
Income or Wage Gap in Upper Lake is 5.9%.
Women in Upper Lake earn 94.1 cents for every dollar earned by a man.
What is Inequality or Gini Index in Upper Lake?
Inequality or Gini Index in Upper Lake is 0.28.
What is the Total Population of Upper Lake?
Total Population of Upper Lake is 954.
What is the Total Male Population of Upper Lake?
Total Male Population of Upper Lake is 571.
What is the Total Female Population of Upper Lake?
Total Female Population of Upper Lake is 383.
What is the Ratio of Males per 100 Females in Upper Lake?
There are 149.09 Males per 100 Females in Upper Lake.
What is the Ratio of Females per 100 Males in Upper Lake?
There are 67.08 Females per 100 Males in Upper Lake.
What is the Median Population Age in Upper Lake?
Median Population Age in Upper Lake is 48.3 Years.
What is the Average Family Size in Upper Lake
Average Family Size in Upper Lake is 3.0 People.
What is the Average Household Size in Upper Lake
Average Household Size in Upper Lake is 2.3 People.
How Large is the Labor Force in Upper Lake?
There are 623 People in the Labor Forcein in Upper Lake.
What is the Percentage of People in the Labor Force in Upper Lake?
73.1% of People are in the Labor Force in Upper Lake.
What is the Unemployment Rate in Upper Lake?
Unemployment Rate in Upper Lake is 6.2%.