Ukiah, CA Map & Demographics
Ukiah Map
Ukiah Overview
$34,729
PER CAPITA INCOME
$89,080
AVG FAMILY INCOME
$62,934
AVG HOUSEHOLD INCOME
31.7%
WAGE / INCOME GAP [ % ]
68.3¢/ $1
WAGE / INCOME GAP [ $ ]
$11,254
FAMILY INCOME DEFICIT
0.51
INEQUALITY / GINI INDEX
16,496
TOTAL POPULATION
8,043
MALE POPULATION
8,453
FEMALE POPULATION
95.15
MALES / 100 FEMALES
105.10
FEMALES / 100 MALES
38.9
MEDIAN AGE
3.6
AVG FAMILY SIZE
2.7
AVG HOUSEHOLD SIZE
7,932
LABOR FORCE [ PEOPLE ]
61.9%
PERCENT IN LABOR FORCE
8.4%
UNEMPLOYMENT RATE
Ukiah Zip Codes
Ukiah Area Codes
Income in Ukiah
Income Overview in Ukiah
Per Capita Income in Ukiah is $34,729, while median incomes of families and households are $89,080 and $62,934 respectively.
| Characteristic | Number | Measure |
| Per Capita Income | 16,496 | $34,729 |
| Median Family Income | 3,327 | $89,080 |
| Mean Family Income | 3,327 | $120,514 |
| Median Household Income | 5,885 | $62,934 |
| Mean Household Income | 5,885 | $90,736 |
| Income Deficit | 3,327 | $11,254 |
| Wage / Income Gap (%) | 16,496 | 31.74% |
| Wage / Income Gap ($) | 16,496 | 68.26¢ per $1 |
| Gini / Inequality Index | 16,496 | 0.51 |
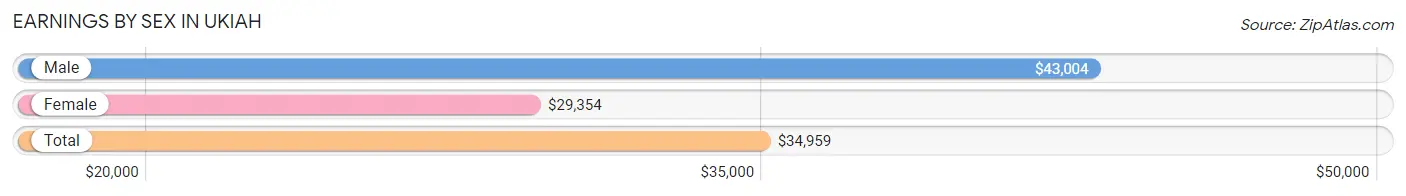
Earnings by Sex in Ukiah
Average Earnings in Ukiah are $34,959, $43,004 for men and $29,354 for women, a difference of 31.7%.
| Sex | Number | Average Earnings |
| Male | 3,906 (49.4%) | $43,004 |
| Female | 4,002 (50.6%) | $29,354 |
| Total | 7,908 (100.0%) | $34,959 |
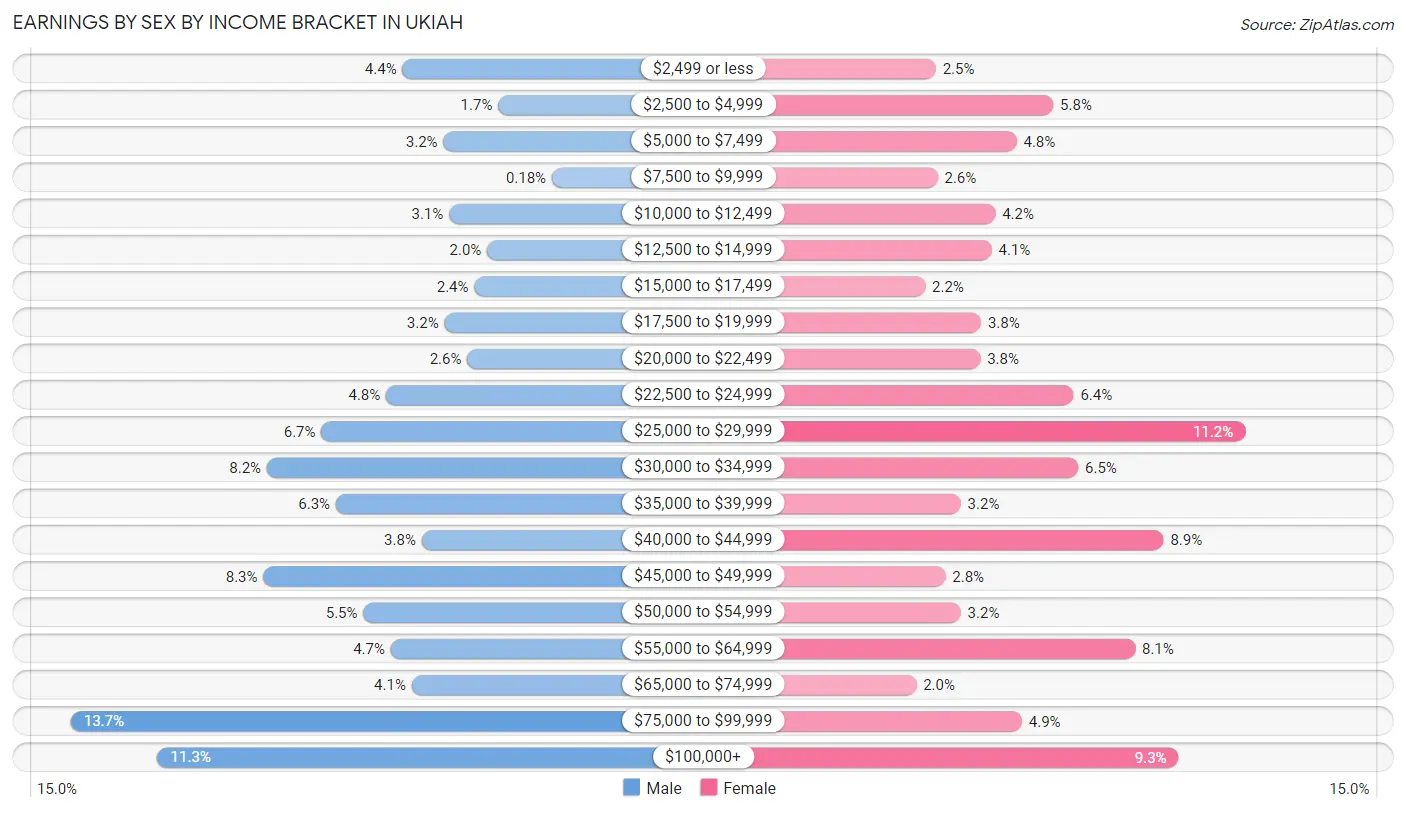
Earnings by Sex by Income Bracket in Ukiah
The most common earnings brackets in Ukiah are $75,000 to $99,999 for men (535 | 13.7%) and $25,000 to $29,999 for women (448 | 11.2%).
| Income | Male | Female |
| $2,499 or less | 171 (4.4%) | 100 (2.5%) |
| $2,500 to $4,999 | 66 (1.7%) | 232 (5.8%) |
| $5,000 to $7,499 | 126 (3.2%) | 191 (4.8%) |
| $7,500 to $9,999 | 7 (0.2%) | 102 (2.5%) |
| $10,000 to $12,499 | 120 (3.1%) | 167 (4.2%) |
| $12,500 to $14,999 | 78 (2.0%) | 163 (4.1%) |
| $15,000 to $17,499 | 92 (2.4%) | 88 (2.2%) |
| $17,500 to $19,999 | 125 (3.2%) | 151 (3.8%) |
| $20,000 to $22,499 | 100 (2.6%) | 150 (3.7%) |
| $22,500 to $24,999 | 189 (4.8%) | 255 (6.4%) |
| $25,000 to $29,999 | 260 (6.7%) | 448 (11.2%) |
| $30,000 to $34,999 | 320 (8.2%) | 260 (6.5%) |
| $35,000 to $39,999 | 244 (6.2%) | 128 (3.2%) |
| $40,000 to $44,999 | 150 (3.8%) | 356 (8.9%) |
| $45,000 to $49,999 | 324 (8.3%) | 111 (2.8%) |
| $50,000 to $54,999 | 214 (5.5%) | 128 (3.2%) |
| $55,000 to $64,999 | 184 (4.7%) | 324 (8.1%) |
| $65,000 to $74,999 | 161 (4.1%) | 78 (1.9%) |
| $75,000 to $99,999 | 535 (13.7%) | 197 (4.9%) |
| $100,000+ | 440 (11.3%) | 373 (9.3%) |
| Total | 3,906 (100.0%) | 4,002 (100.0%) |
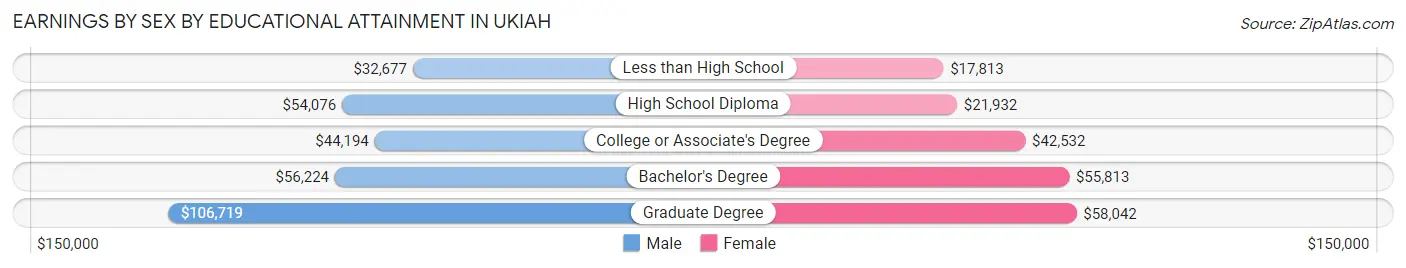
Earnings by Sex by Educational Attainment in Ukiah
Average earnings in Ukiah are $46,107 for men and $34,290 for women, a difference of 25.6%. Men with an educational attainment of graduate degree enjoy the highest average annual earnings of $106,719, while those with less than high school education earn the least with $32,677. Women with an educational attainment of graduate degree earn the most with the average annual earnings of $58,042, while those with less than high school education have the smallest earnings of $17,813.
| Educational Attainment | Male Income | Female Income |
| Less than High School | $32,677 | $17,813 |
| High School Diploma | $54,076 | $21,932 |
| College or Associate's Degree | $44,194 | $42,532 |
| Bachelor's Degree | $56,224 | $55,813 |
| Graduate Degree | $106,719 | $58,042 |
| Total | $46,107 | $34,290 |
Family Income in Ukiah
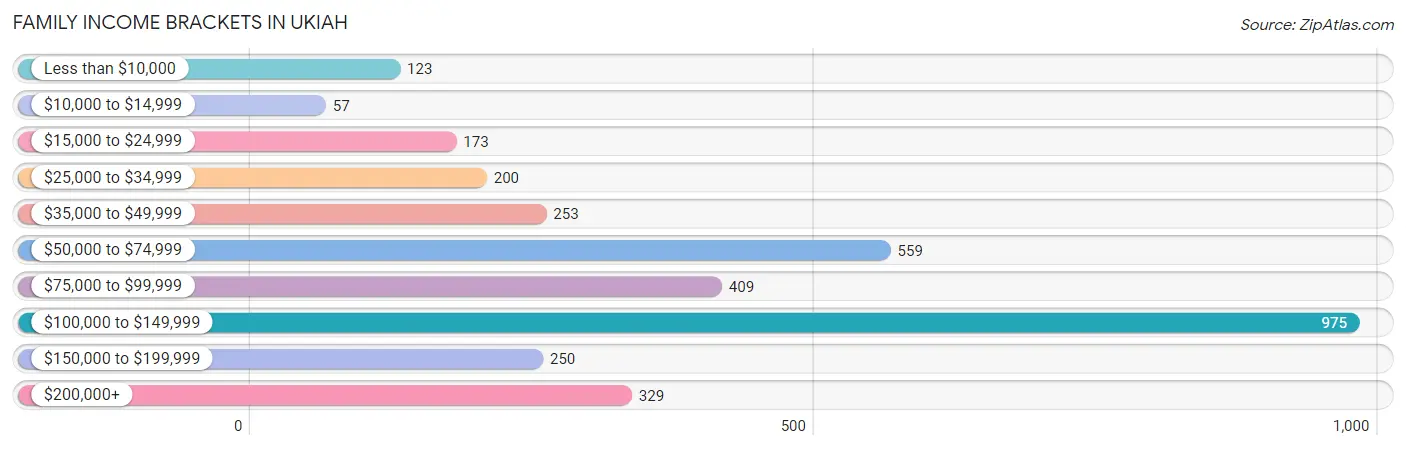
Family Income Brackets in Ukiah
According to the Ukiah family income data, there are 975 families falling into the $100,000 to $149,999 income range, which is the most common income bracket and makes up 29.3% of all families. Conversely, the $10,000 to $14,999 income bracket is the least frequent group with only 57 families (1.7%) belonging to this category.
| Income Bracket | # Families | % Families |
| Less than $10,000 | 123 | 3.7% |
| $10,000 to $14,999 | 57 | 1.7% |
| $15,000 to $24,999 | 173 | 5.2% |
| $25,000 to $34,999 | 200 | 6.0% |
| $35,000 to $49,999 | 253 | 7.6% |
| $50,000 to $74,999 | 559 | 16.8% |
| $75,000 to $99,999 | 409 | 12.3% |
| $100,000 to $149,999 | 975 | 29.3% |
| $150,000 to $199,999 | 250 | 7.5% |
| $200,000+ | 329 | 9.9% |
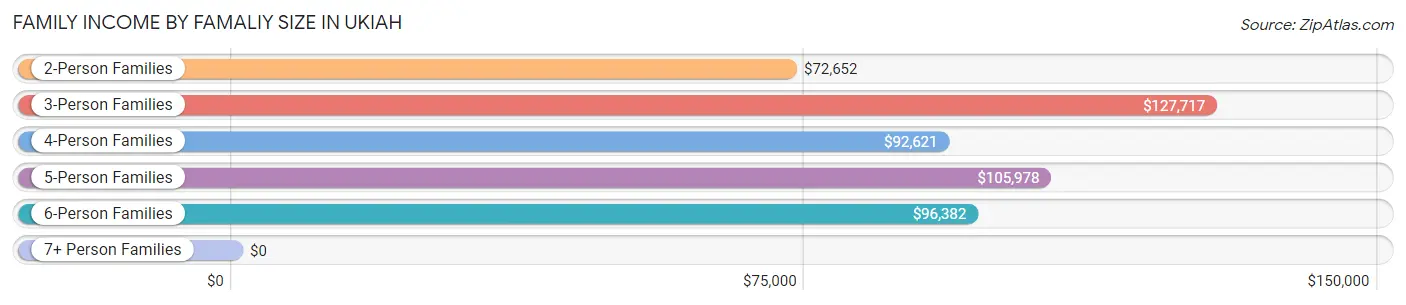
Family Income by Famaliy Size in Ukiah
3-person families (512 | 15.4%) account for the highest median family income in Ukiah with $127,717 per family, while 3-person families (512 | 15.4%) have the highest median income of $42,572 per family member.
| Income Bracket | # Families | Median Income |
| 2-Person Families | 1,467 (44.1%) | $72,652 |
| 3-Person Families | 512 (15.4%) | $127,717 |
| 4-Person Families | 689 (20.7%) | $92,621 |
| 5-Person Families | 451 (13.6%) | $105,978 |
| 6-Person Families | 141 (4.2%) | $96,382 |
| 7+ Person Families | 67 (2.0%) | $0 |
| Total | 3,327 (100.0%) | $89,080 |
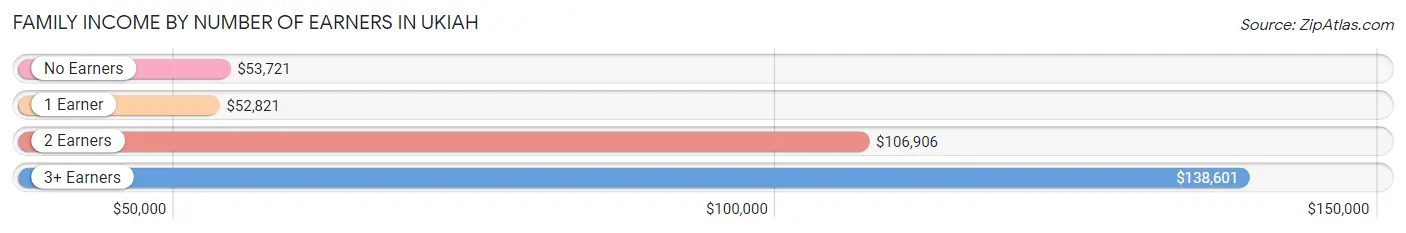
Family Income by Number of Earners in Ukiah
The median family income in Ukiah is $89,080, with families comprising 3+ earners (407) having the highest median family income of $138,601, while families with 1 earner (893) have the lowest median family income of $52,821, accounting for 12.2% and 26.8% of families, respectively.
| Number of Earners | # Families | Median Income |
| No Earners | 572 (17.2%) | $53,721 |
| 1 Earner | 893 (26.8%) | $52,821 |
| 2 Earners | 1,455 (43.7%) | $106,906 |
| 3+ Earners | 407 (12.2%) | $138,601 |
| Total | 3,327 (100.0%) | $89,080 |
Household Income in Ukiah
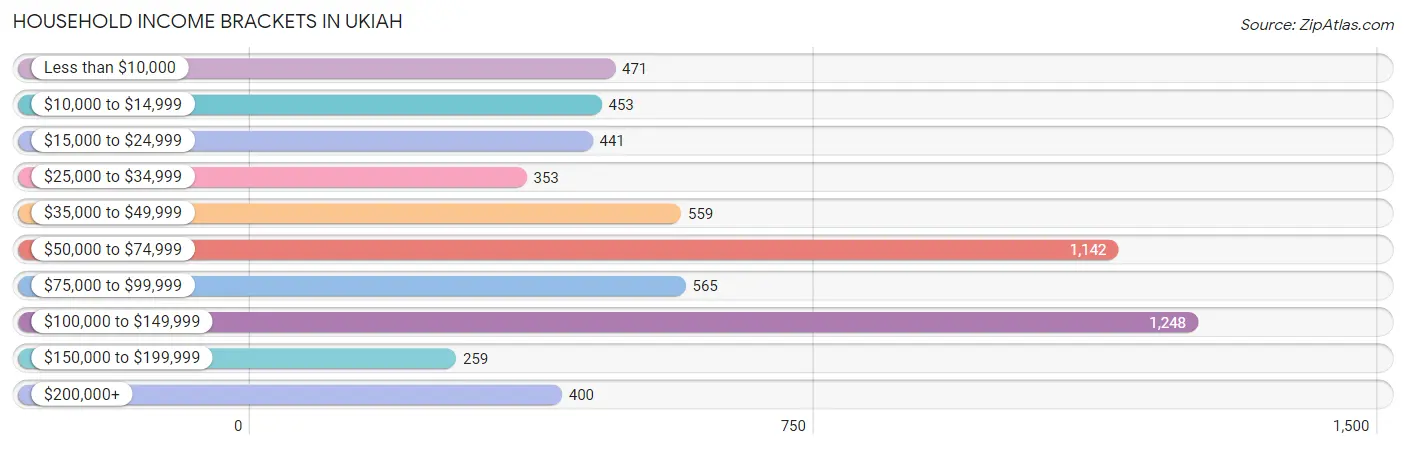
Household Income Brackets in Ukiah
With 1,248 households falling in the category, the $100,000 to $149,999 income range is the most frequent in Ukiah, accounting for 21.2% of all households. In contrast, only 259 households (4.4%) fall into the $150,000 to $199,999 income bracket, making it the least populous group.
| Income Bracket | # Households | % Households |
| Less than $10,000 | 471 | 8.0% |
| $10,000 to $14,999 | 453 | 7.7% |
| $15,000 to $24,999 | 441 | 7.5% |
| $25,000 to $34,999 | 353 | 6.0% |
| $35,000 to $49,999 | 559 | 9.5% |
| $50,000 to $74,999 | 1,142 | 19.4% |
| $75,000 to $99,999 | 565 | 9.6% |
| $100,000 to $149,999 | 1,248 | 21.2% |
| $150,000 to $199,999 | 259 | 4.4% |
| $200,000+ | 400 | 6.8% |
Household Income by Householder Age in Ukiah
The median household income in Ukiah is $62,934, with the highest median household income of $77,414 found in the 25 to 44 years age bracket for the primary householder. A total of 1,842 households (31.3%) fall into this category. Meanwhile, the 15 to 24 years age bracket for the primary householder has the lowest median household income of $0, with 58 households (1.0%) in this group.
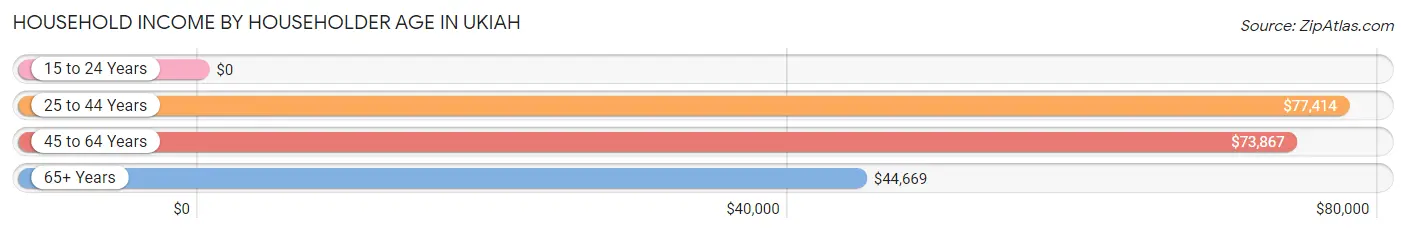
| Income Bracket | # Households | Median Income |
| 15 to 24 Years | 58 (1.0%) | $0 |
| 25 to 44 Years | 1,842 (31.3%) | $77,414 |
| 45 to 64 Years | 2,034 (34.6%) | $73,867 |
| 65+ Years | 1,951 (33.2%) | $44,669 |
| Total | 5,885 (100.0%) | $62,934 |
Poverty in Ukiah
Income Below Poverty by Sex and Age in Ukiah
With 18.2% poverty level for males and 15.4% for females among the residents of Ukiah, 5 year old males and under 5 year old females are the most vulnerable to poverty, with 71 males (40.1%) and 82 females (23.8%) in their respective age groups living below the poverty level.
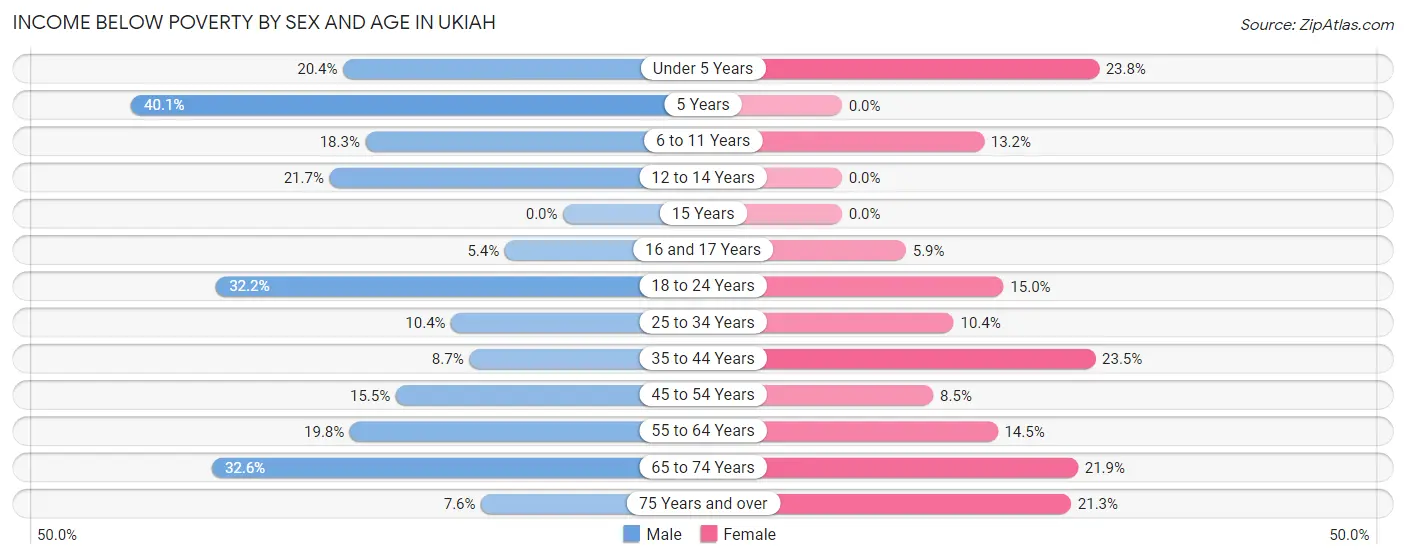
| Age Bracket | Male | Female |
| Under 5 Years | 118 (20.4%) | 82 (23.8%) |
| 5 Years | 71 (40.1%) | 0 (0.0%) |
| 6 to 11 Years | 108 (18.3%) | 129 (13.2%) |
| 12 to 14 Years | 98 (21.7%) | 0 (0.0%) |
| 15 Years | 0 (0.0%) | 0 (0.0%) |
| 16 and 17 Years | 10 (5.4%) | 18 (5.9%) |
| 18 to 24 Years | 201 (32.2%) | 90 (15.0%) |
| 25 to 34 Years | 101 (10.4%) | 85 (10.4%) |
| 35 to 44 Years | 90 (8.7%) | 343 (23.5%) |
| 45 to 54 Years | 139 (15.5%) | 82 (8.5%) |
| 55 to 64 Years | 191 (19.8%) | 136 (14.4%) |
| 65 to 74 Years | 242 (32.6%) | 191 (21.9%) |
| 75 Years and over | 35 (7.6%) | 118 (21.3%) |
| Total | 1,404 (18.2%) | 1,274 (15.4%) |
Income Above Poverty by Sex and Age in Ukiah
According to the poverty statistics in Ukiah, males aged 15 years and females aged 5 years are the age groups that are most secure financially, with 100.0% of males and 100.0% of females in these age groups living above the poverty line.
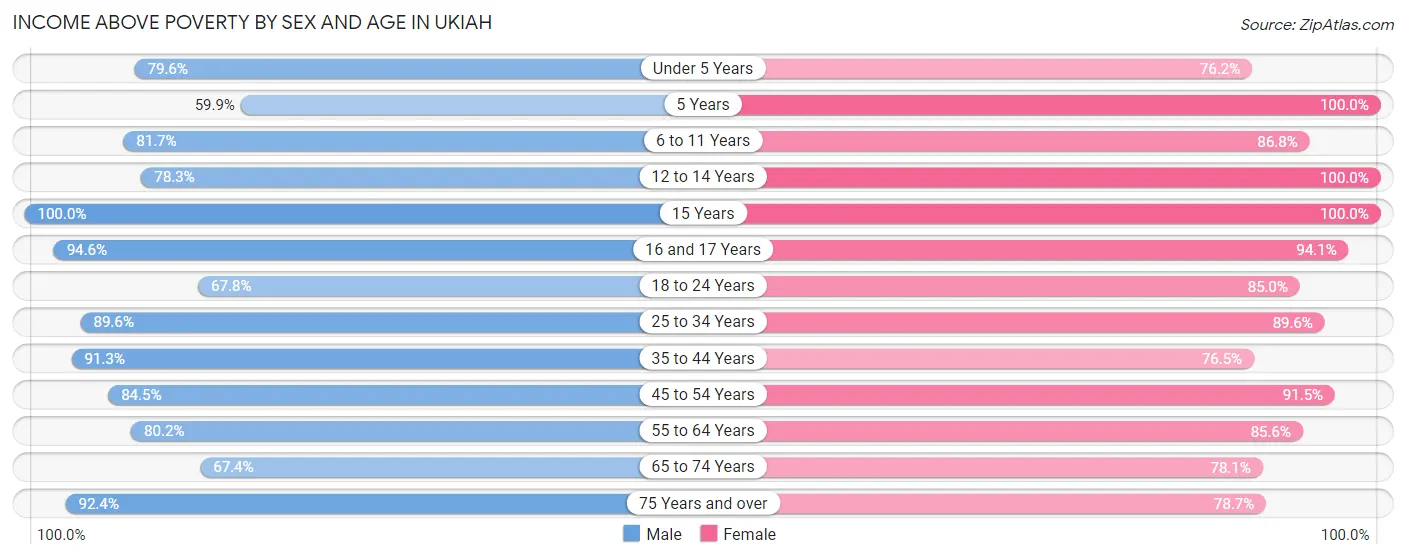
| Age Bracket | Male | Female |
| Under 5 Years | 460 (79.6%) | 262 (76.2%) |
| 5 Years | 106 (59.9%) | 55 (100.0%) |
| 6 to 11 Years | 481 (81.7%) | 850 (86.8%) |
| 12 to 14 Years | 354 (78.3%) | 186 (100.0%) |
| 15 Years | 49 (100.0%) | 195 (100.0%) |
| 16 and 17 Years | 175 (94.6%) | 285 (94.1%) |
| 18 to 24 Years | 423 (67.8%) | 510 (85.0%) |
| 25 to 34 Years | 871 (89.6%) | 735 (89.6%) |
| 35 to 44 Years | 943 (91.3%) | 1,116 (76.5%) |
| 45 to 54 Years | 756 (84.5%) | 885 (91.5%) |
| 55 to 64 Years | 774 (80.2%) | 805 (85.6%) |
| 65 to 74 Years | 500 (67.4%) | 681 (78.1%) |
| 75 Years and over | 425 (92.4%) | 437 (78.7%) |
| Total | 6,317 (81.8%) | 7,002 (84.6%) |
Income Below Poverty Among Married-Couple Families in Ukiah
The poverty statistics for married-couple families in Ukiah show that 2.3% or 49 of the total 2,112 families live below the poverty line. Families with 3 or 4 children have the highest poverty rate of 15.4%, comprising of 38 families. On the other hand, families with 1 or 2 children have the lowest poverty rate of 0.0%, which includes 0 families.
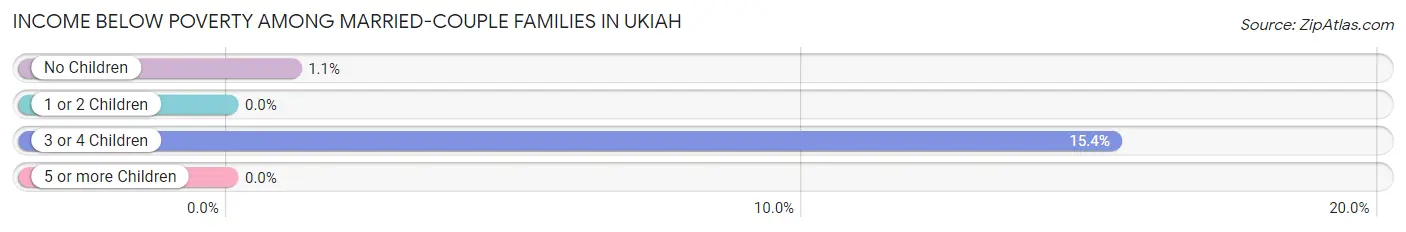
| Children | Above Poverty | Below Poverty |
| No Children | 990 (98.9%) | 11 (1.1%) |
| 1 or 2 Children | 803 (100.0%) | 0 (0.0%) |
| 3 or 4 Children | 209 (84.6%) | 38 (15.4%) |
| 5 or more Children | 61 (100.0%) | 0 (0.0%) |
| Total | 2,063 (97.7%) | 49 (2.3%) |
Income Below Poverty Among Single-Parent Households in Ukiah
According to the poverty data in Ukiah, 23.1% or 58 single-father households and 25.1% or 242 single-mother households are living below the poverty line. Among single-father households, those with 1 or 2 children have the highest poverty rate, with 50 households (40.0%) experiencing poverty. Likewise, among single-mother households, those with 3 or 4 children have the highest poverty rate, with 92 households (61.7%) falling below the poverty line.
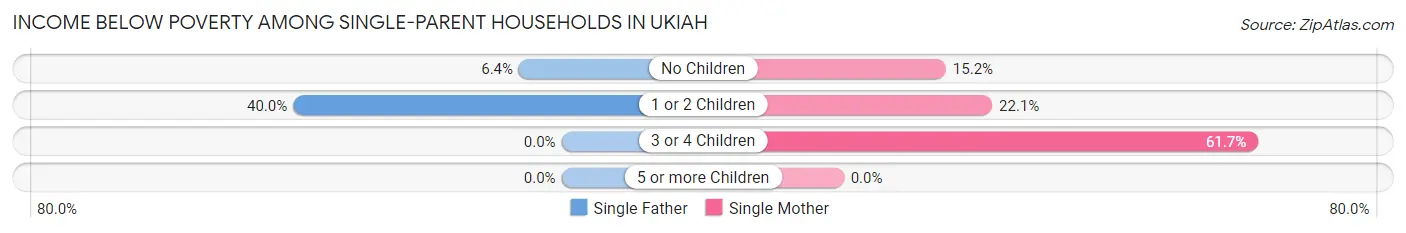
| Children | Single Father | Single Mother |
| No Children | 8 (6.4%) | 67 (15.2%) |
| 1 or 2 Children | 50 (40.0%) | 83 (22.1%) |
| 3 or 4 Children | 0 (0.0%) | 92 (61.7%) |
| 5 or more Children | 0 (0.0%) | 0 (0.0%) |
| Total | 58 (23.1%) | 242 (25.1%) |
Income Below Poverty Among Married-Couple vs Single-Parent Households in Ukiah
The poverty data for Ukiah shows that 49 of the married-couple family households (2.3%) and 300 of the single-parent households (24.7%) are living below the poverty level. Within the married-couple family households, those with 3 or 4 children have the highest poverty rate, with 38 households (15.4%) falling below the poverty line. Among the single-parent households, those with 3 or 4 children have the highest poverty rate, with 92 household (61.7%) living below poverty.
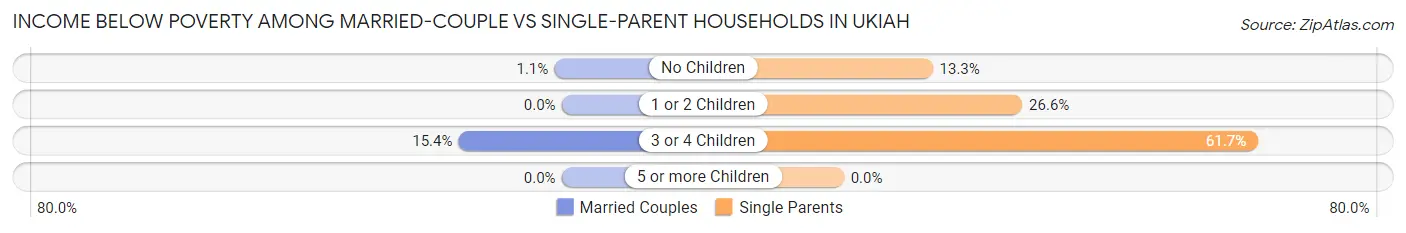
| Children | Married-Couple Families | Single-Parent Households |
| No Children | 11 (1.1%) | 75 (13.3%) |
| 1 or 2 Children | 0 (0.0%) | 133 (26.6%) |
| 3 or 4 Children | 38 (15.4%) | 92 (61.7%) |
| 5 or more Children | 0 (0.0%) | 0 (0.0%) |
| Total | 49 (2.3%) | 300 (24.7%) |
Race in Ukiah
The most populous races in Ukiah are White / Caucasian (11,688 | 70.9%), Hispanic or Latino (5,995 | 36.3%), and Some other Race (1,917 | 11.6%).
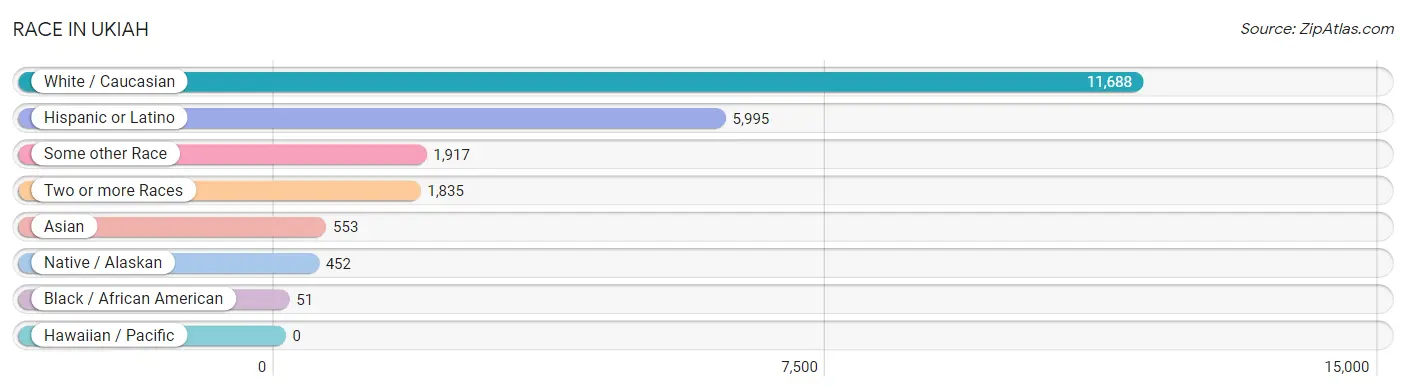
| Race | # Population | % Population |
| Asian | 553 | 3.4% |
| Black / African American | 51 | 0.3% |
| Hawaiian / Pacific | 0 | 0.0% |
| Hispanic or Latino | 5,995 | 36.3% |
| Native / Alaskan | 452 | 2.7% |
| White / Caucasian | 11,688 | 70.9% |
| Two or more Races | 1,835 | 11.1% |
| Some other Race | 1,917 | 11.6% |
| Total | 16,496 | 100.0% |
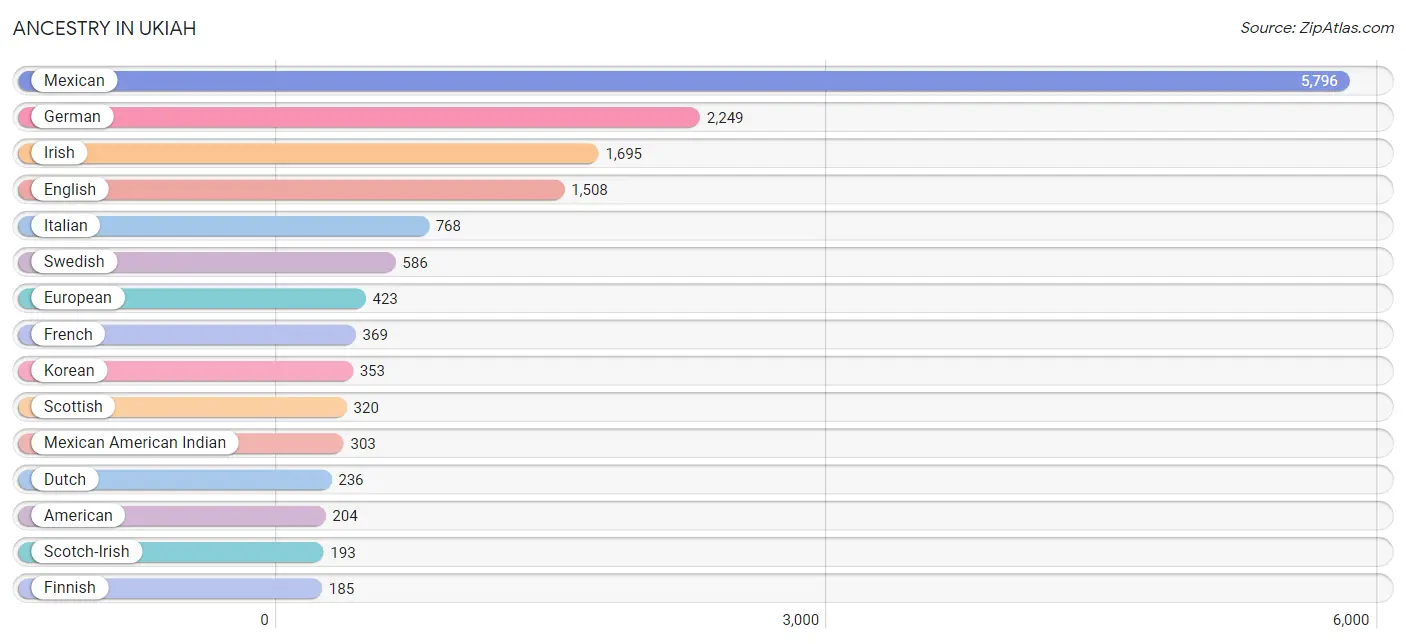
Ancestry in Ukiah
The most populous ancestries reported in Ukiah are Mexican (5,796 | 35.1%), German (2,249 | 13.6%), Irish (1,695 | 10.3%), English (1,508 | 9.1%), and Italian (768 | 4.7%), together accounting for 72.9% of all Ukiah residents.
| Ancestry | # Population | % Population |
| African | 42 | 0.3% |
| American | 204 | 1.2% |
| Apache | 100 | 0.6% |
| Arab | 39 | 0.2% |
| Armenian | 12 | 0.1% |
| British | 92 | 0.6% |
| Burmese | 52 | 0.3% |
| Canadian | 12 | 0.1% |
| Central American Indian | 13 | 0.1% |
| Cherokee | 112 | 0.7% |
| Choctaw | 37 | 0.2% |
| Croatian | 5 | 0.0% |
| Cuban | 12 | 0.1% |
| Czech | 55 | 0.3% |
| Czechoslovakian | 35 | 0.2% |
| Danish | 109 | 0.7% |
| Dutch | 236 | 1.4% |
| Eastern European | 9 | 0.1% |
| English | 1,508 | 9.1% |
| European | 423 | 2.6% |
| Filipino | 11 | 0.1% |
| Finnish | 185 | 1.1% |
| French | 369 | 2.2% |
| French Canadian | 10 | 0.1% |
| German | 2,249 | 13.6% |
| Greek | 7 | 0.0% |
| Hungarian | 14 | 0.1% |
| Indian (Asian) | 110 | 0.7% |
| Irish | 1,695 | 10.3% |
| Iroquois | 9 | 0.1% |
| Italian | 768 | 4.7% |
| Korean | 353 | 2.1% |
| Laotian | 7 | 0.0% |
| Lebanese | 32 | 0.2% |
| Mexican | 5,796 | 35.1% |
| Mexican American Indian | 303 | 1.8% |
| Navajo | 20 | 0.1% |
| Northern European | 152 | 0.9% |
| Norwegian | 173 | 1.1% |
| Pakistani | 9 | 0.1% |
| Pennsylvania German | 21 | 0.1% |
| Peruvian | 33 | 0.2% |
| Polish | 157 | 0.9% |
| Portuguese | 90 | 0.5% |
| Pueblo | 85 | 0.5% |
| Puerto Rican | 20 | 0.1% |
| Russian | 89 | 0.5% |
| Scandinavian | 120 | 0.7% |
| Scotch-Irish | 193 | 1.2% |
| Scottish | 320 | 1.9% |
| South American | 42 | 0.3% |
| Spaniard | 76 | 0.5% |
| Spanish | 11 | 0.1% |
| Sri Lankan | 109 | 0.7% |
| Subsaharan African | 42 | 0.3% |
| Swedish | 586 | 3.5% |
| Swiss | 15 | 0.1% |
| Thai | 28 | 0.2% |
| Ukrainian | 38 | 0.2% |
| Venezuelan | 9 | 0.1% |
| Welsh | 30 | 0.2% | View All 61 Rows |
Immigrants in Ukiah
The most numerous immigrant groups reported in Ukiah came from Latin America (1,768 | 10.7%), Central America (1,759 | 10.7%), Mexico (1,759 | 10.7%), Asia (346 | 2.1%), and South Eastern Asia (171 | 1.0%), together accounting for 35.2% of all Ukiah residents.
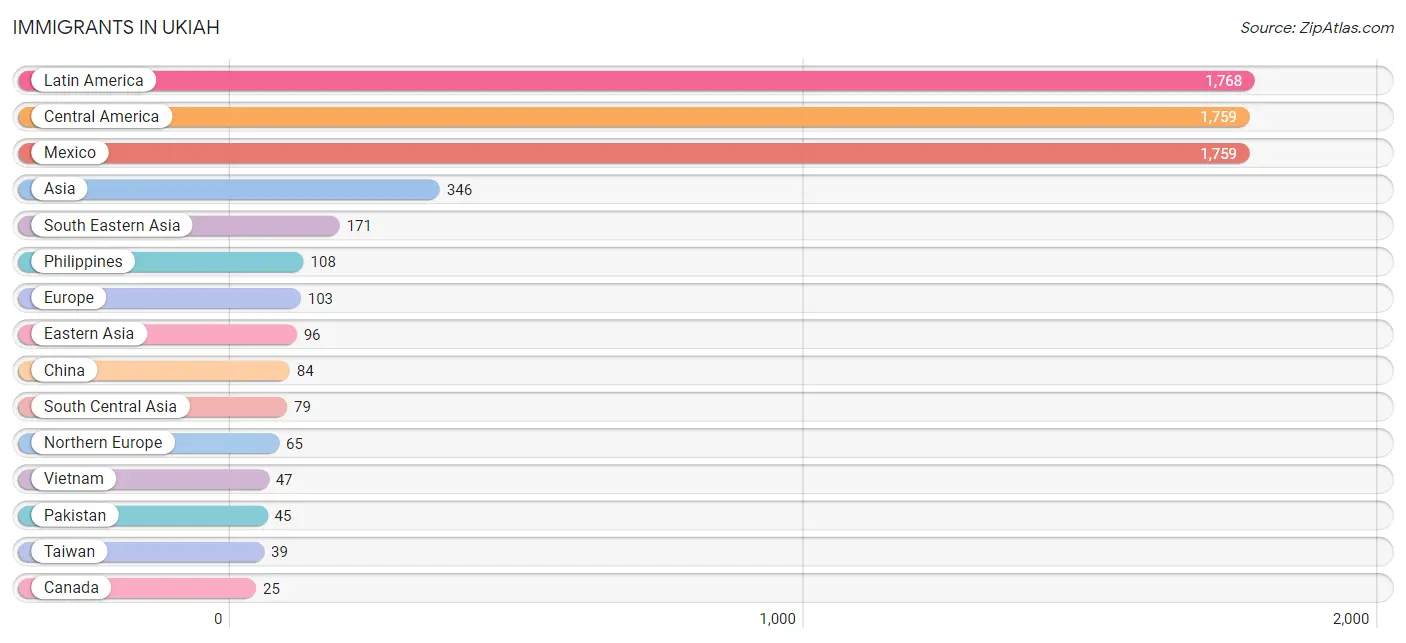
| Immigration Origin | # Population | % Population |
| Asia | 346 | 2.1% |
| Australia | 10 | 0.1% |
| Canada | 25 | 0.2% |
| Central America | 1,759 | 10.7% |
| China | 84 | 0.5% |
| Denmark | 7 | 0.0% |
| Eastern Asia | 96 | 0.6% |
| Eastern Europe | 25 | 0.2% |
| Europe | 103 | 0.6% |
| Germany | 13 | 0.1% |
| Hong Kong | 10 | 0.1% |
| India | 15 | 0.1% |
| Indonesia | 7 | 0.0% |
| Korea | 12 | 0.1% |
| Latin America | 1,768 | 10.7% |
| Mexico | 1,759 | 10.7% |
| Nepal | 19 | 0.1% |
| Northern Europe | 65 | 0.4% |
| Oceania | 10 | 0.1% |
| Pakistan | 45 | 0.3% |
| Philippines | 108 | 0.6% |
| South America | 9 | 0.1% |
| South Central Asia | 79 | 0.5% |
| South Eastern Asia | 171 | 1.0% |
| Sweden | 7 | 0.0% |
| Taiwan | 39 | 0.2% |
| Thailand | 9 | 0.1% |
| Ukraine | 25 | 0.2% |
| Venezuela | 9 | 0.1% |
| Vietnam | 47 | 0.3% |
| Western Europe | 13 | 0.1% | View All 31 Rows |
Sex and Age in Ukiah
Sex and Age in Ukiah
The most populous age groups in Ukiah are 5 to 9 Years (715 | 8.9%) for men and 5 to 9 Years (867 | 10.3%) for women.
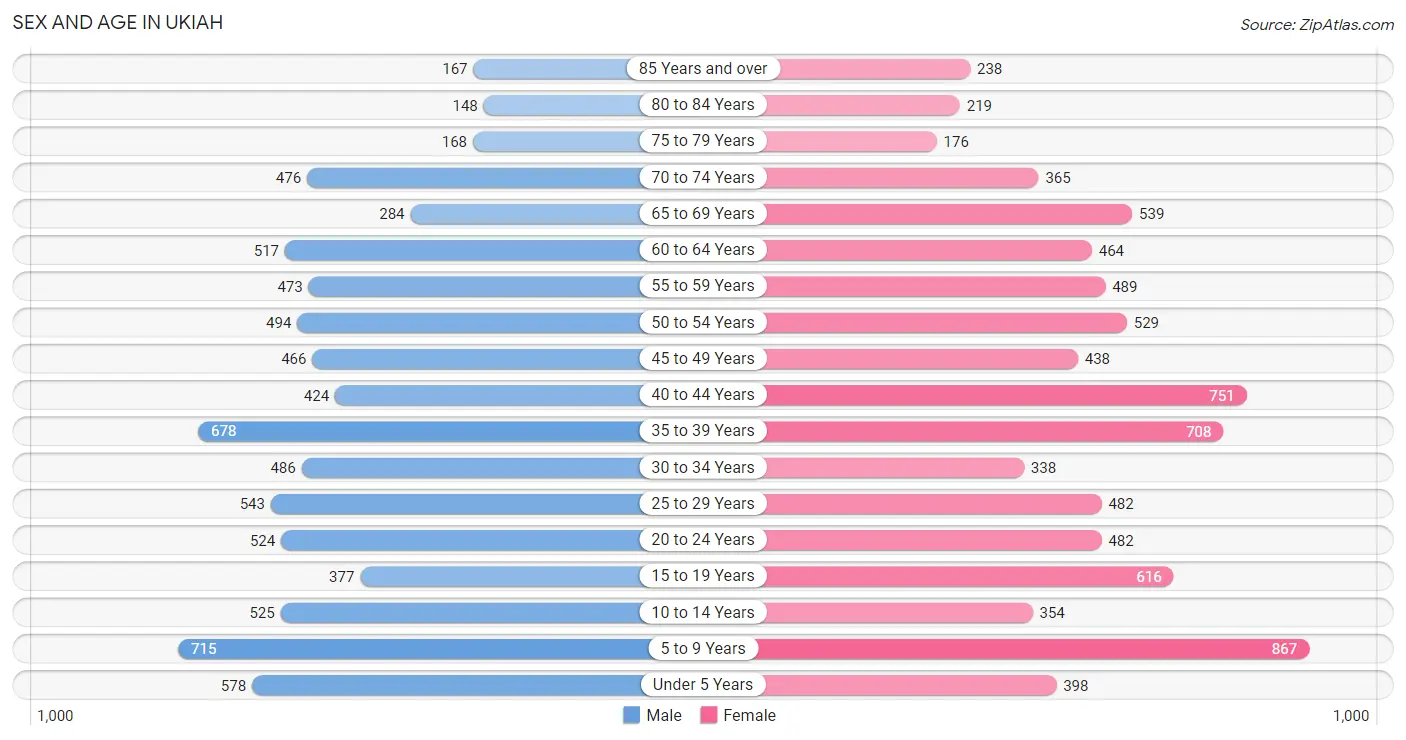
| Age Bracket | Male | Female |
| Under 5 Years | 578 (7.2%) | 398 (4.7%) |
| 5 to 9 Years | 715 (8.9%) | 867 (10.3%) |
| 10 to 14 Years | 525 (6.5%) | 354 (4.2%) |
| 15 to 19 Years | 377 (4.7%) | 616 (7.3%) |
| 20 to 24 Years | 524 (6.5%) | 482 (5.7%) |
| 25 to 29 Years | 543 (6.8%) | 482 (5.7%) |
| 30 to 34 Years | 486 (6.0%) | 338 (4.0%) |
| 35 to 39 Years | 678 (8.4%) | 708 (8.4%) |
| 40 to 44 Years | 424 (5.3%) | 751 (8.9%) |
| 45 to 49 Years | 466 (5.8%) | 438 (5.2%) |
| 50 to 54 Years | 494 (6.1%) | 529 (6.3%) |
| 55 to 59 Years | 473 (5.9%) | 489 (5.8%) |
| 60 to 64 Years | 517 (6.4%) | 464 (5.5%) |
| 65 to 69 Years | 284 (3.5%) | 539 (6.4%) |
| 70 to 74 Years | 476 (5.9%) | 365 (4.3%) |
| 75 to 79 Years | 168 (2.1%) | 176 (2.1%) |
| 80 to 84 Years | 148 (1.8%) | 219 (2.6%) |
| 85 Years and over | 167 (2.1%) | 238 (2.8%) |
| Total | 8,043 (100.0%) | 8,453 (100.0%) |
Families and Households in Ukiah
Median Family Size in Ukiah
The median family size in Ukiah is 3.63 persons per family, with single male/father families (251 | 7.5%) accounting for the largest median family size of 3.95 persons per family. On the other hand, single female/mother families (964 | 29.0%) represent the smallest median family size with 3.25 persons per family.
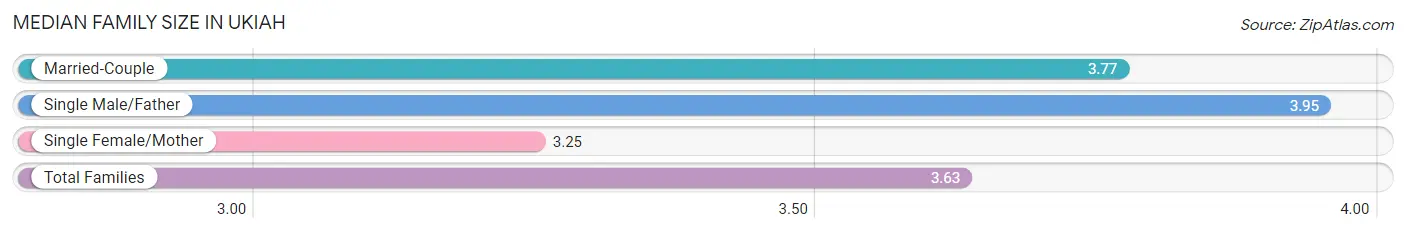
| Family Type | # Families | Family Size |
| Married-Couple | 2,112 (63.5%) | 3.77 |
| Single Male/Father | 251 (7.5%) | 3.95 |
| Single Female/Mother | 964 (29.0%) | 3.25 |
| Total Families | 3,327 (100.0%) | 3.63 |
Median Household Size in Ukiah
The median household size in Ukiah is 2.68 persons per household, with single male/father households (251 | 4.3%) accounting for the largest median household size of 4.53 persons per household. non-family households (2,558 | 43.5%) represent the smallest median household size with 1.21 persons per household.
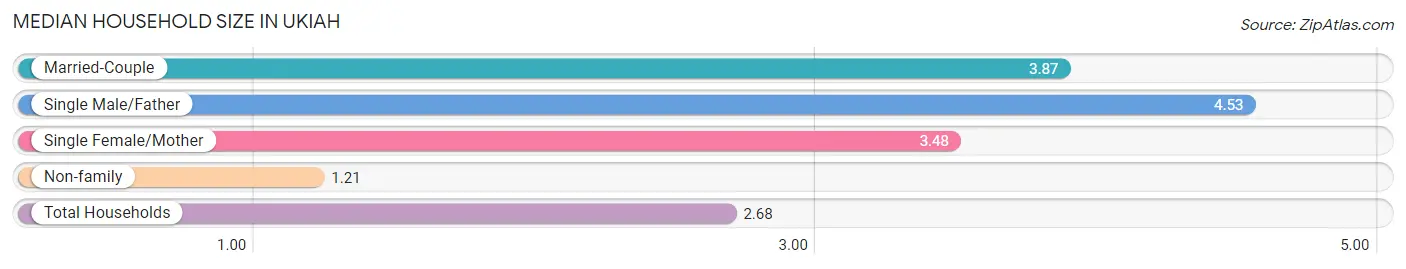
| Household Type | # Households | Household Size |
| Married-Couple | 2,112 (35.9%) | 3.87 |
| Single Male/Father | 251 (4.3%) | 4.53 |
| Single Female/Mother | 964 (16.4%) | 3.48 |
| Non-family | 2,558 (43.5%) | 1.21 |
| Total Households | 5,885 (100.0%) | 2.68 |
Household Size by Marriage Status in Ukiah
Out of a total of 5,885 households in Ukiah, 3,327 (56.5%) are family households, while 2,558 (43.5%) are nonfamily households. The most numerous type of family households are 2-person households, comprising 1,316, and the most common type of nonfamily households are 1-person households, comprising 2,190.
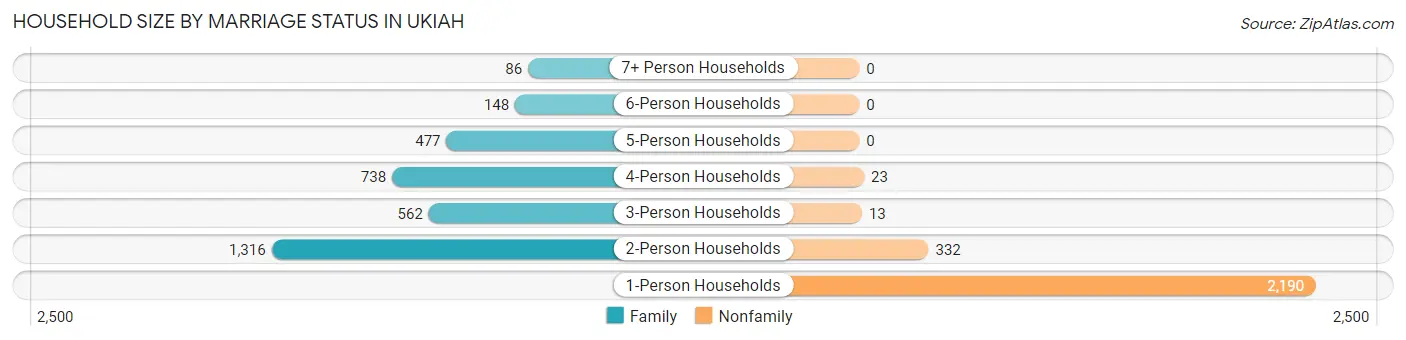
| Household Size | Family Households | Nonfamily Households |
| 1-Person Households | - | 2,190 (37.2%) |
| 2-Person Households | 1,316 (22.4%) | 332 (5.6%) |
| 3-Person Households | 562 (9.6%) | 13 (0.2%) |
| 4-Person Households | 738 (12.5%) | 23 (0.4%) |
| 5-Person Households | 477 (8.1%) | 0 (0.0%) |
| 6-Person Households | 148 (2.5%) | 0 (0.0%) |
| 7+ Person Households | 86 (1.5%) | 0 (0.0%) |
| Total | 3,327 (56.5%) | 2,558 (43.5%) |
Female Fertility in Ukiah
Fertility by Age in Ukiah
Average fertility rate in Ukiah is 41.0 births per 1,000 women. Women in the age bracket of 35 to 50 years have the highest fertility rate with 77.0 births per 1,000 women. Women in the age bracket of 35 to 50 years acount for 97.6% of all women with births.
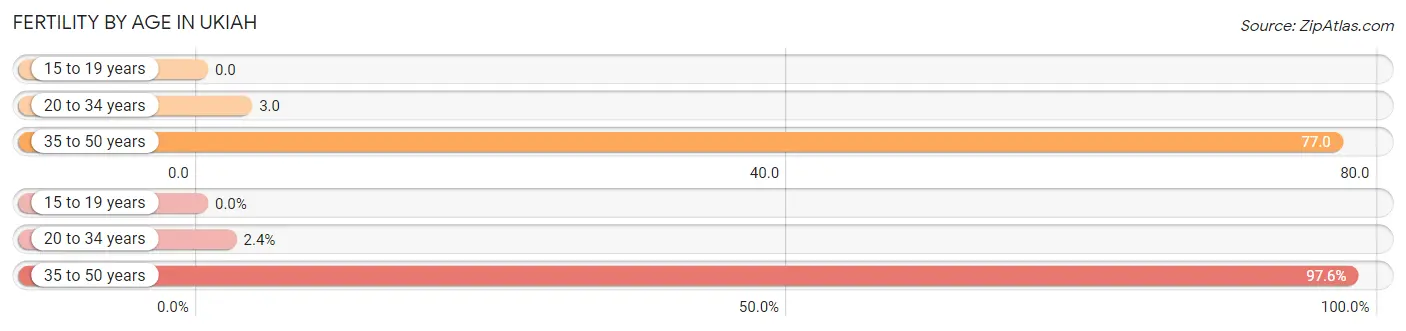
| Age Bracket | Women with Births | Births / 1,000 Women |
| 15 to 19 years | 0 (0.0%) | 0.0 |
| 20 to 34 years | 4 (2.4%) | 3.0 |
| 35 to 50 years | 161 (97.6%) | 77.0 |
| Total | 165 (100.0%) | 41.0 |
Fertility by Age by Marriage Status in Ukiah
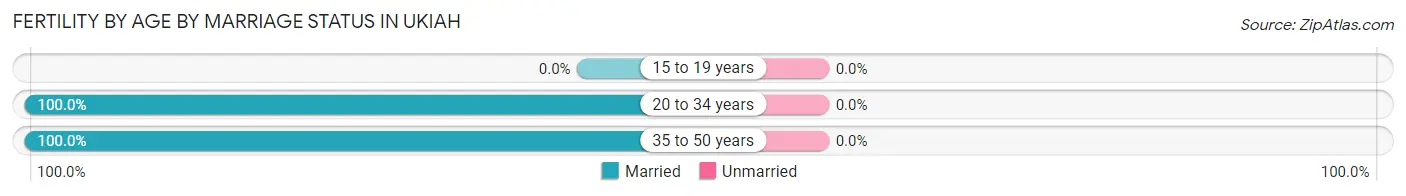
| Age Bracket | Married | Unmarried |
| 15 to 19 years | 0 (0.0%) | 0 (0.0%) |
| 20 to 34 years | 4 (100.0%) | 0 (0.0%) |
| 35 to 50 years | 161 (100.0%) | 0 (0.0%) |
| Total | 165 (100.0%) | 0 (0.0%) |
Fertility by Education in Ukiah
Average fertility rate in Ukiah is 41.0 births per 1,000 women. Women with the education attainment of less than high school have the highest fertility rate of 91.0 births per 1,000 women, while women with the education attainment of bachelor's degree have the lowest fertility at 7.0 births per 1,000 women. Women with the education attainment of less than high school represent 55.8% of all women with births.
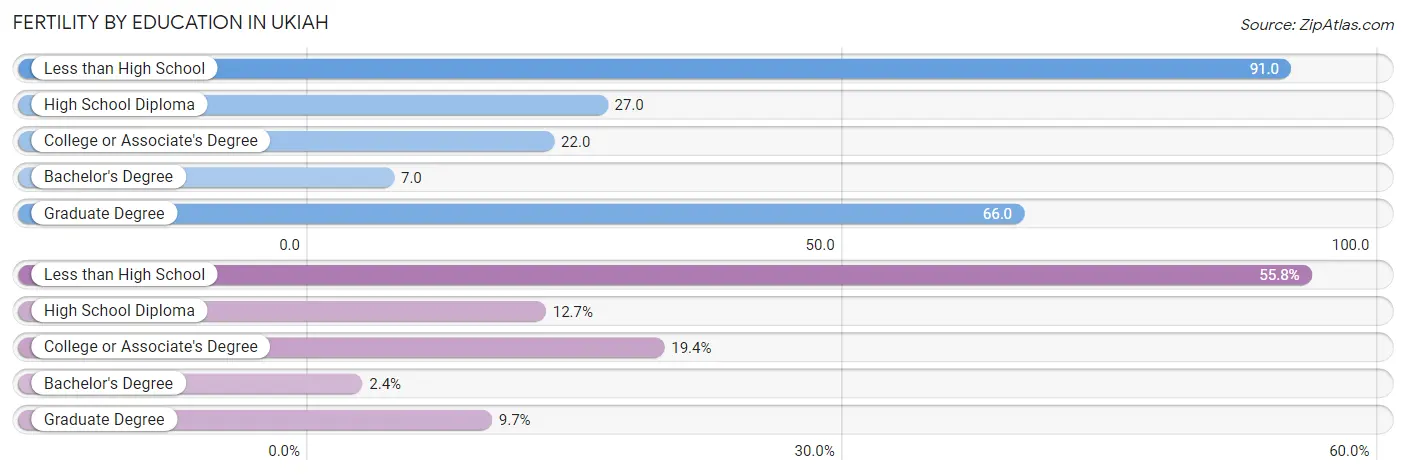
| Educational Attainment | Women with Births | Births / 1,000 Women |
| Less than High School | 92 (55.8%) | 91.0 |
| High School Diploma | 21 (12.7%) | 27.0 |
| College or Associate's Degree | 32 (19.4%) | 22.0 |
| Bachelor's Degree | 4 (2.4%) | 7.0 |
| Graduate Degree | 16 (9.7%) | 66.0 |
| Total | 165 (100.0%) | 41.0 |
Fertility by Education by Marriage Status in Ukiah
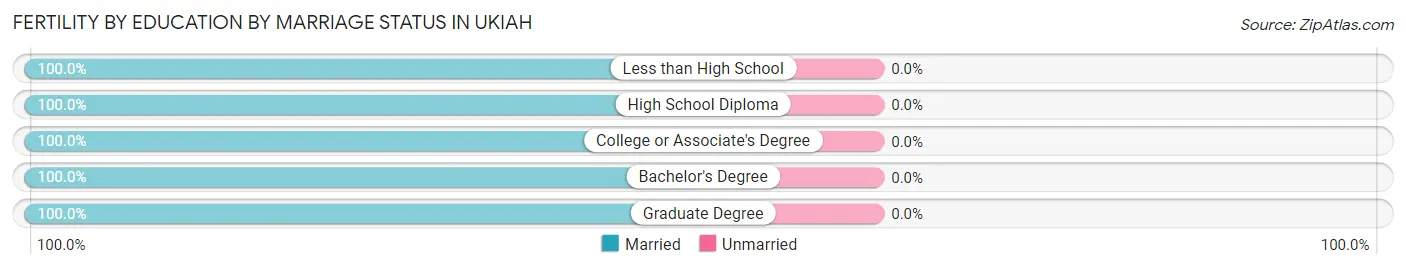
| Educational Attainment | Married | Unmarried |
| Less than High School | 92 (100.0%) | 0 (0.0%) |
| High School Diploma | 21 (100.0%) | 0 (0.0%) |
| College or Associate's Degree | 32 (100.0%) | 0 (0.0%) |
| Bachelor's Degree | 4 (100.0%) | 0 (0.0%) |
| Graduate Degree | 16 (100.0%) | 0 (0.0%) |
| Total | 165 (100.0%) | 0 (0.0%) |
Employment Characteristics in Ukiah
Employment by Class of Employer in Ukiah
Among the 7,065 employed individuals in Ukiah, private company employees (4,116 | 58.3%), local government employees (957 | 13.6%), and not-for-profit organizations (754 | 10.7%) make up the most common classes of employment.
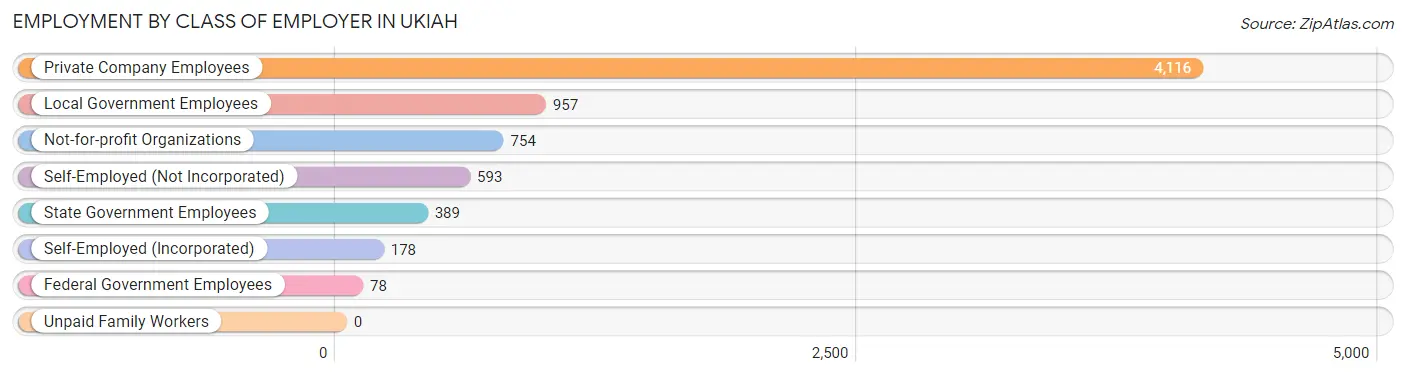
| Employer Class | # Employees | % Employees |
| Private Company Employees | 4,116 | 58.3% |
| Self-Employed (Incorporated) | 178 | 2.5% |
| Self-Employed (Not Incorporated) | 593 | 8.4% |
| Not-for-profit Organizations | 754 | 10.7% |
| Local Government Employees | 957 | 13.6% |
| State Government Employees | 389 | 5.5% |
| Federal Government Employees | 78 | 1.1% |
| Unpaid Family Workers | 0 | 0.0% |
| Total | 7,065 | 100.0% |
Employment Status by Age in Ukiah
According to the labor force statistics for Ukiah, out of the total population over 16 years of age (12,815), 61.9% or 7,932 individuals are in the labor force, with 8.4% or 666 of them unemployed. The age group with the highest labor force participation rate is 35 to 44 years, with 84.8% or 2,172 individuals in the labor force. Within the labor force, the 16 to 19 years age range has the highest percentage of unemployed individuals, with 36.2% or 117 of them being unemployed.
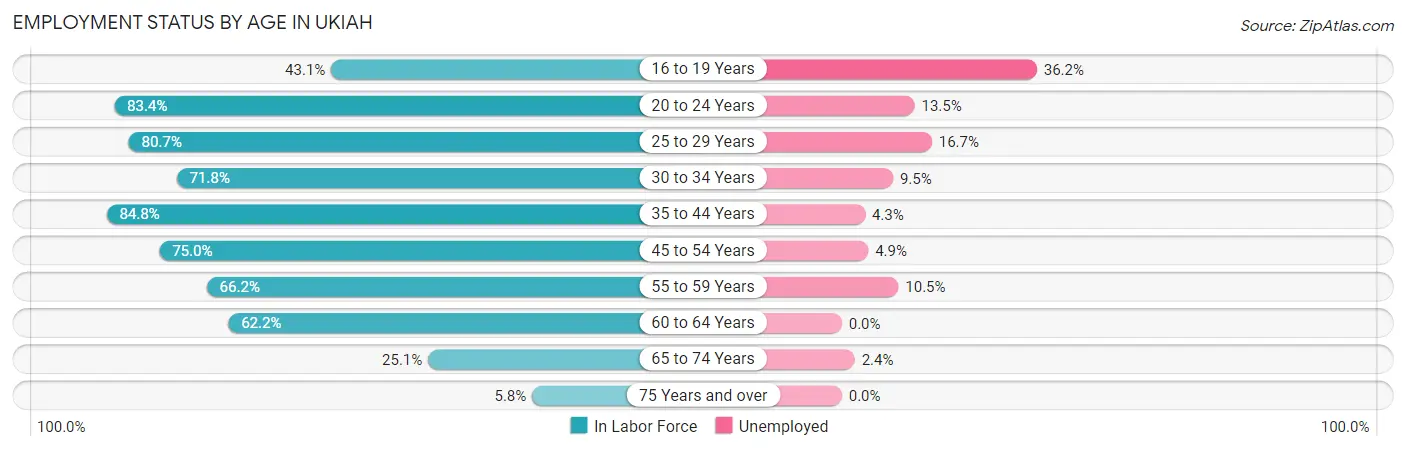
| Age Bracket | In Labor Force | Unemployed |
| 16 to 19 Years | 323 (43.1%) | 117 (36.2%) |
| 20 to 24 Years | 839 (83.4%) | 113 (13.5%) |
| 25 to 29 Years | 827 (80.7%) | 138 (16.7%) |
| 30 to 34 Years | 592 (71.8%) | 56 (9.5%) |
| 35 to 44 Years | 2,172 (84.8%) | 93 (4.3%) |
| 45 to 54 Years | 1,445 (75.0%) | 71 (4.9%) |
| 55 to 59 Years | 637 (66.2%) | 67 (10.5%) |
| 60 to 64 Years | 610 (62.2%) | 0 (0.0%) |
| 65 to 74 Years | 418 (25.1%) | 10 (2.4%) |
| 75 Years and over | 65 (5.8%) | 0 (0.0%) |
| Total | 7,932 (61.9%) | 666 (8.4%) |
Employment Status by Educational Attainment in Ukiah
According to labor force statistics for Ukiah, 75.9% of individuals (6,285) out of the total population between 25 and 64 years of age (8,280) are in the labor force, with 6.8% or 427 of them being unemployed. The group with the highest labor force participation rate are those with the educational attainment of bachelor's degree or higher, with 92.7% or 1,590 individuals in the labor force. Within the labor force, individuals with college / associate degree education have the highest percentage of unemployment, with 9.7% or 241 of them being unemployed.
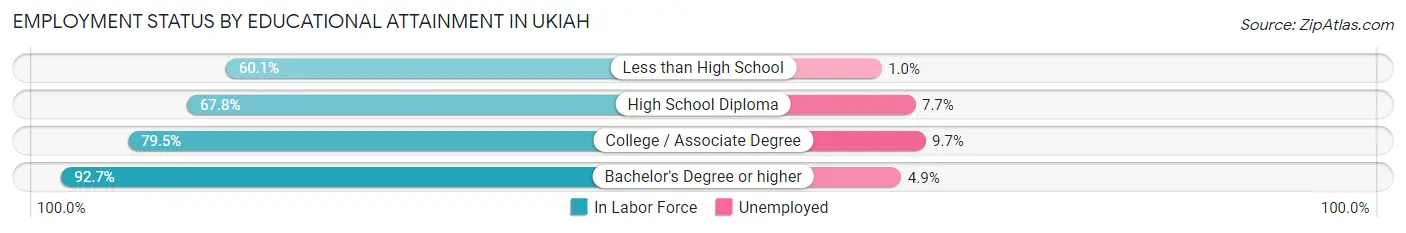
| Educational Attainment | In Labor Force | Unemployed |
| Less than High School | 936 (60.1%) | 16 (1.0%) |
| High School Diploma | 1,277 (67.8%) | 145 (7.7%) |
| College / Associate Degree | 2,484 (79.5%) | 303 (9.7%) |
| Bachelor's Degree or higher | 1,590 (92.7%) | 84 (4.9%) |
| Total | 6,285 (75.9%) | 563 (6.8%) |
Employment Occupations by Sex in Ukiah
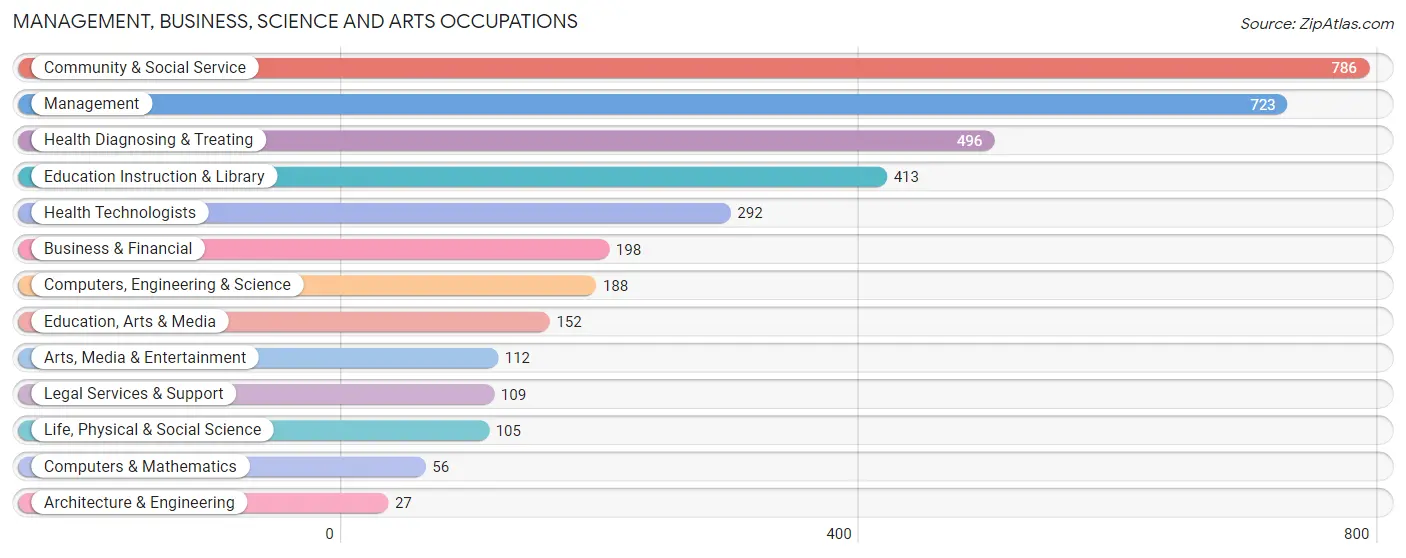
Management, Business, Science and Arts Occupations
The most common Management, Business, Science and Arts occupations in Ukiah are Community & Social Service (786 | 10.8%), Management (723 | 10.0%), Health Diagnosing & Treating (496 | 6.8%), Education Instruction & Library (413 | 5.7%), and Health Technologists (292 | 4.0%).
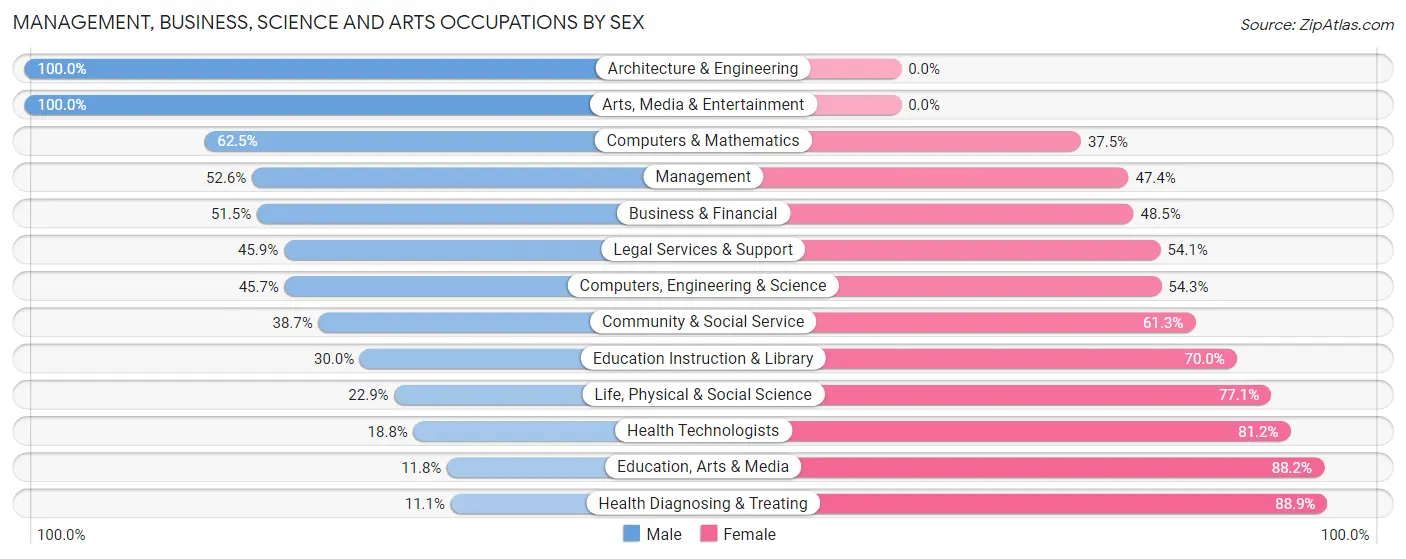
Management, Business, Science and Arts Occupations by Sex
Within the Management, Business, Science and Arts occupations in Ukiah, the most male-oriented occupations are Architecture & Engineering (100.0%), Arts, Media & Entertainment (100.0%), and Computers & Mathematics (62.5%), while the most female-oriented occupations are Health Diagnosing & Treating (88.9%), Education, Arts & Media (88.2%), and Health Technologists (81.2%).
| Occupation | Male | Female |
| Management | 380 (52.6%) | 343 (47.4%) |
| Business & Financial | 102 (51.5%) | 96 (48.5%) |
| Computers, Engineering & Science | 86 (45.7%) | 102 (54.3%) |
| Computers & Mathematics | 35 (62.5%) | 21 (37.5%) |
| Architecture & Engineering | 27 (100.0%) | 0 (0.0%) |
| Life, Physical & Social Science | 24 (22.9%) | 81 (77.1%) |
| Community & Social Service | 304 (38.7%) | 482 (61.3%) |
| Education, Arts & Media | 18 (11.8%) | 134 (88.2%) |
| Legal Services & Support | 50 (45.9%) | 59 (54.1%) |
| Education Instruction & Library | 124 (30.0%) | 289 (70.0%) |
| Arts, Media & Entertainment | 112 (100.0%) | 0 (0.0%) |
| Health Diagnosing & Treating | 55 (11.1%) | 441 (88.9%) |
| Health Technologists | 55 (18.8%) | 237 (81.2%) |
| Total (Category) | 927 (38.8%) | 1,464 (61.2%) |
| Total (Overall) | 3,421 (47.1%) | 3,843 (52.9%) |
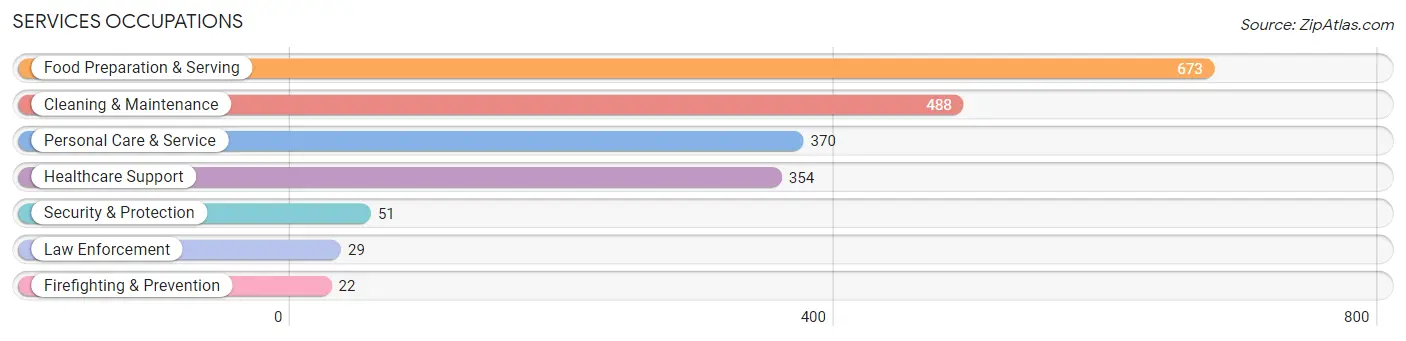
Services Occupations
The most common Services occupations in Ukiah are Food Preparation & Serving (673 | 9.3%), Cleaning & Maintenance (488 | 6.7%), Personal Care & Service (370 | 5.1%), Healthcare Support (354 | 4.9%), and Security & Protection (51 | 0.7%).
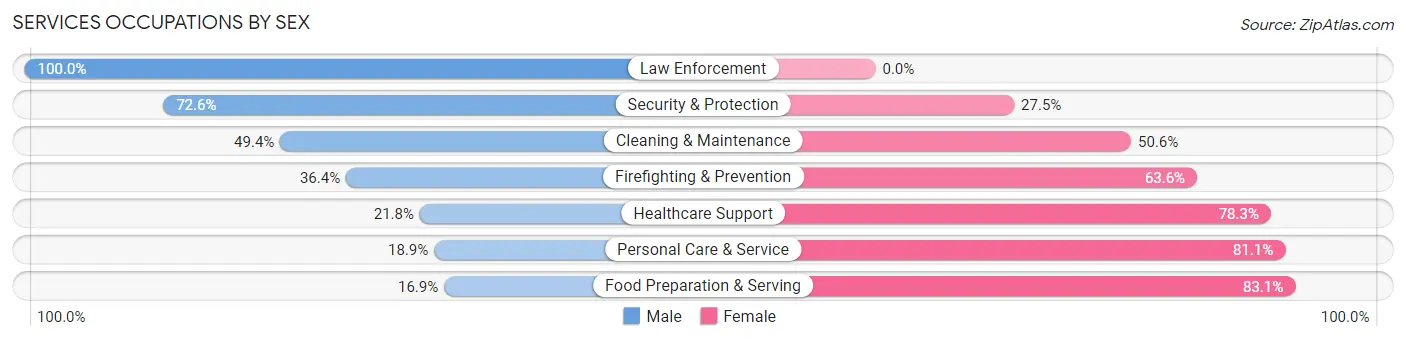
Services Occupations by Sex
Within the Services occupations in Ukiah, the most male-oriented occupations are Law Enforcement (100.0%), Security & Protection (72.6%), and Cleaning & Maintenance (49.4%), while the most female-oriented occupations are Food Preparation & Serving (83.1%), Personal Care & Service (81.1%), and Healthcare Support (78.2%).
| Occupation | Male | Female |
| Healthcare Support | 77 (21.7%) | 277 (78.2%) |
| Security & Protection | 37 (72.6%) | 14 (27.5%) |
| Firefighting & Prevention | 8 (36.4%) | 14 (63.6%) |
| Law Enforcement | 29 (100.0%) | 0 (0.0%) |
| Food Preparation & Serving | 114 (16.9%) | 559 (83.1%) |
| Cleaning & Maintenance | 241 (49.4%) | 247 (50.6%) |
| Personal Care & Service | 70 (18.9%) | 300 (81.1%) |
| Total (Category) | 539 (27.8%) | 1,397 (72.2%) |
| Total (Overall) | 3,421 (47.1%) | 3,843 (52.9%) |
Sales and Office Occupations
The most common Sales and Office occupations in Ukiah are Sales & Related (802 | 11.0%), and Office & Administration (510 | 7.0%).
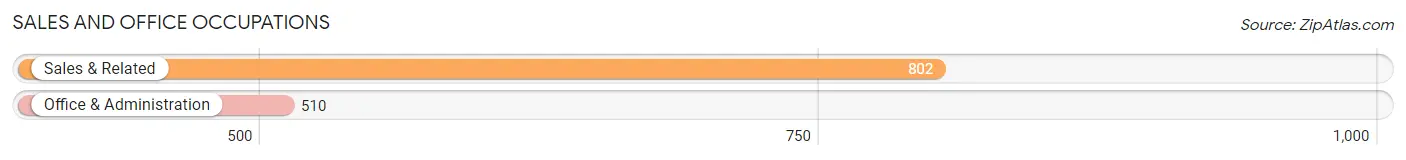
Sales and Office Occupations by Sex
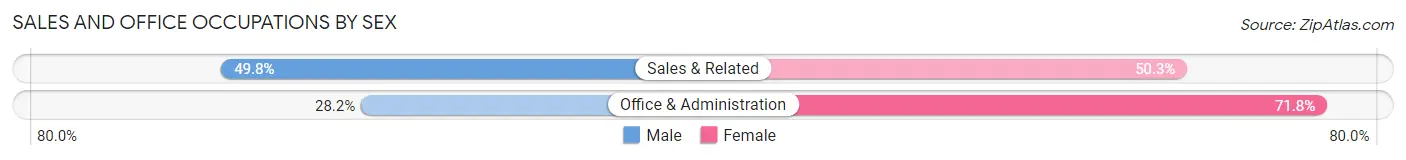
| Occupation | Male | Female |
| Sales & Related | 399 (49.7%) | 403 (50.2%) |
| Office & Administration | 144 (28.2%) | 366 (71.8%) |
| Total (Category) | 543 (41.4%) | 769 (58.6%) |
| Total (Overall) | 3,421 (47.1%) | 3,843 (52.9%) |
Natural Resources, Construction and Maintenance Occupations
The most common Natural Resources, Construction and Maintenance occupations in Ukiah are Construction & Extraction (362 | 5.0%), Farming, Fishing & Forestry (255 | 3.5%), and Installation, Maintenance & Repair (107 | 1.5%).

Natural Resources, Construction and Maintenance Occupations by Sex
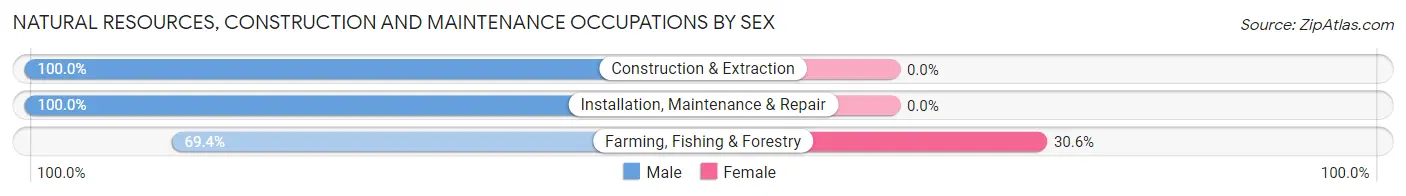
| Occupation | Male | Female |
| Farming, Fishing & Forestry | 177 (69.4%) | 78 (30.6%) |
| Construction & Extraction | 362 (100.0%) | 0 (0.0%) |
| Installation, Maintenance & Repair | 107 (100.0%) | 0 (0.0%) |
| Total (Category) | 646 (89.2%) | 78 (10.8%) |
| Total (Overall) | 3,421 (47.1%) | 3,843 (52.9%) |
Production, Transportation and Moving Occupations
The most common Production, Transportation and Moving occupations in Ukiah are Production (412 | 5.7%), Transportation (283 | 3.9%), and Material Moving (206 | 2.8%).
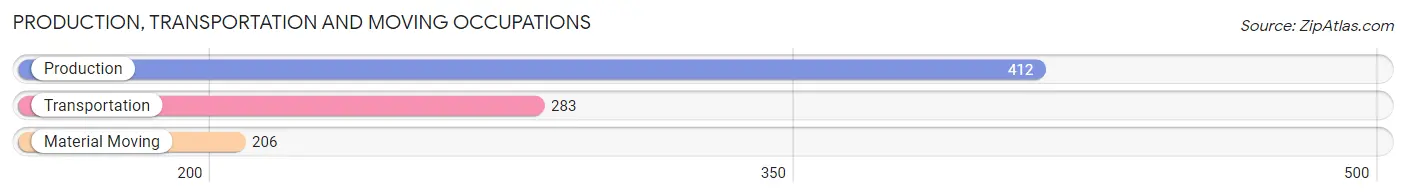
Production, Transportation and Moving Occupations by Sex
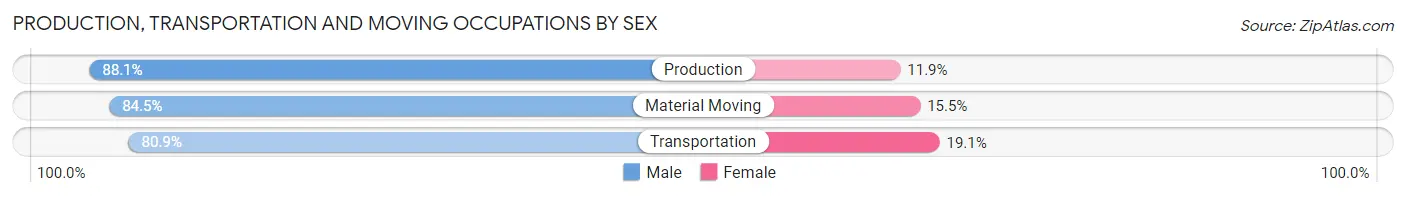
| Occupation | Male | Female |
| Production | 363 (88.1%) | 49 (11.9%) |
| Transportation | 229 (80.9%) | 54 (19.1%) |
| Material Moving | 174 (84.5%) | 32 (15.5%) |
| Total (Category) | 766 (85.0%) | 135 (15.0%) |
| Total (Overall) | 3,421 (47.1%) | 3,843 (52.9%) |
Employment Industries by Sex in Ukiah
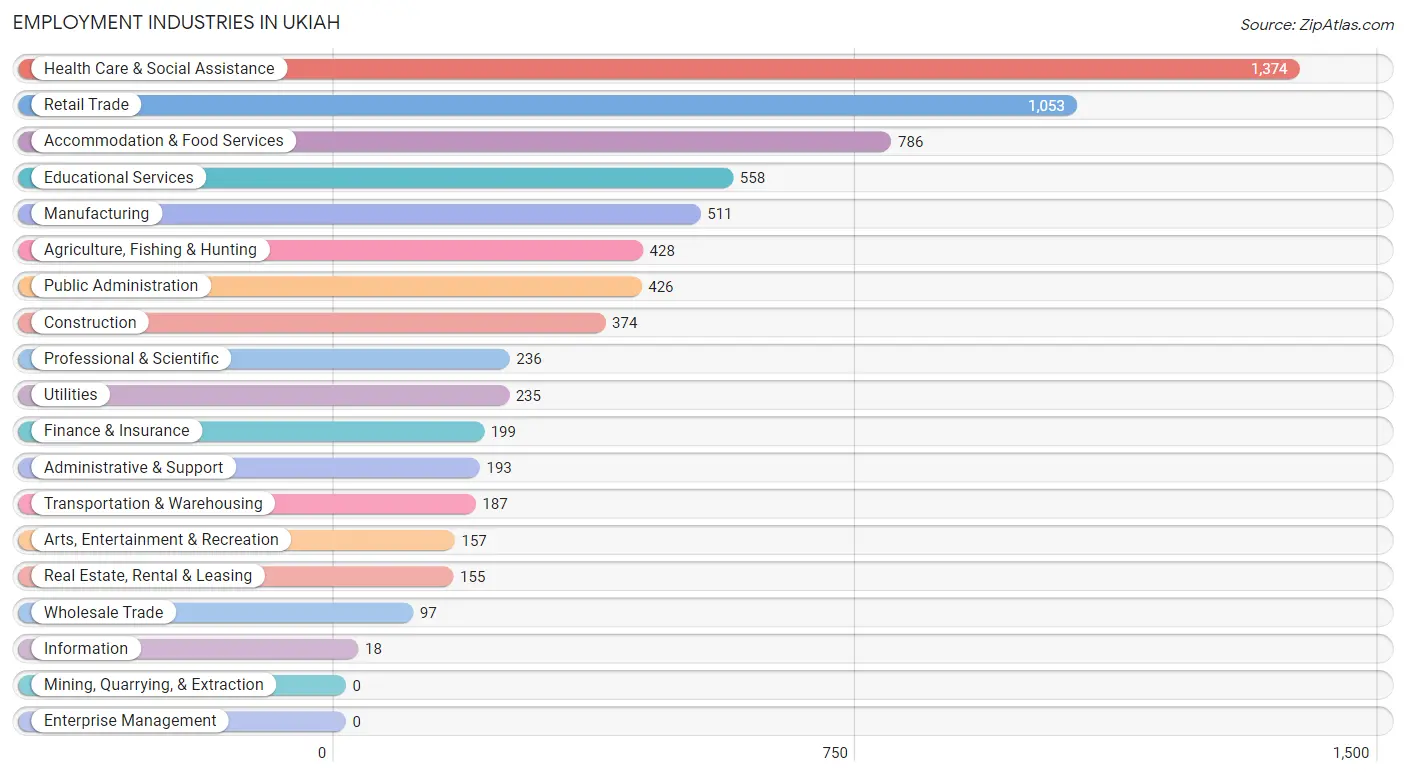
Employment Industries in Ukiah
The major employment industries in Ukiah include Health Care & Social Assistance (1,374 | 18.9%), Retail Trade (1,053 | 14.5%), Accommodation & Food Services (786 | 10.8%), Educational Services (558 | 7.7%), and Manufacturing (511 | 7.0%).
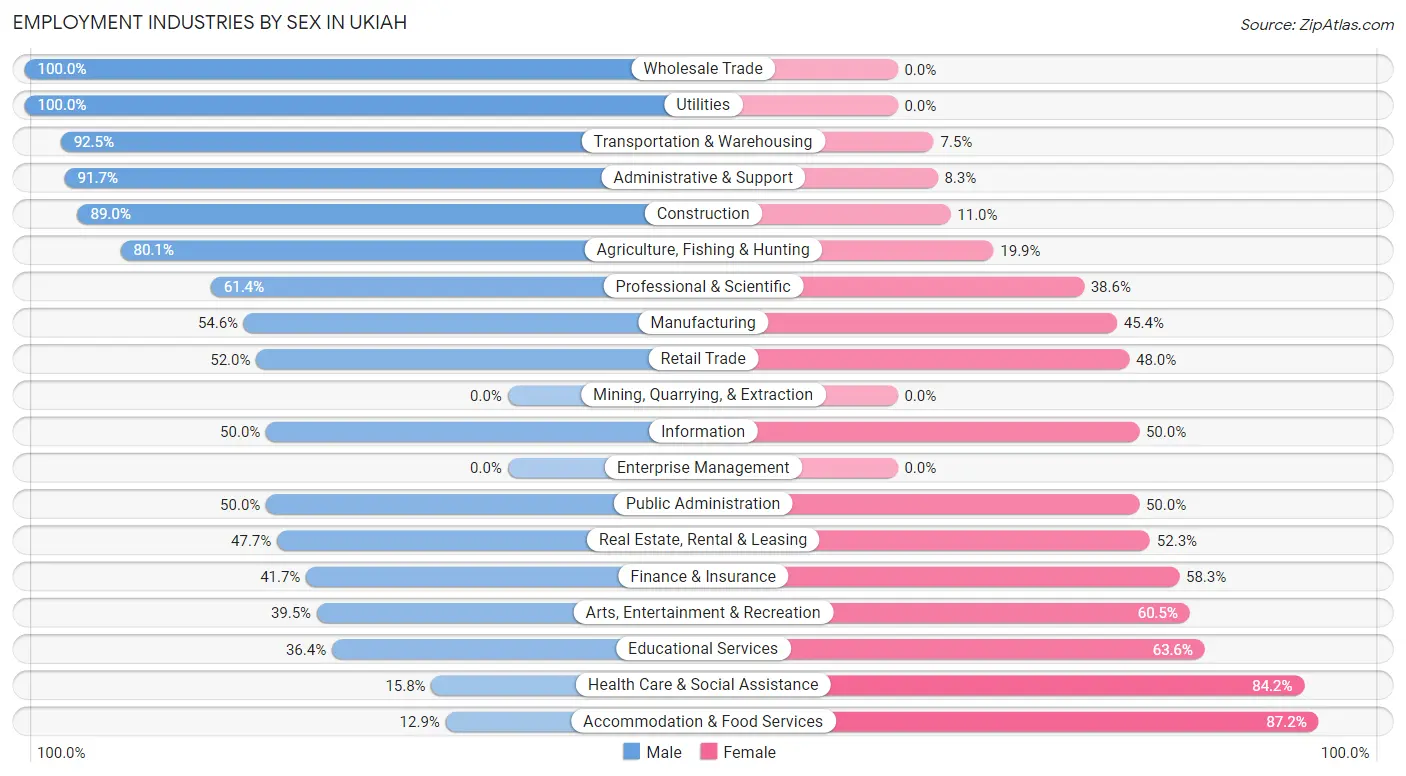
Employment Industries by Sex in Ukiah
The Ukiah industries that see more men than women are Wholesale Trade (100.0%), Utilities (100.0%), and Transportation & Warehousing (92.5%), whereas the industries that tend to have a higher number of women are Accommodation & Food Services (87.2%), Health Care & Social Assistance (84.2%), and Educational Services (63.6%).
| Industry | Male | Female |
| Agriculture, Fishing & Hunting | 343 (80.1%) | 85 (19.9%) |
| Mining, Quarrying, & Extraction | 0 (0.0%) | 0 (0.0%) |
| Construction | 333 (89.0%) | 41 (11.0%) |
| Manufacturing | 279 (54.6%) | 232 (45.4%) |
| Wholesale Trade | 97 (100.0%) | 0 (0.0%) |
| Retail Trade | 548 (52.0%) | 505 (48.0%) |
| Transportation & Warehousing | 173 (92.5%) | 14 (7.5%) |
| Utilities | 235 (100.0%) | 0 (0.0%) |
| Information | 9 (50.0%) | 9 (50.0%) |
| Finance & Insurance | 83 (41.7%) | 116 (58.3%) |
| Real Estate, Rental & Leasing | 74 (47.7%) | 81 (52.3%) |
| Professional & Scientific | 145 (61.4%) | 91 (38.6%) |
| Enterprise Management | 0 (0.0%) | 0 (0.0%) |
| Administrative & Support | 177 (91.7%) | 16 (8.3%) |
| Educational Services | 203 (36.4%) | 355 (63.6%) |
| Health Care & Social Assistance | 217 (15.8%) | 1,157 (84.2%) |
| Arts, Entertainment & Recreation | 62 (39.5%) | 95 (60.5%) |
| Accommodation & Food Services | 101 (12.9%) | 685 (87.2%) |
| Public Administration | 213 (50.0%) | 213 (50.0%) |
| Total | 3,421 (47.1%) | 3,843 (52.9%) |
Education in Ukiah
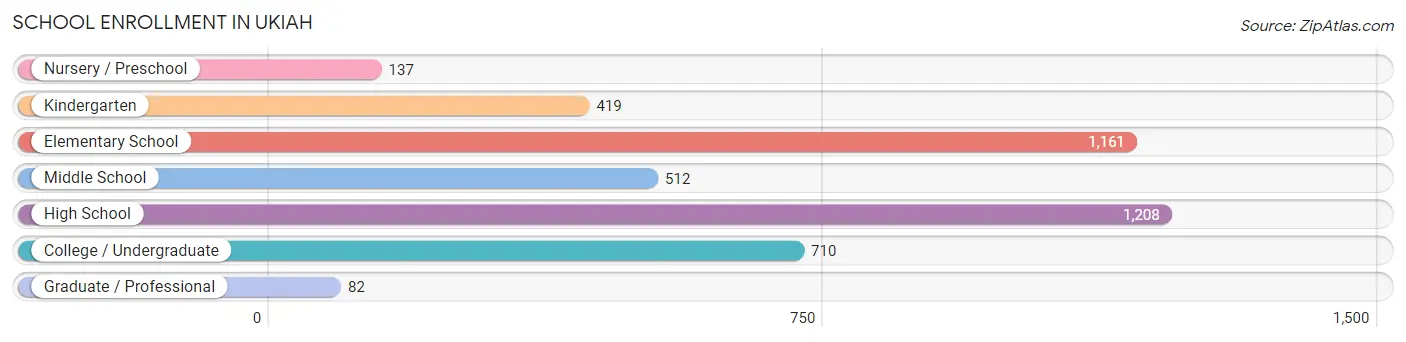
School Enrollment in Ukiah
The most common levels of schooling among the 4,229 students in Ukiah are high school (1,208 | 28.6%), elementary school (1,161 | 27.5%), and college / undergraduate (710 | 16.8%).
| School Level | # Students | % Students |
| Nursery / Preschool | 137 | 3.2% |
| Kindergarten | 419 | 9.9% |
| Elementary School | 1,161 | 27.5% |
| Middle School | 512 | 12.1% |
| High School | 1,208 | 28.6% |
| College / Undergraduate | 710 | 16.8% |
| Graduate / Professional | 82 | 1.9% |
| Total | 4,229 | 100.0% |
School Enrollment by Age by Funding Source in Ukiah
Out of a total of 4,229 students who are enrolled in schools in Ukiah, 368 (8.7%) attend a private institution, while the remaining 3,861 (91.3%) are enrolled in public schools. The age group of 20 to 24 year olds has the highest likelihood of being enrolled in private schools, with 65 (30.1% in the age bracket) enrolled. Conversely, the age group of 5 to 9 year old has the lowest likelihood of being enrolled in a private school, with 1,525 (98.1% in the age bracket) attending a public institution.
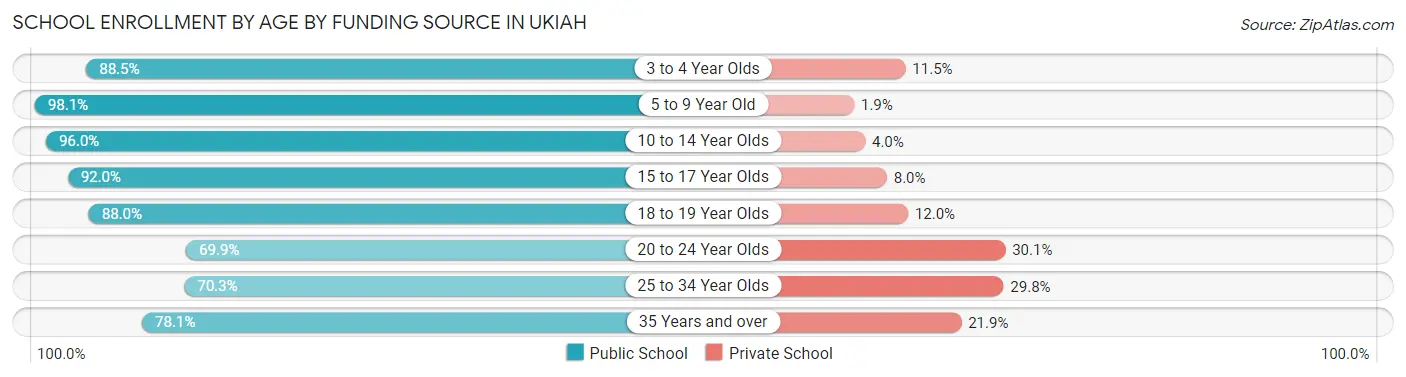
| Age Bracket | Public School | Private School |
| 3 to 4 Year Olds | 100 (88.5%) | 13 (11.5%) |
| 5 to 9 Year Old | 1,525 (98.1%) | 30 (1.9%) |
| 10 to 14 Year Olds | 844 (96.0%) | 35 (4.0%) |
| 15 to 17 Year Olds | 676 (92.0%) | 59 (8.0%) |
| 18 to 19 Year Olds | 125 (88.0%) | 17 (12.0%) |
| 20 to 24 Year Olds | 151 (69.9%) | 65 (30.1%) |
| 25 to 34 Year Olds | 170 (70.3%) | 72 (29.7%) |
| 35 Years and over | 271 (78.1%) | 76 (21.9%) |
| Total | 3,861 (91.3%) | 368 (8.7%) |
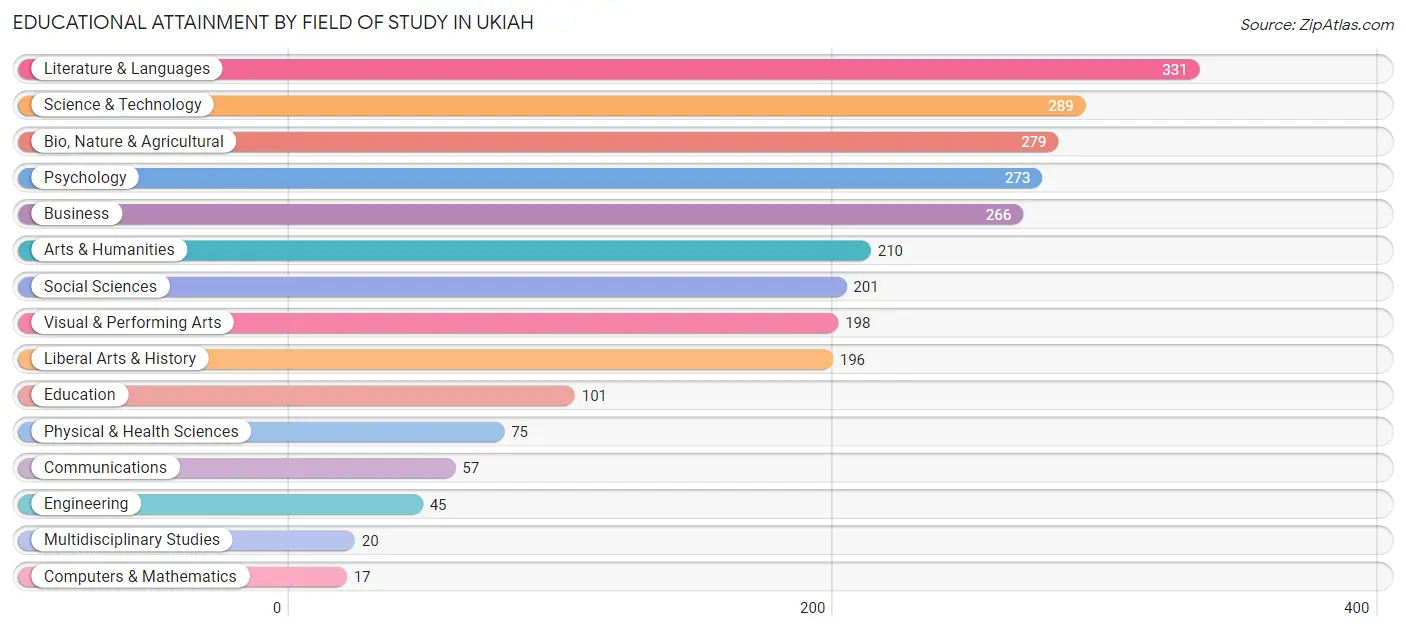
Educational Attainment by Field of Study in Ukiah
Literature & languages (331 | 12.9%), science & technology (289 | 11.3%), bio, nature & agricultural (279 | 10.9%), psychology (273 | 10.7%), and business (266 | 10.4%) are the most common fields of study among 2,558 individuals in Ukiah who have obtained a bachelor's degree or higher.
| Field of Study | # Graduates | % Graduates |
| Computers & Mathematics | 17 | 0.7% |
| Bio, Nature & Agricultural | 279 | 10.9% |
| Physical & Health Sciences | 75 | 2.9% |
| Psychology | 273 | 10.7% |
| Social Sciences | 201 | 7.9% |
| Engineering | 45 | 1.8% |
| Multidisciplinary Studies | 20 | 0.8% |
| Science & Technology | 289 | 11.3% |
| Business | 266 | 10.4% |
| Education | 101 | 4.0% |
| Literature & Languages | 331 | 12.9% |
| Liberal Arts & History | 196 | 7.7% |
| Visual & Performing Arts | 198 | 7.7% |
| Communications | 57 | 2.2% |
| Arts & Humanities | 210 | 8.2% |
| Total | 2,558 | 100.0% |
Transportation & Commute in Ukiah
Vehicle Availability by Sex in Ukiah
The most prevalent vehicle ownership categories in Ukiah are males with 2 vehicles (1,156, accounting for 34.6%) and females with 2 vehicles (1,051, making up 31.9%).
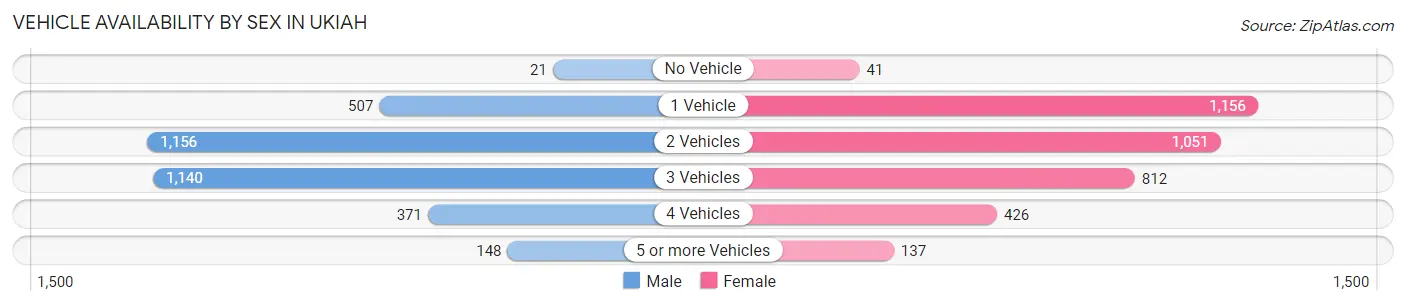
| Vehicles Available | Male | Female |
| No Vehicle | 21 (0.6%) | 41 (1.1%) |
| 1 Vehicle | 507 (15.2%) | 1,156 (31.9%) |
| 2 Vehicles | 1,156 (34.6%) | 1,051 (29.0%) |
| 3 Vehicles | 1,140 (34.1%) | 812 (22.4%) |
| 4 Vehicles | 371 (11.1%) | 426 (11.8%) |
| 5 or more Vehicles | 148 (4.4%) | 137 (3.8%) |
| Total | 3,343 (100.0%) | 3,623 (100.0%) |
Commute Time in Ukiah
The most frequently occuring commute durations in Ukiah are 5 to 9 minutes (2,116 commuters, 32.7%), 10 to 14 minutes (1,549 commuters, 23.9%), and 30 to 34 minutes (647 commuters, 10.0%).
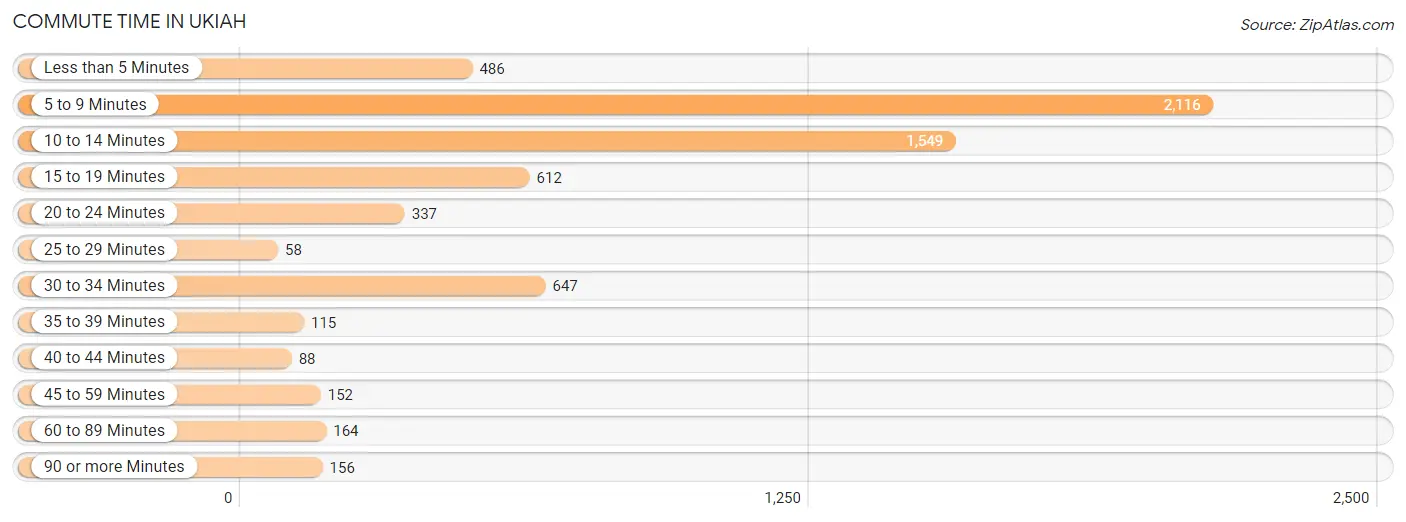
| Commute Time | # Commuters | % Commuters |
| Less than 5 Minutes | 486 | 7.5% |
| 5 to 9 Minutes | 2,116 | 32.7% |
| 10 to 14 Minutes | 1,549 | 23.9% |
| 15 to 19 Minutes | 612 | 9.4% |
| 20 to 24 Minutes | 337 | 5.2% |
| 25 to 29 Minutes | 58 | 0.9% |
| 30 to 34 Minutes | 647 | 10.0% |
| 35 to 39 Minutes | 115 | 1.8% |
| 40 to 44 Minutes | 88 | 1.4% |
| 45 to 59 Minutes | 152 | 2.4% |
| 60 to 89 Minutes | 164 | 2.5% |
| 90 or more Minutes | 156 | 2.4% |
Commute Time by Sex in Ukiah
The most common commute times in Ukiah are 5 to 9 minutes (869 commuters, 27.9%) for males and 5 to 9 minutes (1,247 commuters, 37.1%) for females.
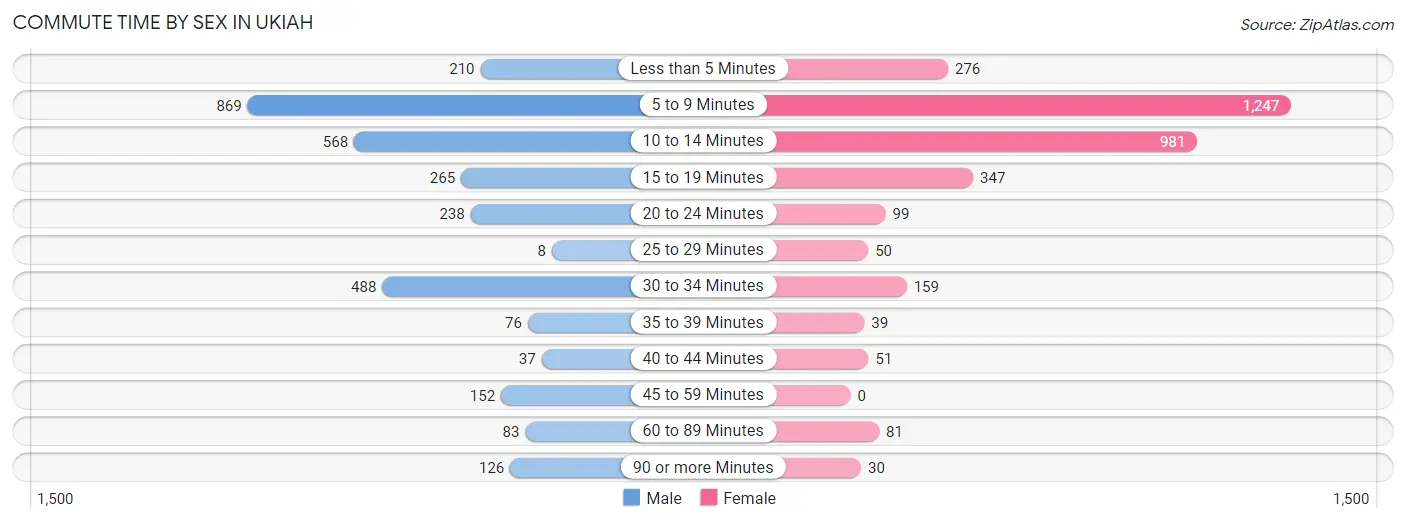
| Commute Time | Male | Female |
| Less than 5 Minutes | 210 (6.7%) | 276 (8.2%) |
| 5 to 9 Minutes | 869 (27.9%) | 1,247 (37.1%) |
| 10 to 14 Minutes | 568 (18.2%) | 981 (29.2%) |
| 15 to 19 Minutes | 265 (8.5%) | 347 (10.3%) |
| 20 to 24 Minutes | 238 (7.6%) | 99 (2.9%) |
| 25 to 29 Minutes | 8 (0.3%) | 50 (1.5%) |
| 30 to 34 Minutes | 488 (15.6%) | 159 (4.7%) |
| 35 to 39 Minutes | 76 (2.4%) | 39 (1.2%) |
| 40 to 44 Minutes | 37 (1.2%) | 51 (1.5%) |
| 45 to 59 Minutes | 152 (4.9%) | 0 (0.0%) |
| 60 to 89 Minutes | 83 (2.7%) | 81 (2.4%) |
| 90 or more Minutes | 126 (4.0%) | 30 (0.9%) |
Time of Departure to Work by Sex in Ukiah
The most frequent times of departure to work in Ukiah are 8:00 AM to 8:29 AM (486, 15.6%) for males and 8:00 AM to 8:29 AM (793, 23.6%) for females.
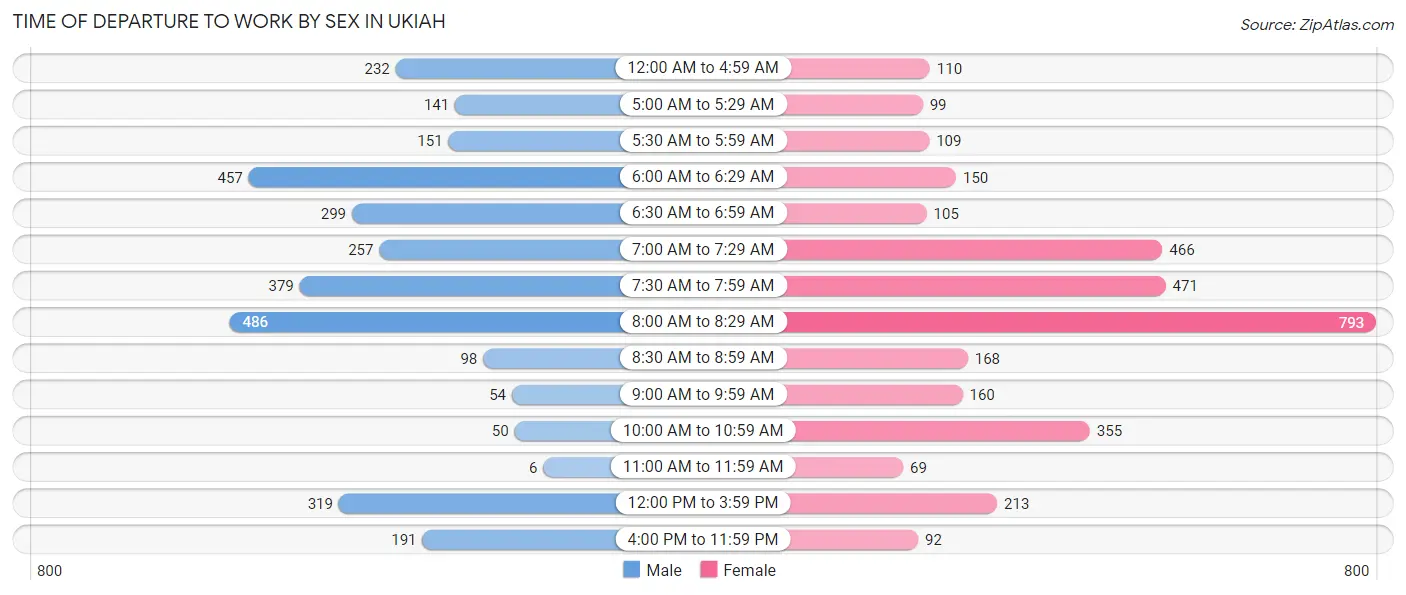
| Time of Departure | Male | Female |
| 12:00 AM to 4:59 AM | 232 (7.4%) | 110 (3.3%) |
| 5:00 AM to 5:29 AM | 141 (4.5%) | 99 (2.9%) |
| 5:30 AM to 5:59 AM | 151 (4.8%) | 109 (3.2%) |
| 6:00 AM to 6:29 AM | 457 (14.6%) | 150 (4.5%) |
| 6:30 AM to 6:59 AM | 299 (9.6%) | 105 (3.1%) |
| 7:00 AM to 7:29 AM | 257 (8.2%) | 466 (13.9%) |
| 7:30 AM to 7:59 AM | 379 (12.1%) | 471 (14.0%) |
| 8:00 AM to 8:29 AM | 486 (15.6%) | 793 (23.6%) |
| 8:30 AM to 8:59 AM | 98 (3.1%) | 168 (5.0%) |
| 9:00 AM to 9:59 AM | 54 (1.7%) | 160 (4.8%) |
| 10:00 AM to 10:59 AM | 50 (1.6%) | 355 (10.6%) |
| 11:00 AM to 11:59 AM | 6 (0.2%) | 69 (2.1%) |
| 12:00 PM to 3:59 PM | 319 (10.2%) | 213 (6.3%) |
| 4:00 PM to 11:59 PM | 191 (6.1%) | 92 (2.7%) |
| Total | 3,120 (100.0%) | 3,360 (100.0%) |
Housing Occupancy in Ukiah
Occupancy by Ownership in Ukiah
Of the total 5,885 dwellings in Ukiah, owner-occupied units account for 2,985 (50.7%), while renter-occupied units make up 2,900 (49.3%).
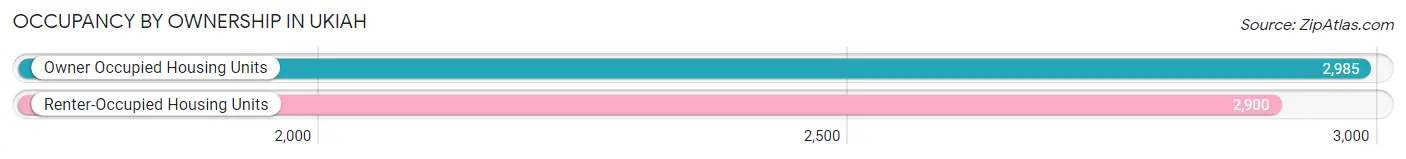
| Occupancy | # Housing Units | % Housing Units |
| Owner Occupied Housing Units | 2,985 | 50.7% |
| Renter-Occupied Housing Units | 2,900 | 49.3% |
| Total Occupied Housing Units | 5,885 | 100.0% |
Occupancy by Household Size in Ukiah
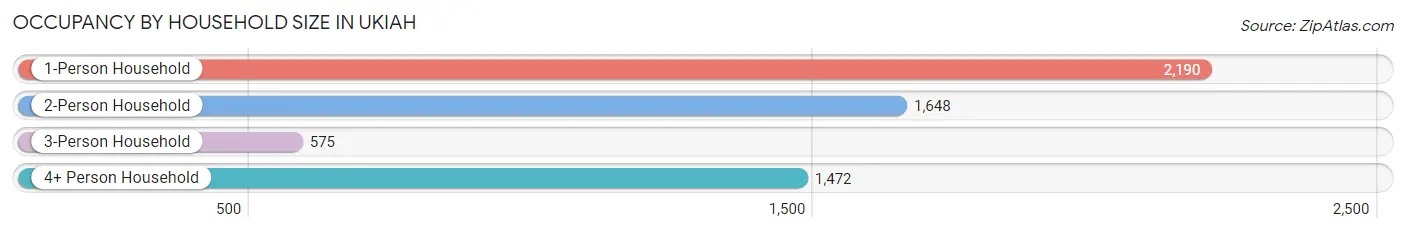
| Household Size | # Housing Units | % Housing Units |
| 1-Person Household | 2,190 | 37.2% |
| 2-Person Household | 1,648 | 28.0% |
| 3-Person Household | 575 | 9.8% |
| 4+ Person Household | 1,472 | 25.0% |
| Total Housing Units | 5,885 | 100.0% |
Occupancy by Ownership by Household Size in Ukiah
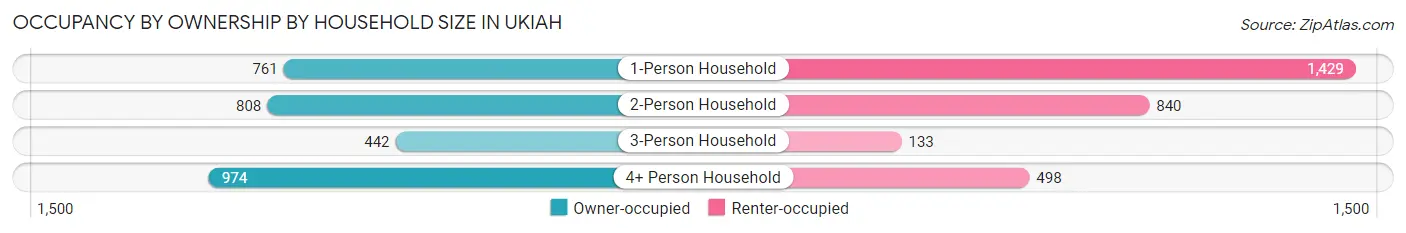
| Household Size | Owner-occupied | Renter-occupied |
| 1-Person Household | 761 (34.7%) | 1,429 (65.2%) |
| 2-Person Household | 808 (49.0%) | 840 (51.0%) |
| 3-Person Household | 442 (76.9%) | 133 (23.1%) |
| 4+ Person Household | 974 (66.2%) | 498 (33.8%) |
| Total Housing Units | 2,985 (50.7%) | 2,900 (49.3%) |
Occupancy by Educational Attainment in Ukiah
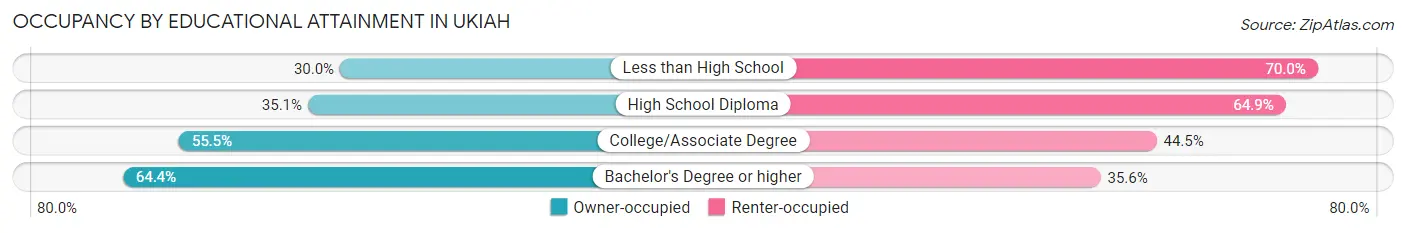
| Household Size | Owner-occupied | Renter-occupied |
| Less than High School | 188 (30.0%) | 439 (70.0%) |
| High School Diploma | 438 (35.1%) | 811 (64.9%) |
| College/Associate Degree | 1,396 (55.5%) | 1,118 (44.5%) |
| Bachelor's Degree or higher | 963 (64.4%) | 532 (35.6%) |
Occupancy by Age of Householder in Ukiah
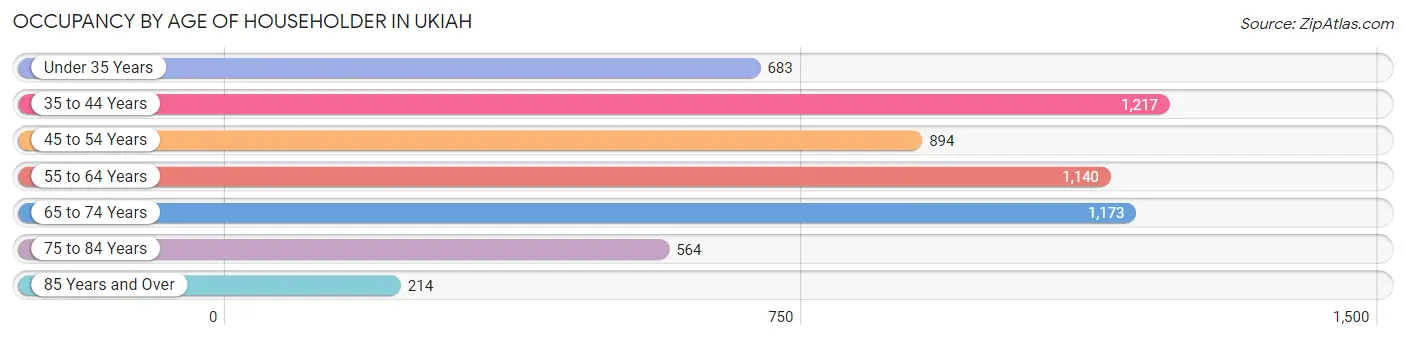
| Age Bracket | # Households | % Households |
| Under 35 Years | 683 | 11.6% |
| 35 to 44 Years | 1,217 | 20.7% |
| 45 to 54 Years | 894 | 15.2% |
| 55 to 64 Years | 1,140 | 19.4% |
| 65 to 74 Years | 1,173 | 19.9% |
| 75 to 84 Years | 564 | 9.6% |
| 85 Years and Over | 214 | 3.6% |
| Total | 5,885 | 100.0% |
Housing Finances in Ukiah
Median Income by Occupancy in Ukiah
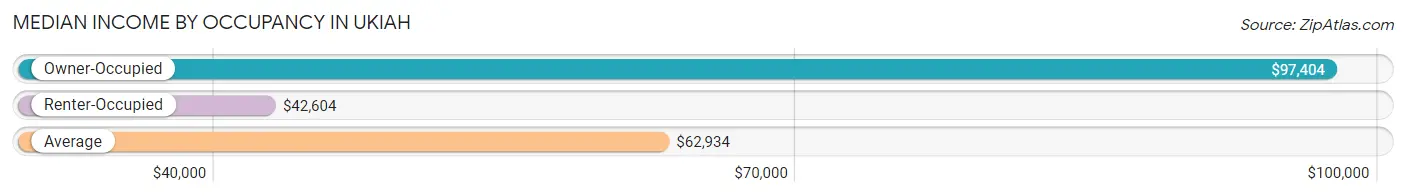
| Occupancy Type | # Households | Median Income |
| Owner-Occupied | 2,985 (50.7%) | $97,404 |
| Renter-Occupied | 2,900 (49.3%) | $42,604 |
| Average | 5,885 (100.0%) | $62,934 |
Occupancy by Householder Income Bracket in Ukiah
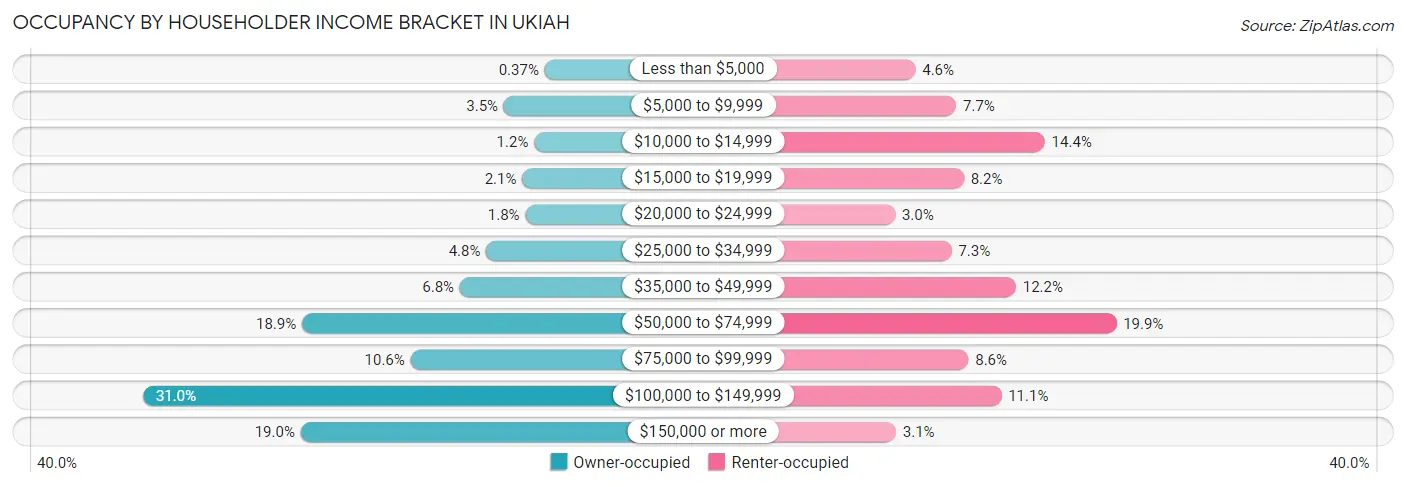
| Income Bracket | Owner-occupied | Renter-occupied |
| Less than $5,000 | 11 (0.4%) | 132 (4.5%) |
| $5,000 to $9,999 | 104 (3.5%) | 222 (7.7%) |
| $10,000 to $14,999 | 35 (1.2%) | 418 (14.4%) |
| $15,000 to $19,999 | 62 (2.1%) | 239 (8.2%) |
| $20,000 to $24,999 | 55 (1.8%) | 87 (3.0%) |
| $25,000 to $34,999 | 144 (4.8%) | 212 (7.3%) |
| $35,000 to $49,999 | 204 (6.8%) | 354 (12.2%) |
| $50,000 to $74,999 | 563 (18.9%) | 576 (19.9%) |
| $75,000 to $99,999 | 316 (10.6%) | 249 (8.6%) |
| $100,000 to $149,999 | 925 (31.0%) | 322 (11.1%) |
| $150,000 or more | 566 (19.0%) | 89 (3.1%) |
| Total | 2,985 (100.0%) | 2,900 (100.0%) |
Monthly Housing Cost Tiers in Ukiah
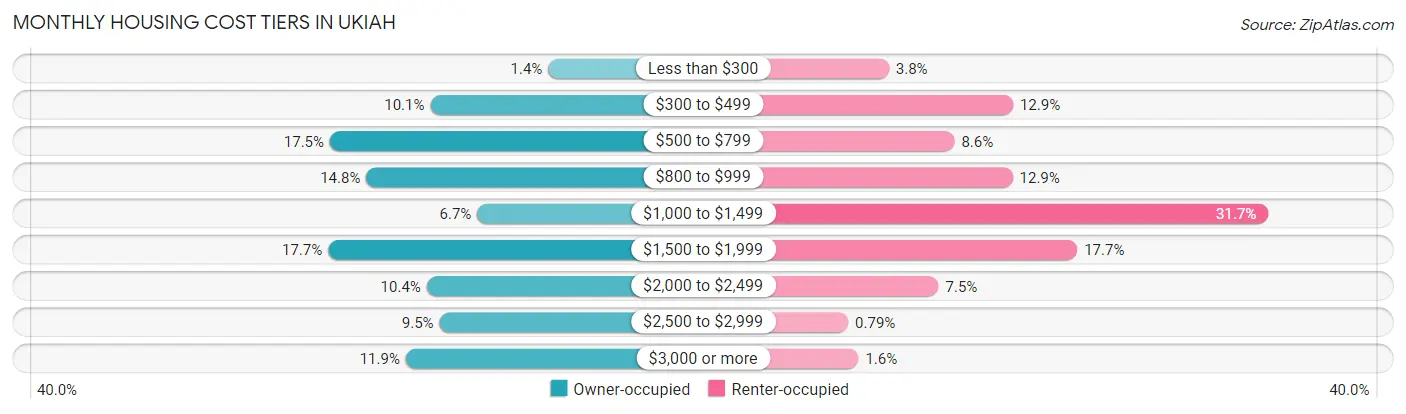
| Monthly Cost | Owner-occupied | Renter-occupied |
| Less than $300 | 43 (1.4%) | 110 (3.8%) |
| $300 to $499 | 302 (10.1%) | 375 (12.9%) |
| $500 to $799 | 523 (17.5%) | 250 (8.6%) |
| $800 to $999 | 443 (14.8%) | 374 (12.9%) |
| $1,000 to $1,499 | 199 (6.7%) | 920 (31.7%) |
| $1,500 to $1,999 | 527 (17.6%) | 512 (17.7%) |
| $2,000 to $2,499 | 310 (10.4%) | 216 (7.4%) |
| $2,500 to $2,999 | 282 (9.5%) | 23 (0.8%) |
| $3,000 or more | 356 (11.9%) | 45 (1.5%) |
| Total | 2,985 (100.0%) | 2,900 (100.0%) |
Physical Housing Characteristics in Ukiah
Housing Structures in Ukiah
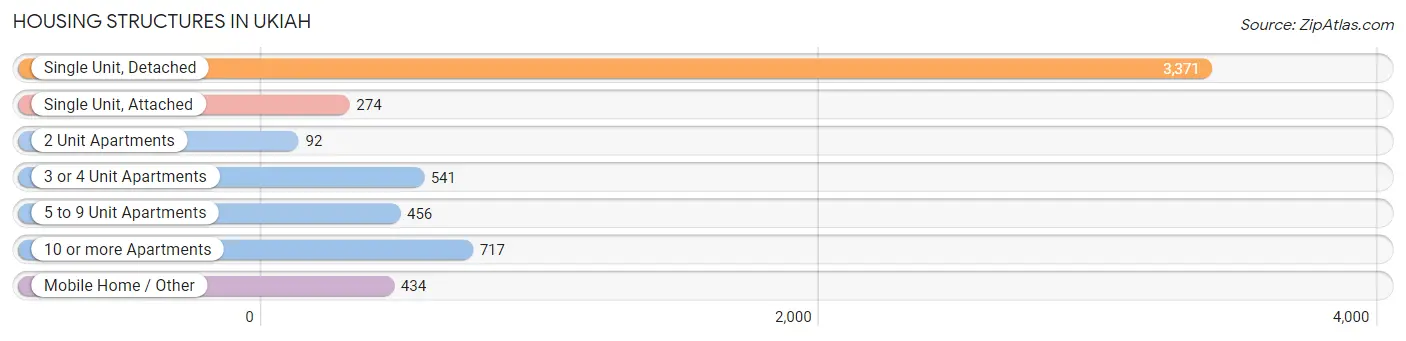
| Structure Type | # Housing Units | % Housing Units |
| Single Unit, Detached | 3,371 | 57.3% |
| Single Unit, Attached | 274 | 4.7% |
| 2 Unit Apartments | 92 | 1.6% |
| 3 or 4 Unit Apartments | 541 | 9.2% |
| 5 to 9 Unit Apartments | 456 | 7.7% |
| 10 or more Apartments | 717 | 12.2% |
| Mobile Home / Other | 434 | 7.4% |
| Total | 5,885 | 100.0% |
Housing Structures by Occupancy in Ukiah
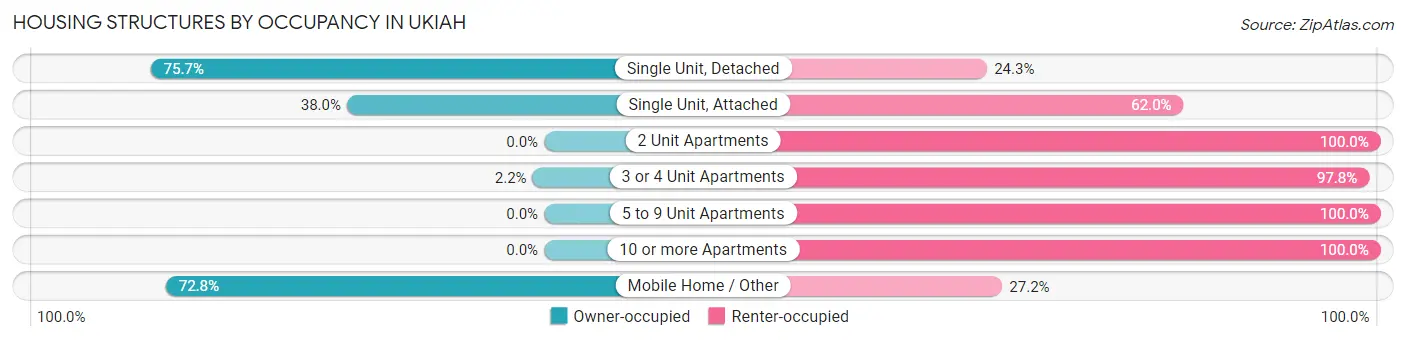
| Structure Type | Owner-occupied | Renter-occupied |
| Single Unit, Detached | 2,553 (75.7%) | 818 (24.3%) |
| Single Unit, Attached | 104 (38.0%) | 170 (62.0%) |
| 2 Unit Apartments | 0 (0.0%) | 92 (100.0%) |
| 3 or 4 Unit Apartments | 12 (2.2%) | 529 (97.8%) |
| 5 to 9 Unit Apartments | 0 (0.0%) | 456 (100.0%) |
| 10 or more Apartments | 0 (0.0%) | 717 (100.0%) |
| Mobile Home / Other | 316 (72.8%) | 118 (27.2%) |
| Total | 2,985 (50.7%) | 2,900 (49.3%) |
Housing Structures by Number of Rooms in Ukiah
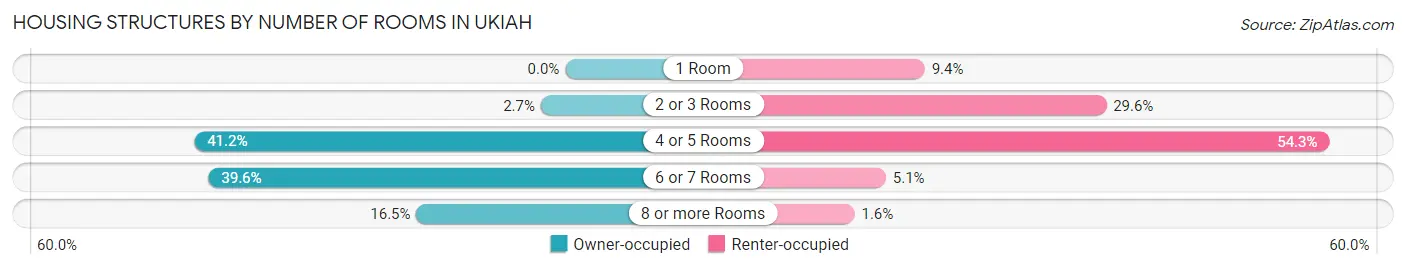
| Number of Rooms | Owner-occupied | Renter-occupied |
| 1 Room | 0 (0.0%) | 273 (9.4%) |
| 2 or 3 Rooms | 81 (2.7%) | 857 (29.5%) |
| 4 or 5 Rooms | 1,229 (41.2%) | 1,575 (54.3%) |
| 6 or 7 Rooms | 1,182 (39.6%) | 148 (5.1%) |
| 8 or more Rooms | 493 (16.5%) | 47 (1.6%) |
| Total | 2,985 (100.0%) | 2,900 (100.0%) |
Housing Structure by Heating Type in Ukiah
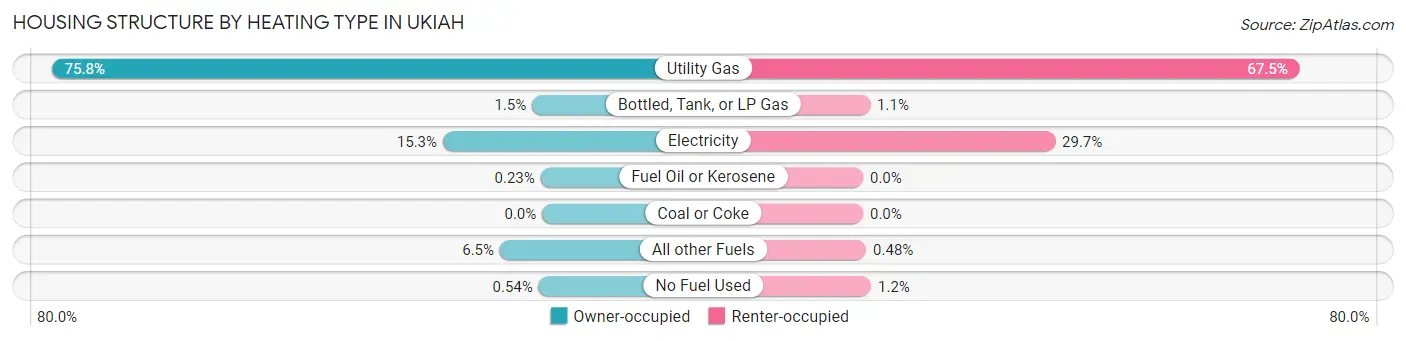
| Heating Type | Owner-occupied | Renter-occupied |
| Utility Gas | 2,263 (75.8%) | 1,957 (67.5%) |
| Bottled, Tank, or LP Gas | 46 (1.5%) | 32 (1.1%) |
| Electricity | 458 (15.3%) | 861 (29.7%) |
| Fuel Oil or Kerosene | 7 (0.2%) | 0 (0.0%) |
| Coal or Coke | 0 (0.0%) | 0 (0.0%) |
| All other Fuels | 195 (6.5%) | 14 (0.5%) |
| No Fuel Used | 16 (0.5%) | 36 (1.2%) |
| Total | 2,985 (100.0%) | 2,900 (100.0%) |
Household Vehicle Usage in Ukiah
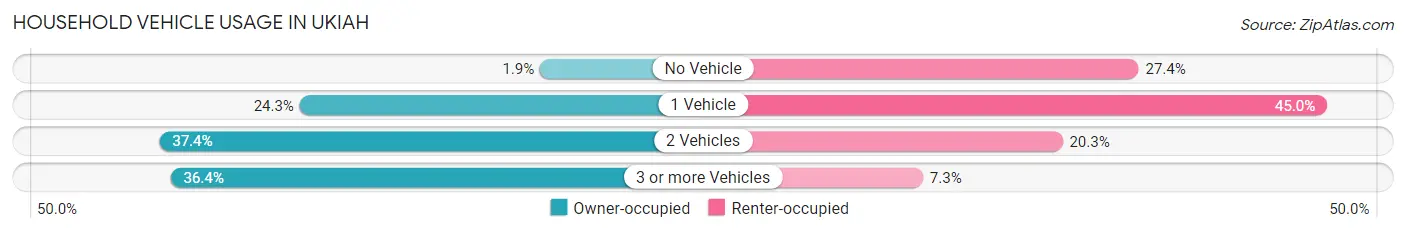
| Vehicles per Household | Owner-occupied | Renter-occupied |
| No Vehicle | 56 (1.9%) | 795 (27.4%) |
| 1 Vehicle | 726 (24.3%) | 1,305 (45.0%) |
| 2 Vehicles | 1,117 (37.4%) | 589 (20.3%) |
| 3 or more Vehicles | 1,086 (36.4%) | 211 (7.3%) |
| Total | 2,985 (100.0%) | 2,900 (100.0%) |
Real Estate & Mortgages in Ukiah
Real Estate and Mortgage Overview in Ukiah
| Characteristic | Without Mortgage | With Mortgage |
| Housing Units | 1,318 | 1,667 |
| Median Property Value | $421,500 | $453,800 |
| Median Household Income | $69,038 | $376 |
| Monthly Housing Costs | $672 | $356 |
| Real Estate Taxes | $2,650 | $74 |
Property Value by Mortgage Status in Ukiah
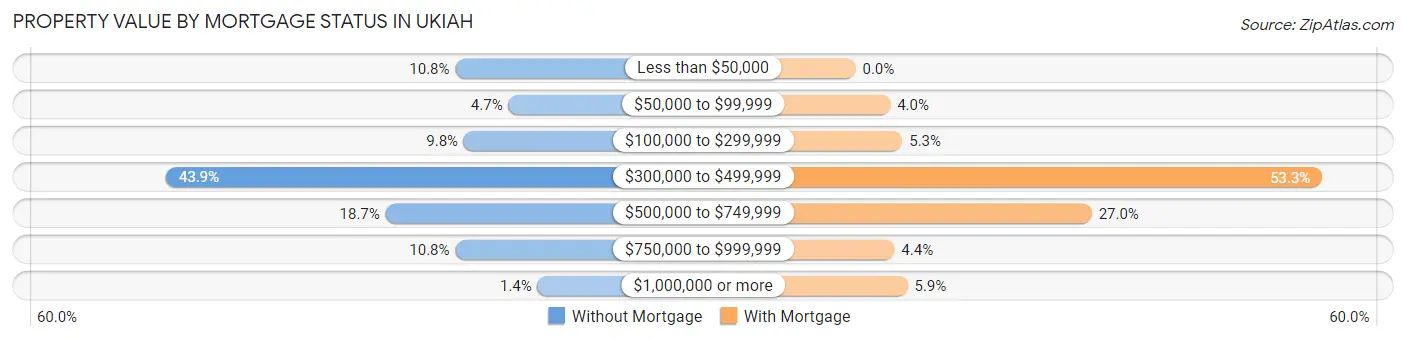
| Property Value | Without Mortgage | With Mortgage |
| Less than $50,000 | 142 (10.8%) | 0 (0.0%) |
| $50,000 to $99,999 | 62 (4.7%) | 66 (4.0%) |
| $100,000 to $299,999 | 129 (9.8%) | 89 (5.3%) |
| $300,000 to $499,999 | 578 (43.9%) | 889 (53.3%) |
| $500,000 to $749,999 | 247 (18.7%) | 450 (27.0%) |
| $750,000 to $999,999 | 142 (10.8%) | 74 (4.4%) |
| $1,000,000 or more | 18 (1.4%) | 99 (5.9%) |
| Total | 1,318 (100.0%) | 1,667 (100.0%) |
Household Income by Mortgage Status in Ukiah
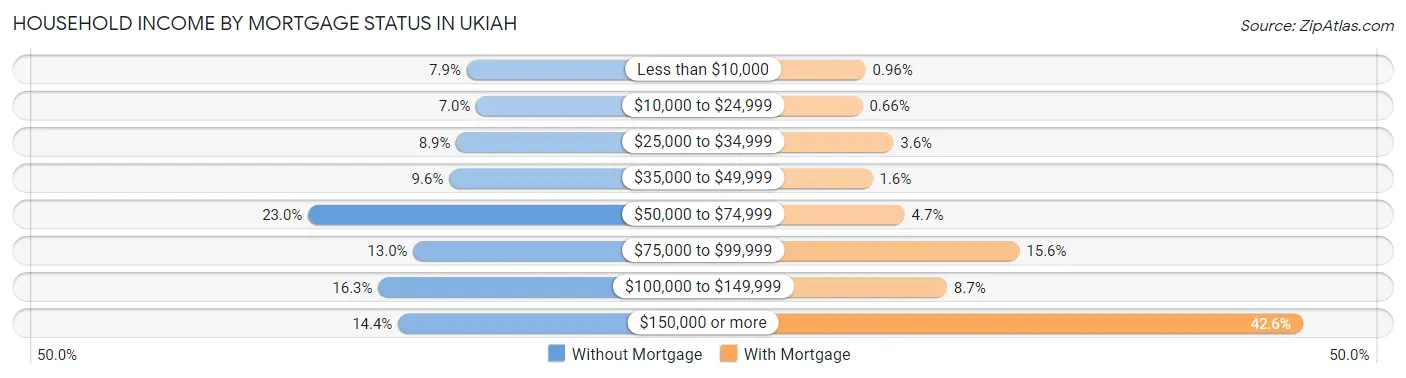
| Household Income | Without Mortgage | With Mortgage |
| Less than $10,000 | 104 (7.9%) | 16 (1.0%) |
| $10,000 to $24,999 | 92 (7.0%) | 11 (0.7%) |
| $25,000 to $34,999 | 117 (8.9%) | 60 (3.6%) |
| $35,000 to $49,999 | 126 (9.6%) | 27 (1.6%) |
| $50,000 to $74,999 | 303 (23.0%) | 78 (4.7%) |
| $75,000 to $99,999 | 171 (13.0%) | 260 (15.6%) |
| $100,000 to $149,999 | 215 (16.3%) | 145 (8.7%) |
| $150,000 or more | 190 (14.4%) | 710 (42.6%) |
| Total | 1,318 (100.0%) | 1,667 (100.0%) |
Property Value to Household Income Ratio in Ukiah
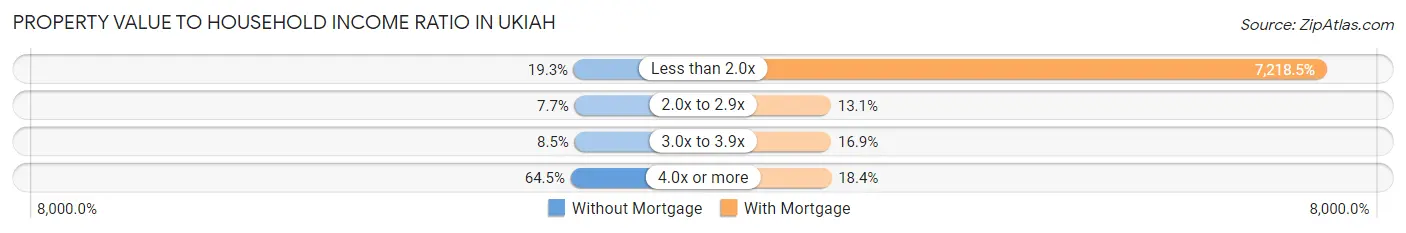
| Value-to-Income Ratio | Without Mortgage | With Mortgage |
| Less than 2.0x | 254 (19.3%) | 120,332 (7,218.5%) |
| 2.0x to 2.9x | 102 (7.7%) | 218 (13.1%) |
| 3.0x to 3.9x | 112 (8.5%) | 282 (16.9%) |
| 4.0x or more | 850 (64.5%) | 306 (18.4%) |
| Total | 1,318 (100.0%) | 1,667 (100.0%) |
Real Estate Taxes by Mortgage Status in Ukiah
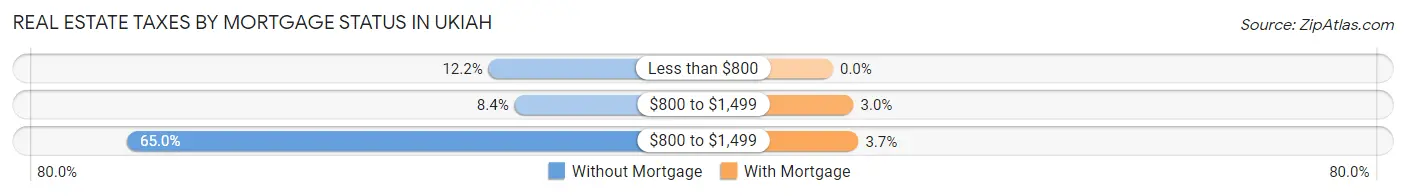
| Property Taxes | Without Mortgage | With Mortgage |
| Less than $800 | 161 (12.2%) | 0 (0.0%) |
| $800 to $1,499 | 111 (8.4%) | 50 (3.0%) |
| $800 to $1,499 | 857 (65.0%) | 62 (3.7%) |
| Total | 1,318 (100.0%) | 1,667 (100.0%) |
Health & Disability in Ukiah
Health Insurance Coverage by Age in Ukiah
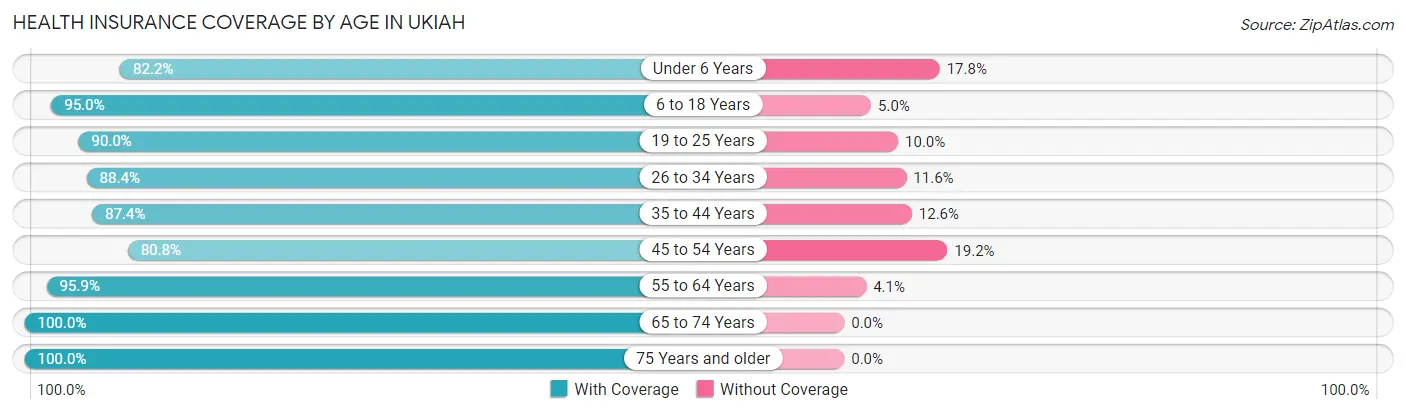
| Age Bracket | With Coverage | Without Coverage |
| Under 6 Years | 993 (82.2%) | 215 (17.8%) |
| 6 to 18 Years | 2,893 (95.0%) | 152 (5.0%) |
| 19 to 25 Years | 1,362 (90.0%) | 152 (10.0%) |
| 26 to 34 Years | 1,252 (88.4%) | 164 (11.6%) |
| 35 to 44 Years | 2,178 (87.4%) | 314 (12.6%) |
| 45 to 54 Years | 1,504 (80.8%) | 358 (19.2%) |
| 55 to 64 Years | 1,828 (95.9%) | 78 (4.1%) |
| 65 to 74 Years | 1,614 (100.0%) | 0 (0.0%) |
| 75 Years and older | 1,015 (100.0%) | 0 (0.0%) |
| Total | 14,639 (91.1%) | 1,433 (8.9%) |
Health Insurance Coverage by Citizenship Status in Ukiah
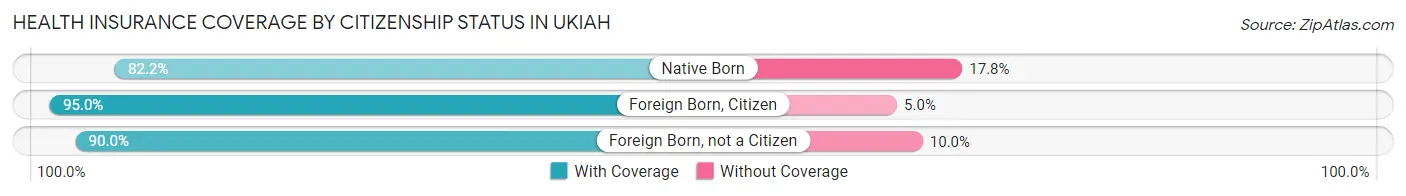
| Citizenship Status | With Coverage | Without Coverage |
| Native Born | 993 (82.2%) | 215 (17.8%) |
| Foreign Born, Citizen | 2,893 (95.0%) | 152 (5.0%) |
| Foreign Born, not a Citizen | 1,362 (90.0%) | 152 (10.0%) |
Health Insurance Coverage by Household Income in Ukiah
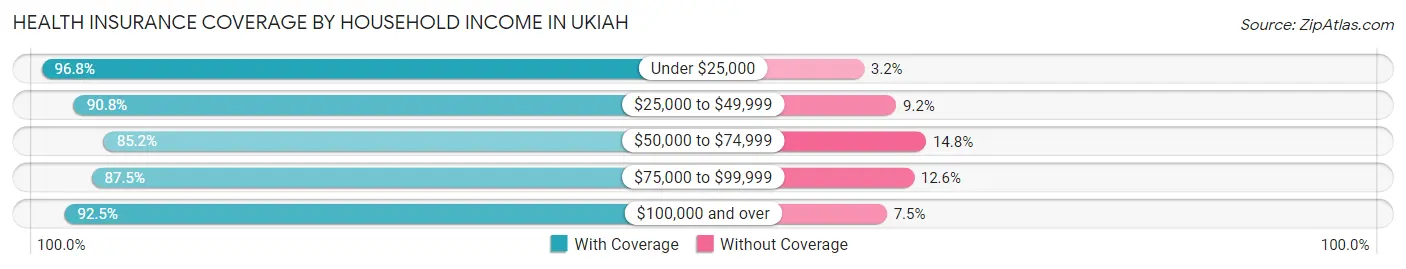
| Household Income | With Coverage | Without Coverage |
| Under $25,000 | 1,945 (96.8%) | 64 (3.2%) |
| $25,000 to $49,999 | 1,983 (90.8%) | 202 (9.2%) |
| $50,000 to $74,999 | 2,497 (85.2%) | 435 (14.8%) |
| $75,000 to $99,999 | 1,463 (87.5%) | 210 (12.6%) |
| $100,000 and over | 6,457 (92.5%) | 522 (7.5%) |
Public vs Private Health Insurance Coverage by Age in Ukiah
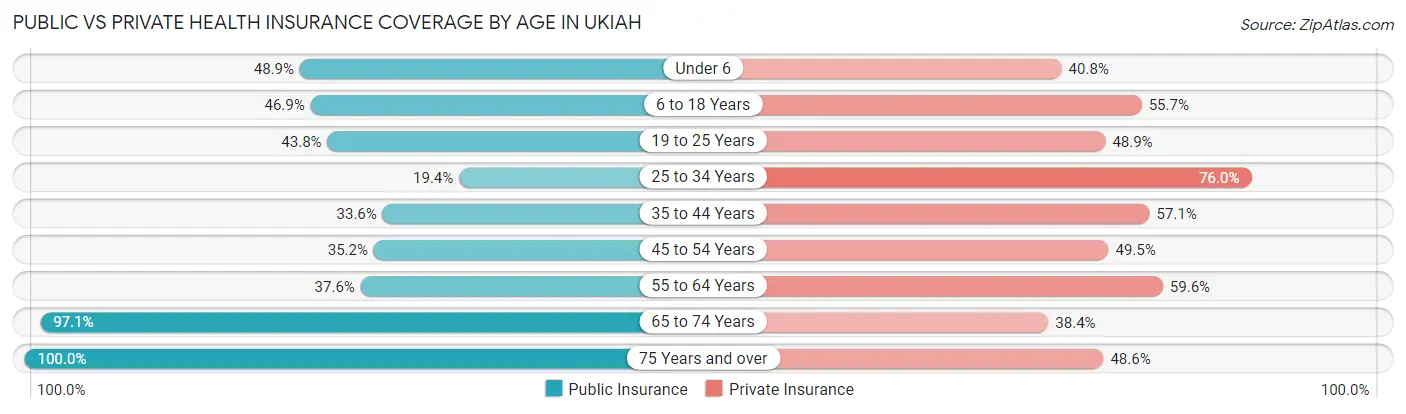
| Age Bracket | Public Insurance | Private Insurance |
| Under 6 | 591 (48.9%) | 493 (40.8%) |
| 6 to 18 Years | 1,429 (46.9%) | 1,695 (55.7%) |
| 19 to 25 Years | 663 (43.8%) | 741 (48.9%) |
| 25 to 34 Years | 274 (19.4%) | 1,076 (76.0%) |
| 35 to 44 Years | 836 (33.6%) | 1,424 (57.1%) |
| 45 to 54 Years | 655 (35.2%) | 922 (49.5%) |
| 55 to 64 Years | 717 (37.6%) | 1,136 (59.6%) |
| 65 to 74 Years | 1,567 (97.1%) | 619 (38.4%) |
| 75 Years and over | 1,015 (100.0%) | 493 (48.6%) |
| Total | 7,747 (48.2%) | 8,599 (53.5%) |
Disability Status by Sex by Age in Ukiah
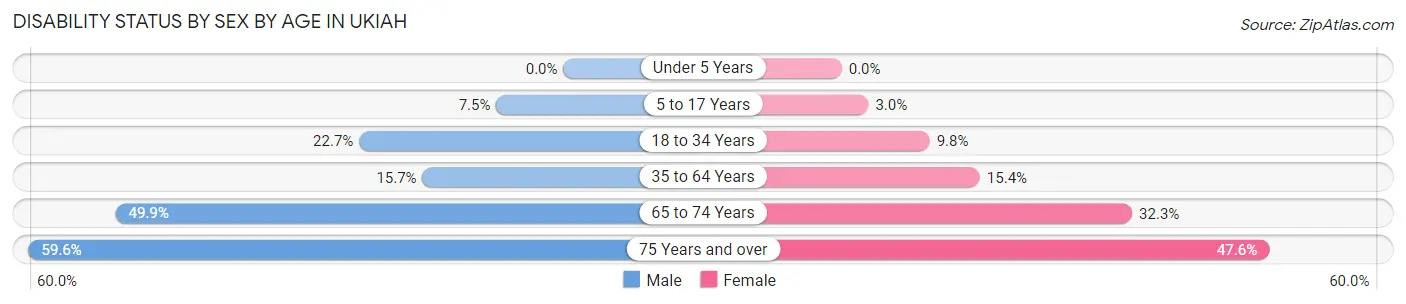
| Age Bracket | Male | Female |
| Under 5 Years | 0 (0.0%) | 0 (0.0%) |
| 5 to 17 Years | 110 (7.5%) | 51 (3.0%) |
| 18 to 34 Years | 363 (22.7%) | 139 (9.8%) |
| 35 to 64 Years | 454 (15.7%) | 518 (15.4%) |
| 65 to 74 Years | 370 (49.9%) | 282 (32.3%) |
| 75 Years and over | 274 (59.6%) | 264 (47.6%) |
Disability Class by Sex by Age in Ukiah
Disability Class: Hearing Difficulty
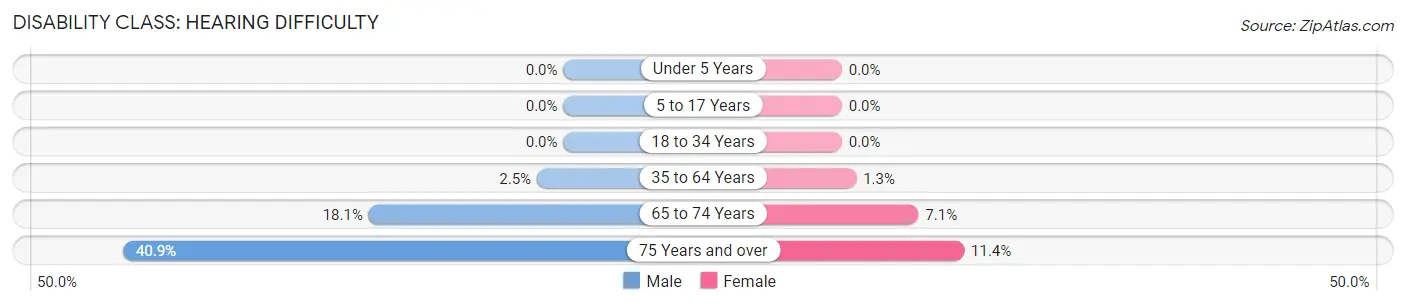
| Age Bracket | Male | Female |
| Under 5 Years | 0 (0.0%) | 0 (0.0%) |
| 5 to 17 Years | 0 (0.0%) | 0 (0.0%) |
| 18 to 34 Years | 0 (0.0%) | 0 (0.0%) |
| 35 to 64 Years | 71 (2.5%) | 45 (1.3%) |
| 65 to 74 Years | 134 (18.1%) | 62 (7.1%) |
| 75 Years and over | 188 (40.9%) | 63 (11.4%) |
Disability Class: Vision Difficulty
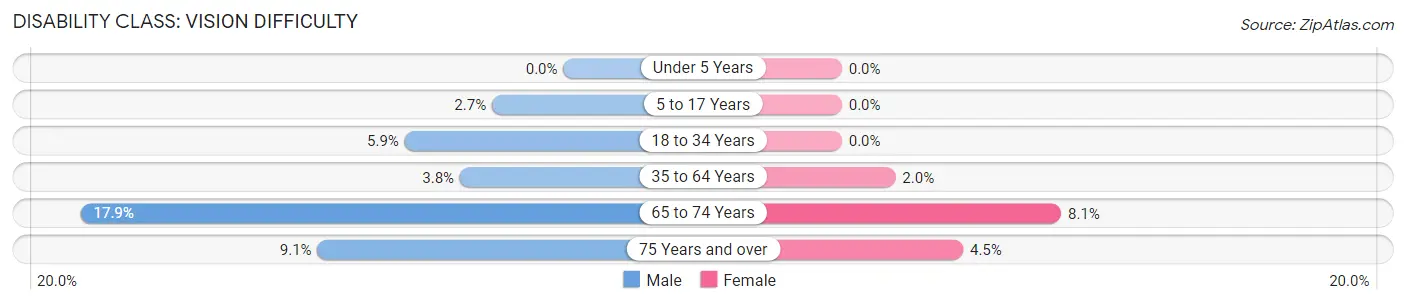
| Age Bracket | Male | Female |
| Under 5 Years | 0 (0.0%) | 0 (0.0%) |
| 5 to 17 Years | 39 (2.6%) | 0 (0.0%) |
| 18 to 34 Years | 94 (5.9%) | 0 (0.0%) |
| 35 to 64 Years | 111 (3.8%) | 67 (2.0%) |
| 65 to 74 Years | 133 (17.9%) | 71 (8.1%) |
| 75 Years and over | 42 (9.1%) | 25 (4.5%) |
Disability Class: Cognitive Difficulty
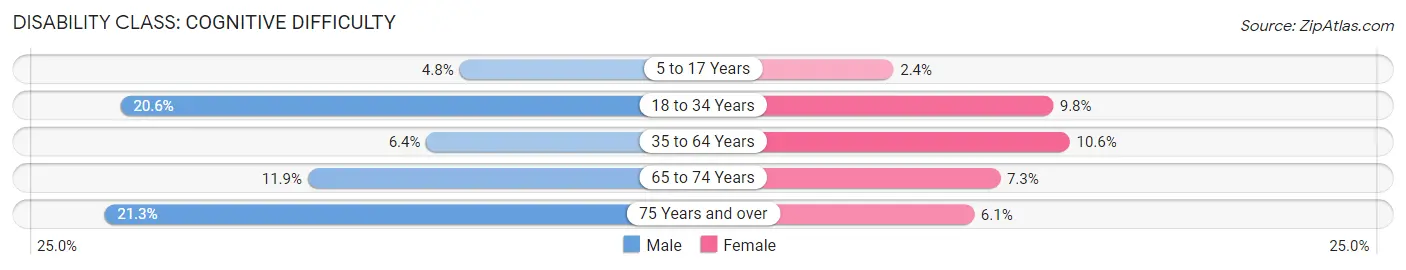
| Age Bracket | Male | Female |
| 5 to 17 Years | 71 (4.8%) | 41 (2.4%) |
| 18 to 34 Years | 328 (20.5%) | 139 (9.8%) |
| 35 to 64 Years | 184 (6.4%) | 356 (10.6%) |
| 65 to 74 Years | 88 (11.9%) | 64 (7.3%) |
| 75 Years and over | 98 (21.3%) | 34 (6.1%) |
Disability Class: Ambulatory Difficulty
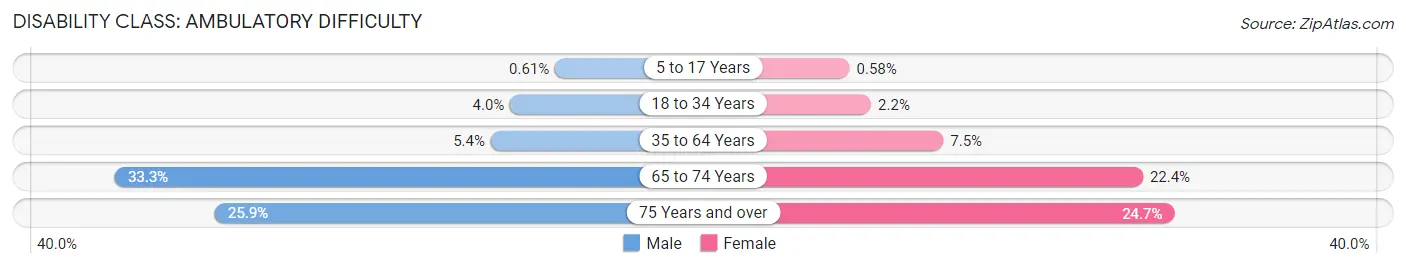
| Age Bracket | Male | Female |
| 5 to 17 Years | 9 (0.6%) | 10 (0.6%) |
| 18 to 34 Years | 63 (4.0%) | 31 (2.2%) |
| 35 to 64 Years | 156 (5.4%) | 254 (7.5%) |
| 65 to 74 Years | 247 (33.3%) | 195 (22.4%) |
| 75 Years and over | 119 (25.9%) | 137 (24.7%) |
Disability Class: Self-Care Difficulty
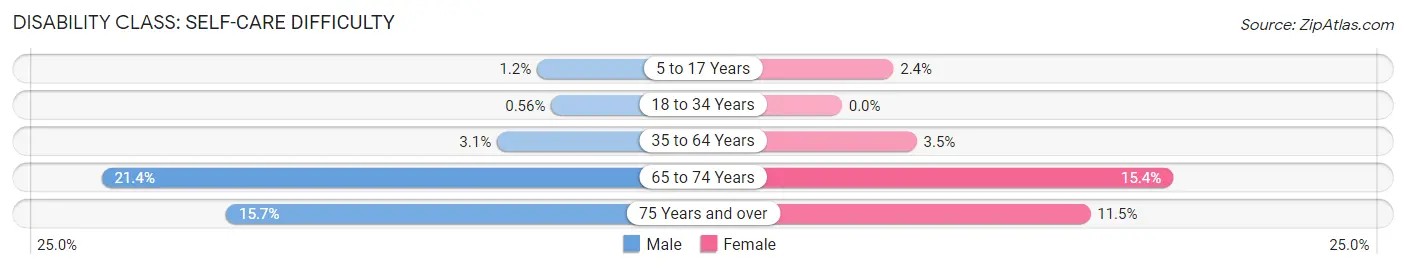
| Age Bracket | Male | Female |
| 5 to 17 Years | 18 (1.2%) | 41 (2.4%) |
| 18 to 34 Years | 9 (0.6%) | 0 (0.0%) |
| 35 to 64 Years | 89 (3.1%) | 117 (3.5%) |
| 65 to 74 Years | 159 (21.4%) | 134 (15.4%) |
| 75 Years and over | 72 (15.7%) | 64 (11.5%) |
Technology Access in Ukiah
Computing Device Access in Ukiah
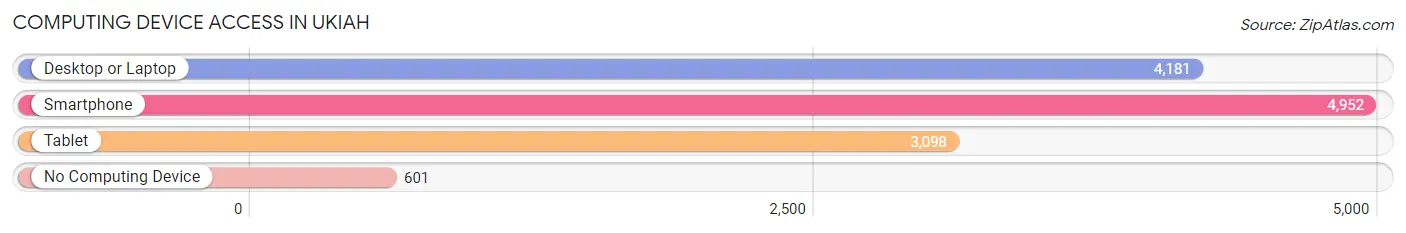
| Device Type | # Households | % Households |
| Desktop or Laptop | 4,181 | 71.1% |
| Smartphone | 4,952 | 84.2% |
| Tablet | 3,098 | 52.6% |
| No Computing Device | 601 | 10.2% |
| Total | 5,885 | 100.0% |
Internet Access in Ukiah
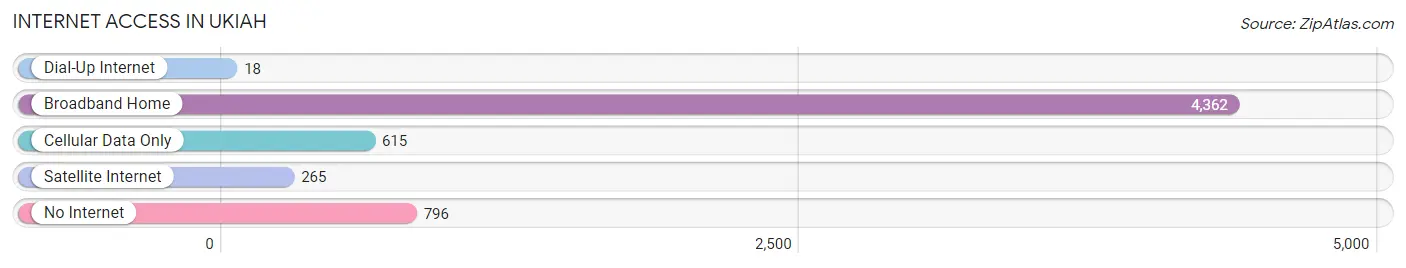
| Internet Type | # Households | % Households |
| Dial-Up Internet | 18 | 0.3% |
| Broadband Home | 4,362 | 74.1% |
| Cellular Data Only | 615 | 10.4% |
| Satellite Internet | 265 | 4.5% |
| No Internet | 796 | 13.5% |
| Total | 5,885 | 100.0% |
Ukiah Summary
History
The city of Ukiah, California is located in Mendocino County, approximately two hours north of San Francisco. The city was founded in 1856 by the Pomo Indians, who named it “Uki”, meaning “deep valley”. The city was later renamed “Ukiah” by the settlers who arrived in the area in the late 1800s. The city was incorporated in 1876 and has since grown to become the largest city in Mendocino County.
The city of Ukiah has a rich history of agriculture and timber production. The area was originally home to the Pomo Indians, who were known for their basket weaving and fishing. In the late 1800s, the area was settled by European immigrants who established farms and ranches. The timber industry also flourished in the area, with the first sawmill being built in 1877. The timber industry continued to be an important part of the local economy until the late 20th century.
The city of Ukiah has also been home to a number of notable figures throughout its history. The most famous of these is the author Jack London, who lived in the area for a time and wrote several of his most famous works while living in Ukiah. The city has also been home to a number of musicians, including the Grateful Dead, who recorded their album “American Beauty” in the city.
Geography
The city of Ukiah is located in the northern part of California’s Central Valley, approximately two hours north of San Francisco. The city is situated in the foothills of the Coast Range Mountains, which provide a stunning backdrop to the city. The city is located at an elevation of approximately 1,000 feet, and the surrounding area is characterized by rolling hills and valleys.
The city of Ukiah is located in a Mediterranean climate zone, which is characterized by hot, dry summers and mild, wet winters. The average annual temperature in the city is approximately 60 degrees Fahrenheit, and the average annual precipitation is approximately 25 inches.
Economy
The economy of Ukiah is largely based on agriculture and tourism. The city is home to a number of wineries and vineyards, which produce a variety of wines that are sold throughout the region. The city is also home to a number of restaurants, bars, and other businesses that cater to tourists.
The city is also home to a number of manufacturing and industrial businesses, including a number of lumber mills and other wood-related businesses. The city is also home to a number of technology companies, including a number of software and web development firms.
Demographics
As of the 2010 census, the city of Ukiah had a population of 16,075. The racial makeup of the city was 68.3% White, 1.3% African American, 0.7% Native American, 1.3% Asian, 0.2% Pacific Islander, and 28.2% from other races. The median household income in the city was $41,945, and the median age was 36.7 years.
Conclusion
The city of Ukiah, California is a vibrant and diverse city located in the northern part of California’s Central Valley. The city has a rich history of agriculture and timber production, and is home to a number of wineries and vineyards. The city is also home to a number of technology companies, and the median household income is approximately $41,945. The city is home to a diverse population, with the majority of residents being White, followed by African American, Native American, Asian, and Pacific Islander.
Common Questions
What is Per Capita Income in Ukiah?
Per Capita income in Ukiah is $34,729.
What is the Median Family Income in Ukiah?
Median Family Income in Ukiah is $89,080.
What is the Median Household income in Ukiah?
Median Household Income in Ukiah is $62,934.
What is Income or Wage Gap in Ukiah?
Income or Wage Gap in Ukiah is 31.7%.
Women in Ukiah earn 68.3 cents for every dollar earned by a man.
What is Family Income Deficit in Ukiah?
Family Income Deficit in Ukiah is $11,254.
Families that are below poverty line in Ukiah earn $11,254 less on average than the poverty threshold level.
What is Inequality or Gini Index in Ukiah?
Inequality or Gini Index in Ukiah is 0.51.
What is the Total Population of Ukiah?
Total Population of Ukiah is 16,496.
What is the Total Male Population of Ukiah?
Total Male Population of Ukiah is 8,043.
What is the Total Female Population of Ukiah?
Total Female Population of Ukiah is 8,453.
What is the Ratio of Males per 100 Females in Ukiah?
There are 95.15 Males per 100 Females in Ukiah.
What is the Ratio of Females per 100 Males in Ukiah?
There are 105.10 Females per 100 Males in Ukiah.
What is the Median Population Age in Ukiah?
Median Population Age in Ukiah is 38.9 Years.
What is the Average Family Size in Ukiah
Average Family Size in Ukiah is 3.6 People.
What is the Average Household Size in Ukiah
Average Household Size in Ukiah is 2.7 People.
How Large is the Labor Force in Ukiah?
There are 7,932 People in the Labor Forcein in Ukiah.
What is the Percentage of People in the Labor Force in Ukiah?
61.9% of People are in the Labor Force in Ukiah.
What is the Unemployment Rate in Ukiah?
Unemployment Rate in Ukiah is 8.4%.