Trinidad, CA Map & Demographics
Trinidad Map
Trinidad Overview
$54,570
PER CAPITA INCOME
$81,500
AVG FAMILY INCOME
$82,250
AVG HOUSEHOLD INCOME
39.5%
WAGE / INCOME GAP [ % ]
60.5¢/ $1
WAGE / INCOME GAP [ $ ]
0.49
INEQUALITY / GINI INDEX
449
TOTAL POPULATION
250
MALE POPULATION
199
FEMALE POPULATION
125.63
MALES / 100 FEMALES
79.60
FEMALES / 100 MALES
55.9
MEDIAN AGE
2.6
AVG FAMILY SIZE
2.2
AVG HOUSEHOLD SIZE
195
LABOR FORCE [ PEOPLE ]
47.0%
PERCENT IN LABOR FORCE
10.3%
UNEMPLOYMENT RATE
Trinidad Zip Codes
Trinidad Area Codes
Income in Trinidad
Income Overview in Trinidad
Per Capita Income in Trinidad is $54,570, while median incomes of families and households are $81,500 and $82,250 respectively.
| Characteristic | Number | Measure |
| Per Capita Income | 449 | $54,570 |
| Median Family Income | 136 | $81,500 |
| Mean Family Income | 136 | $140,001 |
| Median Household Income | 203 | $82,250 |
| Mean Household Income | 203 | $123,094 |
| Income Deficit | 136 | $0 |
| Wage / Income Gap (%) | 449 | 39.54% |
| Wage / Income Gap ($) | 449 | 60.46¢ per $1 |
| Gini / Inequality Index | 449 | 0.49 |
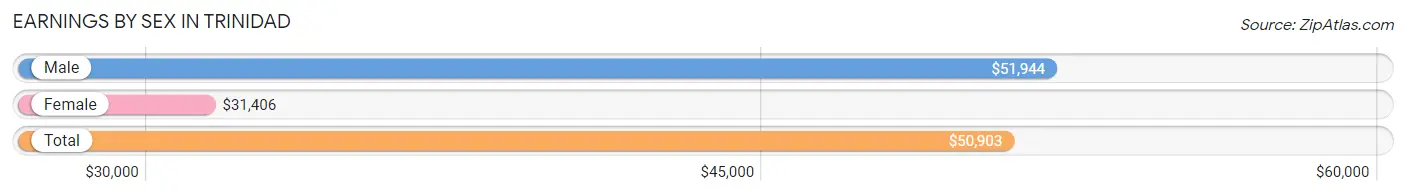
Earnings by Sex in Trinidad
Average Earnings in Trinidad are $50,903, $51,944 for men and $31,406 for women, a difference of 39.5%.
| Sex | Number | Average Earnings |
| Male | 116 (56.0%) | $51,944 |
| Female | 91 (44.0%) | $31,406 |
| Total | 207 (100.0%) | $50,903 |
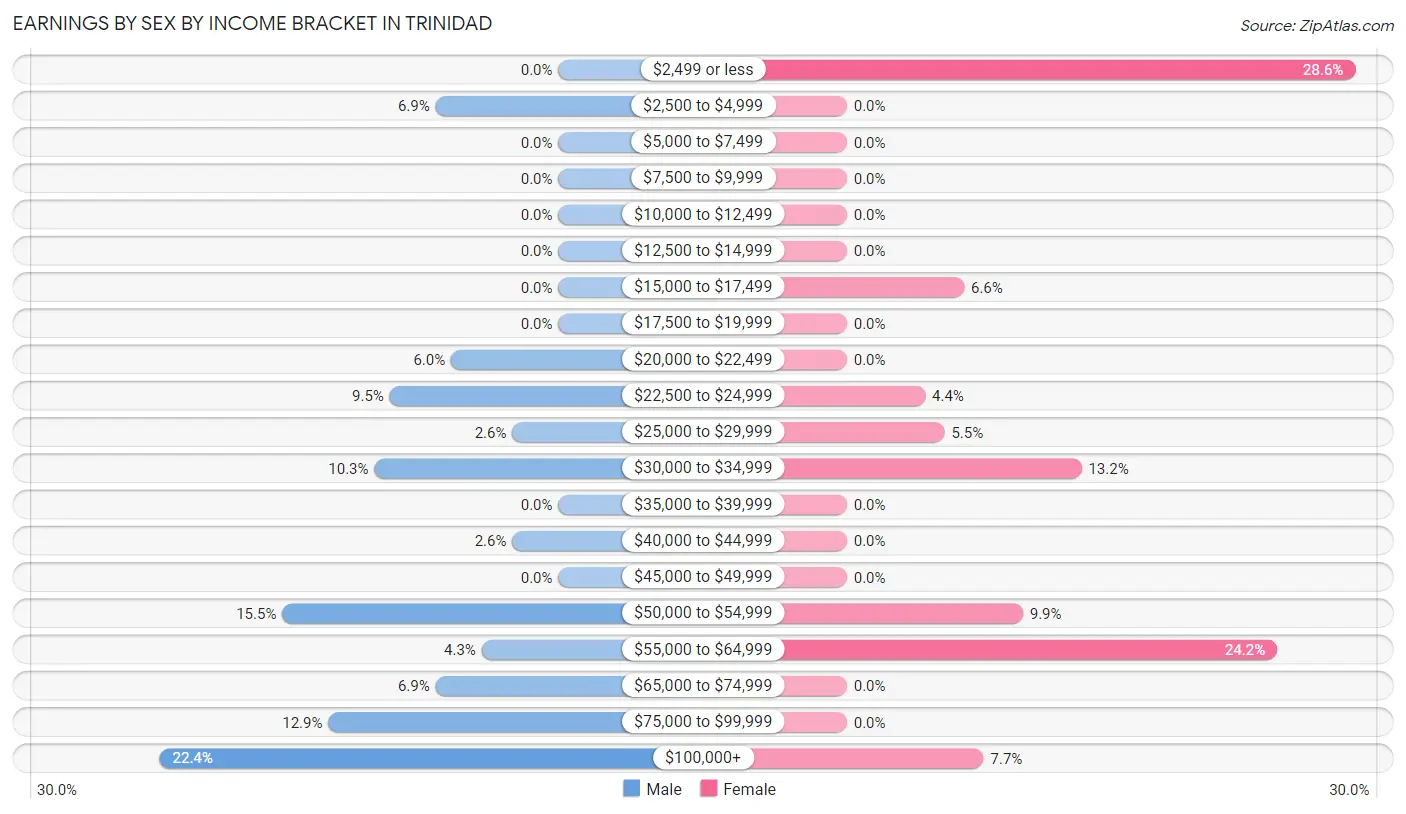
Earnings by Sex by Income Bracket in Trinidad
The most common earnings brackets in Trinidad are $100,000+ for men (26 | 22.4%) and $2,499 or less for women (26 | 28.6%).
| Income | Male | Female |
| $2,499 or less | 0 (0.0%) | 26 (28.6%) |
| $2,500 to $4,999 | 8 (6.9%) | 0 (0.0%) |
| $5,000 to $7,499 | 0 (0.0%) | 0 (0.0%) |
| $7,500 to $9,999 | 0 (0.0%) | 0 (0.0%) |
| $10,000 to $12,499 | 0 (0.0%) | 0 (0.0%) |
| $12,500 to $14,999 | 0 (0.0%) | 0 (0.0%) |
| $15,000 to $17,499 | 0 (0.0%) | 6 (6.6%) |
| $17,500 to $19,999 | 0 (0.0%) | 0 (0.0%) |
| $20,000 to $22,499 | 7 (6.0%) | 0 (0.0%) |
| $22,500 to $24,999 | 11 (9.5%) | 4 (4.4%) |
| $25,000 to $29,999 | 3 (2.6%) | 5 (5.5%) |
| $30,000 to $34,999 | 12 (10.3%) | 12 (13.2%) |
| $35,000 to $39,999 | 0 (0.0%) | 0 (0.0%) |
| $40,000 to $44,999 | 3 (2.6%) | 0 (0.0%) |
| $45,000 to $49,999 | 0 (0.0%) | 0 (0.0%) |
| $50,000 to $54,999 | 18 (15.5%) | 9 (9.9%) |
| $55,000 to $64,999 | 5 (4.3%) | 22 (24.2%) |
| $65,000 to $74,999 | 8 (6.9%) | 0 (0.0%) |
| $75,000 to $99,999 | 15 (12.9%) | 0 (0.0%) |
| $100,000+ | 26 (22.4%) | 7 (7.7%) |
| Total | 116 (100.0%) | 91 (100.0%) |
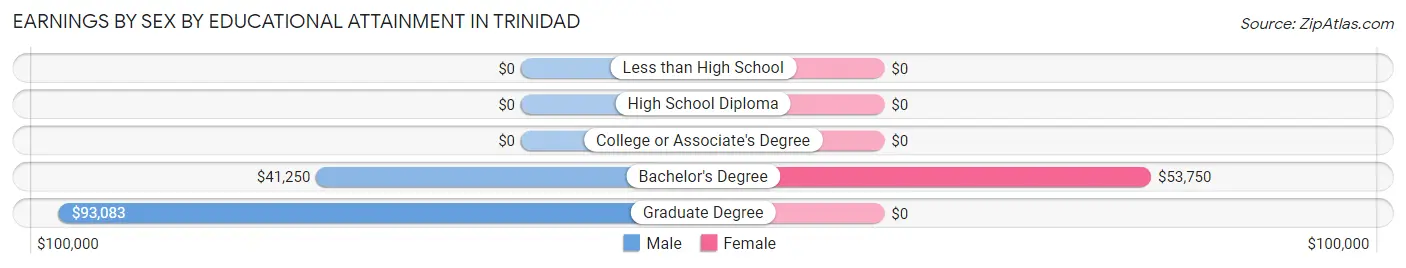
Earnings by Sex by Educational Attainment in Trinidad
Average earnings in Trinidad are $55,750 for men and $52,639 for women, a difference of 5.6%. Men with an educational attainment of graduate degree enjoy the highest average annual earnings of $93,083, while those with bachelor's degree education earn the least with $41,250. Women with an educational attainment of bachelor's degree earn the most with the average annual earnings of $53,750, while those with bachelor's degree education have the smallest earnings of $53,750.
| Educational Attainment | Male Income | Female Income |
| Less than High School | - | - |
| High School Diploma | - | - |
| College or Associate's Degree | - | - |
| Bachelor's Degree | $41,250 | $53,750 |
| Graduate Degree | $93,083 | $0 |
| Total | $55,750 | $52,639 |
Family Income in Trinidad
Family Income Brackets in Trinidad
According to the Trinidad family income data, there are 32 families falling into the $50,000 to $74,999 income range, which is the most common income bracket and makes up 23.5% of all families.
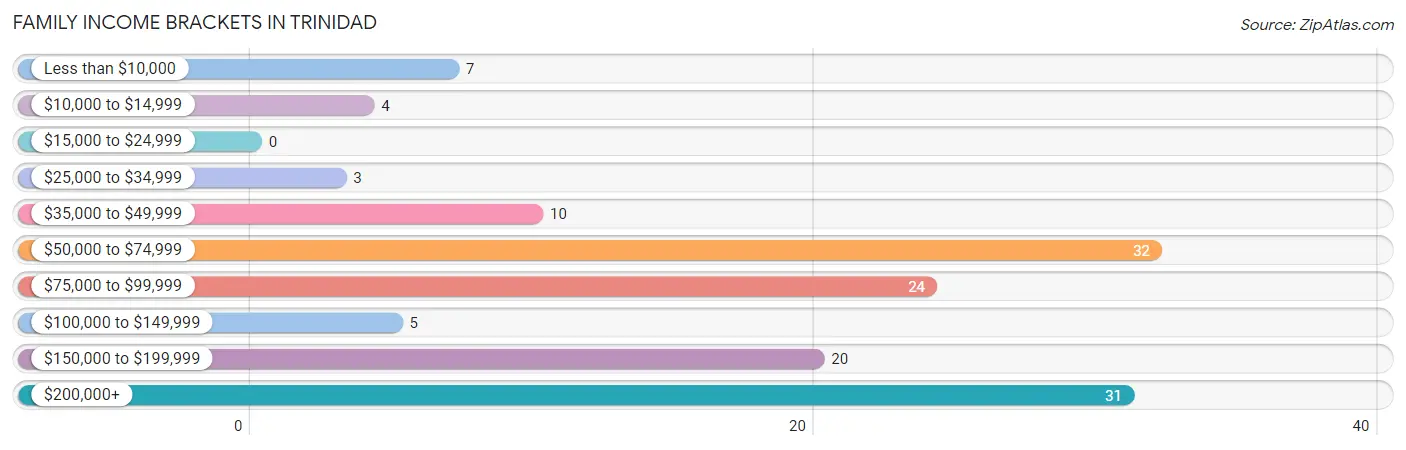
| Income Bracket | # Families | % Families |
| Less than $10,000 | 7 | 5.1% |
| $10,000 to $14,999 | 4 | 2.9% |
| $15,000 to $24,999 | 0 | 0.0% |
| $25,000 to $34,999 | 3 | 2.2% |
| $35,000 to $49,999 | 10 | 7.4% |
| $50,000 to $74,999 | 32 | 23.5% |
| $75,000 to $99,999 | 24 | 17.6% |
| $100,000 to $149,999 | 5 | 3.7% |
| $150,000 to $199,999 | 20 | 14.7% |
| $200,000+ | 31 | 22.8% |
Family Income by Famaliy Size in Trinidad
2-person families (108 | 79.4%) account for the highest median family income in Trinidad with $80,000 per family, while 2-person families (108 | 79.4%) have the highest median income of $40,000 per family member.
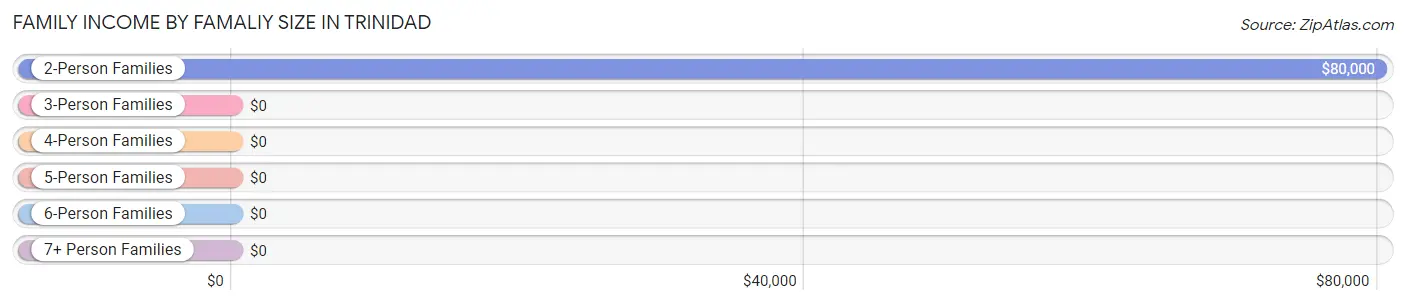
| Income Bracket | # Families | Median Income |
| 2-Person Families | 108 (79.4%) | $80,000 |
| 3-Person Families | 3 (2.2%) | $0 |
| 4-Person Families | 24 (17.6%) | $0 |
| 5-Person Families | 1 (0.7%) | $0 |
| 6-Person Families | 0 (0.0%) | $0 |
| 7+ Person Families | 0 (0.0%) | $0 |
| Total | 136 (100.0%) | $81,500 |
Family Income by Number of Earners in Trinidad
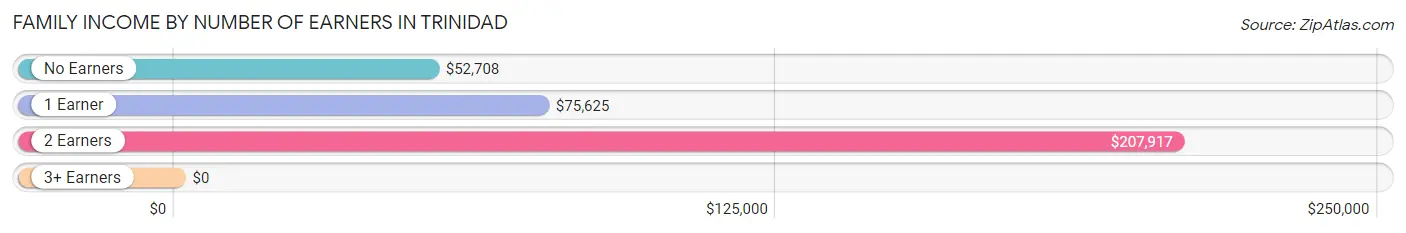
| Number of Earners | # Families | Median Income |
| No Earners | 35 (25.7%) | $52,708 |
| 1 Earner | 59 (43.4%) | $75,625 |
| 2 Earners | 34 (25.0%) | $207,917 |
| 3+ Earners | 8 (5.9%) | $0 |
| Total | 136 (100.0%) | $81,500 |
Household Income in Trinidad
Household Income Brackets in Trinidad
With 41 households falling in the category, the $50,000 to $74,999 income range is the most frequent in Trinidad, accounting for 20.2% of all households. In contrast, only 3 households (1.5%) fall into the $25,000 to $34,999 income bracket, making it the least populous group.
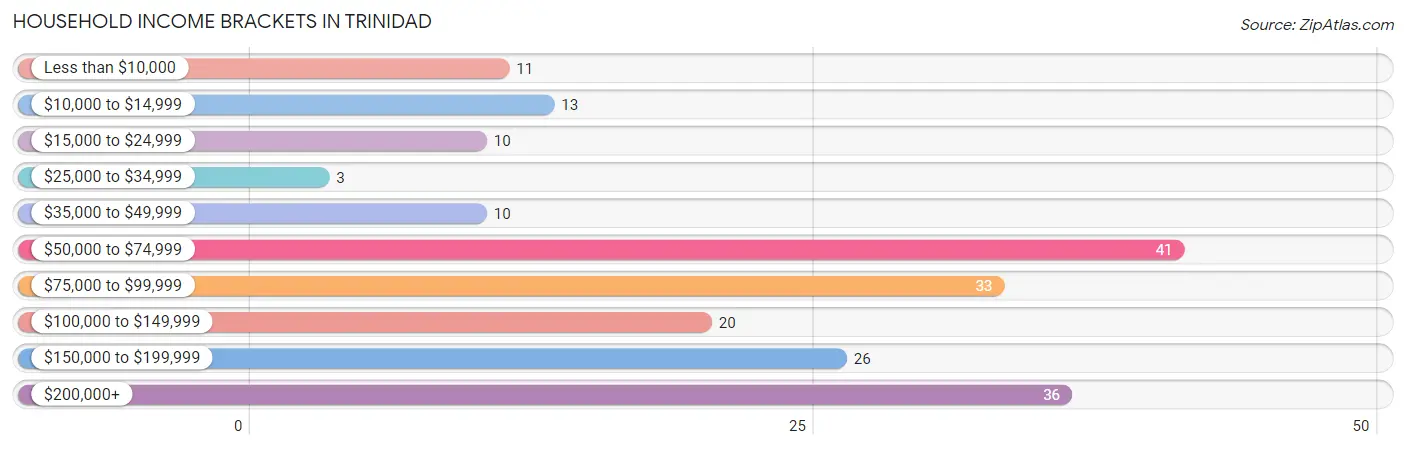
| Income Bracket | # Households | % Households |
| Less than $10,000 | 11 | 5.4% |
| $10,000 to $14,999 | 13 | 6.4% |
| $15,000 to $24,999 | 10 | 4.9% |
| $25,000 to $34,999 | 3 | 1.5% |
| $35,000 to $49,999 | 10 | 4.9% |
| $50,000 to $74,999 | 41 | 20.2% |
| $75,000 to $99,999 | 33 | 16.3% |
| $100,000 to $149,999 | 20 | 9.9% |
| $150,000 to $199,999 | 26 | 12.8% |
| $200,000+ | 36 | 17.7% |
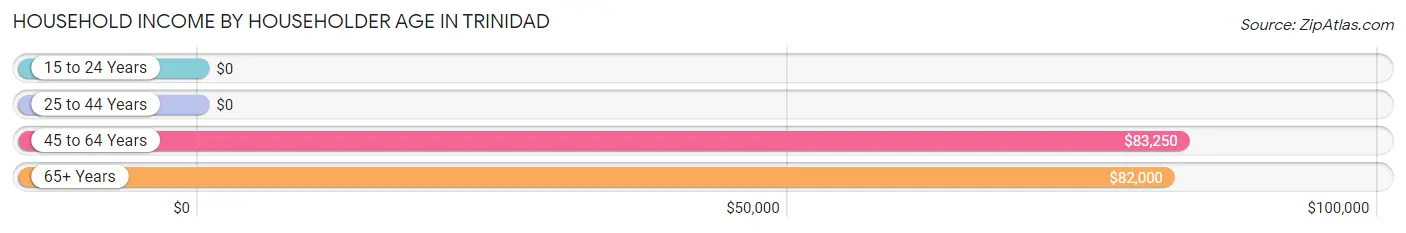
Household Income by Householder Age in Trinidad
The median household income in Trinidad is $82,250, with the highest median household income of $83,250 found in the 45 to 64 years age bracket for the primary householder. A total of 77 households (37.9%) fall into this category.
| Income Bracket | # Households | Median Income |
| 15 to 24 Years | 0 (0.0%) | $0 |
| 25 to 44 Years | 36 (17.7%) | $0 |
| 45 to 64 Years | 77 (37.9%) | $83,250 |
| 65+ Years | 90 (44.3%) | $82,000 |
| Total | 203 (100.0%) | $82,250 |
Poverty in Trinidad
Income Below Poverty by Sex and Age in Trinidad
With 15.6% poverty level for males and 12.1% for females among the residents of Trinidad, 12 to 14 year old males and 6 to 11 year old females are the most vulnerable to poverty, with 5 males (100.0%) and 5 females (71.4%) in their respective age groups living below the poverty level.
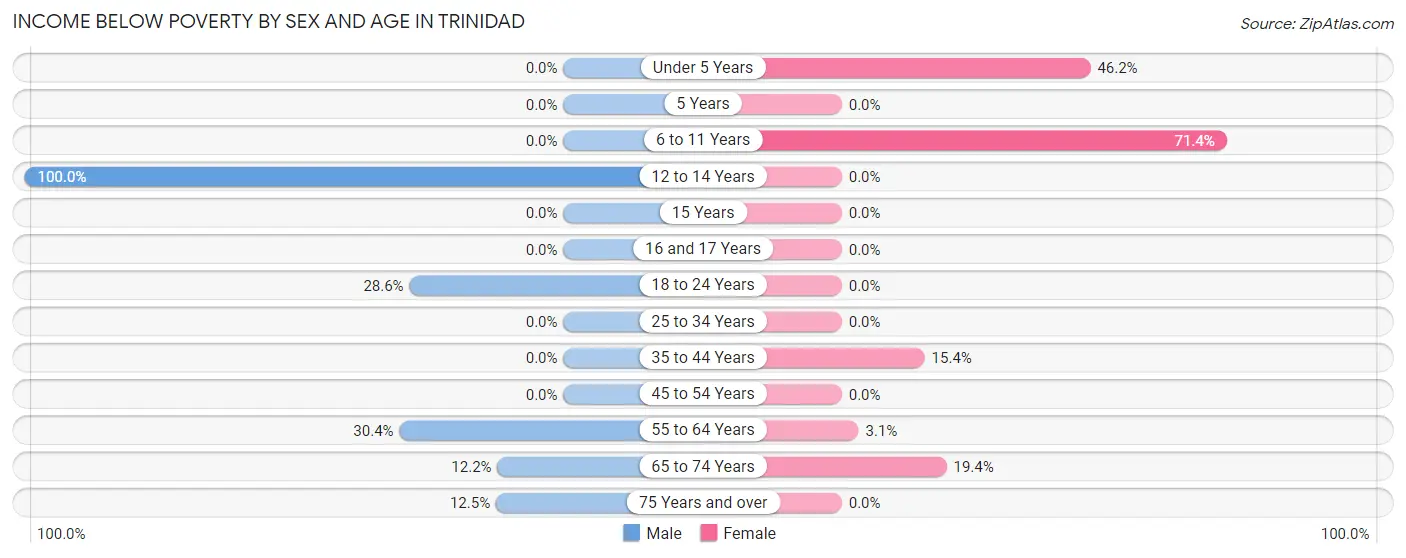
| Age Bracket | Male | Female |
| Under 5 Years | 0 (0.0%) | 6 (46.2%) |
| 5 Years | 0 (0.0%) | 0 (0.0%) |
| 6 to 11 Years | 0 (0.0%) | 5 (71.4%) |
| 12 to 14 Years | 5 (100.0%) | 0 (0.0%) |
| 15 Years | 0 (0.0%) | 0 (0.0%) |
| 16 and 17 Years | 0 (0.0%) | 0 (0.0%) |
| 18 to 24 Years | 10 (28.6%) | 0 (0.0%) |
| 25 to 34 Years | 0 (0.0%) | 0 (0.0%) |
| 35 to 44 Years | 0 (0.0%) | 4 (15.4%) |
| 45 to 54 Years | 0 (0.0%) | 0 (0.0%) |
| 55 to 64 Years | 14 (30.4%) | 2 (3.1%) |
| 65 to 74 Years | 6 (12.2%) | 7 (19.4%) |
| 75 Years and over | 4 (12.5%) | 0 (0.0%) |
| Total | 39 (15.6%) | 24 (12.1%) |
Income Above Poverty by Sex and Age in Trinidad
According to the poverty statistics in Trinidad, males aged under 5 years and females aged 18 to 24 years are the age groups that are most secure financially, with 100.0% of males and 100.0% of females in these age groups living above the poverty line.
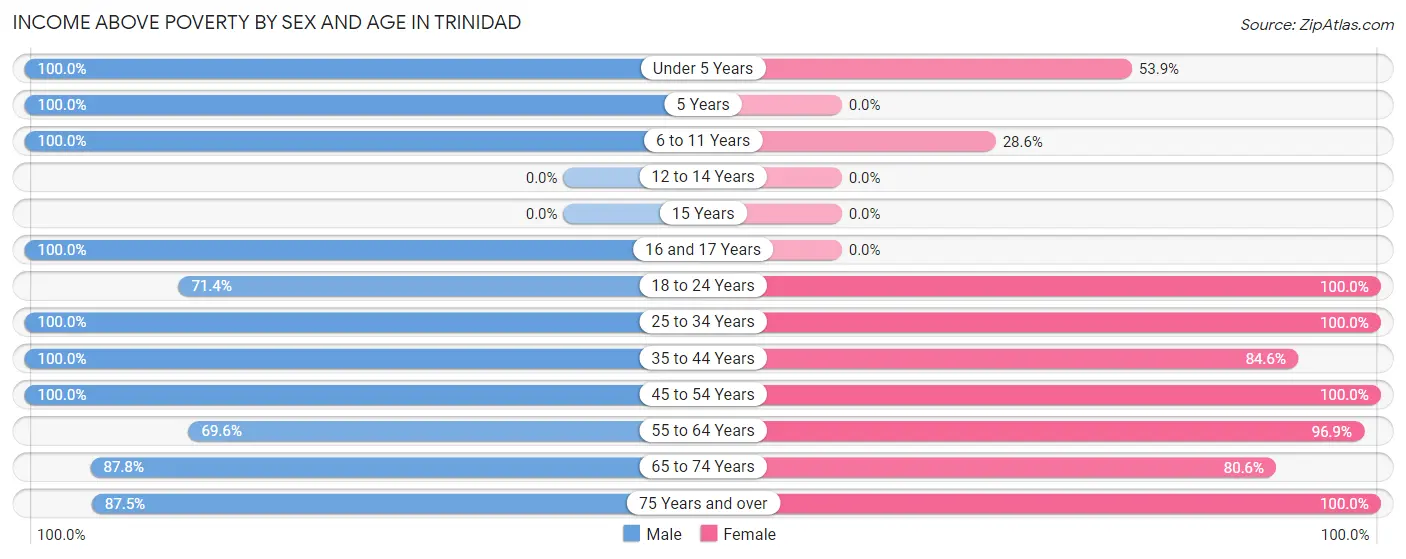
| Age Bracket | Male | Female |
| Under 5 Years | 7 (100.0%) | 7 (53.8%) |
| 5 Years | 1 (100.0%) | 0 (0.0%) |
| 6 to 11 Years | 1 (100.0%) | 2 (28.6%) |
| 12 to 14 Years | 0 (0.0%) | 0 (0.0%) |
| 15 Years | 0 (0.0%) | 0 (0.0%) |
| 16 and 17 Years | 17 (100.0%) | 0 (0.0%) |
| 18 to 24 Years | 25 (71.4%) | 16 (100.0%) |
| 25 to 34 Years | 13 (100.0%) | 8 (100.0%) |
| 35 to 44 Years | 20 (100.0%) | 22 (84.6%) |
| 45 to 54 Years | 24 (100.0%) | 15 (100.0%) |
| 55 to 64 Years | 32 (69.6%) | 62 (96.9%) |
| 65 to 74 Years | 43 (87.8%) | 29 (80.6%) |
| 75 Years and over | 28 (87.5%) | 14 (100.0%) |
| Total | 211 (84.4%) | 175 (87.9%) |
Income Below Poverty Among Married-Couple Families in Trinidad
The poverty statistics for married-couple families in Trinidad show that 6.5% or 7 of the total 107 families live below the poverty line. Families with no children have the highest poverty rate of 7.1%, comprising of 7 families. On the other hand, families with 1 or 2 children have the lowest poverty rate of 0.0%, which includes 0 families.
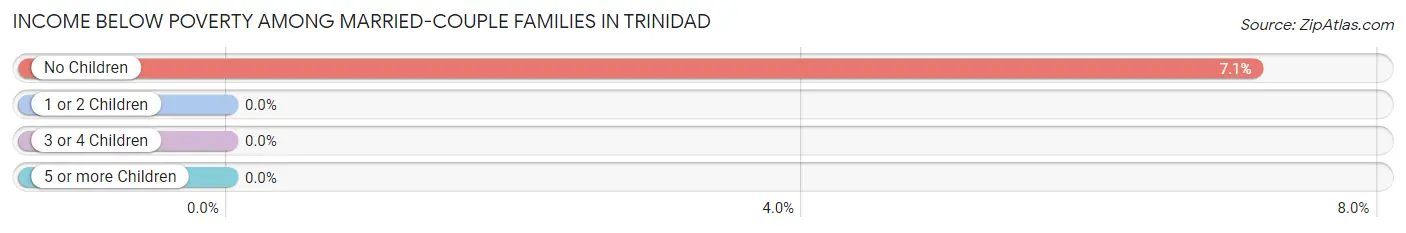
| Children | Above Poverty | Below Poverty |
| No Children | 91 (92.9%) | 7 (7.1%) |
| 1 or 2 Children | 8 (100.0%) | 0 (0.0%) |
| 3 or 4 Children | 1 (100.0%) | 0 (0.0%) |
| 5 or more Children | 0 (0.0%) | 0 (0.0%) |
| Total | 100 (93.5%) | 7 (6.5%) |
Income Below Poverty Among Single-Parent Households in Trinidad
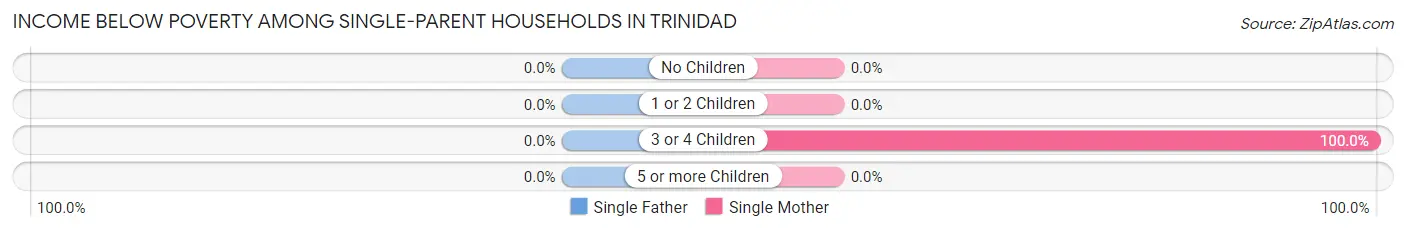
| Children | Single Father | Single Mother |
| No Children | 0 (0.0%) | 0 (0.0%) |
| 1 or 2 Children | 0 (0.0%) | 0 (0.0%) |
| 3 or 4 Children | 0 (0.0%) | 4 (100.0%) |
| 5 or more Children | 0 (0.0%) | 0 (0.0%) |
| Total | 0 (0.0%) | 4 (23.5%) |
Income Below Poverty Among Married-Couple vs Single-Parent Households in Trinidad
The poverty data for Trinidad shows that 7 of the married-couple family households (6.5%) and 4 of the single-parent households (13.8%) are living below the poverty level. Within the married-couple family households, those with no children have the highest poverty rate, with 7 households (7.1%) falling below the poverty line. Among the single-parent households, those with 3 or 4 children have the highest poverty rate, with 4 household (100.0%) living below poverty.
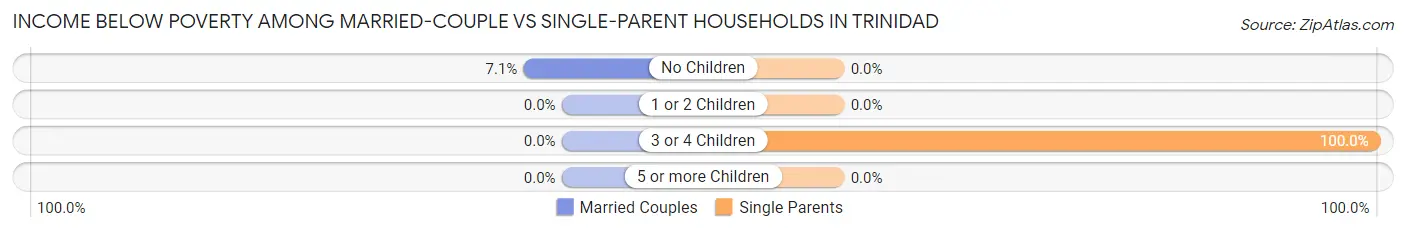
| Children | Married-Couple Families | Single-Parent Households |
| No Children | 7 (7.1%) | 0 (0.0%) |
| 1 or 2 Children | 0 (0.0%) | 0 (0.0%) |
| 3 or 4 Children | 0 (0.0%) | 4 (100.0%) |
| 5 or more Children | 0 (0.0%) | 0 (0.0%) |
| Total | 7 (6.5%) | 4 (13.8%) |
Race in Trinidad
The most populous races in Trinidad are White / Caucasian (368 | 82.0%), Hispanic or Latino (58 | 12.9%), and Two or more Races (42 | 9.3%).
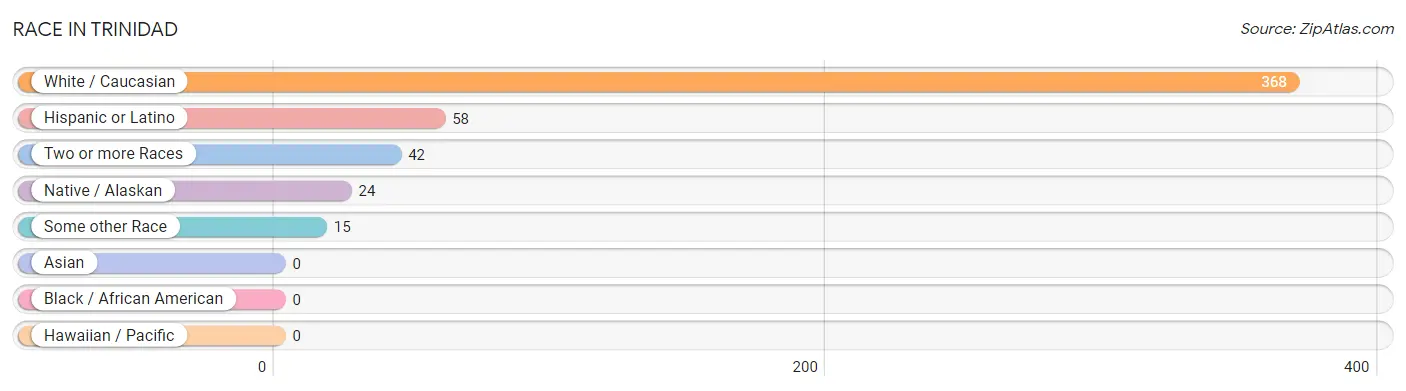
| Race | # Population | % Population |
| Asian | 0 | 0.0% |
| Black / African American | 0 | 0.0% |
| Hawaiian / Pacific | 0 | 0.0% |
| Hispanic or Latino | 58 | 12.9% |
| Native / Alaskan | 24 | 5.3% |
| White / Caucasian | 368 | 82.0% |
| Two or more Races | 42 | 9.3% |
| Some other Race | 15 | 3.3% |
| Total | 449 | 100.0% |
Ancestry in Trinidad
The most populous ancestries reported in Trinidad are English (77 | 17.2%), German (53 | 11.8%), Mexican (44 | 9.8%), Italian (32 | 7.1%), and Irish (29 | 6.5%), together accounting for 52.3% of all Trinidad residents.
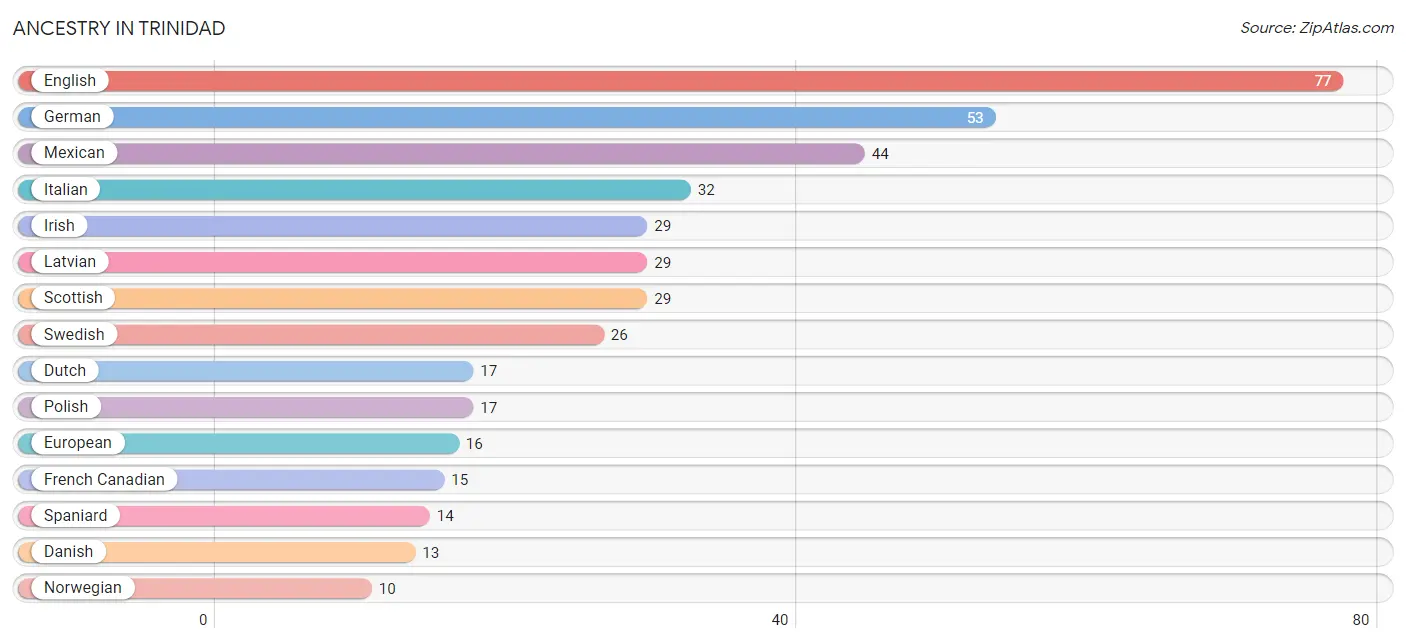
| Ancestry | # Population | % Population |
| American | 2 | 0.4% |
| Cherokee | 5 | 1.1% |
| Danish | 13 | 2.9% |
| Dutch | 17 | 3.8% |
| Eastern European | 4 | 0.9% |
| English | 77 | 17.2% |
| European | 16 | 3.6% |
| French Canadian | 15 | 3.3% |
| German | 53 | 11.8% |
| Guamanian / Chamorro | 5 | 1.1% |
| Irish | 29 | 6.5% |
| Italian | 32 | 7.1% |
| Korean | 6 | 1.3% |
| Latvian | 29 | 6.5% |
| Mexican | 44 | 9.8% |
| Native Hawaiian | 5 | 1.1% |
| Norwegian | 10 | 2.2% |
| Polish | 17 | 3.8% |
| Portuguese | 4 | 0.9% |
| Samoan | 5 | 1.1% |
| Scandinavian | 4 | 0.9% |
| Scotch-Irish | 3 | 0.7% |
| Scottish | 29 | 6.5% |
| Spaniard | 14 | 3.1% |
| Swedish | 26 | 5.8% |
| Swiss | 4 | 0.9% |
| Thai | 5 | 1.1% | View All 27 Rows |
Immigrants in Trinidad
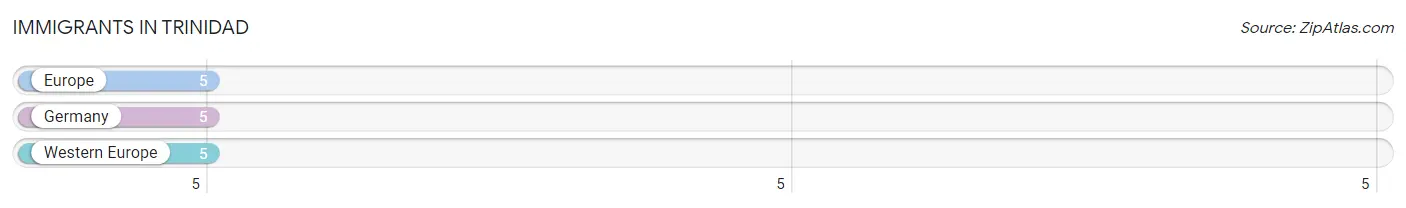
The most numerous immigrant groups reported in Trinidad came from Europe (5 | 1.1%), Germany (5 | 1.1%), and Western Europe (5 | 1.1%), together accounting for 3.3% of all Trinidad residents.
| Immigration Origin | # Population | % Population |
| Europe | 5 | 1.1% |
| Germany | 5 | 1.1% |
| Western Europe | 5 | 1.1% | View All 3 Rows |
Sex and Age in Trinidad
Sex and Age in Trinidad
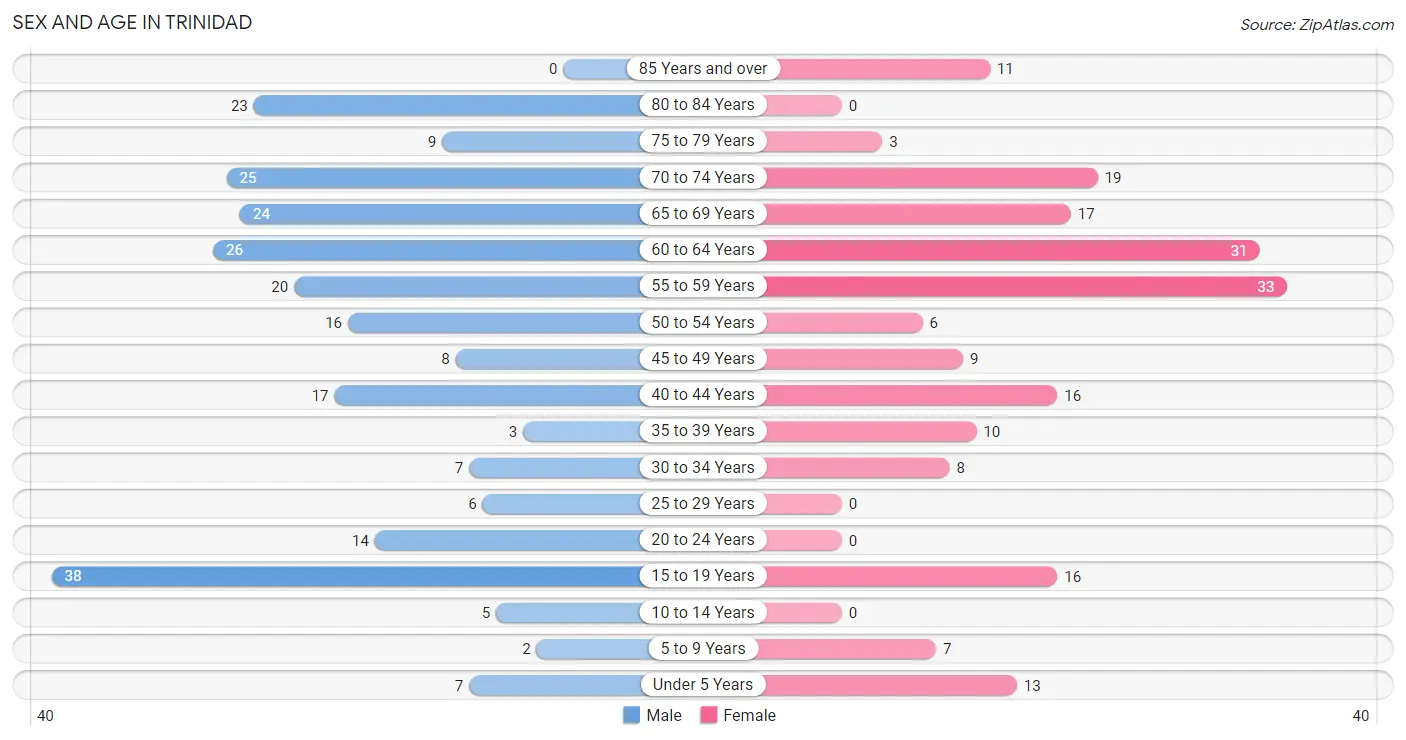
The most populous age groups in Trinidad are 15 to 19 Years (38 | 15.2%) for men and 55 to 59 Years (33 | 16.6%) for women.
| Age Bracket | Male | Female |
| Under 5 Years | 7 (2.8%) | 13 (6.5%) |
| 5 to 9 Years | 2 (0.8%) | 7 (3.5%) |
| 10 to 14 Years | 5 (2.0%) | 0 (0.0%) |
| 15 to 19 Years | 38 (15.2%) | 16 (8.0%) |
| 20 to 24 Years | 14 (5.6%) | 0 (0.0%) |
| 25 to 29 Years | 6 (2.4%) | 0 (0.0%) |
| 30 to 34 Years | 7 (2.8%) | 8 (4.0%) |
| 35 to 39 Years | 3 (1.2%) | 10 (5.0%) |
| 40 to 44 Years | 17 (6.8%) | 16 (8.0%) |
| 45 to 49 Years | 8 (3.2%) | 9 (4.5%) |
| 50 to 54 Years | 16 (6.4%) | 6 (3.0%) |
| 55 to 59 Years | 20 (8.0%) | 33 (16.6%) |
| 60 to 64 Years | 26 (10.4%) | 31 (15.6%) |
| 65 to 69 Years | 24 (9.6%) | 17 (8.5%) |
| 70 to 74 Years | 25 (10.0%) | 19 (9.6%) |
| 75 to 79 Years | 9 (3.6%) | 3 (1.5%) |
| 80 to 84 Years | 23 (9.2%) | 0 (0.0%) |
| 85 Years and over | 0 (0.0%) | 11 (5.5%) |
| Total | 250 (100.0%) | 199 (100.0%) |
Families and Households in Trinidad
Median Family Size in Trinidad
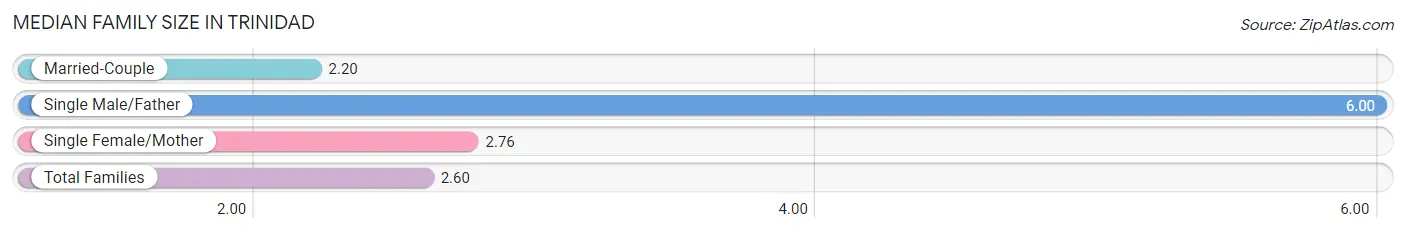
The median family size in Trinidad is 2.60 persons per family, with single male/father families (12 | 8.8%) accounting for the largest median family size of 6 persons per family. On the other hand, married-couple families (107 | 78.7%) represent the smallest median family size with 2.20 persons per family.
| Family Type | # Families | Family Size |
| Married-Couple | 107 (78.7%) | 2.20 |
| Single Male/Father | 12 (8.8%) | 6.00 |
| Single Female/Mother | 17 (12.5%) | 2.76 |
| Total Families | 136 (100.0%) | 2.60 |
Median Household Size in Trinidad
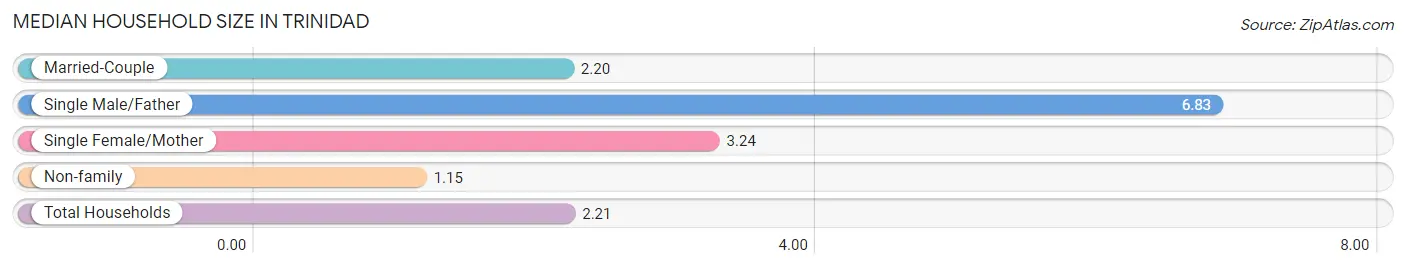
The median household size in Trinidad is 2.21 persons per household, with single male/father households (12 | 5.9%) accounting for the largest median household size of 6.83 persons per household. non-family households (67 | 33.0%) represent the smallest median household size with 1.15 persons per household.
| Household Type | # Households | Household Size |
| Married-Couple | 107 (52.7%) | 2.20 |
| Single Male/Father | 12 (5.9%) | 6.83 |
| Single Female/Mother | 17 (8.4%) | 3.24 |
| Non-family | 67 (33.0%) | 1.15 |
| Total Households | 203 (100.0%) | 2.21 |
Household Size by Marriage Status in Trinidad
Out of a total of 203 households in Trinidad, 136 (67.0%) are family households, while 67 (33.0%) are nonfamily households. The most numerous type of family households are 2-person households, comprising 101, and the most common type of nonfamily households are 1-person households, comprising 56.
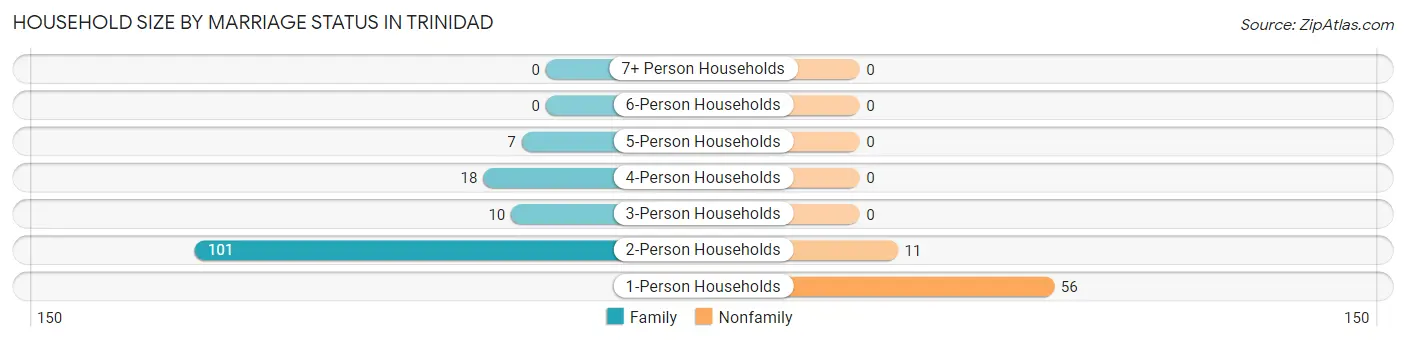
| Household Size | Family Households | Nonfamily Households |
| 1-Person Households | - | 56 (27.6%) |
| 2-Person Households | 101 (49.7%) | 11 (5.4%) |
| 3-Person Households | 10 (4.9%) | 0 (0.0%) |
| 4-Person Households | 18 (8.9%) | 0 (0.0%) |
| 5-Person Households | 7 (3.5%) | 0 (0.0%) |
| 6-Person Households | 0 (0.0%) | 0 (0.0%) |
| 7+ Person Households | 0 (0.0%) | 0 (0.0%) |
| Total | 136 (67.0%) | 67 (33.0%) |
Female Fertility in Trinidad
Fertility by Age in Trinidad
| Age Bracket | Women with Births | Births / 1,000 Women |
| 15 to 19 years | 0 (0.0%) | 0.0 |
| 20 to 34 years | 0 (0.0%) | 0.0 |
| 35 to 50 years | 0 (0.0%) | 0.0 |
| Total | 0 (0.0%) | 0.0 |
Fertility by Age by Marriage Status in Trinidad
| Age Bracket | Married | Unmarried |
| 15 to 19 years | 0 (0.0%) | 0 (0.0%) |
| 20 to 34 years | 0 (0.0%) | 0 (0.0%) |
| 35 to 50 years | 0 (0.0%) | 0 (0.0%) |
| Total | 0 (0.0%) | 0 (0.0%) |
Fertility by Education in Trinidad
| Educational Attainment | Women with Births | Births / 1,000 Women |
| Less than High School | 0 (0.0%) | 0.0 |
| High School Diploma | 0 (0.0%) | 0.0 |
| College or Associate's Degree | 0 (0.0%) | 0.0 |
| Bachelor's Degree | 0 (0.0%) | 0.0 |
| Graduate Degree | 0 (0.0%) | 0.0 |
| Total | 0 (0.0%) | 0.0 |
Fertility by Education by Marriage Status in Trinidad
| Educational Attainment | Married | Unmarried |
| Less than High School | 0 (0.0%) | 0 (0.0%) |
| High School Diploma | 0 (0.0%) | 0 (0.0%) |
| College or Associate's Degree | 0 (0.0%) | 0 (0.0%) |
| Bachelor's Degree | 0 (0.0%) | 0 (0.0%) |
| Graduate Degree | 0 (0.0%) | 0 (0.0%) |
| Total | 0 (0.0%) | 0 (0.0%) |
Employment Characteristics in Trinidad
Employment by Class of Employer in Trinidad
Among the 175 employed individuals in Trinidad, self-employed (not incorporated) (47 | 26.9%), private company employees (41 | 23.4%), and local government employees (25 | 14.3%) make up the most common classes of employment.
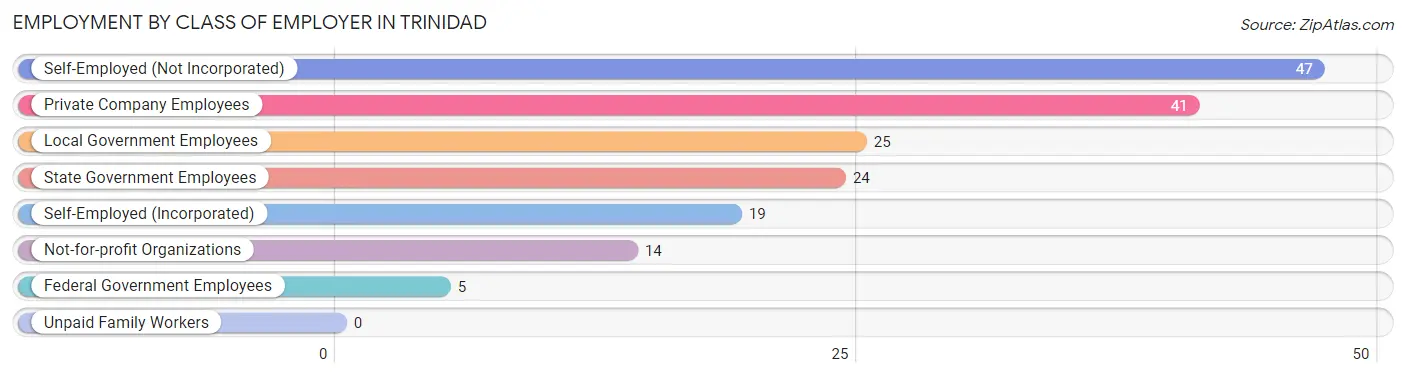
| Employer Class | # Employees | % Employees |
| Private Company Employees | 41 | 23.4% |
| Self-Employed (Incorporated) | 19 | 10.9% |
| Self-Employed (Not Incorporated) | 47 | 26.9% |
| Not-for-profit Organizations | 14 | 8.0% |
| Local Government Employees | 25 | 14.3% |
| State Government Employees | 24 | 13.7% |
| Federal Government Employees | 5 | 2.9% |
| Unpaid Family Workers | 0 | 0.0% |
| Total | 175 | 100.0% |
Employment Status by Age in Trinidad
According to the labor force statistics for Trinidad, out of the total population over 16 years of age (415), 47.0% or 195 individuals are in the labor force, with 10.3% or 20 of them unemployed. The age group with the highest labor force participation rate is 25 to 29 years, with 100.0% or 6 individuals in the labor force. Within the labor force, the 16 to 19 years age range has the highest percentage of unemployed individuals, with 59.3% or 16 of them being unemployed.
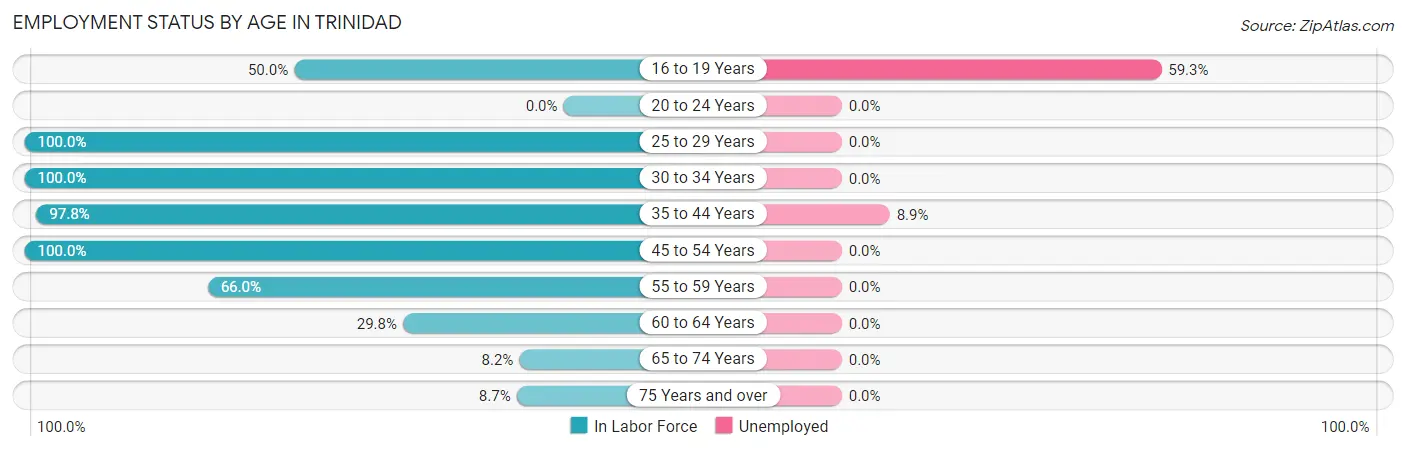
| Age Bracket | In Labor Force | Unemployed |
| 16 to 19 Years | 27 (50.0%) | 16 (59.3%) |
| 20 to 24 Years | 0 (0.0%) | 0 (0.0%) |
| 25 to 29 Years | 6 (100.0%) | 0 (0.0%) |
| 30 to 34 Years | 15 (100.0%) | 0 (0.0%) |
| 35 to 44 Years | 45 (97.8%) | 4 (8.9%) |
| 45 to 54 Years | 39 (100.0%) | 0 (0.0%) |
| 55 to 59 Years | 35 (66.0%) | 0 (0.0%) |
| 60 to 64 Years | 17 (29.8%) | 0 (0.0%) |
| 65 to 74 Years | 7 (8.2%) | 0 (0.0%) |
| 75 Years and over | 4 (8.7%) | 0 (0.0%) |
| Total | 195 (47.0%) | 20 (10.3%) |
Employment Status by Educational Attainment in Trinidad
According to labor force statistics for Trinidad, 72.7% of individuals (157) out of the total population between 25 and 64 years of age (216) are in the labor force, with 2.5% or 4 of them being unemployed. The group with the highest labor force participation rate are those with the educational attainment of bachelor's degree or higher, with 75.0% or 126 individuals in the labor force. Within the labor force, individuals with bachelor's degree or higher education have the highest percentage of unemployment, with 3.2% or 4 of them being unemployed.
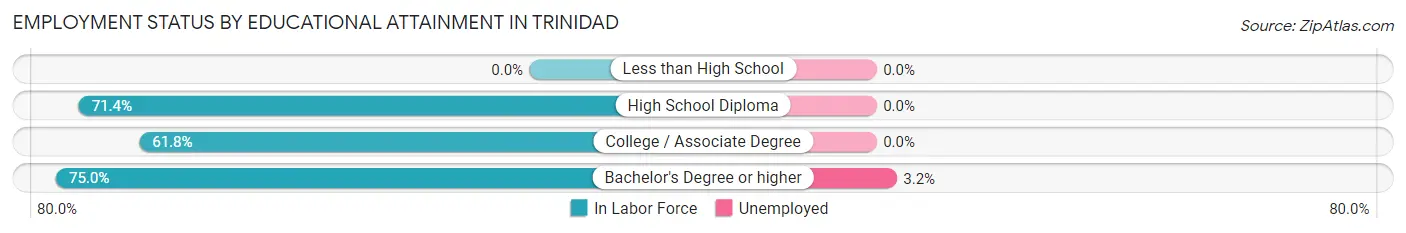
| Educational Attainment | In Labor Force | Unemployed |
| Less than High School | 0 (0.0%) | 0 (0.0%) |
| High School Diploma | 10 (71.4%) | 0 (0.0%) |
| College / Associate Degree | 21 (61.8%) | 0 (0.0%) |
| Bachelor's Degree or higher | 126 (75.0%) | 5 (3.2%) |
| Total | 157 (72.7%) | 5 (2.5%) |
Employment Occupations by Sex in Trinidad
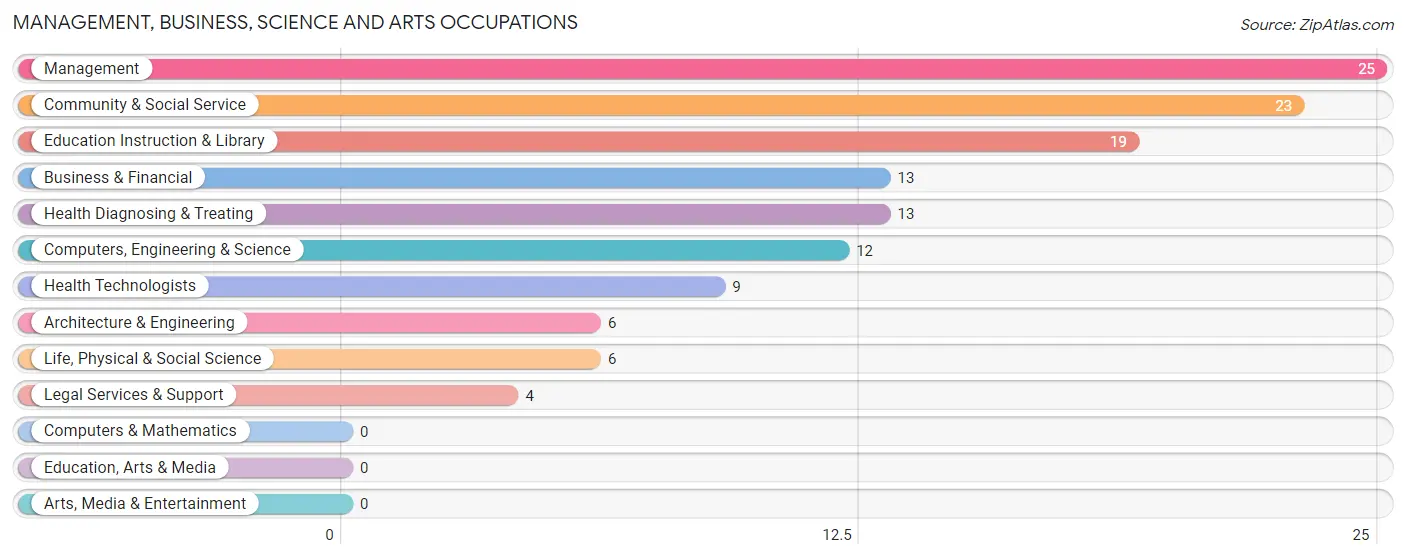
Management, Business, Science and Arts Occupations
The most common Management, Business, Science and Arts occupations in Trinidad are Management (25 | 14.3%), Community & Social Service (23 | 13.1%), Education Instruction & Library (19 | 10.9%), Business & Financial (13 | 7.4%), and Health Diagnosing & Treating (13 | 7.4%).
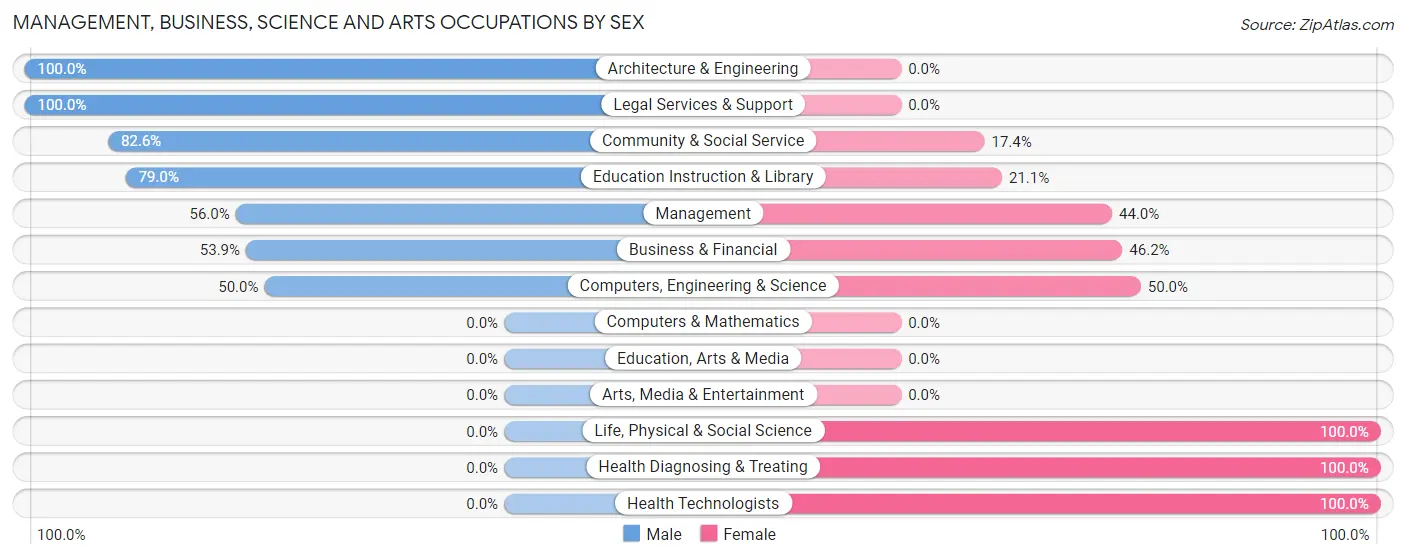
Management, Business, Science and Arts Occupations by Sex
Within the Management, Business, Science and Arts occupations in Trinidad, the most male-oriented occupations are Architecture & Engineering (100.0%), Legal Services & Support (100.0%), and Community & Social Service (82.6%), while the most female-oriented occupations are Life, Physical & Social Science (100.0%), Health Diagnosing & Treating (100.0%), and Health Technologists (100.0%).
| Occupation | Male | Female |
| Management | 14 (56.0%) | 11 (44.0%) |
| Business & Financial | 7 (53.8%) | 6 (46.2%) |
| Computers, Engineering & Science | 6 (50.0%) | 6 (50.0%) |
| Computers & Mathematics | 0 (0.0%) | 0 (0.0%) |
| Architecture & Engineering | 6 (100.0%) | 0 (0.0%) |
| Life, Physical & Social Science | 0 (0.0%) | 6 (100.0%) |
| Community & Social Service | 19 (82.6%) | 4 (17.4%) |
| Education, Arts & Media | 0 (0.0%) | 0 (0.0%) |
| Legal Services & Support | 4 (100.0%) | 0 (0.0%) |
| Education Instruction & Library | 15 (78.9%) | 4 (21.0%) |
| Arts, Media & Entertainment | 0 (0.0%) | 0 (0.0%) |
| Health Diagnosing & Treating | 0 (0.0%) | 13 (100.0%) |
| Health Technologists | 0 (0.0%) | 9 (100.0%) |
| Total (Category) | 46 (53.5%) | 40 (46.5%) |
| Total (Overall) | 104 (59.4%) | 71 (40.6%) |
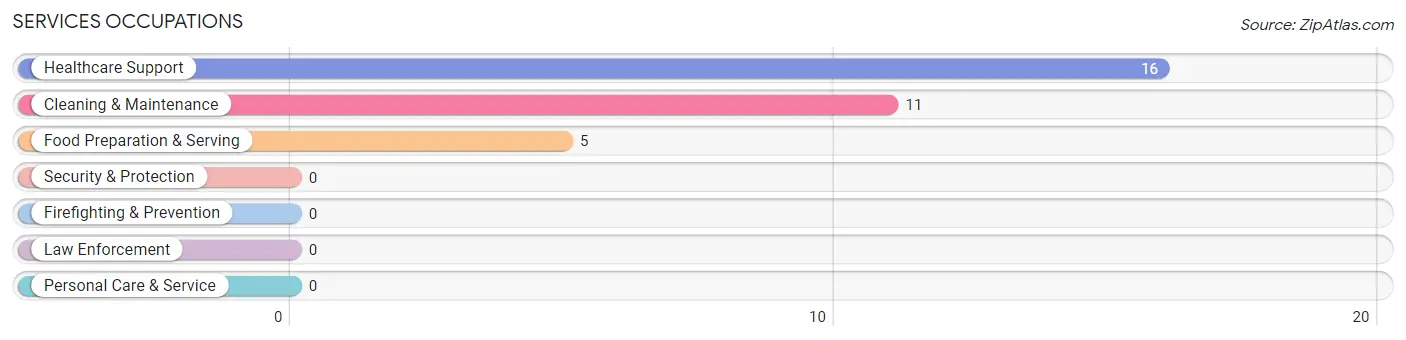
Services Occupations
The most common Services occupations in Trinidad are Healthcare Support (16 | 9.1%), Cleaning & Maintenance (11 | 6.3%), and Food Preparation & Serving (5 | 2.9%).
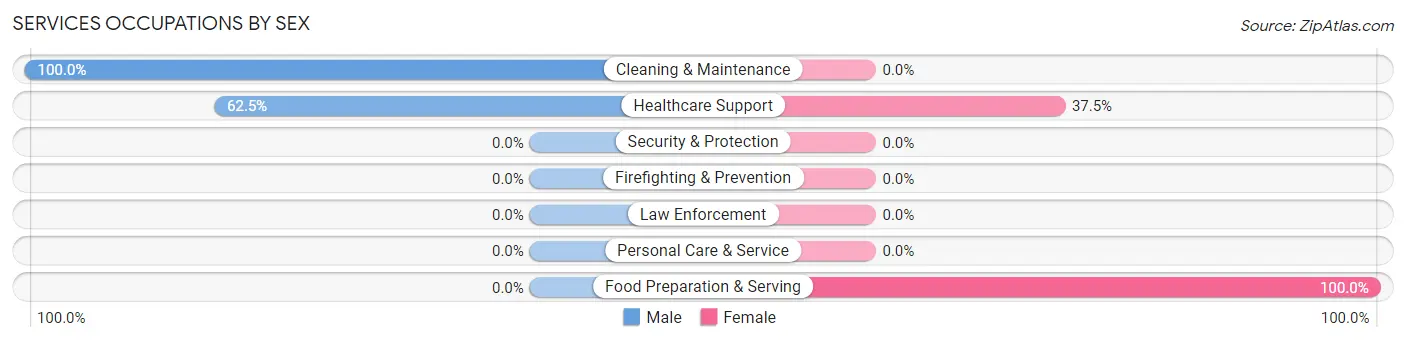
Services Occupations by Sex
Within the Services occupations in Trinidad, the most male-oriented occupations are Cleaning & Maintenance (100.0%), and Healthcare Support (62.5%), while the most female-oriented occupations are Food Preparation & Serving (100.0%), and Healthcare Support (37.5%).
| Occupation | Male | Female |
| Healthcare Support | 10 (62.5%) | 6 (37.5%) |
| Security & Protection | 0 (0.0%) | 0 (0.0%) |
| Firefighting & Prevention | 0 (0.0%) | 0 (0.0%) |
| Law Enforcement | 0 (0.0%) | 0 (0.0%) |
| Food Preparation & Serving | 0 (0.0%) | 5 (100.0%) |
| Cleaning & Maintenance | 11 (100.0%) | 0 (0.0%) |
| Personal Care & Service | 0 (0.0%) | 0 (0.0%) |
| Total (Category) | 21 (65.6%) | 11 (34.4%) |
| Total (Overall) | 104 (59.4%) | 71 (40.6%) |
Sales and Office Occupations
The most common Sales and Office occupations in Trinidad are Sales & Related (25 | 14.3%), and Office & Administration (14 | 8.0%).
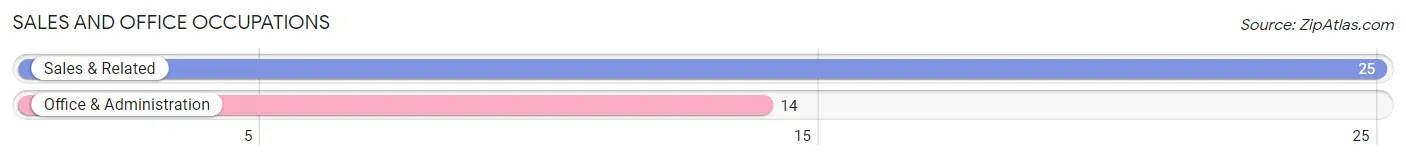
Sales and Office Occupations by Sex
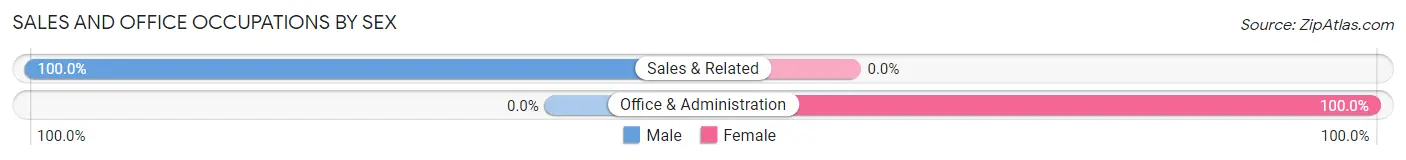
| Occupation | Male | Female |
| Sales & Related | 25 (100.0%) | 0 (0.0%) |
| Office & Administration | 0 (0.0%) | 14 (100.0%) |
| Total (Category) | 25 (64.1%) | 14 (35.9%) |
| Total (Overall) | 104 (59.4%) | 71 (40.6%) |
Natural Resources, Construction and Maintenance Occupations
The most common Natural Resources, Construction and Maintenance occupations in Trinidad are Farming, Fishing & Forestry (6 | 3.4%), and Construction & Extraction (5 | 2.9%).
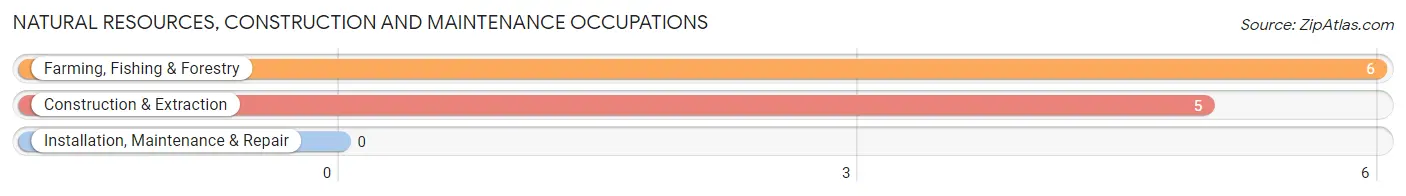
Natural Resources, Construction and Maintenance Occupations by Sex
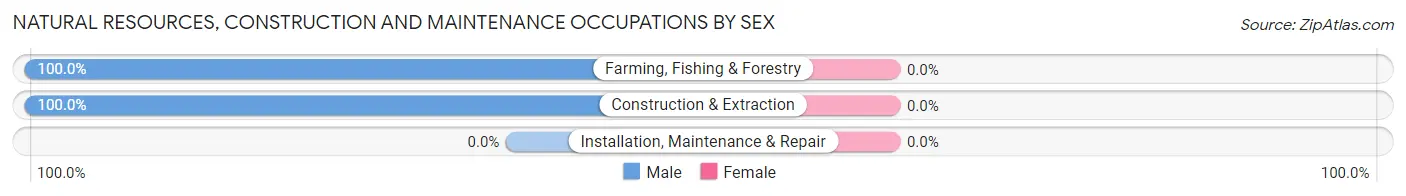
| Occupation | Male | Female |
| Farming, Fishing & Forestry | 6 (100.0%) | 0 (0.0%) |
| Construction & Extraction | 5 (100.0%) | 0 (0.0%) |
| Installation, Maintenance & Repair | 0 (0.0%) | 0 (0.0%) |
| Total (Category) | 11 (100.0%) | 0 (0.0%) |
| Total (Overall) | 104 (59.4%) | 71 (40.6%) |
Production, Transportation and Moving Occupations
The most common Production, Transportation and Moving occupations in Trinidad are , and Production (7 | 4.0%).
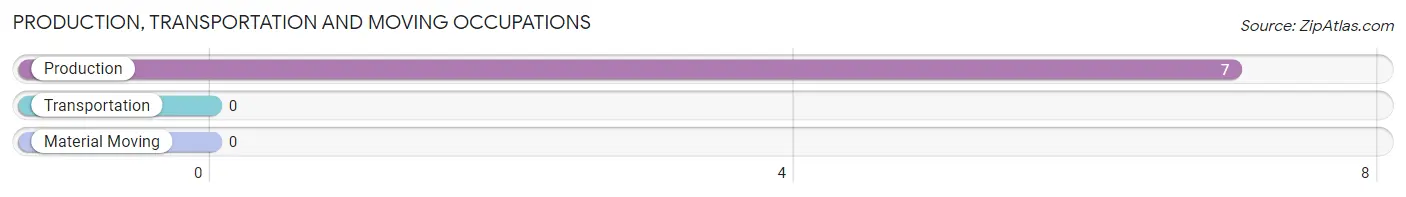
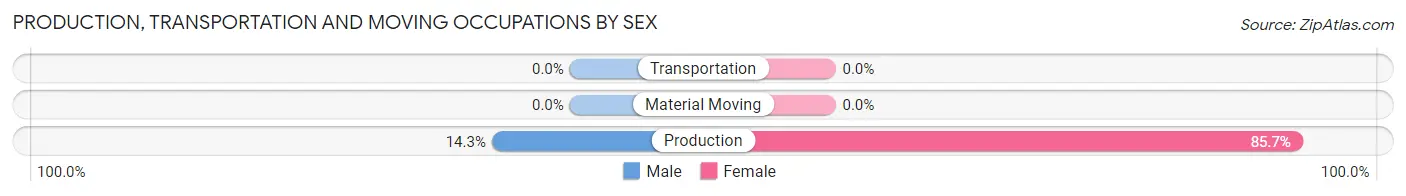
Production, Transportation and Moving Occupations by Sex
| Occupation | Male | Female |
| Production | 1 (14.3%) | 6 (85.7%) |
| Transportation | 0 (0.0%) | 0 (0.0%) |
| Material Moving | 0 (0.0%) | 0 (0.0%) |
| Total (Category) | 1 (14.3%) | 6 (85.7%) |
| Total (Overall) | 104 (59.4%) | 71 (40.6%) |
Employment Industries by Sex in Trinidad
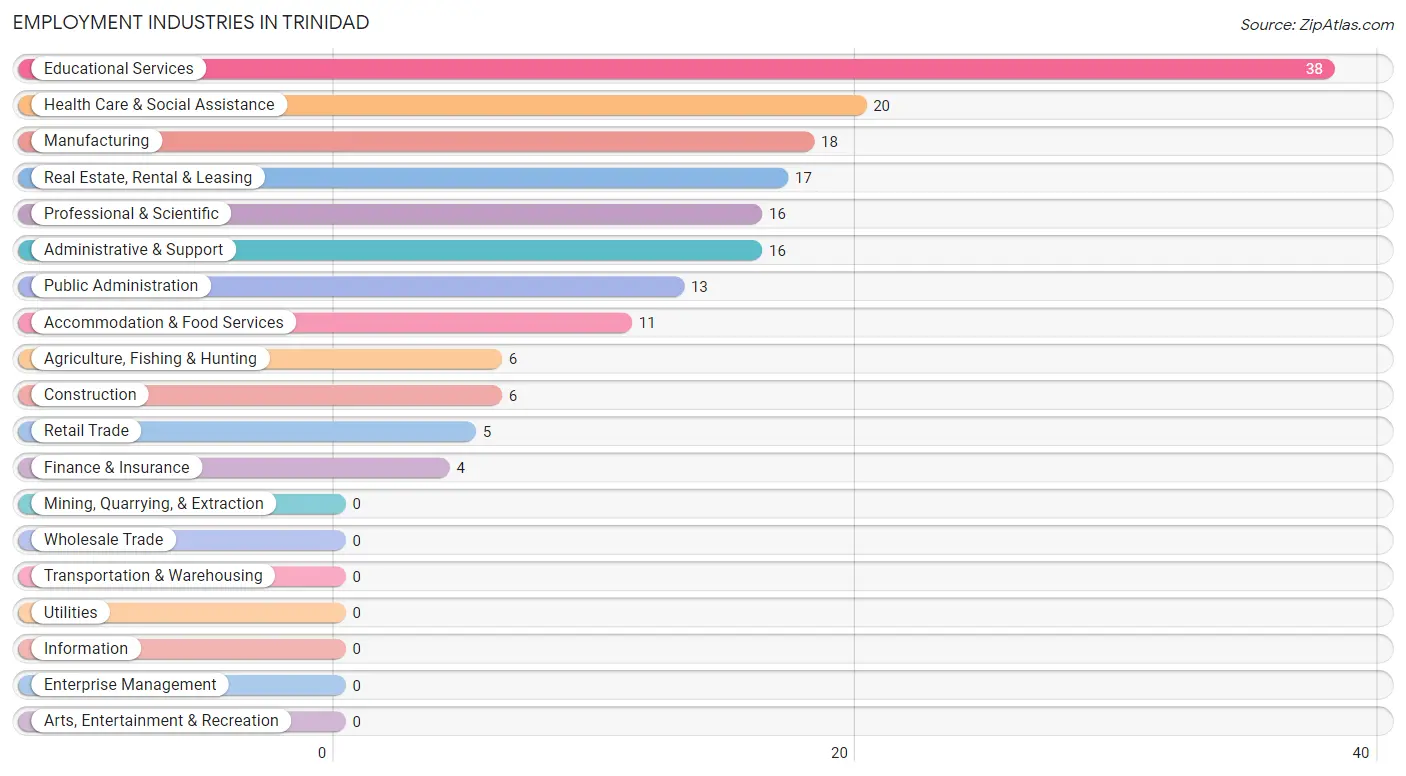
Employment Industries in Trinidad
The major employment industries in Trinidad include Educational Services (38 | 21.7%), Health Care & Social Assistance (20 | 11.4%), Manufacturing (18 | 10.3%), Real Estate, Rental & Leasing (17 | 9.7%), and Professional & Scientific (16 | 9.1%).
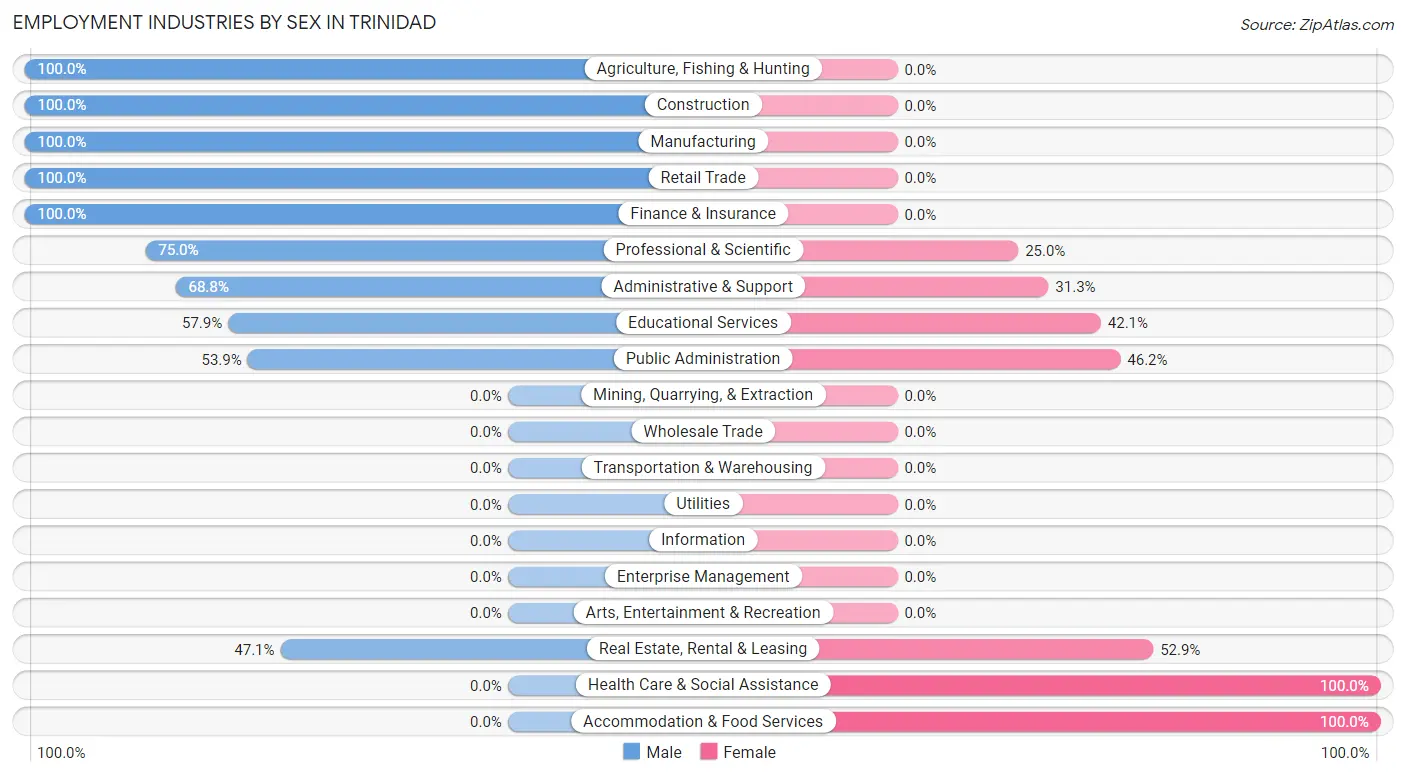
Employment Industries by Sex in Trinidad
The Trinidad industries that see more men than women are Agriculture, Fishing & Hunting (100.0%), Construction (100.0%), and Manufacturing (100.0%), whereas the industries that tend to have a higher number of women are Health Care & Social Assistance (100.0%), Accommodation & Food Services (100.0%), and Real Estate, Rental & Leasing (52.9%).
| Industry | Male | Female |
| Agriculture, Fishing & Hunting | 6 (100.0%) | 0 (0.0%) |
| Mining, Quarrying, & Extraction | 0 (0.0%) | 0 (0.0%) |
| Construction | 6 (100.0%) | 0 (0.0%) |
| Manufacturing | 18 (100.0%) | 0 (0.0%) |
| Wholesale Trade | 0 (0.0%) | 0 (0.0%) |
| Retail Trade | 5 (100.0%) | 0 (0.0%) |
| Transportation & Warehousing | 0 (0.0%) | 0 (0.0%) |
| Utilities | 0 (0.0%) | 0 (0.0%) |
| Information | 0 (0.0%) | 0 (0.0%) |
| Finance & Insurance | 4 (100.0%) | 0 (0.0%) |
| Real Estate, Rental & Leasing | 8 (47.1%) | 9 (52.9%) |
| Professional & Scientific | 12 (75.0%) | 4 (25.0%) |
| Enterprise Management | 0 (0.0%) | 0 (0.0%) |
| Administrative & Support | 11 (68.8%) | 5 (31.2%) |
| Educational Services | 22 (57.9%) | 16 (42.1%) |
| Health Care & Social Assistance | 0 (0.0%) | 20 (100.0%) |
| Arts, Entertainment & Recreation | 0 (0.0%) | 0 (0.0%) |
| Accommodation & Food Services | 0 (0.0%) | 11 (100.0%) |
| Public Administration | 7 (53.8%) | 6 (46.2%) |
| Total | 104 (59.4%) | 71 (40.6%) |
Education in Trinidad
School Enrollment in Trinidad
The most common levels of schooling among the 55 students in Trinidad are graduate / professional (24 | 43.6%), high school (17 | 30.9%), and elementary school (8 | 14.5%).
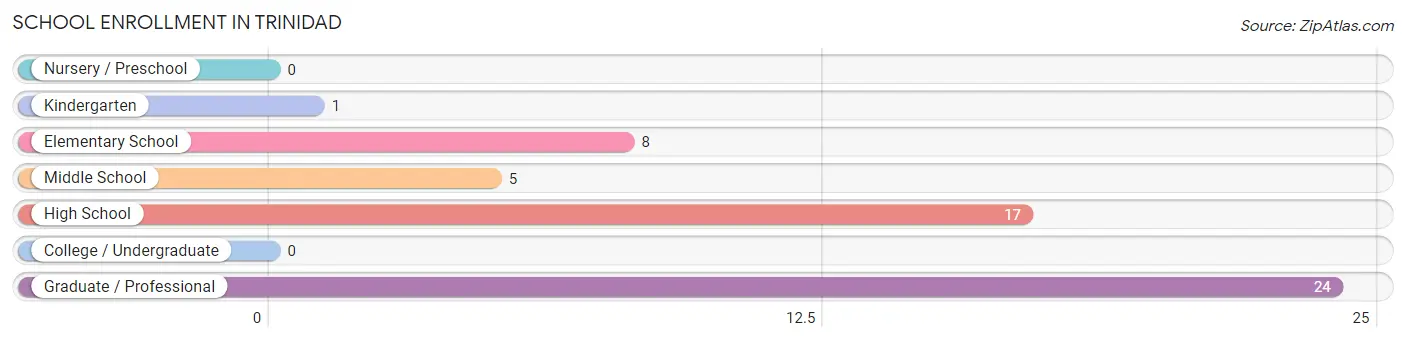
| School Level | # Students | % Students |
| Nursery / Preschool | 0 | 0.0% |
| Kindergarten | 1 | 1.8% |
| Elementary School | 8 | 14.5% |
| Middle School | 5 | 9.1% |
| High School | 17 | 30.9% |
| College / Undergraduate | 0 | 0.0% |
| Graduate / Professional | 24 | 43.6% |
| Total | 55 | 100.0% |
School Enrollment by Age by Funding Source in Trinidad
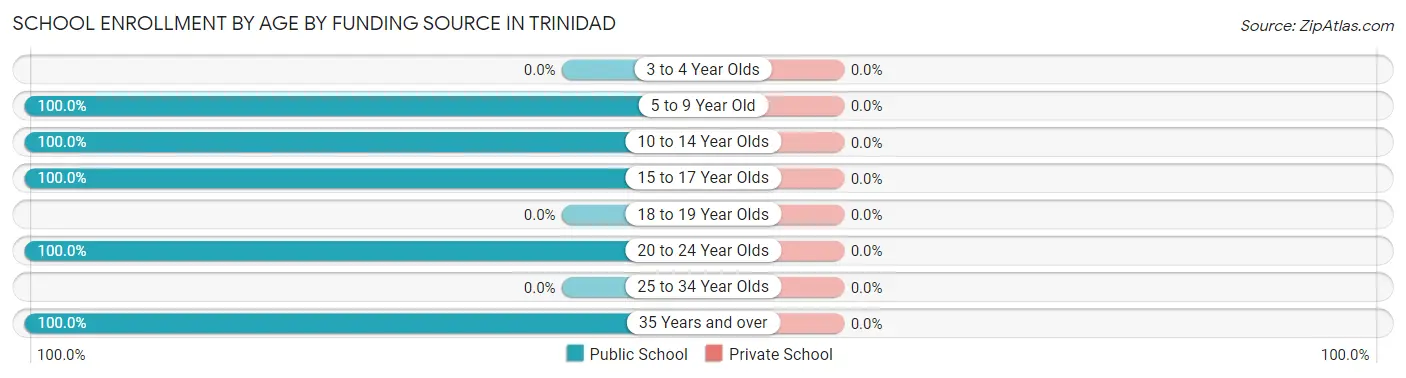
| Age Bracket | Public School | Private School |
| 3 to 4 Year Olds | 0 (0.0%) | 0 (0.0%) |
| 5 to 9 Year Old | 9 (100.0%) | 0 (0.0%) |
| 10 to 14 Year Olds | 5 (100.0%) | 0 (0.0%) |
| 15 to 17 Year Olds | 17 (100.0%) | 0 (0.0%) |
| 18 to 19 Year Olds | 0 (0.0%) | 0 (0.0%) |
| 20 to 24 Year Olds | 14 (100.0%) | 0 (0.0%) |
| 25 to 34 Year Olds | 0 (0.0%) | 0 (0.0%) |
| 35 Years and over | 10 (100.0%) | 0 (0.0%) |
| Total | 55 (100.0%) | 0 (0.0%) |
Educational Attainment by Field of Study in Trinidad
Bio, nature & agricultural (45 | 15.8%), social sciences (38 | 13.3%), business (38 | 13.3%), education (32 | 11.2%), and engineering (26 | 9.1%) are the most common fields of study among 285 individuals in Trinidad who have obtained a bachelor's degree or higher.
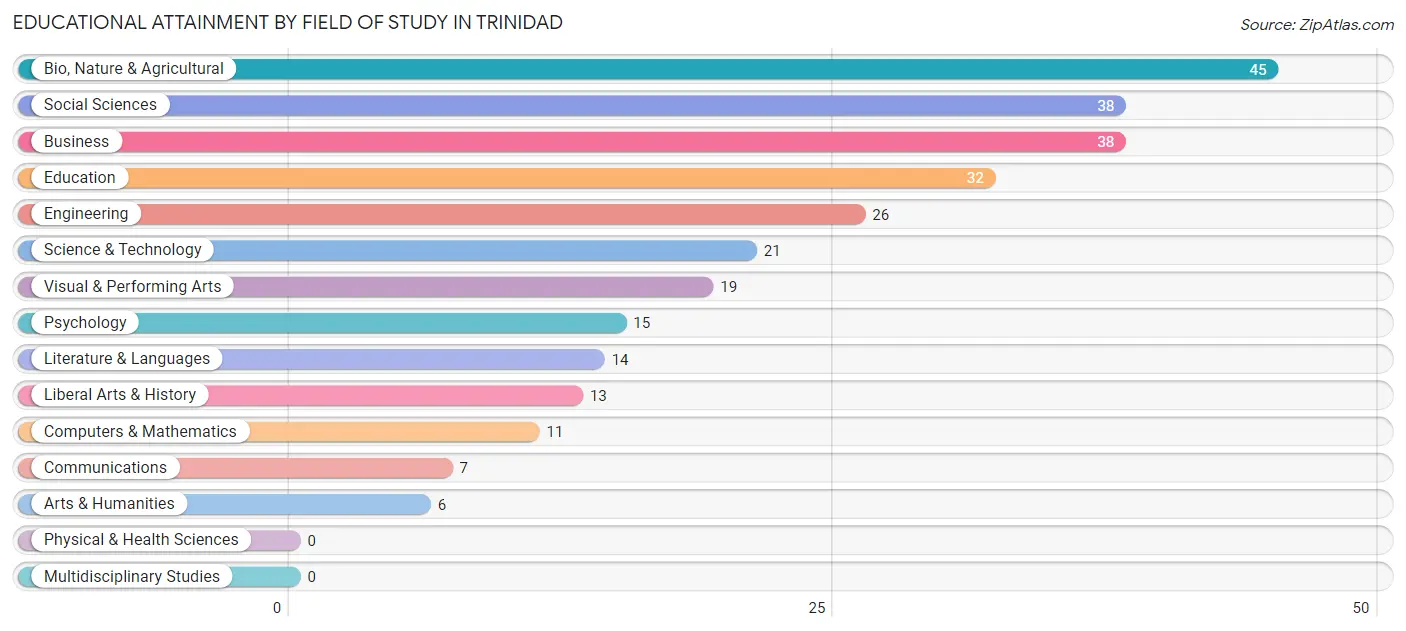
| Field of Study | # Graduates | % Graduates |
| Computers & Mathematics | 11 | 3.9% |
| Bio, Nature & Agricultural | 45 | 15.8% |
| Physical & Health Sciences | 0 | 0.0% |
| Psychology | 15 | 5.3% |
| Social Sciences | 38 | 13.3% |
| Engineering | 26 | 9.1% |
| Multidisciplinary Studies | 0 | 0.0% |
| Science & Technology | 21 | 7.4% |
| Business | 38 | 13.3% |
| Education | 32 | 11.2% |
| Literature & Languages | 14 | 4.9% |
| Liberal Arts & History | 13 | 4.6% |
| Visual & Performing Arts | 19 | 6.7% |
| Communications | 7 | 2.5% |
| Arts & Humanities | 6 | 2.1% |
| Total | 285 | 100.0% |
Transportation & Commute in Trinidad
Vehicle Availability by Sex in Trinidad
The most prevalent vehicle ownership categories in Trinidad are males with 2 vehicles (51, accounting for 49.0%) and females with 2 vehicles (34, making up 71.8%).
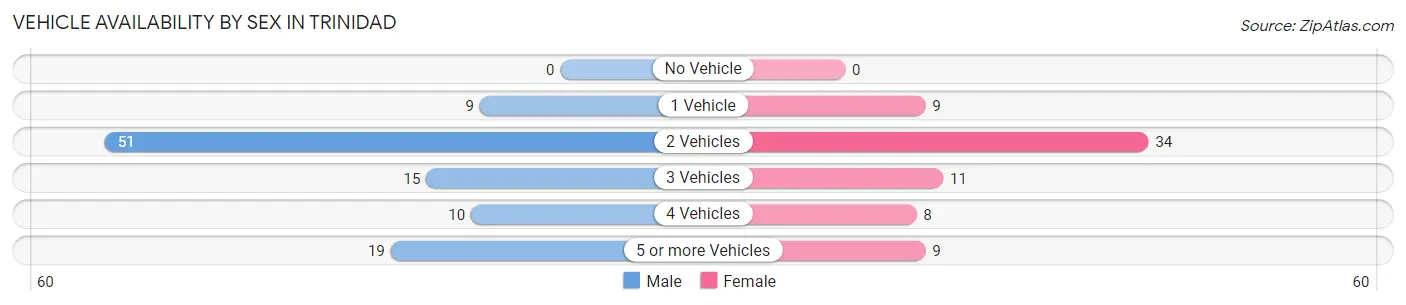
| Vehicles Available | Male | Female |
| No Vehicle | 0 (0.0%) | 0 (0.0%) |
| 1 Vehicle | 9 (8.6%) | 9 (12.7%) |
| 2 Vehicles | 51 (49.0%) | 34 (47.9%) |
| 3 Vehicles | 15 (14.4%) | 11 (15.5%) |
| 4 Vehicles | 10 (9.6%) | 8 (11.3%) |
| 5 or more Vehicles | 19 (18.3%) | 9 (12.7%) |
| Total | 104 (100.0%) | 71 (100.0%) |
Commute Time in Trinidad
The most frequently occuring commute durations in Trinidad are 15 to 19 minutes (38 commuters, 29.2%), 30 to 34 minutes (34 commuters, 26.2%), and 25 to 29 minutes (18 commuters, 13.9%).
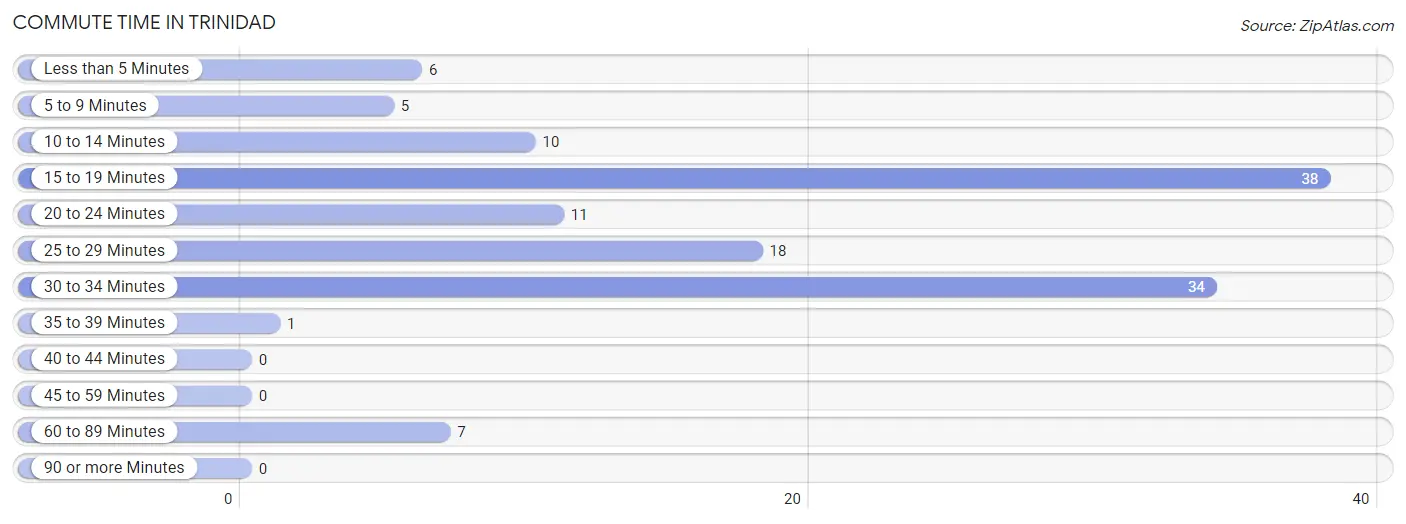
| Commute Time | # Commuters | % Commuters |
| Less than 5 Minutes | 6 | 4.6% |
| 5 to 9 Minutes | 5 | 3.8% |
| 10 to 14 Minutes | 10 | 7.7% |
| 15 to 19 Minutes | 38 | 29.2% |
| 20 to 24 Minutes | 11 | 8.5% |
| 25 to 29 Minutes | 18 | 13.9% |
| 30 to 34 Minutes | 34 | 26.2% |
| 35 to 39 Minutes | 1 | 0.8% |
| 40 to 44 Minutes | 0 | 0.0% |
| 45 to 59 Minutes | 0 | 0.0% |
| 60 to 89 Minutes | 7 | 5.4% |
| 90 or more Minutes | 0 | 0.0% |
Commute Time by Sex in Trinidad
The most common commute times in Trinidad are 15 to 19 minutes (28 commuters, 37.8%) for males and 30 to 34 minutes (13 commuters, 23.2%) for females.
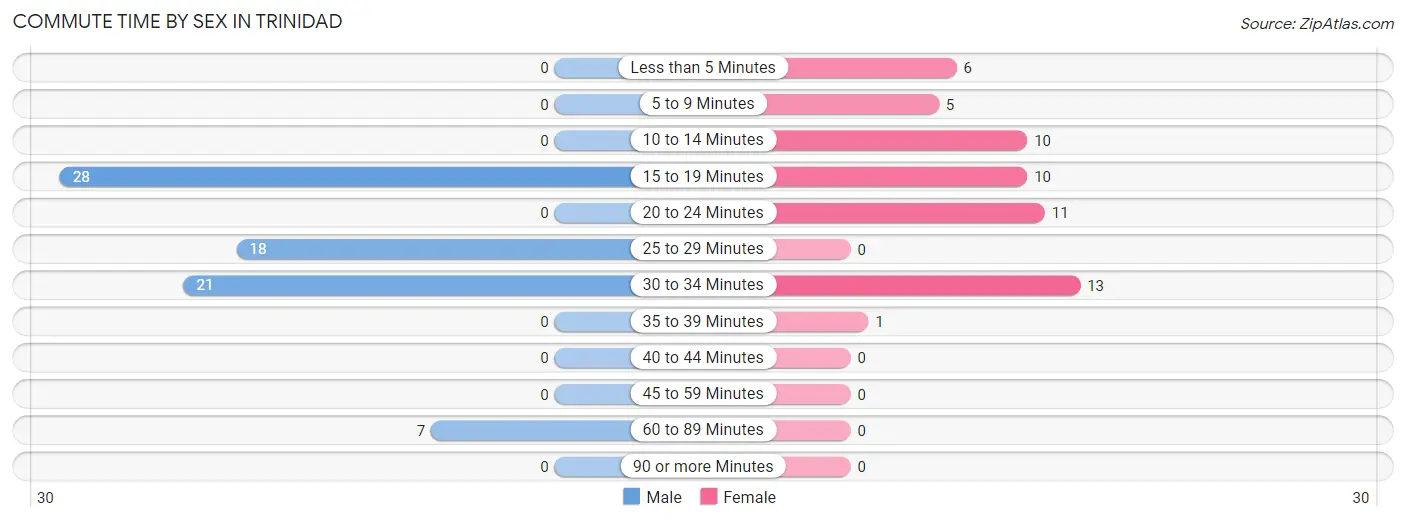
| Commute Time | Male | Female |
| Less than 5 Minutes | 0 (0.0%) | 6 (10.7%) |
| 5 to 9 Minutes | 0 (0.0%) | 5 (8.9%) |
| 10 to 14 Minutes | 0 (0.0%) | 10 (17.9%) |
| 15 to 19 Minutes | 28 (37.8%) | 10 (17.9%) |
| 20 to 24 Minutes | 0 (0.0%) | 11 (19.6%) |
| 25 to 29 Minutes | 18 (24.3%) | 0 (0.0%) |
| 30 to 34 Minutes | 21 (28.4%) | 13 (23.2%) |
| 35 to 39 Minutes | 0 (0.0%) | 1 (1.8%) |
| 40 to 44 Minutes | 0 (0.0%) | 0 (0.0%) |
| 45 to 59 Minutes | 0 (0.0%) | 0 (0.0%) |
| 60 to 89 Minutes | 7 (9.5%) | 0 (0.0%) |
| 90 or more Minutes | 0 (0.0%) | 0 (0.0%) |
Time of Departure to Work by Sex in Trinidad
The most frequent times of departure to work in Trinidad are 8:00 AM to 8:29 AM (18, 24.3%) for males and 9:00 AM to 9:59 AM (25, 44.6%) for females.
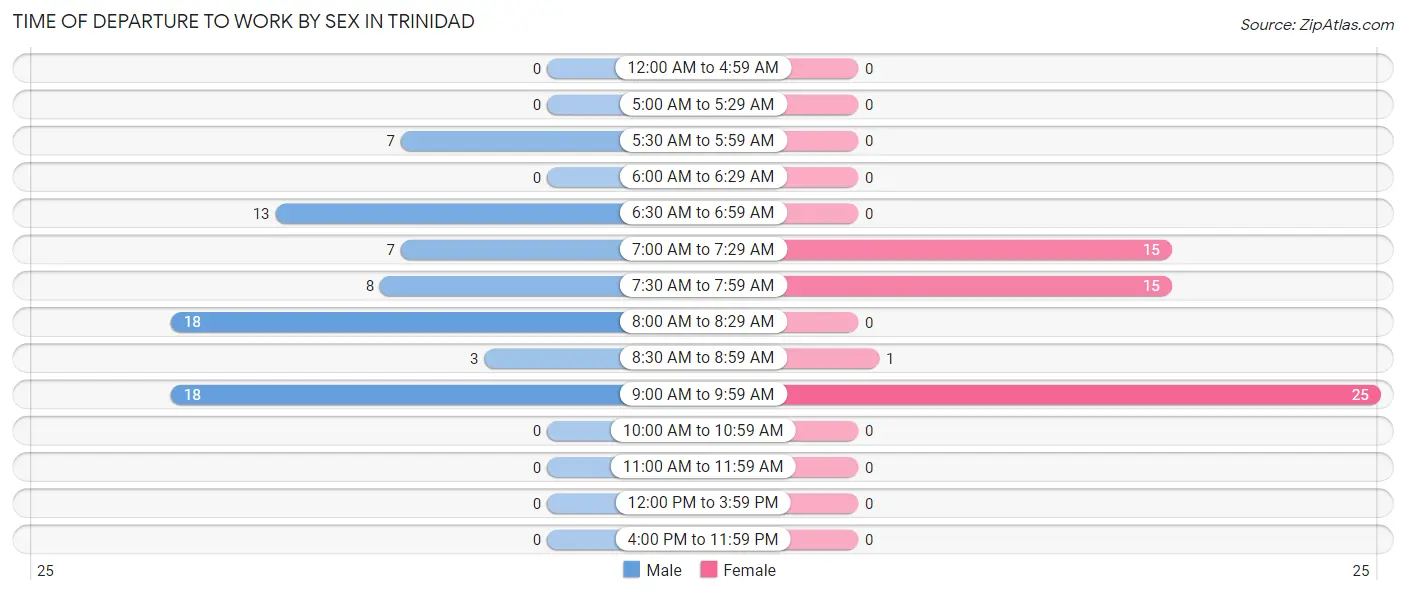
| Time of Departure | Male | Female |
| 12:00 AM to 4:59 AM | 0 (0.0%) | 0 (0.0%) |
| 5:00 AM to 5:29 AM | 0 (0.0%) | 0 (0.0%) |
| 5:30 AM to 5:59 AM | 7 (9.5%) | 0 (0.0%) |
| 6:00 AM to 6:29 AM | 0 (0.0%) | 0 (0.0%) |
| 6:30 AM to 6:59 AM | 13 (17.6%) | 0 (0.0%) |
| 7:00 AM to 7:29 AM | 7 (9.5%) | 15 (26.8%) |
| 7:30 AM to 7:59 AM | 8 (10.8%) | 15 (26.8%) |
| 8:00 AM to 8:29 AM | 18 (24.3%) | 0 (0.0%) |
| 8:30 AM to 8:59 AM | 3 (4.1%) | 1 (1.8%) |
| 9:00 AM to 9:59 AM | 18 (24.3%) | 25 (44.6%) |
| 10:00 AM to 10:59 AM | 0 (0.0%) | 0 (0.0%) |
| 11:00 AM to 11:59 AM | 0 (0.0%) | 0 (0.0%) |
| 12:00 PM to 3:59 PM | 0 (0.0%) | 0 (0.0%) |
| 4:00 PM to 11:59 PM | 0 (0.0%) | 0 (0.0%) |
| Total | 74 (100.0%) | 56 (100.0%) |
Housing Occupancy in Trinidad
Occupancy by Ownership in Trinidad
Of the total 203 dwellings in Trinidad, owner-occupied units account for 172 (84.7%), while renter-occupied units make up 31 (15.3%).
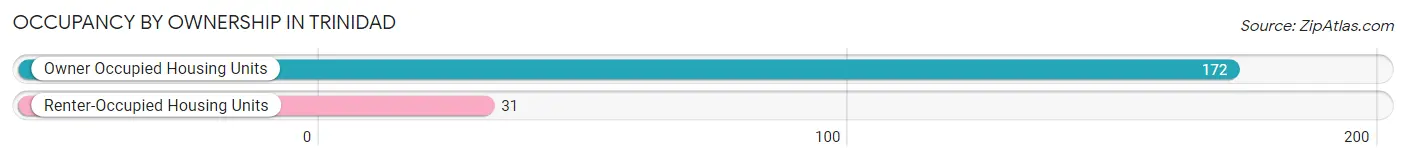
| Occupancy | # Housing Units | % Housing Units |
| Owner Occupied Housing Units | 172 | 84.7% |
| Renter-Occupied Housing Units | 31 | 15.3% |
| Total Occupied Housing Units | 203 | 100.0% |
Occupancy by Household Size in Trinidad
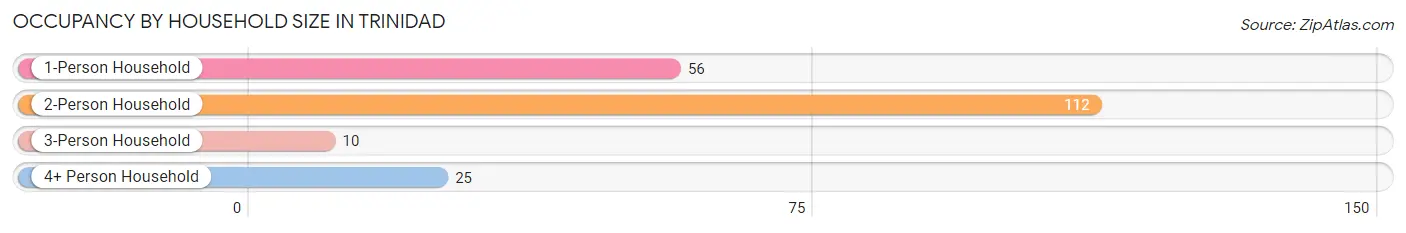
| Household Size | # Housing Units | % Housing Units |
| 1-Person Household | 56 | 27.6% |
| 2-Person Household | 112 | 55.2% |
| 3-Person Household | 10 | 4.9% |
| 4+ Person Household | 25 | 12.3% |
| Total Housing Units | 203 | 100.0% |
Occupancy by Ownership by Household Size in Trinidad
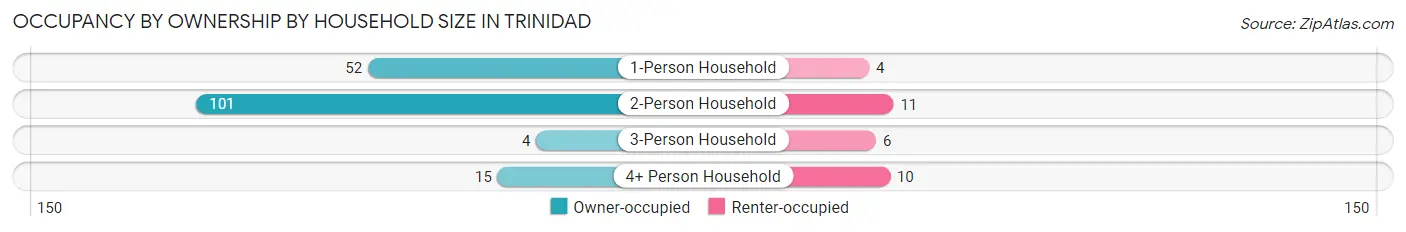
| Household Size | Owner-occupied | Renter-occupied |
| 1-Person Household | 52 (92.9%) | 4 (7.1%) |
| 2-Person Household | 101 (90.2%) | 11 (9.8%) |
| 3-Person Household | 4 (40.0%) | 6 (60.0%) |
| 4+ Person Household | 15 (60.0%) | 10 (40.0%) |
| Total Housing Units | 172 (84.7%) | 31 (15.3%) |
Occupancy by Educational Attainment in Trinidad
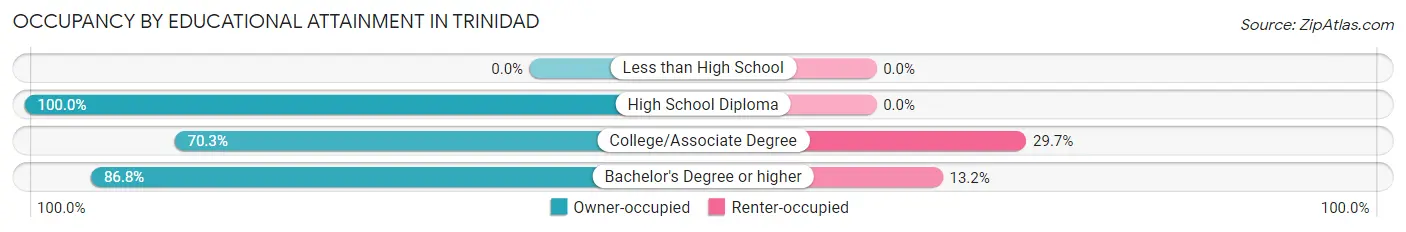
| Household Size | Owner-occupied | Renter-occupied |
| Less than High School | 0 (0.0%) | 0 (0.0%) |
| High School Diploma | 14 (100.0%) | 0 (0.0%) |
| College/Associate Degree | 26 (70.3%) | 11 (29.7%) |
| Bachelor's Degree or higher | 132 (86.8%) | 20 (13.2%) |
Occupancy by Age of Householder in Trinidad
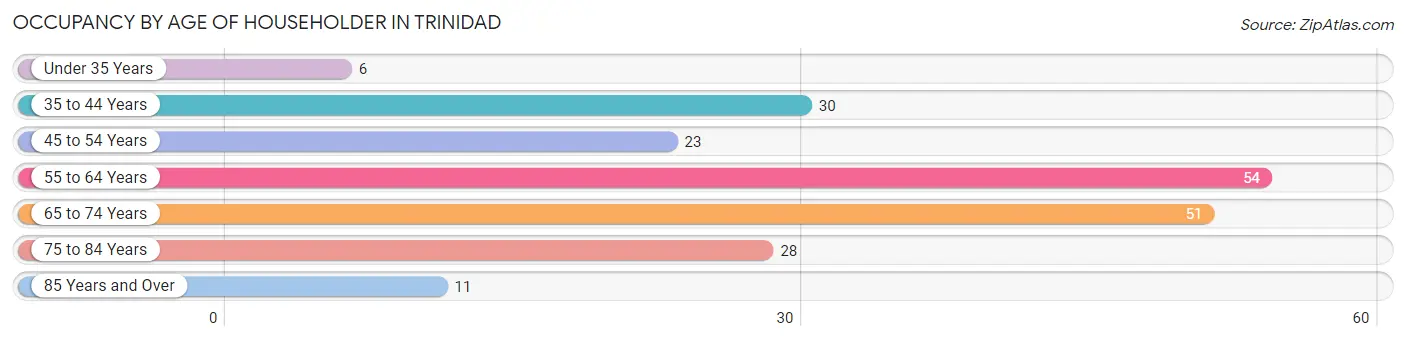
| Age Bracket | # Households | % Households |
| Under 35 Years | 6 | 3.0% |
| 35 to 44 Years | 30 | 14.8% |
| 45 to 54 Years | 23 | 11.3% |
| 55 to 64 Years | 54 | 26.6% |
| 65 to 74 Years | 51 | 25.1% |
| 75 to 84 Years | 28 | 13.8% |
| 85 Years and Over | 11 | 5.4% |
| Total | 203 | 100.0% |
Housing Finances in Trinidad
Median Income by Occupancy in Trinidad
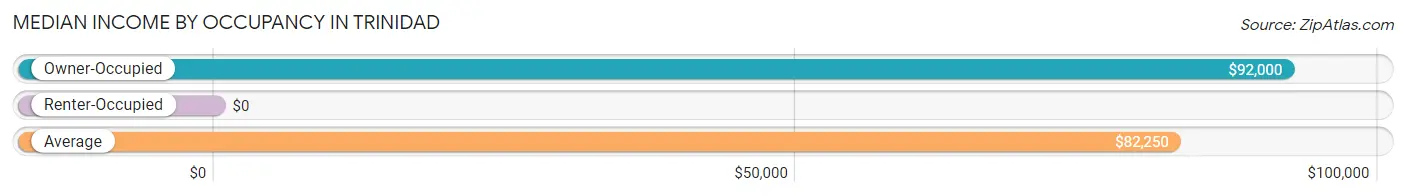
| Occupancy Type | # Households | Median Income |
| Owner-Occupied | 172 (84.7%) | $92,000 |
| Renter-Occupied | 31 (15.3%) | $0 |
| Average | 203 (100.0%) | $82,250 |
Occupancy by Householder Income Bracket in Trinidad
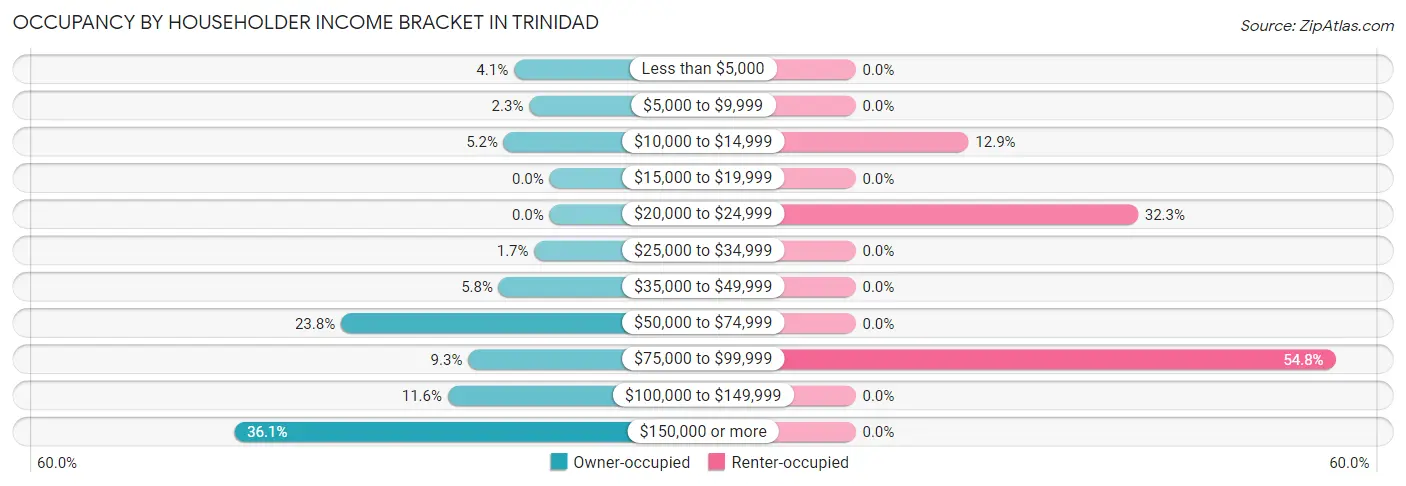
| Income Bracket | Owner-occupied | Renter-occupied |
| Less than $5,000 | 7 (4.1%) | 0 (0.0%) |
| $5,000 to $9,999 | 4 (2.3%) | 0 (0.0%) |
| $10,000 to $14,999 | 9 (5.2%) | 4 (12.9%) |
| $15,000 to $19,999 | 0 (0.0%) | 0 (0.0%) |
| $20,000 to $24,999 | 0 (0.0%) | 10 (32.3%) |
| $25,000 to $34,999 | 3 (1.7%) | 0 (0.0%) |
| $35,000 to $49,999 | 10 (5.8%) | 0 (0.0%) |
| $50,000 to $74,999 | 41 (23.8%) | 0 (0.0%) |
| $75,000 to $99,999 | 16 (9.3%) | 17 (54.8%) |
| $100,000 to $149,999 | 20 (11.6%) | 0 (0.0%) |
| $150,000 or more | 62 (36.0%) | 0 (0.0%) |
| Total | 172 (100.0%) | 31 (100.0%) |
Monthly Housing Cost Tiers in Trinidad
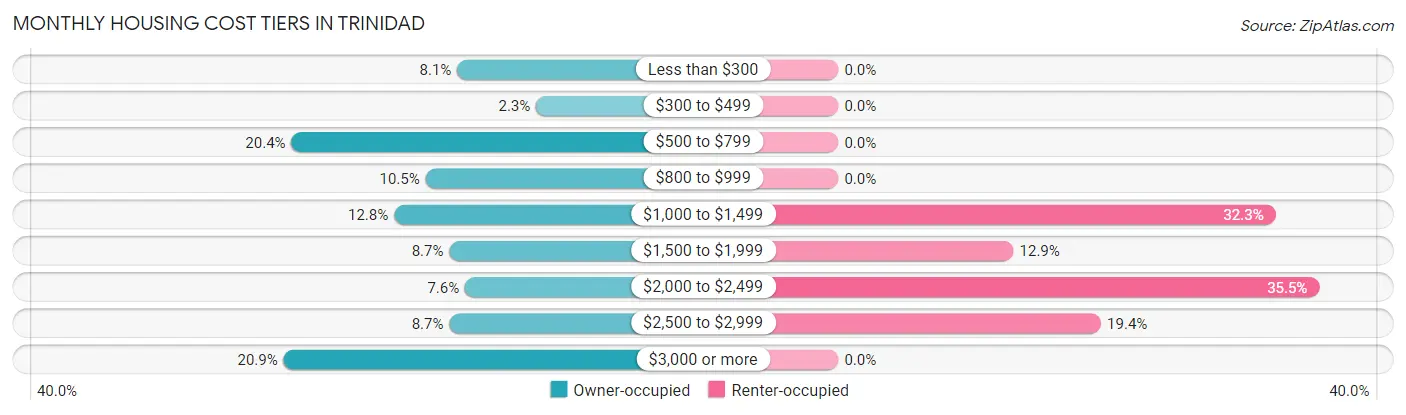
| Monthly Cost | Owner-occupied | Renter-occupied |
| Less than $300 | 14 (8.1%) | 0 (0.0%) |
| $300 to $499 | 4 (2.3%) | 0 (0.0%) |
| $500 to $799 | 35 (20.3%) | 0 (0.0%) |
| $800 to $999 | 18 (10.5%) | 0 (0.0%) |
| $1,000 to $1,499 | 22 (12.8%) | 10 (32.3%) |
| $1,500 to $1,999 | 15 (8.7%) | 4 (12.9%) |
| $2,000 to $2,499 | 13 (7.6%) | 11 (35.5%) |
| $2,500 to $2,999 | 15 (8.7%) | 6 (19.4%) |
| $3,000 or more | 36 (20.9%) | 0 (0.0%) |
| Total | 172 (100.0%) | 31 (100.0%) |
Physical Housing Characteristics in Trinidad
Housing Structures in Trinidad
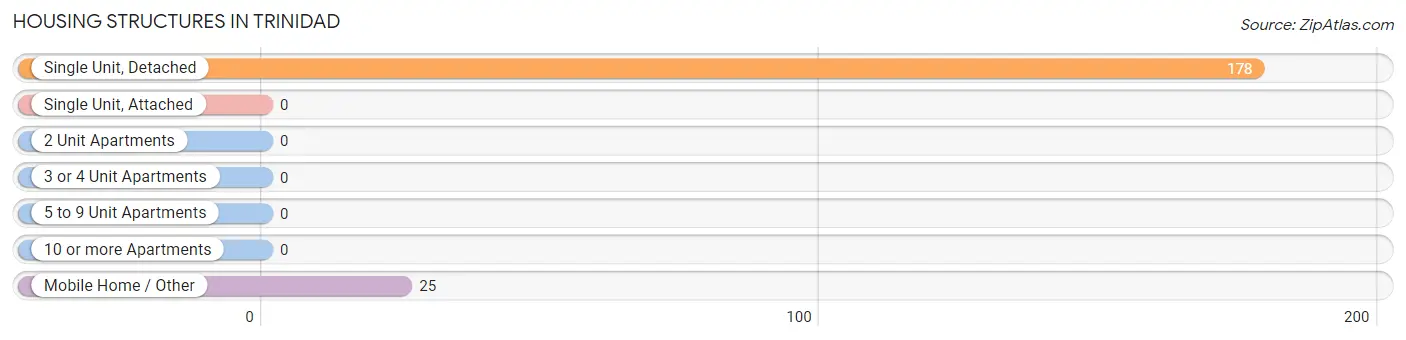
| Structure Type | # Housing Units | % Housing Units |
| Single Unit, Detached | 178 | 87.7% |
| Single Unit, Attached | 0 | 0.0% |
| 2 Unit Apartments | 0 | 0.0% |
| 3 or 4 Unit Apartments | 0 | 0.0% |
| 5 to 9 Unit Apartments | 0 | 0.0% |
| 10 or more Apartments | 0 | 0.0% |
| Mobile Home / Other | 25 | 12.3% |
| Total | 203 | 100.0% |
Housing Structures by Occupancy in Trinidad
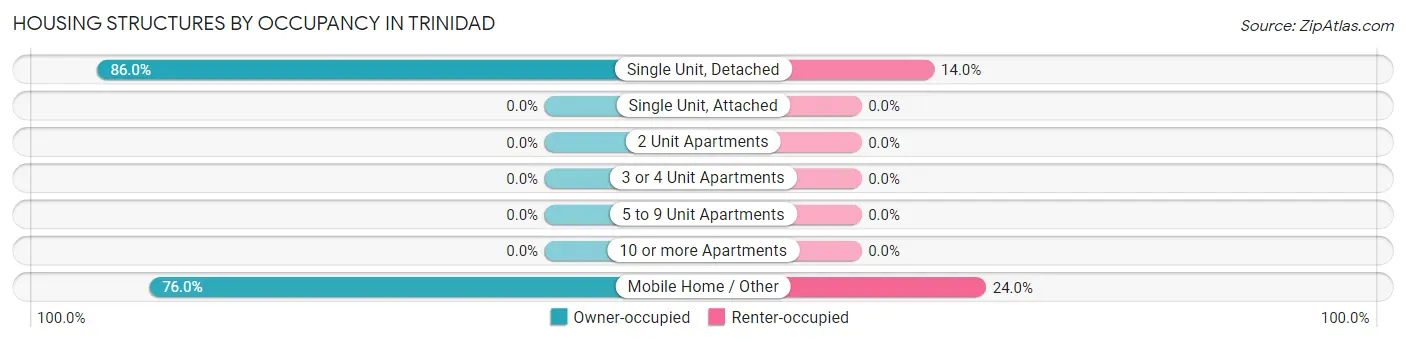
| Structure Type | Owner-occupied | Renter-occupied |
| Single Unit, Detached | 153 (86.0%) | 25 (14.0%) |
| Single Unit, Attached | 0 (0.0%) | 0 (0.0%) |
| 2 Unit Apartments | 0 (0.0%) | 0 (0.0%) |
| 3 or 4 Unit Apartments | 0 (0.0%) | 0 (0.0%) |
| 5 to 9 Unit Apartments | 0 (0.0%) | 0 (0.0%) |
| 10 or more Apartments | 0 (0.0%) | 0 (0.0%) |
| Mobile Home / Other | 19 (76.0%) | 6 (24.0%) |
| Total | 172 (84.7%) | 31 (15.3%) |
Housing Structures by Number of Rooms in Trinidad
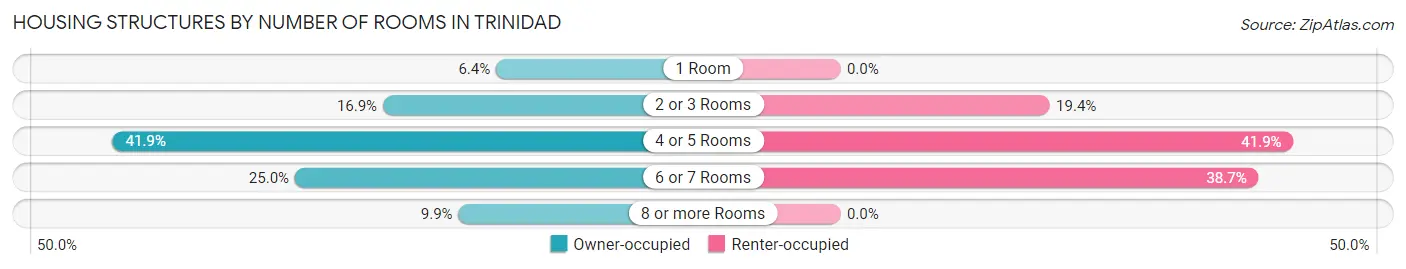
| Number of Rooms | Owner-occupied | Renter-occupied |
| 1 Room | 11 (6.4%) | 0 (0.0%) |
| 2 or 3 Rooms | 29 (16.9%) | 6 (19.4%) |
| 4 or 5 Rooms | 72 (41.9%) | 13 (41.9%) |
| 6 or 7 Rooms | 43 (25.0%) | 12 (38.7%) |
| 8 or more Rooms | 17 (9.9%) | 0 (0.0%) |
| Total | 172 (100.0%) | 31 (100.0%) |
Housing Structure by Heating Type in Trinidad
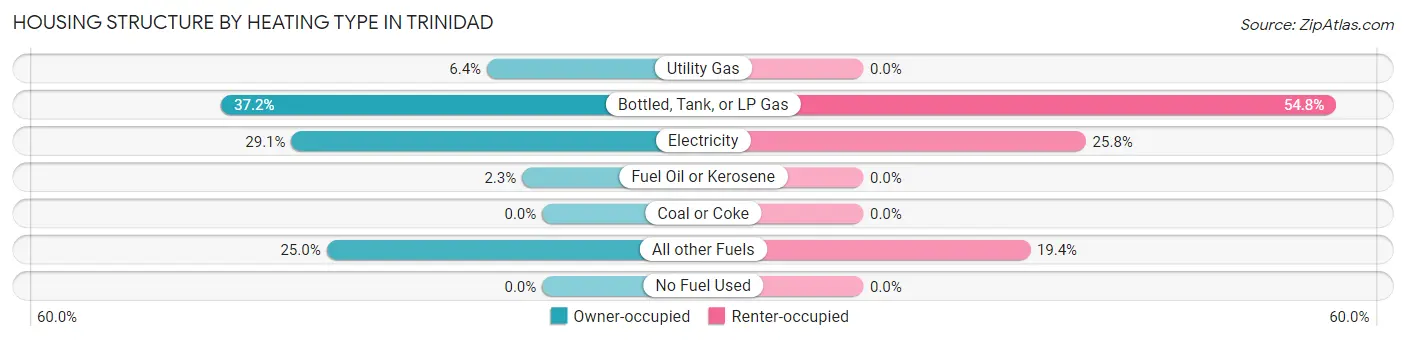
| Heating Type | Owner-occupied | Renter-occupied |
| Utility Gas | 11 (6.4%) | 0 (0.0%) |
| Bottled, Tank, or LP Gas | 64 (37.2%) | 17 (54.8%) |
| Electricity | 50 (29.1%) | 8 (25.8%) |
| Fuel Oil or Kerosene | 4 (2.3%) | 0 (0.0%) |
| Coal or Coke | 0 (0.0%) | 0 (0.0%) |
| All other Fuels | 43 (25.0%) | 6 (19.4%) |
| No Fuel Used | 0 (0.0%) | 0 (0.0%) |
| Total | 172 (100.0%) | 31 (100.0%) |
Household Vehicle Usage in Trinidad
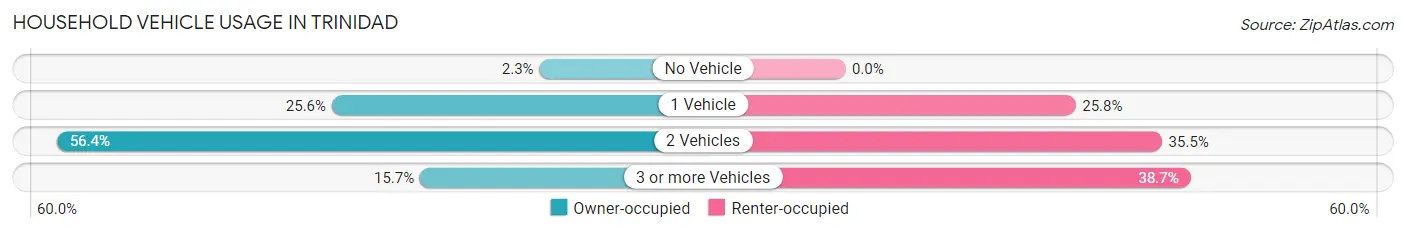
| Vehicles per Household | Owner-occupied | Renter-occupied |
| No Vehicle | 4 (2.3%) | 0 (0.0%) |
| 1 Vehicle | 44 (25.6%) | 8 (25.8%) |
| 2 Vehicles | 97 (56.4%) | 11 (35.5%) |
| 3 or more Vehicles | 27 (15.7%) | 12 (38.7%) |
| Total | 172 (100.0%) | 31 (100.0%) |
Real Estate & Mortgages in Trinidad
Real Estate and Mortgage Overview in Trinidad
| Characteristic | Without Mortgage | With Mortgage |
| Housing Units | 100 | 72 |
| Median Property Value | $560,300 | $804,700 |
| Median Household Income | $90,500 | $39 |
| Monthly Housing Costs | $690 | $36 |
| Real Estate Taxes | $4,769 | $1 |
Property Value by Mortgage Status in Trinidad
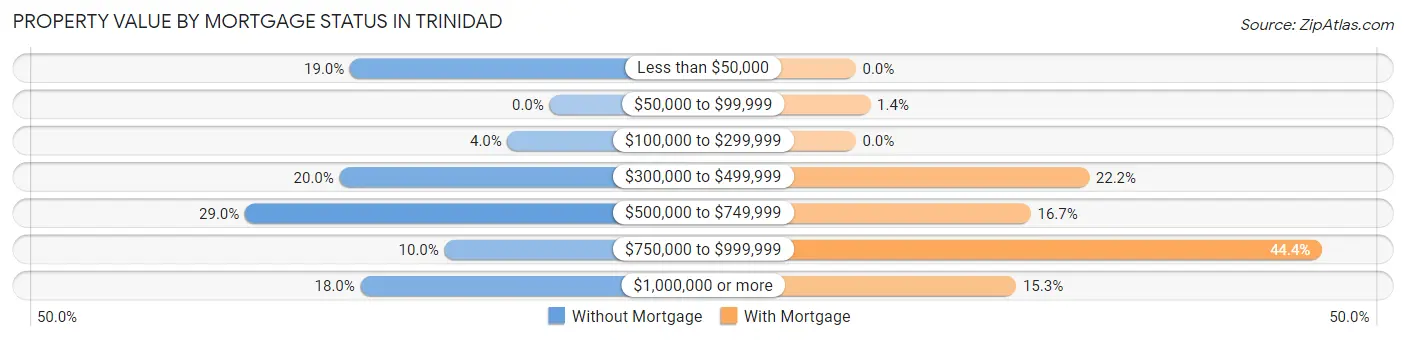
| Property Value | Without Mortgage | With Mortgage |
| Less than $50,000 | 19 (19.0%) | 0 (0.0%) |
| $50,000 to $99,999 | 0 (0.0%) | 1 (1.4%) |
| $100,000 to $299,999 | 4 (4.0%) | 0 (0.0%) |
| $300,000 to $499,999 | 20 (20.0%) | 16 (22.2%) |
| $500,000 to $749,999 | 29 (29.0%) | 12 (16.7%) |
| $750,000 to $999,999 | 10 (10.0%) | 32 (44.4%) |
| $1,000,000 or more | 18 (18.0%) | 11 (15.3%) |
| Total | 100 (100.0%) | 72 (100.0%) |
Household Income by Mortgage Status in Trinidad
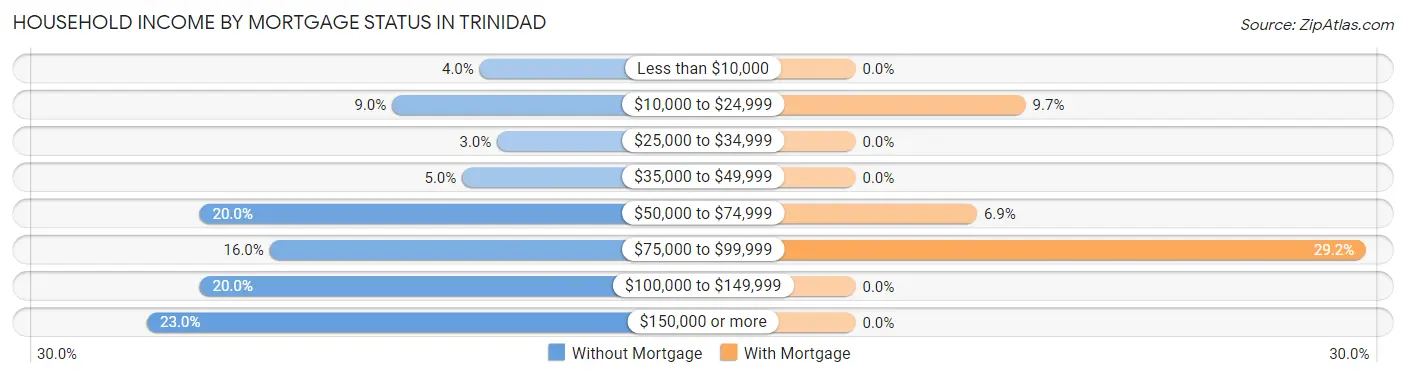
| Household Income | Without Mortgage | With Mortgage |
| Less than $10,000 | 4 (4.0%) | 0 (0.0%) |
| $10,000 to $24,999 | 9 (9.0%) | 7 (9.7%) |
| $25,000 to $34,999 | 3 (3.0%) | 0 (0.0%) |
| $35,000 to $49,999 | 5 (5.0%) | 0 (0.0%) |
| $50,000 to $74,999 | 20 (20.0%) | 5 (6.9%) |
| $75,000 to $99,999 | 16 (16.0%) | 21 (29.2%) |
| $100,000 to $149,999 | 20 (20.0%) | 0 (0.0%) |
| $150,000 or more | 23 (23.0%) | 0 (0.0%) |
| Total | 100 (100.0%) | 72 (100.0%) |
Property Value to Household Income Ratio in Trinidad
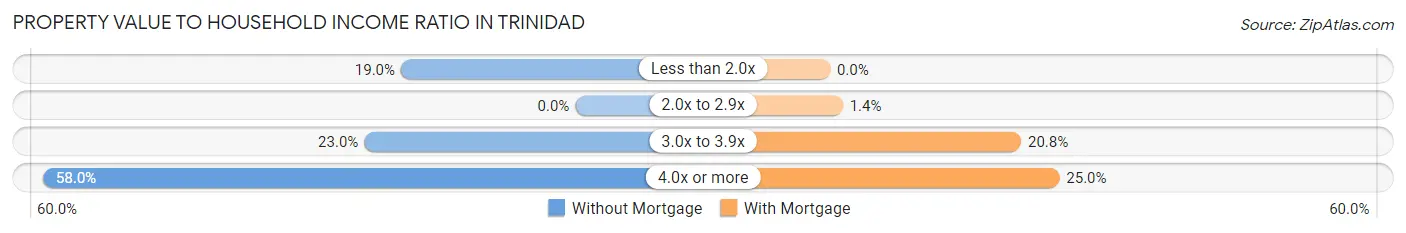
| Value-to-Income Ratio | Without Mortgage | With Mortgage |
| Less than 2.0x | 19 (19.0%) | 0 (0.0%) |
| 2.0x to 2.9x | 0 (0.0%) | 1 (1.4%) |
| 3.0x to 3.9x | 23 (23.0%) | 15 (20.8%) |
| 4.0x or more | 58 (58.0%) | 18 (25.0%) |
| Total | 100 (100.0%) | 72 (100.0%) |
Real Estate Taxes by Mortgage Status in Trinidad
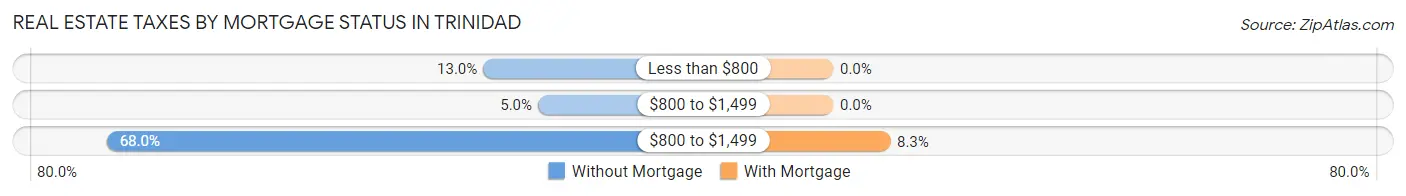
| Property Taxes | Without Mortgage | With Mortgage |
| Less than $800 | 13 (13.0%) | 0 (0.0%) |
| $800 to $1,499 | 5 (5.0%) | 0 (0.0%) |
| $800 to $1,499 | 68 (68.0%) | 6 (8.3%) |
| Total | 100 (100.0%) | 72 (100.0%) |
Health & Disability in Trinidad
Health Insurance Coverage by Age in Trinidad
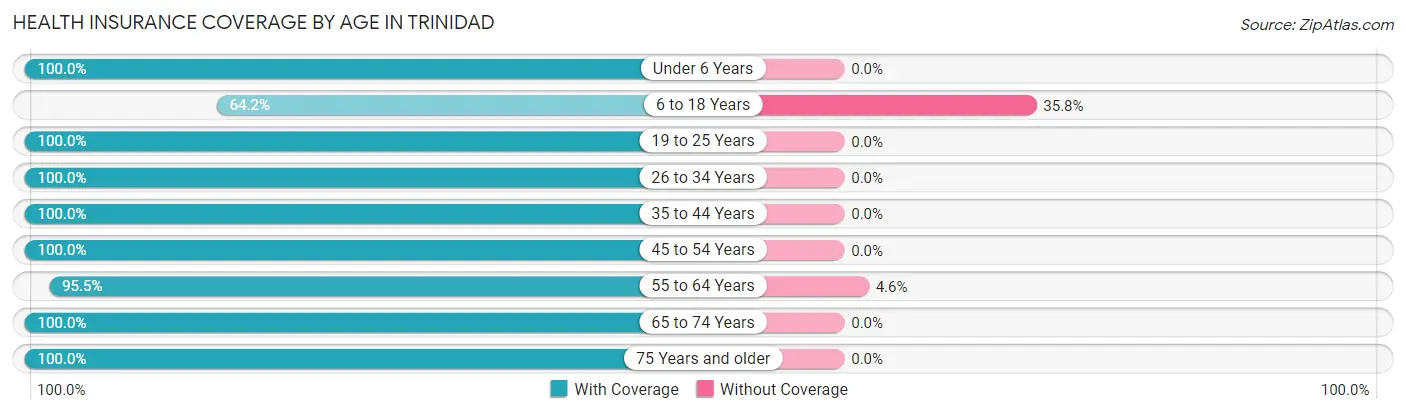
| Age Bracket | With Coverage | Without Coverage |
| Under 6 Years | 21 (100.0%) | 0 (0.0%) |
| 6 to 18 Years | 43 (64.2%) | 24 (35.8%) |
| 19 to 25 Years | 14 (100.0%) | 0 (0.0%) |
| 26 to 34 Years | 21 (100.0%) | 0 (0.0%) |
| 35 to 44 Years | 46 (100.0%) | 0 (0.0%) |
| 45 to 54 Years | 39 (100.0%) | 0 (0.0%) |
| 55 to 64 Years | 105 (95.5%) | 5 (4.5%) |
| 65 to 74 Years | 85 (100.0%) | 0 (0.0%) |
| 75 Years and older | 46 (100.0%) | 0 (0.0%) |
| Total | 420 (93.5%) | 29 (6.5%) |
Health Insurance Coverage by Citizenship Status in Trinidad
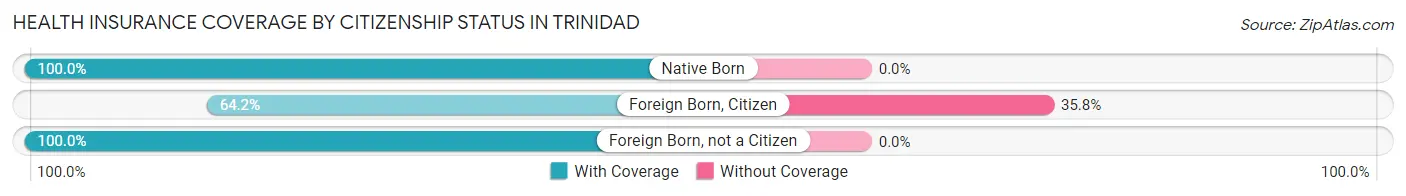
| Citizenship Status | With Coverage | Without Coverage |
| Native Born | 21 (100.0%) | 0 (0.0%) |
| Foreign Born, Citizen | 43 (64.2%) | 24 (35.8%) |
| Foreign Born, not a Citizen | 14 (100.0%) | 0 (0.0%) |
Health Insurance Coverage by Household Income in Trinidad
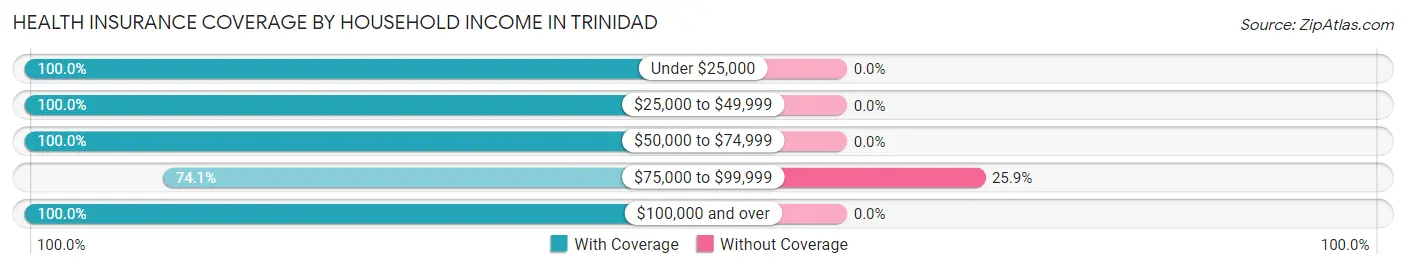
| Household Income | With Coverage | Without Coverage |
| Under $25,000 | 61 (100.0%) | 0 (0.0%) |
| $25,000 to $49,999 | 26 (100.0%) | 0 (0.0%) |
| $50,000 to $74,999 | 69 (100.0%) | 0 (0.0%) |
| $75,000 to $99,999 | 83 (74.1%) | 29 (25.9%) |
| $100,000 and over | 181 (100.0%) | 0 (0.0%) |
Public vs Private Health Insurance Coverage by Age in Trinidad
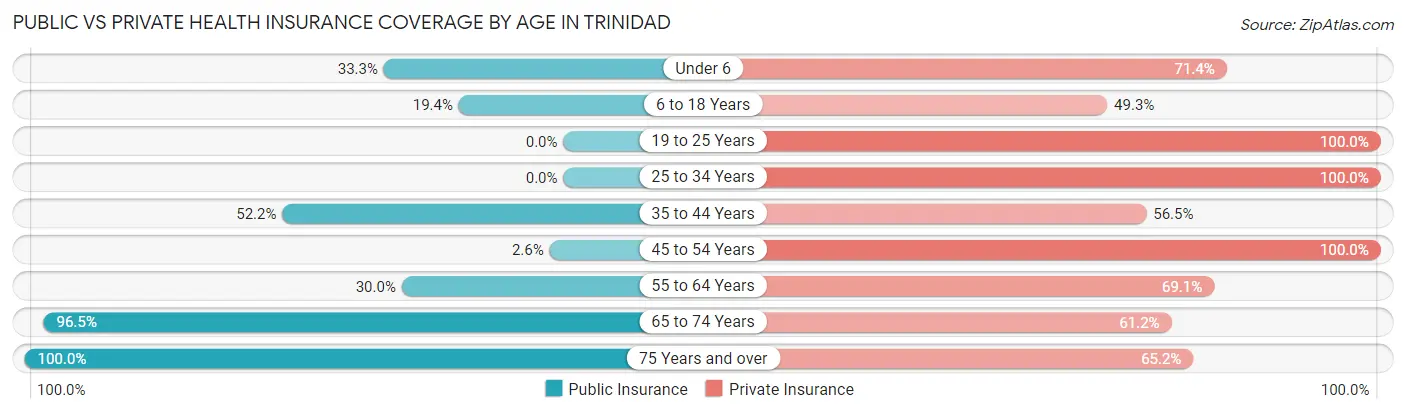
| Age Bracket | Public Insurance | Private Insurance |
| Under 6 | 7 (33.3%) | 15 (71.4%) |
| 6 to 18 Years | 13 (19.4%) | 33 (49.2%) |
| 19 to 25 Years | 0 (0.0%) | 14 (100.0%) |
| 25 to 34 Years | 0 (0.0%) | 21 (100.0%) |
| 35 to 44 Years | 24 (52.2%) | 26 (56.5%) |
| 45 to 54 Years | 1 (2.6%) | 39 (100.0%) |
| 55 to 64 Years | 33 (30.0%) | 76 (69.1%) |
| 65 to 74 Years | 82 (96.5%) | 52 (61.2%) |
| 75 Years and over | 46 (100.0%) | 30 (65.2%) |
| Total | 206 (45.9%) | 306 (68.1%) |
Disability Status by Sex by Age in Trinidad
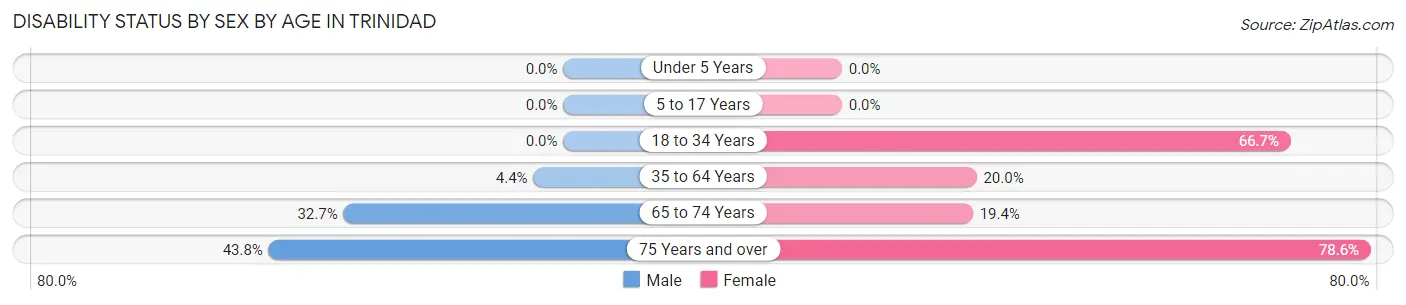
| Age Bracket | Male | Female |
| Under 5 Years | 0 (0.0%) | 0 (0.0%) |
| 5 to 17 Years | 0 (0.0%) | 0 (0.0%) |
| 18 to 34 Years | 0 (0.0%) | 16 (66.7%) |
| 35 to 64 Years | 4 (4.4%) | 21 (20.0%) |
| 65 to 74 Years | 16 (32.7%) | 7 (19.4%) |
| 75 Years and over | 14 (43.8%) | 11 (78.6%) |
Disability Class by Sex by Age in Trinidad
Disability Class: Hearing Difficulty
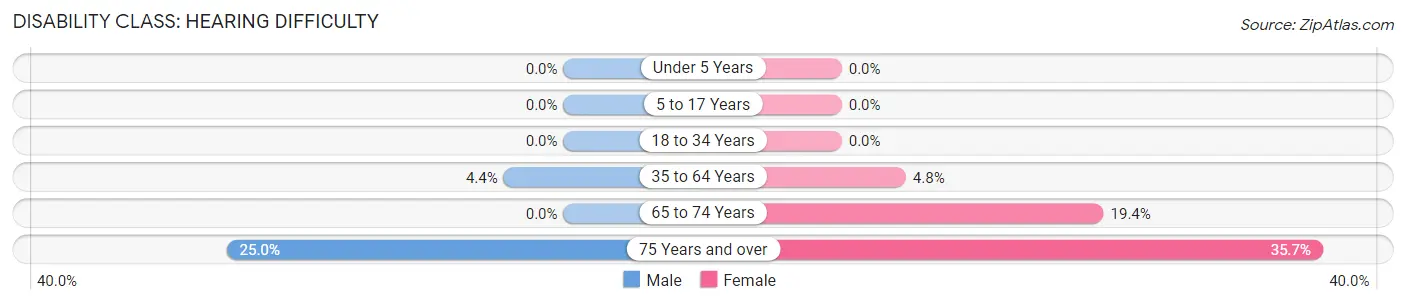
| Age Bracket | Male | Female |
| Under 5 Years | 0 (0.0%) | 0 (0.0%) |
| 5 to 17 Years | 0 (0.0%) | 0 (0.0%) |
| 18 to 34 Years | 0 (0.0%) | 0 (0.0%) |
| 35 to 64 Years | 4 (4.4%) | 5 (4.8%) |
| 65 to 74 Years | 0 (0.0%) | 7 (19.4%) |
| 75 Years and over | 8 (25.0%) | 5 (35.7%) |
Disability Class: Vision Difficulty
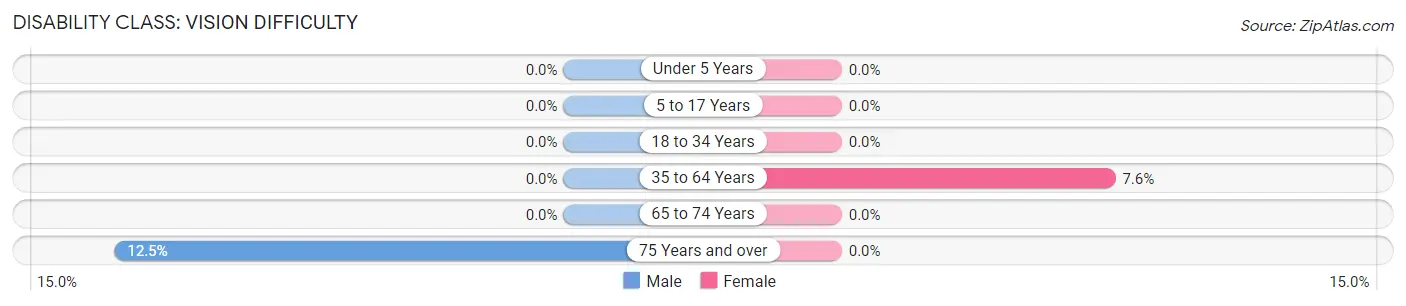
| Age Bracket | Male | Female |
| Under 5 Years | 0 (0.0%) | 0 (0.0%) |
| 5 to 17 Years | 0 (0.0%) | 0 (0.0%) |
| 18 to 34 Years | 0 (0.0%) | 0 (0.0%) |
| 35 to 64 Years | 0 (0.0%) | 8 (7.6%) |
| 65 to 74 Years | 0 (0.0%) | 0 (0.0%) |
| 75 Years and over | 4 (12.5%) | 0 (0.0%) |
Disability Class: Cognitive Difficulty
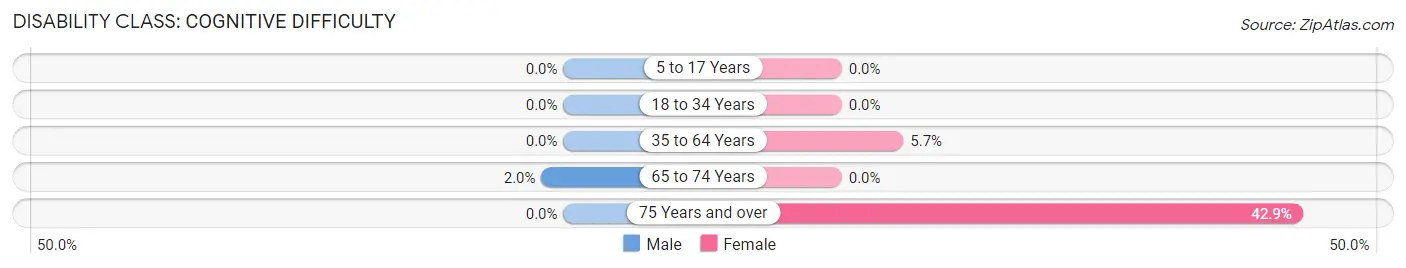
| Age Bracket | Male | Female |
| 5 to 17 Years | 0 (0.0%) | 0 (0.0%) |
| 18 to 34 Years | 0 (0.0%) | 0 (0.0%) |
| 35 to 64 Years | 0 (0.0%) | 6 (5.7%) |
| 65 to 74 Years | 1 (2.0%) | 0 (0.0%) |
| 75 Years and over | 0 (0.0%) | 6 (42.9%) |
Disability Class: Ambulatory Difficulty
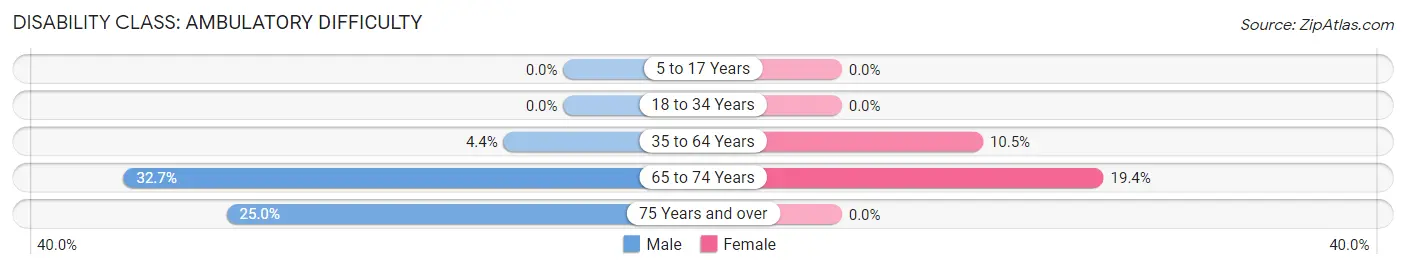
| Age Bracket | Male | Female |
| 5 to 17 Years | 0 (0.0%) | 0 (0.0%) |
| 18 to 34 Years | 0 (0.0%) | 0 (0.0%) |
| 35 to 64 Years | 4 (4.4%) | 11 (10.5%) |
| 65 to 74 Years | 16 (32.7%) | 7 (19.4%) |
| 75 Years and over | 8 (25.0%) | 0 (0.0%) |
Disability Class: Self-Care Difficulty
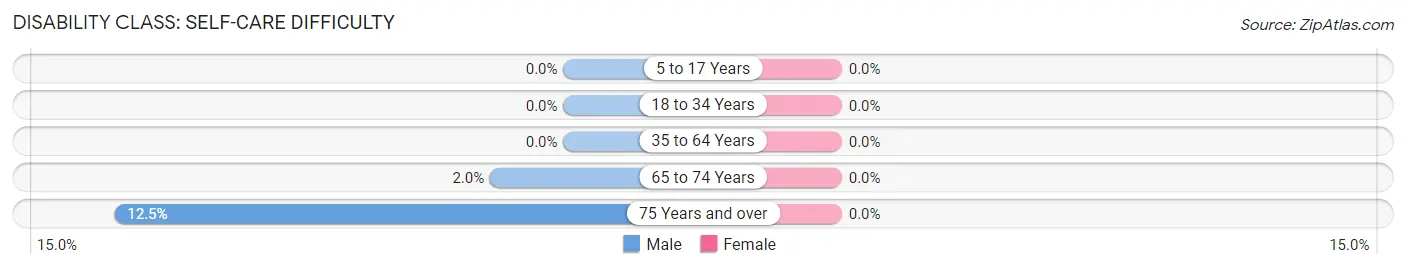
| Age Bracket | Male | Female |
| 5 to 17 Years | 0 (0.0%) | 0 (0.0%) |
| 18 to 34 Years | 0 (0.0%) | 0 (0.0%) |
| 35 to 64 Years | 0 (0.0%) | 0 (0.0%) |
| 65 to 74 Years | 1 (2.0%) | 0 (0.0%) |
| 75 Years and over | 4 (12.5%) | 0 (0.0%) |
Technology Access in Trinidad
Computing Device Access in Trinidad
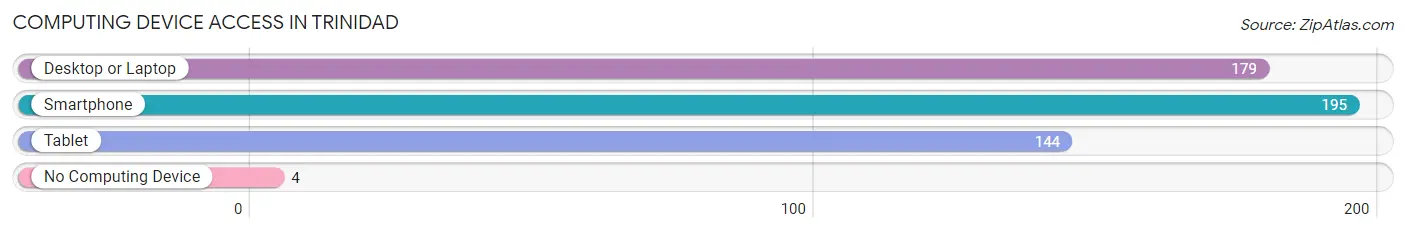
| Device Type | # Households | % Households |
| Desktop or Laptop | 179 | 88.2% |
| Smartphone | 195 | 96.1% |
| Tablet | 144 | 70.9% |
| No Computing Device | 4 | 2.0% |
| Total | 203 | 100.0% |
Internet Access in Trinidad
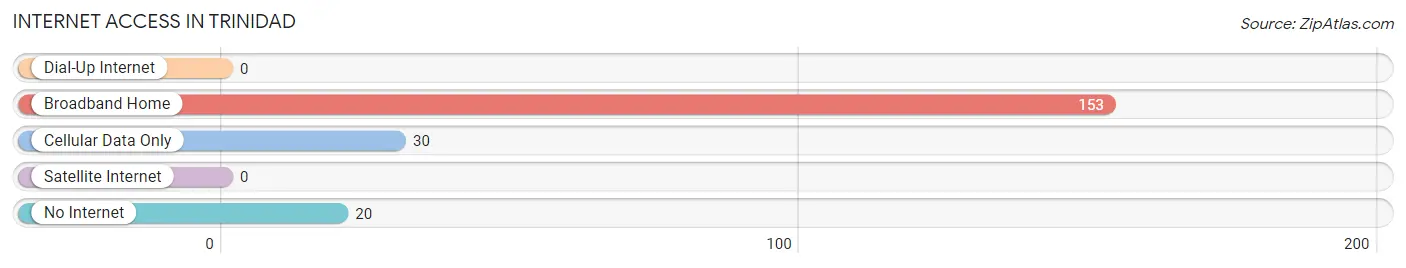
| Internet Type | # Households | % Households |
| Dial-Up Internet | 0 | 0.0% |
| Broadband Home | 153 | 75.4% |
| Cellular Data Only | 30 | 14.8% |
| Satellite Internet | 0 | 0.0% |
| No Internet | 20 | 9.9% |
| Total | 203 | 100.0% |
Trinidad Summary
Trinidad is a small coastal town located in Humboldt County, California. It is situated on the Pacific Ocean, approximately 25 miles north of Eureka and 250 miles north of San Francisco. The town has a population of about 350 people and is known for its stunning natural beauty, its vibrant arts and culture, and its laid-back lifestyle.
History
Trinidad was first settled in the 1850s by a group of settlers from the East Coast. The town was named after the nearby Trinidad Head, a prominent headland that juts out into the Pacific Ocean. The town quickly grew and became a popular destination for fishermen, loggers, and miners. In the late 1800s, the town was home to a bustling wharf and a bustling lumber industry.
In the early 1900s, the town began to attract tourists, and the population began to grow. The town was incorporated in 1908 and soon became a popular destination for vacationers. In the 1950s, the town began to attract artists and writers, and the population began to grow again.
Geography
Trinidad is located on the Pacific Coast of California, approximately 25 miles north of Eureka and 250 miles north of San Francisco. The town is situated on a small peninsula, surrounded by the Pacific Ocean on three sides. The town is surrounded by lush forests and is home to a variety of wildlife, including deer, elk, and black bears. The town is also home to a variety of birds, including bald eagles, ospreys, and seagulls.
The town is located in a temperate climate, with mild winters and warm summers. The average temperature in the summer is around 70 degrees Fahrenheit, and the average temperature in the winter is around 50 degrees Fahrenheit.
Economy
Trinidad’s economy is largely based on tourism and fishing. The town is home to a variety of restaurants, shops, and galleries, as well as a number of bed and breakfasts. The town is also home to a number of charter fishing boats, which offer deep-sea fishing trips.
The town is also home to a number of small businesses, including a grocery store, a hardware store, and a post office. The town is also home to a number of art galleries, which feature the work of local artists.
Demographics
As of the 2010 census, the population of Trinidad was 350 people. The town is predominantly white, with a small Hispanic population. The median household income in the town is $45,000, and the median age is 44. The town is home to a variety of religions, including Christianity, Judaism, and Buddhism.
Conclusion
Trinidad is a small coastal town located in Humboldt County, California. It is known for its stunning natural beauty, its vibrant arts and culture, and its laid-back lifestyle. The town has a population of about 350 people and is largely based on tourism and fishing. The town is predominantly white, with a small Hispanic population, and the median household income is $45,000. Trinidad is a popular destination for vacationers and is home to a variety of restaurants, shops, and galleries.
Common Questions
What is Per Capita Income in Trinidad?
Per Capita income in Trinidad is $54,570.
What is the Median Family Income in Trinidad?
Median Family Income in Trinidad is $81,500.
What is the Median Household income in Trinidad?
Median Household Income in Trinidad is $82,250.
What is Income or Wage Gap in Trinidad?
Income or Wage Gap in Trinidad is 39.5%.
Women in Trinidad earn 60.5 cents for every dollar earned by a man.
What is Inequality or Gini Index in Trinidad?
Inequality or Gini Index in Trinidad is 0.49.
What is the Total Population of Trinidad?
Total Population of Trinidad is 449.
What is the Total Male Population of Trinidad?
Total Male Population of Trinidad is 250.
What is the Total Female Population of Trinidad?
Total Female Population of Trinidad is 199.
What is the Ratio of Males per 100 Females in Trinidad?
There are 125.63 Males per 100 Females in Trinidad.
What is the Ratio of Females per 100 Males in Trinidad?
There are 79.60 Females per 100 Males in Trinidad.
What is the Median Population Age in Trinidad?
Median Population Age in Trinidad is 55.9 Years.
What is the Average Family Size in Trinidad
Average Family Size in Trinidad is 2.6 People.
What is the Average Household Size in Trinidad
Average Household Size in Trinidad is 2.2 People.
How Large is the Labor Force in Trinidad?
There are 195 People in the Labor Forcein in Trinidad.
What is the Percentage of People in the Labor Force in Trinidad?
47.0% of People are in the Labor Force in Trinidad.
What is the Unemployment Rate in Trinidad?
Unemployment Rate in Trinidad is 10.3%.