Sonoma, CA Map & Demographics
Sonoma Map
Sonoma Overview
$70,445
PER CAPITA INCOME
$127,743
AVG FAMILY INCOME
$96,090
AVG HOUSEHOLD INCOME
43.0%
WAGE / INCOME GAP [ % ]
57.0¢/ $1
WAGE / INCOME GAP [ $ ]
$9,679
FAMILY INCOME DEFICIT
0.50
INEQUALITY / GINI INDEX
10,702
TOTAL POPULATION
4,778
MALE POPULATION
5,924
FEMALE POPULATION
80.65
MALES / 100 FEMALES
123.98
FEMALES / 100 MALES
54.7
MEDIAN AGE
2.7
AVG FAMILY SIZE
1.9
AVG HOUSEHOLD SIZE
5,309
LABOR FORCE [ PEOPLE ]
55.4%
PERCENT IN LABOR FORCE
6.1%
UNEMPLOYMENT RATE
Sonoma Zip Codes
Sonoma Area Codes
Income in Sonoma
Income Overview in Sonoma
Per Capita Income in Sonoma is $70,445, while median incomes of families and households are $127,743 and $96,090 respectively.
| Characteristic | Number | Measure |
| Per Capita Income | 10,702 | $70,445 |
| Median Family Income | 2,741 | $127,743 |
| Mean Family Income | 2,741 | $172,820 |
| Median Household Income | 5,338 | $96,090 |
| Mean Household Income | 5,338 | $140,291 |
| Income Deficit | 2,741 | $9,679 |
| Wage / Income Gap (%) | 10,702 | 43.00% |
| Wage / Income Gap ($) | 10,702 | 57.00¢ per $1 |
| Gini / Inequality Index | 10,702 | 0.50 |
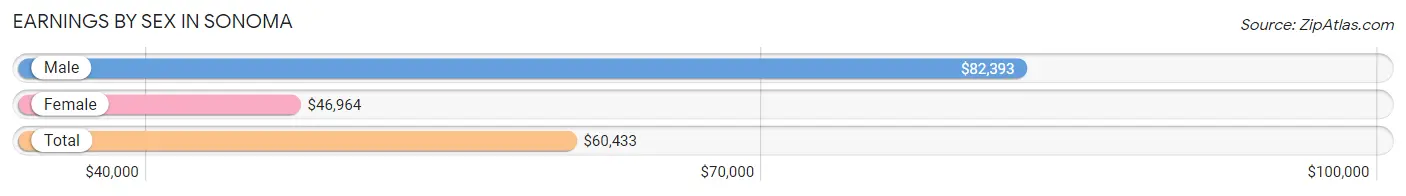
Earnings by Sex in Sonoma
Average Earnings in Sonoma are $60,433, $82,393 for men and $46,964 for women, a difference of 43.0%.
| Sex | Number | Average Earnings |
| Male | 2,647 (47.8%) | $82,393 |
| Female | 2,893 (52.2%) | $46,964 |
| Total | 5,540 (100.0%) | $60,433 |
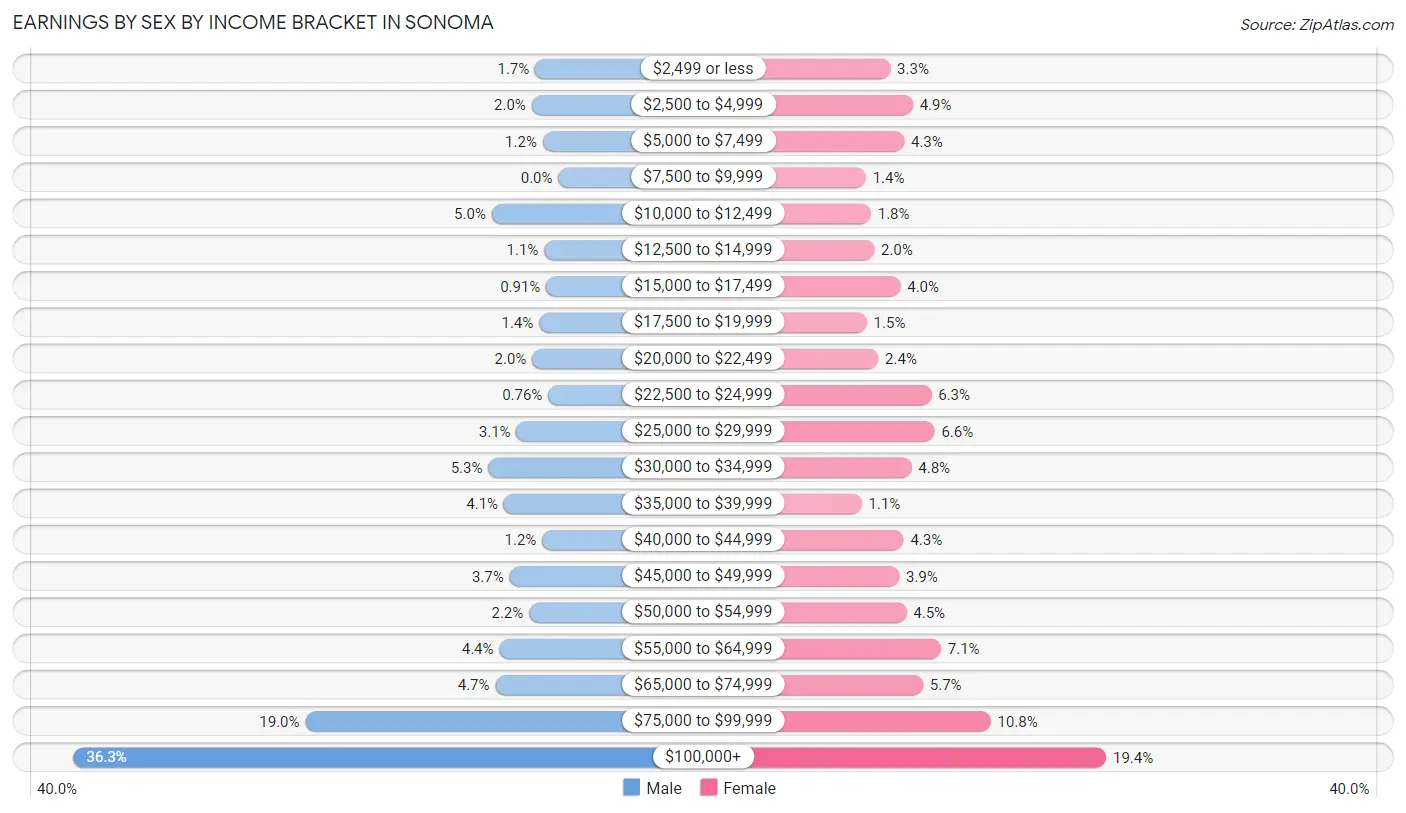
Earnings by Sex by Income Bracket in Sonoma
The most common earnings brackets in Sonoma are $100,000+ for men (962 | 36.3%) and $100,000+ for women (562 | 19.4%).
| Income | Male | Female |
| $2,499 or less | 46 (1.7%) | 94 (3.3%) |
| $2,500 to $4,999 | 53 (2.0%) | 143 (4.9%) |
| $5,000 to $7,499 | 31 (1.2%) | 124 (4.3%) |
| $7,500 to $9,999 | 0 (0.0%) | 41 (1.4%) |
| $10,000 to $12,499 | 132 (5.0%) | 52 (1.8%) |
| $12,500 to $14,999 | 28 (1.1%) | 59 (2.0%) |
| $15,000 to $17,499 | 24 (0.9%) | 116 (4.0%) |
| $17,500 to $19,999 | 38 (1.4%) | 43 (1.5%) |
| $20,000 to $22,499 | 52 (2.0%) | 68 (2.4%) |
| $22,500 to $24,999 | 20 (0.8%) | 183 (6.3%) |
| $25,000 to $29,999 | 83 (3.1%) | 190 (6.6%) |
| $30,000 to $34,999 | 139 (5.2%) | 140 (4.8%) |
| $35,000 to $39,999 | 108 (4.1%) | 32 (1.1%) |
| $40,000 to $44,999 | 32 (1.2%) | 123 (4.3%) |
| $45,000 to $49,999 | 97 (3.7%) | 113 (3.9%) |
| $50,000 to $54,999 | 58 (2.2%) | 129 (4.5%) |
| $55,000 to $64,999 | 117 (4.4%) | 204 (7.0%) |
| $65,000 to $74,999 | 125 (4.7%) | 165 (5.7%) |
| $75,000 to $99,999 | 502 (19.0%) | 312 (10.8%) |
| $100,000+ | 962 (36.3%) | 562 (19.4%) |
| Total | 2,647 (100.0%) | 2,893 (100.0%) |
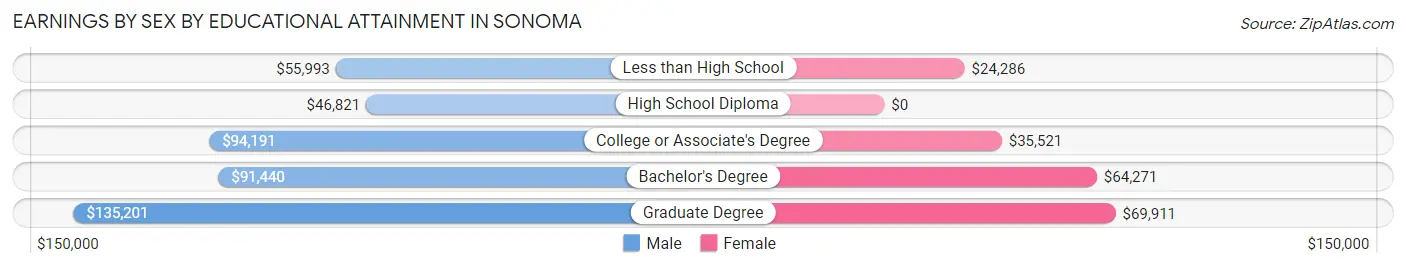
Earnings by Sex by Educational Attainment in Sonoma
Average earnings in Sonoma are $86,821 for men and $51,840 for women, a difference of 40.3%. Men with an educational attainment of graduate degree enjoy the highest average annual earnings of $135,201, while those with high school diploma education earn the least with $46,821. Women with an educational attainment of graduate degree earn the most with the average annual earnings of $69,911, while those with less than high school education have the smallest earnings of $24,286.
| Educational Attainment | Male Income | Female Income |
| Less than High School | $55,993 | $24,286 |
| High School Diploma | $46,821 | $0 |
| College or Associate's Degree | $94,191 | $35,521 |
| Bachelor's Degree | $91,440 | $64,271 |
| Graduate Degree | $135,201 | $69,911 |
| Total | $86,821 | $51,840 |
Family Income in Sonoma
Family Income Brackets in Sonoma
According to the Sonoma family income data, there are 778 families falling into the $200,000+ income range, which is the most common income bracket and makes up 28.4% of all families. Conversely, the $10,000 to $14,999 income bracket is the least frequent group with only 19 families (0.7%) belonging to this category.
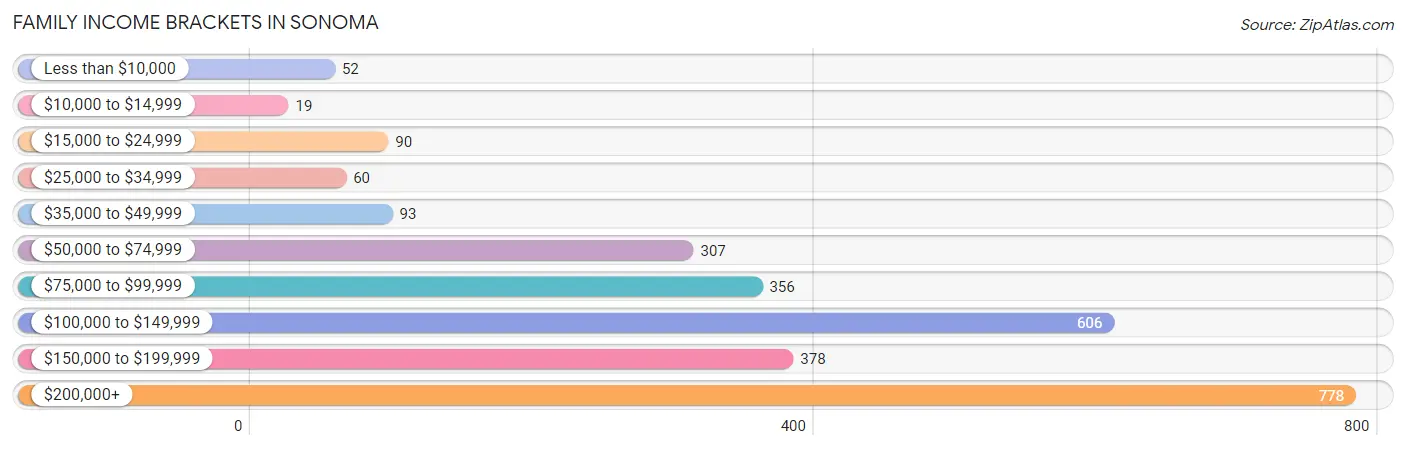
| Income Bracket | # Families | % Families |
| Less than $10,000 | 52 | 1.9% |
| $10,000 to $14,999 | 19 | 0.7% |
| $15,000 to $24,999 | 90 | 3.3% |
| $25,000 to $34,999 | 60 | 2.2% |
| $35,000 to $49,999 | 93 | 3.4% |
| $50,000 to $74,999 | 307 | 11.2% |
| $75,000 to $99,999 | 356 | 13.0% |
| $100,000 to $149,999 | 606 | 22.1% |
| $150,000 to $199,999 | 378 | 13.8% |
| $200,000+ | 778 | 28.4% |
Family Income by Famaliy Size in Sonoma
5-person families (44 | 1.6%) account for the highest median family income in Sonoma with $169,167 per family, while 2-person families (1,577 | 57.5%) have the highest median income of $70,541 per family member.
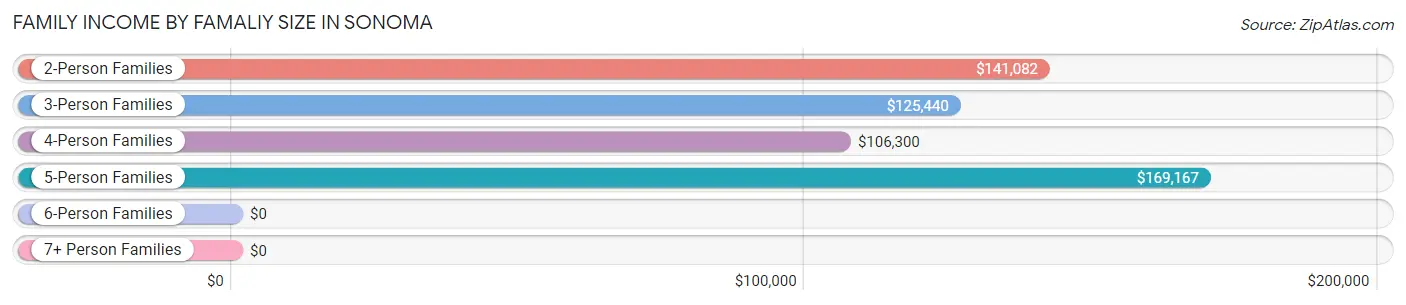
| Income Bracket | # Families | Median Income |
| 2-Person Families | 1,577 (57.5%) | $141,082 |
| 3-Person Families | 717 (26.2%) | $125,440 |
| 4-Person Families | 364 (13.3%) | $106,300 |
| 5-Person Families | 44 (1.6%) | $169,167 |
| 6-Person Families | 39 (1.4%) | $0 |
| 7+ Person Families | 0 (0.0%) | $0 |
| Total | 2,741 (100.0%) | $127,743 |
Family Income by Number of Earners in Sonoma
The median family income in Sonoma is $127,743, with families comprising 2 earners (1,413) having the highest median family income of $161,932, while families with no earners (667) have the lowest median family income of $76,676, accounting for 51.5% and 24.3% of families, respectively.
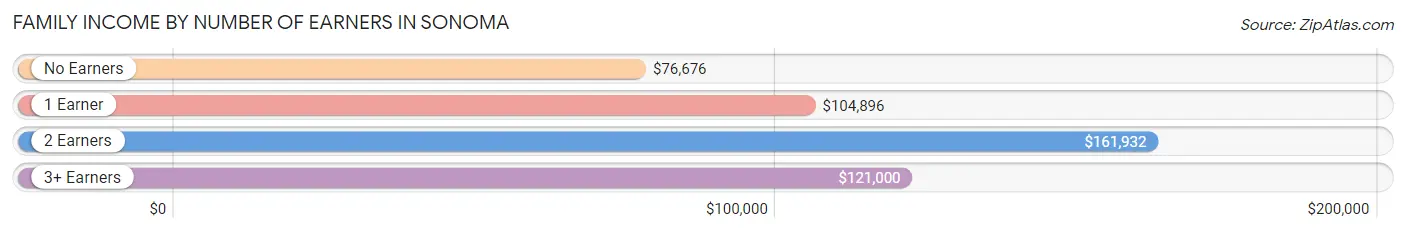
| Number of Earners | # Families | Median Income |
| No Earners | 667 (24.3%) | $76,676 |
| 1 Earner | 519 (18.9%) | $104,896 |
| 2 Earners | 1,413 (51.5%) | $161,932 |
| 3+ Earners | 142 (5.2%) | $121,000 |
| Total | 2,741 (100.0%) | $127,743 |
Household Income in Sonoma
Household Income Brackets in Sonoma
With 1,164 households falling in the category, the $200,000+ income range is the most frequent in Sonoma, accounting for 21.8% of all households. In contrast, only 101 households (1.9%) fall into the $10,000 to $14,999 income bracket, making it the least populous group.
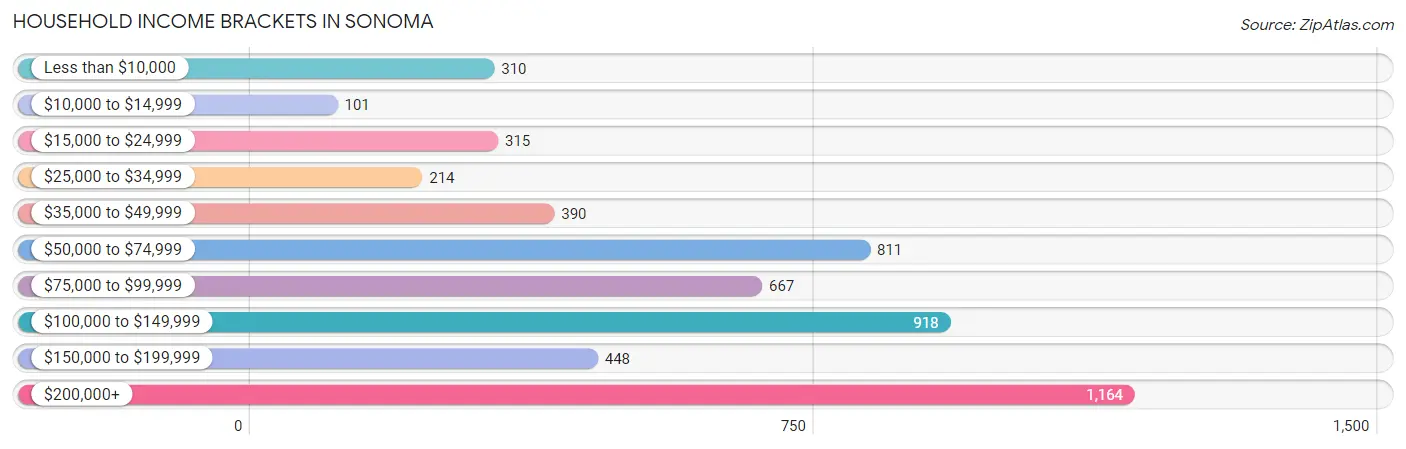
| Income Bracket | # Households | % Households |
| Less than $10,000 | 310 | 5.8% |
| $10,000 to $14,999 | 101 | 1.9% |
| $15,000 to $24,999 | 315 | 5.9% |
| $25,000 to $34,999 | 214 | 4.0% |
| $35,000 to $49,999 | 390 | 7.3% |
| $50,000 to $74,999 | 811 | 15.2% |
| $75,000 to $99,999 | 667 | 12.5% |
| $100,000 to $149,999 | 918 | 17.2% |
| $150,000 to $199,999 | 448 | 8.4% |
| $200,000+ | 1,164 | 21.8% |
Household Income by Householder Age in Sonoma
The median household income in Sonoma is $96,090, with the highest median household income of $126,321 found in the 45 to 64 years age bracket for the primary householder. A total of 2,105 households (39.4%) fall into this category. Meanwhile, the 15 to 24 years age bracket for the primary householder has the lowest median household income of $0, with 34 households (0.6%) in this group.
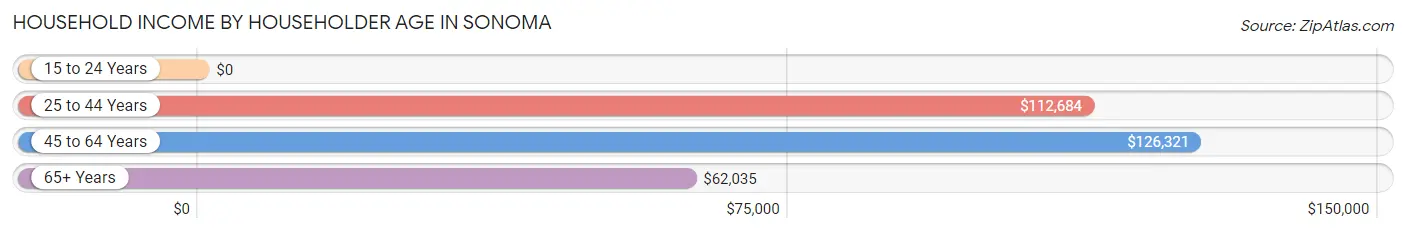
| Income Bracket | # Households | Median Income |
| 15 to 24 Years | 34 (0.6%) | $0 |
| 25 to 44 Years | 815 (15.3%) | $112,684 |
| 45 to 64 Years | 2,105 (39.4%) | $126,321 |
| 65+ Years | 2,384 (44.7%) | $62,035 |
| Total | 5,338 (100.0%) | $96,090 |
Poverty in Sonoma
Income Below Poverty by Sex and Age in Sonoma
With 6.6% poverty level for males and 10.6% for females among the residents of Sonoma, 5 year old males and 6 to 11 year old females are the most vulnerable to poverty, with 30 males (35.7%) and 88 females (32.1%) in their respective age groups living below the poverty level.
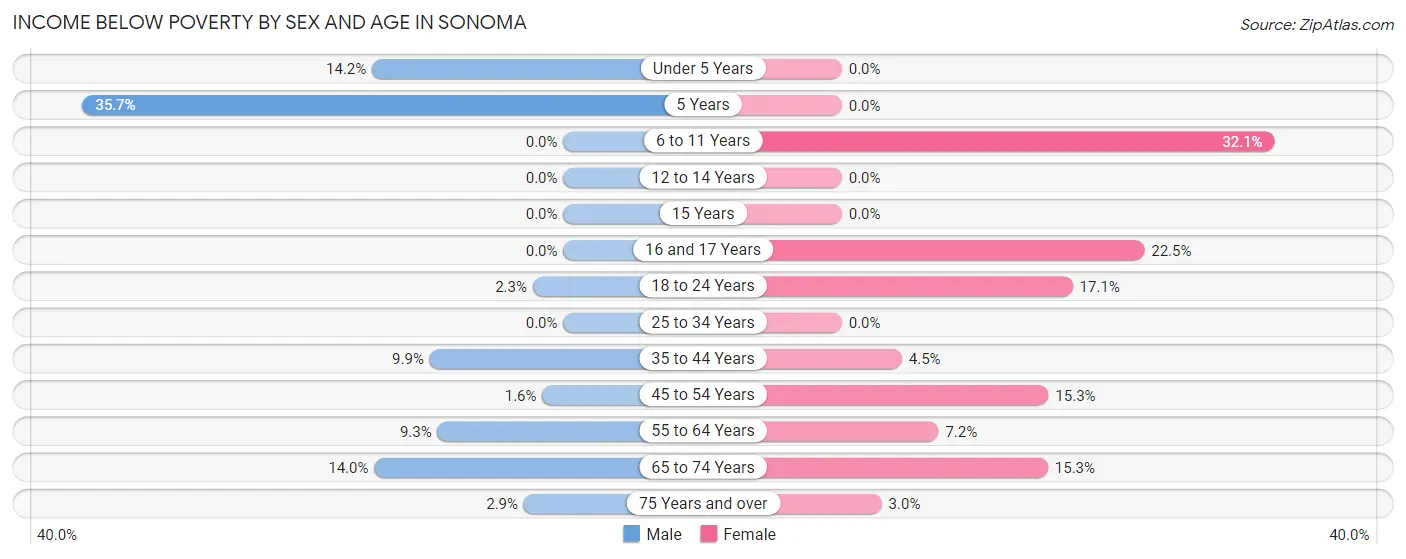
| Age Bracket | Male | Female |
| Under 5 Years | 24 (14.2%) | 0 (0.0%) |
| 5 Years | 30 (35.7%) | 0 (0.0%) |
| 6 to 11 Years | 0 (0.0%) | 88 (32.1%) |
| 12 to 14 Years | 0 (0.0%) | 0 (0.0%) |
| 15 Years | 0 (0.0%) | 0 (0.0%) |
| 16 and 17 Years | 0 (0.0%) | 42 (22.5%) |
| 18 to 24 Years | 6 (2.3%) | 42 (17.1%) |
| 25 to 34 Years | 0 (0.0%) | 0 (0.0%) |
| 35 to 44 Years | 50 (9.9%) | 18 (4.5%) |
| 45 to 54 Years | 11 (1.6%) | 166 (15.3%) |
| 55 to 64 Years | 65 (9.3%) | 65 (7.2%) |
| 65 to 74 Years | 106 (14.0%) | 155 (15.3%) |
| 75 Years and over | 16 (2.9%) | 34 (3.0%) |
| Total | 308 (6.6%) | 610 (10.6%) |
Income Above Poverty by Sex and Age in Sonoma
According to the poverty statistics in Sonoma, males aged 6 to 11 years and females aged under 5 years are the age groups that are most secure financially, with 100.0% of males and 100.0% of females in these age groups living above the poverty line.
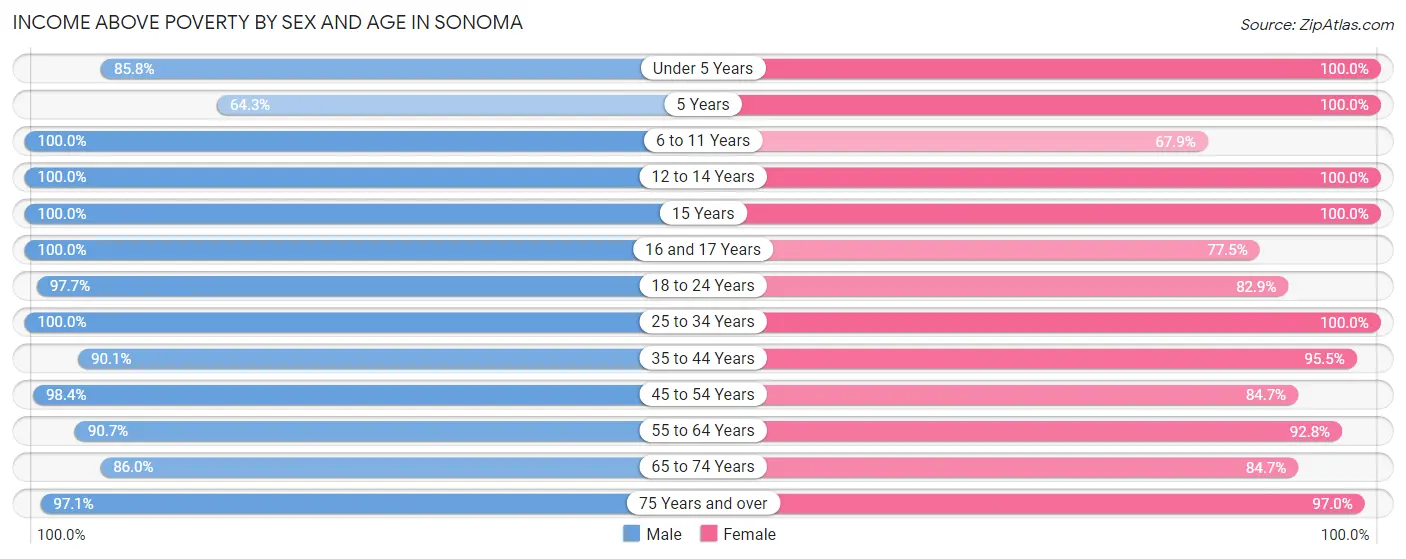
| Age Bracket | Male | Female |
| Under 5 Years | 145 (85.8%) | 84 (100.0%) |
| 5 Years | 54 (64.3%) | 13 (100.0%) |
| 6 to 11 Years | 216 (100.0%) | 186 (67.9%) |
| 12 to 14 Years | 130 (100.0%) | 75 (100.0%) |
| 15 Years | 2 (100.0%) | 9 (100.0%) |
| 16 and 17 Years | 181 (100.0%) | 145 (77.5%) |
| 18 to 24 Years | 258 (97.7%) | 203 (82.9%) |
| 25 to 34 Years | 405 (100.0%) | 322 (100.0%) |
| 35 to 44 Years | 454 (90.1%) | 386 (95.5%) |
| 45 to 54 Years | 696 (98.4%) | 916 (84.7%) |
| 55 to 64 Years | 631 (90.7%) | 840 (92.8%) |
| 65 to 74 Years | 649 (86.0%) | 858 (84.7%) |
| 75 Years and over | 531 (97.1%) | 1,115 (97.0%) |
| Total | 4,352 (93.4%) | 5,152 (89.4%) |
Income Below Poverty Among Married-Couple Families in Sonoma
The poverty statistics for married-couple families in Sonoma show that 3.6% or 83 of the total 2,275 families live below the poverty line. Families with no children have the highest poverty rate of 5.1%, comprising of 83 families. On the other hand, families with 1 or 2 children have the lowest poverty rate of 0.0%, which includes 0 families.
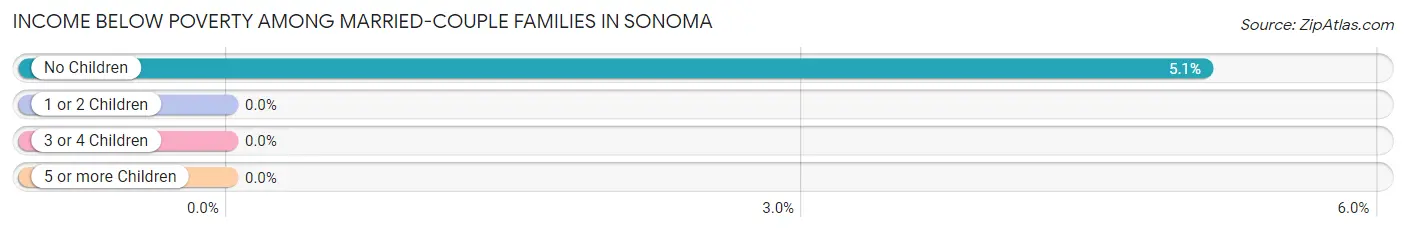
| Children | Above Poverty | Below Poverty |
| No Children | 1,548 (94.9%) | 83 (5.1%) |
| 1 or 2 Children | 629 (100.0%) | 0 (0.0%) |
| 3 or 4 Children | 15 (100.0%) | 0 (0.0%) |
| 5 or more Children | 0 (0.0%) | 0 (0.0%) |
| Total | 2,192 (96.4%) | 83 (3.6%) |
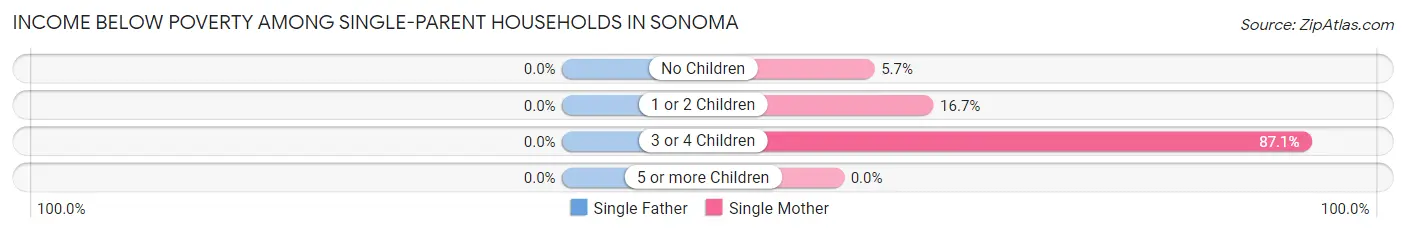
Income Below Poverty Among Single-Parent Households in Sonoma
| Children | Single Father | Single Mother |
| No Children | 0 (0.0%) | 7 (5.7%) |
| 1 or 2 Children | 0 (0.0%) | 34 (16.7%) |
| 3 or 4 Children | 0 (0.0%) | 27 (87.1%) |
| 5 or more Children | 0 (0.0%) | 0 (0.0%) |
| Total | 0 (0.0%) | 68 (19.0%) |
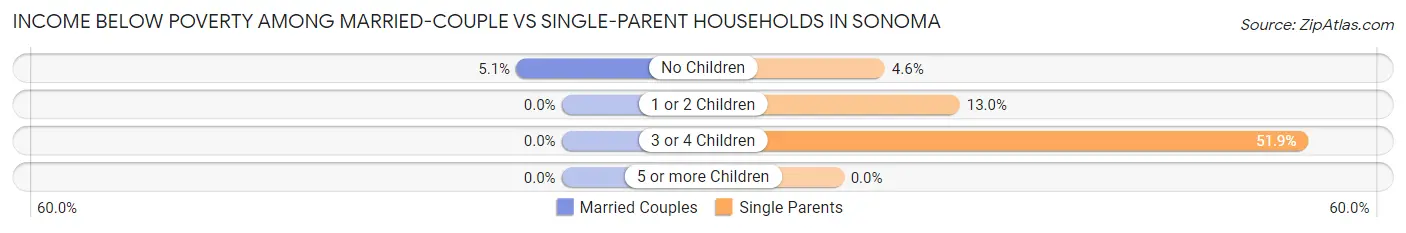
Income Below Poverty Among Married-Couple vs Single-Parent Households in Sonoma
The poverty data for Sonoma shows that 83 of the married-couple family households (3.6%) and 68 of the single-parent households (14.6%) are living below the poverty level. Within the married-couple family households, those with no children have the highest poverty rate, with 83 households (5.1%) falling below the poverty line. Among the single-parent households, those with 3 or 4 children have the highest poverty rate, with 27 household (51.9%) living below poverty.
| Children | Married-Couple Families | Single-Parent Households |
| No Children | 83 (5.1%) | 7 (4.6%) |
| 1 or 2 Children | 0 (0.0%) | 34 (13.0%) |
| 3 or 4 Children | 0 (0.0%) | 27 (51.9%) |
| 5 or more Children | 0 (0.0%) | 0 (0.0%) |
| Total | 83 (3.6%) | 68 (14.6%) |
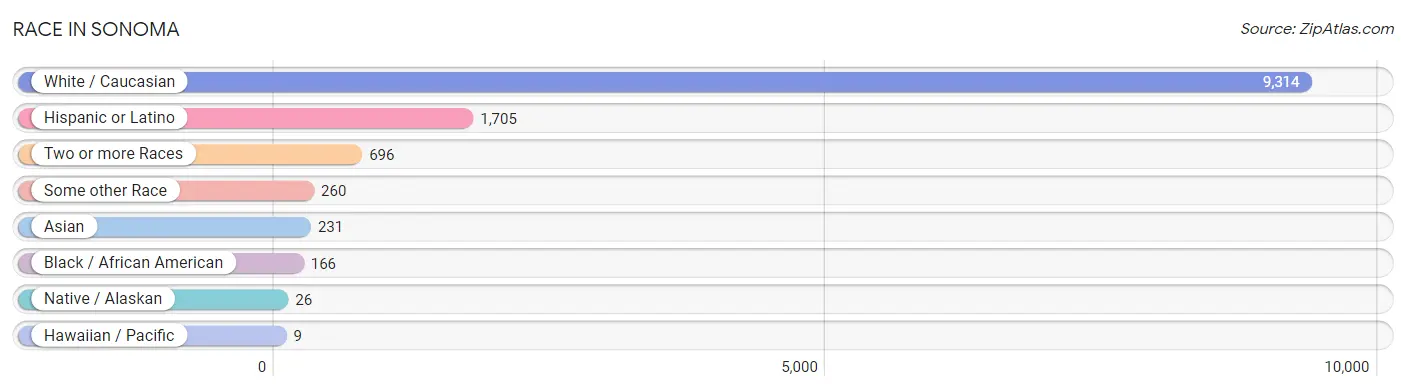
Race in Sonoma
The most populous races in Sonoma are White / Caucasian (9,314 | 87.0%), Hispanic or Latino (1,705 | 15.9%), and Two or more Races (696 | 6.5%).
| Race | # Population | % Population |
| Asian | 231 | 2.2% |
| Black / African American | 166 | 1.5% |
| Hawaiian / Pacific | 9 | 0.1% |
| Hispanic or Latino | 1,705 | 15.9% |
| Native / Alaskan | 26 | 0.2% |
| White / Caucasian | 9,314 | 87.0% |
| Two or more Races | 696 | 6.5% |
| Some other Race | 260 | 2.4% |
| Total | 10,702 | 100.0% |
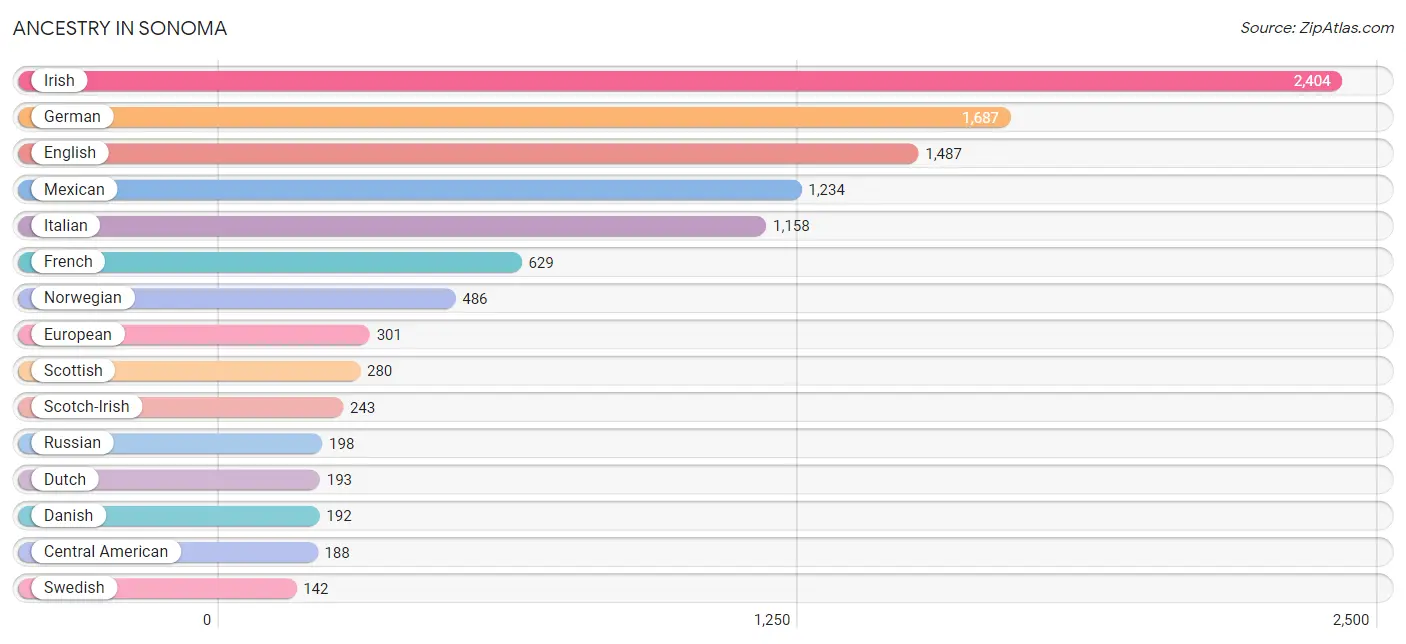
Ancestry in Sonoma
The most populous ancestries reported in Sonoma are Irish (2,404 | 22.5%), German (1,687 | 15.8%), English (1,487 | 13.9%), Mexican (1,234 | 11.5%), and Italian (1,158 | 10.8%), together accounting for 74.5% of all Sonoma residents.
| Ancestry | # Population | % Population |
| Albanian | 13 | 0.1% |
| American | 115 | 1.1% |
| Apache | 26 | 0.2% |
| Arab | 39 | 0.4% |
| Argentinean | 9 | 0.1% |
| Armenian | 82 | 0.8% |
| Austrian | 41 | 0.4% |
| Belgian | 11 | 0.1% |
| Bhutanese | 33 | 0.3% |
| British | 59 | 0.5% |
| Bulgarian | 12 | 0.1% |
| Canadian | 26 | 0.2% |
| Central American | 188 | 1.8% |
| Central American Indian | 26 | 0.2% |
| Cherokee | 12 | 0.1% |
| Colombian | 67 | 0.6% |
| Croatian | 86 | 0.8% |
| Czech | 11 | 0.1% |
| Czechoslovakian | 10 | 0.1% |
| Danish | 192 | 1.8% |
| Dutch | 193 | 1.8% |
| Eastern European | 78 | 0.7% |
| English | 1,487 | 13.9% |
| European | 301 | 2.8% |
| Finnish | 53 | 0.5% |
| French | 629 | 5.9% |
| French Canadian | 31 | 0.3% |
| German | 1,687 | 15.8% |
| Greek | 88 | 0.8% |
| Guamanian / Chamorro | 22 | 0.2% |
| Honduran | 12 | 0.1% |
| Hungarian | 21 | 0.2% |
| Indian (Asian) | 61 | 0.6% |
| Irish | 2,404 | 22.5% |
| Italian | 1,158 | 10.8% |
| Jordanian | 7 | 0.1% |
| Korean | 130 | 1.2% |
| Laotian | 5 | 0.1% |
| Malaysian | 29 | 0.3% |
| Mexican | 1,234 | 11.5% |
| Native Hawaiian | 9 | 0.1% |
| Nicaraguan | 125 | 1.2% |
| Northern European | 87 | 0.8% |
| Norwegian | 486 | 4.5% |
| Palestinian | 32 | 0.3% |
| Polish | 132 | 1.2% |
| Portuguese | 60 | 0.6% |
| Puerto Rican | 12 | 0.1% |
| Romanian | 32 | 0.3% |
| Russian | 198 | 1.8% |
| Salvadoran | 51 | 0.5% |
| Scandinavian | 47 | 0.4% |
| Scotch-Irish | 243 | 2.3% |
| Scottish | 280 | 2.6% |
| Serbian | 13 | 0.1% |
| Sioux | 33 | 0.3% |
| Slovak | 23 | 0.2% |
| Slovene | 14 | 0.1% |
| South American | 76 | 0.7% |
| Spaniard | 66 | 0.6% |
| Spanish | 96 | 0.9% |
| Swedish | 142 | 1.3% |
| Swiss | 80 | 0.7% |
| Thai | 85 | 0.8% |
| Ukrainian | 18 | 0.2% |
| Welsh | 140 | 1.3% |
| Yugoslavian | 38 | 0.4% | View All 67 Rows |
Immigrants in Sonoma
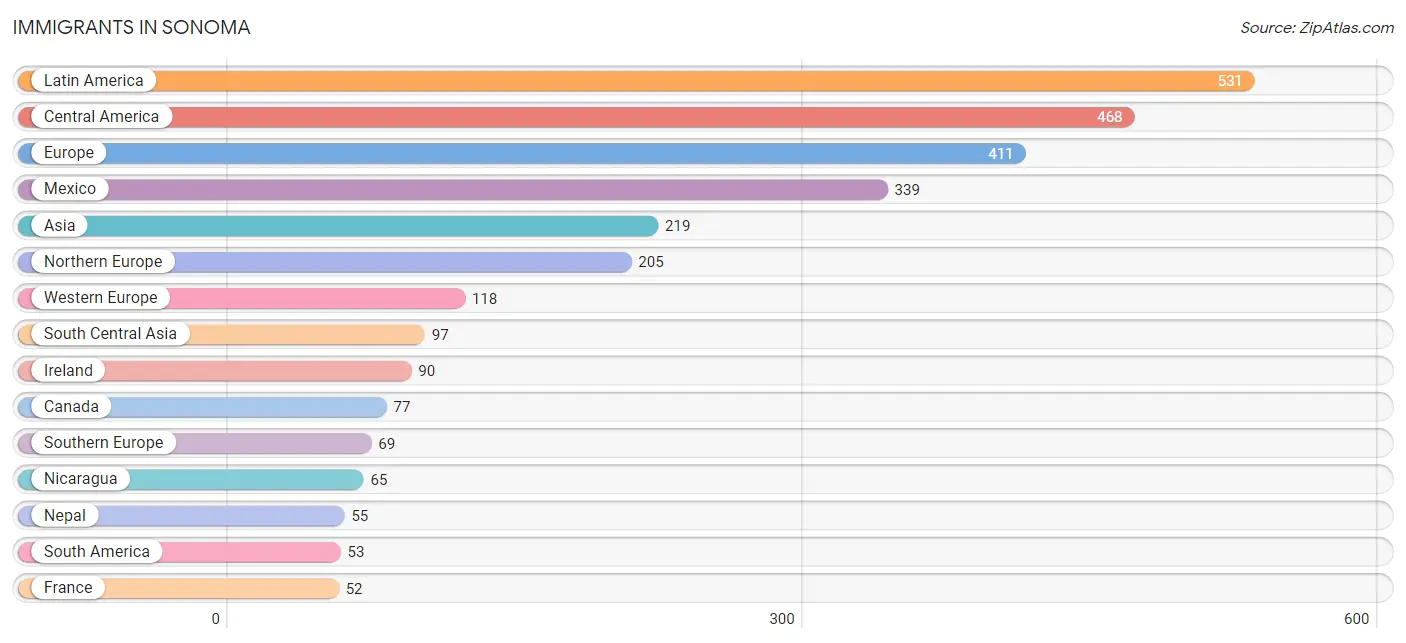
The most numerous immigrant groups reported in Sonoma came from Latin America (531 | 5.0%), Central America (468 | 4.4%), Europe (411 | 3.8%), Mexico (339 | 3.2%), and Asia (219 | 2.1%), together accounting for 18.4% of all Sonoma residents.
| Immigration Origin | # Population | % Population |
| Argentina | 44 | 0.4% |
| Asia | 219 | 2.1% |
| Australia | 17 | 0.2% |
| Austria | 14 | 0.1% |
| Barbados | 10 | 0.1% |
| Belgium | 11 | 0.1% |
| Cambodia | 23 | 0.2% |
| Canada | 77 | 0.7% |
| Caribbean | 10 | 0.1% |
| Central America | 468 | 4.4% |
| China | 24 | 0.2% |
| Colombia | 9 | 0.1% |
| Costa Rica | 34 | 0.3% |
| Denmark | 16 | 0.2% |
| Eastern Asia | 24 | 0.2% |
| Eastern Europe | 19 | 0.2% |
| El Salvador | 26 | 0.2% |
| Europe | 411 | 3.8% |
| France | 52 | 0.5% |
| Germany | 18 | 0.2% |
| Greece | 8 | 0.1% |
| Honduras | 4 | 0.0% |
| India | 42 | 0.4% |
| Indonesia | 19 | 0.2% |
| Ireland | 90 | 0.8% |
| Italy | 50 | 0.5% |
| Jordan | 7 | 0.1% |
| Latin America | 531 | 5.0% |
| Lebanon | 11 | 0.1% |
| Mexico | 339 | 3.2% |
| Nepal | 55 | 0.5% |
| Nicaragua | 65 | 0.6% |
| Northern Europe | 205 | 1.9% |
| Oceania | 17 | 0.2% |
| Poland | 10 | 0.1% |
| Scotland | 30 | 0.3% |
| South America | 53 | 0.5% |
| South Central Asia | 97 | 0.9% |
| South Eastern Asia | 48 | 0.4% |
| Southern Europe | 69 | 0.6% |
| Sweden | 14 | 0.1% |
| Switzerland | 23 | 0.2% |
| Ukraine | 9 | 0.1% |
| Vietnam | 6 | 0.1% |
| Western Asia | 18 | 0.2% |
| Western Europe | 118 | 1.1% | View All 46 Rows |
Sex and Age in Sonoma
Sex and Age in Sonoma
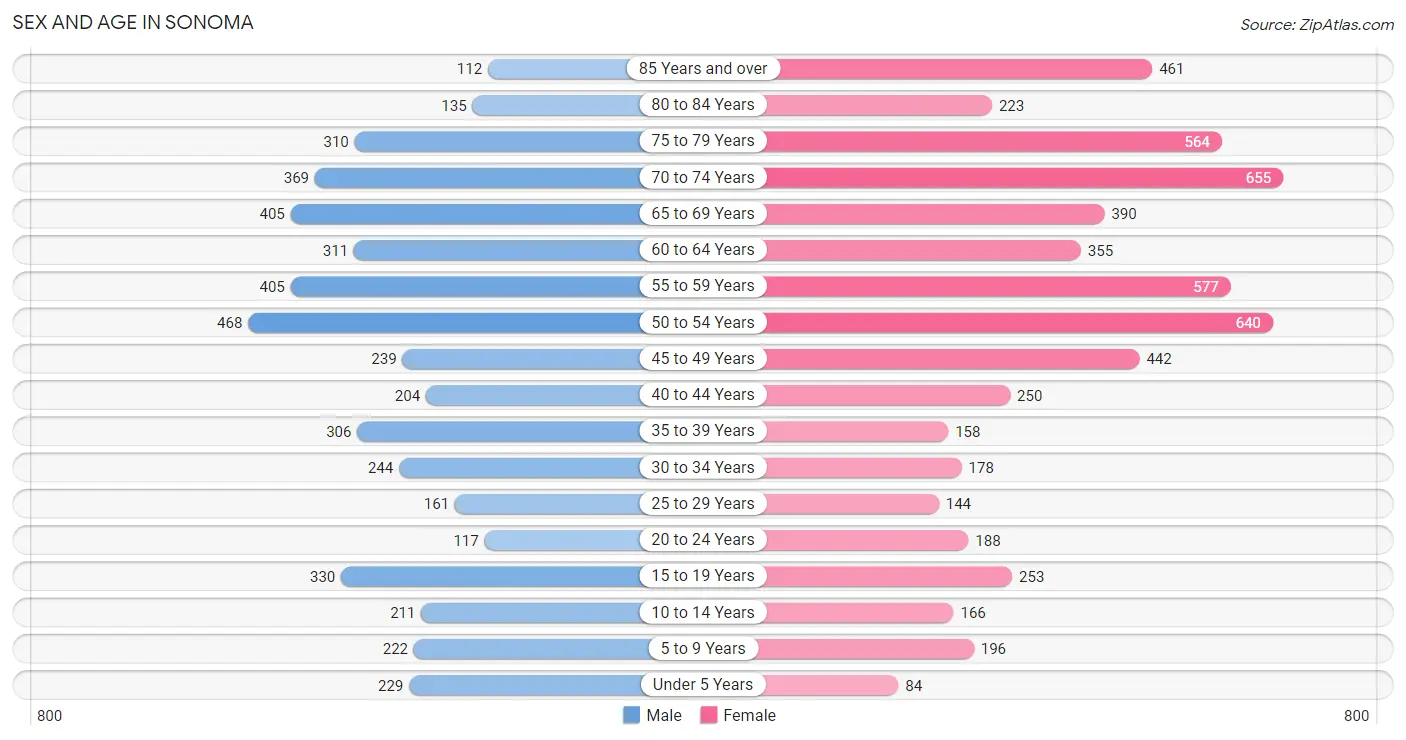
The most populous age groups in Sonoma are 50 to 54 Years (468 | 9.8%) for men and 70 to 74 Years (655 | 11.1%) for women.
| Age Bracket | Male | Female |
| Under 5 Years | 229 (4.8%) | 84 (1.4%) |
| 5 to 9 Years | 222 (4.6%) | 196 (3.3%) |
| 10 to 14 Years | 211 (4.4%) | 166 (2.8%) |
| 15 to 19 Years | 330 (6.9%) | 253 (4.3%) |
| 20 to 24 Years | 117 (2.5%) | 188 (3.2%) |
| 25 to 29 Years | 161 (3.4%) | 144 (2.4%) |
| 30 to 34 Years | 244 (5.1%) | 178 (3.0%) |
| 35 to 39 Years | 306 (6.4%) | 158 (2.7%) |
| 40 to 44 Years | 204 (4.3%) | 250 (4.2%) |
| 45 to 49 Years | 239 (5.0%) | 442 (7.5%) |
| 50 to 54 Years | 468 (9.8%) | 640 (10.8%) |
| 55 to 59 Years | 405 (8.5%) | 577 (9.7%) |
| 60 to 64 Years | 311 (6.5%) | 355 (6.0%) |
| 65 to 69 Years | 405 (8.5%) | 390 (6.6%) |
| 70 to 74 Years | 369 (7.7%) | 655 (11.1%) |
| 75 to 79 Years | 310 (6.5%) | 564 (9.5%) |
| 80 to 84 Years | 135 (2.8%) | 223 (3.8%) |
| 85 Years and over | 112 (2.3%) | 461 (7.8%) |
| Total | 4,778 (100.0%) | 5,924 (100.0%) |
Families and Households in Sonoma
Median Family Size in Sonoma
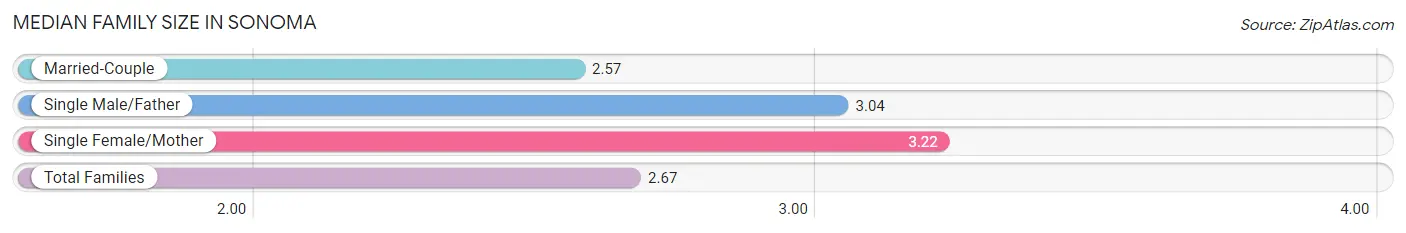
The median family size in Sonoma is 2.67 persons per family, with single female/mother families (358 | 13.1%) accounting for the largest median family size of 3.22 persons per family. On the other hand, married-couple families (2,275 | 83.0%) represent the smallest median family size with 2.57 persons per family.
| Family Type | # Families | Family Size |
| Married-Couple | 2,275 (83.0%) | 2.57 |
| Single Male/Father | 108 (3.9%) | 3.04 |
| Single Female/Mother | 358 (13.1%) | 3.22 |
| Total Families | 2,741 (100.0%) | 2.67 |
Median Household Size in Sonoma
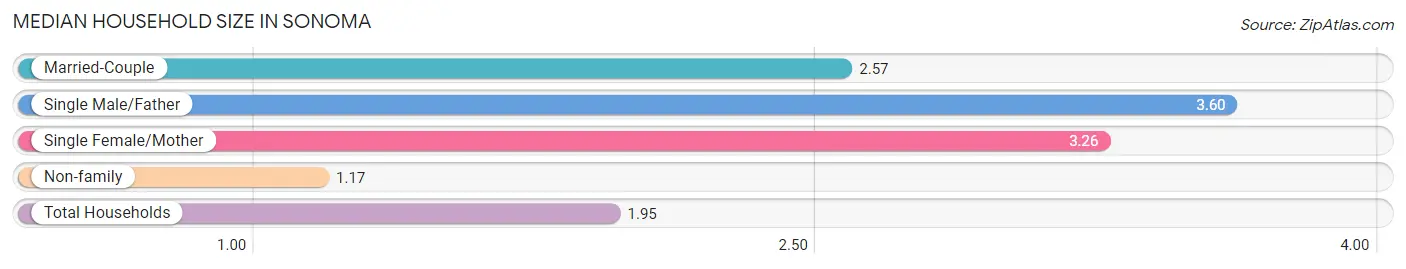
The median household size in Sonoma is 1.95 persons per household, with single male/father households (108 | 2.0%) accounting for the largest median household size of 3.6 persons per household. non-family households (2,597 | 48.6%) represent the smallest median household size with 1.17 persons per household.
| Household Type | # Households | Household Size |
| Married-Couple | 2,275 (42.6%) | 2.57 |
| Single Male/Father | 108 (2.0%) | 3.60 |
| Single Female/Mother | 358 (6.7%) | 3.26 |
| Non-family | 2,597 (48.6%) | 1.17 |
| Total Households | 5,338 (100.0%) | 1.95 |
Household Size by Marriage Status in Sonoma
Out of a total of 5,338 households in Sonoma, 2,741 (51.3%) are family households, while 2,597 (48.6%) are nonfamily households. The most numerous type of family households are 2-person households, comprising 1,541, and the most common type of nonfamily households are 1-person households, comprising 2,219.
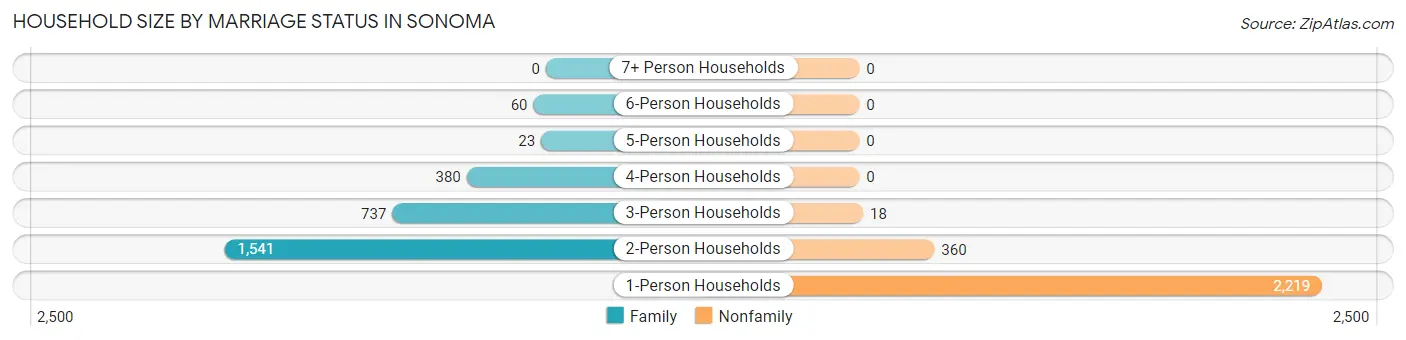
| Household Size | Family Households | Nonfamily Households |
| 1-Person Households | - | 2,219 (41.6%) |
| 2-Person Households | 1,541 (28.9%) | 360 (6.7%) |
| 3-Person Households | 737 (13.8%) | 18 (0.3%) |
| 4-Person Households | 380 (7.1%) | 0 (0.0%) |
| 5-Person Households | 23 (0.4%) | 0 (0.0%) |
| 6-Person Households | 60 (1.1%) | 0 (0.0%) |
| 7+ Person Households | 0 (0.0%) | 0 (0.0%) |
| Total | 2,741 (51.3%) | 2,597 (48.6%) |
Female Fertility in Sonoma
Fertility by Age in Sonoma
Average fertility rate in Sonoma is 64.0 births per 1,000 women. Women in the age bracket of 35 to 50 years have the highest fertility rate with 75.0 births per 1,000 women. Women in the age bracket of 35 to 50 years acount for 69.4% of all women with births.
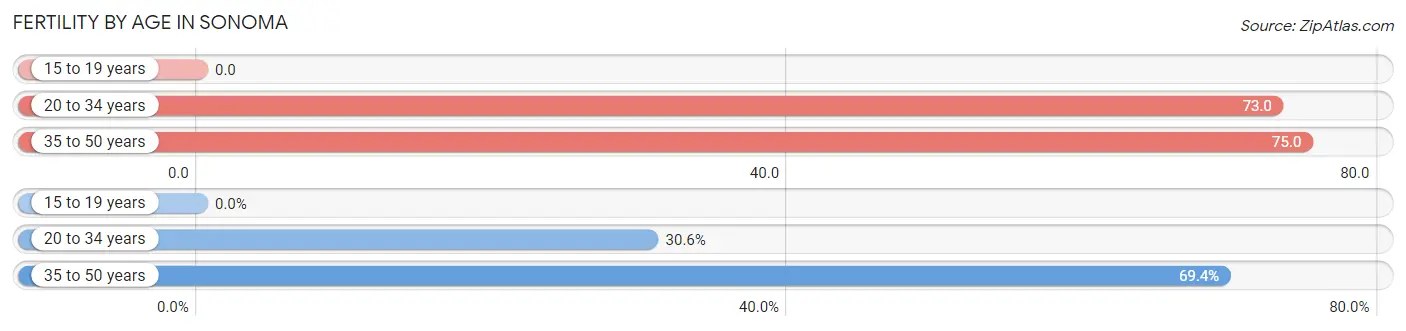
| Age Bracket | Women with Births | Births / 1,000 Women |
| 15 to 19 years | 0 (0.0%) | 0.0 |
| 20 to 34 years | 37 (30.6%) | 73.0 |
| 35 to 50 years | 84 (69.4%) | 75.0 |
| Total | 121 (100.0%) | 64.0 |
Fertility by Age by Marriage Status in Sonoma
71.9% of women with births (121) in Sonoma are married. The highest percentage of unmarried women with births falls into 20 to 34 years age bracket with 91.9% of them unmarried at the time of birth, while the lowest percentage of unmarried women with births belong to 35 to 50 years age bracket with 0.0% of them unmarried.
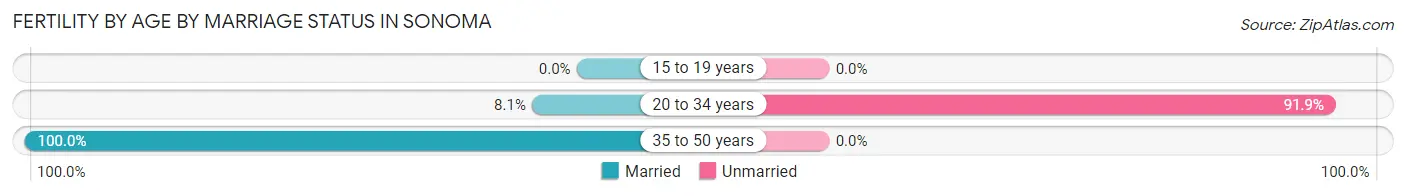
| Age Bracket | Married | Unmarried |
| 15 to 19 years | 0 (0.0%) | 0 (0.0%) |
| 20 to 34 years | 3 (8.1%) | 34 (91.9%) |
| 35 to 50 years | 84 (100.0%) | 0 (0.0%) |
| Total | 87 (71.9%) | 34 (28.1%) |
Fertility by Education in Sonoma
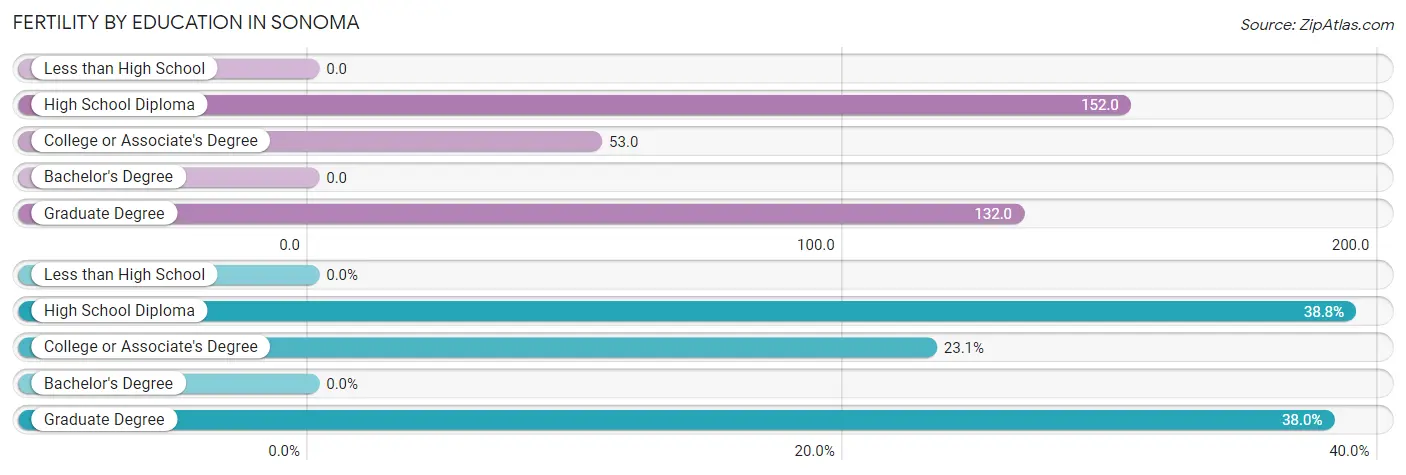
| Educational Attainment | Women with Births | Births / 1,000 Women |
| Less than High School | 0 (0.0%) | 0.0 |
| High School Diploma | 47 (38.8%) | 152.0 |
| College or Associate's Degree | 28 (23.1%) | 53.0 |
| Bachelor's Degree | 0 (0.0%) | 0.0 |
| Graduate Degree | 46 (38.0%) | 132.0 |
| Total | 121 (100.0%) | 64.0 |
Fertility by Education by Marriage Status in Sonoma
28.1% of women with births in Sonoma are unmarried. Women with the educational attainment of college or associate's degree are most likely to be married with 100.0% of them married at childbirth, while women with the educational attainment of high school diploma are least likely to be married with 72.3% of them unmarried at childbirth.
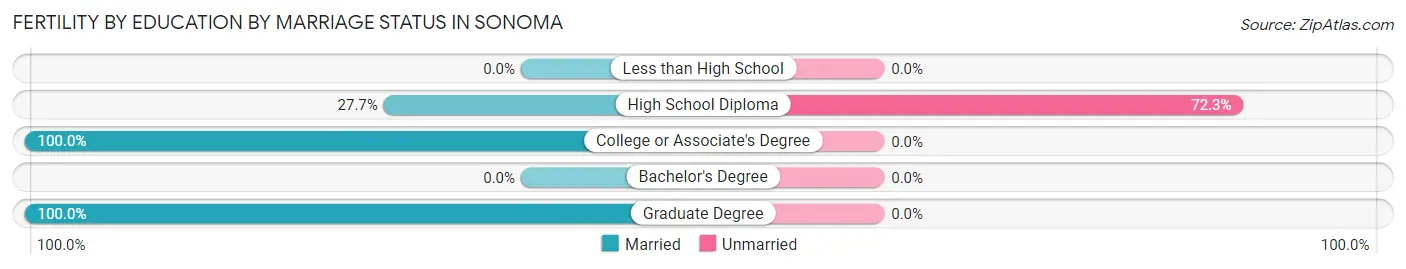
| Educational Attainment | Married | Unmarried |
| Less than High School | 0 (0.0%) | 0 (0.0%) |
| High School Diploma | 13 (27.7%) | 34 (72.3%) |
| College or Associate's Degree | 28 (100.0%) | 0 (0.0%) |
| Bachelor's Degree | 0 (0.0%) | 0 (0.0%) |
| Graduate Degree | 46 (100.0%) | 0 (0.0%) |
| Total | 87 (71.9%) | 34 (28.1%) |
Employment Characteristics in Sonoma
Employment by Class of Employer in Sonoma
Among the 4,868 employed individuals in Sonoma, private company employees (3,027 | 62.2%), self-employed (not incorporated) (523 | 10.7%), and local government employees (400 | 8.2%) make up the most common classes of employment.
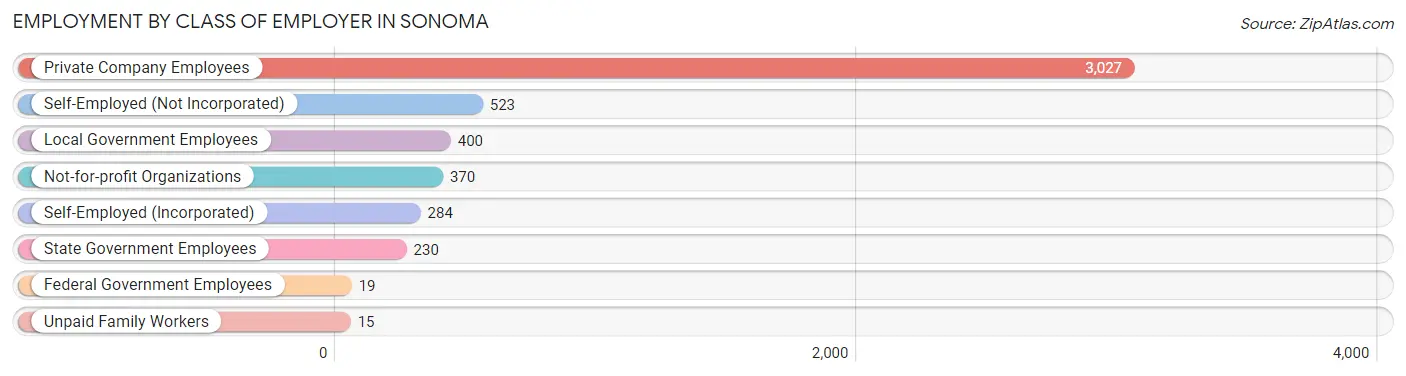
| Employer Class | # Employees | % Employees |
| Private Company Employees | 3,027 | 62.2% |
| Self-Employed (Incorporated) | 284 | 5.8% |
| Self-Employed (Not Incorporated) | 523 | 10.7% |
| Not-for-profit Organizations | 370 | 7.6% |
| Local Government Employees | 400 | 8.2% |
| State Government Employees | 230 | 4.7% |
| Federal Government Employees | 19 | 0.4% |
| Unpaid Family Workers | 15 | 0.3% |
| Total | 4,868 | 100.0% |
Employment Status by Age in Sonoma
According to the labor force statistics for Sonoma, out of the total population over 16 years of age (9,583), 55.4% or 5,309 individuals are in the labor force, with 6.1% or 324 of them unemployed. The age group with the highest labor force participation rate is 30 to 34 years, with 99.5% or 420 individuals in the labor force. Within the labor force, the 16 to 19 years age range has the highest percentage of unemployed individuals, with 22.8% or 46 of them being unemployed.
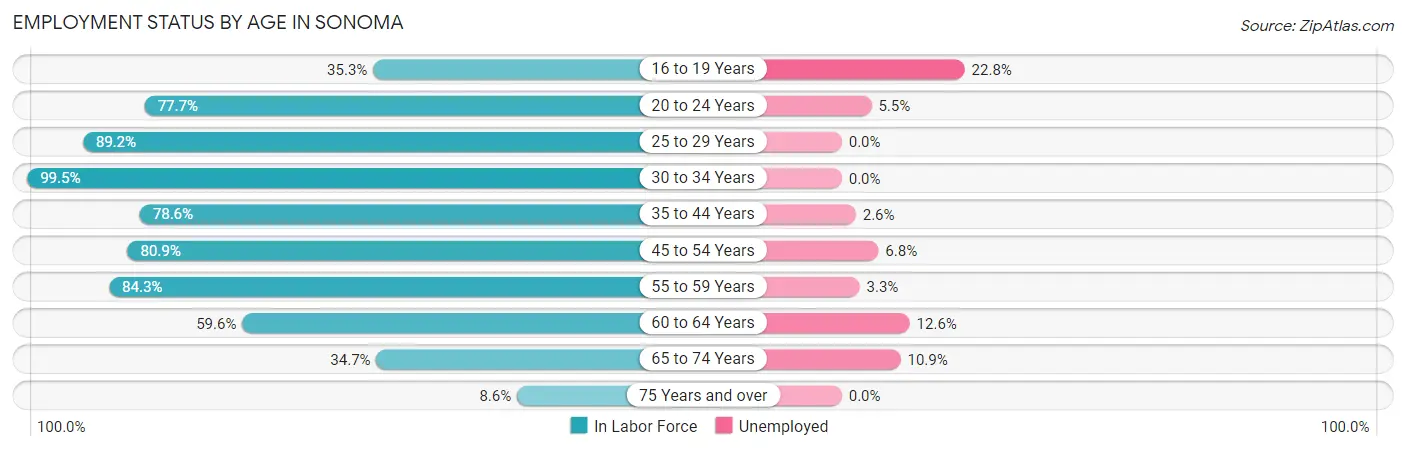
| Age Bracket | In Labor Force | Unemployed |
| 16 to 19 Years | 202 (35.3%) | 46 (22.8%) |
| 20 to 24 Years | 237 (77.7%) | 13 (5.5%) |
| 25 to 29 Years | 272 (89.2%) | 0 (0.0%) |
| 30 to 34 Years | 420 (99.5%) | 0 (0.0%) |
| 35 to 44 Years | 722 (78.6%) | 19 (2.6%) |
| 45 to 54 Years | 1,447 (80.9%) | 98 (6.8%) |
| 55 to 59 Years | 828 (84.3%) | 27 (3.3%) |
| 60 to 64 Years | 397 (59.6%) | 50 (12.6%) |
| 65 to 74 Years | 631 (34.7%) | 69 (10.9%) |
| 75 Years and over | 155 (8.6%) | 0 (0.0%) |
| Total | 5,309 (55.4%) | 324 (6.1%) |
Employment Status by Educational Attainment in Sonoma
According to labor force statistics for Sonoma, 80.4% of individuals (4,086) out of the total population between 25 and 64 years of age (5,082) are in the labor force, with 4.8% or 196 of them being unemployed. The group with the highest labor force participation rate are those with the educational attainment of bachelor's degree or higher, with 87.4% or 2,255 individuals in the labor force. Within the labor force, individuals with high school diploma education have the highest percentage of unemployment, with 7.7% or 52 of them being unemployed.
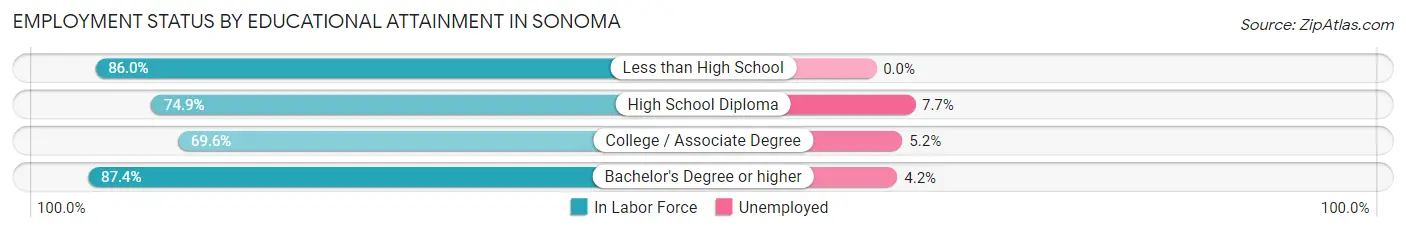
| Educational Attainment | In Labor Force | Unemployed |
| Less than High School | 221 (86.0%) | 0 (0.0%) |
| High School Diploma | 673 (74.9%) | 69 (7.7%) |
| College / Associate Degree | 938 (69.6%) | 70 (5.2%) |
| Bachelor's Degree or higher | 2,255 (87.4%) | 108 (4.2%) |
| Total | 4,086 (80.4%) | 244 (4.8%) |
Employment Occupations by Sex in Sonoma
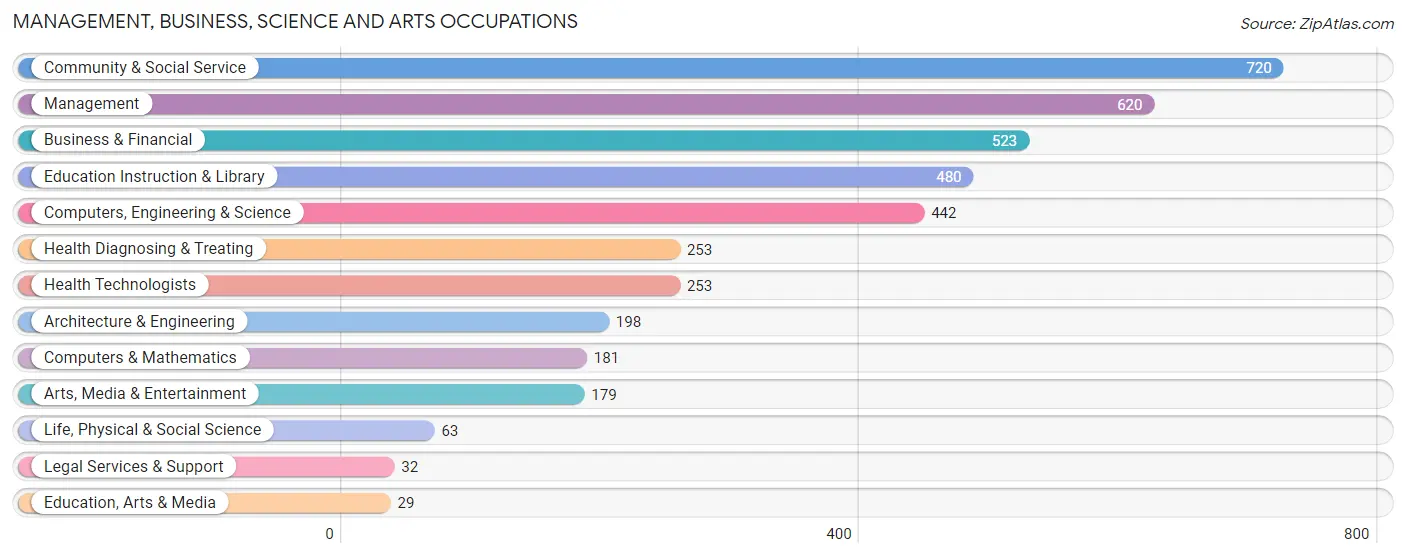
Management, Business, Science and Arts Occupations
The most common Management, Business, Science and Arts occupations in Sonoma are Community & Social Service (720 | 14.4%), Management (620 | 12.4%), Business & Financial (523 | 10.5%), Education Instruction & Library (480 | 9.6%), and Computers, Engineering & Science (442 | 8.9%).
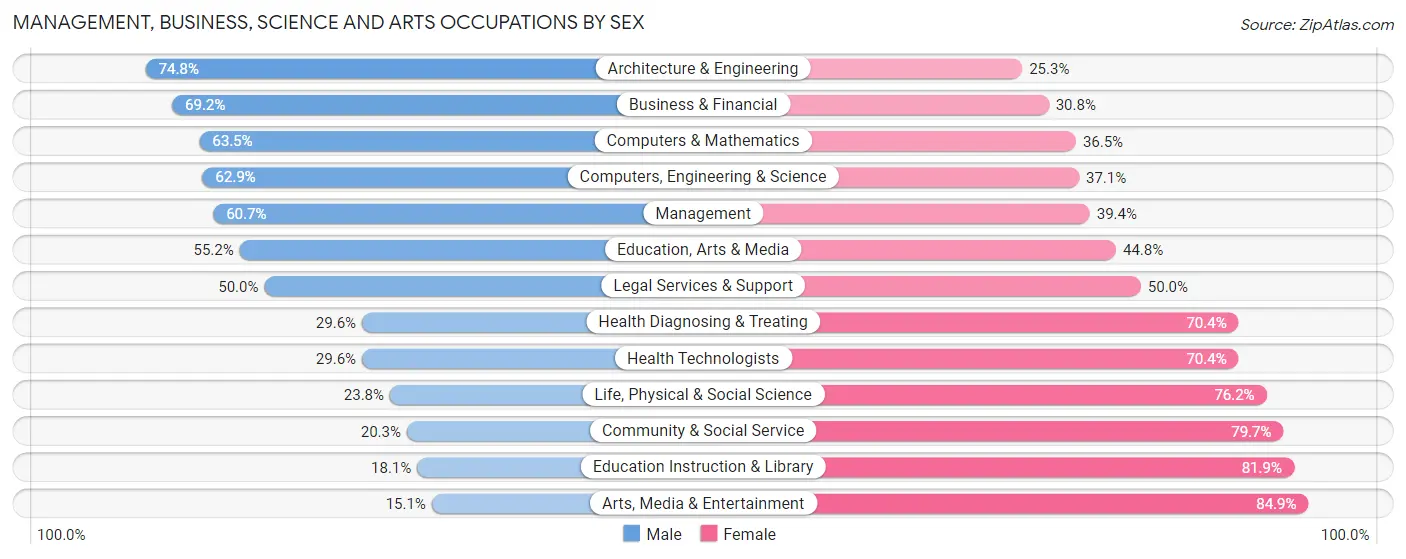
Management, Business, Science and Arts Occupations by Sex
Within the Management, Business, Science and Arts occupations in Sonoma, the most male-oriented occupations are Architecture & Engineering (74.8%), Business & Financial (69.2%), and Computers & Mathematics (63.5%), while the most female-oriented occupations are Arts, Media & Entertainment (84.9%), Education Instruction & Library (81.9%), and Community & Social Service (79.7%).
| Occupation | Male | Female |
| Management | 376 (60.7%) | 244 (39.4%) |
| Business & Financial | 362 (69.2%) | 161 (30.8%) |
| Computers, Engineering & Science | 278 (62.9%) | 164 (37.1%) |
| Computers & Mathematics | 115 (63.5%) | 66 (36.5%) |
| Architecture & Engineering | 148 (74.8%) | 50 (25.3%) |
| Life, Physical & Social Science | 15 (23.8%) | 48 (76.2%) |
| Community & Social Service | 146 (20.3%) | 574 (79.7%) |
| Education, Arts & Media | 16 (55.2%) | 13 (44.8%) |
| Legal Services & Support | 16 (50.0%) | 16 (50.0%) |
| Education Instruction & Library | 87 (18.1%) | 393 (81.9%) |
| Arts, Media & Entertainment | 27 (15.1%) | 152 (84.9%) |
| Health Diagnosing & Treating | 75 (29.6%) | 178 (70.4%) |
| Health Technologists | 75 (29.6%) | 178 (70.4%) |
| Total (Category) | 1,237 (48.4%) | 1,321 (51.6%) |
| Total (Overall) | 2,419 (48.5%) | 2,569 (51.5%) |
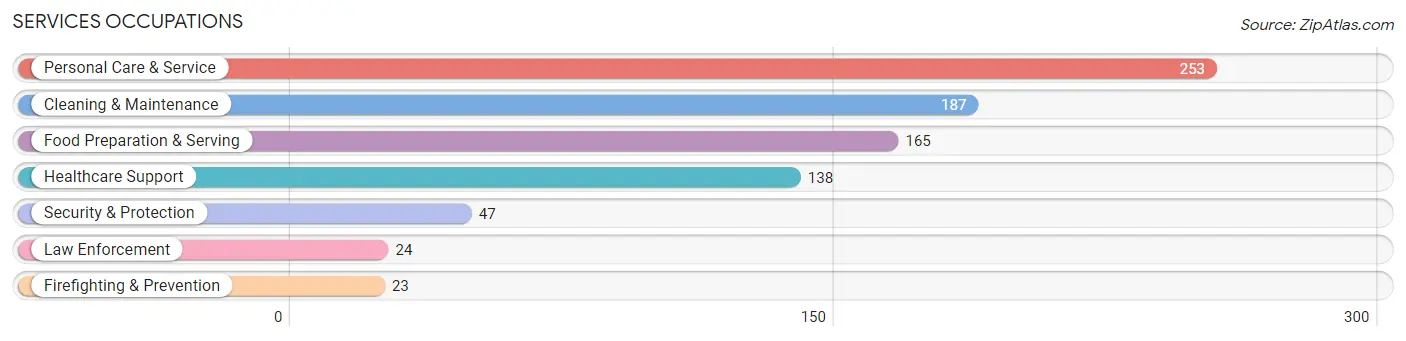
Services Occupations
The most common Services occupations in Sonoma are Personal Care & Service (253 | 5.1%), Cleaning & Maintenance (187 | 3.7%), Food Preparation & Serving (165 | 3.3%), Healthcare Support (138 | 2.8%), and Security & Protection (47 | 0.9%).
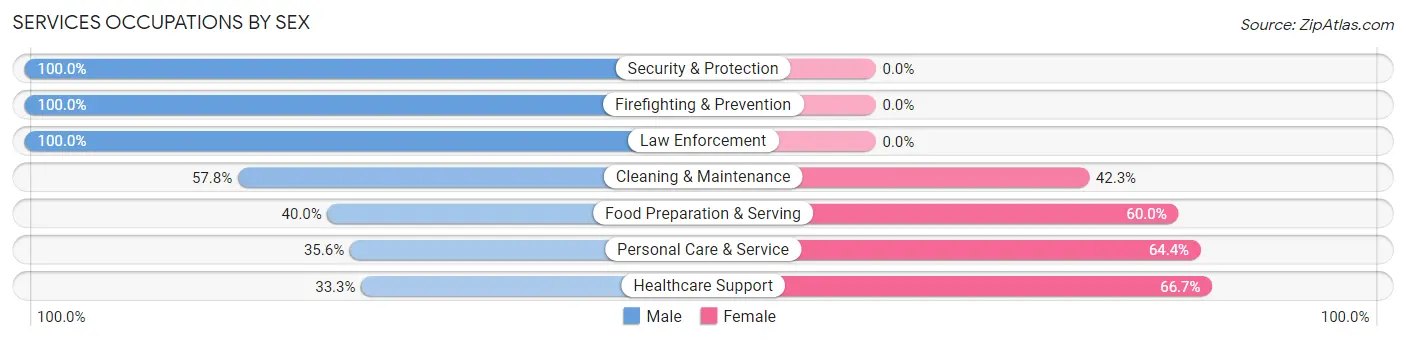
Services Occupations by Sex
Within the Services occupations in Sonoma, the most male-oriented occupations are Security & Protection (100.0%), Firefighting & Prevention (100.0%), and Law Enforcement (100.0%), while the most female-oriented occupations are Healthcare Support (66.7%), Personal Care & Service (64.4%), and Food Preparation & Serving (60.0%).
| Occupation | Male | Female |
| Healthcare Support | 46 (33.3%) | 92 (66.7%) |
| Security & Protection | 47 (100.0%) | 0 (0.0%) |
| Firefighting & Prevention | 23 (100.0%) | 0 (0.0%) |
| Law Enforcement | 24 (100.0%) | 0 (0.0%) |
| Food Preparation & Serving | 66 (40.0%) | 99 (60.0%) |
| Cleaning & Maintenance | 108 (57.8%) | 79 (42.2%) |
| Personal Care & Service | 90 (35.6%) | 163 (64.4%) |
| Total (Category) | 357 (45.2%) | 433 (54.8%) |
| Total (Overall) | 2,419 (48.5%) | 2,569 (51.5%) |
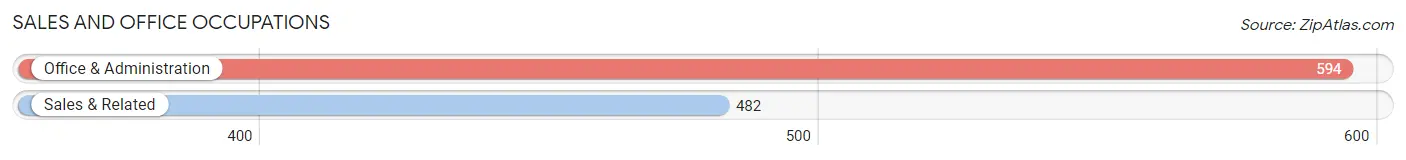
Sales and Office Occupations
The most common Sales and Office occupations in Sonoma are Office & Administration (594 | 11.9%), and Sales & Related (482 | 9.7%).
Sales and Office Occupations by Sex
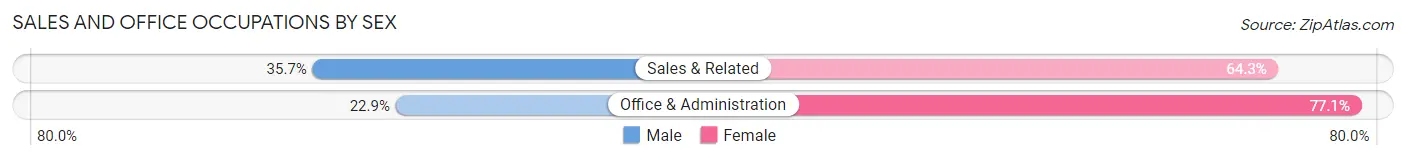
| Occupation | Male | Female |
| Sales & Related | 172 (35.7%) | 310 (64.3%) |
| Office & Administration | 136 (22.9%) | 458 (77.1%) |
| Total (Category) | 308 (28.6%) | 768 (71.4%) |
| Total (Overall) | 2,419 (48.5%) | 2,569 (51.5%) |
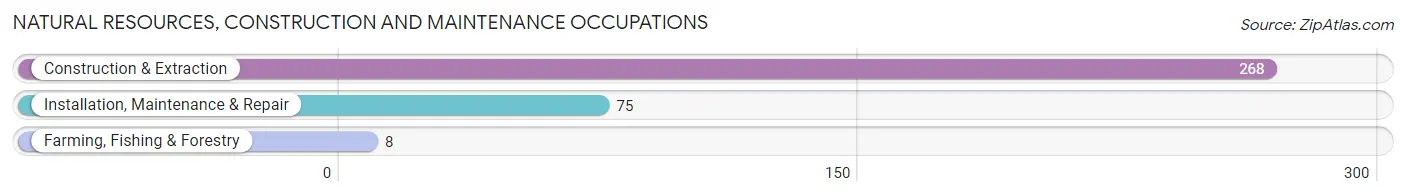
Natural Resources, Construction and Maintenance Occupations
The most common Natural Resources, Construction and Maintenance occupations in Sonoma are Construction & Extraction (268 | 5.4%), Installation, Maintenance & Repair (75 | 1.5%), and Farming, Fishing & Forestry (8 | 0.2%).
Natural Resources, Construction and Maintenance Occupations by Sex
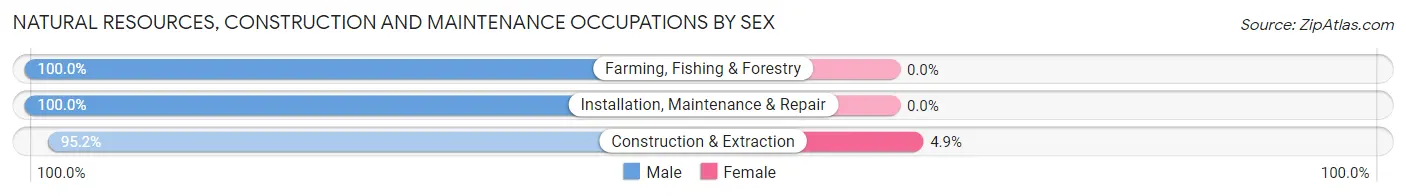
| Occupation | Male | Female |
| Farming, Fishing & Forestry | 8 (100.0%) | 0 (0.0%) |
| Construction & Extraction | 255 (95.2%) | 13 (4.9%) |
| Installation, Maintenance & Repair | 75 (100.0%) | 0 (0.0%) |
| Total (Category) | 338 (96.3%) | 13 (3.7%) |
| Total (Overall) | 2,419 (48.5%) | 2,569 (51.5%) |
Production, Transportation and Moving Occupations
The most common Production, Transportation and Moving occupations in Sonoma are Production (122 | 2.5%), Material Moving (55 | 1.1%), and Transportation (36 | 0.7%).
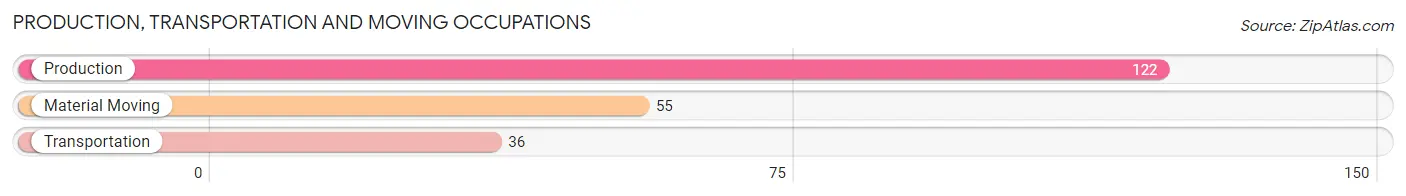
Production, Transportation and Moving Occupations by Sex
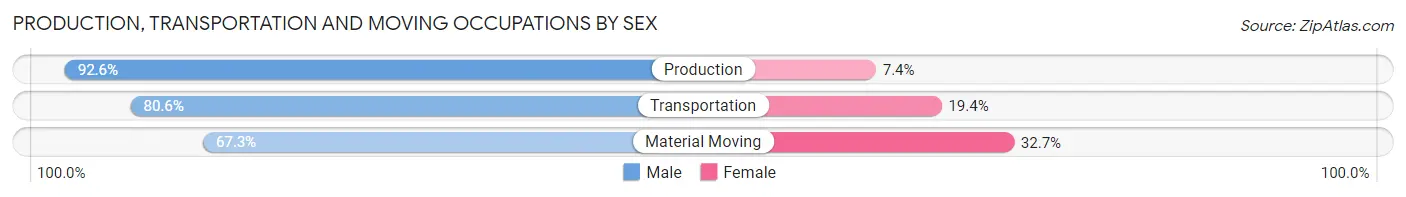
| Occupation | Male | Female |
| Production | 113 (92.6%) | 9 (7.4%) |
| Transportation | 29 (80.6%) | 7 (19.4%) |
| Material Moving | 37 (67.3%) | 18 (32.7%) |
| Total (Category) | 179 (84.0%) | 34 (16.0%) |
| Total (Overall) | 2,419 (48.5%) | 2,569 (51.5%) |
Employment Industries by Sex in Sonoma
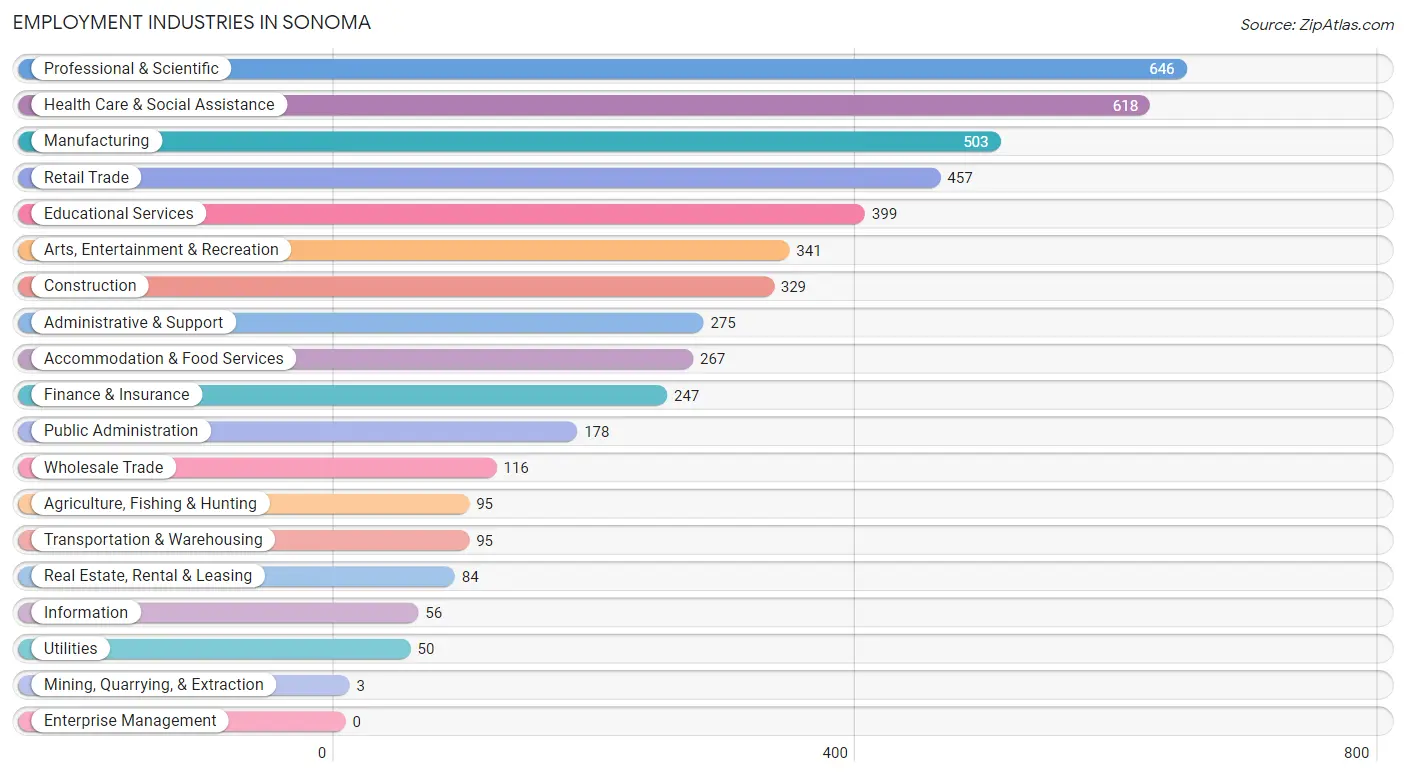
Employment Industries in Sonoma
The major employment industries in Sonoma include Professional & Scientific (646 | 13.0%), Health Care & Social Assistance (618 | 12.4%), Manufacturing (503 | 10.1%), Retail Trade (457 | 9.2%), and Educational Services (399 | 8.0%).
Employment Industries by Sex in Sonoma
The Sonoma industries that see more men than women are Mining, Quarrying, & Extraction (100.0%), Utilities (100.0%), and Construction (90.9%), whereas the industries that tend to have a higher number of women are Educational Services (80.2%), Real Estate, Rental & Leasing (79.8%), and Finance & Insurance (71.7%).
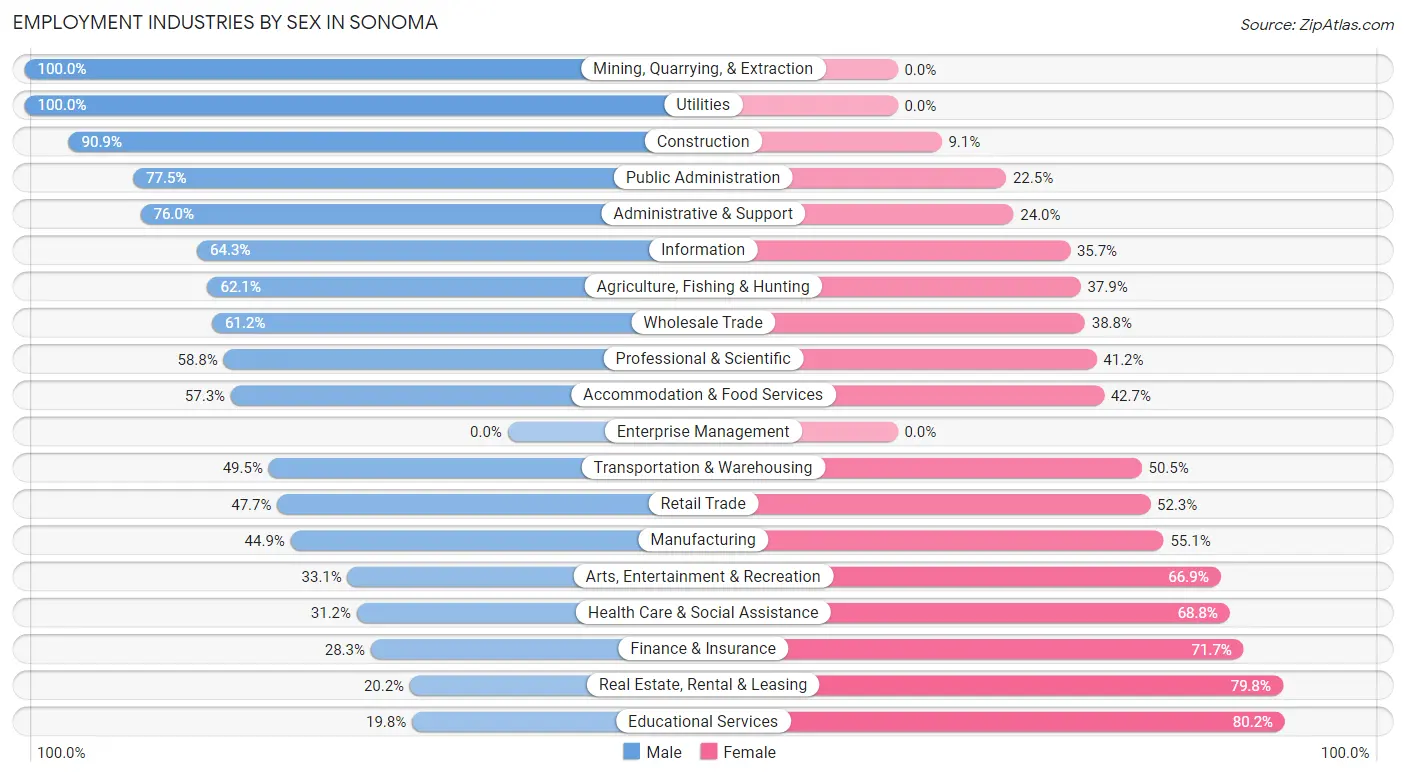
| Industry | Male | Female |
| Agriculture, Fishing & Hunting | 59 (62.1%) | 36 (37.9%) |
| Mining, Quarrying, & Extraction | 3 (100.0%) | 0 (0.0%) |
| Construction | 299 (90.9%) | 30 (9.1%) |
| Manufacturing | 226 (44.9%) | 277 (55.1%) |
| Wholesale Trade | 71 (61.2%) | 45 (38.8%) |
| Retail Trade | 218 (47.7%) | 239 (52.3%) |
| Transportation & Warehousing | 47 (49.5%) | 48 (50.5%) |
| Utilities | 50 (100.0%) | 0 (0.0%) |
| Information | 36 (64.3%) | 20 (35.7%) |
| Finance & Insurance | 70 (28.3%) | 177 (71.7%) |
| Real Estate, Rental & Leasing | 17 (20.2%) | 67 (79.8%) |
| Professional & Scientific | 380 (58.8%) | 266 (41.2%) |
| Enterprise Management | 0 (0.0%) | 0 (0.0%) |
| Administrative & Support | 209 (76.0%) | 66 (24.0%) |
| Educational Services | 79 (19.8%) | 320 (80.2%) |
| Health Care & Social Assistance | 193 (31.2%) | 425 (68.8%) |
| Arts, Entertainment & Recreation | 113 (33.1%) | 228 (66.9%) |
| Accommodation & Food Services | 153 (57.3%) | 114 (42.7%) |
| Public Administration | 138 (77.5%) | 40 (22.5%) |
| Total | 2,419 (48.5%) | 2,569 (51.5%) |
Education in Sonoma
School Enrollment in Sonoma
The most common levels of schooling among the 1,432 students in Sonoma are high school (411 | 28.7%), college / undergraduate (306 | 21.4%), and elementary school (267 | 18.6%).
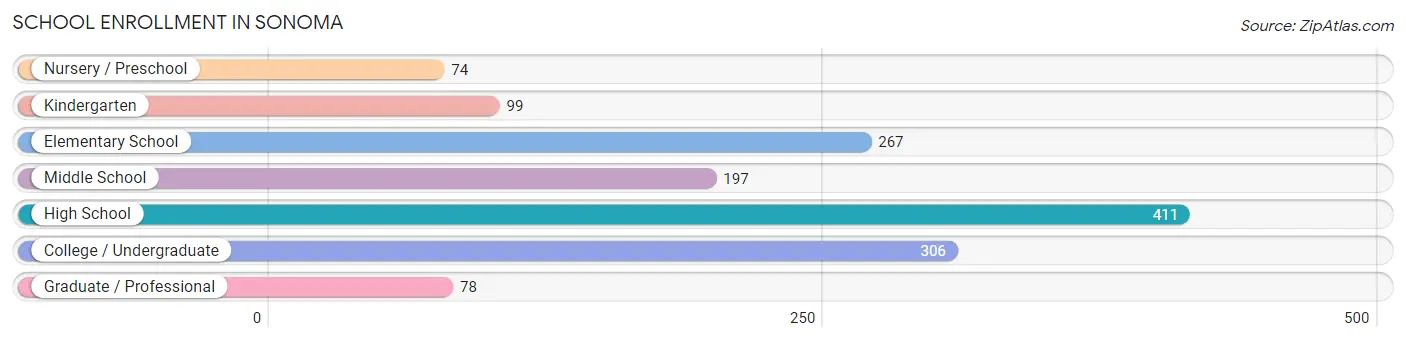
| School Level | # Students | % Students |
| Nursery / Preschool | 74 | 5.2% |
| Kindergarten | 99 | 6.9% |
| Elementary School | 267 | 18.6% |
| Middle School | 197 | 13.8% |
| High School | 411 | 28.7% |
| College / Undergraduate | 306 | 21.4% |
| Graduate / Professional | 78 | 5.4% |
| Total | 1,432 | 100.0% |
School Enrollment by Age by Funding Source in Sonoma
Out of a total of 1,432 students who are enrolled in schools in Sonoma, 271 (18.9%) attend a private institution, while the remaining 1,161 (81.1%) are enrolled in public schools. The age group of 15 to 17 year olds has the highest likelihood of being enrolled in private schools, with 109 (31.9% in the age bracket) enrolled. Conversely, the age group of 20 to 24 year olds has the lowest likelihood of being enrolled in a private school, with 102 (100.0% in the age bracket) attending a public institution.
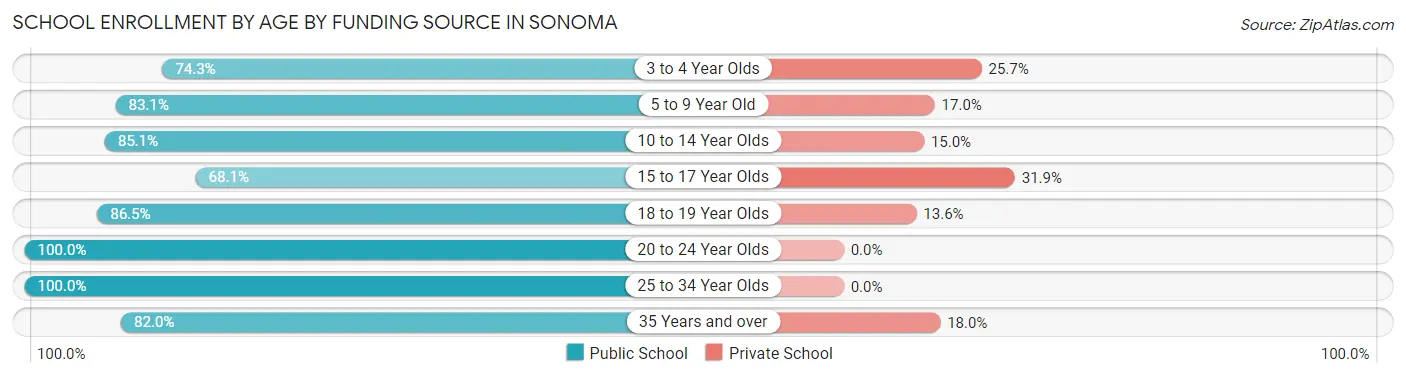
| Age Bracket | Public School | Private School |
| 3 to 4 Year Olds | 55 (74.3%) | 19 (25.7%) |
| 5 to 9 Year Old | 294 (83.1%) | 60 (17.0%) |
| 10 to 14 Year Olds | 256 (85.1%) | 45 (14.9%) |
| 15 to 17 Year Olds | 233 (68.1%) | 109 (31.9%) |
| 18 to 19 Year Olds | 134 (86.5%) | 21 (13.6%) |
| 20 to 24 Year Olds | 102 (100.0%) | 0 (0.0%) |
| 25 to 34 Year Olds | 15 (100.0%) | 0 (0.0%) |
| 35 Years and over | 73 (82.0%) | 16 (18.0%) |
| Total | 1,161 (81.1%) | 271 (18.9%) |
Educational Attainment by Field of Study in Sonoma
Social sciences (727 | 15.9%), business (630 | 13.8%), science & technology (439 | 9.6%), psychology (437 | 9.6%), and liberal arts & history (400 | 8.7%) are the most common fields of study among 4,570 individuals in Sonoma who have obtained a bachelor's degree or higher.
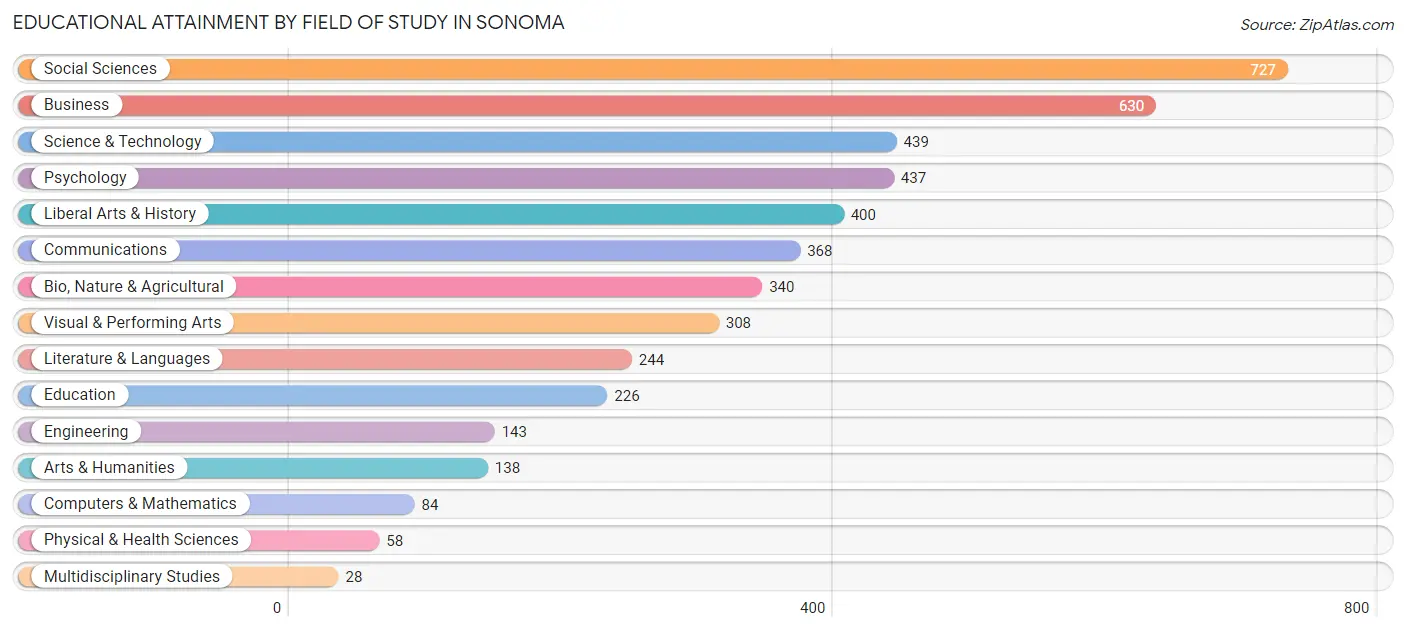
| Field of Study | # Graduates | % Graduates |
| Computers & Mathematics | 84 | 1.8% |
| Bio, Nature & Agricultural | 340 | 7.4% |
| Physical & Health Sciences | 58 | 1.3% |
| Psychology | 437 | 9.6% |
| Social Sciences | 727 | 15.9% |
| Engineering | 143 | 3.1% |
| Multidisciplinary Studies | 28 | 0.6% |
| Science & Technology | 439 | 9.6% |
| Business | 630 | 13.8% |
| Education | 226 | 5.0% |
| Literature & Languages | 244 | 5.3% |
| Liberal Arts & History | 400 | 8.7% |
| Visual & Performing Arts | 308 | 6.7% |
| Communications | 368 | 8.1% |
| Arts & Humanities | 138 | 3.0% |
| Total | 4,570 | 100.0% |
Transportation & Commute in Sonoma
Vehicle Availability by Sex in Sonoma
The most prevalent vehicle ownership categories in Sonoma are males with 2 vehicles (1,202, accounting for 50.8%) and females with 2 vehicles (1,004, making up 48.0%).
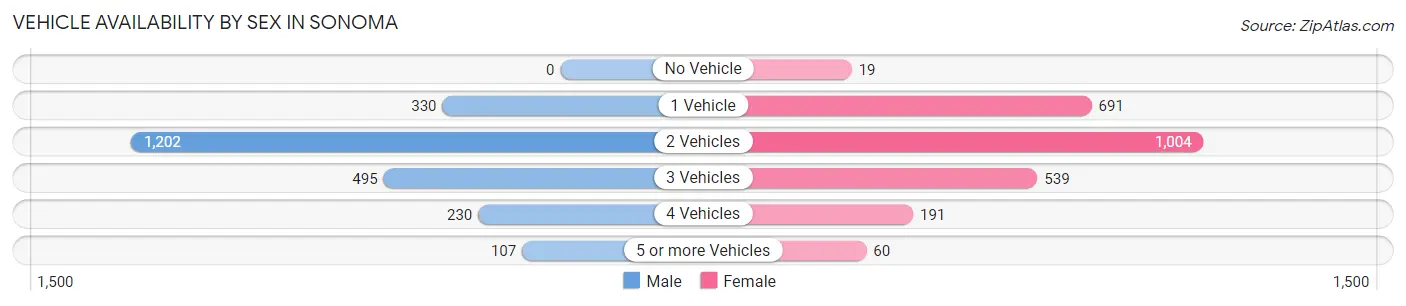
| Vehicles Available | Male | Female |
| No Vehicle | 0 (0.0%) | 19 (0.8%) |
| 1 Vehicle | 330 (14.0%) | 691 (27.6%) |
| 2 Vehicles | 1,202 (50.8%) | 1,004 (40.1%) |
| 3 Vehicles | 495 (20.9%) | 539 (21.5%) |
| 4 Vehicles | 230 (9.7%) | 191 (7.6%) |
| 5 or more Vehicles | 107 (4.5%) | 60 (2.4%) |
| Total | 2,364 (100.0%) | 2,504 (100.0%) |
Commute Time in Sonoma
The most frequently occuring commute durations in Sonoma are 5 to 9 minutes (903 commuters, 23.8%), 30 to 34 minutes (448 commuters, 11.8%), and 10 to 14 minutes (384 commuters, 10.1%).
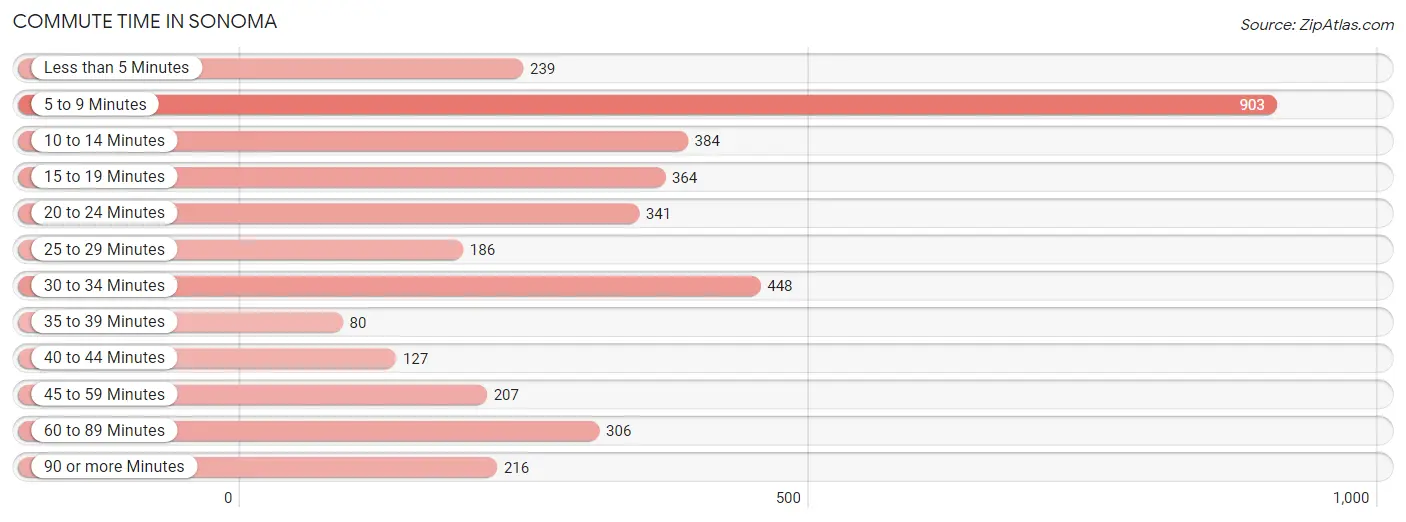
| Commute Time | # Commuters | % Commuters |
| Less than 5 Minutes | 239 | 6.3% |
| 5 to 9 Minutes | 903 | 23.8% |
| 10 to 14 Minutes | 384 | 10.1% |
| 15 to 19 Minutes | 364 | 9.6% |
| 20 to 24 Minutes | 341 | 9.0% |
| 25 to 29 Minutes | 186 | 4.9% |
| 30 to 34 Minutes | 448 | 11.8% |
| 35 to 39 Minutes | 80 | 2.1% |
| 40 to 44 Minutes | 127 | 3.3% |
| 45 to 59 Minutes | 207 | 5.4% |
| 60 to 89 Minutes | 306 | 8.1% |
| 90 or more Minutes | 216 | 5.7% |
Commute Time by Sex in Sonoma
The most common commute times in Sonoma are 5 to 9 minutes (435 commuters, 23.2%) for males and 5 to 9 minutes (468 commuters, 24.3%) for females.
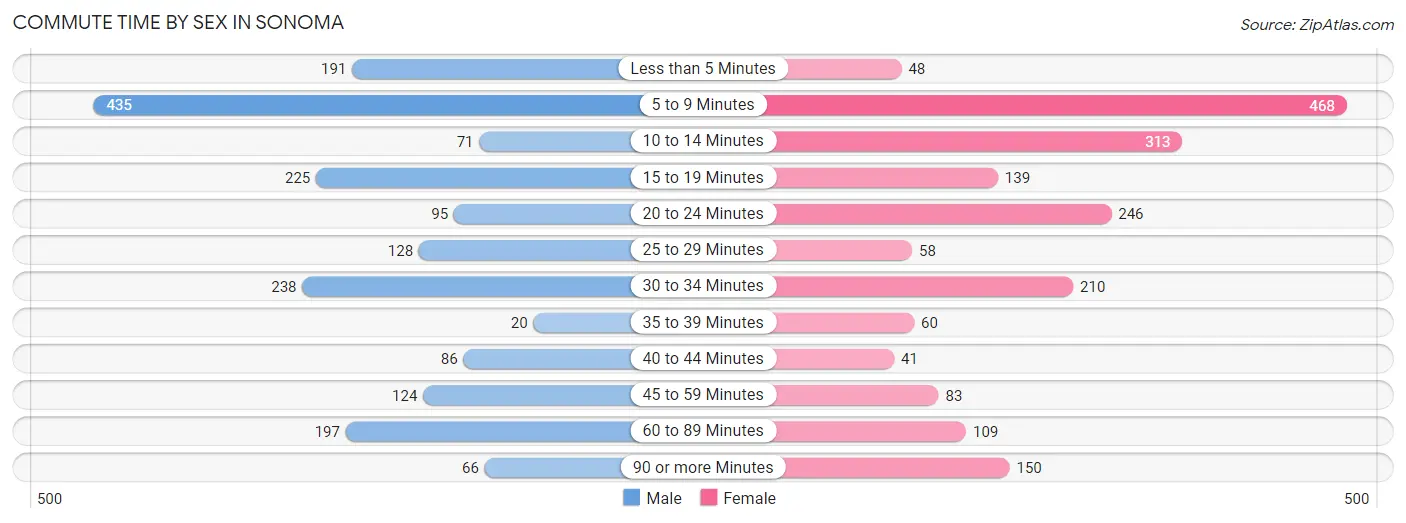
| Commute Time | Male | Female |
| Less than 5 Minutes | 191 (10.2%) | 48 (2.5%) |
| 5 to 9 Minutes | 435 (23.2%) | 468 (24.3%) |
| 10 to 14 Minutes | 71 (3.8%) | 313 (16.3%) |
| 15 to 19 Minutes | 225 (12.0%) | 139 (7.2%) |
| 20 to 24 Minutes | 95 (5.1%) | 246 (12.8%) |
| 25 to 29 Minutes | 128 (6.8%) | 58 (3.0%) |
| 30 to 34 Minutes | 238 (12.7%) | 210 (10.9%) |
| 35 to 39 Minutes | 20 (1.1%) | 60 (3.1%) |
| 40 to 44 Minutes | 86 (4.6%) | 41 (2.1%) |
| 45 to 59 Minutes | 124 (6.6%) | 83 (4.3%) |
| 60 to 89 Minutes | 197 (10.5%) | 109 (5.7%) |
| 90 or more Minutes | 66 (3.5%) | 150 (7.8%) |
Time of Departure to Work by Sex in Sonoma
The most frequent times of departure to work in Sonoma are 12:00 AM to 4:59 AM (224, 11.9%) for males and 8:00 AM to 8:29 AM (365, 19.0%) for females.
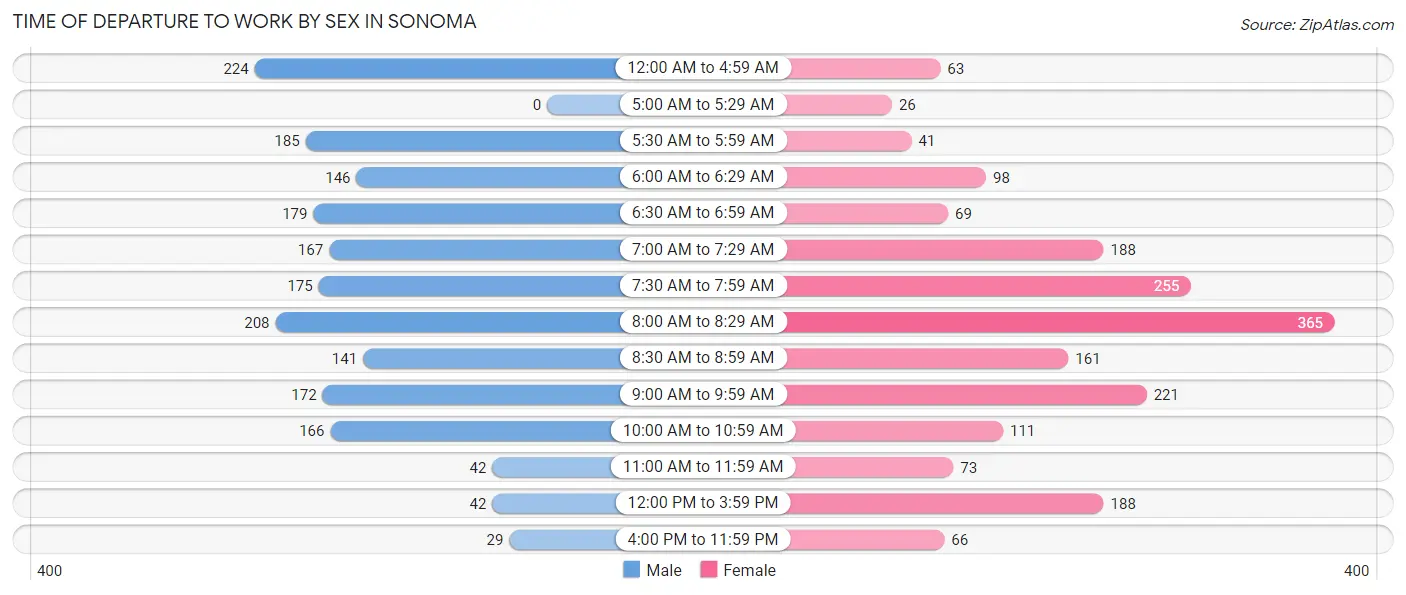
| Time of Departure | Male | Female |
| 12:00 AM to 4:59 AM | 224 (11.9%) | 63 (3.3%) |
| 5:00 AM to 5:29 AM | 0 (0.0%) | 26 (1.3%) |
| 5:30 AM to 5:59 AM | 185 (9.9%) | 41 (2.1%) |
| 6:00 AM to 6:29 AM | 146 (7.8%) | 98 (5.1%) |
| 6:30 AM to 6:59 AM | 179 (9.5%) | 69 (3.6%) |
| 7:00 AM to 7:29 AM | 167 (8.9%) | 188 (9.8%) |
| 7:30 AM to 7:59 AM | 175 (9.3%) | 255 (13.3%) |
| 8:00 AM to 8:29 AM | 208 (11.1%) | 365 (19.0%) |
| 8:30 AM to 8:59 AM | 141 (7.5%) | 161 (8.4%) |
| 9:00 AM to 9:59 AM | 172 (9.2%) | 221 (11.5%) |
| 10:00 AM to 10:59 AM | 166 (8.8%) | 111 (5.8%) |
| 11:00 AM to 11:59 AM | 42 (2.2%) | 73 (3.8%) |
| 12:00 PM to 3:59 PM | 42 (2.2%) | 188 (9.8%) |
| 4:00 PM to 11:59 PM | 29 (1.5%) | 66 (3.4%) |
| Total | 1,876 (100.0%) | 1,925 (100.0%) |
Housing Occupancy in Sonoma
Occupancy by Ownership in Sonoma
Of the total 5,338 dwellings in Sonoma, owner-occupied units account for 3,282 (61.5%), while renter-occupied units make up 2,056 (38.5%).
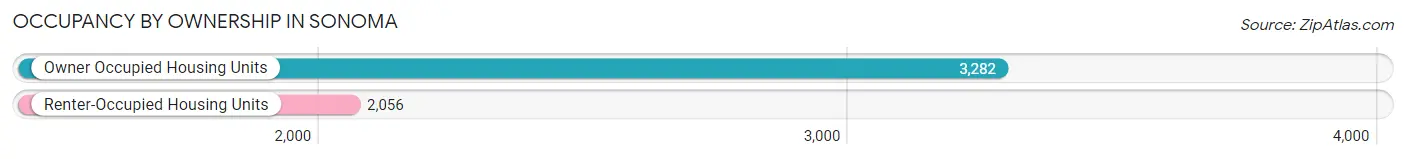
| Occupancy | # Housing Units | % Housing Units |
| Owner Occupied Housing Units | 3,282 | 61.5% |
| Renter-Occupied Housing Units | 2,056 | 38.5% |
| Total Occupied Housing Units | 5,338 | 100.0% |
Occupancy by Household Size in Sonoma
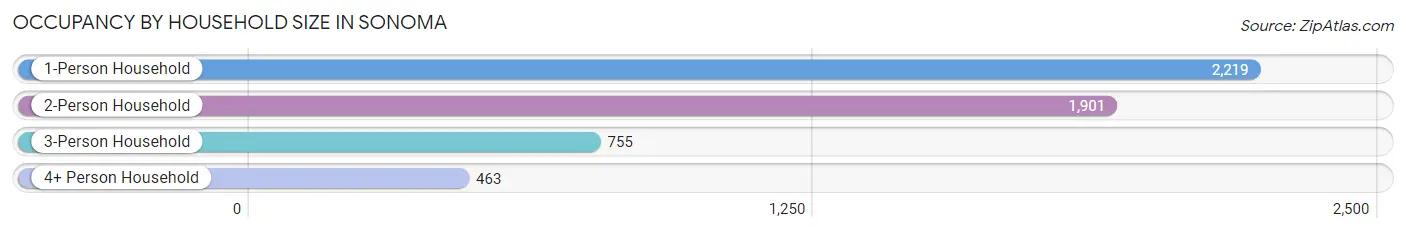
| Household Size | # Housing Units | % Housing Units |
| 1-Person Household | 2,219 | 41.6% |
| 2-Person Household | 1,901 | 35.6% |
| 3-Person Household | 755 | 14.1% |
| 4+ Person Household | 463 | 8.7% |
| Total Housing Units | 5,338 | 100.0% |
Occupancy by Ownership by Household Size in Sonoma
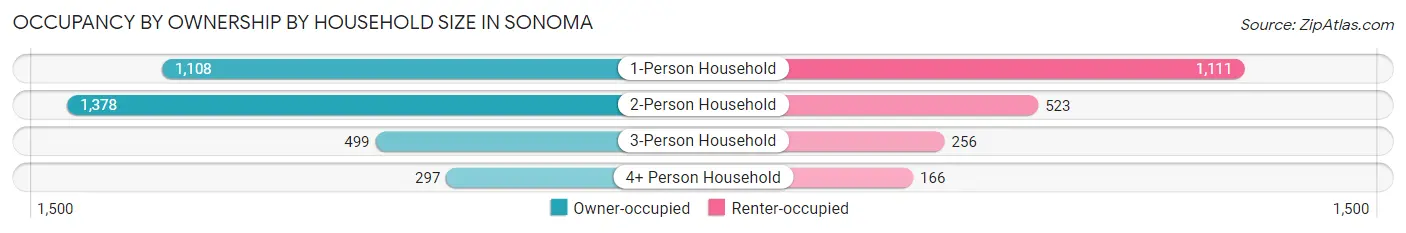
| Household Size | Owner-occupied | Renter-occupied |
| 1-Person Household | 1,108 (49.9%) | 1,111 (50.1%) |
| 2-Person Household | 1,378 (72.5%) | 523 (27.5%) |
| 3-Person Household | 499 (66.1%) | 256 (33.9%) |
| 4+ Person Household | 297 (64.1%) | 166 (35.8%) |
| Total Housing Units | 3,282 (61.5%) | 2,056 (38.5%) |
Occupancy by Educational Attainment in Sonoma
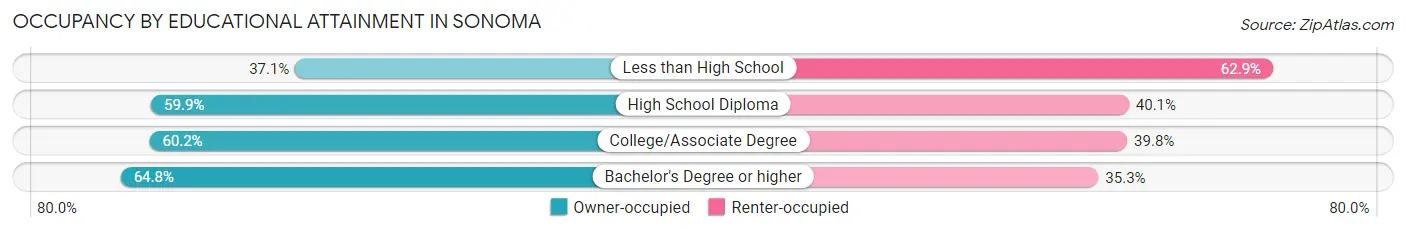
| Household Size | Owner-occupied | Renter-occupied |
| Less than High School | 89 (37.1%) | 151 (62.9%) |
| High School Diploma | 423 (59.9%) | 283 (40.1%) |
| College/Associate Degree | 975 (60.2%) | 645 (39.8%) |
| Bachelor's Degree or higher | 1,795 (64.7%) | 977 (35.2%) |
Occupancy by Age of Householder in Sonoma
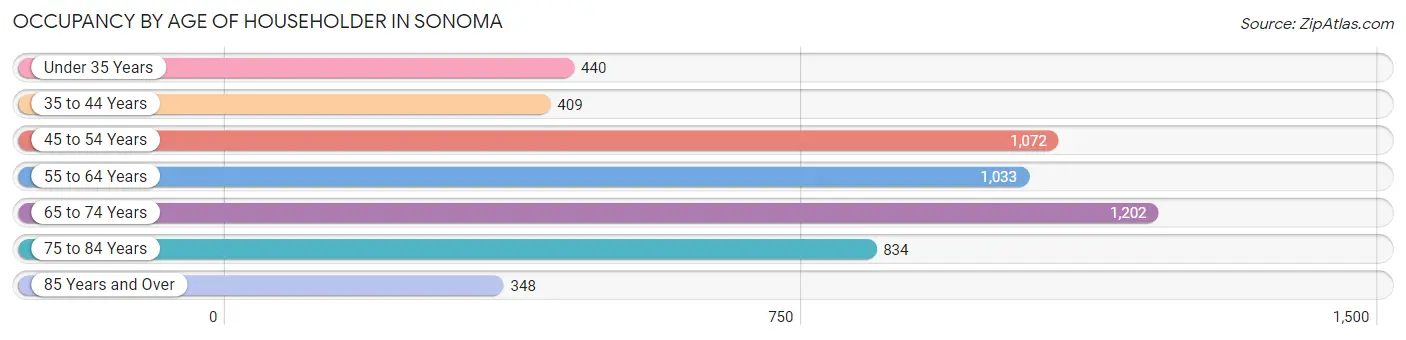
| Age Bracket | # Households | % Households |
| Under 35 Years | 440 | 8.2% |
| 35 to 44 Years | 409 | 7.7% |
| 45 to 54 Years | 1,072 | 20.1% |
| 55 to 64 Years | 1,033 | 19.4% |
| 65 to 74 Years | 1,202 | 22.5% |
| 75 to 84 Years | 834 | 15.6% |
| 85 Years and Over | 348 | 6.5% |
| Total | 5,338 | 100.0% |
Housing Finances in Sonoma
Median Income by Occupancy in Sonoma
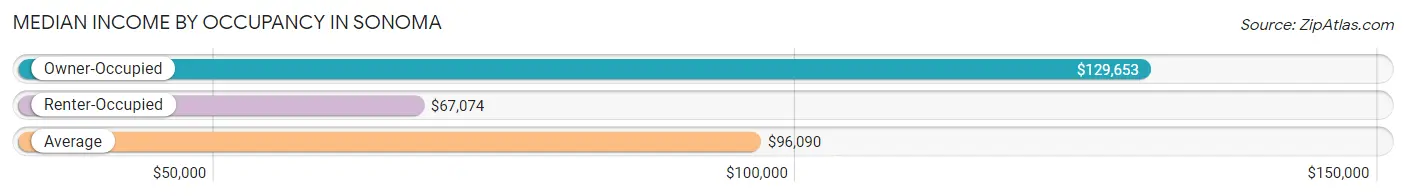
| Occupancy Type | # Households | Median Income |
| Owner-Occupied | 3,282 (61.5%) | $129,653 |
| Renter-Occupied | 2,056 (38.5%) | $67,074 |
| Average | 5,338 (100.0%) | $96,090 |
Occupancy by Householder Income Bracket in Sonoma
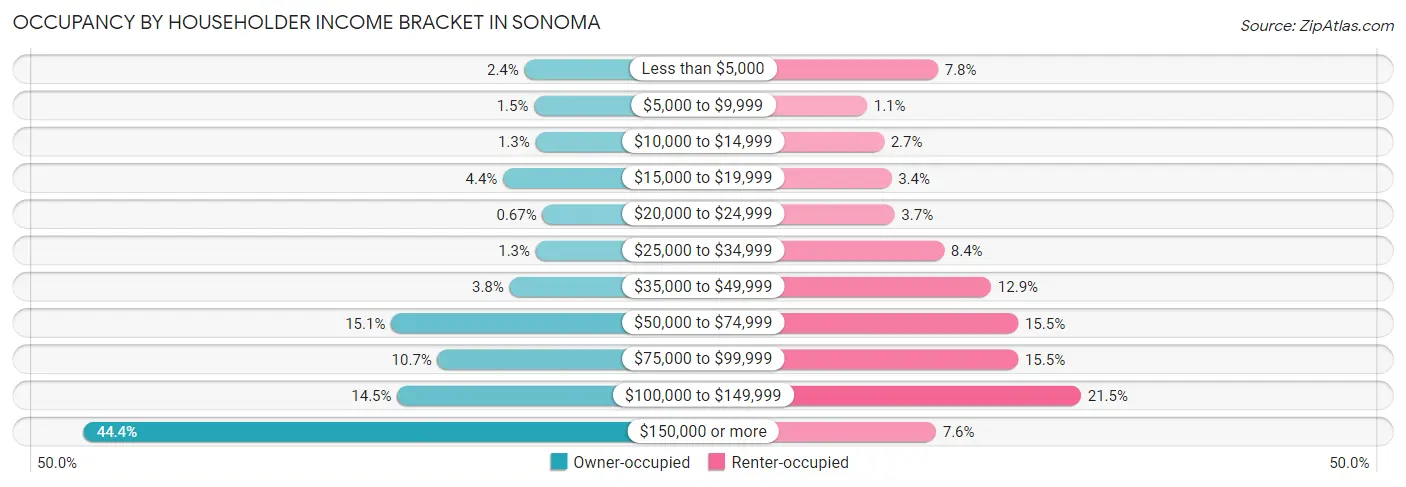
| Income Bracket | Owner-occupied | Renter-occupied |
| Less than $5,000 | 78 (2.4%) | 161 (7.8%) |
| $5,000 to $9,999 | 48 (1.5%) | 22 (1.1%) |
| $10,000 to $14,999 | 44 (1.3%) | 55 (2.7%) |
| $15,000 to $19,999 | 145 (4.4%) | 70 (3.4%) |
| $20,000 to $24,999 | 22 (0.7%) | 76 (3.7%) |
| $25,000 to $34,999 | 43 (1.3%) | 173 (8.4%) |
| $35,000 to $49,999 | 125 (3.8%) | 265 (12.9%) |
| $50,000 to $74,999 | 495 (15.1%) | 318 (15.5%) |
| $75,000 to $99,999 | 350 (10.7%) | 318 (15.5%) |
| $100,000 to $149,999 | 476 (14.5%) | 441 (21.4%) |
| $150,000 or more | 1,456 (44.4%) | 157 (7.6%) |
| Total | 3,282 (100.0%) | 2,056 (100.0%) |
Monthly Housing Cost Tiers in Sonoma
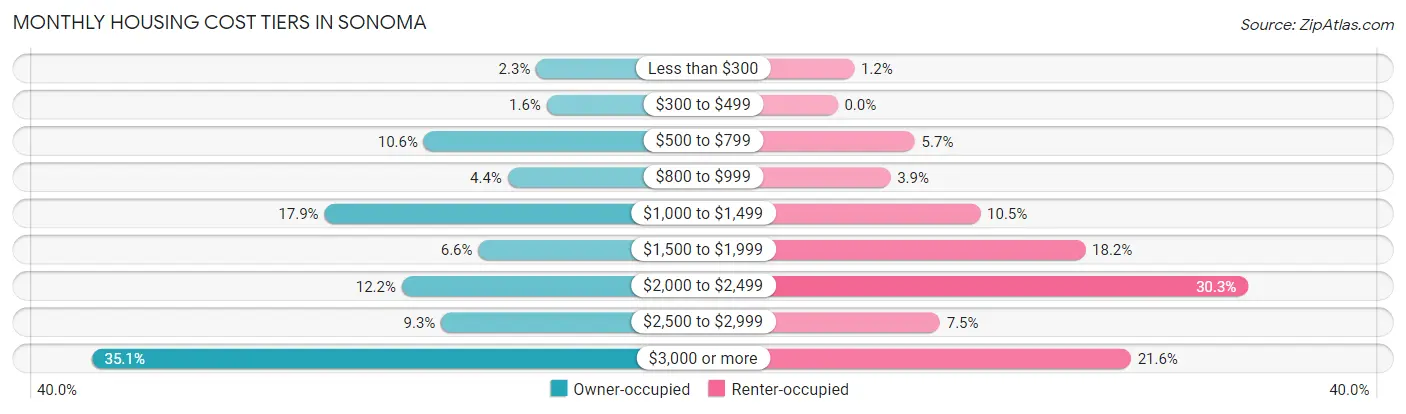
| Monthly Cost | Owner-occupied | Renter-occupied |
| Less than $300 | 76 (2.3%) | 25 (1.2%) |
| $300 to $499 | 51 (1.5%) | 0 (0.0%) |
| $500 to $799 | 348 (10.6%) | 117 (5.7%) |
| $800 to $999 | 145 (4.4%) | 80 (3.9%) |
| $1,000 to $1,499 | 588 (17.9%) | 216 (10.5%) |
| $1,500 to $1,999 | 216 (6.6%) | 375 (18.2%) |
| $2,000 to $2,499 | 401 (12.2%) | 622 (30.2%) |
| $2,500 to $2,999 | 306 (9.3%) | 155 (7.5%) |
| $3,000 or more | 1,151 (35.1%) | 444 (21.6%) |
| Total | 3,282 (100.0%) | 2,056 (100.0%) |
Physical Housing Characteristics in Sonoma
Housing Structures in Sonoma
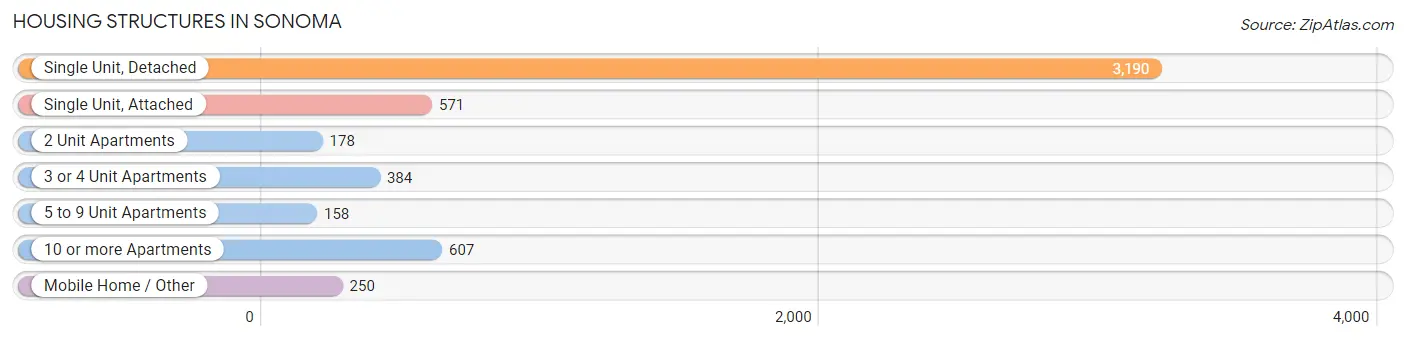
| Structure Type | # Housing Units | % Housing Units |
| Single Unit, Detached | 3,190 | 59.8% |
| Single Unit, Attached | 571 | 10.7% |
| 2 Unit Apartments | 178 | 3.3% |
| 3 or 4 Unit Apartments | 384 | 7.2% |
| 5 to 9 Unit Apartments | 158 | 3.0% |
| 10 or more Apartments | 607 | 11.4% |
| Mobile Home / Other | 250 | 4.7% |
| Total | 5,338 | 100.0% |
Housing Structures by Occupancy in Sonoma
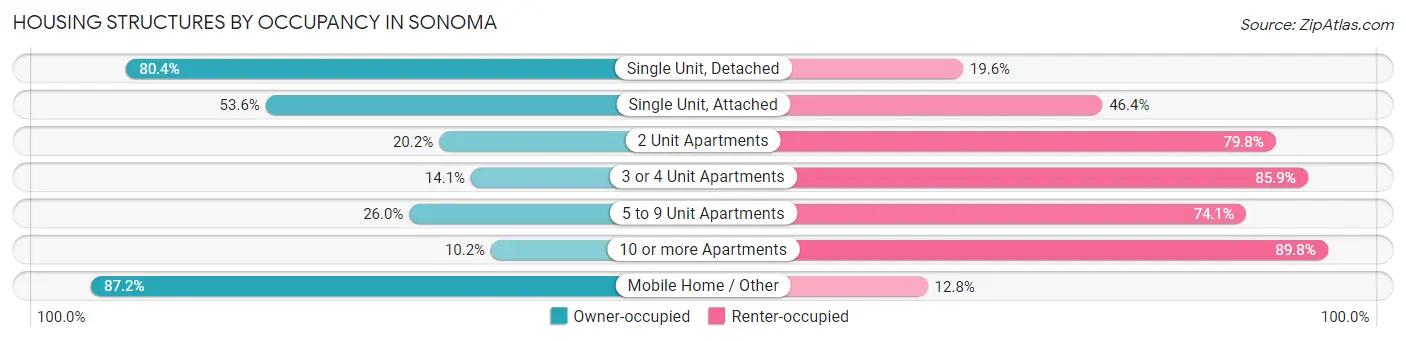
| Structure Type | Owner-occupied | Renter-occupied |
| Single Unit, Detached | 2,565 (80.4%) | 625 (19.6%) |
| Single Unit, Attached | 306 (53.6%) | 265 (46.4%) |
| 2 Unit Apartments | 36 (20.2%) | 142 (79.8%) |
| 3 or 4 Unit Apartments | 54 (14.1%) | 330 (85.9%) |
| 5 to 9 Unit Apartments | 41 (26.0%) | 117 (74.1%) |
| 10 or more Apartments | 62 (10.2%) | 545 (89.8%) |
| Mobile Home / Other | 218 (87.2%) | 32 (12.8%) |
| Total | 3,282 (61.5%) | 2,056 (38.5%) |
Housing Structures by Number of Rooms in Sonoma
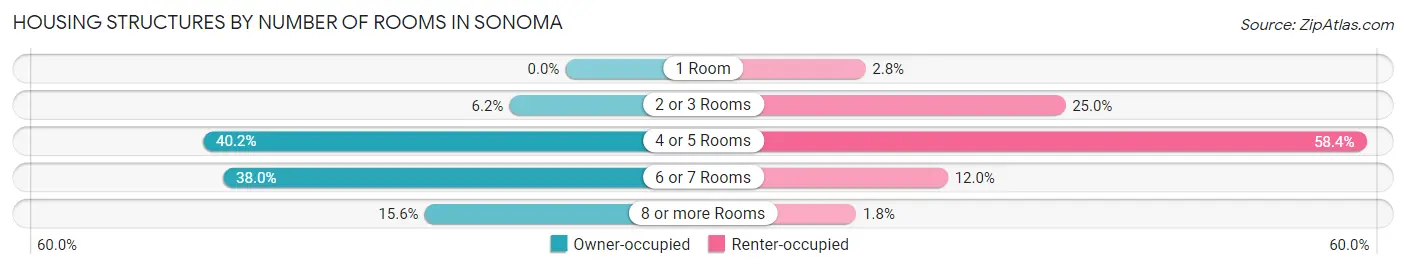
| Number of Rooms | Owner-occupied | Renter-occupied |
| 1 Room | 0 (0.0%) | 58 (2.8%) |
| 2 or 3 Rooms | 204 (6.2%) | 514 (25.0%) |
| 4 or 5 Rooms | 1,319 (40.2%) | 1,201 (58.4%) |
| 6 or 7 Rooms | 1,246 (38.0%) | 246 (12.0%) |
| 8 or more Rooms | 513 (15.6%) | 37 (1.8%) |
| Total | 3,282 (100.0%) | 2,056 (100.0%) |
Housing Structure by Heating Type in Sonoma
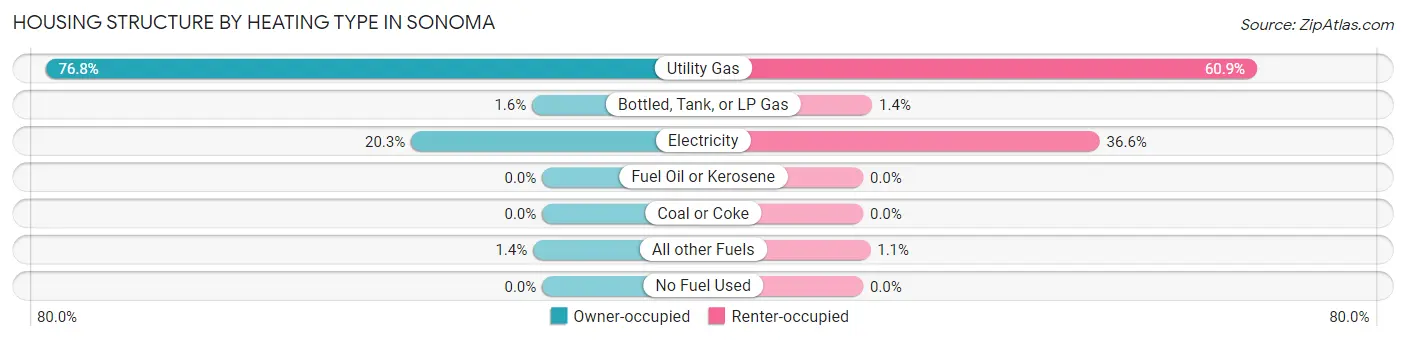
| Heating Type | Owner-occupied | Renter-occupied |
| Utility Gas | 2,520 (76.8%) | 1,252 (60.9%) |
| Bottled, Tank, or LP Gas | 51 (1.5%) | 29 (1.4%) |
| Electricity | 665 (20.3%) | 752 (36.6%) |
| Fuel Oil or Kerosene | 0 (0.0%) | 0 (0.0%) |
| Coal or Coke | 0 (0.0%) | 0 (0.0%) |
| All other Fuels | 46 (1.4%) | 23 (1.1%) |
| No Fuel Used | 0 (0.0%) | 0 (0.0%) |
| Total | 3,282 (100.0%) | 2,056 (100.0%) |
Household Vehicle Usage in Sonoma
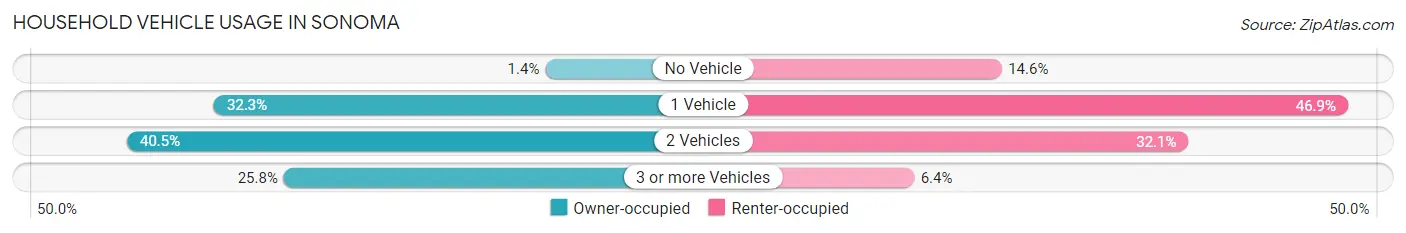
| Vehicles per Household | Owner-occupied | Renter-occupied |
| No Vehicle | 46 (1.4%) | 300 (14.6%) |
| 1 Vehicle | 1,061 (32.3%) | 965 (46.9%) |
| 2 Vehicles | 1,328 (40.5%) | 659 (32.1%) |
| 3 or more Vehicles | 847 (25.8%) | 132 (6.4%) |
| Total | 3,282 (100.0%) | 2,056 (100.0%) |
Real Estate & Mortgages in Sonoma
Real Estate and Mortgage Overview in Sonoma
| Characteristic | Without Mortgage | With Mortgage |
| Housing Units | 1,367 | 1,915 |
| Median Property Value | $953,600 | $912,600 |
| Median Household Income | $81,563 | $1,015 |
| Monthly Housing Costs | $1,202 | $1,050 |
| Real Estate Taxes | $7,607 | $8 |
Property Value by Mortgage Status in Sonoma
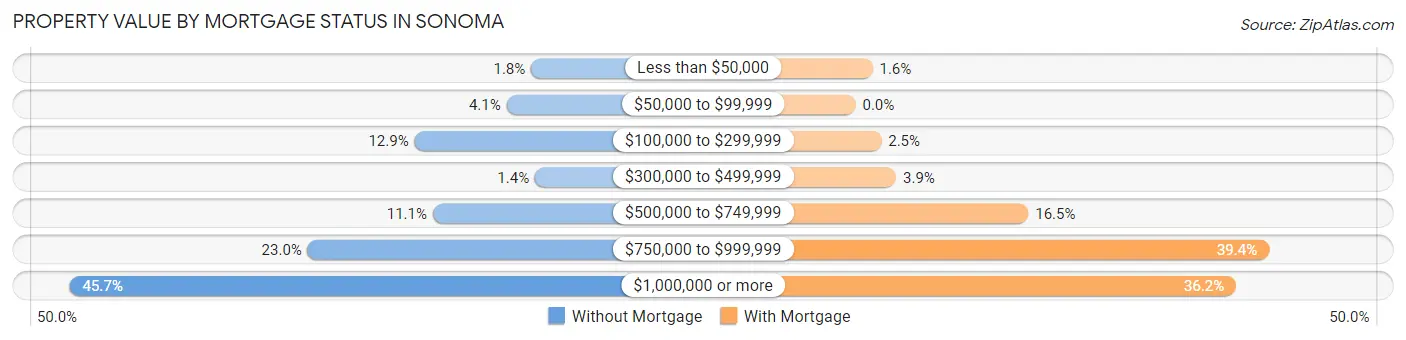
| Property Value | Without Mortgage | With Mortgage |
| Less than $50,000 | 24 (1.8%) | 31 (1.6%) |
| $50,000 to $99,999 | 56 (4.1%) | 0 (0.0%) |
| $100,000 to $299,999 | 176 (12.9%) | 47 (2.5%) |
| $300,000 to $499,999 | 19 (1.4%) | 74 (3.9%) |
| $500,000 to $749,999 | 152 (11.1%) | 315 (16.5%) |
| $750,000 to $999,999 | 315 (23.0%) | 754 (39.4%) |
| $1,000,000 or more | 625 (45.7%) | 694 (36.2%) |
| Total | 1,367 (100.0%) | 1,915 (100.0%) |
Household Income by Mortgage Status in Sonoma
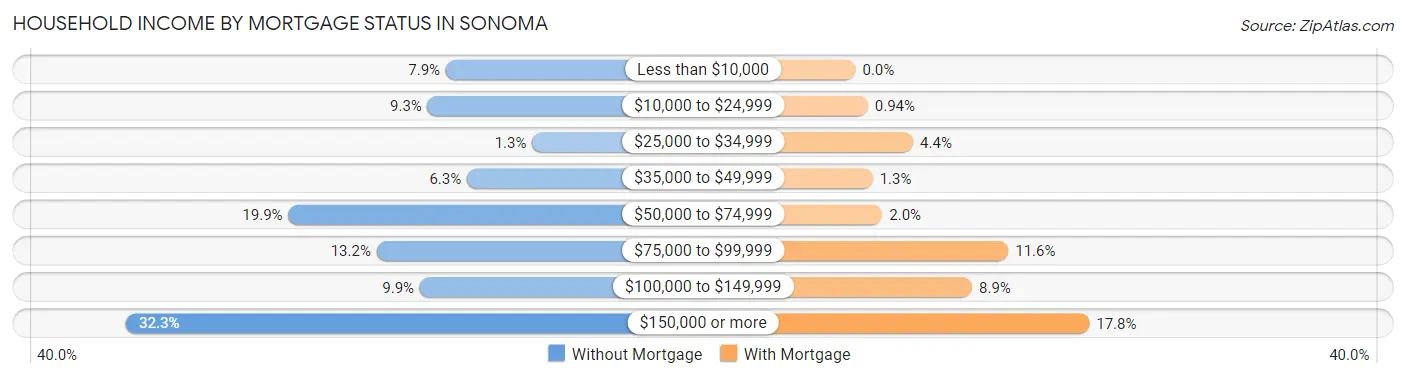
| Household Income | Without Mortgage | With Mortgage |
| Less than $10,000 | 108 (7.9%) | 0 (0.0%) |
| $10,000 to $24,999 | 127 (9.3%) | 18 (0.9%) |
| $25,000 to $34,999 | 18 (1.3%) | 84 (4.4%) |
| $35,000 to $49,999 | 86 (6.3%) | 25 (1.3%) |
| $50,000 to $74,999 | 272 (19.9%) | 39 (2.0%) |
| $75,000 to $99,999 | 180 (13.2%) | 223 (11.6%) |
| $100,000 to $149,999 | 135 (9.9%) | 170 (8.9%) |
| $150,000 or more | 441 (32.3%) | 341 (17.8%) |
| Total | 1,367 (100.0%) | 1,915 (100.0%) |
Property Value to Household Income Ratio in Sonoma
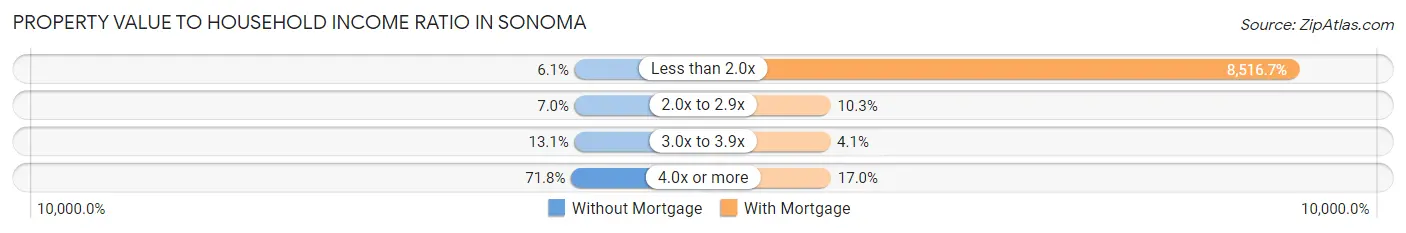
| Value-to-Income Ratio | Without Mortgage | With Mortgage |
| Less than 2.0x | 84 (6.1%) | 163,094 (8,516.7%) |
| 2.0x to 2.9x | 96 (7.0%) | 198 (10.3%) |
| 3.0x to 3.9x | 179 (13.1%) | 79 (4.1%) |
| 4.0x or more | 982 (71.8%) | 326 (17.0%) |
| Total | 1,367 (100.0%) | 1,915 (100.0%) |
Real Estate Taxes by Mortgage Status in Sonoma
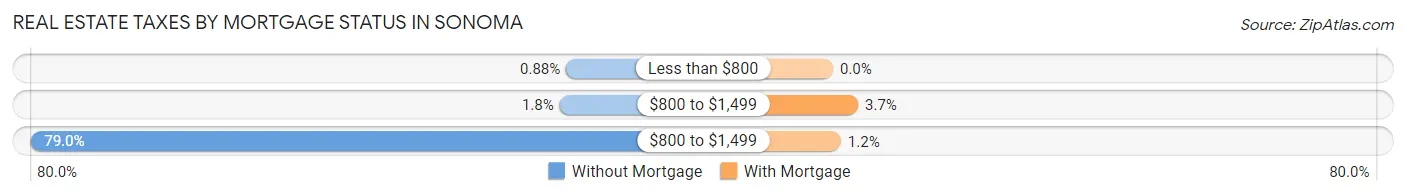
| Property Taxes | Without Mortgage | With Mortgage |
| Less than $800 | 12 (0.9%) | 0 (0.0%) |
| $800 to $1,499 | 25 (1.8%) | 70 (3.7%) |
| $800 to $1,499 | 1,080 (79.0%) | 22 (1.1%) |
| Total | 1,367 (100.0%) | 1,915 (100.0%) |
Health & Disability in Sonoma
Health Insurance Coverage by Age in Sonoma
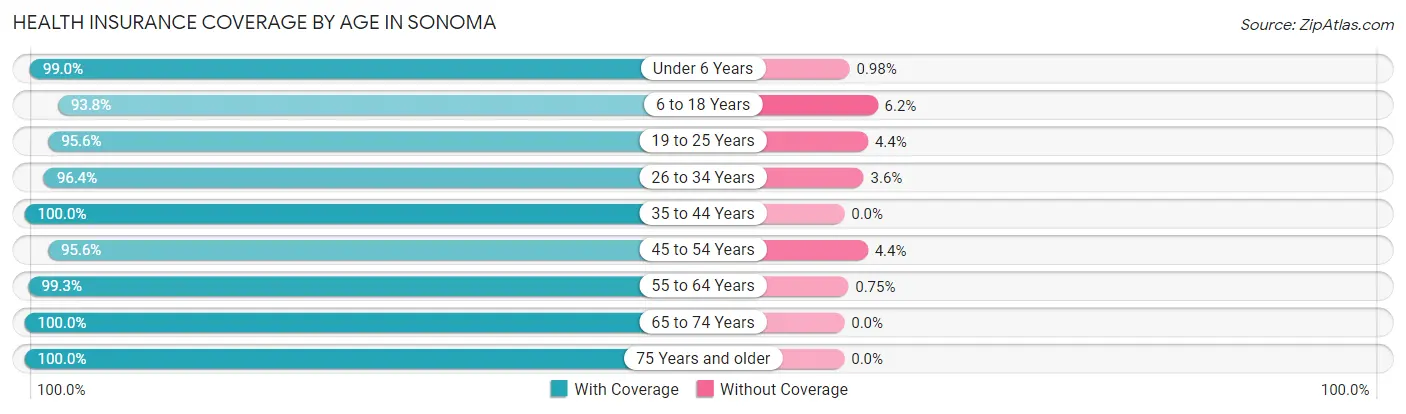
| Age Bracket | With Coverage | Without Coverage |
| Under 6 Years | 406 (99.0%) | 4 (1.0%) |
| 6 to 18 Years | 1,072 (93.8%) | 71 (6.2%) |
| 19 to 25 Years | 455 (95.6%) | 21 (4.4%) |
| 26 to 34 Years | 669 (96.4%) | 25 (3.6%) |
| 35 to 44 Years | 908 (100.0%) | 0 (0.0%) |
| 45 to 54 Years | 1,711 (95.6%) | 78 (4.4%) |
| 55 to 64 Years | 1,589 (99.3%) | 12 (0.7%) |
| 65 to 74 Years | 1,768 (100.0%) | 0 (0.0%) |
| 75 Years and older | 1,696 (100.0%) | 0 (0.0%) |
| Total | 10,274 (98.0%) | 211 (2.0%) |
Health Insurance Coverage by Citizenship Status in Sonoma
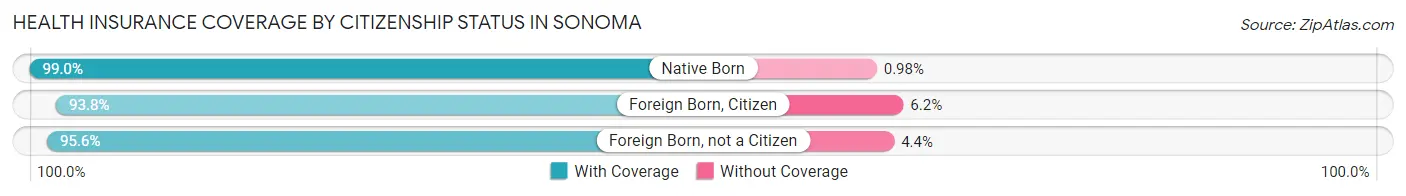
| Citizenship Status | With Coverage | Without Coverage |
| Native Born | 406 (99.0%) | 4 (1.0%) |
| Foreign Born, Citizen | 1,072 (93.8%) | 71 (6.2%) |
| Foreign Born, not a Citizen | 455 (95.6%) | 21 (4.4%) |
Health Insurance Coverage by Household Income in Sonoma
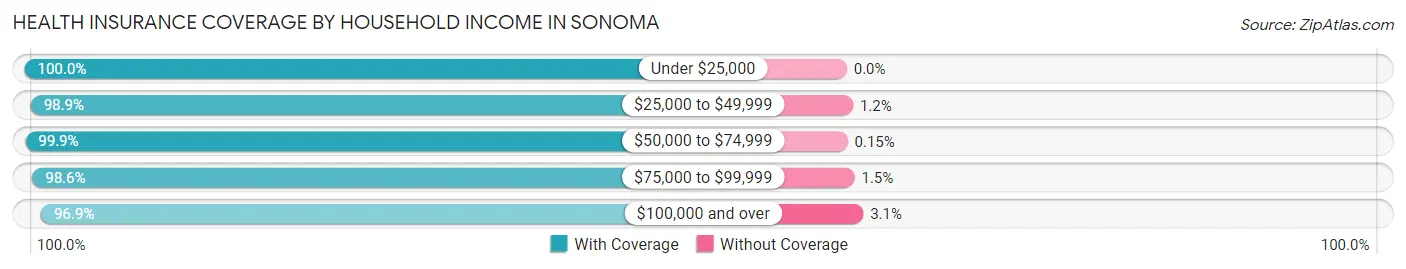
| Household Income | With Coverage | Without Coverage |
| Under $25,000 | 1,070 (100.0%) | 0 (0.0%) |
| $25,000 to $49,999 | 860 (98.9%) | 10 (1.1%) |
| $50,000 to $74,999 | 1,338 (99.9%) | 2 (0.2%) |
| $75,000 to $99,999 | 1,294 (98.6%) | 19 (1.5%) |
| $100,000 and over | 5,662 (96.9%) | 180 (3.1%) |
Public vs Private Health Insurance Coverage by Age in Sonoma
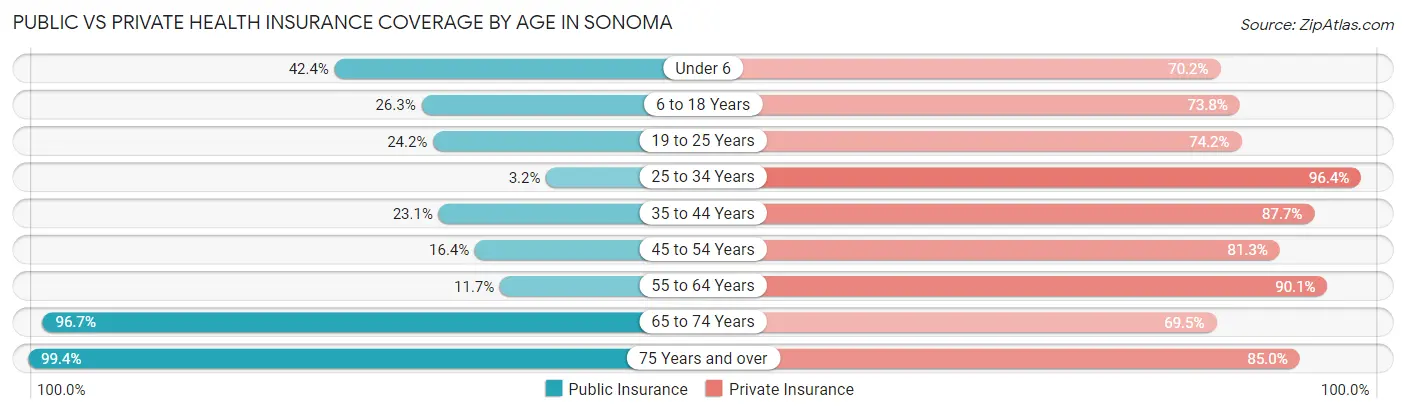
| Age Bracket | Public Insurance | Private Insurance |
| Under 6 | 174 (42.4%) | 288 (70.2%) |
| 6 to 18 Years | 301 (26.3%) | 844 (73.8%) |
| 19 to 25 Years | 115 (24.2%) | 353 (74.2%) |
| 25 to 34 Years | 22 (3.2%) | 669 (96.4%) |
| 35 to 44 Years | 210 (23.1%) | 796 (87.7%) |
| 45 to 54 Years | 293 (16.4%) | 1,454 (81.3%) |
| 55 to 64 Years | 188 (11.7%) | 1,443 (90.1%) |
| 65 to 74 Years | 1,709 (96.7%) | 1,229 (69.5%) |
| 75 Years and over | 1,685 (99.4%) | 1,441 (85.0%) |
| Total | 4,697 (44.8%) | 8,517 (81.2%) |
Disability Status by Sex by Age in Sonoma
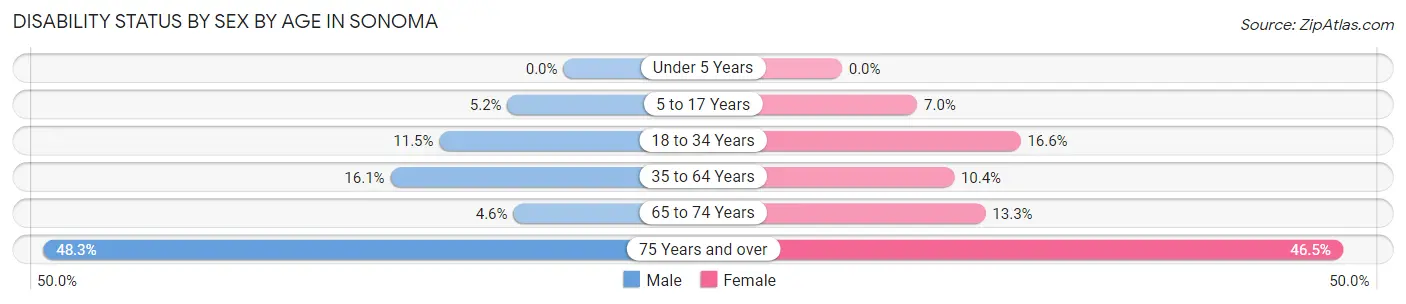
| Age Bracket | Male | Female |
| Under 5 Years | 0 (0.0%) | 0 (0.0%) |
| 5 to 17 Years | 32 (5.2%) | 39 (7.0%) |
| 18 to 34 Years | 77 (11.5%) | 94 (16.6%) |
| 35 to 64 Years | 306 (16.1%) | 249 (10.4%) |
| 65 to 74 Years | 35 (4.6%) | 135 (13.3%) |
| 75 Years and over | 264 (48.3%) | 534 (46.5%) |
Disability Class by Sex by Age in Sonoma
Disability Class: Hearing Difficulty
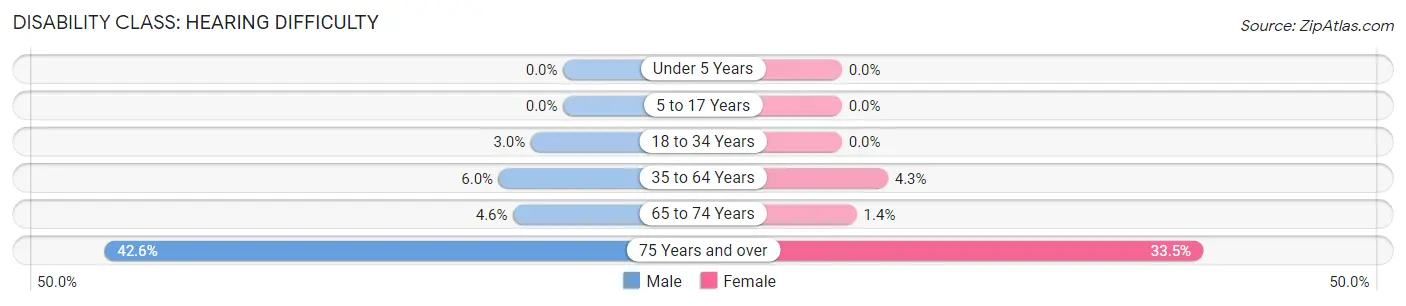
| Age Bracket | Male | Female |
| Under 5 Years | 0 (0.0%) | 0 (0.0%) |
| 5 to 17 Years | 0 (0.0%) | 0 (0.0%) |
| 18 to 34 Years | 20 (3.0%) | 0 (0.0%) |
| 35 to 64 Years | 114 (6.0%) | 102 (4.3%) |
| 65 to 74 Years | 35 (4.6%) | 14 (1.4%) |
| 75 Years and over | 233 (42.6%) | 385 (33.5%) |
Disability Class: Vision Difficulty
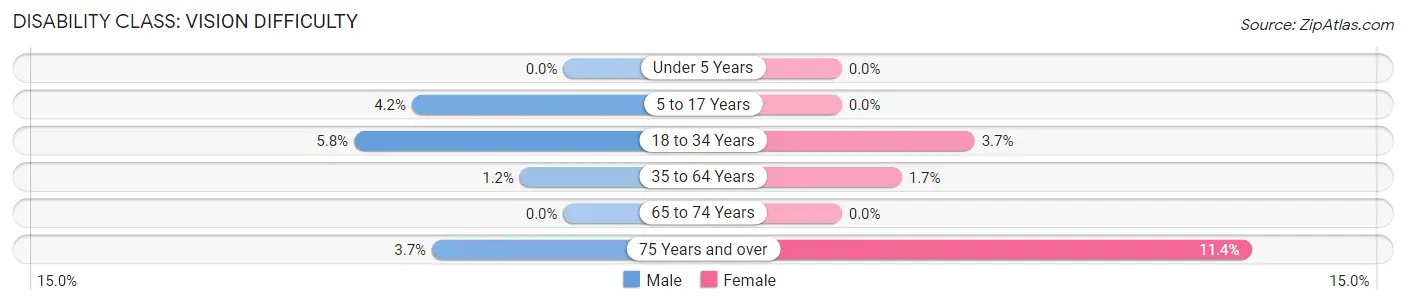
| Age Bracket | Male | Female |
| Under 5 Years | 0 (0.0%) | 0 (0.0%) |
| 5 to 17 Years | 26 (4.2%) | 0 (0.0%) |
| 18 to 34 Years | 39 (5.8%) | 21 (3.7%) |
| 35 to 64 Years | 23 (1.2%) | 40 (1.7%) |
| 65 to 74 Years | 0 (0.0%) | 0 (0.0%) |
| 75 Years and over | 20 (3.7%) | 131 (11.4%) |
Disability Class: Cognitive Difficulty
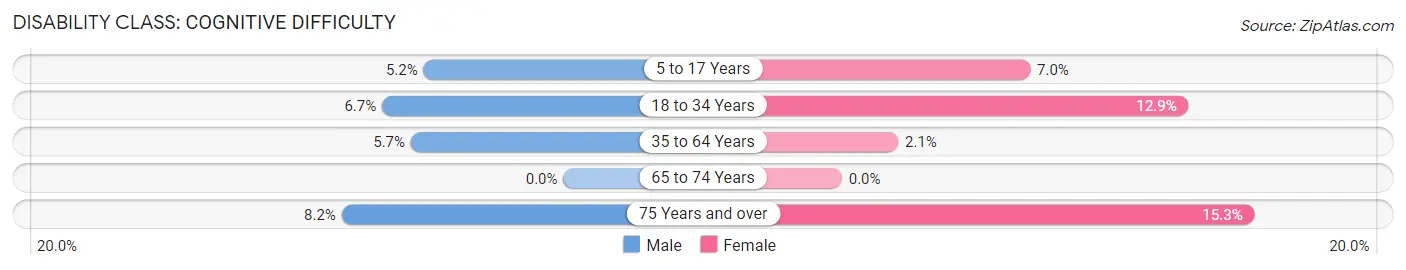
| Age Bracket | Male | Female |
| 5 to 17 Years | 32 (5.2%) | 39 (7.0%) |
| 18 to 34 Years | 45 (6.7%) | 73 (12.9%) |
| 35 to 64 Years | 108 (5.7%) | 50 (2.1%) |
| 65 to 74 Years | 0 (0.0%) | 0 (0.0%) |
| 75 Years and over | 45 (8.2%) | 176 (15.3%) |
Disability Class: Ambulatory Difficulty
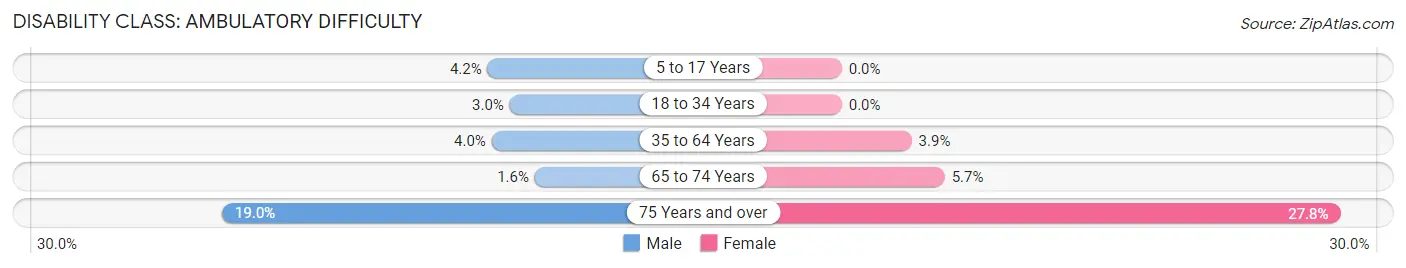
| Age Bracket | Male | Female |
| 5 to 17 Years | 26 (4.2%) | 0 (0.0%) |
| 18 to 34 Years | 20 (3.0%) | 0 (0.0%) |
| 35 to 64 Years | 76 (4.0%) | 93 (3.9%) |
| 65 to 74 Years | 12 (1.6%) | 58 (5.7%) |
| 75 Years and over | 104 (19.0%) | 319 (27.8%) |
Disability Class: Self-Care Difficulty
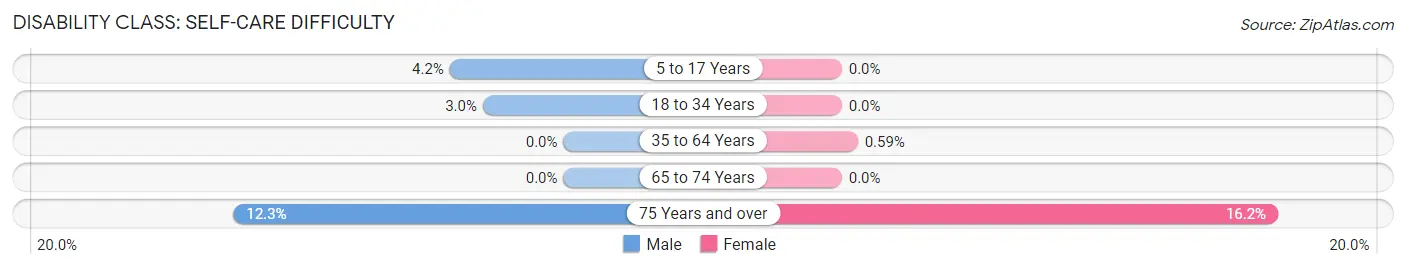
| Age Bracket | Male | Female |
| 5 to 17 Years | 26 (4.2%) | 0 (0.0%) |
| 18 to 34 Years | 20 (3.0%) | 0 (0.0%) |
| 35 to 64 Years | 0 (0.0%) | 14 (0.6%) |
| 65 to 74 Years | 0 (0.0%) | 0 (0.0%) |
| 75 Years and over | 67 (12.2%) | 186 (16.2%) |
Technology Access in Sonoma
Computing Device Access in Sonoma
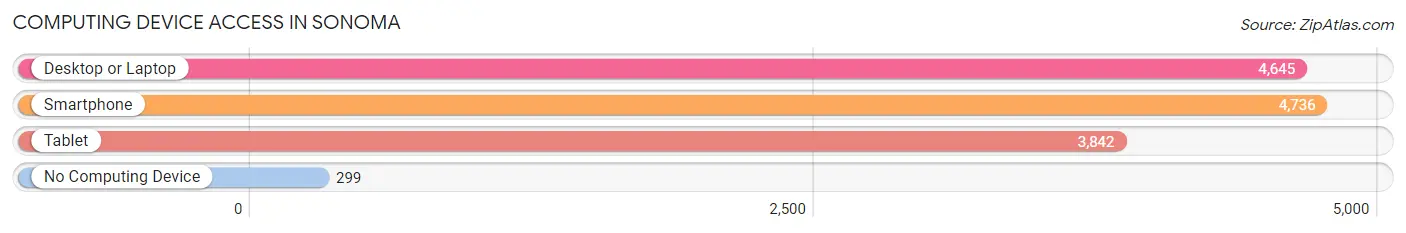
| Device Type | # Households | % Households |
| Desktop or Laptop | 4,645 | 87.0% |
| Smartphone | 4,736 | 88.7% |
| Tablet | 3,842 | 72.0% |
| No Computing Device | 299 | 5.6% |
| Total | 5,338 | 100.0% |
Internet Access in Sonoma
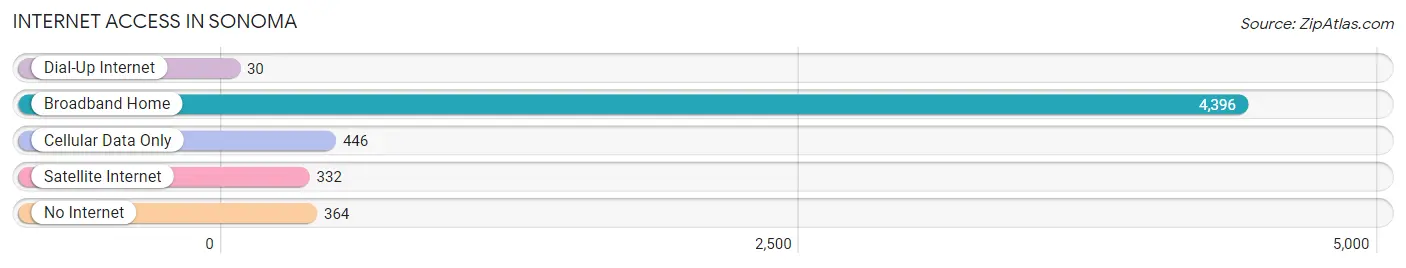
| Internet Type | # Households | % Households |
| Dial-Up Internet | 30 | 0.6% |
| Broadband Home | 4,396 | 82.4% |
| Cellular Data Only | 446 | 8.4% |
| Satellite Internet | 332 | 6.2% |
| No Internet | 364 | 6.8% |
| Total | 5,338 | 100.0% |
Sonoma Summary
Sonoma, California is a small city located in the heart of Sonoma Valley in Sonoma County, California. It is situated in the northern part of the San Francisco Bay Area, about an hour north of San Francisco. Sonoma is known for its picturesque scenery, its wine country, and its historic downtown.
History
The area that is now Sonoma was originally inhabited by the Coast Miwok Native Americans. The first Europeans to settle in the area were Spanish missionaries, who established the Mission San Francisco Solano in 1823. The mission was the 21st of the California missions and was the northernmost mission in the chain. The mission was secularized in 1834 and the land was divided into large ranchos.
In 1835, General Mariano Vallejo, a Mexican military officer, was granted the Rancho Cabeza de Santa Rosa, which included the area that is now Sonoma. Vallejo built a home in the area and established the town of Sonoma in 1835. The town was named after the Sonoma Valley and was the first town in California to be named after a valley.
In 1846, the Bear Flag Revolt began in Sonoma when a group of American settlers declared California an independent republic. The revolt was short-lived, however, and California was annexed by the United States in 1848.
In the late 19th century, Sonoma became a popular tourist destination. The town was known for its hot springs, which were believed to have healing properties. The town also became known for its wineries, which began to be established in the late 19th century.
Geography
Sonoma is located in the northern part of Sonoma Valley, which is part of the larger Napa-Sonoma Valley. The city is situated at the base of the Mayacamas Mountains, which form the eastern boundary of the valley. The city is bordered by the Sonoma Creek to the north and the Napa River to the south.
The city has a total area of 4.3 square miles, of which 4.2 square miles is land and 0.1 square miles is water. The city has a Mediterranean climate, with hot, dry summers and mild, wet winters.
Economy
Sonoma’s economy is largely based on tourism and agriculture. The city is known for its wineries, which attract visitors from around the world. The city is also home to a number of restaurants, shops, and other businesses that cater to tourists.
Agriculture is also an important part of the local economy. The city is home to a number of farms that produce a variety of fruits and vegetables, including grapes, apples, and olives.
Demographics
As of the 2010 census, Sonoma had a population of 10,648. The racial makeup of the city was 77.2% White, 0.9% African American, 0.7% Native American, 1.2% Asian, 0.1% Pacific Islander, 17.2% from other races, and 3.0% from two or more races. Hispanic or Latino of any race were 33.2% of the population.
The median household income in Sonoma was $63,837, and the median family income was $76,817. The per capita income for the city was $35,945. About 11.2% of families and 14.7% of the population were below the poverty line, including 19.2% of those under age 18 and 6.2% of those age 65 or over.
Common Questions
What is Per Capita Income in Sonoma?
Per Capita income in Sonoma is $70,445.
What is the Median Family Income in Sonoma?
Median Family Income in Sonoma is $127,743.
What is the Median Household income in Sonoma?
Median Household Income in Sonoma is $96,090.
What is Income or Wage Gap in Sonoma?
Income or Wage Gap in Sonoma is 43.0%.
Women in Sonoma earn 57.0 cents for every dollar earned by a man.
What is Family Income Deficit in Sonoma?
Family Income Deficit in Sonoma is $9,679.
Families that are below poverty line in Sonoma earn $9,679 less on average than the poverty threshold level.
What is Inequality or Gini Index in Sonoma?
Inequality or Gini Index in Sonoma is 0.50.
What is the Total Population of Sonoma?
Total Population of Sonoma is 10,702.
What is the Total Male Population of Sonoma?
Total Male Population of Sonoma is 4,778.
What is the Total Female Population of Sonoma?
Total Female Population of Sonoma is 5,924.
What is the Ratio of Males per 100 Females in Sonoma?
There are 80.65 Males per 100 Females in Sonoma.
What is the Ratio of Females per 100 Males in Sonoma?
There are 123.98 Females per 100 Males in Sonoma.
What is the Median Population Age in Sonoma?
Median Population Age in Sonoma is 54.7 Years.
What is the Average Family Size in Sonoma
Average Family Size in Sonoma is 2.7 People.
What is the Average Household Size in Sonoma
Average Household Size in Sonoma is 1.9 People.
How Large is the Labor Force in Sonoma?
There are 5,309 People in the Labor Forcein in Sonoma.
What is the Percentage of People in the Labor Force in Sonoma?
55.4% of People are in the Labor Force in Sonoma.
What is the Unemployment Rate in Sonoma?
Unemployment Rate in Sonoma is 6.1%.