Smith River, CA Map & Demographics
Smith River Map
Smith River Overview
$22,085
PER CAPITA INCOME
$98,693
AVG FAMILY INCOME
$95,350
AVG HOUSEHOLD INCOME
0.31
INEQUALITY / GINI INDEX
849
TOTAL POPULATION
427
MALE POPULATION
422
FEMALE POPULATION
101.18
MALES / 100 FEMALES
98.83
FEMALES / 100 MALES
23.8
MEDIAN AGE
4.1
AVG FAMILY SIZE
3.4
AVG HOUSEHOLD SIZE
350
LABOR FORCE [ PEOPLE ]
62.4%
PERCENT IN LABOR FORCE
6.0%
UNEMPLOYMENT RATE
Smith River Zip Codes
Smith River Area Codes
Income in Smith River
Income Overview in Smith River
Per Capita Income in Smith River is $22,085, while median incomes of families and households are $98,693 and $95,350 respectively.
| Characteristic | Number | Measure |
| Per Capita Income | 849 | $22,085 |
| Median Family Income | 187 | $98,693 |
| Mean Family Income | 187 | $91,538 |
| Median Household Income | 251 | $95,350 |
| Mean Household Income | 251 | $74,295 |
| Income Deficit | 187 | $0 |
| Wage / Income Gap (%) | 849 | 0.00% |
| Wage / Income Gap ($) | 849 | 100.00¢ per $1 |
| Gini / Inequality Index | 849 | 0.31 |
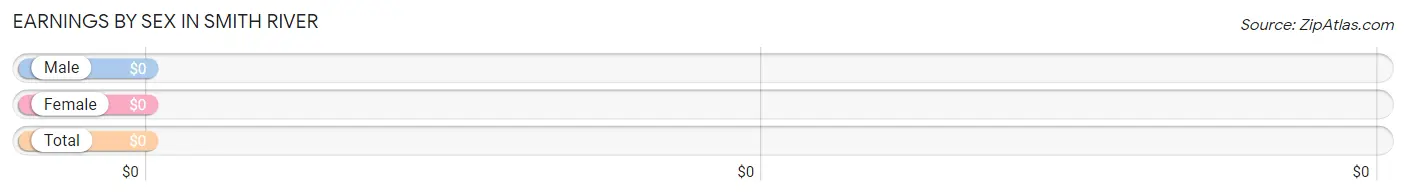
Earnings by Sex in Smith River
| Sex | Number | Average Earnings |
| Male | 189 (50.7%) | $0 |
| Female | 184 (49.3%) | $0 |
| Total | 373 (100.0%) | $0 |
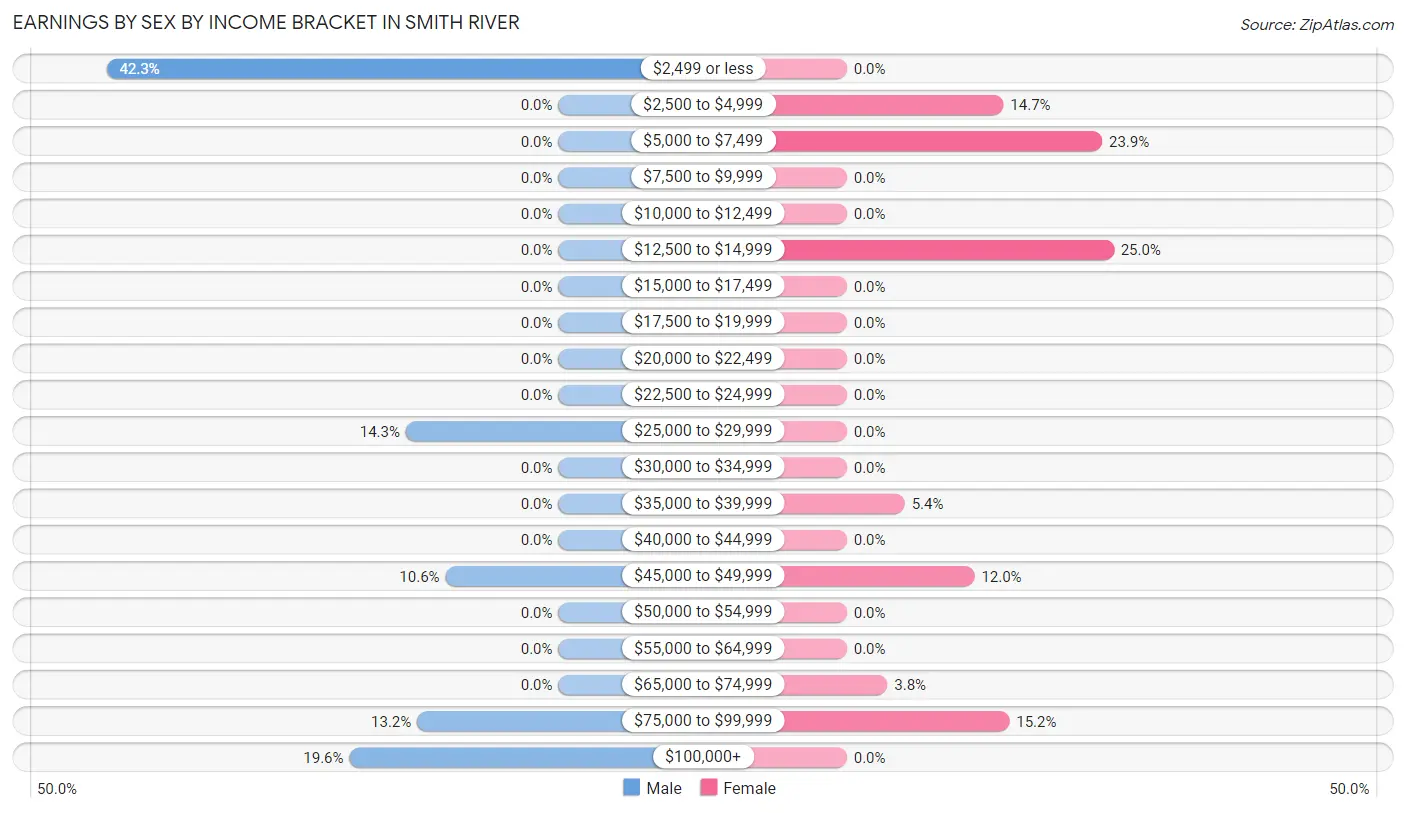
Earnings by Sex by Income Bracket in Smith River
The most common earnings brackets in Smith River are $2,499 or less for men (80 | 42.3%) and $12,500 to $14,999 for women (46 | 25.0%).
| Income | Male | Female |
| $2,499 or less | 80 (42.3%) | 0 (0.0%) |
| $2,500 to $4,999 | 0 (0.0%) | 27 (14.7%) |
| $5,000 to $7,499 | 0 (0.0%) | 44 (23.9%) |
| $7,500 to $9,999 | 0 (0.0%) | 0 (0.0%) |
| $10,000 to $12,499 | 0 (0.0%) | 0 (0.0%) |
| $12,500 to $14,999 | 0 (0.0%) | 46 (25.0%) |
| $15,000 to $17,499 | 0 (0.0%) | 0 (0.0%) |
| $17,500 to $19,999 | 0 (0.0%) | 0 (0.0%) |
| $20,000 to $22,499 | 0 (0.0%) | 0 (0.0%) |
| $22,500 to $24,999 | 0 (0.0%) | 0 (0.0%) |
| $25,000 to $29,999 | 27 (14.3%) | 0 (0.0%) |
| $30,000 to $34,999 | 0 (0.0%) | 0 (0.0%) |
| $35,000 to $39,999 | 0 (0.0%) | 10 (5.4%) |
| $40,000 to $44,999 | 0 (0.0%) | 0 (0.0%) |
| $45,000 to $49,999 | 20 (10.6%) | 22 (12.0%) |
| $50,000 to $54,999 | 0 (0.0%) | 0 (0.0%) |
| $55,000 to $64,999 | 0 (0.0%) | 0 (0.0%) |
| $65,000 to $74,999 | 0 (0.0%) | 7 (3.8%) |
| $75,000 to $99,999 | 25 (13.2%) | 28 (15.2%) |
| $100,000+ | 37 (19.6%) | 0 (0.0%) |
| Total | 189 (100.0%) | 184 (100.0%) |
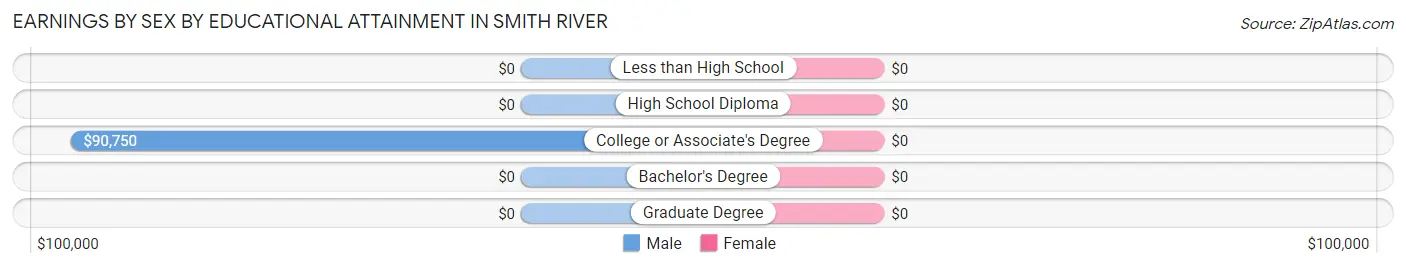
Earnings by Sex by Educational Attainment in Smith River
| Educational Attainment | Male Income | Female Income |
| Less than High School | - | - |
| High School Diploma | - | - |
| College or Associate's Degree | $90,750 | $0 |
| Bachelor's Degree | - | - |
| Graduate Degree | - | - |
| Total | $90,750 | $0 |
Family Income in Smith River
Family Income Brackets in Smith River
According to the Smith River family income data, there are 82 families falling into the $100,000 to $149,999 income range, which is the most common income bracket and makes up 43.9% of all families.
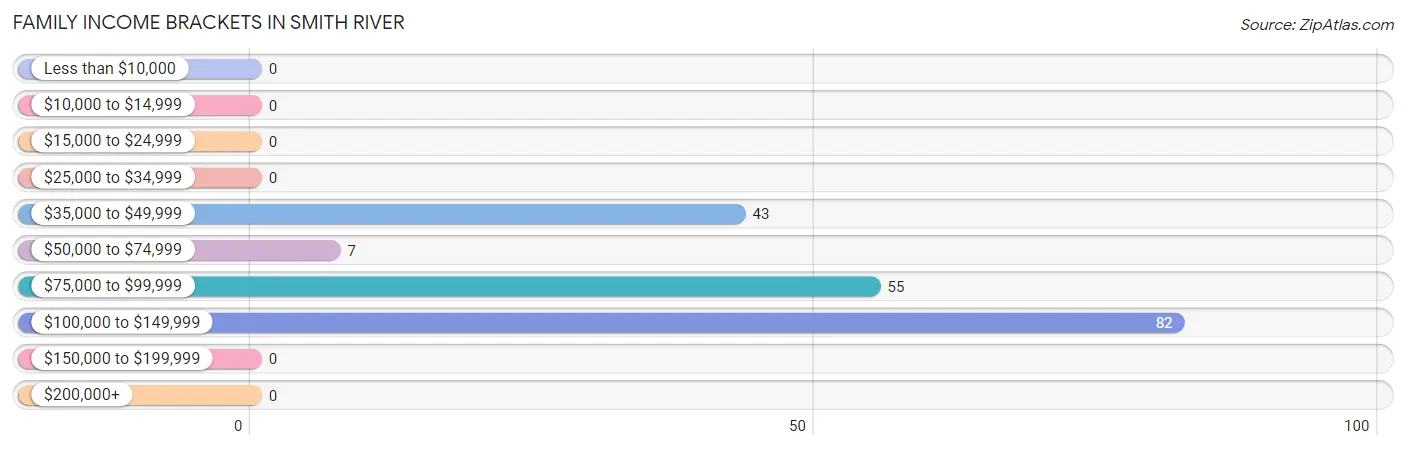
| Income Bracket | # Families | % Families |
| Less than $10,000 | 0 | 0.0% |
| $10,000 to $14,999 | 0 | 0.0% |
| $15,000 to $24,999 | 0 | 0.0% |
| $25,000 to $34,999 | 0 | 0.0% |
| $35,000 to $49,999 | 43 | 23.0% |
| $50,000 to $74,999 | 7 | 3.7% |
| $75,000 to $99,999 | 55 | 29.4% |
| $100,000 to $149,999 | 82 | 43.9% |
| $150,000 to $199,999 | 0 | 0.0% |
| $200,000+ | 0 | 0.0% |
Family Income by Famaliy Size in Smith River
5-person families (75 | 40.1%) account for the highest median family income in Smith River with $98,920 per family, while 2-person families (52 | 27.8%) have the highest median income of $29,822 per family member.
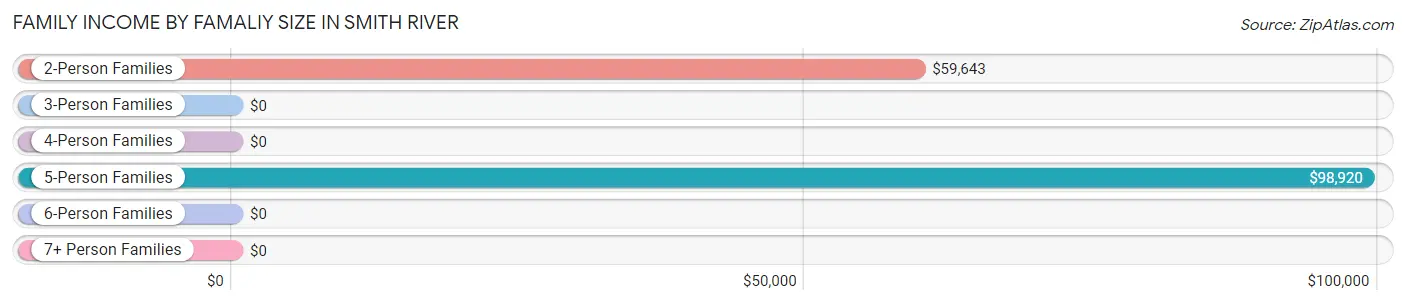
| Income Bracket | # Families | Median Income |
| 2-Person Families | 52 (27.8%) | $59,643 |
| 3-Person Families | 0 (0.0%) | $0 |
| 4-Person Families | 60 (32.1%) | $0 |
| 5-Person Families | 75 (40.1%) | $98,920 |
| 6-Person Families | 0 (0.0%) | $0 |
| 7+ Person Families | 0 (0.0%) | $0 |
| Total | 187 (100.0%) | $98,693 |
Family Income by Number of Earners in Smith River
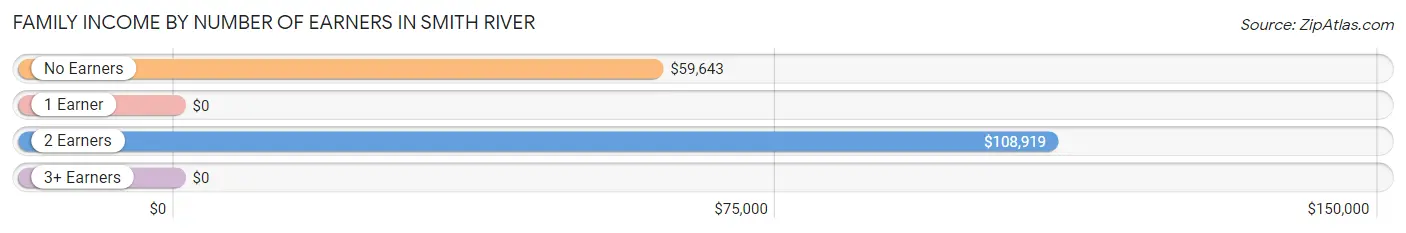
| Number of Earners | # Families | Median Income |
| No Earners | 38 (20.3%) | $59,643 |
| 1 Earner | 14 (7.5%) | $0 |
| 2 Earners | 88 (47.1%) | $108,919 |
| 3+ Earners | 47 (25.1%) | $0 |
| Total | 187 (100.0%) | $98,693 |
Household Income in Smith River
Household Income Brackets in Smith River
With 82 households falling in the category, the $100,000 to $149,999 income range is the most frequent in Smith River, accounting for 32.7% of all households.
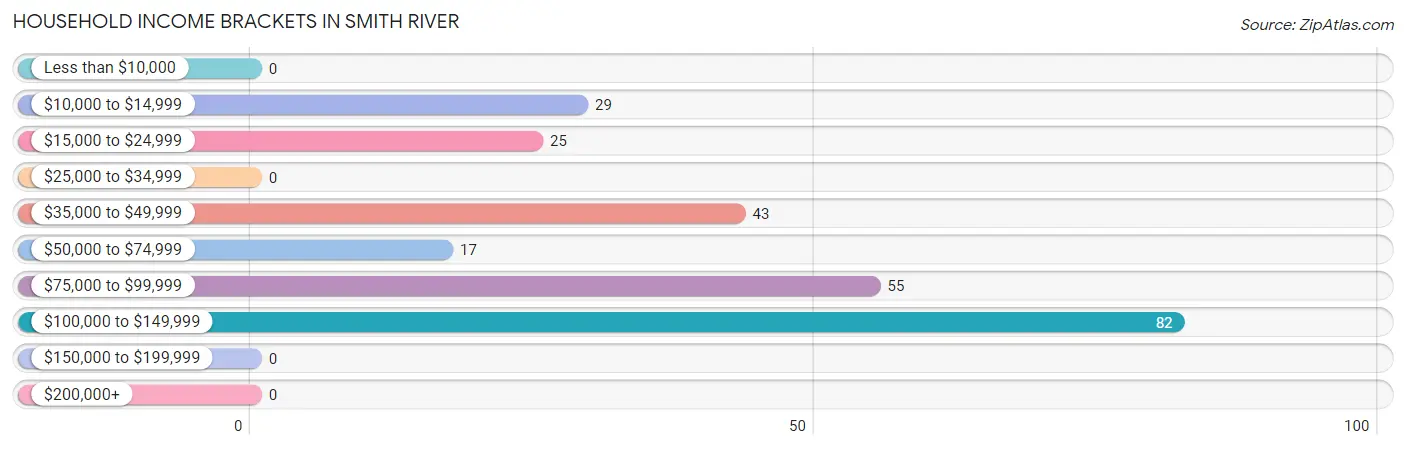
| Income Bracket | # Households | % Households |
| Less than $10,000 | 0 | 0.0% |
| $10,000 to $14,999 | 29 | 11.6% |
| $15,000 to $24,999 | 25 | 10.0% |
| $25,000 to $34,999 | 0 | 0.0% |
| $35,000 to $49,999 | 43 | 17.1% |
| $50,000 to $74,999 | 17 | 6.8% |
| $75,000 to $99,999 | 55 | 21.9% |
| $100,000 to $149,999 | 82 | 32.7% |
| $150,000 to $199,999 | 0 | 0.0% |
| $200,000+ | 0 | 0.0% |
Household Income by Householder Age in Smith River
The median household income in Smith River is $95,350, with the highest median household income of $108,108 found in the 25 to 44 years age bracket for the primary householder. A total of 112 households (44.6%) fall into this category.
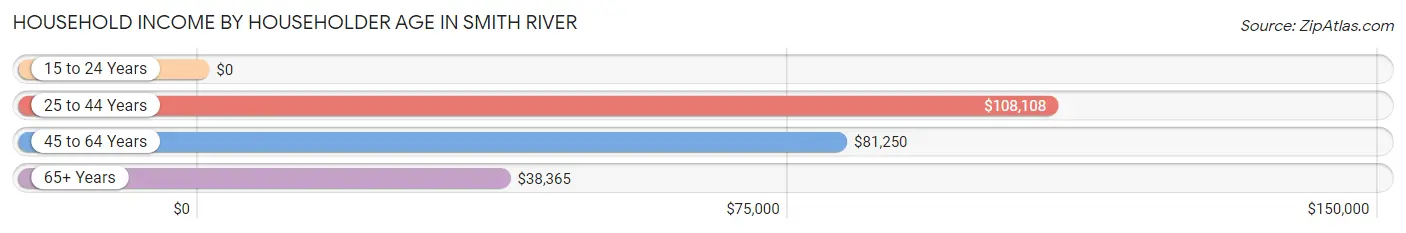
| Income Bracket | # Households | Median Income |
| 15 to 24 Years | 0 (0.0%) | $0 |
| 25 to 44 Years | 112 (44.6%) | $108,108 |
| 45 to 64 Years | 22 (8.8%) | $81,250 |
| 65+ Years | 117 (46.6%) | $38,365 |
| Total | 251 (100.0%) | $95,350 |
Poverty in Smith River
Income Below Poverty by Sex and Age in Smith River
With 5.6% poverty level for males and 12.8% for females among the residents of Smith River, 55 to 64 year old males and 65 to 74 year old females are the most vulnerable to poverty, with 24 males (64.9%) and 25 females (73.5%) in their respective age groups living below the poverty level.
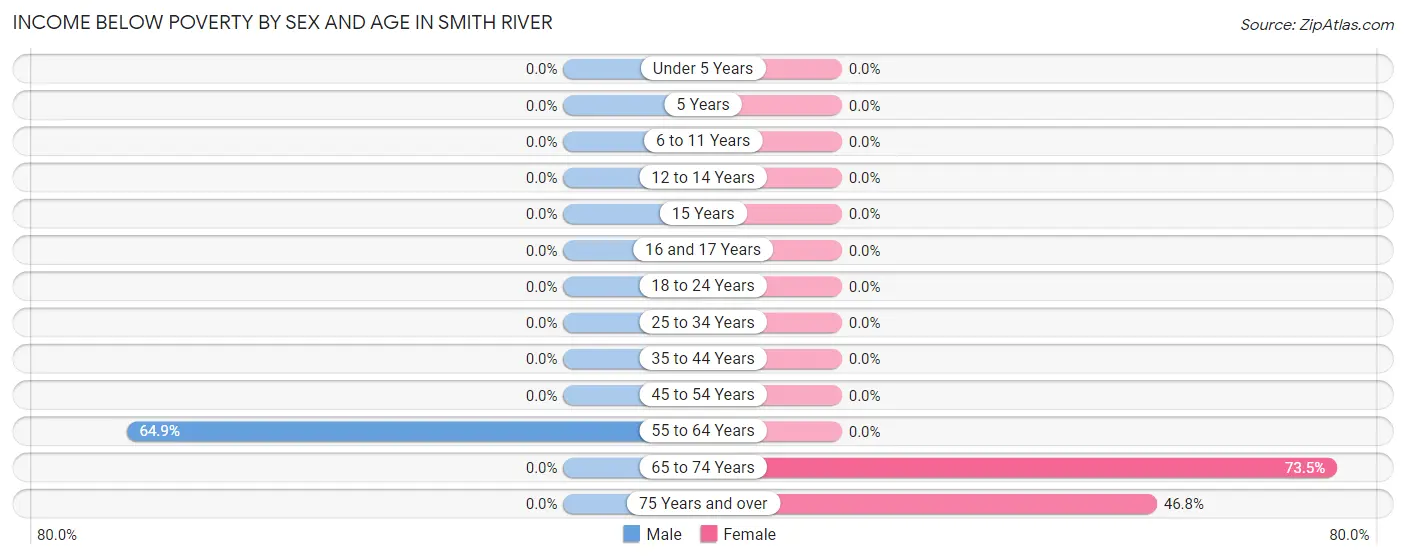
| Age Bracket | Male | Female |
| Under 5 Years | 0 (0.0%) | 0 (0.0%) |
| 5 Years | 0 (0.0%) | 0 (0.0%) |
| 6 to 11 Years | 0 (0.0%) | 0 (0.0%) |
| 12 to 14 Years | 0 (0.0%) | 0 (0.0%) |
| 15 Years | 0 (0.0%) | 0 (0.0%) |
| 16 and 17 Years | 0 (0.0%) | 0 (0.0%) |
| 18 to 24 Years | 0 (0.0%) | 0 (0.0%) |
| 25 to 34 Years | 0 (0.0%) | 0 (0.0%) |
| 35 to 44 Years | 0 (0.0%) | 0 (0.0%) |
| 45 to 54 Years | 0 (0.0%) | 0 (0.0%) |
| 55 to 64 Years | 24 (64.9%) | 0 (0.0%) |
| 65 to 74 Years | 0 (0.0%) | 25 (73.5%) |
| 75 Years and over | 0 (0.0%) | 29 (46.8%) |
| Total | 24 (5.6%) | 54 (12.8%) |
Income Above Poverty by Sex and Age in Smith River
According to the poverty statistics in Smith River, males aged under 5 years and females aged under 5 years are the age groups that are most secure financially, with 100.0% of males and 100.0% of females in these age groups living above the poverty line.
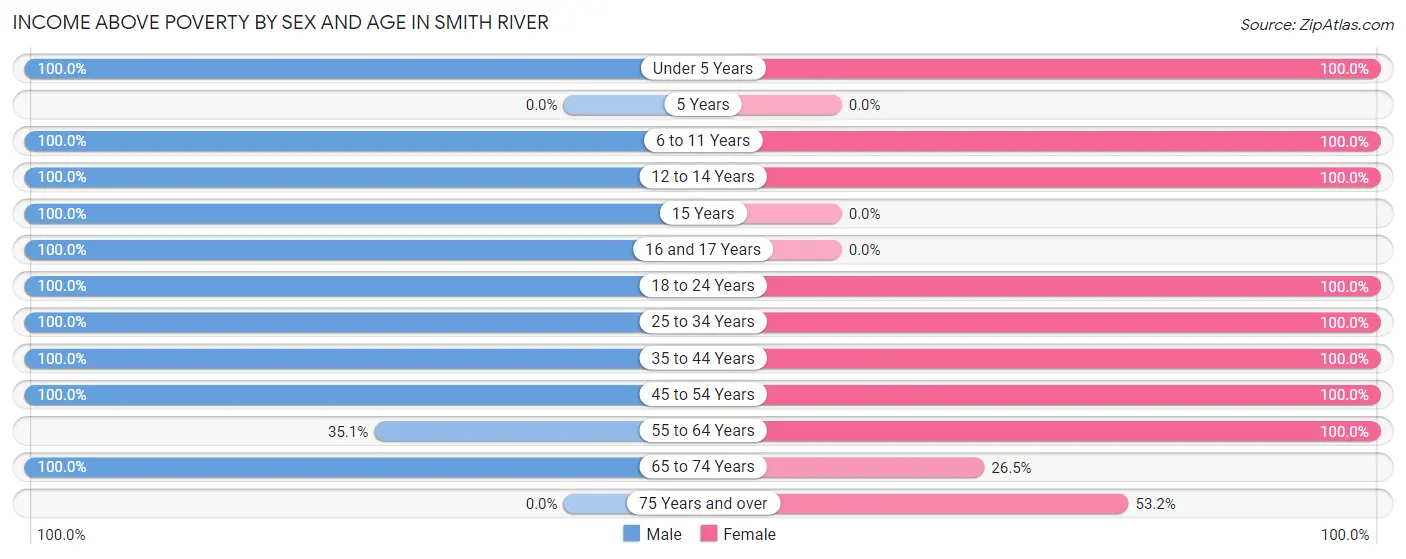
| Age Bracket | Male | Female |
| Under 5 Years | 28 (100.0%) | 23 (100.0%) |
| 5 Years | 0 (0.0%) | 0 (0.0%) |
| 6 to 11 Years | 45 (100.0%) | 76 (100.0%) |
| 12 to 14 Years | 32 (100.0%) | 44 (100.0%) |
| 15 Years | 40 (100.0%) | 0 (0.0%) |
| 16 and 17 Years | 18 (100.0%) | 0 (0.0%) |
| 18 to 24 Years | 80 (100.0%) | 46 (100.0%) |
| 25 to 34 Years | 37 (100.0%) | 21 (100.0%) |
| 35 to 44 Years | 52 (100.0%) | 77 (100.0%) |
| 45 to 54 Years | 20 (100.0%) | 10 (100.0%) |
| 55 to 64 Years | 13 (35.1%) | 29 (100.0%) |
| 65 to 74 Years | 38 (100.0%) | 9 (26.5%) |
| 75 Years and over | 0 (0.0%) | 33 (53.2%) |
| Total | 403 (94.4%) | 368 (87.2%) |
Income Below Poverty Among Married-Couple Families in Smith River
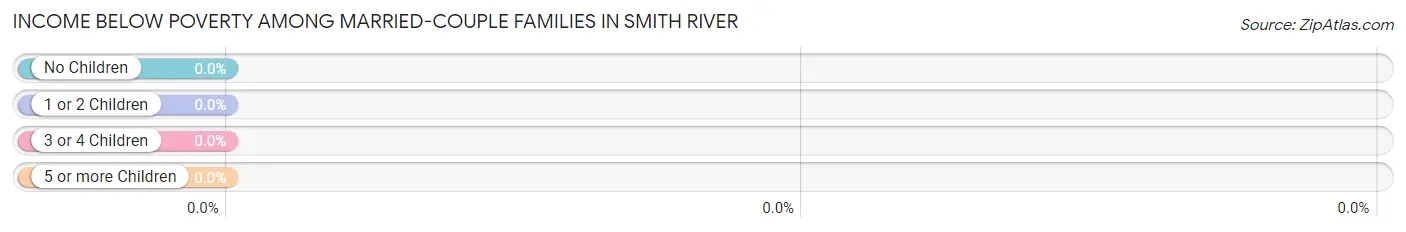
| Children | Above Poverty | Below Poverty |
| No Children | 52 (100.0%) | 0 (0.0%) |
| 1 or 2 Children | 84 (100.0%) | 0 (0.0%) |
| 3 or 4 Children | 28 (100.0%) | 0 (0.0%) |
| 5 or more Children | 0 (0.0%) | 0 (0.0%) |
| Total | 164 (100.0%) | 0 (0.0%) |
Income Below Poverty Among Single-Parent Households in Smith River
| Children | Single Father | Single Mother |
| No Children | 0 (0.0%) | 0 (0.0%) |
| 1 or 2 Children | 0 (0.0%) | 0 (0.0%) |
| 3 or 4 Children | 0 (0.0%) | 0 (0.0%) |
| 5 or more Children | 0 (0.0%) | 0 (0.0%) |
| Total | 0 (0.0%) | 0 (0.0%) |
Income Below Poverty Among Married-Couple vs Single-Parent Households in Smith River
| Children | Married-Couple Families | Single-Parent Households |
| No Children | 0 (0.0%) | 0 (0.0%) |
| 1 or 2 Children | 0 (0.0%) | 0 (0.0%) |
| 3 or 4 Children | 0 (0.0%) | 0 (0.0%) |
| 5 or more Children | 0 (0.0%) | 0 (0.0%) |
| Total | 0 (0.0%) | 0 (0.0%) |
Race in Smith River
The most populous races in Smith River are White / Caucasian (588 | 69.3%), Native / Alaskan (232 | 27.3%), and Hispanic or Latino (170 | 20.0%).
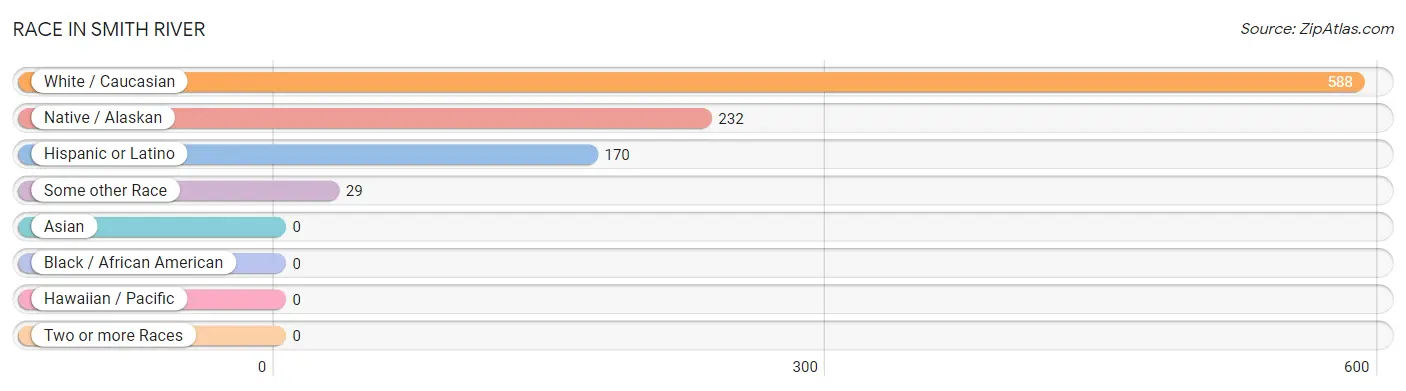
| Race | # Population | % Population |
| Asian | 0 | 0.0% |
| Black / African American | 0 | 0.0% |
| Hawaiian / Pacific | 0 | 0.0% |
| Hispanic or Latino | 170 | 20.0% |
| Native / Alaskan | 232 | 27.3% |
| White / Caucasian | 588 | 69.3% |
| Two or more Races | 0 | 0.0% |
| Some other Race | 29 | 3.4% |
| Total | 849 | 100.0% |
Ancestry in Smith River
The most populous ancestries reported in Smith River are Mexican (157 | 18.5%), Scottish (84 | 9.9%), Irish (83 | 9.8%), Norwegian (65 | 7.7%), and American (23 | 2.7%), together accounting for 48.5% of all Smith River residents.
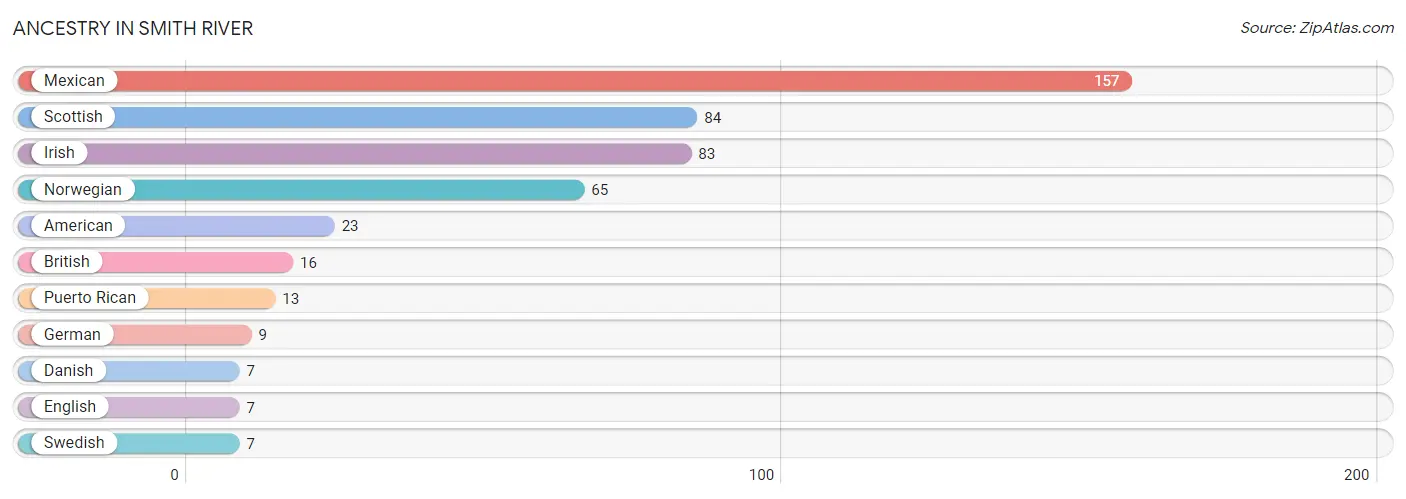
| Ancestry | # Population | % Population |
| American | 23 | 2.7% |
| British | 16 | 1.9% |
| Danish | 7 | 0.8% |
| English | 7 | 0.8% |
| German | 9 | 1.1% |
| Irish | 83 | 9.8% |
| Mexican | 157 | 18.5% |
| Norwegian | 65 | 7.7% |
| Puerto Rican | 13 | 1.5% |
| Scottish | 84 | 9.9% |
| Swedish | 7 | 0.8% | View All 11 Rows |
Immigrants in Smith River
The most numerous immigrant groups reported in Smith River came from Central America (66 | 7.8%), Latin America (66 | 7.8%), and Mexico (66 | 7.8%), together accounting for 23.3% of all Smith River residents.
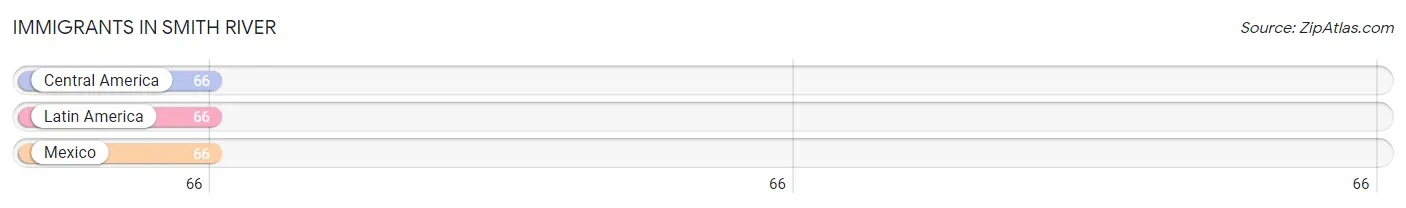
| Immigration Origin | # Population | % Population |
| Central America | 66 | 7.8% |
| Latin America | 66 | 7.8% |
| Mexico | 66 | 7.8% | View All 3 Rows |
Sex and Age in Smith River
Sex and Age in Smith River
The most populous age groups in Smith River are 15 to 19 Years (115 | 26.9%) for men and 10 to 14 Years (68 | 16.1%) for women.
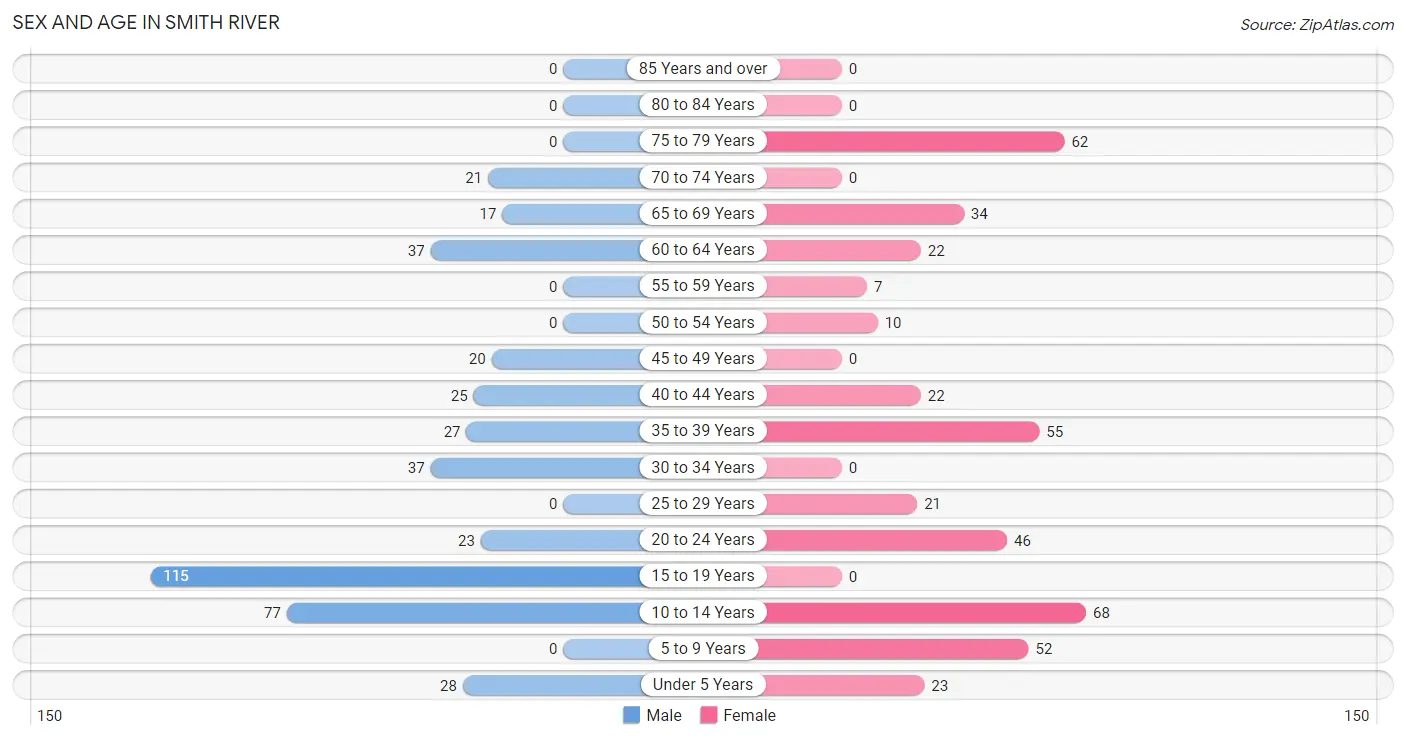
| Age Bracket | Male | Female |
| Under 5 Years | 28 (6.6%) | 23 (5.4%) |
| 5 to 9 Years | 0 (0.0%) | 52 (12.3%) |
| 10 to 14 Years | 77 (18.0%) | 68 (16.1%) |
| 15 to 19 Years | 115 (26.9%) | 0 (0.0%) |
| 20 to 24 Years | 23 (5.4%) | 46 (10.9%) |
| 25 to 29 Years | 0 (0.0%) | 21 (5.0%) |
| 30 to 34 Years | 37 (8.7%) | 0 (0.0%) |
| 35 to 39 Years | 27 (6.3%) | 55 (13.0%) |
| 40 to 44 Years | 25 (5.9%) | 22 (5.2%) |
| 45 to 49 Years | 20 (4.7%) | 0 (0.0%) |
| 50 to 54 Years | 0 (0.0%) | 10 (2.4%) |
| 55 to 59 Years | 0 (0.0%) | 7 (1.7%) |
| 60 to 64 Years | 37 (8.7%) | 22 (5.2%) |
| 65 to 69 Years | 17 (4.0%) | 34 (8.1%) |
| 70 to 74 Years | 21 (4.9%) | 0 (0.0%) |
| 75 to 79 Years | 0 (0.0%) | 62 (14.7%) |
| 80 to 84 Years | 0 (0.0%) | 0 (0.0%) |
| 85 Years and over | 0 (0.0%) | 0 (0.0%) |
| Total | 427 (100.0%) | 422 (100.0%) |
Families and Households in Smith River
Median Family Size in Smith River
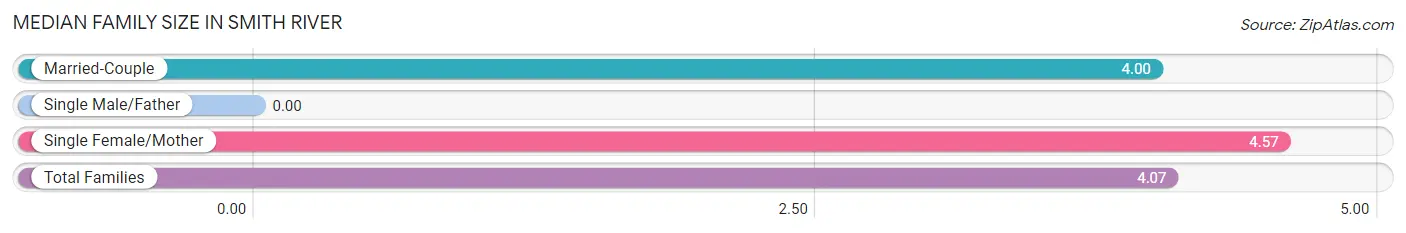
| Family Type | # Families | Family Size |
| Married-Couple | 164 (87.7%) | 4.00 |
| Single Male/Father | 0 (0.0%) | - |
| Single Female/Mother | 23 (12.3%) | 4.57 |
| Total Families | 187 (100.0%) | 4.07 |
Median Household Size in Smith River
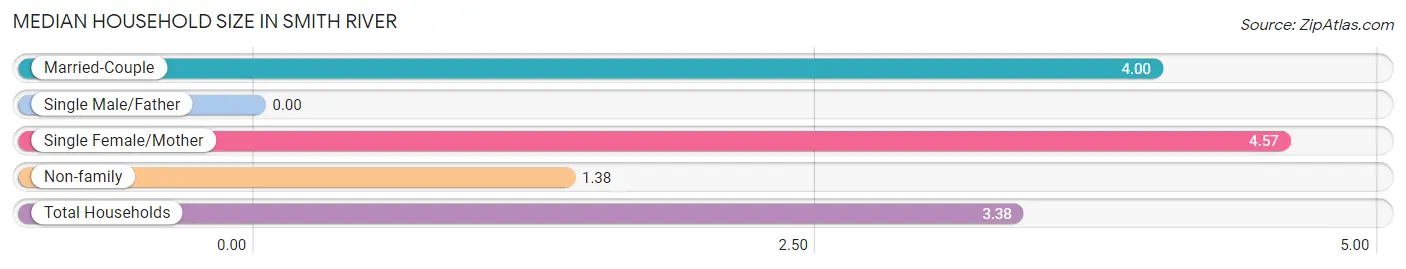
| Household Type | # Households | Household Size |
| Married-Couple | 164 (65.3%) | 4.00 |
| Single Male/Father | 0 (0.0%) | - |
| Single Female/Mother | 23 (9.2%) | 4.57 |
| Non-family | 64 (25.5%) | 1.38 |
| Total Households | 251 (100.0%) | 3.38 |
Household Size by Marriage Status in Smith River
Out of a total of 251 households in Smith River, 187 (74.5%) are family households, while 64 (25.5%) are nonfamily households. The most numerous type of family households are 5-person households, comprising 75, and the most common type of nonfamily households are 1-person households, comprising 39.
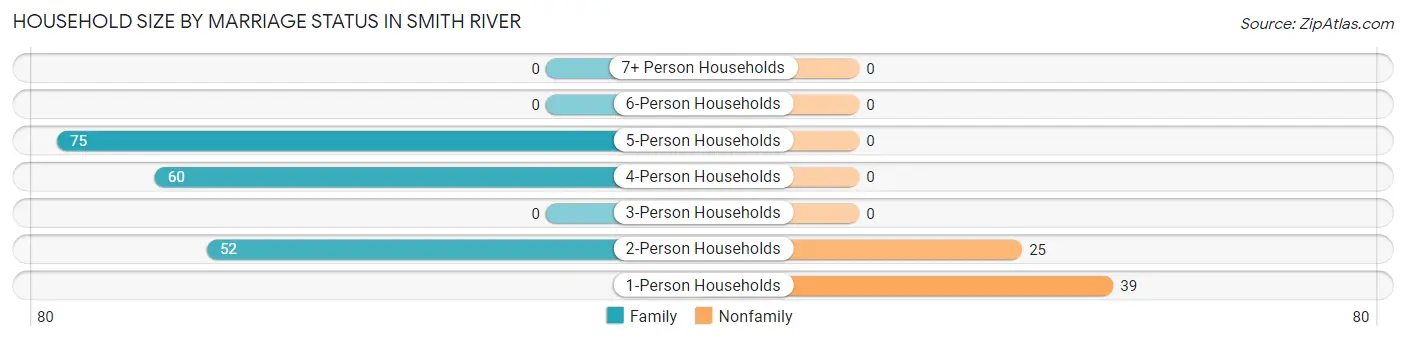
| Household Size | Family Households | Nonfamily Households |
| 1-Person Households | - | 39 (15.5%) |
| 2-Person Households | 52 (20.7%) | 25 (10.0%) |
| 3-Person Households | 0 (0.0%) | 0 (0.0%) |
| 4-Person Households | 60 (23.9%) | 0 (0.0%) |
| 5-Person Households | 75 (29.9%) | 0 (0.0%) |
| 6-Person Households | 0 (0.0%) | 0 (0.0%) |
| 7+ Person Households | 0 (0.0%) | 0 (0.0%) |
| Total | 187 (74.5%) | 64 (25.5%) |
Female Fertility in Smith River
Fertility by Age in Smith River
| Age Bracket | Women with Births | Births / 1,000 Women |
| 15 to 19 years | 0 (0.0%) | 0.0 |
| 20 to 34 years | 0 (0.0%) | 0.0 |
| 35 to 50 years | 0 (0.0%) | 0.0 |
| Total | 0 (0.0%) | 0.0 |
Fertility by Age by Marriage Status in Smith River
| Age Bracket | Married | Unmarried |
| 15 to 19 years | 0 (0.0%) | 0 (0.0%) |
| 20 to 34 years | 0 (0.0%) | 0 (0.0%) |
| 35 to 50 years | 0 (0.0%) | 0 (0.0%) |
| Total | 0 (0.0%) | 0 (0.0%) |
Fertility by Education in Smith River
| Educational Attainment | Women with Births | Births / 1,000 Women |
| Less than High School | 0 (0.0%) | 0.0 |
| High School Diploma | 0 (0.0%) | 0.0 |
| College or Associate's Degree | 0 (0.0%) | 0.0 |
| Bachelor's Degree | 0 (0.0%) | 0.0 |
| Graduate Degree | 0 (0.0%) | 0.0 |
| Total | 0 (0.0%) | 0.0 |
Fertility by Education by Marriage Status in Smith River
| Educational Attainment | Married | Unmarried |
| Less than High School | 0 (0.0%) | 0 (0.0%) |
| High School Diploma | 0 (0.0%) | 0 (0.0%) |
| College or Associate's Degree | 0 (0.0%) | 0 (0.0%) |
| Bachelor's Degree | 0 (0.0%) | 0 (0.0%) |
| Graduate Degree | 0 (0.0%) | 0 (0.0%) |
| Total | 0 (0.0%) | 0 (0.0%) |
Employment Characteristics in Smith River
Employment by Class of Employer in Smith River
Among the 329 employed individuals in Smith River, private company employees (102 | 31.0%), not-for-profit organizations (68 | 20.7%), and self-employed (not incorporated) (54 | 16.4%) make up the most common classes of employment.
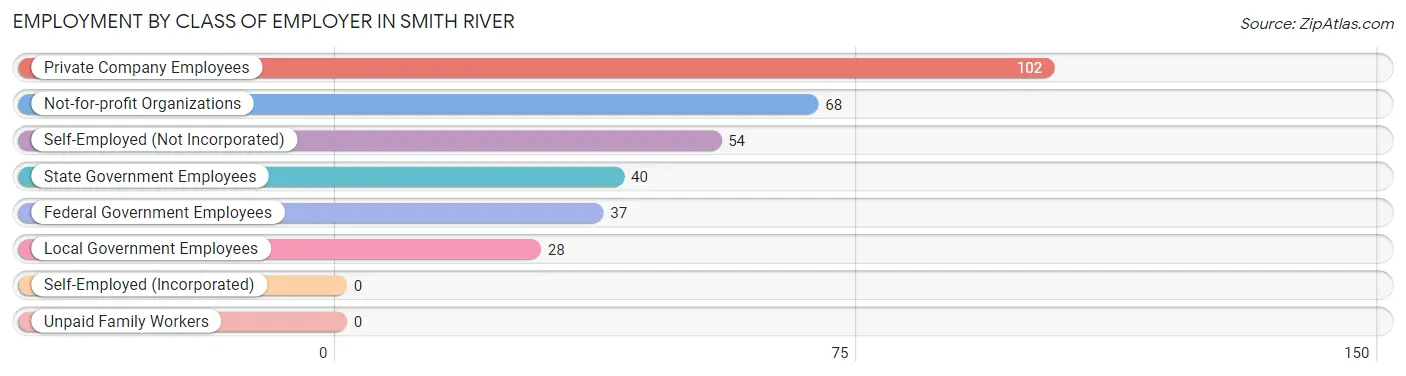
| Employer Class | # Employees | % Employees |
| Private Company Employees | 102 | 31.0% |
| Self-Employed (Incorporated) | 0 | 0.0% |
| Self-Employed (Not Incorporated) | 54 | 16.4% |
| Not-for-profit Organizations | 68 | 20.7% |
| Local Government Employees | 28 | 8.5% |
| State Government Employees | 40 | 12.2% |
| Federal Government Employees | 37 | 11.3% |
| Unpaid Family Workers | 0 | 0.0% |
| Total | 329 | 100.0% |
Employment Status by Age in Smith River
According to the labor force statistics for Smith River, out of the total population over 16 years of age (561), 62.4% or 350 individuals are in the labor force, with 6.0% or 21 of them unemployed. The age group with the highest labor force participation rate is 25 to 29 years, with 100.0% or 21 individuals in the labor force. Within the labor force, the 25 to 29 years age range has the highest percentage of unemployed individuals, with 100.0% or 21 of them being unemployed.
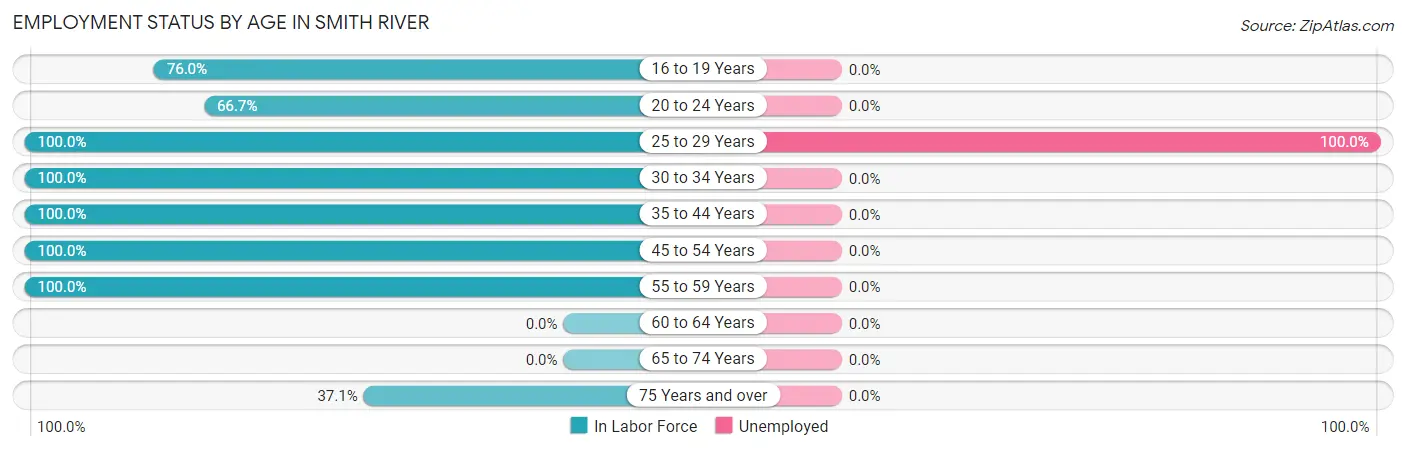
| Age Bracket | In Labor Force | Unemployed |
| 16 to 19 Years | 57 (76.0%) | 0 (0.0%) |
| 20 to 24 Years | 46 (66.7%) | 0 (0.0%) |
| 25 to 29 Years | 21 (100.0%) | 21 (100.0%) |
| 30 to 34 Years | 37 (100.0%) | 0 (0.0%) |
| 35 to 44 Years | 129 (100.0%) | 0 (0.0%) |
| 45 to 54 Years | 30 (100.0%) | 0 (0.0%) |
| 55 to 59 Years | 7 (100.0%) | 0 (0.0%) |
| 60 to 64 Years | 0 (0.0%) | 0 (0.0%) |
| 65 to 74 Years | 0 (0.0%) | 0 (0.0%) |
| 75 Years and over | 23 (37.1%) | 0 (0.0%) |
| Total | 350 (62.4%) | 21 (6.0%) |
Employment Status by Educational Attainment in Smith River
According to labor force statistics for Smith River, 79.2% of individuals (224) out of the total population between 25 and 64 years of age (283) are in the labor force, with 9.4% or 21 of them being unemployed. The group with the highest labor force participation rate are those with the educational attainment of college / associate degree, with 88.8% or 159 individuals in the labor force. Within the labor force, individuals with high school diploma education have the highest percentage of unemployment, with 32.3% or 21 of them being unemployed.
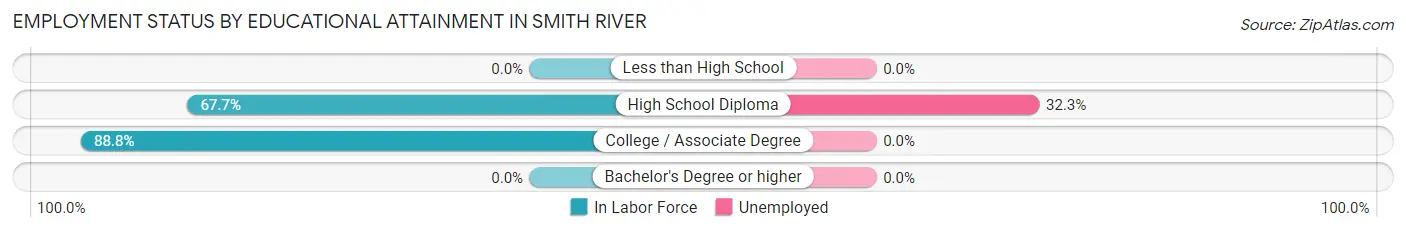
| Educational Attainment | In Labor Force | Unemployed |
| Less than High School | 0 (0.0%) | 0 (0.0%) |
| High School Diploma | 65 (67.7%) | 31 (32.3%) |
| College / Associate Degree | 159 (88.8%) | 0 (0.0%) |
| Bachelor's Degree or higher | 0 (0.0%) | 0 (0.0%) |
| Total | 224 (79.2%) | 27 (9.4%) |
Employment Occupations by Sex in Smith River
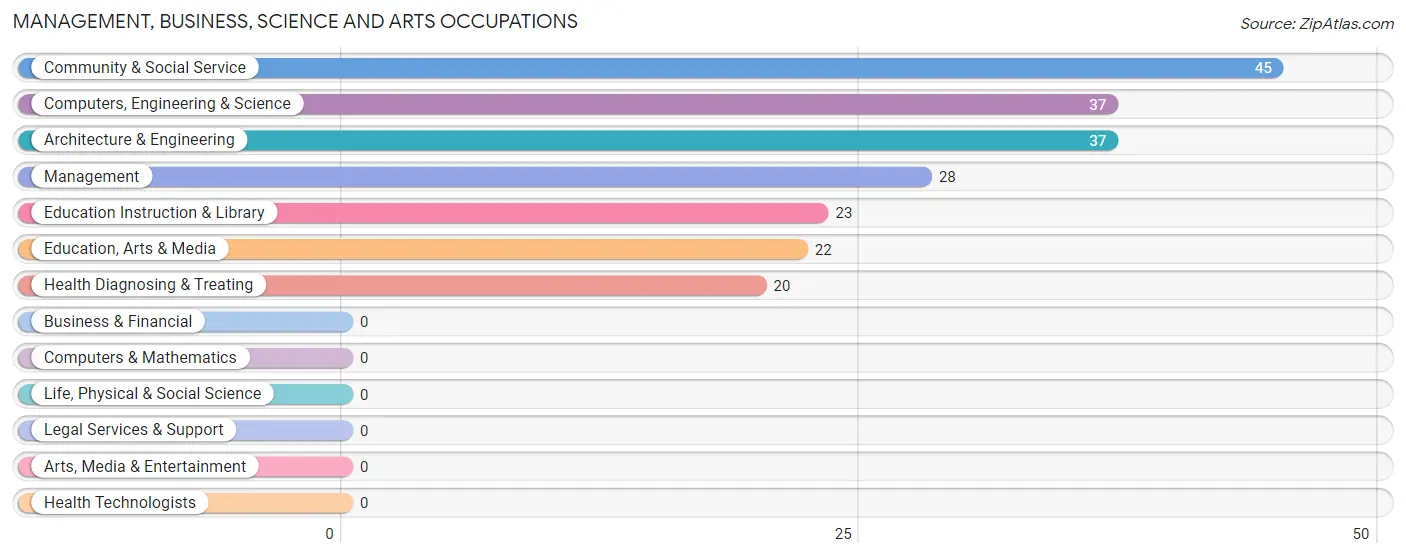
Management, Business, Science and Arts Occupations
The most common Management, Business, Science and Arts occupations in Smith River are Community & Social Service (45 | 13.7%), Computers, Engineering & Science (37 | 11.3%), Architecture & Engineering (37 | 11.3%), Management (28 | 8.5%), and Education Instruction & Library (23 | 7.0%).
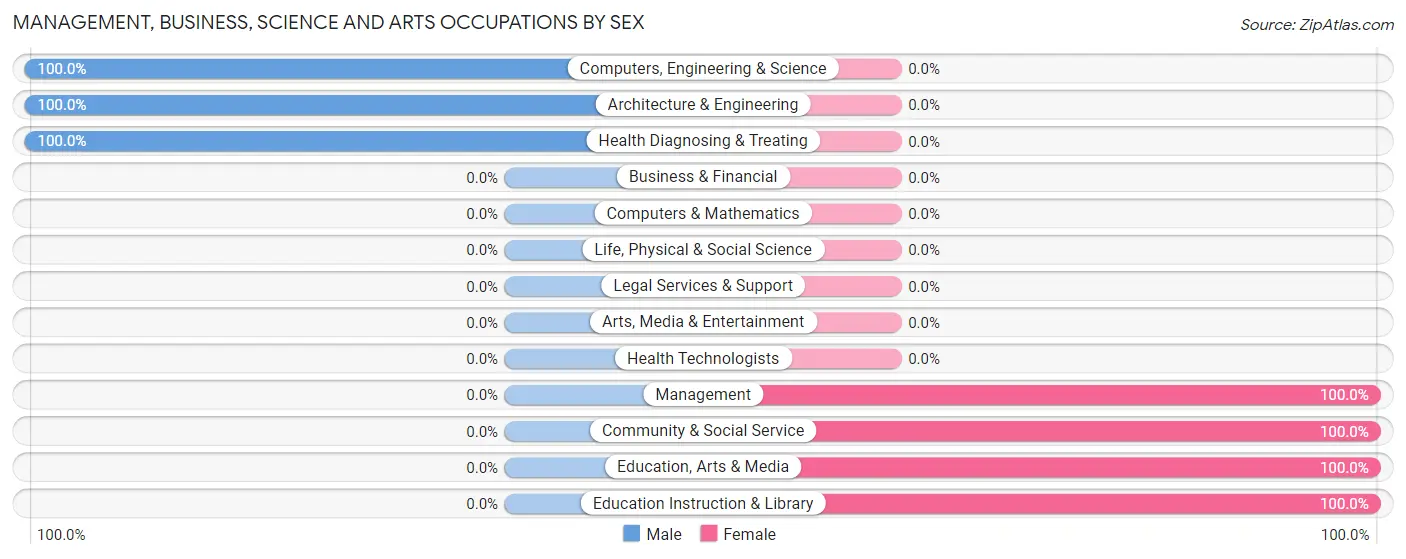
Management, Business, Science and Arts Occupations by Sex
Within the Management, Business, Science and Arts occupations in Smith River, the most male-oriented occupations are Computers, Engineering & Science (100.0%), Architecture & Engineering (100.0%), and Health Diagnosing & Treating (100.0%), while the most female-oriented occupations are Management (100.0%), Community & Social Service (100.0%), and Education, Arts & Media (100.0%).
| Occupation | Male | Female |
| Management | 0 (0.0%) | 28 (100.0%) |
| Business & Financial | 0 (0.0%) | 0 (0.0%) |
| Computers, Engineering & Science | 37 (100.0%) | 0 (0.0%) |
| Computers & Mathematics | 0 (0.0%) | 0 (0.0%) |
| Architecture & Engineering | 37 (100.0%) | 0 (0.0%) |
| Life, Physical & Social Science | 0 (0.0%) | 0 (0.0%) |
| Community & Social Service | 0 (0.0%) | 45 (100.0%) |
| Education, Arts & Media | 0 (0.0%) | 22 (100.0%) |
| Legal Services & Support | 0 (0.0%) | 0 (0.0%) |
| Education Instruction & Library | 0 (0.0%) | 23 (100.0%) |
| Arts, Media & Entertainment | 0 (0.0%) | 0 (0.0%) |
| Health Diagnosing & Treating | 20 (100.0%) | 0 (0.0%) |
| Health Technologists | 0 (0.0%) | 0 (0.0%) |
| Total (Category) | 57 (43.9%) | 73 (56.1%) |
| Total (Overall) | 166 (50.5%) | 163 (49.5%) |
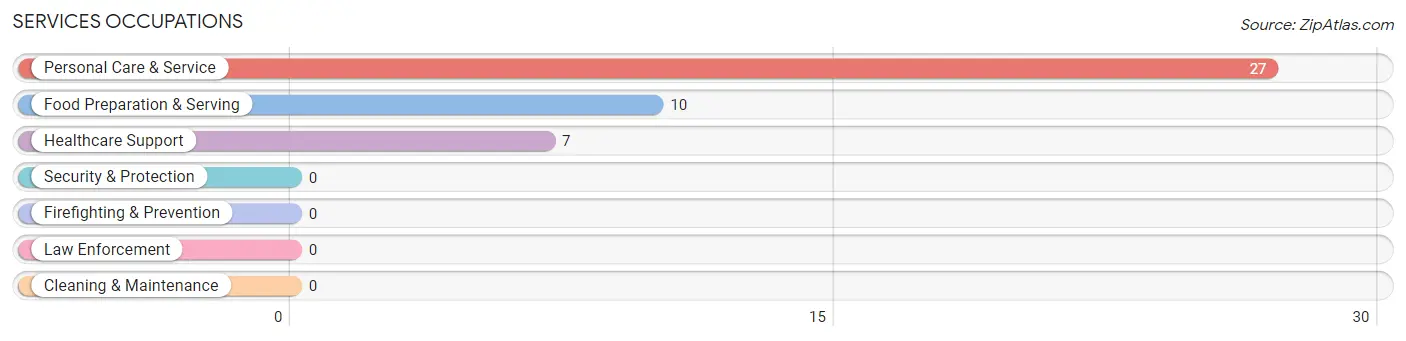
Services Occupations
The most common Services occupations in Smith River are Personal Care & Service (27 | 8.2%), Food Preparation & Serving (10 | 3.0%), and Healthcare Support (7 | 2.1%).
Services Occupations by Sex
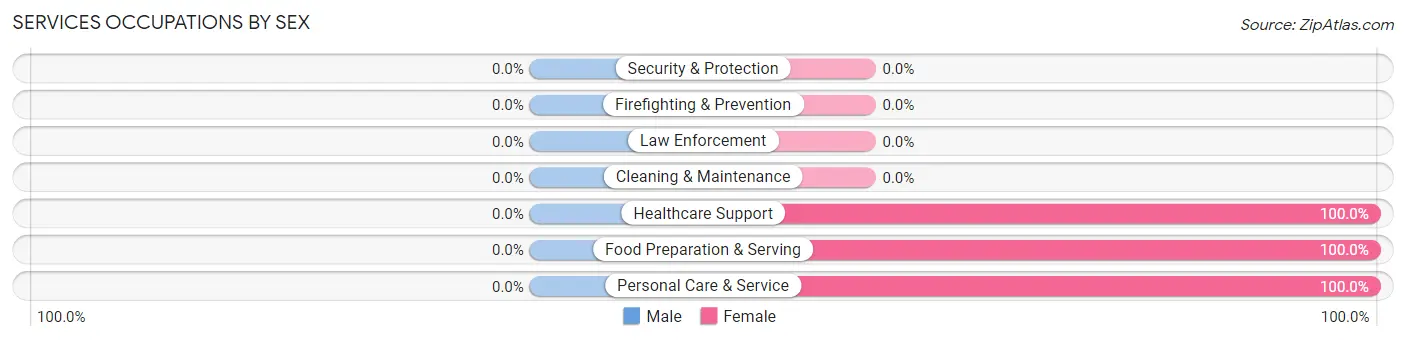
| Occupation | Male | Female |
| Healthcare Support | 0 (0.0%) | 7 (100.0%) |
| Security & Protection | 0 (0.0%) | 0 (0.0%) |
| Firefighting & Prevention | 0 (0.0%) | 0 (0.0%) |
| Law Enforcement | 0 (0.0%) | 0 (0.0%) |
| Food Preparation & Serving | 0 (0.0%) | 10 (100.0%) |
| Cleaning & Maintenance | 0 (0.0%) | 0 (0.0%) |
| Personal Care & Service | 0 (0.0%) | 27 (100.0%) |
| Total (Category) | 0 (0.0%) | 44 (100.0%) |
| Total (Overall) | 166 (50.5%) | 163 (49.5%) |
Sales and Office Occupations
The most common Sales and Office occupations in Smith River are , and Sales & Related (103 | 31.3%).
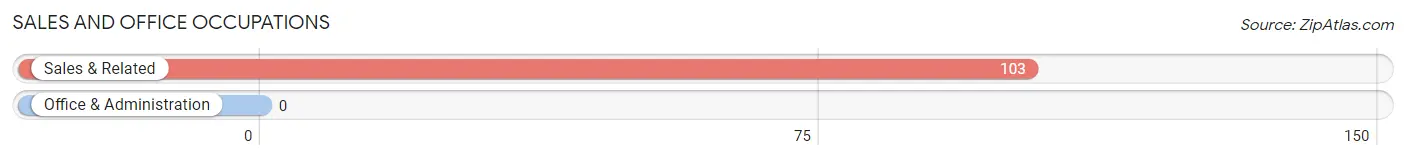
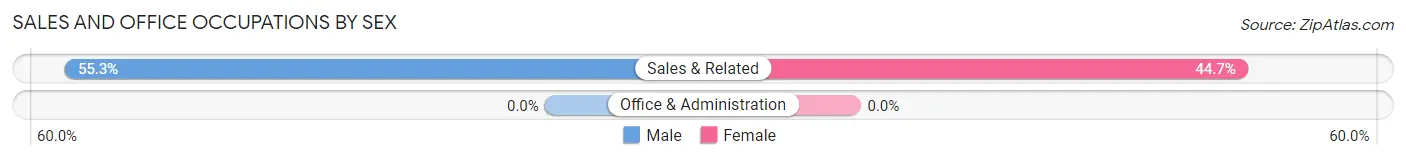
Sales and Office Occupations by Sex
| Occupation | Male | Female |
| Sales & Related | 57 (55.3%) | 46 (44.7%) |
| Office & Administration | 0 (0.0%) | 0 (0.0%) |
| Total (Category) | 57 (55.3%) | 46 (44.7%) |
| Total (Overall) | 166 (50.5%) | 163 (49.5%) |
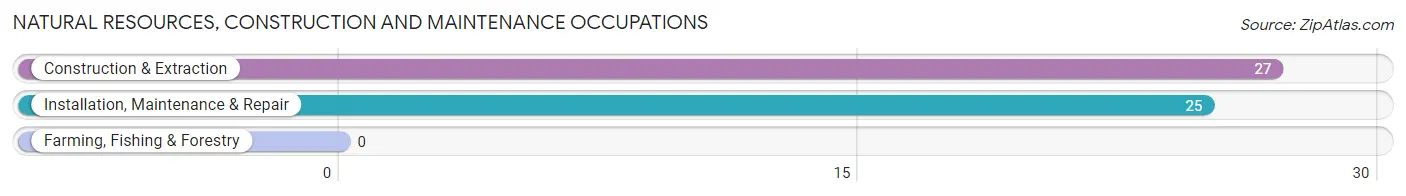
Natural Resources, Construction and Maintenance Occupations
The most common Natural Resources, Construction and Maintenance occupations in Smith River are Construction & Extraction (27 | 8.2%), and Installation, Maintenance & Repair (25 | 7.6%).
Natural Resources, Construction and Maintenance Occupations by Sex
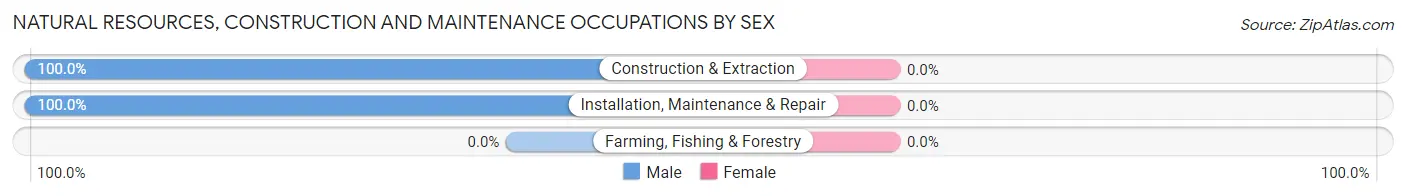
| Occupation | Male | Female |
| Farming, Fishing & Forestry | 0 (0.0%) | 0 (0.0%) |
| Construction & Extraction | 27 (100.0%) | 0 (0.0%) |
| Installation, Maintenance & Repair | 25 (100.0%) | 0 (0.0%) |
| Total (Category) | 52 (100.0%) | 0 (0.0%) |
| Total (Overall) | 166 (50.5%) | 163 (49.5%) |
Production, Transportation and Moving Occupations
Production, Transportation and Moving Occupations by Sex
| Occupation | Male | Female |
| Production | 0 (0.0%) | 0 (0.0%) |
| Transportation | 0 (0.0%) | 0 (0.0%) |
| Material Moving | 0 (0.0%) | 0 (0.0%) |
| Total (Category) | 0 (0.0%) | 0 (0.0%) |
| Total (Overall) | 166 (50.5%) | 163 (49.5%) |
Employment Industries by Sex in Smith River
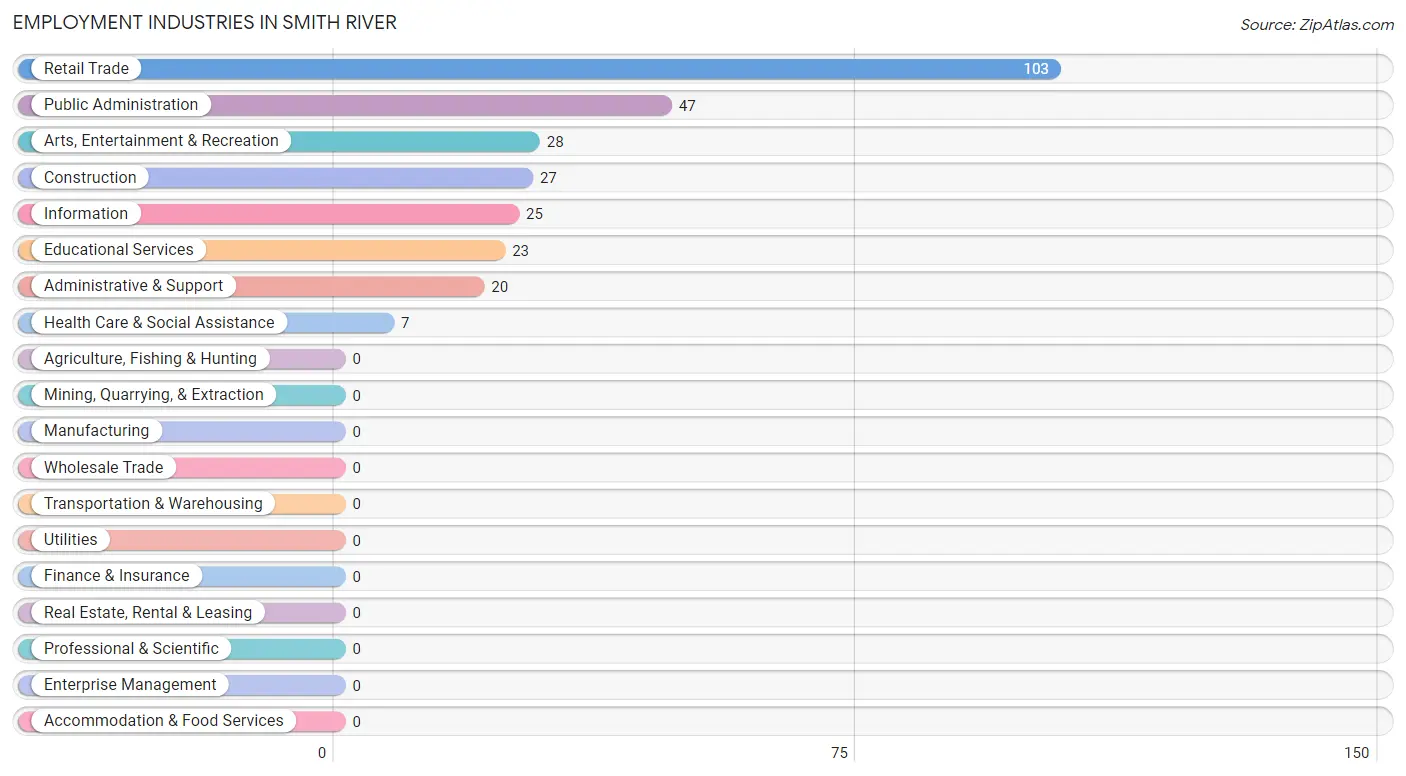
Employment Industries in Smith River
The major employment industries in Smith River include Retail Trade (103 | 31.3%), Public Administration (47 | 14.3%), Arts, Entertainment & Recreation (28 | 8.5%), Construction (27 | 8.2%), and Information (25 | 7.6%).
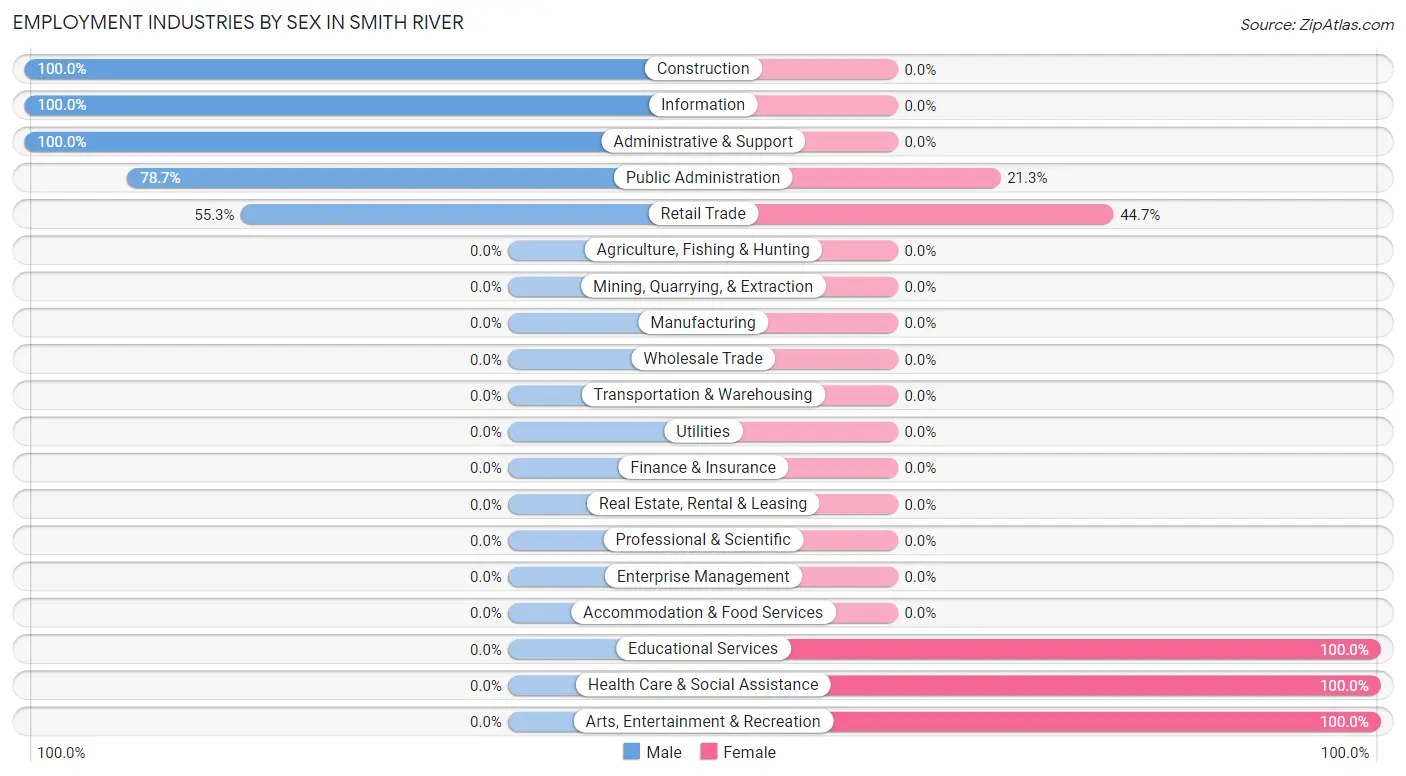
Employment Industries by Sex in Smith River
The Smith River industries that see more men than women are Construction (100.0%), Information (100.0%), and Administrative & Support (100.0%), whereas the industries that tend to have a higher number of women are Educational Services (100.0%), Health Care & Social Assistance (100.0%), and Arts, Entertainment & Recreation (100.0%).
| Industry | Male | Female |
| Agriculture, Fishing & Hunting | 0 (0.0%) | 0 (0.0%) |
| Mining, Quarrying, & Extraction | 0 (0.0%) | 0 (0.0%) |
| Construction | 27 (100.0%) | 0 (0.0%) |
| Manufacturing | 0 (0.0%) | 0 (0.0%) |
| Wholesale Trade | 0 (0.0%) | 0 (0.0%) |
| Retail Trade | 57 (55.3%) | 46 (44.7%) |
| Transportation & Warehousing | 0 (0.0%) | 0 (0.0%) |
| Utilities | 0 (0.0%) | 0 (0.0%) |
| Information | 25 (100.0%) | 0 (0.0%) |
| Finance & Insurance | 0 (0.0%) | 0 (0.0%) |
| Real Estate, Rental & Leasing | 0 (0.0%) | 0 (0.0%) |
| Professional & Scientific | 0 (0.0%) | 0 (0.0%) |
| Enterprise Management | 0 (0.0%) | 0 (0.0%) |
| Administrative & Support | 20 (100.0%) | 0 (0.0%) |
| Educational Services | 0 (0.0%) | 23 (100.0%) |
| Health Care & Social Assistance | 0 (0.0%) | 7 (100.0%) |
| Arts, Entertainment & Recreation | 0 (0.0%) | 28 (100.0%) |
| Accommodation & Food Services | 0 (0.0%) | 0 (0.0%) |
| Public Administration | 37 (78.7%) | 10 (21.3%) |
| Total | 166 (50.5%) | 163 (49.5%) |
Education in Smith River
School Enrollment in Smith River
The most common levels of schooling among the 381 students in Smith River are high school (159 | 41.7%), middle school (101 | 26.5%), and college / undergraduate (69 | 18.1%).
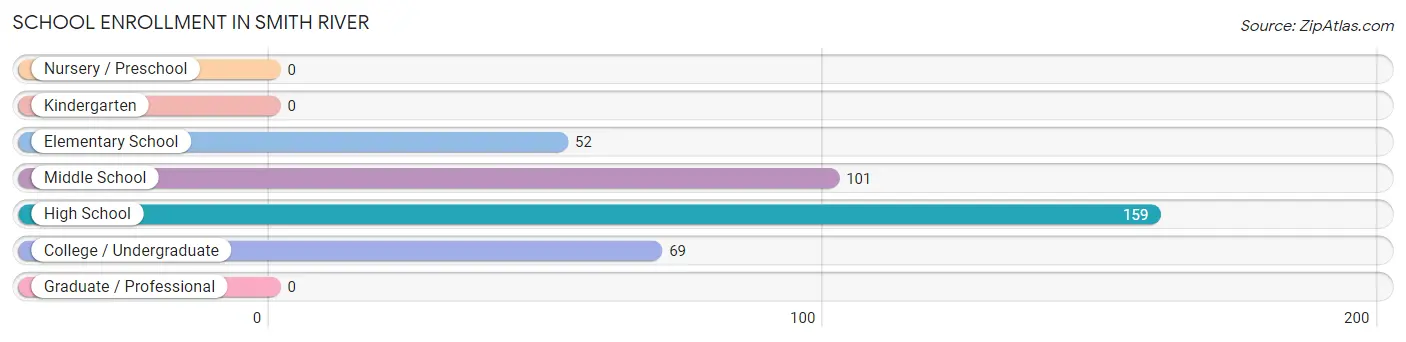
| School Level | # Students | % Students |
| Nursery / Preschool | 0 | 0.0% |
| Kindergarten | 0 | 0.0% |
| Elementary School | 52 | 13.7% |
| Middle School | 101 | 26.5% |
| High School | 159 | 41.7% |
| College / Undergraduate | 69 | 18.1% |
| Graduate / Professional | 0 | 0.0% |
| Total | 381 | 100.0% |
School Enrollment by Age by Funding Source in Smith River
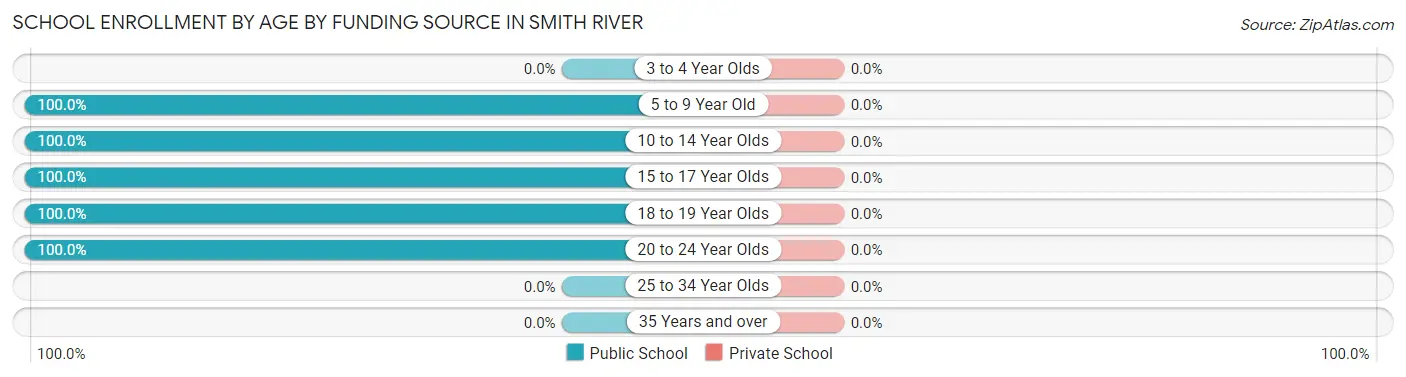
| Age Bracket | Public School | Private School |
| 3 to 4 Year Olds | 0 (0.0%) | 0 (0.0%) |
| 5 to 9 Year Old | 52 (100.0%) | 0 (0.0%) |
| 10 to 14 Year Olds | 145 (100.0%) | 0 (0.0%) |
| 15 to 17 Year Olds | 58 (100.0%) | 0 (0.0%) |
| 18 to 19 Year Olds | 57 (100.0%) | 0 (0.0%) |
| 20 to 24 Year Olds | 69 (100.0%) | 0 (0.0%) |
| 25 to 34 Year Olds | 0 (0.0%) | 0 (0.0%) |
| 35 Years and over | 0 (0.0%) | 0 (0.0%) |
| Total | 381 (100.0%) | 0 (0.0%) |
Educational Attainment by Field of Study in Smith River
Visual & performing arts (23 | 74.2%), and liberal arts & history (8 | 25.8%) are the most common fields of study among 31 individuals in Smith River who have obtained a bachelor's degree or higher.
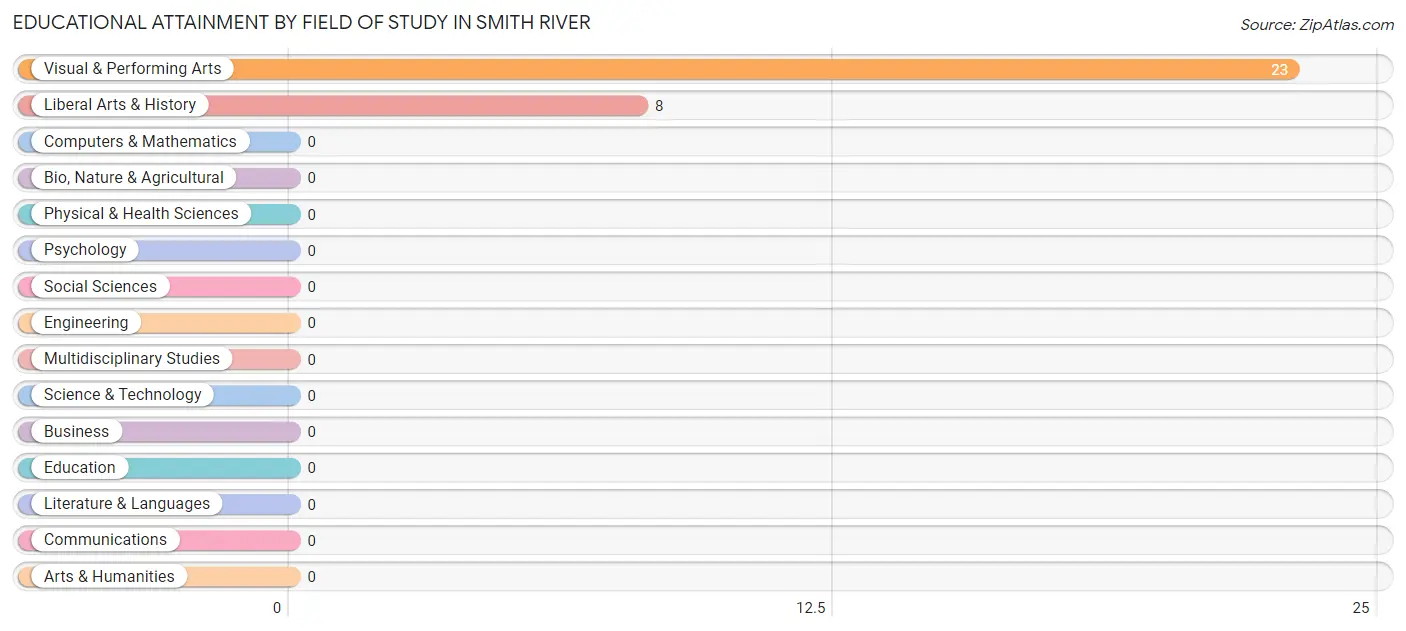
| Field of Study | # Graduates | % Graduates |
| Computers & Mathematics | 0 | 0.0% |
| Bio, Nature & Agricultural | 0 | 0.0% |
| Physical & Health Sciences | 0 | 0.0% |
| Psychology | 0 | 0.0% |
| Social Sciences | 0 | 0.0% |
| Engineering | 0 | 0.0% |
| Multidisciplinary Studies | 0 | 0.0% |
| Science & Technology | 0 | 0.0% |
| Business | 0 | 0.0% |
| Education | 0 | 0.0% |
| Literature & Languages | 0 | 0.0% |
| Liberal Arts & History | 8 | 25.8% |
| Visual & Performing Arts | 23 | 74.2% |
| Communications | 0 | 0.0% |
| Arts & Humanities | 0 | 0.0% |
| Total | 31 | 100.0% |
Transportation & Commute in Smith River
Vehicle Availability by Sex in Smith River
The most prevalent vehicle ownership categories in Smith River are males with 4 vehicles (82, accounting for 49.4%) and females with 4 vehicles (27, making up 50.3%).
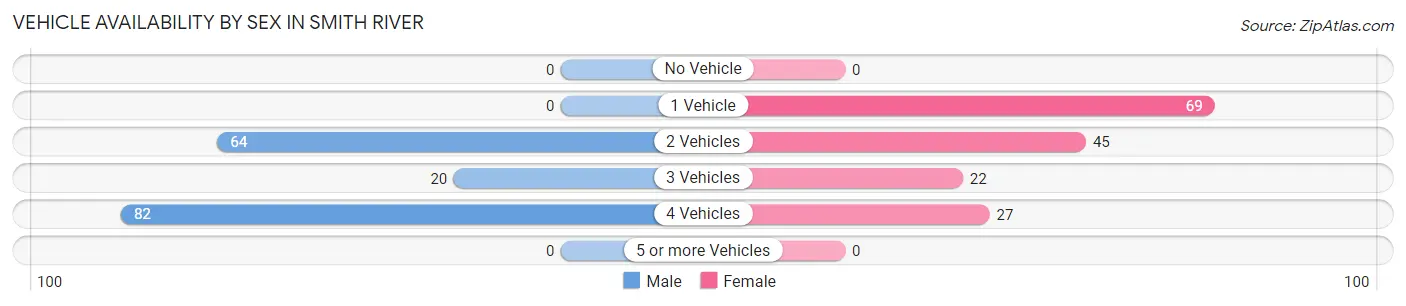
| Vehicles Available | Male | Female |
| No Vehicle | 0 (0.0%) | 0 (0.0%) |
| 1 Vehicle | 0 (0.0%) | 69 (42.3%) |
| 2 Vehicles | 64 (38.6%) | 45 (27.6%) |
| 3 Vehicles | 20 (12.0%) | 22 (13.5%) |
| 4 Vehicles | 82 (49.4%) | 27 (16.6%) |
| 5 or more Vehicles | 0 (0.0%) | 0 (0.0%) |
| Total | 166 (100.0%) | 163 (100.0%) |
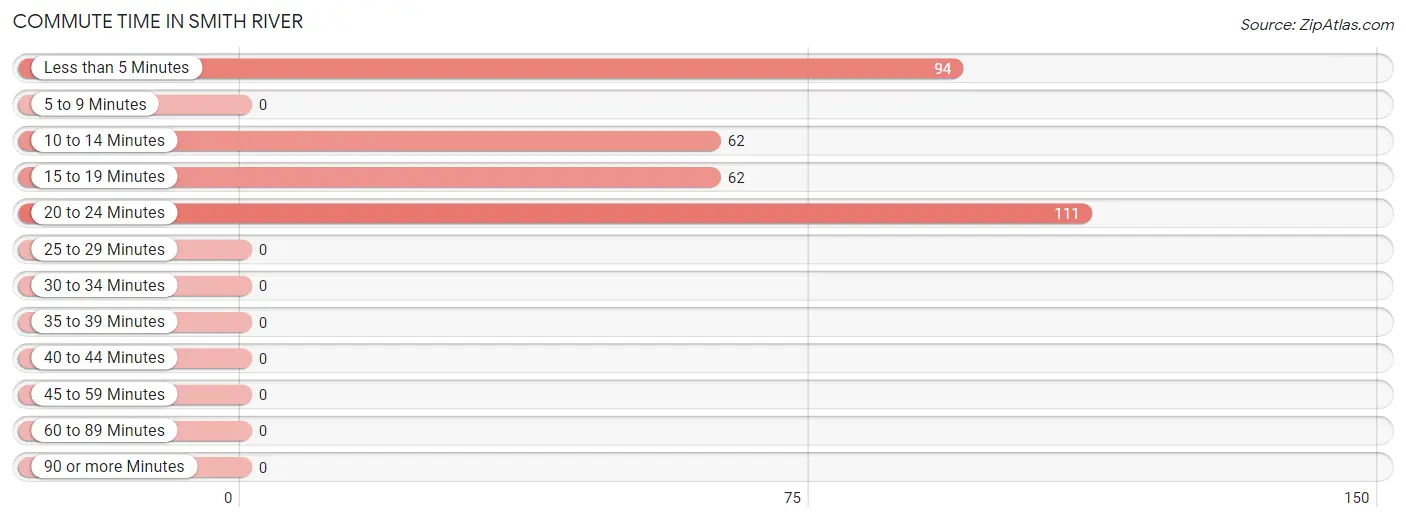
Commute Time in Smith River
The most frequently occuring commute durations in Smith River are 20 to 24 minutes (111 commuters, 33.7%), less than 5 minutes (94 commuters, 28.6%), and 10 to 14 minutes (62 commuters, 18.8%).
| Commute Time | # Commuters | % Commuters |
| Less than 5 Minutes | 94 | 28.6% |
| 5 to 9 Minutes | 0 | 0.0% |
| 10 to 14 Minutes | 62 | 18.8% |
| 15 to 19 Minutes | 62 | 18.8% |
| 20 to 24 Minutes | 111 | 33.7% |
| 25 to 29 Minutes | 0 | 0.0% |
| 30 to 34 Minutes | 0 | 0.0% |
| 35 to 39 Minutes | 0 | 0.0% |
| 40 to 44 Minutes | 0 | 0.0% |
| 45 to 59 Minutes | 0 | 0.0% |
| 60 to 89 Minutes | 0 | 0.0% |
| 90 or more Minutes | 0 | 0.0% |
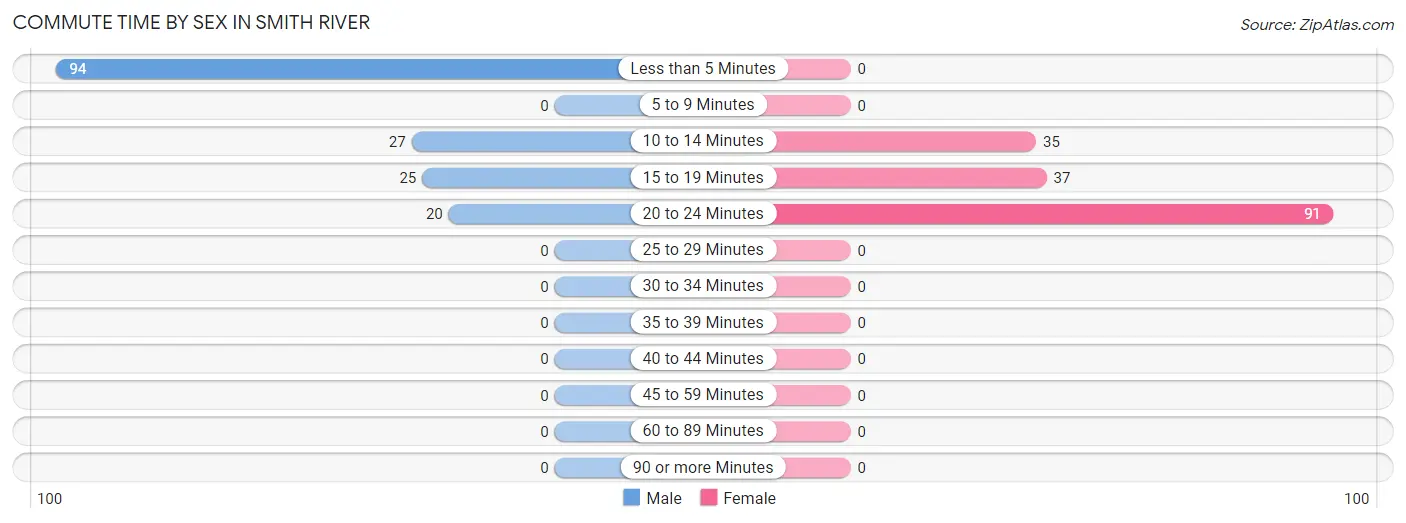
Commute Time by Sex in Smith River
The most common commute times in Smith River are less than 5 minutes (94 commuters, 56.6%) for males and 20 to 24 minutes (91 commuters, 55.8%) for females.
| Commute Time | Male | Female |
| Less than 5 Minutes | 94 (56.6%) | 0 (0.0%) |
| 5 to 9 Minutes | 0 (0.0%) | 0 (0.0%) |
| 10 to 14 Minutes | 27 (16.3%) | 35 (21.5%) |
| 15 to 19 Minutes | 25 (15.1%) | 37 (22.7%) |
| 20 to 24 Minutes | 20 (12.0%) | 91 (55.8%) |
| 25 to 29 Minutes | 0 (0.0%) | 0 (0.0%) |
| 30 to 34 Minutes | 0 (0.0%) | 0 (0.0%) |
| 35 to 39 Minutes | 0 (0.0%) | 0 (0.0%) |
| 40 to 44 Minutes | 0 (0.0%) | 0 (0.0%) |
| 45 to 59 Minutes | 0 (0.0%) | 0 (0.0%) |
| 60 to 89 Minutes | 0 (0.0%) | 0 (0.0%) |
| 90 or more Minutes | 0 (0.0%) | 0 (0.0%) |
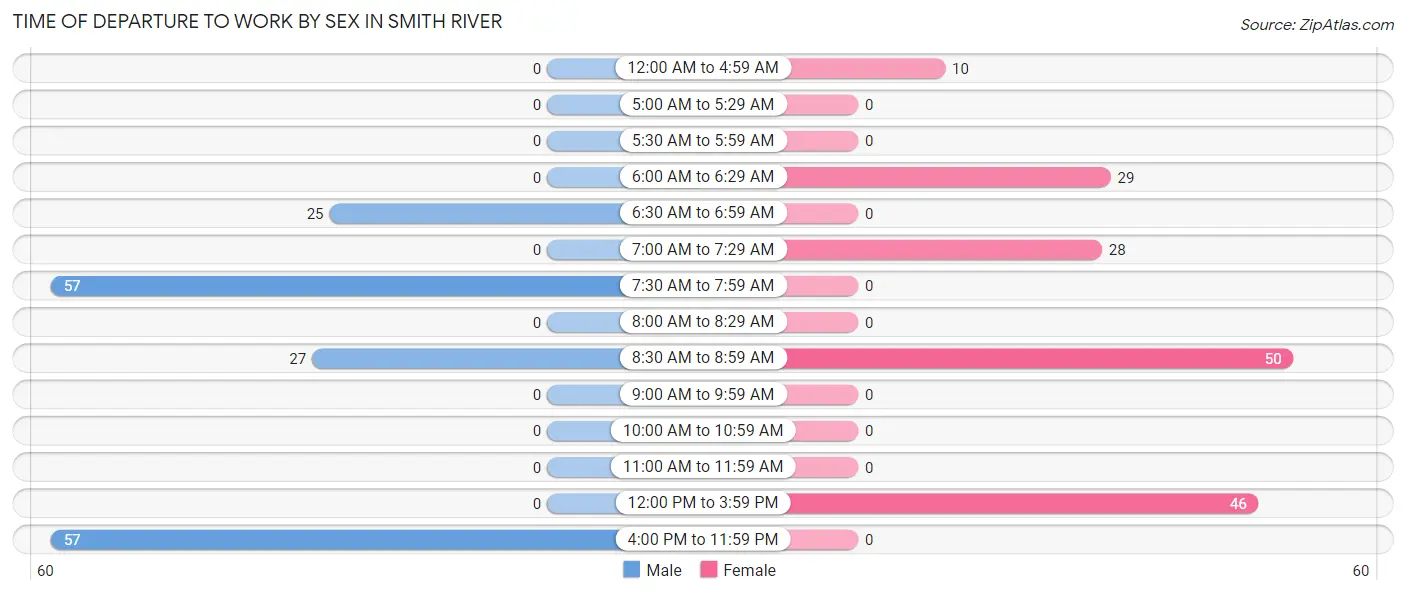
Time of Departure to Work by Sex in Smith River
The most frequent times of departure to work in Smith River are 7:30 AM to 7:59 AM (57, 34.3%) for males and 8:30 AM to 8:59 AM (50, 30.7%) for females.
| Time of Departure | Male | Female |
| 12:00 AM to 4:59 AM | 0 (0.0%) | 10 (6.1%) |
| 5:00 AM to 5:29 AM | 0 (0.0%) | 0 (0.0%) |
| 5:30 AM to 5:59 AM | 0 (0.0%) | 0 (0.0%) |
| 6:00 AM to 6:29 AM | 0 (0.0%) | 29 (17.8%) |
| 6:30 AM to 6:59 AM | 25 (15.1%) | 0 (0.0%) |
| 7:00 AM to 7:29 AM | 0 (0.0%) | 28 (17.2%) |
| 7:30 AM to 7:59 AM | 57 (34.3%) | 0 (0.0%) |
| 8:00 AM to 8:29 AM | 0 (0.0%) | 0 (0.0%) |
| 8:30 AM to 8:59 AM | 27 (16.3%) | 50 (30.7%) |
| 9:00 AM to 9:59 AM | 0 (0.0%) | 0 (0.0%) |
| 10:00 AM to 10:59 AM | 0 (0.0%) | 0 (0.0%) |
| 11:00 AM to 11:59 AM | 0 (0.0%) | 0 (0.0%) |
| 12:00 PM to 3:59 PM | 0 (0.0%) | 46 (28.2%) |
| 4:00 PM to 11:59 PM | 57 (34.3%) | 0 (0.0%) |
| Total | 166 (100.0%) | 163 (100.0%) |
Housing Occupancy in Smith River
Occupancy by Ownership in Smith River
Of the total 251 dwellings in Smith River, owner-occupied units account for 197 (78.5%), while renter-occupied units make up 54 (21.5%).
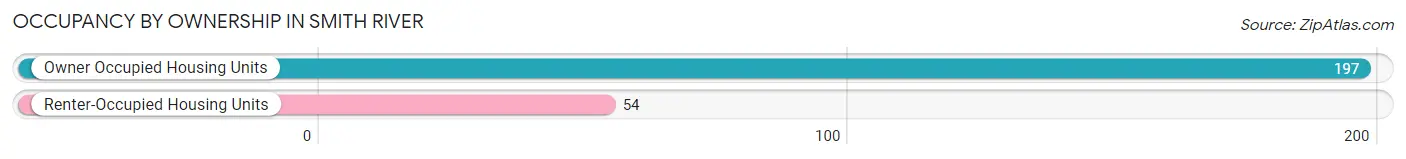
| Occupancy | # Housing Units | % Housing Units |
| Owner Occupied Housing Units | 197 | 78.5% |
| Renter-Occupied Housing Units | 54 | 21.5% |
| Total Occupied Housing Units | 251 | 100.0% |
Occupancy by Household Size in Smith River
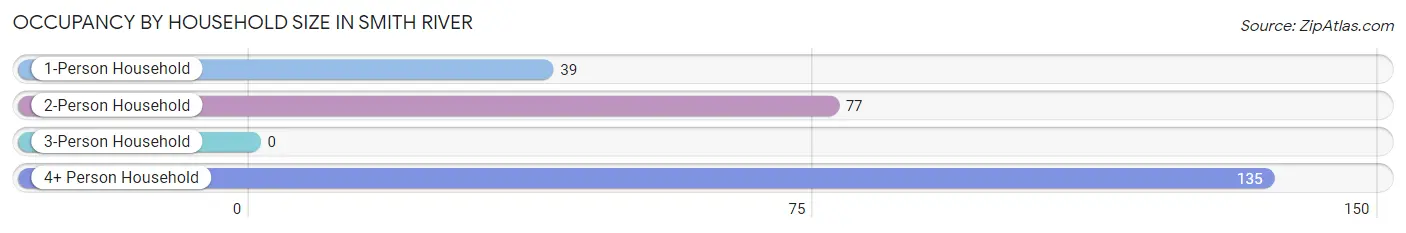
| Household Size | # Housing Units | % Housing Units |
| 1-Person Household | 39 | 15.5% |
| 2-Person Household | 77 | 30.7% |
| 3-Person Household | 0 | 0.0% |
| 4+ Person Household | 135 | 53.8% |
| Total Housing Units | 251 | 100.0% |
Occupancy by Ownership by Household Size in Smith River
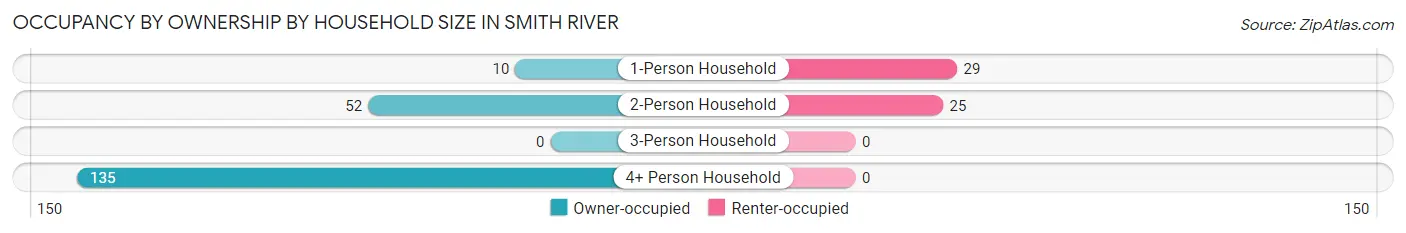
| Household Size | Owner-occupied | Renter-occupied |
| 1-Person Household | 10 (25.6%) | 29 (74.4%) |
| 2-Person Household | 52 (67.5%) | 25 (32.5%) |
| 3-Person Household | 0 (0.0%) | 0 (0.0%) |
| 4+ Person Household | 135 (100.0%) | 0 (0.0%) |
| Total Housing Units | 197 (78.5%) | 54 (21.5%) |
Occupancy by Educational Attainment in Smith River
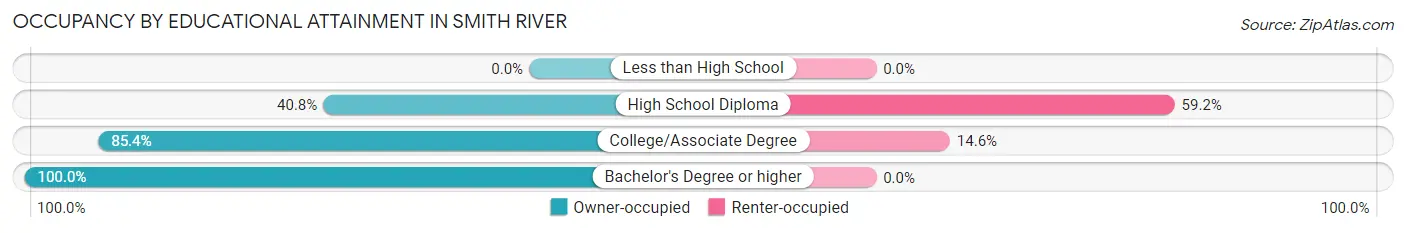
| Household Size | Owner-occupied | Renter-occupied |
| Less than High School | 0 (0.0%) | 0 (0.0%) |
| High School Diploma | 20 (40.8%) | 29 (59.2%) |
| College/Associate Degree | 146 (85.4%) | 25 (14.6%) |
| Bachelor's Degree or higher | 31 (100.0%) | 0 (0.0%) |
Occupancy by Age of Householder in Smith River
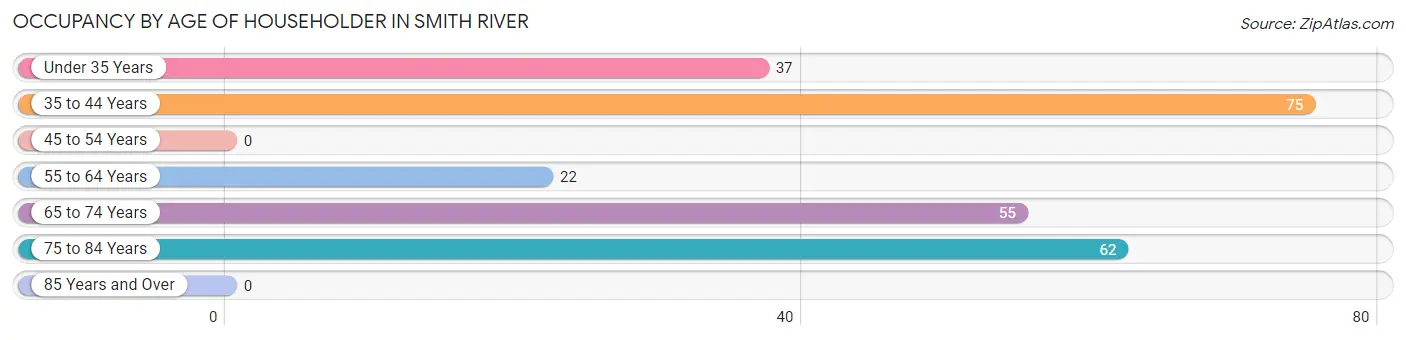
| Age Bracket | # Households | % Households |
| Under 35 Years | 37 | 14.7% |
| 35 to 44 Years | 75 | 29.9% |
| 45 to 54 Years | 0 | 0.0% |
| 55 to 64 Years | 22 | 8.8% |
| 65 to 74 Years | 55 | 21.9% |
| 75 to 84 Years | 62 | 24.7% |
| 85 Years and Over | 0 | 0.0% |
| Total | 251 | 100.0% |
Housing Finances in Smith River
Median Income by Occupancy in Smith River
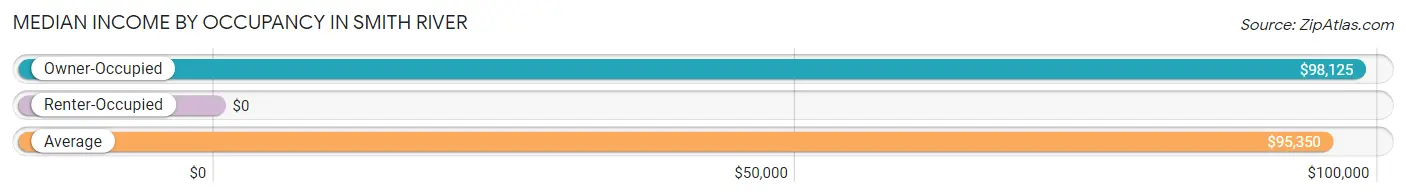
| Occupancy Type | # Households | Median Income |
| Owner-Occupied | 197 (78.5%) | $98,125 |
| Renter-Occupied | 54 (21.5%) | $0 |
| Average | 251 (100.0%) | $95,350 |
Occupancy by Householder Income Bracket in Smith River
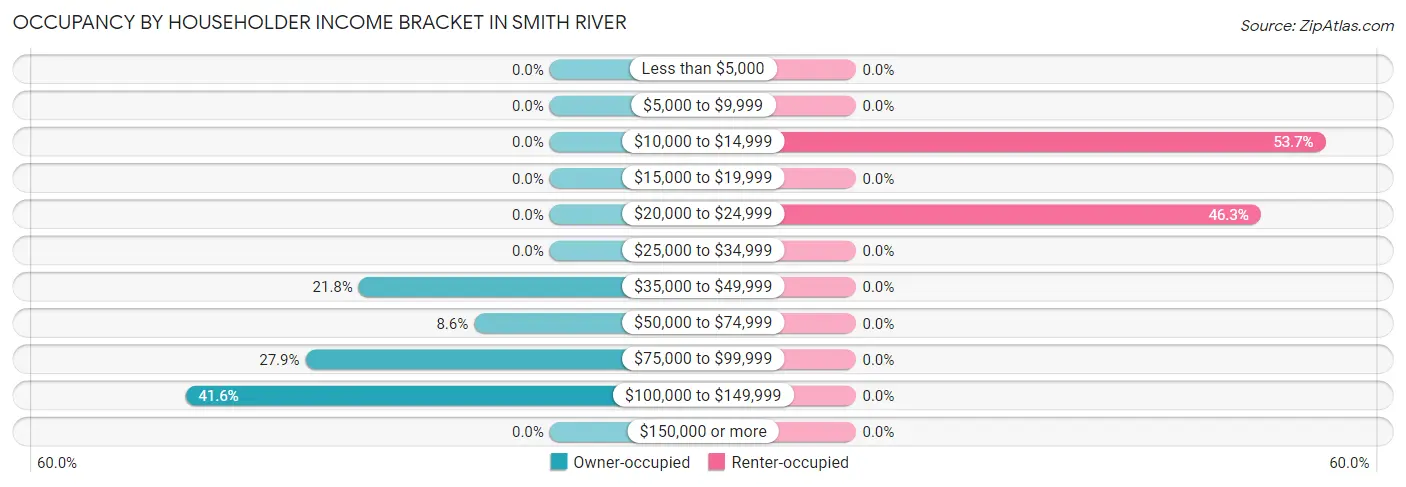
| Income Bracket | Owner-occupied | Renter-occupied |
| Less than $5,000 | 0 (0.0%) | 0 (0.0%) |
| $5,000 to $9,999 | 0 (0.0%) | 0 (0.0%) |
| $10,000 to $14,999 | 0 (0.0%) | 29 (53.7%) |
| $15,000 to $19,999 | 0 (0.0%) | 0 (0.0%) |
| $20,000 to $24,999 | 0 (0.0%) | 25 (46.3%) |
| $25,000 to $34,999 | 0 (0.0%) | 0 (0.0%) |
| $35,000 to $49,999 | 43 (21.8%) | 0 (0.0%) |
| $50,000 to $74,999 | 17 (8.6%) | 0 (0.0%) |
| $75,000 to $99,999 | 55 (27.9%) | 0 (0.0%) |
| $100,000 to $149,999 | 82 (41.6%) | 0 (0.0%) |
| $150,000 or more | 0 (0.0%) | 0 (0.0%) |
| Total | 197 (100.0%) | 54 (100.0%) |
Monthly Housing Cost Tiers in Smith River
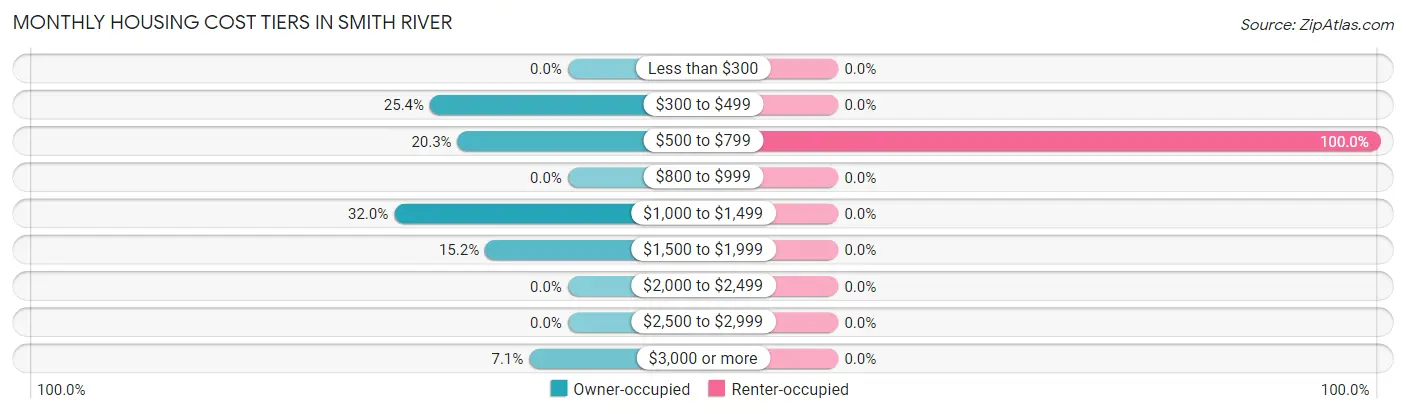
| Monthly Cost | Owner-occupied | Renter-occupied |
| Less than $300 | 0 (0.0%) | 0 (0.0%) |
| $300 to $499 | 50 (25.4%) | 0 (0.0%) |
| $500 to $799 | 40 (20.3%) | 54 (100.0%) |
| $800 to $999 | 0 (0.0%) | 0 (0.0%) |
| $1,000 to $1,499 | 63 (32.0%) | 0 (0.0%) |
| $1,500 to $1,999 | 30 (15.2%) | 0 (0.0%) |
| $2,000 to $2,499 | 0 (0.0%) | 0 (0.0%) |
| $2,500 to $2,999 | 0 (0.0%) | 0 (0.0%) |
| $3,000 or more | 14 (7.1%) | 0 (0.0%) |
| Total | 197 (100.0%) | 54 (100.0%) |
Physical Housing Characteristics in Smith River
Housing Structures in Smith River
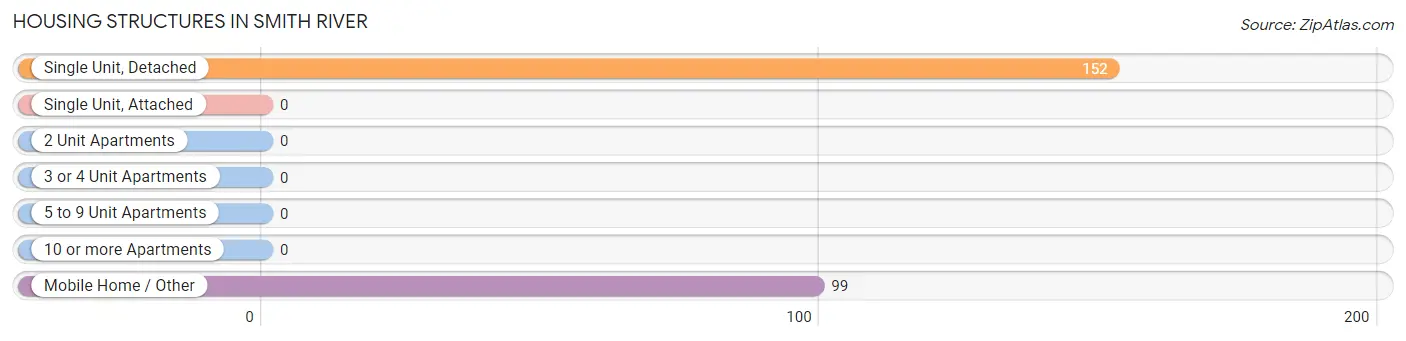
| Structure Type | # Housing Units | % Housing Units |
| Single Unit, Detached | 152 | 60.6% |
| Single Unit, Attached | 0 | 0.0% |
| 2 Unit Apartments | 0 | 0.0% |
| 3 or 4 Unit Apartments | 0 | 0.0% |
| 5 to 9 Unit Apartments | 0 | 0.0% |
| 10 or more Apartments | 0 | 0.0% |
| Mobile Home / Other | 99 | 39.4% |
| Total | 251 | 100.0% |
Housing Structures by Occupancy in Smith River
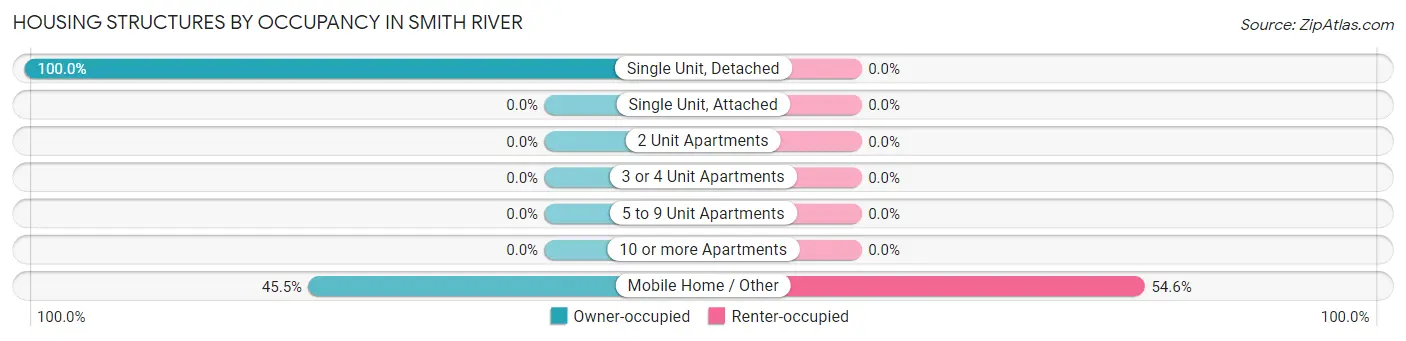
| Structure Type | Owner-occupied | Renter-occupied |
| Single Unit, Detached | 152 (100.0%) | 0 (0.0%) |
| Single Unit, Attached | 0 (0.0%) | 0 (0.0%) |
| 2 Unit Apartments | 0 (0.0%) | 0 (0.0%) |
| 3 or 4 Unit Apartments | 0 (0.0%) | 0 (0.0%) |
| 5 to 9 Unit Apartments | 0 (0.0%) | 0 (0.0%) |
| 10 or more Apartments | 0 (0.0%) | 0 (0.0%) |
| Mobile Home / Other | 45 (45.5%) | 54 (54.5%) |
| Total | 197 (78.5%) | 54 (21.5%) |
Housing Structures by Number of Rooms in Smith River
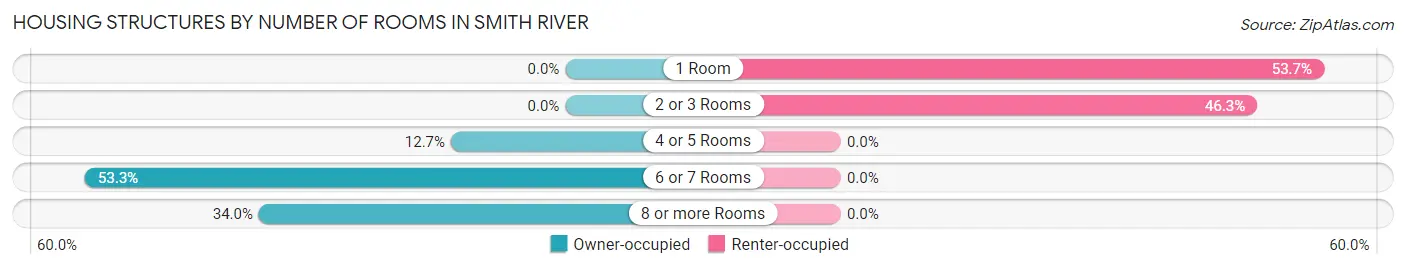
| Number of Rooms | Owner-occupied | Renter-occupied |
| 1 Room | 0 (0.0%) | 29 (53.7%) |
| 2 or 3 Rooms | 0 (0.0%) | 25 (46.3%) |
| 4 or 5 Rooms | 25 (12.7%) | 0 (0.0%) |
| 6 or 7 Rooms | 105 (53.3%) | 0 (0.0%) |
| 8 or more Rooms | 67 (34.0%) | 0 (0.0%) |
| Total | 197 (100.0%) | 54 (100.0%) |
Housing Structure by Heating Type in Smith River
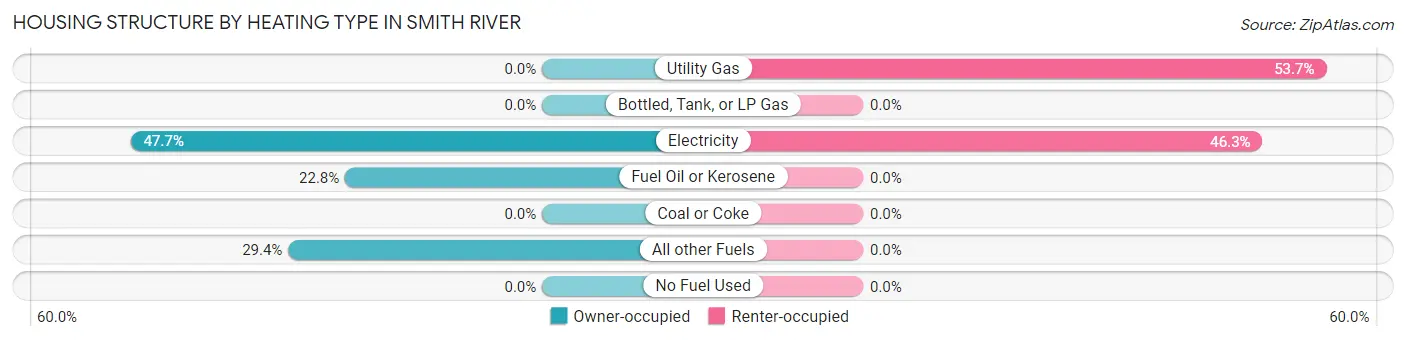
| Heating Type | Owner-occupied | Renter-occupied |
| Utility Gas | 0 (0.0%) | 29 (53.7%) |
| Bottled, Tank, or LP Gas | 0 (0.0%) | 0 (0.0%) |
| Electricity | 94 (47.7%) | 25 (46.3%) |
| Fuel Oil or Kerosene | 45 (22.8%) | 0 (0.0%) |
| Coal or Coke | 0 (0.0%) | 0 (0.0%) |
| All other Fuels | 58 (29.4%) | 0 (0.0%) |
| No Fuel Used | 0 (0.0%) | 0 (0.0%) |
| Total | 197 (100.0%) | 54 (100.0%) |
Household Vehicle Usage in Smith River
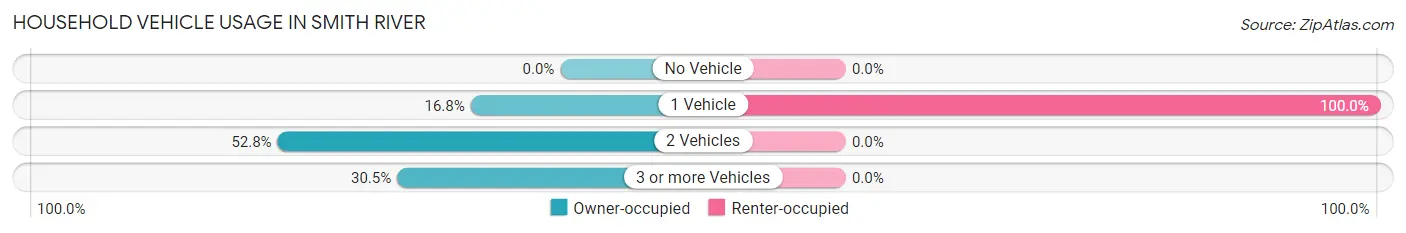
| Vehicles per Household | Owner-occupied | Renter-occupied |
| No Vehicle | 0 (0.0%) | 0 (0.0%) |
| 1 Vehicle | 33 (16.8%) | 54 (100.0%) |
| 2 Vehicles | 104 (52.8%) | 0 (0.0%) |
| 3 or more Vehicles | 60 (30.5%) | 0 (0.0%) |
| Total | 197 (100.0%) | 54 (100.0%) |
Real Estate & Mortgages in Smith River
Real Estate and Mortgage Overview in Smith River
| Characteristic | Without Mortgage | With Mortgage |
| Housing Units | 90 | 107 |
| Median Property Value | $375,700 | $290,600 |
| Median Household Income | - | - |
| Monthly Housing Costs | $486 | $14 |
| Real Estate Taxes | $1,558 | $0 |
Property Value by Mortgage Status in Smith River
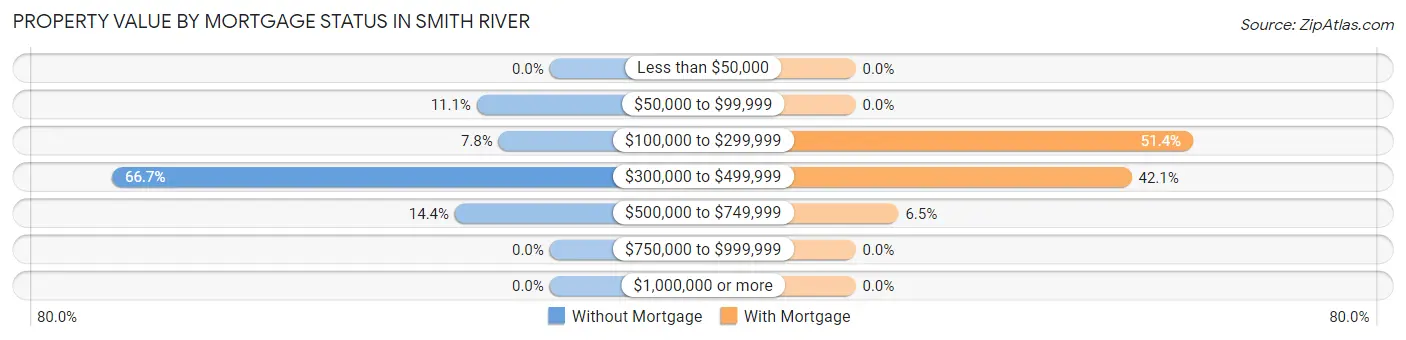
| Property Value | Without Mortgage | With Mortgage |
| Less than $50,000 | 0 (0.0%) | 0 (0.0%) |
| $50,000 to $99,999 | 10 (11.1%) | 0 (0.0%) |
| $100,000 to $299,999 | 7 (7.8%) | 55 (51.4%) |
| $300,000 to $499,999 | 60 (66.7%) | 45 (42.1%) |
| $500,000 to $749,999 | 13 (14.4%) | 7 (6.5%) |
| $750,000 to $999,999 | 0 (0.0%) | 0 (0.0%) |
| $1,000,000 or more | 0 (0.0%) | 0 (0.0%) |
| Total | 90 (100.0%) | 107 (100.0%) |
Household Income by Mortgage Status in Smith River
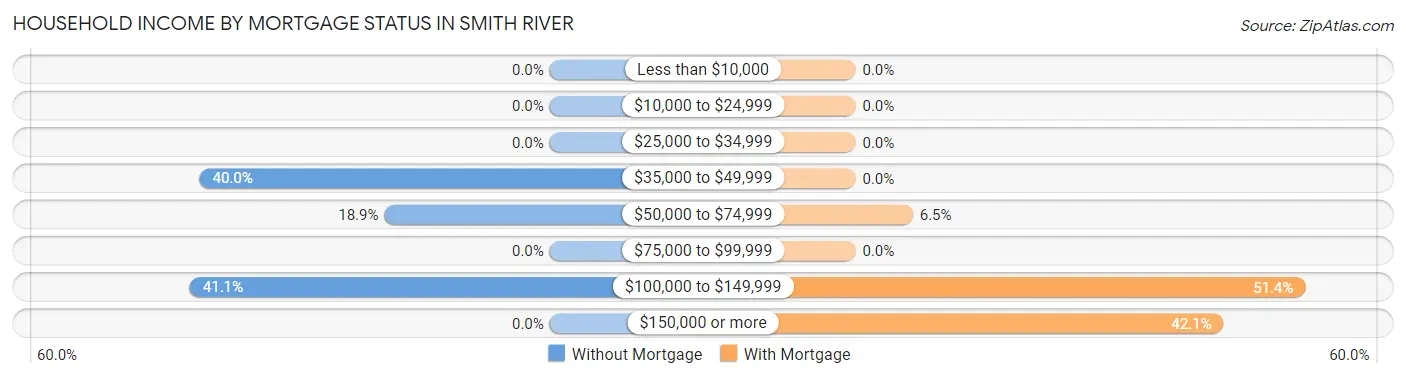
| Household Income | Without Mortgage | With Mortgage |
| Less than $10,000 | 0 (0.0%) | 0 (0.0%) |
| $10,000 to $24,999 | 0 (0.0%) | 0 (0.0%) |
| $25,000 to $34,999 | 0 (0.0%) | 0 (0.0%) |
| $35,000 to $49,999 | 36 (40.0%) | 0 (0.0%) |
| $50,000 to $74,999 | 17 (18.9%) | 7 (6.5%) |
| $75,000 to $99,999 | 0 (0.0%) | 0 (0.0%) |
| $100,000 to $149,999 | 37 (41.1%) | 55 (51.4%) |
| $150,000 or more | 0 (0.0%) | 45 (42.1%) |
| Total | 90 (100.0%) | 107 (100.0%) |
Property Value to Household Income Ratio in Smith River
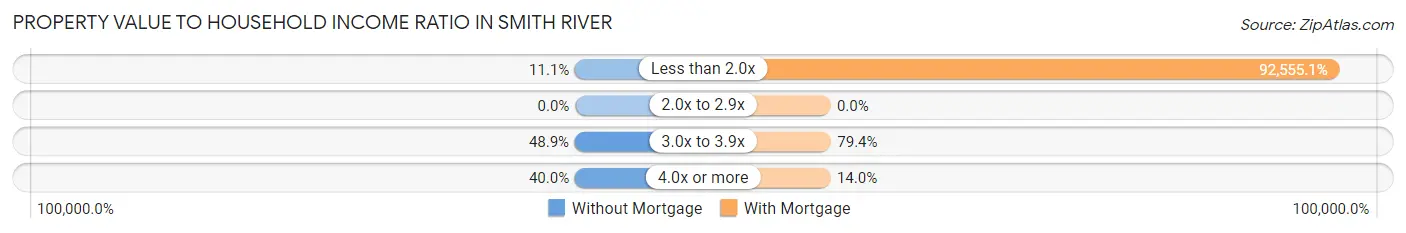
| Value-to-Income Ratio | Without Mortgage | With Mortgage |
| Less than 2.0x | 10 (11.1%) | 99,034 (92,555.1%) |
| 2.0x to 2.9x | 0 (0.0%) | 0 (0.0%) |
| 3.0x to 3.9x | 44 (48.9%) | 85 (79.4%) |
| 4.0x or more | 36 (40.0%) | 15 (14.0%) |
| Total | 90 (100.0%) | 107 (100.0%) |
Real Estate Taxes by Mortgage Status in Smith River
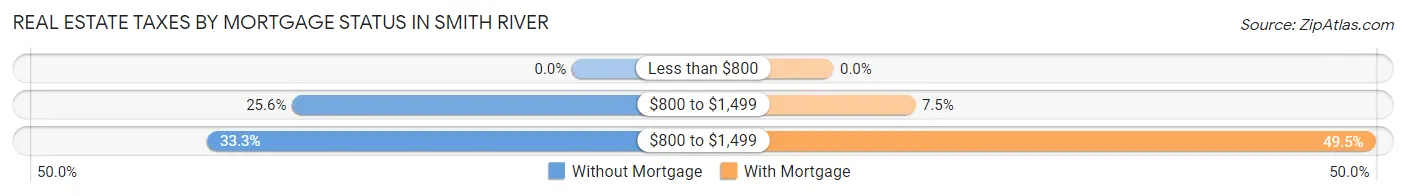
| Property Taxes | Without Mortgage | With Mortgage |
| Less than $800 | 0 (0.0%) | 0 (0.0%) |
| $800 to $1,499 | 23 (25.6%) | 8 (7.5%) |
| $800 to $1,499 | 30 (33.3%) | 53 (49.5%) |
| Total | 90 (100.0%) | 107 (100.0%) |
Health & Disability in Smith River
Health Insurance Coverage by Age in Smith River
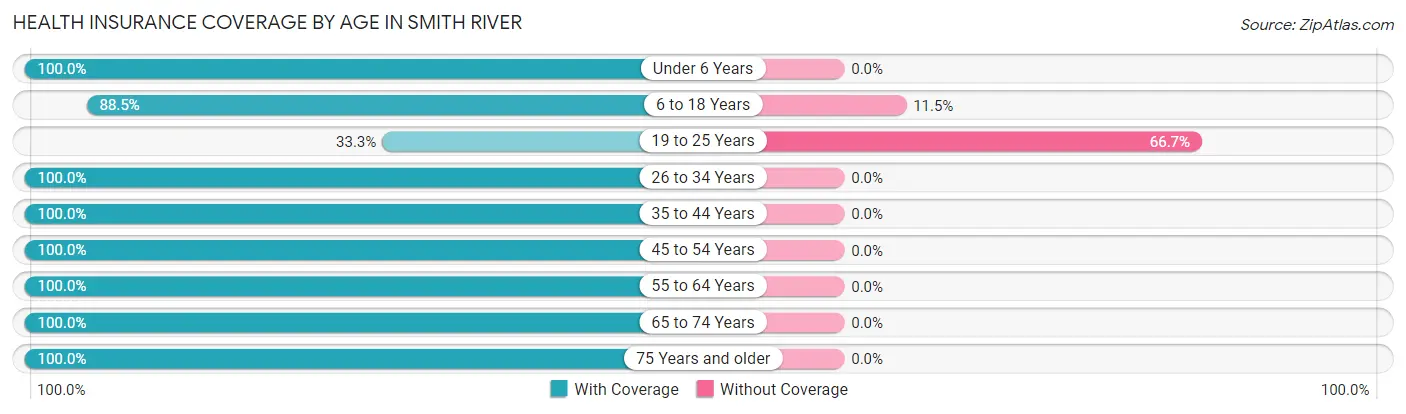
| Age Bracket | With Coverage | Without Coverage |
| Under 6 Years | 51 (100.0%) | 0 (0.0%) |
| 6 to 18 Years | 276 (88.5%) | 36 (11.5%) |
| 19 to 25 Years | 23 (33.3%) | 46 (66.7%) |
| 26 to 34 Years | 58 (100.0%) | 0 (0.0%) |
| 35 to 44 Years | 129 (100.0%) | 0 (0.0%) |
| 45 to 54 Years | 30 (100.0%) | 0 (0.0%) |
| 55 to 64 Years | 66 (100.0%) | 0 (0.0%) |
| 65 to 74 Years | 72 (100.0%) | 0 (0.0%) |
| 75 Years and older | 62 (100.0%) | 0 (0.0%) |
| Total | 767 (90.3%) | 82 (9.7%) |
Health Insurance Coverage by Citizenship Status in Smith River
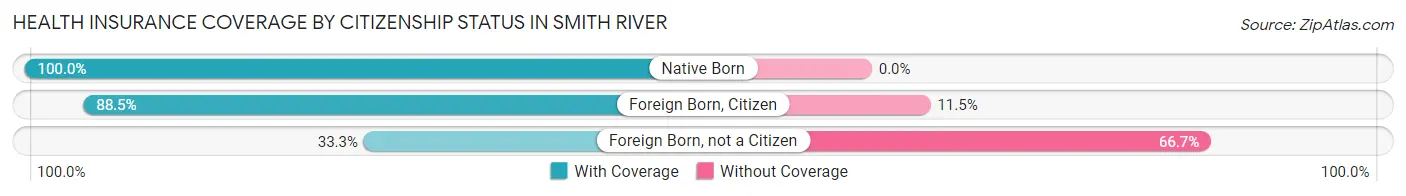
| Citizenship Status | With Coverage | Without Coverage |
| Native Born | 51 (100.0%) | 0 (0.0%) |
| Foreign Born, Citizen | 276 (88.5%) | 36 (11.5%) |
| Foreign Born, not a Citizen | 23 (33.3%) | 46 (66.7%) |
Health Insurance Coverage by Household Income in Smith River
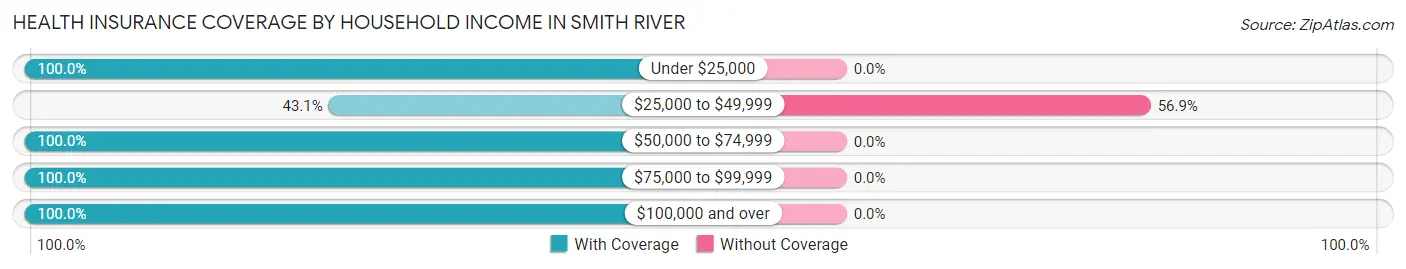
| Household Income | With Coverage | Without Coverage |
| Under $25,000 | 78 (100.0%) | 0 (0.0%) |
| $25,000 to $49,999 | 62 (43.1%) | 82 (56.9%) |
| $50,000 to $74,999 | 23 (100.0%) | 0 (0.0%) |
| $75,000 to $99,999 | 289 (100.0%) | 0 (0.0%) |
| $100,000 and over | 315 (100.0%) | 0 (0.0%) |
Public vs Private Health Insurance Coverage by Age in Smith River
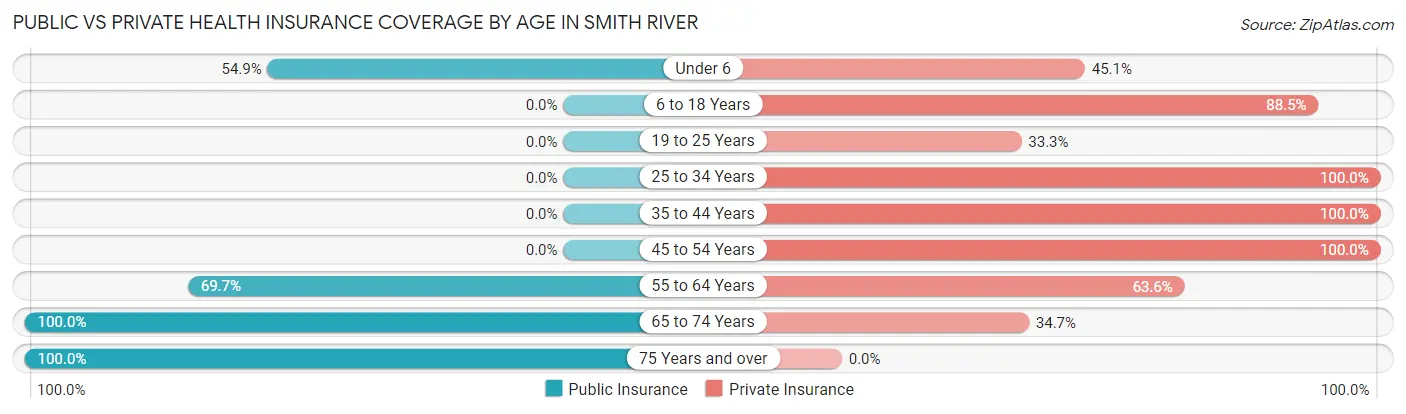
| Age Bracket | Public Insurance | Private Insurance |
| Under 6 | 28 (54.9%) | 23 (45.1%) |
| 6 to 18 Years | 0 (0.0%) | 276 (88.5%) |
| 19 to 25 Years | 0 (0.0%) | 23 (33.3%) |
| 25 to 34 Years | 0 (0.0%) | 58 (100.0%) |
| 35 to 44 Years | 0 (0.0%) | 129 (100.0%) |
| 45 to 54 Years | 0 (0.0%) | 30 (100.0%) |
| 55 to 64 Years | 46 (69.7%) | 42 (63.6%) |
| 65 to 74 Years | 72 (100.0%) | 25 (34.7%) |
| 75 Years and over | 62 (100.0%) | 0 (0.0%) |
| Total | 208 (24.5%) | 606 (71.4%) |
Disability Status by Sex by Age in Smith River
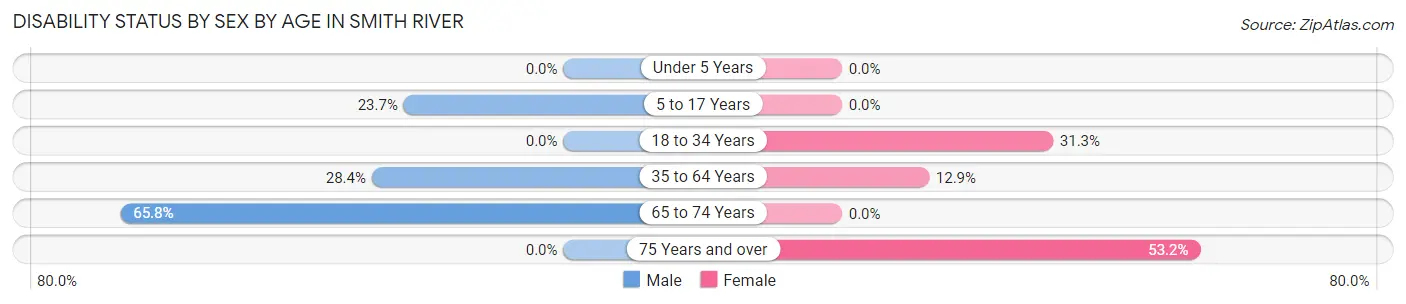
| Age Bracket | Male | Female |
| Under 5 Years | 0 (0.0%) | 0 (0.0%) |
| 5 to 17 Years | 32 (23.7%) | 0 (0.0%) |
| 18 to 34 Years | 0 (0.0%) | 21 (31.3%) |
| 35 to 64 Years | 31 (28.4%) | 15 (12.9%) |
| 65 to 74 Years | 25 (65.8%) | 0 (0.0%) |
| 75 Years and over | 0 (0.0%) | 33 (53.2%) |
Disability Class by Sex by Age in Smith River
Disability Class: Hearing Difficulty
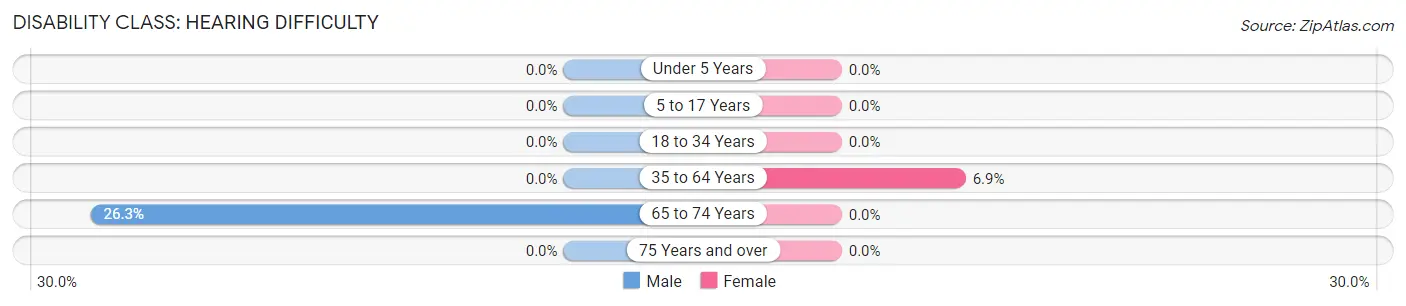
| Age Bracket | Male | Female |
| Under 5 Years | 0 (0.0%) | 0 (0.0%) |
| 5 to 17 Years | 0 (0.0%) | 0 (0.0%) |
| 18 to 34 Years | 0 (0.0%) | 0 (0.0%) |
| 35 to 64 Years | 0 (0.0%) | 8 (6.9%) |
| 65 to 74 Years | 10 (26.3%) | 0 (0.0%) |
| 75 Years and over | 0 (0.0%) | 0 (0.0%) |
Disability Class: Vision Difficulty
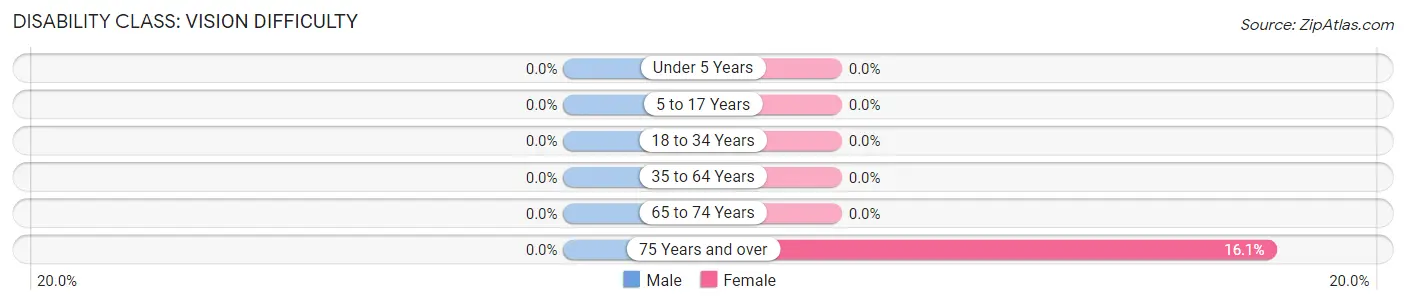
| Age Bracket | Male | Female |
| Under 5 Years | 0 (0.0%) | 0 (0.0%) |
| 5 to 17 Years | 0 (0.0%) | 0 (0.0%) |
| 18 to 34 Years | 0 (0.0%) | 0 (0.0%) |
| 35 to 64 Years | 0 (0.0%) | 0 (0.0%) |
| 65 to 74 Years | 0 (0.0%) | 0 (0.0%) |
| 75 Years and over | 0 (0.0%) | 10 (16.1%) |
Disability Class: Cognitive Difficulty
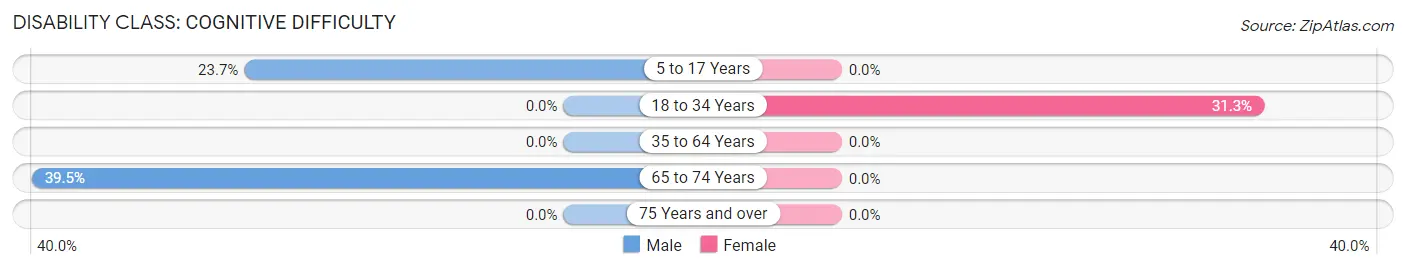
| Age Bracket | Male | Female |
| 5 to 17 Years | 32 (23.7%) | 0 (0.0%) |
| 18 to 34 Years | 0 (0.0%) | 21 (31.3%) |
| 35 to 64 Years | 0 (0.0%) | 0 (0.0%) |
| 65 to 74 Years | 15 (39.5%) | 0 (0.0%) |
| 75 Years and over | 0 (0.0%) | 0 (0.0%) |
Disability Class: Ambulatory Difficulty
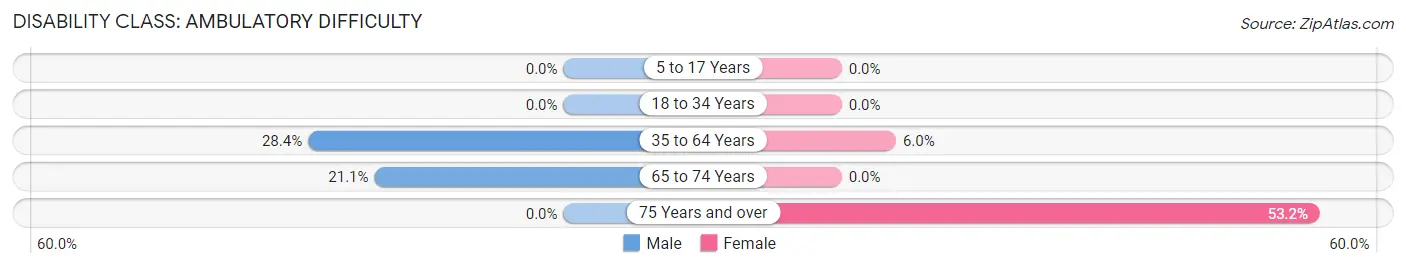
| Age Bracket | Male | Female |
| 5 to 17 Years | 0 (0.0%) | 0 (0.0%) |
| 18 to 34 Years | 0 (0.0%) | 0 (0.0%) |
| 35 to 64 Years | 31 (28.4%) | 7 (6.0%) |
| 65 to 74 Years | 8 (21.0%) | 0 (0.0%) |
| 75 Years and over | 0 (0.0%) | 33 (53.2%) |
Disability Class: Self-Care Difficulty
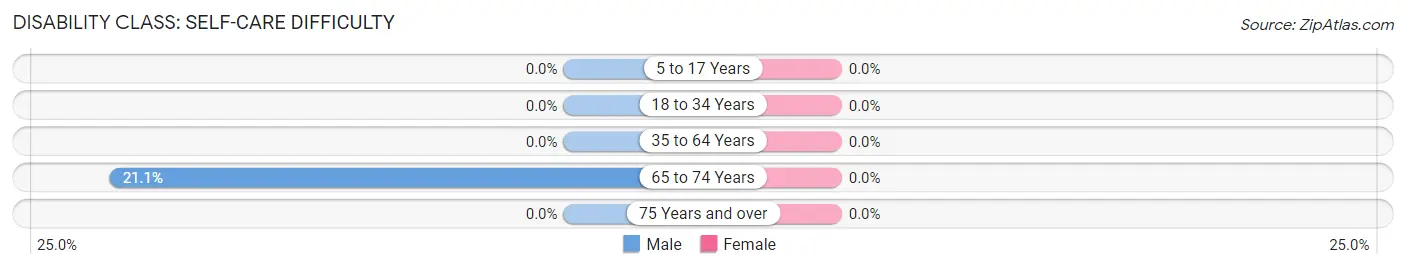
| Age Bracket | Male | Female |
| 5 to 17 Years | 0 (0.0%) | 0 (0.0%) |
| 18 to 34 Years | 0 (0.0%) | 0 (0.0%) |
| 35 to 64 Years | 0 (0.0%) | 0 (0.0%) |
| 65 to 74 Years | 8 (21.0%) | 0 (0.0%) |
| 75 Years and over | 0 (0.0%) | 0 (0.0%) |
Technology Access in Smith River
Computing Device Access in Smith River
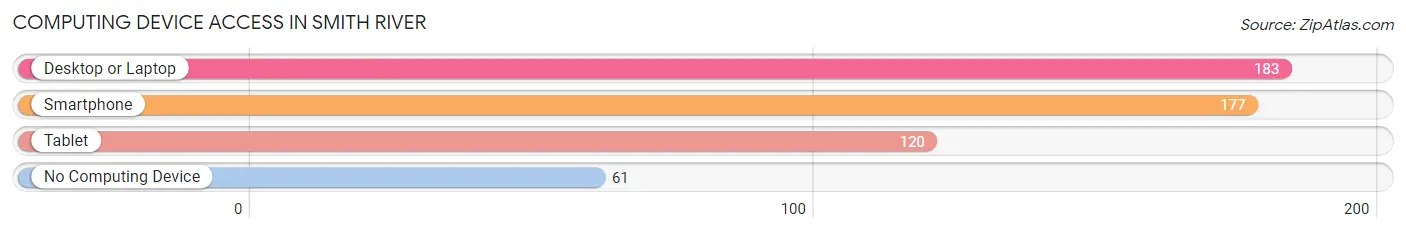
| Device Type | # Households | % Households |
| Desktop or Laptop | 183 | 72.9% |
| Smartphone | 177 | 70.5% |
| Tablet | 120 | 47.8% |
| No Computing Device | 61 | 24.3% |
| Total | 251 | 100.0% |
Internet Access in Smith River
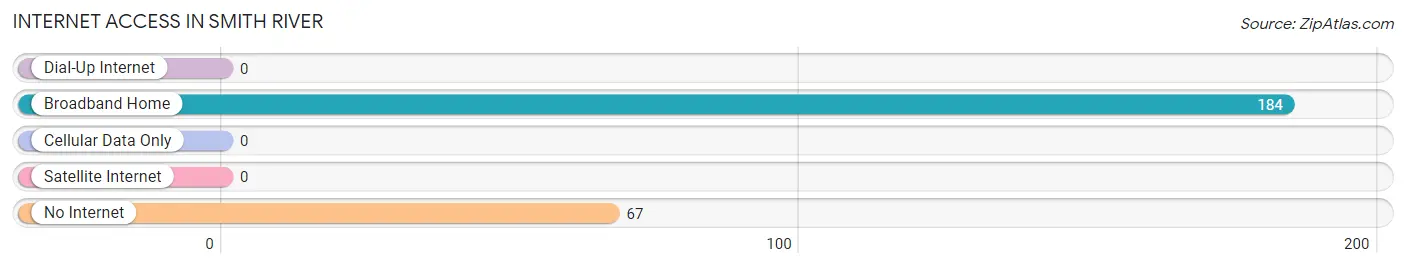
| Internet Type | # Households | % Households |
| Dial-Up Internet | 0 | 0.0% |
| Broadband Home | 184 | 73.3% |
| Cellular Data Only | 0 | 0.0% |
| Satellite Internet | 0 | 0.0% |
| No Internet | 67 | 26.7% |
| Total | 251 | 100.0% |
Smith River Summary
River, CA is a small town located in Del Norte County, California. It is situated on the Smith River, which is the longest river in the state of California. The town has a population of approximately 1,500 people and is located about 25 miles south of the Oregon border.
The town of Smith River was first settled in the late 1800s by a group of settlers from the Midwest. The town was named after the Smith River, which was named after the explorer John Smith. The town was originally a logging and fishing community, but in the early 1900s, it became a popular tourist destination. The town is now known for its scenic beauty and outdoor activities.
Geography
Smith River is located in the northern part of Del Norte County, California. It is situated on the Smith River, which is the longest river in the state of California. The town is surrounded by the Smith River National Recreation Area, which is a protected area of land that includes the Smith River and its tributaries. The town is also located near the Pacific Ocean, which is about 25 miles away.
The town of Smith River is located in a temperate climate zone, with mild winters and warm summers. The average temperature in the summer is around 70 degrees Fahrenheit, and the average temperature in the winter is around 50 degrees Fahrenheit. The town receives an average of about 30 inches of rain per year.
Economy
The economy of Smith River is largely based on tourism and outdoor recreation. The town is home to several fishing and hunting lodges, as well as a number of campgrounds and RV parks. The town is also home to several restaurants and bars, as well as a few small retail stores.
The town is also home to a number of small businesses, including a lumber mill, a boat repair shop, and a few small manufacturing companies. The town is also home to a number of small farms, which produce a variety of fruits and vegetables.
Demographics
The population of Smith River is approximately 1,500 people. The town is predominantly white, with about 90% of the population being Caucasian. The town also has a small Hispanic population, as well as a small African American population. The median household income in the town is around $40,000 per year.
Conclusion
Smith River, CA is a small town located in Del Norte County, California. It is situated on the Smith River, which is the longest river in the state of California. The town has a population of approximately 1,500 people and is known for its scenic beauty and outdoor activities. The economy of Smith River is largely based on tourism and outdoor recreation, and the town is predominantly white, with a small Hispanic and African American population.
Common Questions
What is Per Capita Income in Smith River?
Per Capita income in Smith River is $22,085.
What is the Median Family Income in Smith River?
Median Family Income in Smith River is $98,693.
What is the Median Household income in Smith River?
Median Household Income in Smith River is $95,350.
What is Inequality or Gini Index in Smith River?
Inequality or Gini Index in Smith River is 0.31.
What is the Total Population of Smith River?
Total Population of Smith River is 849.
What is the Total Male Population of Smith River?
Total Male Population of Smith River is 427.
What is the Total Female Population of Smith River?
Total Female Population of Smith River is 422.
What is the Ratio of Males per 100 Females in Smith River?
There are 101.18 Males per 100 Females in Smith River.
What is the Ratio of Females per 100 Males in Smith River?
There are 98.83 Females per 100 Males in Smith River.
What is the Median Population Age in Smith River?
Median Population Age in Smith River is 23.8 Years.
What is the Average Family Size in Smith River
Average Family Size in Smith River is 4.1 People.
What is the Average Household Size in Smith River
Average Household Size in Smith River is 3.4 People.
How Large is the Labor Force in Smith River?
There are 350 People in the Labor Forcein in Smith River.
What is the Percentage of People in the Labor Force in Smith River?
62.4% of People are in the Labor Force in Smith River.
What is the Unemployment Rate in Smith River?
Unemployment Rate in Smith River is 6.0%.