Sebastopol, CA Map & Demographics
Sebastopol Map
Sebastopol Overview
$49,297
PER CAPITA INCOME
$130,865
AVG FAMILY INCOME
$98,185
AVG HOUSEHOLD INCOME
18.0%
WAGE / INCOME GAP [ % ]
82.0¢/ $1
WAGE / INCOME GAP [ $ ]
0.43
INEQUALITY / GINI INDEX
7,503
TOTAL POPULATION
3,436
MALE POPULATION
4,067
FEMALE POPULATION
84.48
MALES / 100 FEMALES
118.36
FEMALES / 100 MALES
48.8
MEDIAN AGE
2.9
AVG FAMILY SIZE
2.3
AVG HOUSEHOLD SIZE
4,000
LABOR FORCE [ PEOPLE ]
62.9%
PERCENT IN LABOR FORCE
5.5%
UNEMPLOYMENT RATE
Sebastopol Zip Codes
Sebastopol Area Codes
Income in Sebastopol
Income Overview in Sebastopol
Per Capita Income in Sebastopol is $49,297, while median incomes of families and households are $130,865 and $98,185 respectively.
| Characteristic | Number | Measure |
| Per Capita Income | 7,503 | $49,297 |
| Median Family Income | 1,967 | $130,865 |
| Mean Family Income | 1,967 | $143,171 |
| Median Household Income | 3,258 | $98,185 |
| Mean Household Income | 3,258 | $114,300 |
| Income Deficit | 1,967 | $0 |
| Wage / Income Gap (%) | 7,503 | 17.96% |
| Wage / Income Gap ($) | 7,503 | 82.04¢ per $1 |
| Gini / Inequality Index | 7,503 | 0.43 |
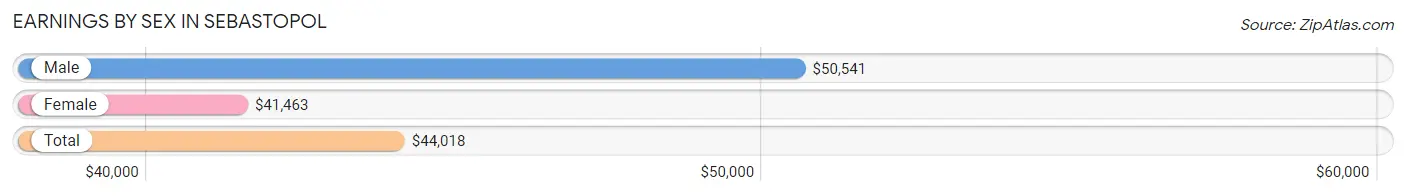
Earnings by Sex in Sebastopol
Average Earnings in Sebastopol are $44,018, $50,541 for men and $41,463 for women, a difference of 18.0%.
| Sex | Number | Average Earnings |
| Male | 2,138 (50.2%) | $50,541 |
| Female | 2,124 (49.8%) | $41,463 |
| Total | 4,262 (100.0%) | $44,018 |
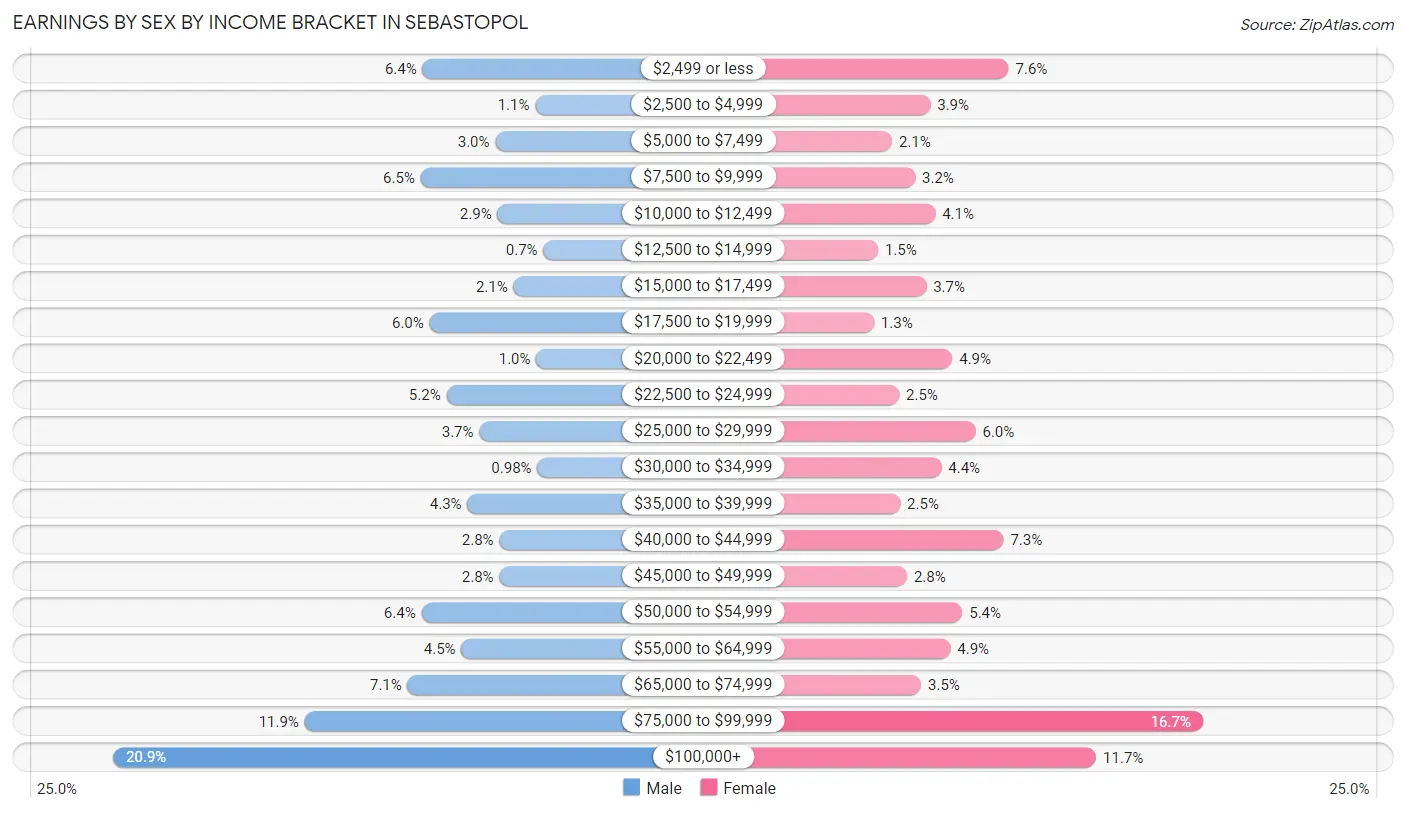
Earnings by Sex by Income Bracket in Sebastopol
The most common earnings brackets in Sebastopol are $100,000+ for men (446 | 20.9%) and $75,000 to $99,999 for women (354 | 16.7%).
| Income | Male | Female |
| $2,499 or less | 136 (6.4%) | 161 (7.6%) |
| $2,500 to $4,999 | 23 (1.1%) | 83 (3.9%) |
| $5,000 to $7,499 | 63 (2.9%) | 45 (2.1%) |
| $7,500 to $9,999 | 138 (6.5%) | 68 (3.2%) |
| $10,000 to $12,499 | 61 (2.9%) | 88 (4.1%) |
| $12,500 to $14,999 | 15 (0.7%) | 31 (1.5%) |
| $15,000 to $17,499 | 45 (2.1%) | 79 (3.7%) |
| $17,500 to $19,999 | 129 (6.0%) | 27 (1.3%) |
| $20,000 to $22,499 | 22 (1.0%) | 105 (4.9%) |
| $22,500 to $24,999 | 112 (5.2%) | 52 (2.5%) |
| $25,000 to $29,999 | 79 (3.7%) | 128 (6.0%) |
| $30,000 to $34,999 | 21 (1.0%) | 94 (4.4%) |
| $35,000 to $39,999 | 91 (4.3%) | 53 (2.5%) |
| $40,000 to $44,999 | 59 (2.8%) | 156 (7.3%) |
| $45,000 to $49,999 | 59 (2.8%) | 60 (2.8%) |
| $50,000 to $54,999 | 137 (6.4%) | 115 (5.4%) |
| $55,000 to $64,999 | 97 (4.5%) | 103 (4.9%) |
| $65,000 to $74,999 | 151 (7.1%) | 74 (3.5%) |
| $75,000 to $99,999 | 254 (11.9%) | 354 (16.7%) |
| $100,000+ | 446 (20.9%) | 248 (11.7%) |
| Total | 2,138 (100.0%) | 2,124 (100.0%) |
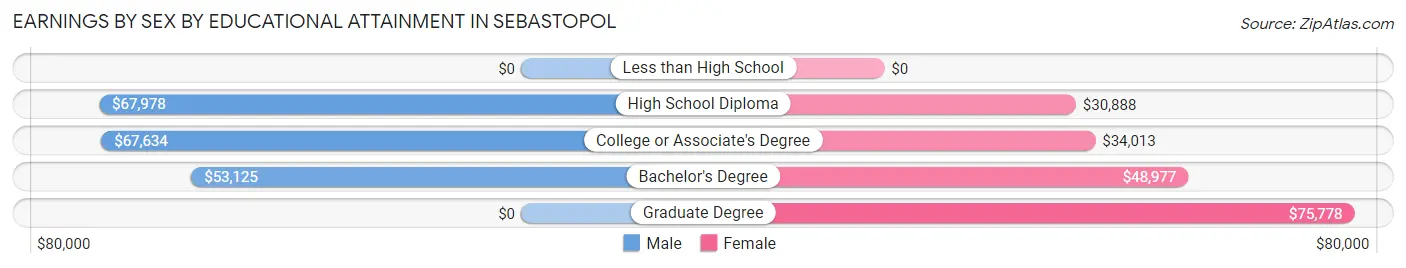
Earnings by Sex by Educational Attainment in Sebastopol
Average earnings in Sebastopol are $60,132 for men and $43,564 for women, a difference of 27.6%. Men with an educational attainment of high school diploma enjoy the highest average annual earnings of $67,978, while those with bachelor's degree education earn the least with $53,125. Women with an educational attainment of graduate degree earn the most with the average annual earnings of $75,778, while those with high school diploma education have the smallest earnings of $30,888.
| Educational Attainment | Male Income | Female Income |
| Less than High School | - | - |
| High School Diploma | $67,978 | $30,888 |
| College or Associate's Degree | $67,634 | $34,013 |
| Bachelor's Degree | $53,125 | $48,977 |
| Graduate Degree | - | - |
| Total | $60,132 | $43,564 |
Family Income in Sebastopol
Family Income Brackets in Sebastopol
According to the Sebastopol family income data, there are 513 families falling into the $100,000 to $149,999 income range, which is the most common income bracket and makes up 26.1% of all families.
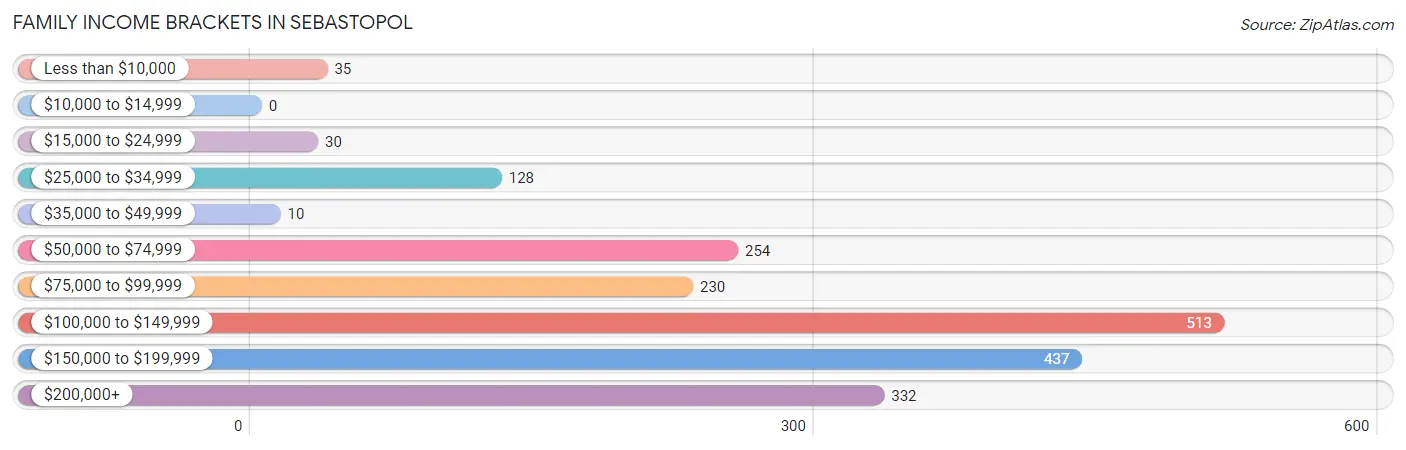
| Income Bracket | # Families | % Families |
| Less than $10,000 | 35 | 1.8% |
| $10,000 to $14,999 | 0 | 0.0% |
| $15,000 to $24,999 | 30 | 1.5% |
| $25,000 to $34,999 | 128 | 6.5% |
| $35,000 to $49,999 | 10 | 0.5% |
| $50,000 to $74,999 | 254 | 12.9% |
| $75,000 to $99,999 | 230 | 11.7% |
| $100,000 to $149,999 | 513 | 26.1% |
| $150,000 to $199,999 | 437 | 22.2% |
| $200,000+ | 332 | 16.9% |
Family Income by Famaliy Size in Sebastopol
4-person families (424 | 21.6%) account for the highest median family income in Sebastopol with $171,384 per family, while 2-person families (994 | 50.5%) have the highest median income of $51,875 per family member.
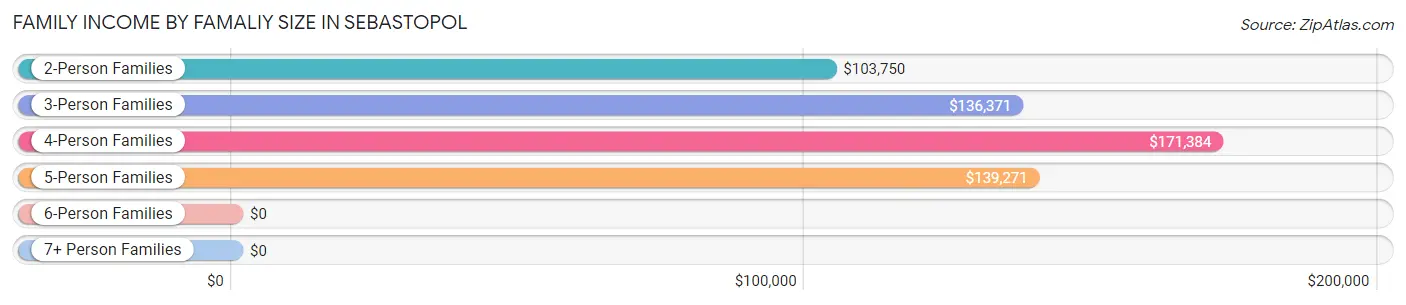
| Income Bracket | # Families | Median Income |
| 2-Person Families | 994 (50.5%) | $103,750 |
| 3-Person Families | 424 (21.6%) | $136,371 |
| 4-Person Families | 424 (21.6%) | $171,384 |
| 5-Person Families | 41 (2.1%) | $139,271 |
| 6-Person Families | 0 (0.0%) | $0 |
| 7+ Person Families | 84 (4.3%) | $0 |
| Total | 1,967 (100.0%) | $130,865 |
Family Income by Number of Earners in Sebastopol
The median family income in Sebastopol is $130,865, with families comprising 3+ earners (323) having the highest median family income of $171,714, while families with 1 earner (563) have the lowest median family income of $76,587, accounting for 16.4% and 28.6% of families, respectively.
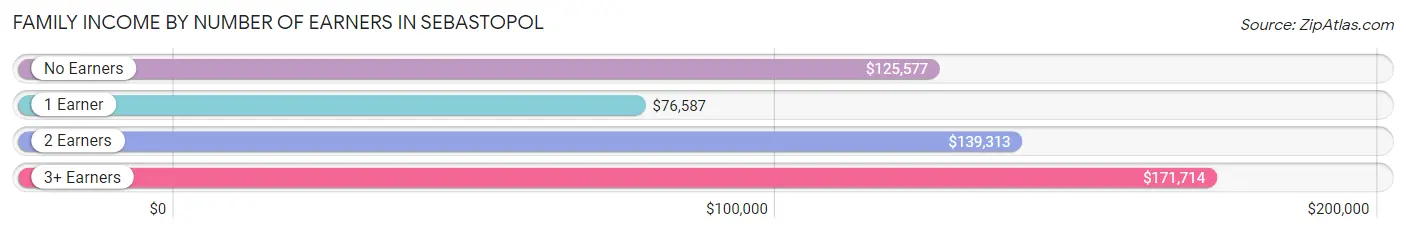
| Number of Earners | # Families | Median Income |
| No Earners | 180 (9.1%) | $125,577 |
| 1 Earner | 563 (28.6%) | $76,587 |
| 2 Earners | 901 (45.8%) | $139,313 |
| 3+ Earners | 323 (16.4%) | $171,714 |
| Total | 1,967 (100.0%) | $130,865 |
Household Income in Sebastopol
Household Income Brackets in Sebastopol
With 661 households falling in the category, the $100,000 to $149,999 income range is the most frequent in Sebastopol, accounting for 20.3% of all households. In contrast, only 65 households (2.0%) fall into the $10,000 to $14,999 income bracket, making it the least populous group.
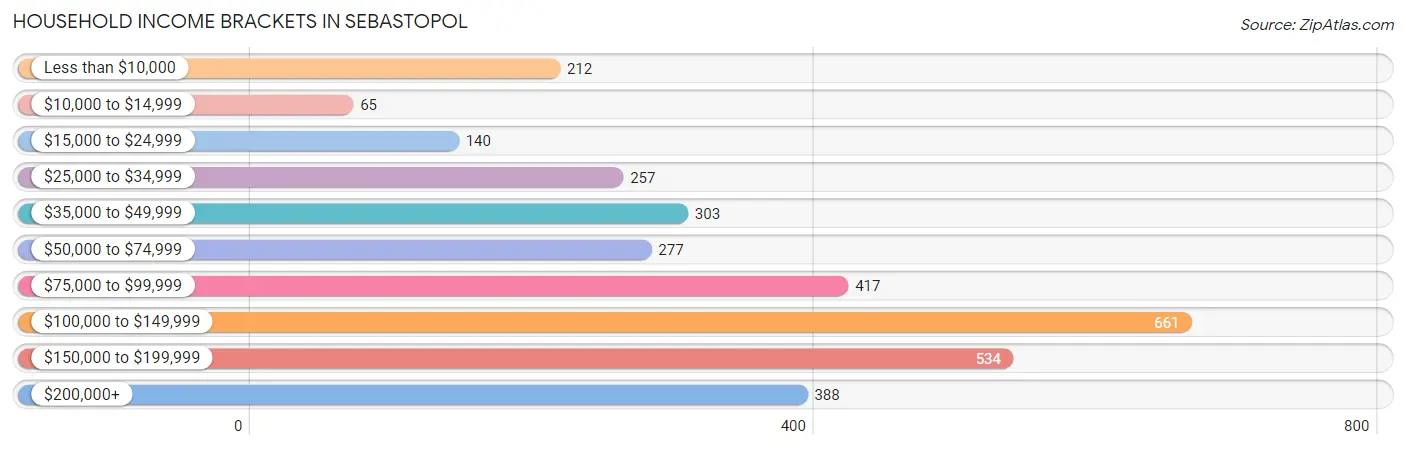
| Income Bracket | # Households | % Households |
| Less than $10,000 | 212 | 6.5% |
| $10,000 to $14,999 | 65 | 2.0% |
| $15,000 to $24,999 | 140 | 4.3% |
| $25,000 to $34,999 | 257 | 7.9% |
| $35,000 to $49,999 | 303 | 9.3% |
| $50,000 to $74,999 | 277 | 8.5% |
| $75,000 to $99,999 | 417 | 12.8% |
| $100,000 to $149,999 | 661 | 20.3% |
| $150,000 to $199,999 | 534 | 16.4% |
| $200,000+ | 388 | 11.9% |
Household Income by Householder Age in Sebastopol
The median household income in Sebastopol is $98,185, with the highest median household income of $111,719 found in the 45 to 64 years age bracket for the primary householder. A total of 1,353 households (41.5%) fall into this category. Meanwhile, the 15 to 24 years age bracket for the primary householder has the lowest median household income of $0, with 28 households (0.9%) in this group.
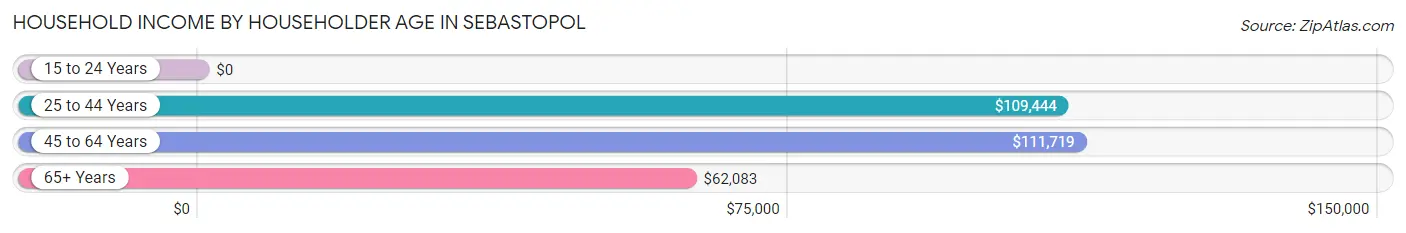
| Income Bracket | # Households | Median Income |
| 15 to 24 Years | 28 (0.9%) | $0 |
| 25 to 44 Years | 712 (21.8%) | $109,444 |
| 45 to 64 Years | 1,353 (41.5%) | $111,719 |
| 65+ Years | 1,165 (35.8%) | $62,083 |
| Total | 3,258 (100.0%) | $98,185 |
Poverty in Sebastopol
Income Below Poverty by Sex and Age in Sebastopol
With 9.5% poverty level for males and 7.2% for females among the residents of Sebastopol, 12 to 14 year old males and 75 year old and over females are the most vulnerable to poverty, with 30 males (22.2%) and 103 females (30.6%) in their respective age groups living below the poverty level.
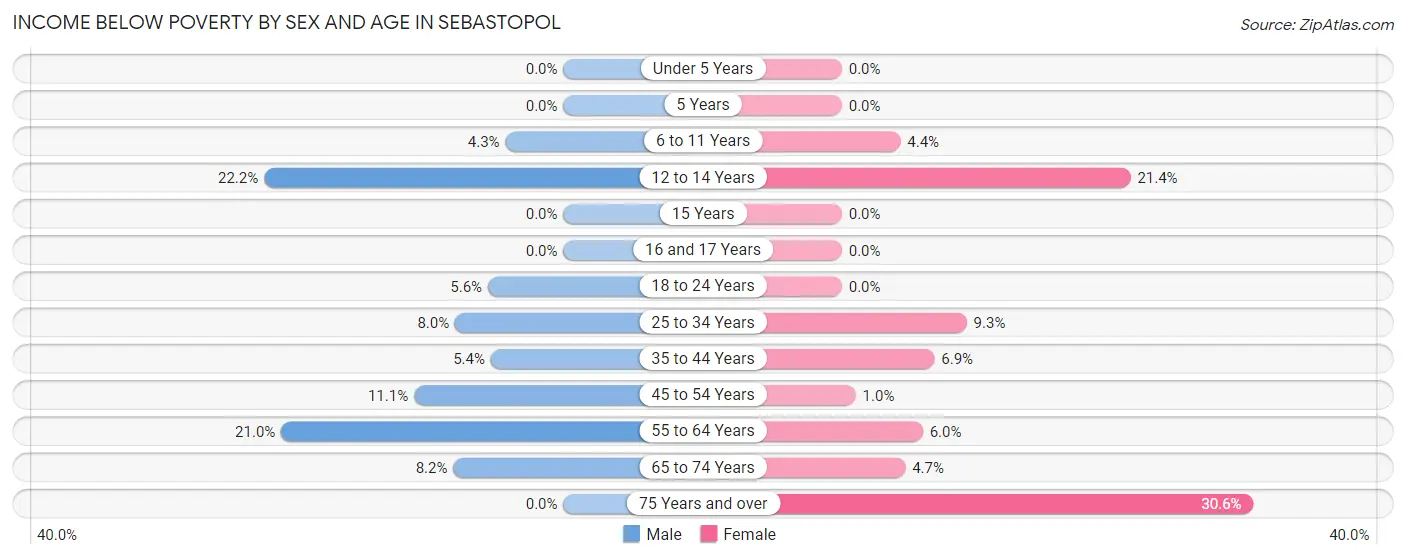
| Age Bracket | Male | Female |
| Under 5 Years | 0 (0.0%) | 0 (0.0%) |
| 5 Years | 0 (0.0%) | 0 (0.0%) |
| 6 to 11 Years | 8 (4.3%) | 12 (4.3%) |
| 12 to 14 Years | 30 (22.2%) | 27 (21.4%) |
| 15 Years | 0 (0.0%) | 0 (0.0%) |
| 16 and 17 Years | 0 (0.0%) | 0 (0.0%) |
| 18 to 24 Years | 21 (5.6%) | 0 (0.0%) |
| 25 to 34 Years | 36 (8.0%) | 42 (9.3%) |
| 35 to 44 Years | 16 (5.4%) | 27 (6.9%) |
| 45 to 54 Years | 53 (11.1%) | 6 (1.0%) |
| 55 to 64 Years | 106 (20.9%) | 36 (6.0%) |
| 65 to 74 Years | 51 (8.2%) | 35 (4.7%) |
| 75 Years and over | 0 (0.0%) | 103 (30.6%) |
| Total | 321 (9.5%) | 288 (7.2%) |
Income Above Poverty by Sex and Age in Sebastopol
According to the poverty statistics in Sebastopol, males aged under 5 years and females aged under 5 years are the age groups that are most secure financially, with 100.0% of males and 100.0% of females in these age groups living above the poverty line.
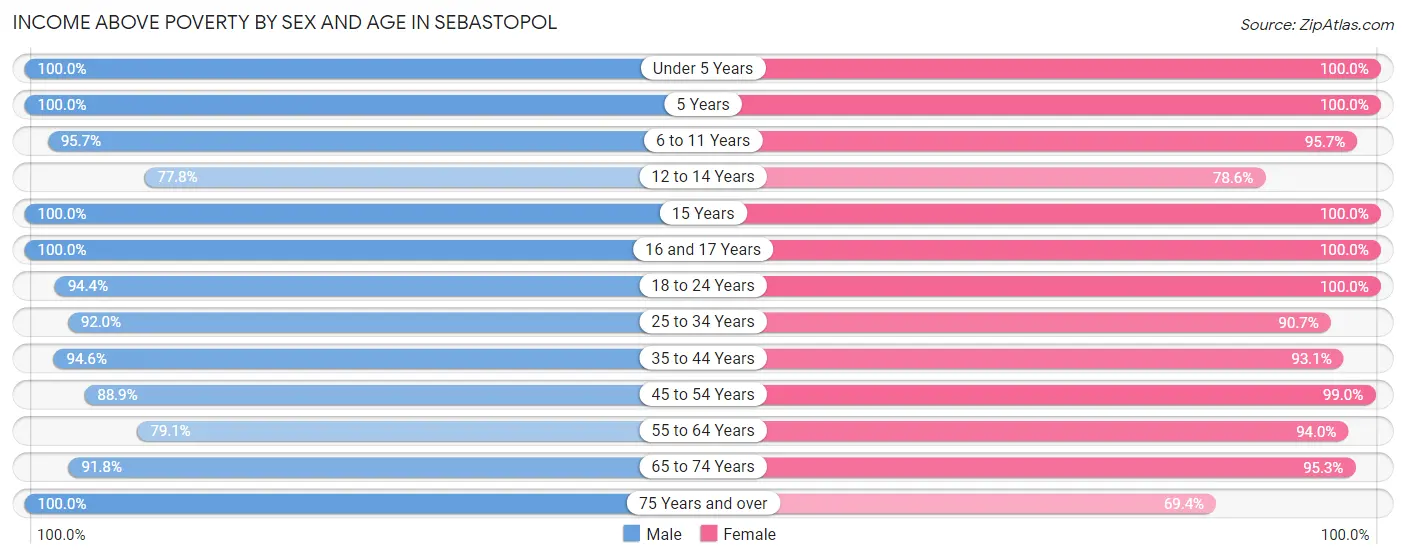
| Age Bracket | Male | Female |
| Under 5 Years | 148 (100.0%) | 152 (100.0%) |
| 5 Years | 7 (100.0%) | 58 (100.0%) |
| 6 to 11 Years | 178 (95.7%) | 264 (95.7%) |
| 12 to 14 Years | 105 (77.8%) | 99 (78.6%) |
| 15 Years | 17 (100.0%) | 38 (100.0%) |
| 16 and 17 Years | 25 (100.0%) | 85 (100.0%) |
| 18 to 24 Years | 354 (94.4%) | 167 (100.0%) |
| 25 to 34 Years | 412 (92.0%) | 411 (90.7%) |
| 35 to 44 Years | 281 (94.6%) | 366 (93.1%) |
| 45 to 54 Years | 425 (88.9%) | 577 (99.0%) |
| 55 to 64 Years | 400 (79.0%) | 563 (94.0%) |
| 65 to 74 Years | 573 (91.8%) | 708 (95.3%) |
| 75 Years and over | 129 (100.0%) | 234 (69.4%) |
| Total | 3,054 (90.5%) | 3,722 (92.8%) |
Income Below Poverty Among Married-Couple Families in Sebastopol
The poverty statistics for married-couple families in Sebastopol show that 3.5% or 54 of the total 1,549 families live below the poverty line. Families with 1 or 2 children have the highest poverty rate of 4.6%, comprising of 29 families. On the other hand, families with 3 or 4 children have the lowest poverty rate of 0.0%, which includes 0 families.
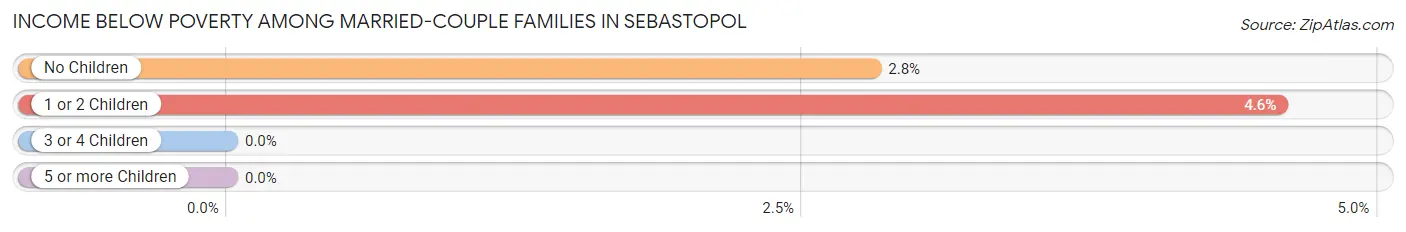
| Children | Above Poverty | Below Poverty |
| No Children | 867 (97.2%) | 25 (2.8%) |
| 1 or 2 Children | 605 (95.4%) | 29 (4.6%) |
| 3 or 4 Children | 23 (100.0%) | 0 (0.0%) |
| 5 or more Children | 0 (0.0%) | 0 (0.0%) |
| Total | 1,495 (96.5%) | 54 (3.5%) |
Income Below Poverty Among Single-Parent Households in Sebastopol
According to the poverty data in Sebastopol, 7.1% or 10 single-father households and 4.0% or 11 single-mother households are living below the poverty line. Among single-father households, those with no children have the highest poverty rate, with 10 households (11.8%) experiencing poverty. Likewise, among single-mother households, those with 1 or 2 children have the highest poverty rate, with 11 households (10.0%) falling below the poverty line.
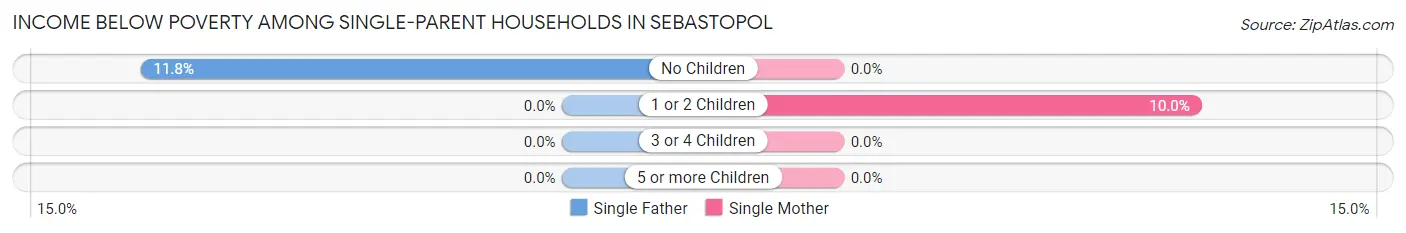
| Children | Single Father | Single Mother |
| No Children | 10 (11.8%) | 0 (0.0%) |
| 1 or 2 Children | 0 (0.0%) | 11 (10.0%) |
| 3 or 4 Children | 0 (0.0%) | 0 (0.0%) |
| 5 or more Children | 0 (0.0%) | 0 (0.0%) |
| Total | 10 (7.1%) | 11 (4.0%) |
Income Below Poverty Among Married-Couple vs Single-Parent Households in Sebastopol
The poverty data for Sebastopol shows that 54 of the married-couple family households (3.5%) and 21 of the single-parent households (5.0%) are living below the poverty level. Within the married-couple family households, those with 1 or 2 children have the highest poverty rate, with 29 households (4.6%) falling below the poverty line. Among the single-parent households, those with 1 or 2 children have the highest poverty rate, with 11 household (8.0%) living below poverty.
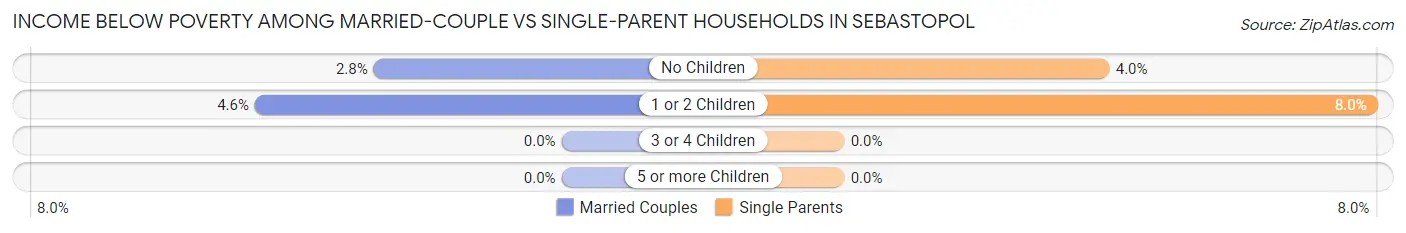
| Children | Married-Couple Families | Single-Parent Households |
| No Children | 25 (2.8%) | 10 (4.0%) |
| 1 or 2 Children | 29 (4.6%) | 11 (8.0%) |
| 3 or 4 Children | 0 (0.0%) | 0 (0.0%) |
| 5 or more Children | 0 (0.0%) | 0 (0.0%) |
| Total | 54 (3.5%) | 21 (5.0%) |
Race in Sebastopol
The most populous races in Sebastopol are White / Caucasian (5,656 | 75.4%), Hispanic or Latino (1,179 | 15.7%), and Two or more Races (716 | 9.5%).
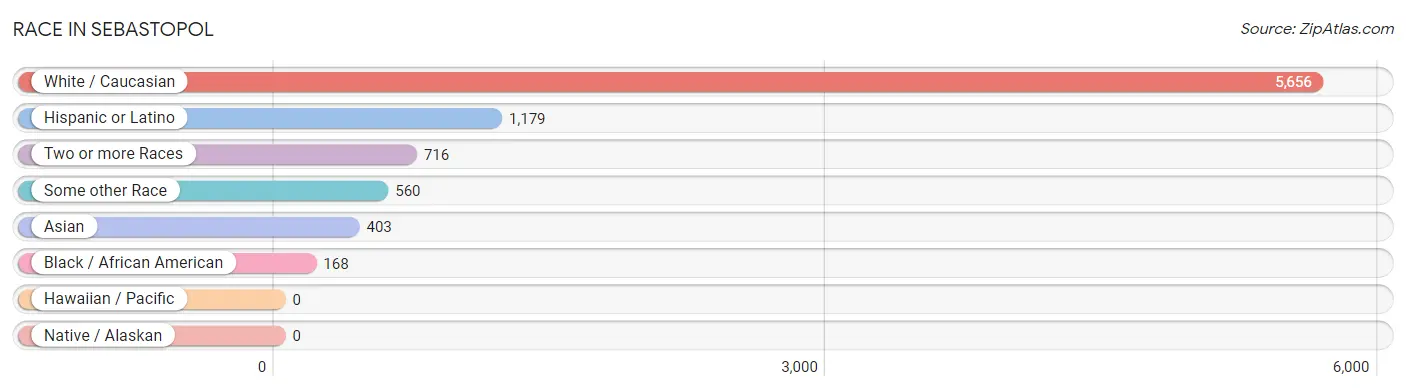
| Race | # Population | % Population |
| Asian | 403 | 5.4% |
| Black / African American | 168 | 2.2% |
| Hawaiian / Pacific | 0 | 0.0% |
| Hispanic or Latino | 1,179 | 15.7% |
| Native / Alaskan | 0 | 0.0% |
| White / Caucasian | 5,656 | 75.4% |
| Two or more Races | 716 | 9.5% |
| Some other Race | 560 | 7.5% |
| Total | 7,503 | 100.0% |
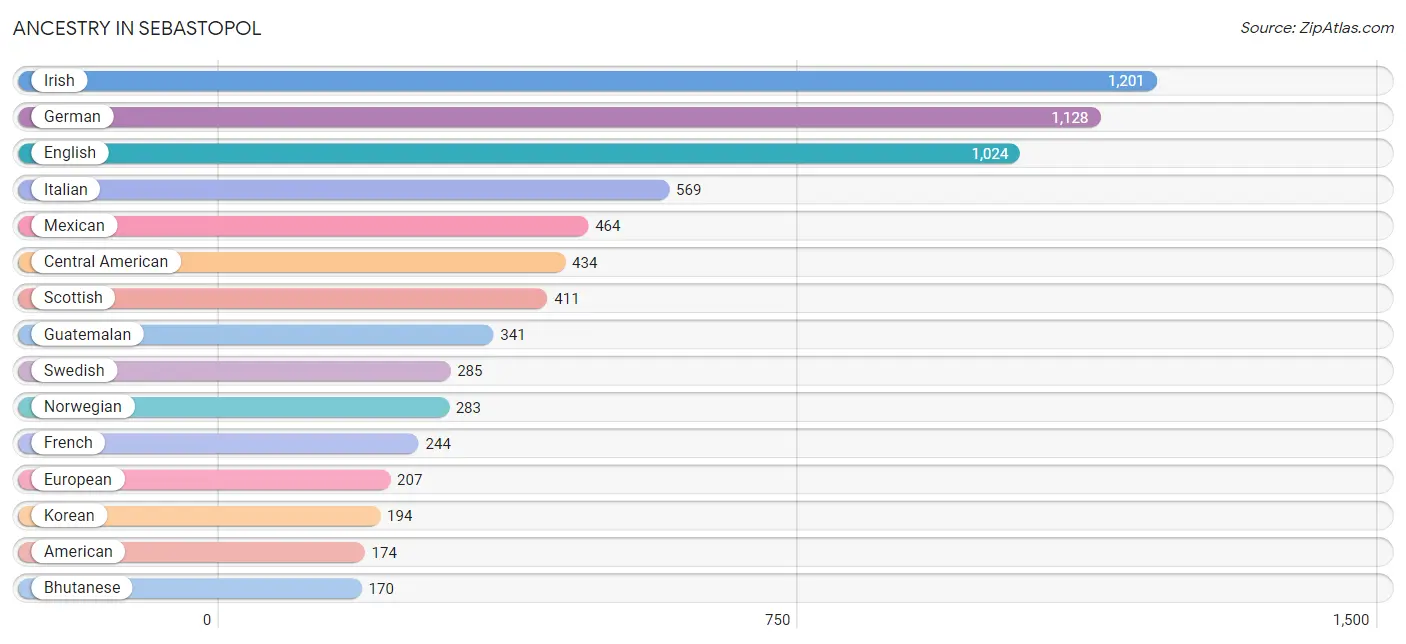
Ancestry in Sebastopol
The most populous ancestries reported in Sebastopol are Irish (1,201 | 16.0%), German (1,128 | 15.0%), English (1,024 | 13.7%), Italian (569 | 7.6%), and Mexican (464 | 6.2%), together accounting for 58.5% of all Sebastopol residents.
| Ancestry | # Population | % Population |
| American | 174 | 2.3% |
| Arab | 155 | 2.1% |
| Armenian | 91 | 1.2% |
| Austrian | 18 | 0.2% |
| Bhutanese | 170 | 2.3% |
| British | 41 | 0.5% |
| Burmese | 67 | 0.9% |
| Canadian | 23 | 0.3% |
| Celtic | 8 | 0.1% |
| Central American | 434 | 5.8% |
| Cherokee | 117 | 1.6% |
| Chilean | 7 | 0.1% |
| Colombian | 120 | 1.6% |
| Croatian | 11 | 0.2% |
| Czech | 10 | 0.1% |
| Danish | 49 | 0.6% |
| Dutch | 68 | 0.9% |
| Eastern European | 88 | 1.2% |
| English | 1,024 | 13.7% |
| European | 207 | 2.8% |
| Finnish | 33 | 0.4% |
| French | 244 | 3.3% |
| French Canadian | 87 | 1.2% |
| German | 1,128 | 15.0% |
| Greek | 58 | 0.8% |
| Guatemalan | 341 | 4.5% |
| Hungarian | 78 | 1.0% |
| Icelander | 19 | 0.3% |
| Indian (Asian) | 132 | 1.8% |
| Irish | 1,201 | 16.0% |
| Italian | 569 | 7.6% |
| Korean | 194 | 2.6% |
| Latvian | 18 | 0.2% |
| Lebanese | 21 | 0.3% |
| Lithuanian | 19 | 0.3% |
| Mexican | 464 | 6.2% |
| Northern European | 42 | 0.6% |
| Norwegian | 283 | 3.8% |
| Pakistani | 33 | 0.4% |
| Palestinian | 17 | 0.2% |
| Peruvian | 23 | 0.3% |
| Polish | 80 | 1.1% |
| Portuguese | 131 | 1.8% |
| Romanian | 14 | 0.2% |
| Russian | 100 | 1.3% |
| Salvadoran | 93 | 1.2% |
| Scandinavian | 83 | 1.1% |
| Scotch-Irish | 124 | 1.7% |
| Scottish | 411 | 5.5% |
| Sioux | 124 | 1.7% |
| Slovak | 24 | 0.3% |
| South American | 150 | 2.0% |
| Spanish | 120 | 1.6% |
| Swedish | 285 | 3.8% |
| Swiss | 67 | 0.9% |
| Syrian | 64 | 0.9% |
| Thai | 49 | 0.6% |
| Ukrainian | 28 | 0.4% |
| Welsh | 42 | 0.6% | View All 59 Rows |
Immigrants in Sebastopol
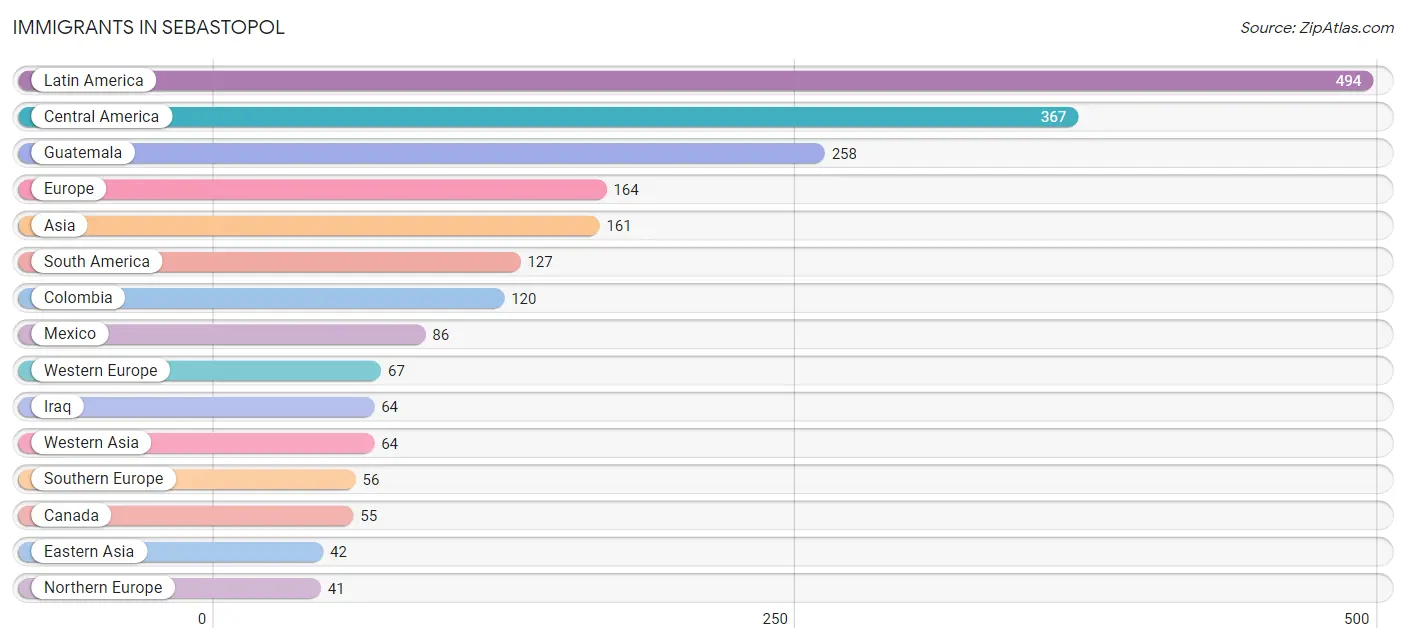
The most numerous immigrant groups reported in Sebastopol came from Latin America (494 | 6.6%), Central America (367 | 4.9%), Guatemala (258 | 3.4%), Europe (164 | 2.2%), and Asia (161 | 2.1%), together accounting for 19.3% of all Sebastopol residents.
| Immigration Origin | # Population | % Population |
| Africa | 18 | 0.2% |
| Asia | 161 | 2.1% |
| Australia | 22 | 0.3% |
| Canada | 55 | 0.7% |
| Central America | 367 | 4.9% |
| Chile | 7 | 0.1% |
| Colombia | 120 | 1.6% |
| Eastern Asia | 42 | 0.6% |
| El Salvador | 23 | 0.3% |
| Europe | 164 | 2.2% |
| Germany | 26 | 0.4% |
| Greece | 16 | 0.2% |
| Guatemala | 258 | 3.4% |
| Iran | 27 | 0.4% |
| Iraq | 64 | 0.9% |
| Italy | 40 | 0.5% |
| Japan | 32 | 0.4% |
| Korea | 10 | 0.1% |
| Latin America | 494 | 6.6% |
| Mexico | 86 | 1.1% |
| Northern Europe | 41 | 0.5% |
| Oceania | 22 | 0.3% |
| South Africa | 18 | 0.2% |
| South America | 127 | 1.7% |
| South Central Asia | 27 | 0.4% |
| South Eastern Asia | 28 | 0.4% |
| Southern Europe | 56 | 0.7% |
| Sweden | 24 | 0.3% |
| Switzerland | 41 | 0.5% |
| Thailand | 19 | 0.3% |
| Vietnam | 9 | 0.1% |
| Western Asia | 64 | 0.9% |
| Western Europe | 67 | 0.9% | View All 33 Rows |
Sex and Age in Sebastopol
Sex and Age in Sebastopol
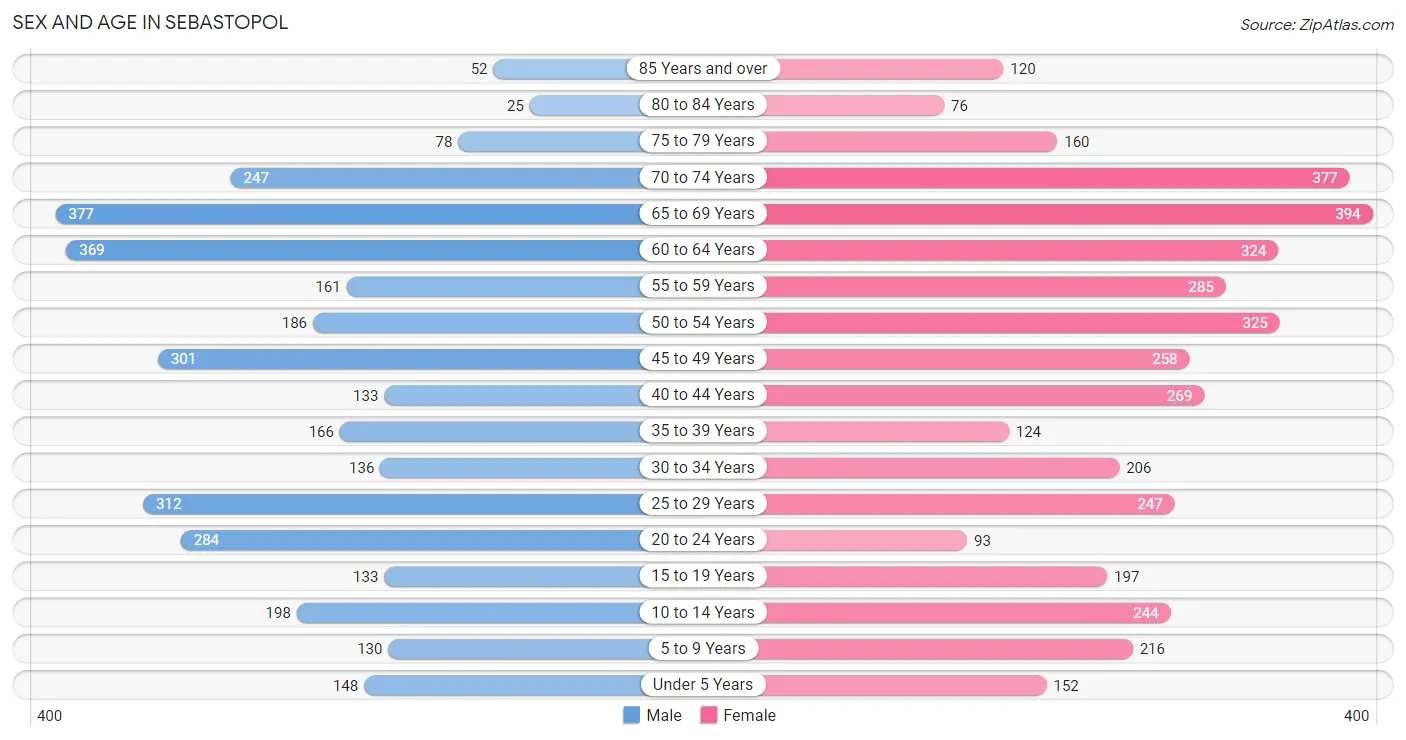
The most populous age groups in Sebastopol are 65 to 69 Years (377 | 11.0%) for men and 65 to 69 Years (394 | 9.7%) for women.
| Age Bracket | Male | Female |
| Under 5 Years | 148 (4.3%) | 152 (3.7%) |
| 5 to 9 Years | 130 (3.8%) | 216 (5.3%) |
| 10 to 14 Years | 198 (5.8%) | 244 (6.0%) |
| 15 to 19 Years | 133 (3.9%) | 197 (4.8%) |
| 20 to 24 Years | 284 (8.3%) | 93 (2.3%) |
| 25 to 29 Years | 312 (9.1%) | 247 (6.1%) |
| 30 to 34 Years | 136 (4.0%) | 206 (5.1%) |
| 35 to 39 Years | 166 (4.8%) | 124 (3.0%) |
| 40 to 44 Years | 133 (3.9%) | 269 (6.6%) |
| 45 to 49 Years | 301 (8.8%) | 258 (6.3%) |
| 50 to 54 Years | 186 (5.4%) | 325 (8.0%) |
| 55 to 59 Years | 161 (4.7%) | 285 (7.0%) |
| 60 to 64 Years | 369 (10.7%) | 324 (8.0%) |
| 65 to 69 Years | 377 (11.0%) | 394 (9.7%) |
| 70 to 74 Years | 247 (7.2%) | 377 (9.3%) |
| 75 to 79 Years | 78 (2.3%) | 160 (3.9%) |
| 80 to 84 Years | 25 (0.7%) | 76 (1.9%) |
| 85 Years and over | 52 (1.5%) | 120 (2.9%) |
| Total | 3,436 (100.0%) | 4,067 (100.0%) |
Families and Households in Sebastopol
Median Family Size in Sebastopol
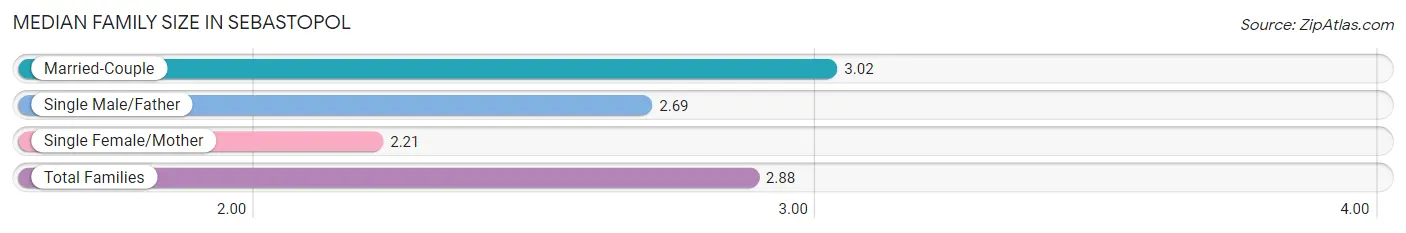
The median family size in Sebastopol is 2.88 persons per family, with married-couple families (1,549 | 78.7%) accounting for the largest median family size of 3.02 persons per family. On the other hand, single female/mother families (278 | 14.1%) represent the smallest median family size with 2.21 persons per family.
| Family Type | # Families | Family Size |
| Married-Couple | 1,549 (78.7%) | 3.02 |
| Single Male/Father | 140 (7.1%) | 2.69 |
| Single Female/Mother | 278 (14.1%) | 2.21 |
| Total Families | 1,967 (100.0%) | 2.88 |
Median Household Size in Sebastopol
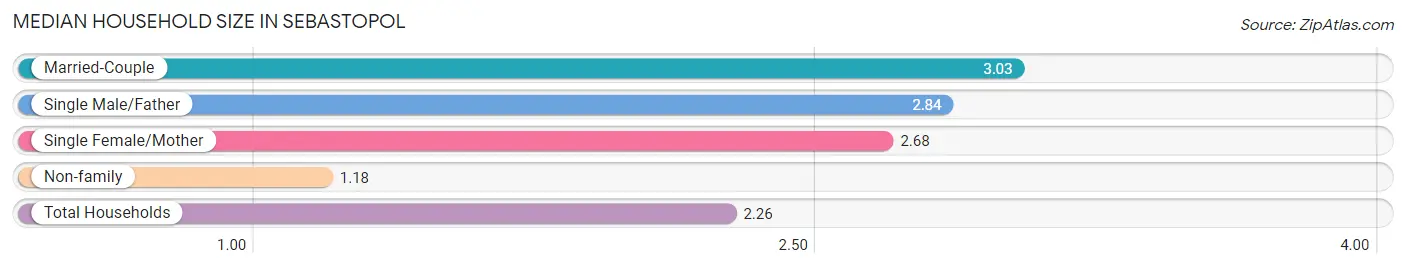
The median household size in Sebastopol is 2.26 persons per household, with married-couple households (1,549 | 47.5%) accounting for the largest median household size of 3.03 persons per household. non-family households (1,291 | 39.6%) represent the smallest median household size with 1.18 persons per household.
| Household Type | # Households | Household Size |
| Married-Couple | 1,549 (47.5%) | 3.03 |
| Single Male/Father | 140 (4.3%) | 2.84 |
| Single Female/Mother | 278 (8.5%) | 2.68 |
| Non-family | 1,291 (39.6%) | 1.18 |
| Total Households | 3,258 (100.0%) | 2.26 |
Household Size by Marriage Status in Sebastopol
Out of a total of 3,258 households in Sebastopol, 1,967 (60.4%) are family households, while 1,291 (39.6%) are nonfamily households. The most numerous type of family households are 2-person households, comprising 881, and the most common type of nonfamily households are 1-person households, comprising 1,125.
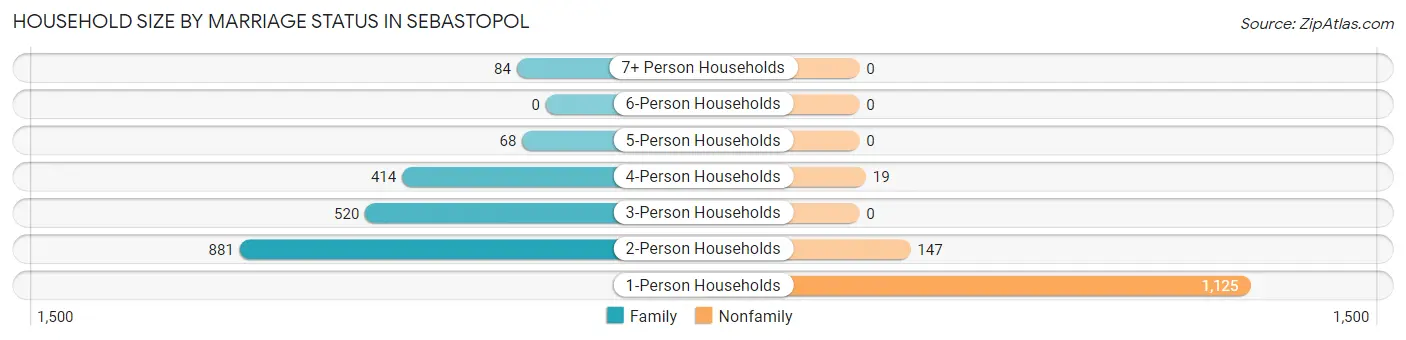
| Household Size | Family Households | Nonfamily Households |
| 1-Person Households | - | 1,125 (34.5%) |
| 2-Person Households | 881 (27.0%) | 147 (4.5%) |
| 3-Person Households | 520 (16.0%) | 0 (0.0%) |
| 4-Person Households | 414 (12.7%) | 19 (0.6%) |
| 5-Person Households | 68 (2.1%) | 0 (0.0%) |
| 6-Person Households | 0 (0.0%) | 0 (0.0%) |
| 7+ Person Households | 84 (2.6%) | 0 (0.0%) |
| Total | 1,967 (60.4%) | 1,291 (39.6%) |
Female Fertility in Sebastopol
Fertility by Age in Sebastopol
Average fertility rate in Sebastopol is 66.0 births per 1,000 women. Women in the age bracket of 20 to 34 years have the highest fertility rate with 117.0 births per 1,000 women. Women in the age bracket of 20 to 34 years acount for 65.3% of all women with births.
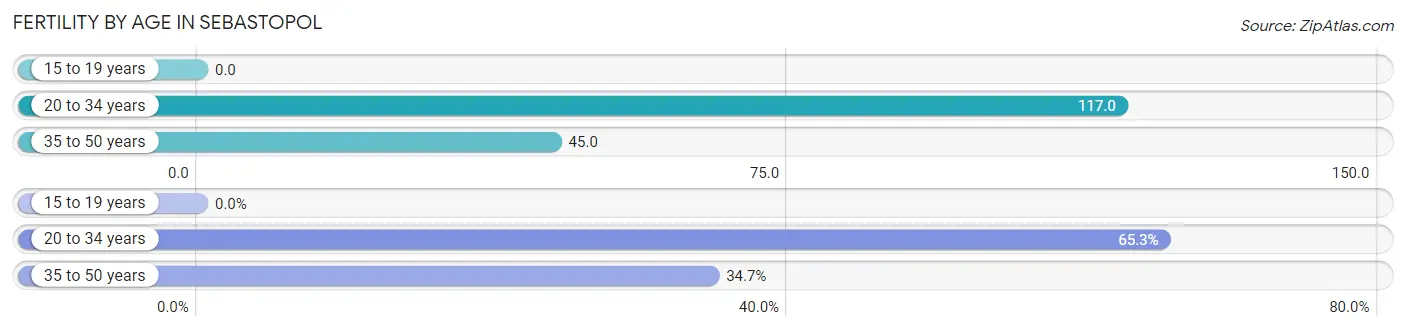
| Age Bracket | Women with Births | Births / 1,000 Women |
| 15 to 19 years | 0 (0.0%) | 0.0 |
| 20 to 34 years | 64 (65.3%) | 117.0 |
| 35 to 50 years | 34 (34.7%) | 45.0 |
| Total | 98 (100.0%) | 66.0 |
Fertility by Age by Marriage Status in Sebastopol
93.9% of women with births (98) in Sebastopol are married. The highest percentage of unmarried women with births falls into 20 to 34 years age bracket with 9.4% of them unmarried at the time of birth, while the lowest percentage of unmarried women with births belong to 35 to 50 years age bracket with 0.0% of them unmarried.
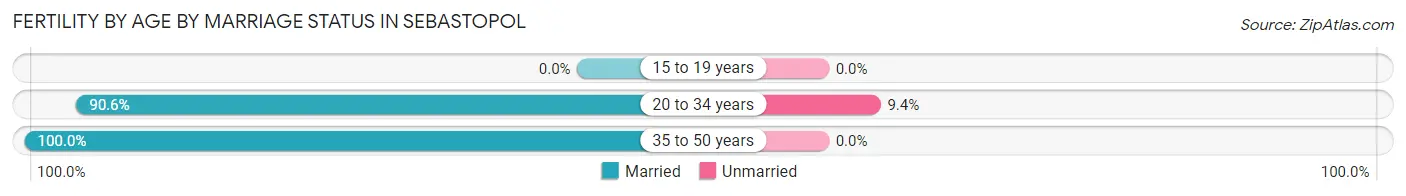
| Age Bracket | Married | Unmarried |
| 15 to 19 years | 0 (0.0%) | 0 (0.0%) |
| 20 to 34 years | 58 (90.6%) | 6 (9.4%) |
| 35 to 50 years | 34 (100.0%) | 0 (0.0%) |
| Total | 92 (93.9%) | 6 (6.1%) |
Fertility by Education in Sebastopol
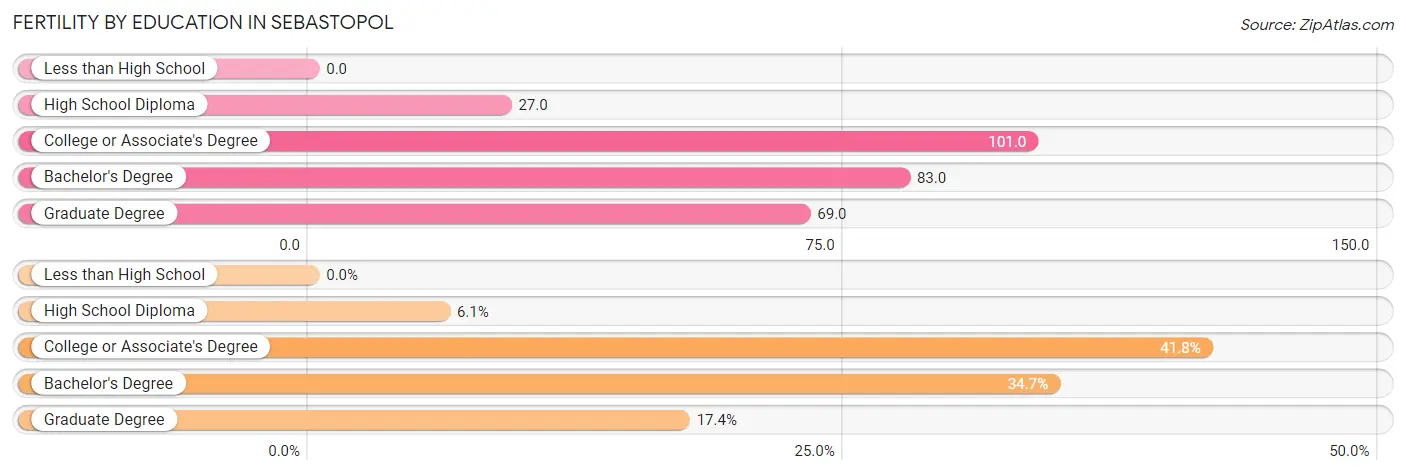
| Educational Attainment | Women with Births | Births / 1,000 Women |
| Less than High School | 0 (0.0%) | 0.0 |
| High School Diploma | 6 (6.1%) | 27.0 |
| College or Associate's Degree | 41 (41.8%) | 101.0 |
| Bachelor's Degree | 34 (34.7%) | 83.0 |
| Graduate Degree | 17 (17.3%) | 69.0 |
| Total | 98 (100.0%) | 66.0 |
Fertility by Education by Marriage Status in Sebastopol
6.1% of women with births in Sebastopol are unmarried. Women with the educational attainment of college or associate's degree are most likely to be married with 100.0% of them married at childbirth, while women with the educational attainment of high school diploma are least likely to be married with 100.0% of them unmarried at childbirth.
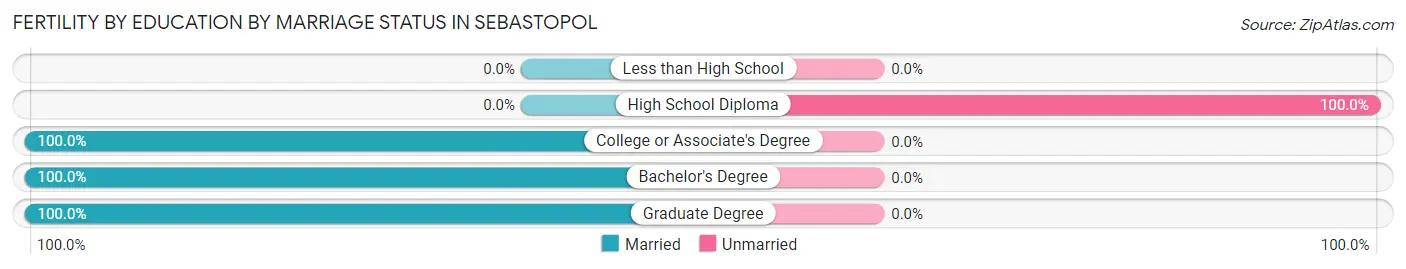
| Educational Attainment | Married | Unmarried |
| Less than High School | 0 (0.0%) | 0 (0.0%) |
| High School Diploma | 0 (0.0%) | 6 (100.0%) |
| College or Associate's Degree | 41 (100.0%) | 0 (0.0%) |
| Bachelor's Degree | 34 (100.0%) | 0 (0.0%) |
| Graduate Degree | 17 (100.0%) | 0 (0.0%) |
| Total | 92 (93.9%) | 6 (6.1%) |
Employment Characteristics in Sebastopol
Employment by Class of Employer in Sebastopol
Among the 3,759 employed individuals in Sebastopol, private company employees (2,092 | 55.6%), local government employees (566 | 15.1%), and self-employed (not incorporated) (441 | 11.7%) make up the most common classes of employment.
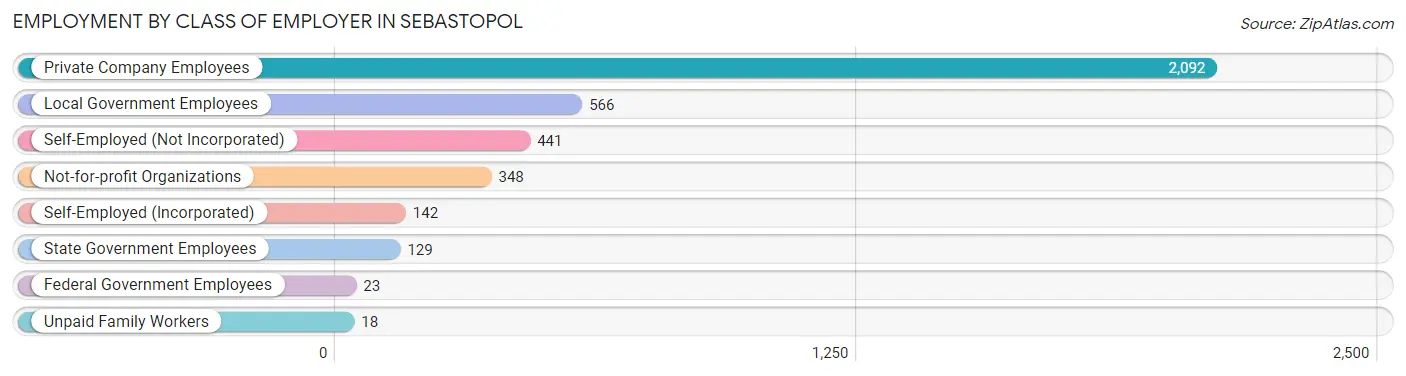
| Employer Class | # Employees | % Employees |
| Private Company Employees | 2,092 | 55.6% |
| Self-Employed (Incorporated) | 142 | 3.8% |
| Self-Employed (Not Incorporated) | 441 | 11.7% |
| Not-for-profit Organizations | 348 | 9.3% |
| Local Government Employees | 566 | 15.1% |
| State Government Employees | 129 | 3.4% |
| Federal Government Employees | 23 | 0.6% |
| Unpaid Family Workers | 18 | 0.5% |
| Total | 3,759 | 100.0% |
Employment Status by Age in Sebastopol
According to the labor force statistics for Sebastopol, out of the total population over 16 years of age (6,360), 62.9% or 4,000 individuals are in the labor force, with 5.5% or 220 of them unemployed. The age group with the highest labor force participation rate is 30 to 34 years, with 94.7% or 324 individuals in the labor force. Within the labor force, the 75 years and over age range has the highest percentage of unemployed individuals, with 23.5% or 8 of them being unemployed.
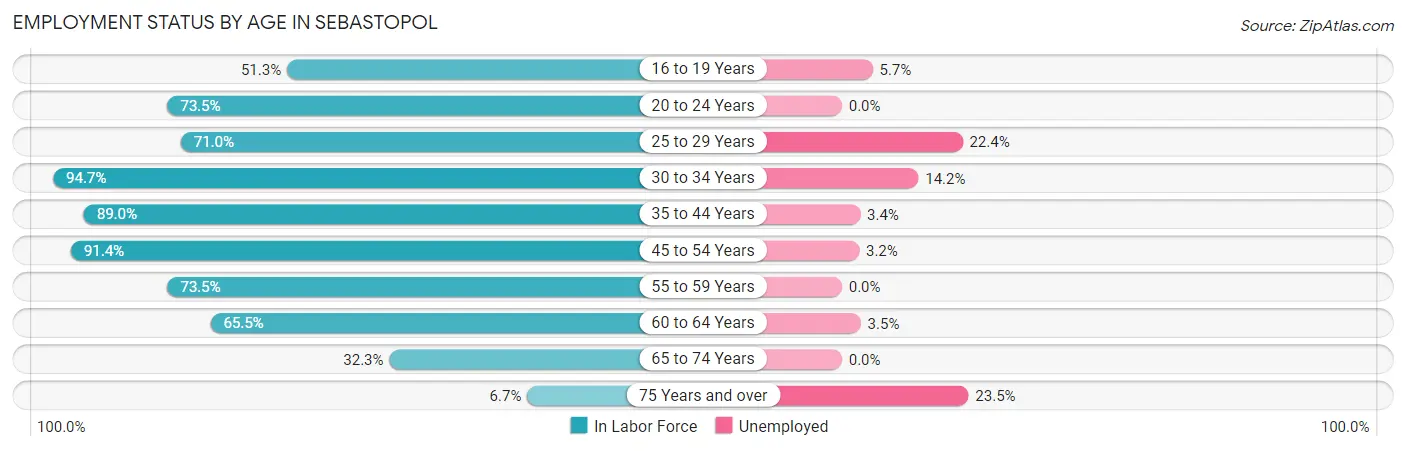
| Age Bracket | In Labor Force | Unemployed |
| 16 to 19 Years | 141 (51.3%) | 8 (5.7%) |
| 20 to 24 Years | 277 (73.5%) | 0 (0.0%) |
| 25 to 29 Years | 397 (71.0%) | 89 (22.4%) |
| 30 to 34 Years | 324 (94.7%) | 46 (14.2%) |
| 35 to 44 Years | 616 (89.0%) | 21 (3.4%) |
| 45 to 54 Years | 978 (91.4%) | 31 (3.2%) |
| 55 to 59 Years | 328 (73.5%) | 0 (0.0%) |
| 60 to 64 Years | 454 (65.5%) | 16 (3.5%) |
| 65 to 74 Years | 451 (32.3%) | 0 (0.0%) |
| 75 Years and over | 34 (6.7%) | 8 (23.5%) |
| Total | 4,000 (62.9%) | 220 (5.5%) |
Employment Status by Educational Attainment in Sebastopol
According to labor force statistics for Sebastopol, 81.5% of individuals (3,099) out of the total population between 25 and 64 years of age (3,802) are in the labor force, with 6.6% or 205 of them being unemployed. The group with the highest labor force participation rate are those with the educational attainment of bachelor's degree or higher, with 88.3% or 1,440 individuals in the labor force. Within the labor force, individuals with high school diploma education have the highest percentage of unemployment, with 10.9% or 60 of them being unemployed.
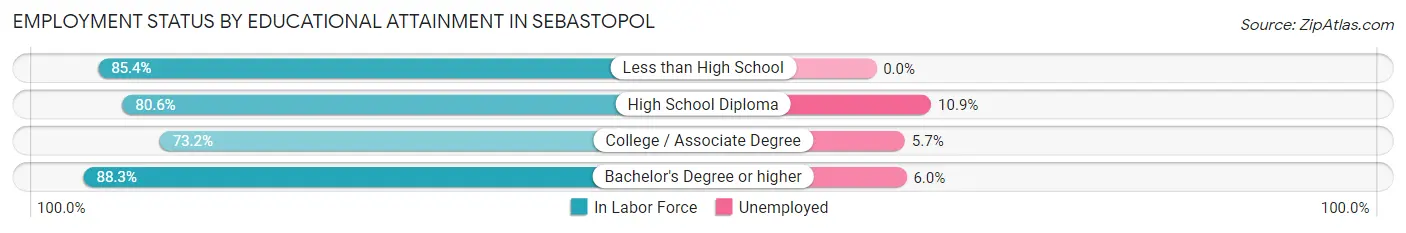
| Educational Attainment | In Labor Force | Unemployed |
| Less than High School | 123 (85.4%) | 0 (0.0%) |
| High School Diploma | 548 (80.6%) | 74 (10.9%) |
| College / Associate Degree | 986 (73.2%) | 77 (5.7%) |
| Bachelor's Degree or higher | 1,440 (88.3%) | 98 (6.0%) |
| Total | 3,099 (81.5%) | 251 (6.6%) |
Employment Occupations by Sex in Sebastopol
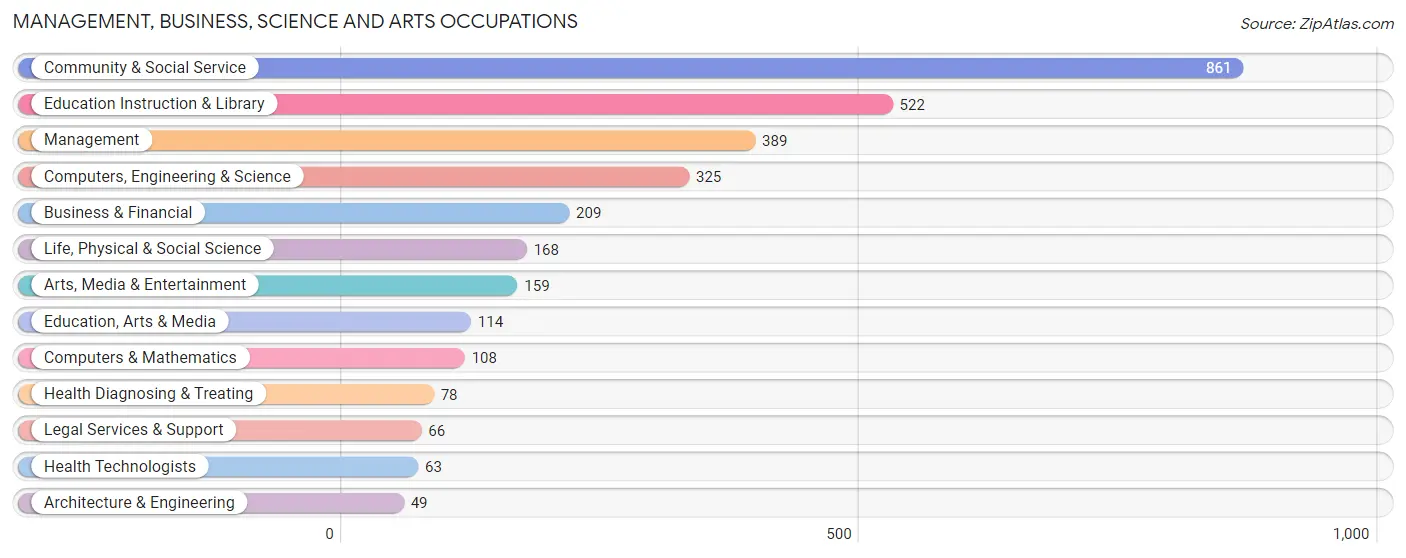
Management, Business, Science and Arts Occupations
The most common Management, Business, Science and Arts occupations in Sebastopol are Community & Social Service (861 | 22.8%), Education Instruction & Library (522 | 13.8%), Management (389 | 10.3%), Computers, Engineering & Science (325 | 8.6%), and Business & Financial (209 | 5.5%).
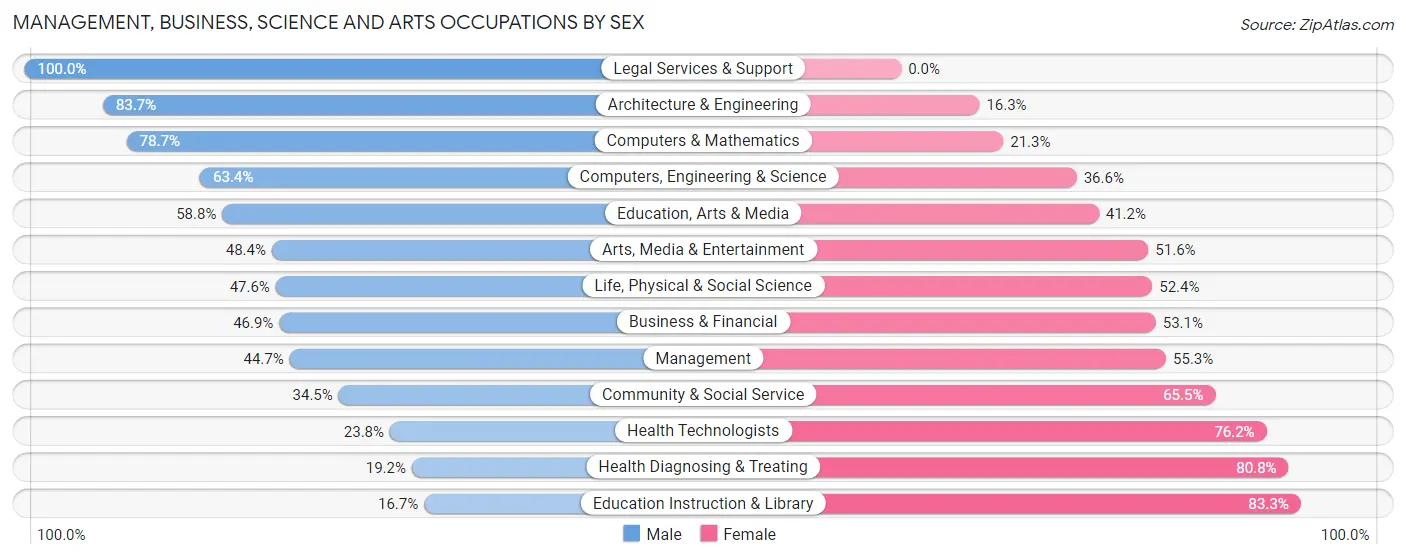
Management, Business, Science and Arts Occupations by Sex
Within the Management, Business, Science and Arts occupations in Sebastopol, the most male-oriented occupations are Legal Services & Support (100.0%), Architecture & Engineering (83.7%), and Computers & Mathematics (78.7%), while the most female-oriented occupations are Education Instruction & Library (83.3%), Health Diagnosing & Treating (80.8%), and Health Technologists (76.2%).
| Occupation | Male | Female |
| Management | 174 (44.7%) | 215 (55.3%) |
| Business & Financial | 98 (46.9%) | 111 (53.1%) |
| Computers, Engineering & Science | 206 (63.4%) | 119 (36.6%) |
| Computers & Mathematics | 85 (78.7%) | 23 (21.3%) |
| Architecture & Engineering | 41 (83.7%) | 8 (16.3%) |
| Life, Physical & Social Science | 80 (47.6%) | 88 (52.4%) |
| Community & Social Service | 297 (34.5%) | 564 (65.5%) |
| Education, Arts & Media | 67 (58.8%) | 47 (41.2%) |
| Legal Services & Support | 66 (100.0%) | 0 (0.0%) |
| Education Instruction & Library | 87 (16.7%) | 435 (83.3%) |
| Arts, Media & Entertainment | 77 (48.4%) | 82 (51.6%) |
| Health Diagnosing & Treating | 15 (19.2%) | 63 (80.8%) |
| Health Technologists | 15 (23.8%) | 48 (76.2%) |
| Total (Category) | 790 (42.4%) | 1,072 (57.6%) |
| Total (Overall) | 1,853 (49.0%) | 1,928 (51.0%) |
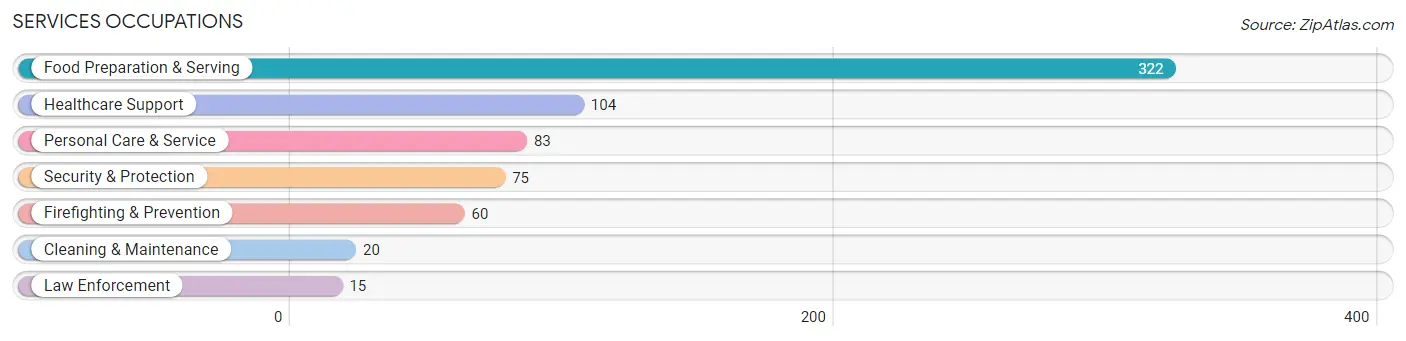
Services Occupations
The most common Services occupations in Sebastopol are Food Preparation & Serving (322 | 8.5%), Healthcare Support (104 | 2.8%), Personal Care & Service (83 | 2.2%), Security & Protection (75 | 2.0%), and Firefighting & Prevention (60 | 1.6%).
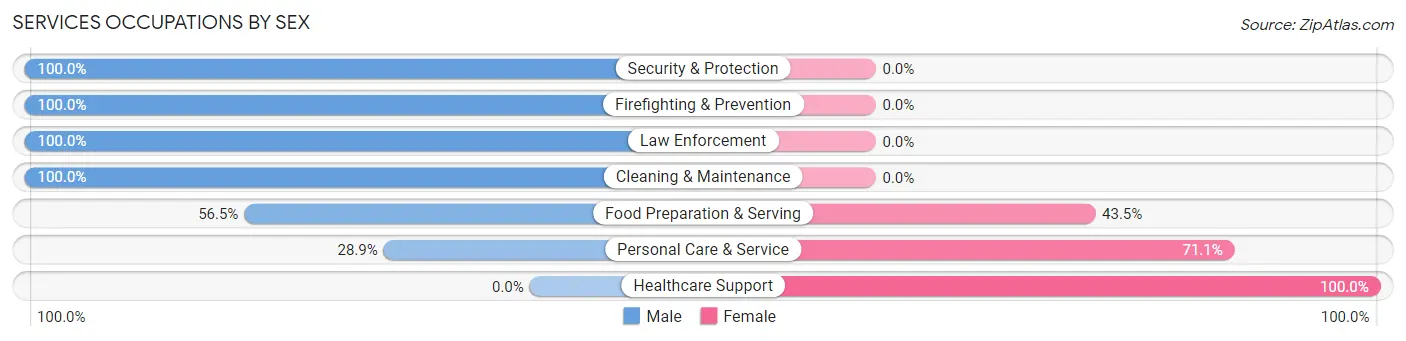
Services Occupations by Sex
Within the Services occupations in Sebastopol, the most male-oriented occupations are Security & Protection (100.0%), Firefighting & Prevention (100.0%), and Law Enforcement (100.0%), while the most female-oriented occupations are Healthcare Support (100.0%), Personal Care & Service (71.1%), and Food Preparation & Serving (43.5%).
| Occupation | Male | Female |
| Healthcare Support | 0 (0.0%) | 104 (100.0%) |
| Security & Protection | 75 (100.0%) | 0 (0.0%) |
| Firefighting & Prevention | 60 (100.0%) | 0 (0.0%) |
| Law Enforcement | 15 (100.0%) | 0 (0.0%) |
| Food Preparation & Serving | 182 (56.5%) | 140 (43.5%) |
| Cleaning & Maintenance | 20 (100.0%) | 0 (0.0%) |
| Personal Care & Service | 24 (28.9%) | 59 (71.1%) |
| Total (Category) | 301 (49.8%) | 303 (50.2%) |
| Total (Overall) | 1,853 (49.0%) | 1,928 (51.0%) |
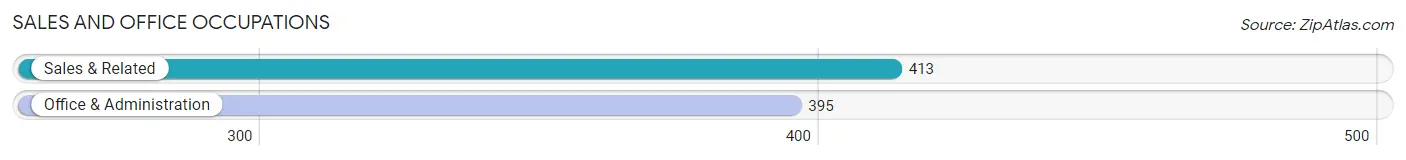
Sales and Office Occupations
The most common Sales and Office occupations in Sebastopol are Sales & Related (413 | 10.9%), and Office & Administration (395 | 10.4%).
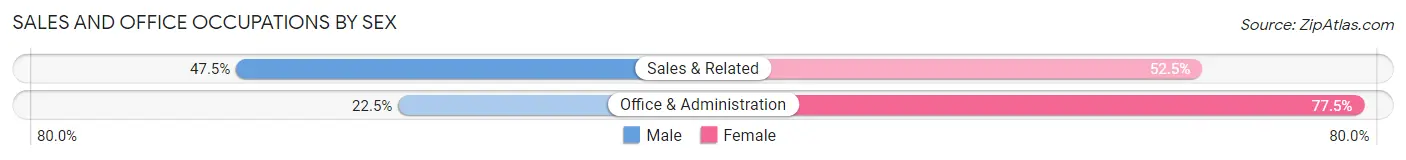
Sales and Office Occupations by Sex
| Occupation | Male | Female |
| Sales & Related | 196 (47.5%) | 217 (52.5%) |
| Office & Administration | 89 (22.5%) | 306 (77.5%) |
| Total (Category) | 285 (35.3%) | 523 (64.7%) |
| Total (Overall) | 1,853 (49.0%) | 1,928 (51.0%) |
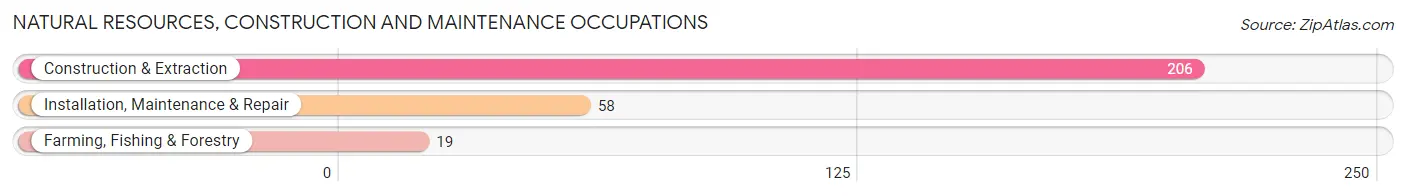
Natural Resources, Construction and Maintenance Occupations
The most common Natural Resources, Construction and Maintenance occupations in Sebastopol are Construction & Extraction (206 | 5.4%), Installation, Maintenance & Repair (58 | 1.5%), and Farming, Fishing & Forestry (19 | 0.5%).
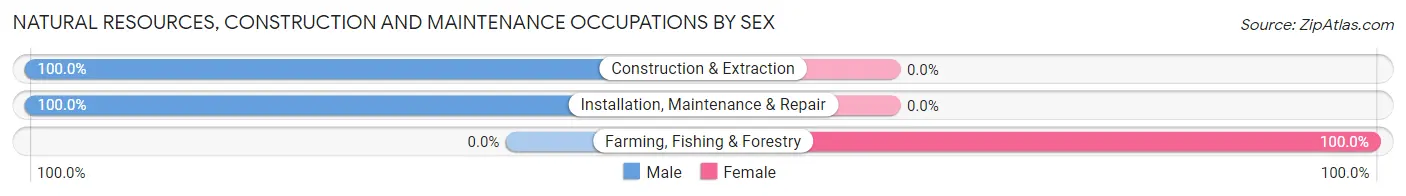
Natural Resources, Construction and Maintenance Occupations by Sex
| Occupation | Male | Female |
| Farming, Fishing & Forestry | 0 (0.0%) | 19 (100.0%) |
| Construction & Extraction | 206 (100.0%) | 0 (0.0%) |
| Installation, Maintenance & Repair | 58 (100.0%) | 0 (0.0%) |
| Total (Category) | 264 (93.3%) | 19 (6.7%) |
| Total (Overall) | 1,853 (49.0%) | 1,928 (51.0%) |
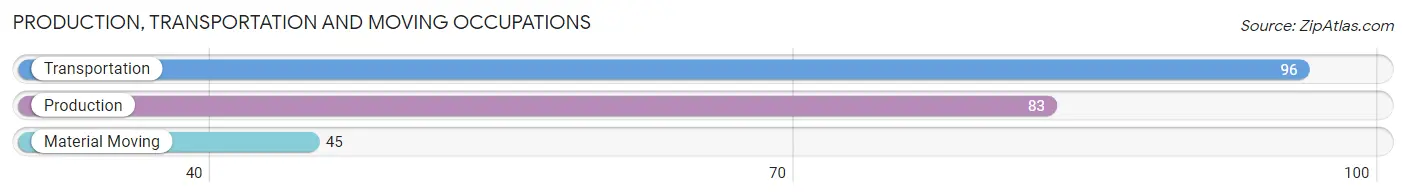
Production, Transportation and Moving Occupations
The most common Production, Transportation and Moving occupations in Sebastopol are Transportation (96 | 2.5%), Production (83 | 2.2%), and Material Moving (45 | 1.2%).
Production, Transportation and Moving Occupations by Sex
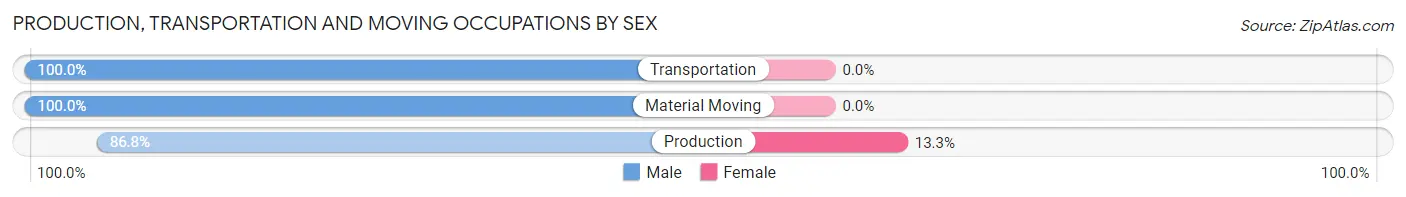
| Occupation | Male | Female |
| Production | 72 (86.8%) | 11 (13.3%) |
| Transportation | 96 (100.0%) | 0 (0.0%) |
| Material Moving | 45 (100.0%) | 0 (0.0%) |
| Total (Category) | 213 (95.1%) | 11 (4.9%) |
| Total (Overall) | 1,853 (49.0%) | 1,928 (51.0%) |
Employment Industries by Sex in Sebastopol
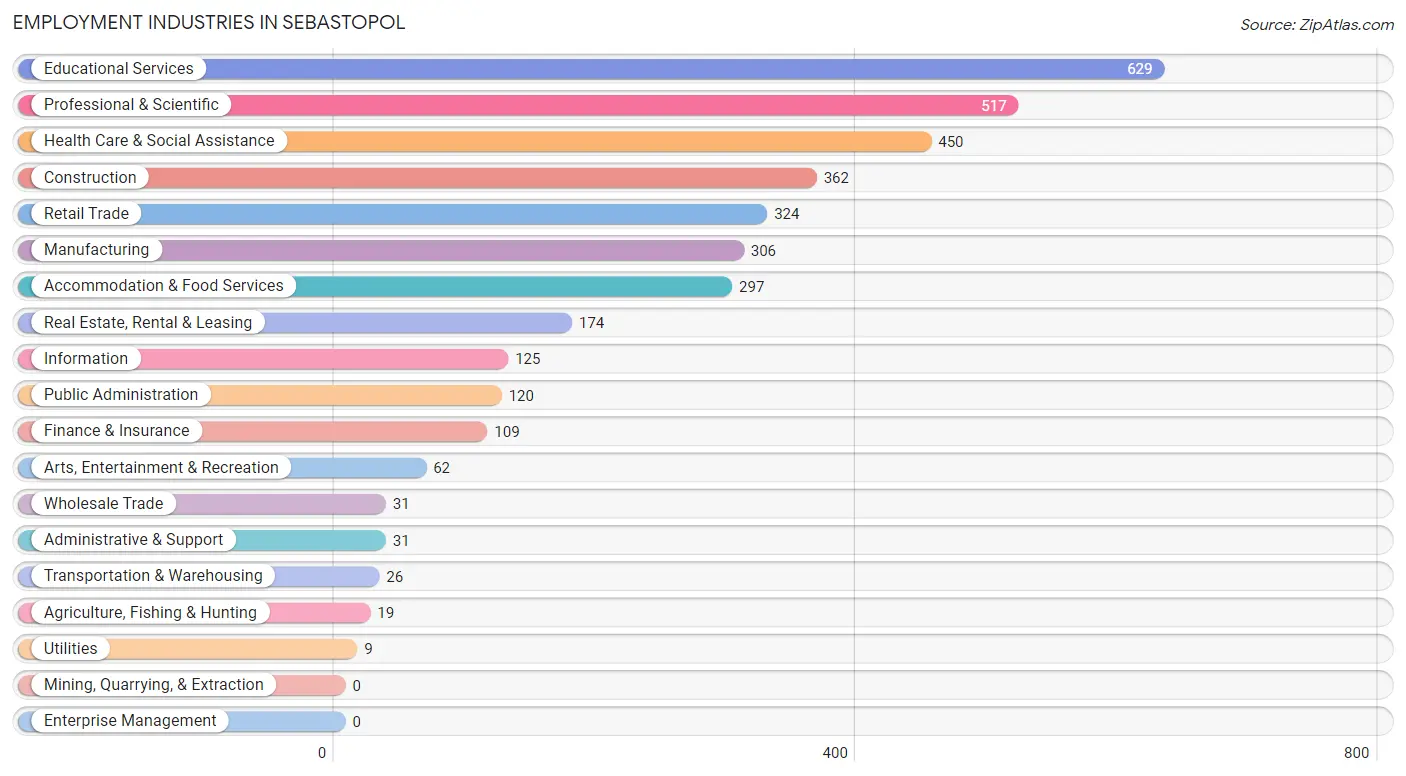
Employment Industries in Sebastopol
The major employment industries in Sebastopol include Educational Services (629 | 16.6%), Professional & Scientific (517 | 13.7%), Health Care & Social Assistance (450 | 11.9%), Construction (362 | 9.6%), and Retail Trade (324 | 8.6%).
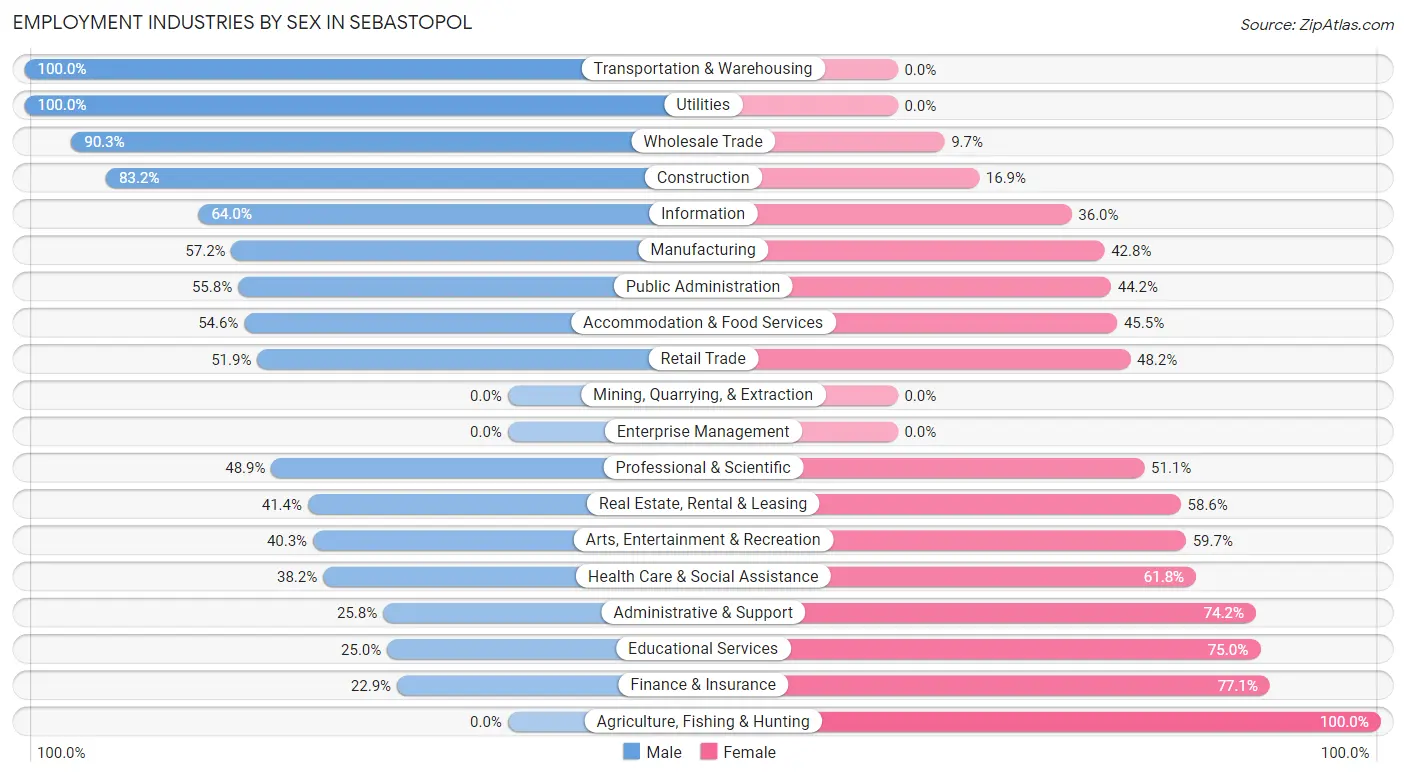
Employment Industries by Sex in Sebastopol
The Sebastopol industries that see more men than women are Transportation & Warehousing (100.0%), Utilities (100.0%), and Wholesale Trade (90.3%), whereas the industries that tend to have a higher number of women are Agriculture, Fishing & Hunting (100.0%), Finance & Insurance (77.1%), and Educational Services (75.0%).
| Industry | Male | Female |
| Agriculture, Fishing & Hunting | 0 (0.0%) | 19 (100.0%) |
| Mining, Quarrying, & Extraction | 0 (0.0%) | 0 (0.0%) |
| Construction | 301 (83.2%) | 61 (16.9%) |
| Manufacturing | 175 (57.2%) | 131 (42.8%) |
| Wholesale Trade | 28 (90.3%) | 3 (9.7%) |
| Retail Trade | 168 (51.8%) | 156 (48.1%) |
| Transportation & Warehousing | 26 (100.0%) | 0 (0.0%) |
| Utilities | 9 (100.0%) | 0 (0.0%) |
| Information | 80 (64.0%) | 45 (36.0%) |
| Finance & Insurance | 25 (22.9%) | 84 (77.1%) |
| Real Estate, Rental & Leasing | 72 (41.4%) | 102 (58.6%) |
| Professional & Scientific | 253 (48.9%) | 264 (51.1%) |
| Enterprise Management | 0 (0.0%) | 0 (0.0%) |
| Administrative & Support | 8 (25.8%) | 23 (74.2%) |
| Educational Services | 157 (25.0%) | 472 (75.0%) |
| Health Care & Social Assistance | 172 (38.2%) | 278 (61.8%) |
| Arts, Entertainment & Recreation | 25 (40.3%) | 37 (59.7%) |
| Accommodation & Food Services | 162 (54.5%) | 135 (45.5%) |
| Public Administration | 67 (55.8%) | 53 (44.2%) |
| Total | 1,853 (49.0%) | 1,928 (51.0%) |
Education in Sebastopol
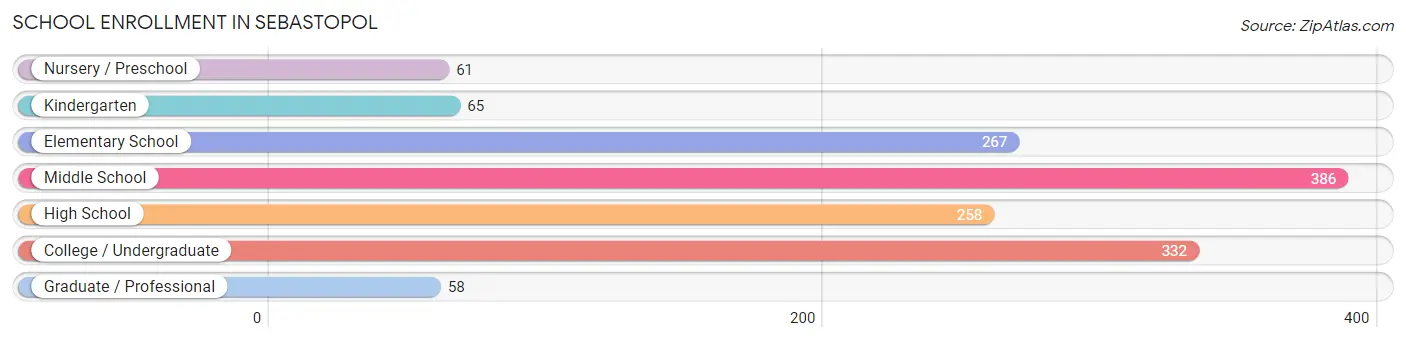
School Enrollment in Sebastopol
The most common levels of schooling among the 1,427 students in Sebastopol are middle school (386 | 27.1%), college / undergraduate (332 | 23.3%), and elementary school (267 | 18.7%).
| School Level | # Students | % Students |
| Nursery / Preschool | 61 | 4.3% |
| Kindergarten | 65 | 4.6% |
| Elementary School | 267 | 18.7% |
| Middle School | 386 | 27.1% |
| High School | 258 | 18.1% |
| College / Undergraduate | 332 | 23.3% |
| Graduate / Professional | 58 | 4.1% |
| Total | 1,427 | 100.0% |
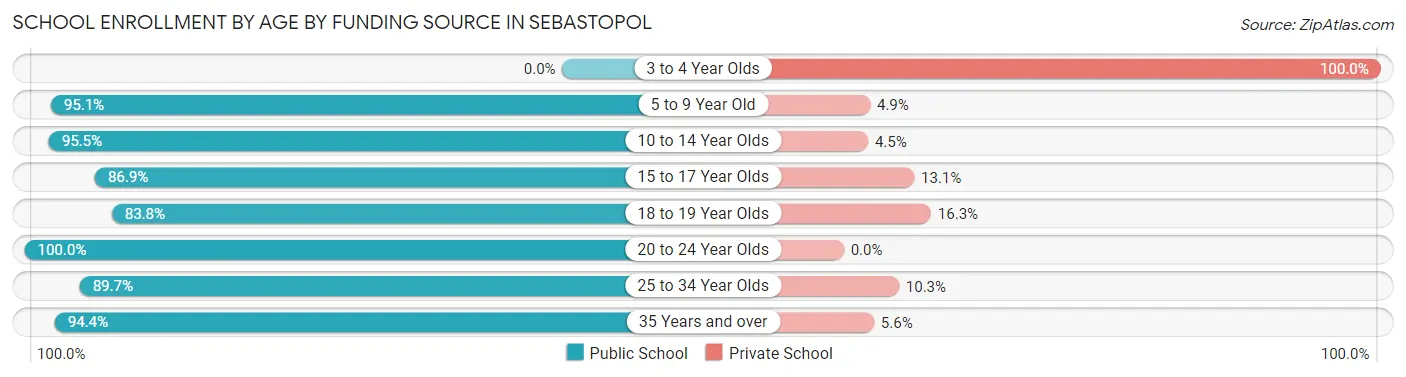
School Enrollment by Age by Funding Source in Sebastopol
Out of a total of 1,427 students who are enrolled in schools in Sebastopol, 116 (8.1%) attend a private institution, while the remaining 1,311 (91.9%) are enrolled in public schools. The age group of 3 to 4 year olds has the highest likelihood of being enrolled in private schools, with 26 (100.0% in the age bracket) enrolled. Conversely, the age group of 20 to 24 year olds has the lowest likelihood of being enrolled in a private school, with 124 (100.0% in the age bracket) attending a public institution.
| Age Bracket | Public School | Private School |
| 3 to 4 Year Olds | 0 (0.0%) | 26 (100.0%) |
| 5 to 9 Year Old | 329 (95.1%) | 17 (4.9%) |
| 10 to 14 Year Olds | 422 (95.5%) | 20 (4.5%) |
| 15 to 17 Year Olds | 139 (86.9%) | 21 (13.1%) |
| 18 to 19 Year Olds | 67 (83.8%) | 13 (16.3%) |
| 20 to 24 Year Olds | 124 (100.0%) | 0 (0.0%) |
| 25 to 34 Year Olds | 96 (89.7%) | 11 (10.3%) |
| 35 Years and over | 134 (94.4%) | 8 (5.6%) |
| Total | 1,311 (91.9%) | 116 (8.1%) |
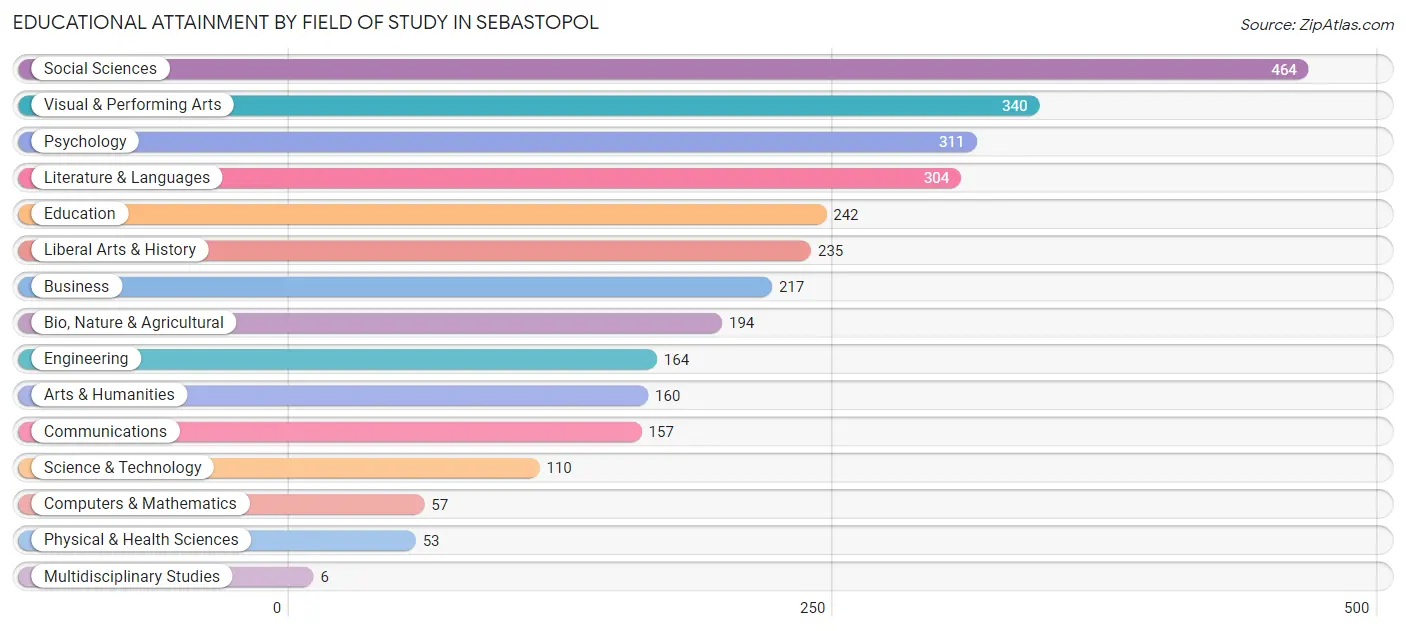
Educational Attainment by Field of Study in Sebastopol
Social sciences (464 | 15.4%), visual & performing arts (340 | 11.3%), psychology (311 | 10.3%), literature & languages (304 | 10.1%), and education (242 | 8.0%) are the most common fields of study among 3,014 individuals in Sebastopol who have obtained a bachelor's degree or higher.
| Field of Study | # Graduates | % Graduates |
| Computers & Mathematics | 57 | 1.9% |
| Bio, Nature & Agricultural | 194 | 6.4% |
| Physical & Health Sciences | 53 | 1.8% |
| Psychology | 311 | 10.3% |
| Social Sciences | 464 | 15.4% |
| Engineering | 164 | 5.4% |
| Multidisciplinary Studies | 6 | 0.2% |
| Science & Technology | 110 | 3.6% |
| Business | 217 | 7.2% |
| Education | 242 | 8.0% |
| Literature & Languages | 304 | 10.1% |
| Liberal Arts & History | 235 | 7.8% |
| Visual & Performing Arts | 340 | 11.3% |
| Communications | 157 | 5.2% |
| Arts & Humanities | 160 | 5.3% |
| Total | 3,014 | 100.0% |
Transportation & Commute in Sebastopol
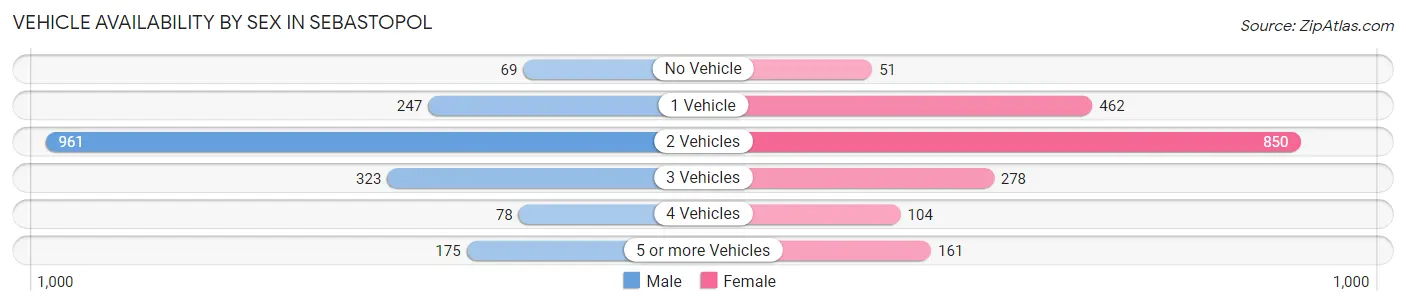
Vehicle Availability by Sex in Sebastopol
The most prevalent vehicle ownership categories in Sebastopol are males with 2 vehicles (961, accounting for 51.9%) and females with 2 vehicles (850, making up 50.4%).
| Vehicles Available | Male | Female |
| No Vehicle | 69 (3.7%) | 51 (2.7%) |
| 1 Vehicle | 247 (13.3%) | 462 (24.2%) |
| 2 Vehicles | 961 (51.9%) | 850 (44.6%) |
| 3 Vehicles | 323 (17.4%) | 278 (14.6%) |
| 4 Vehicles | 78 (4.2%) | 104 (5.5%) |
| 5 or more Vehicles | 175 (9.4%) | 161 (8.5%) |
| Total | 1,853 (100.0%) | 1,906 (100.0%) |
Commute Time in Sebastopol
The most frequently occuring commute durations in Sebastopol are 20 to 24 minutes (592 commuters, 19.1%), 25 to 29 minutes (524 commuters, 16.9%), and 30 to 34 minutes (471 commuters, 15.2%).
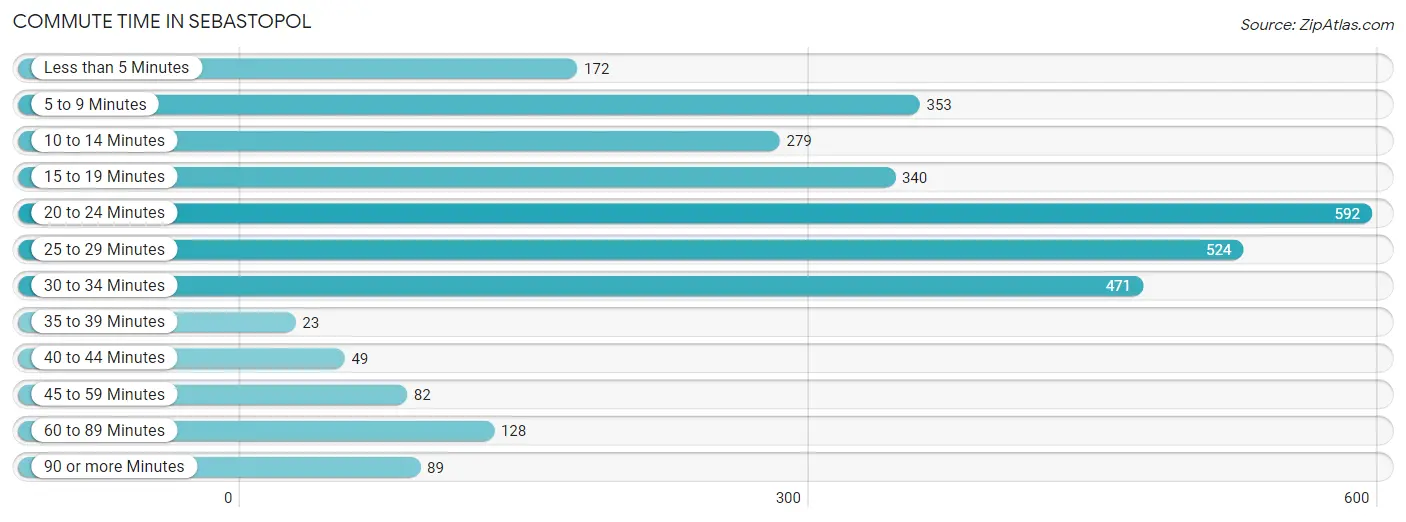
| Commute Time | # Commuters | % Commuters |
| Less than 5 Minutes | 172 | 5.5% |
| 5 to 9 Minutes | 353 | 11.4% |
| 10 to 14 Minutes | 279 | 9.0% |
| 15 to 19 Minutes | 340 | 11.0% |
| 20 to 24 Minutes | 592 | 19.1% |
| 25 to 29 Minutes | 524 | 16.9% |
| 30 to 34 Minutes | 471 | 15.2% |
| 35 to 39 Minutes | 23 | 0.7% |
| 40 to 44 Minutes | 49 | 1.6% |
| 45 to 59 Minutes | 82 | 2.6% |
| 60 to 89 Minutes | 128 | 4.1% |
| 90 or more Minutes | 89 | 2.9% |
Commute Time by Sex in Sebastopol
The most common commute times in Sebastopol are 20 to 24 minutes (289 commuters, 18.1%) for males and 20 to 24 minutes (303 commuters, 20.1%) for females.
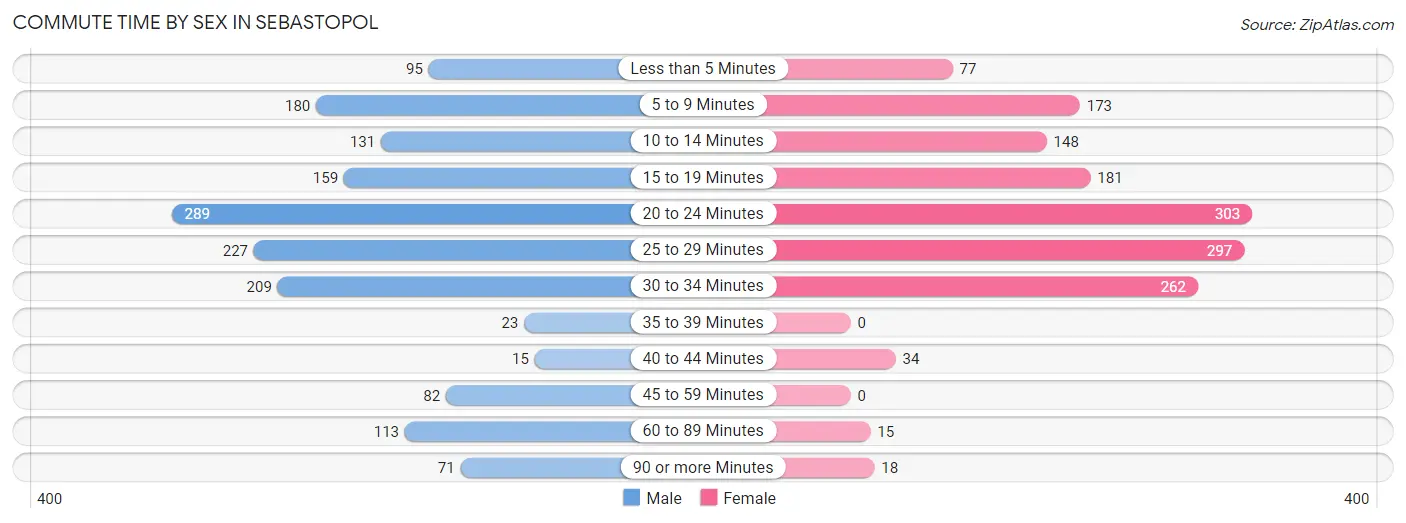
| Commute Time | Male | Female |
| Less than 5 Minutes | 95 (6.0%) | 77 (5.1%) |
| 5 to 9 Minutes | 180 (11.3%) | 173 (11.5%) |
| 10 to 14 Minutes | 131 (8.2%) | 148 (9.8%) |
| 15 to 19 Minutes | 159 (10.0%) | 181 (12.0%) |
| 20 to 24 Minutes | 289 (18.1%) | 303 (20.1%) |
| 25 to 29 Minutes | 227 (14.2%) | 297 (19.7%) |
| 30 to 34 Minutes | 209 (13.1%) | 262 (17.4%) |
| 35 to 39 Minutes | 23 (1.4%) | 0 (0.0%) |
| 40 to 44 Minutes | 15 (0.9%) | 34 (2.2%) |
| 45 to 59 Minutes | 82 (5.1%) | 0 (0.0%) |
| 60 to 89 Minutes | 113 (7.1%) | 15 (1.0%) |
| 90 or more Minutes | 71 (4.4%) | 18 (1.2%) |
Time of Departure to Work by Sex in Sebastopol
The most frequent times of departure to work in Sebastopol are 8:00 AM to 8:29 AM (309, 19.4%) for males and 8:00 AM to 8:29 AM (346, 22.9%) for females.
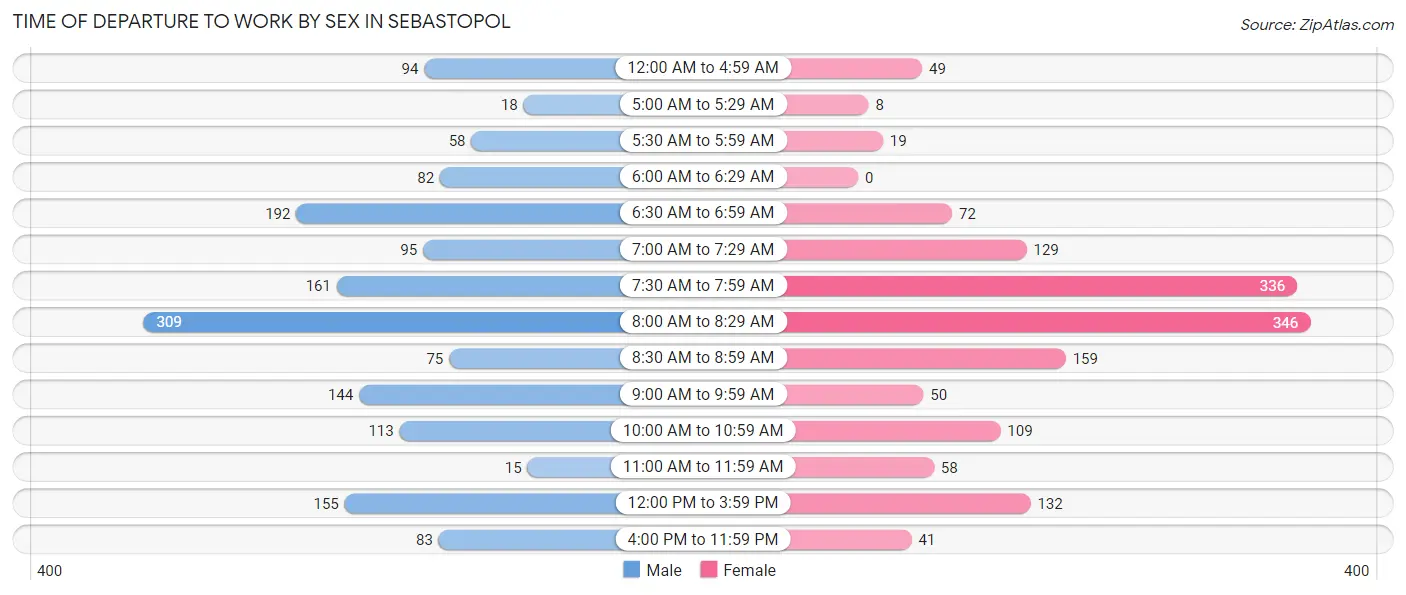
| Time of Departure | Male | Female |
| 12:00 AM to 4:59 AM | 94 (5.9%) | 49 (3.3%) |
| 5:00 AM to 5:29 AM | 18 (1.1%) | 8 (0.5%) |
| 5:30 AM to 5:59 AM | 58 (3.6%) | 19 (1.3%) |
| 6:00 AM to 6:29 AM | 82 (5.1%) | 0 (0.0%) |
| 6:30 AM to 6:59 AM | 192 (12.0%) | 72 (4.8%) |
| 7:00 AM to 7:29 AM | 95 (6.0%) | 129 (8.6%) |
| 7:30 AM to 7:59 AM | 161 (10.1%) | 336 (22.3%) |
| 8:00 AM to 8:29 AM | 309 (19.4%) | 346 (22.9%) |
| 8:30 AM to 8:59 AM | 75 (4.7%) | 159 (10.5%) |
| 9:00 AM to 9:59 AM | 144 (9.0%) | 50 (3.3%) |
| 10:00 AM to 10:59 AM | 113 (7.1%) | 109 (7.2%) |
| 11:00 AM to 11:59 AM | 15 (0.9%) | 58 (3.8%) |
| 12:00 PM to 3:59 PM | 155 (9.7%) | 132 (8.7%) |
| 4:00 PM to 11:59 PM | 83 (5.2%) | 41 (2.7%) |
| Total | 1,594 (100.0%) | 1,508 (100.0%) |
Housing Occupancy in Sebastopol
Occupancy by Ownership in Sebastopol
Of the total 3,258 dwellings in Sebastopol, owner-occupied units account for 1,816 (55.7%), while renter-occupied units make up 1,442 (44.3%).
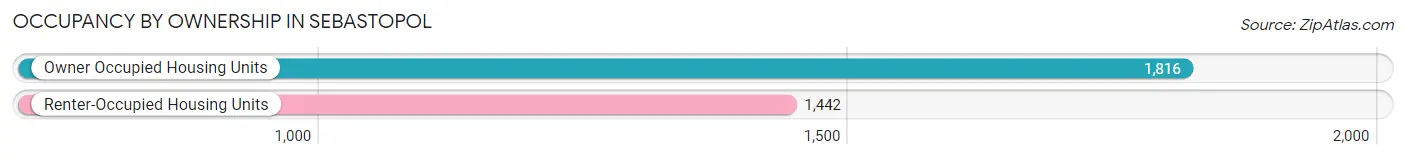
| Occupancy | # Housing Units | % Housing Units |
| Owner Occupied Housing Units | 1,816 | 55.7% |
| Renter-Occupied Housing Units | 1,442 | 44.3% |
| Total Occupied Housing Units | 3,258 | 100.0% |
Occupancy by Household Size in Sebastopol
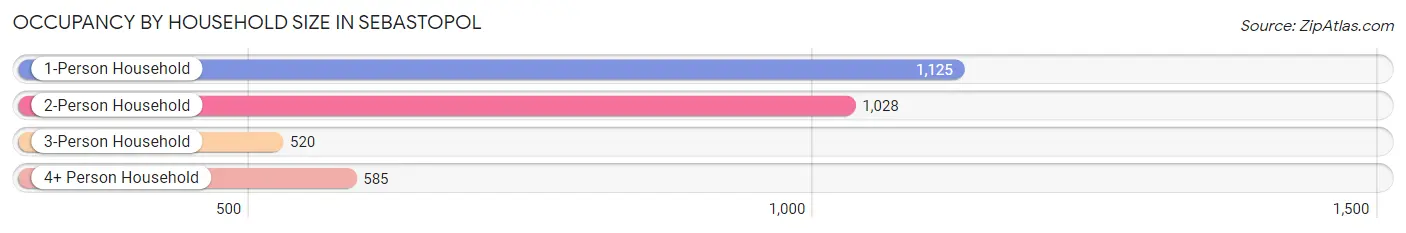
| Household Size | # Housing Units | % Housing Units |
| 1-Person Household | 1,125 | 34.5% |
| 2-Person Household | 1,028 | 31.6% |
| 3-Person Household | 520 | 16.0% |
| 4+ Person Household | 585 | 18.0% |
| Total Housing Units | 3,258 | 100.0% |
Occupancy by Ownership by Household Size in Sebastopol
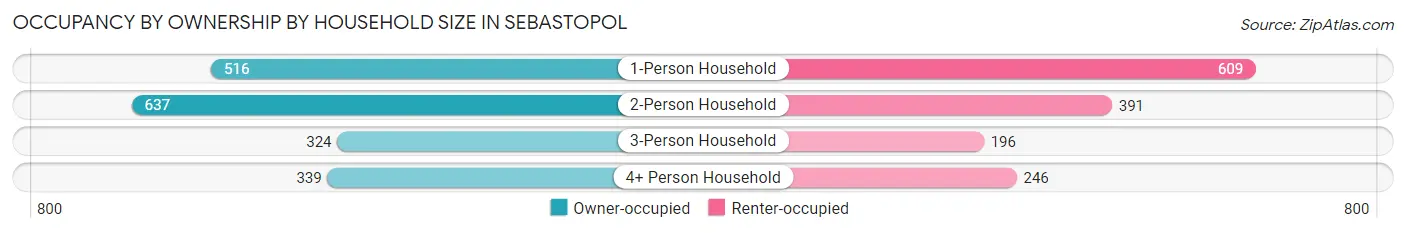
| Household Size | Owner-occupied | Renter-occupied |
| 1-Person Household | 516 (45.9%) | 609 (54.1%) |
| 2-Person Household | 637 (62.0%) | 391 (38.0%) |
| 3-Person Household | 324 (62.3%) | 196 (37.7%) |
| 4+ Person Household | 339 (58.0%) | 246 (42.0%) |
| Total Housing Units | 1,816 (55.7%) | 1,442 (44.3%) |
Occupancy by Educational Attainment in Sebastopol
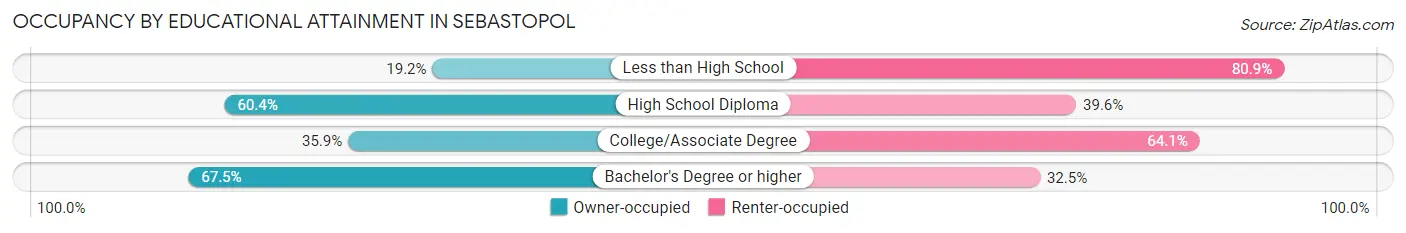
| Household Size | Owner-occupied | Renter-occupied |
| Less than High School | 9 (19.2%) | 38 (80.8%) |
| High School Diploma | 306 (60.4%) | 201 (39.6%) |
| College/Associate Degree | 368 (35.9%) | 658 (64.1%) |
| Bachelor's Degree or higher | 1,133 (67.5%) | 545 (32.5%) |
Occupancy by Age of Householder in Sebastopol
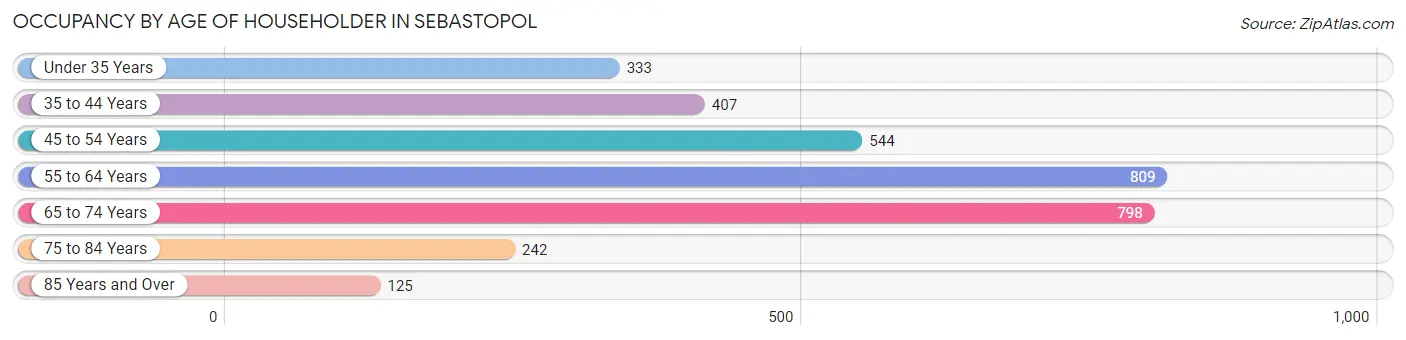
| Age Bracket | # Households | % Households |
| Under 35 Years | 333 | 10.2% |
| 35 to 44 Years | 407 | 12.5% |
| 45 to 54 Years | 544 | 16.7% |
| 55 to 64 Years | 809 | 24.8% |
| 65 to 74 Years | 798 | 24.5% |
| 75 to 84 Years | 242 | 7.4% |
| 85 Years and Over | 125 | 3.8% |
| Total | 3,258 | 100.0% |
Housing Finances in Sebastopol
Median Income by Occupancy in Sebastopol
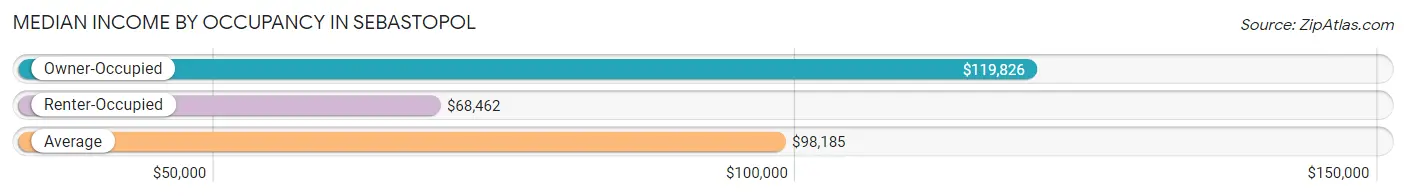
| Occupancy Type | # Households | Median Income |
| Owner-Occupied | 1,816 (55.7%) | $119,826 |
| Renter-Occupied | 1,442 (44.3%) | $68,462 |
| Average | 3,258 (100.0%) | $98,185 |
Occupancy by Householder Income Bracket in Sebastopol
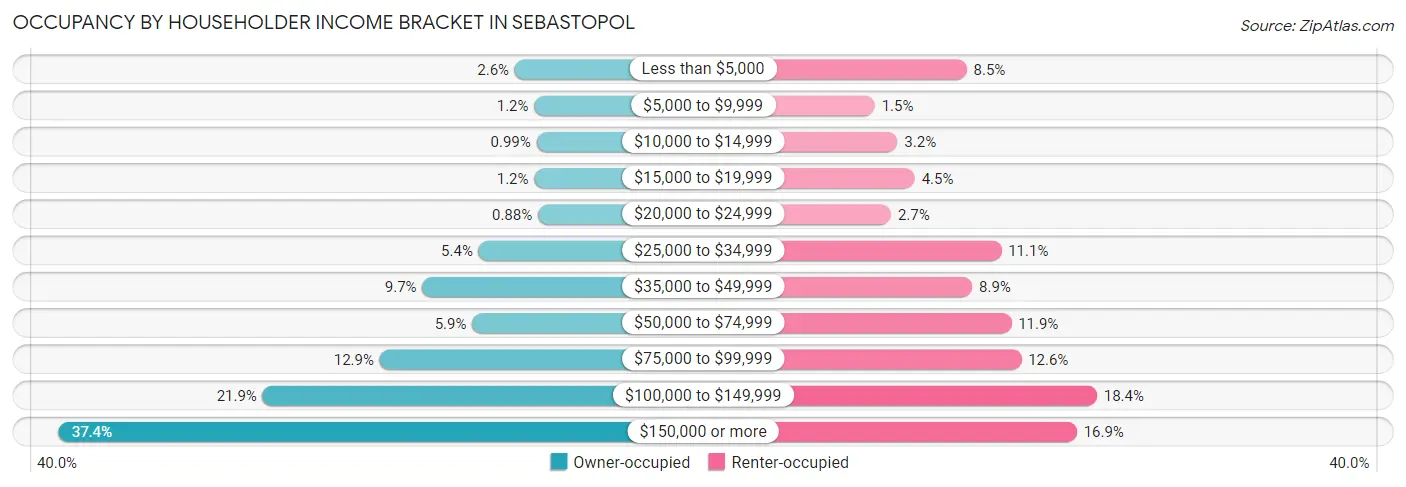
| Income Bracket | Owner-occupied | Renter-occupied |
| Less than $5,000 | 48 (2.6%) | 122 (8.5%) |
| $5,000 to $9,999 | 21 (1.2%) | 21 (1.5%) |
| $10,000 to $14,999 | 18 (1.0%) | 46 (3.2%) |
| $15,000 to $19,999 | 21 (1.2%) | 65 (4.5%) |
| $20,000 to $24,999 | 16 (0.9%) | 39 (2.7%) |
| $25,000 to $34,999 | 98 (5.4%) | 160 (11.1%) |
| $35,000 to $49,999 | 176 (9.7%) | 128 (8.9%) |
| $50,000 to $74,999 | 107 (5.9%) | 171 (11.9%) |
| $75,000 to $99,999 | 235 (12.9%) | 182 (12.6%) |
| $100,000 to $149,999 | 397 (21.9%) | 265 (18.4%) |
| $150,000 or more | 679 (37.4%) | 243 (16.9%) |
| Total | 1,816 (100.0%) | 1,442 (100.0%) |
Monthly Housing Cost Tiers in Sebastopol
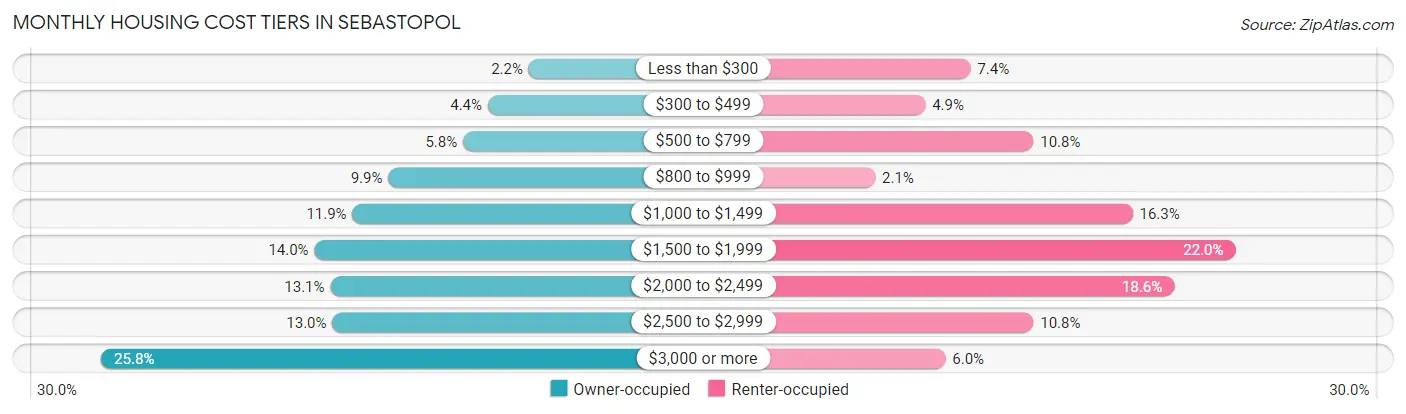
| Monthly Cost | Owner-occupied | Renter-occupied |
| Less than $300 | 39 (2.1%) | 106 (7.3%) |
| $300 to $499 | 80 (4.4%) | 70 (4.9%) |
| $500 to $799 | 105 (5.8%) | 156 (10.8%) |
| $800 to $999 | 180 (9.9%) | 30 (2.1%) |
| $1,000 to $1,499 | 216 (11.9%) | 235 (16.3%) |
| $1,500 to $1,999 | 254 (14.0%) | 317 (22.0%) |
| $2,000 to $2,499 | 238 (13.1%) | 268 (18.6%) |
| $2,500 to $2,999 | 236 (13.0%) | 156 (10.8%) |
| $3,000 or more | 468 (25.8%) | 86 (6.0%) |
| Total | 1,816 (100.0%) | 1,442 (100.0%) |
Physical Housing Characteristics in Sebastopol
Housing Structures in Sebastopol
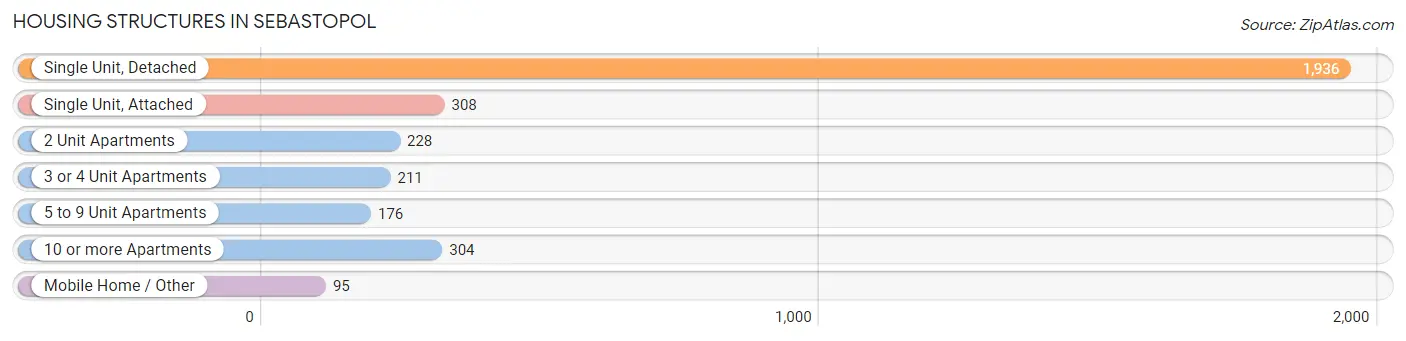
| Structure Type | # Housing Units | % Housing Units |
| Single Unit, Detached | 1,936 | 59.4% |
| Single Unit, Attached | 308 | 9.5% |
| 2 Unit Apartments | 228 | 7.0% |
| 3 or 4 Unit Apartments | 211 | 6.5% |
| 5 to 9 Unit Apartments | 176 | 5.4% |
| 10 or more Apartments | 304 | 9.3% |
| Mobile Home / Other | 95 | 2.9% |
| Total | 3,258 | 100.0% |
Housing Structures by Occupancy in Sebastopol
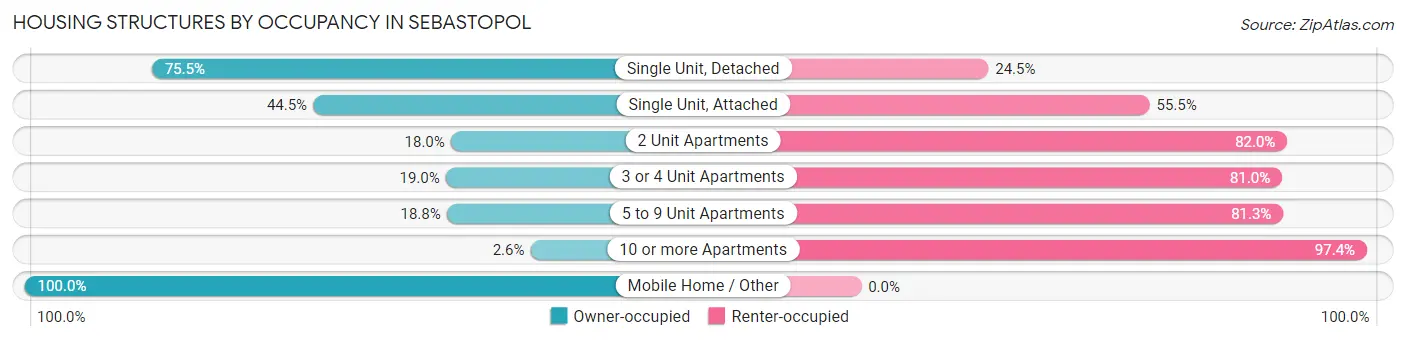
| Structure Type | Owner-occupied | Renter-occupied |
| Single Unit, Detached | 1,462 (75.5%) | 474 (24.5%) |
| Single Unit, Attached | 137 (44.5%) | 171 (55.5%) |
| 2 Unit Apartments | 41 (18.0%) | 187 (82.0%) |
| 3 or 4 Unit Apartments | 40 (19.0%) | 171 (81.0%) |
| 5 to 9 Unit Apartments | 33 (18.8%) | 143 (81.2%) |
| 10 or more Apartments | 8 (2.6%) | 296 (97.4%) |
| Mobile Home / Other | 95 (100.0%) | 0 (0.0%) |
| Total | 1,816 (55.7%) | 1,442 (44.3%) |
Housing Structures by Number of Rooms in Sebastopol
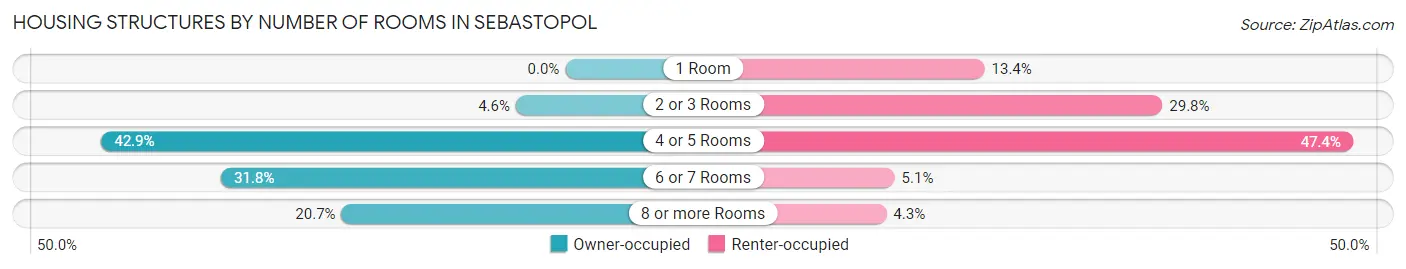
| Number of Rooms | Owner-occupied | Renter-occupied |
| 1 Room | 0 (0.0%) | 193 (13.4%) |
| 2 or 3 Rooms | 83 (4.6%) | 430 (29.8%) |
| 4 or 5 Rooms | 779 (42.9%) | 684 (47.4%) |
| 6 or 7 Rooms | 578 (31.8%) | 73 (5.1%) |
| 8 or more Rooms | 376 (20.7%) | 62 (4.3%) |
| Total | 1,816 (100.0%) | 1,442 (100.0%) |
Housing Structure by Heating Type in Sebastopol
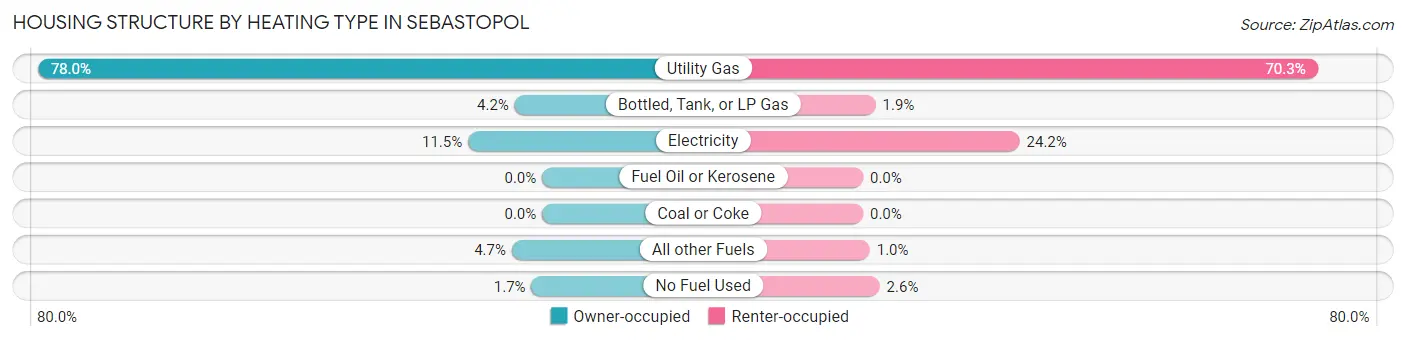
| Heating Type | Owner-occupied | Renter-occupied |
| Utility Gas | 1,416 (78.0%) | 1,013 (70.3%) |
| Bottled, Tank, or LP Gas | 77 (4.2%) | 28 (1.9%) |
| Electricity | 208 (11.5%) | 349 (24.2%) |
| Fuel Oil or Kerosene | 0 (0.0%) | 0 (0.0%) |
| Coal or Coke | 0 (0.0%) | 0 (0.0%) |
| All other Fuels | 85 (4.7%) | 15 (1.0%) |
| No Fuel Used | 30 (1.7%) | 37 (2.6%) |
| Total | 1,816 (100.0%) | 1,442 (100.0%) |
Household Vehicle Usage in Sebastopol
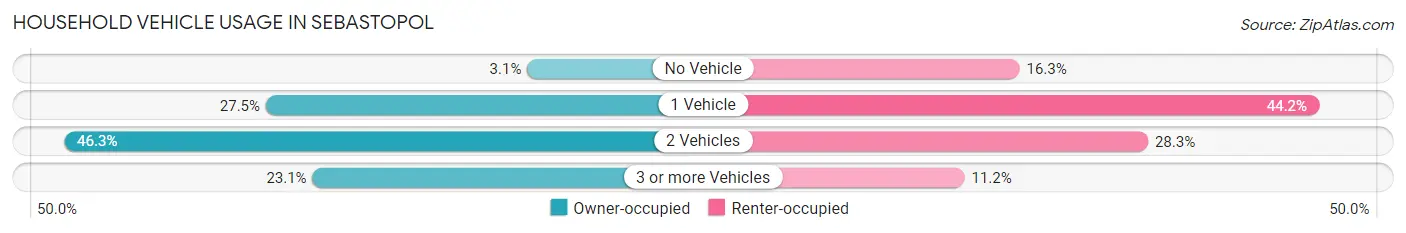
| Vehicles per Household | Owner-occupied | Renter-occupied |
| No Vehicle | 56 (3.1%) | 235 (16.3%) |
| 1 Vehicle | 499 (27.5%) | 638 (44.2%) |
| 2 Vehicles | 841 (46.3%) | 408 (28.3%) |
| 3 or more Vehicles | 420 (23.1%) | 161 (11.2%) |
| Total | 1,816 (100.0%) | 1,442 (100.0%) |
Real Estate & Mortgages in Sebastopol
Real Estate and Mortgage Overview in Sebastopol
| Characteristic | Without Mortgage | With Mortgage |
| Housing Units | 615 | 1,201 |
| Median Property Value | $764,000 | $841,200 |
| Median Household Income | $91,402 | $530 |
| Monthly Housing Costs | $942 | $460 |
| Real Estate Taxes | $5,071 | $14 |
Property Value by Mortgage Status in Sebastopol
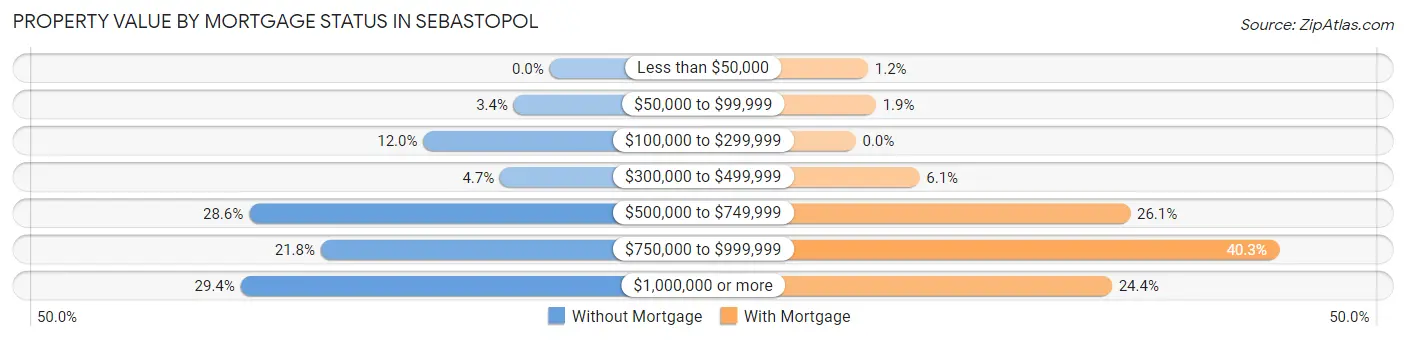
| Property Value | Without Mortgage | With Mortgage |
| Less than $50,000 | 0 (0.0%) | 14 (1.2%) |
| $50,000 to $99,999 | 21 (3.4%) | 23 (1.9%) |
| $100,000 to $299,999 | 74 (12.0%) | 0 (0.0%) |
| $300,000 to $499,999 | 29 (4.7%) | 73 (6.1%) |
| $500,000 to $749,999 | 176 (28.6%) | 314 (26.1%) |
| $750,000 to $999,999 | 134 (21.8%) | 484 (40.3%) |
| $1,000,000 or more | 181 (29.4%) | 293 (24.4%) |
| Total | 615 (100.0%) | 1,201 (100.0%) |
Household Income by Mortgage Status in Sebastopol
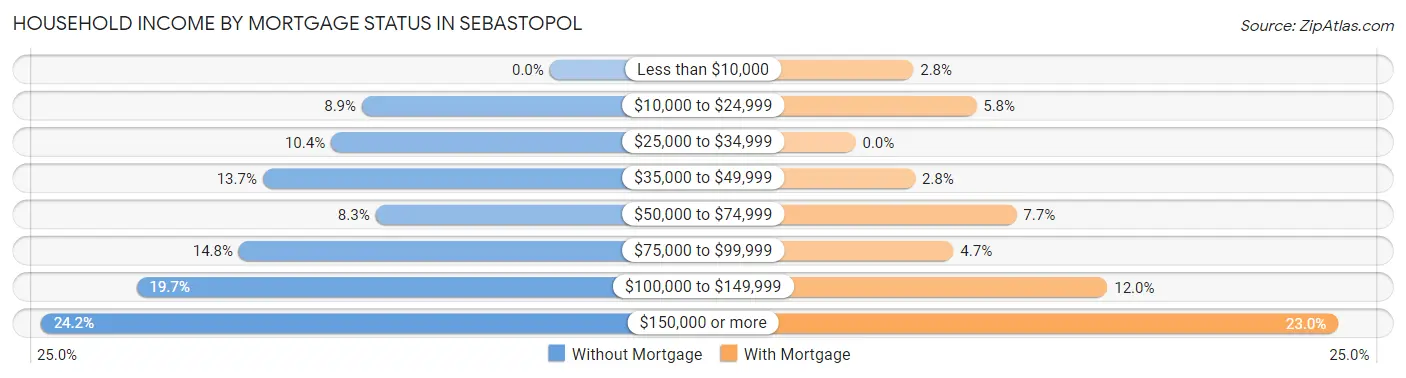
| Household Income | Without Mortgage | With Mortgage |
| Less than $10,000 | 0 (0.0%) | 33 (2.8%) |
| $10,000 to $24,999 | 55 (8.9%) | 69 (5.8%) |
| $25,000 to $34,999 | 64 (10.4%) | 0 (0.0%) |
| $35,000 to $49,999 | 84 (13.7%) | 34 (2.8%) |
| $50,000 to $74,999 | 51 (8.3%) | 92 (7.7%) |
| $75,000 to $99,999 | 91 (14.8%) | 56 (4.7%) |
| $100,000 to $149,999 | 121 (19.7%) | 144 (12.0%) |
| $150,000 or more | 149 (24.2%) | 276 (23.0%) |
| Total | 615 (100.0%) | 1,201 (100.0%) |
Property Value to Household Income Ratio in Sebastopol
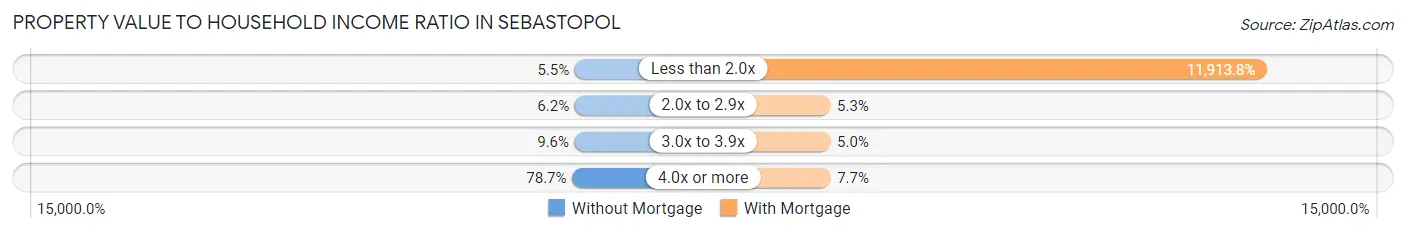
| Value-to-Income Ratio | Without Mortgage | With Mortgage |
| Less than 2.0x | 34 (5.5%) | 143,085 (11,913.8%) |
| 2.0x to 2.9x | 38 (6.2%) | 64 (5.3%) |
| 3.0x to 3.9x | 59 (9.6%) | 60 (5.0%) |
| 4.0x or more | 484 (78.7%) | 93 (7.7%) |
| Total | 615 (100.0%) | 1,201 (100.0%) |
Real Estate Taxes by Mortgage Status in Sebastopol
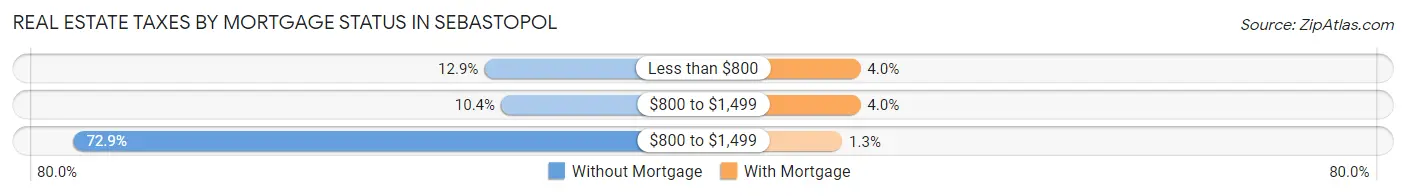
| Property Taxes | Without Mortgage | With Mortgage |
| Less than $800 | 79 (12.9%) | 48 (4.0%) |
| $800 to $1,499 | 64 (10.4%) | 48 (4.0%) |
| $800 to $1,499 | 448 (72.9%) | 16 (1.3%) |
| Total | 615 (100.0%) | 1,201 (100.0%) |
Health & Disability in Sebastopol
Health Insurance Coverage by Age in Sebastopol
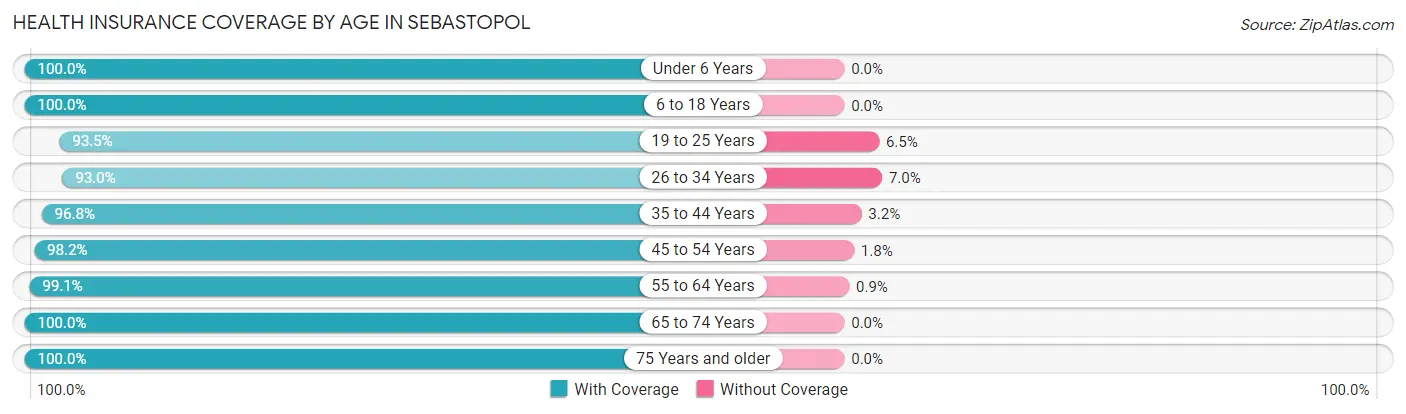
| Age Bracket | With Coverage | Without Coverage |
| Under 6 Years | 365 (100.0%) | 0 (0.0%) |
| 6 to 18 Years | 1,008 (100.0%) | 0 (0.0%) |
| 19 to 25 Years | 506 (93.5%) | 35 (6.5%) |
| 26 to 34 Years | 727 (93.0%) | 55 (7.0%) |
| 35 to 44 Years | 668 (96.8%) | 22 (3.2%) |
| 45 to 54 Years | 1,042 (98.2%) | 19 (1.8%) |
| 55 to 64 Years | 1,095 (99.1%) | 10 (0.9%) |
| 65 to 74 Years | 1,367 (100.0%) | 0 (0.0%) |
| 75 Years and older | 466 (100.0%) | 0 (0.0%) |
| Total | 7,244 (98.1%) | 141 (1.9%) |
Health Insurance Coverage by Citizenship Status in Sebastopol
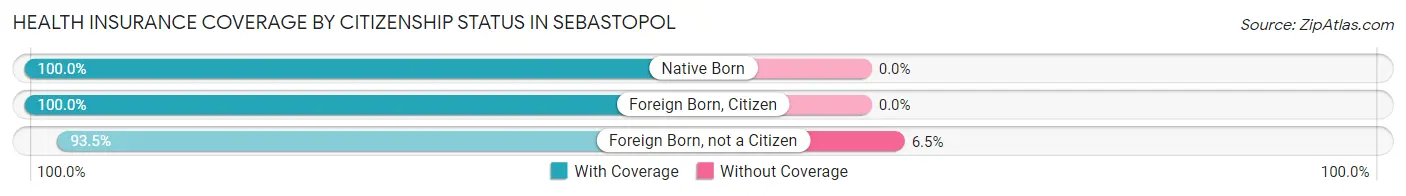
| Citizenship Status | With Coverage | Without Coverage |
| Native Born | 365 (100.0%) | 0 (0.0%) |
| Foreign Born, Citizen | 1,008 (100.0%) | 0 (0.0%) |
| Foreign Born, not a Citizen | 506 (93.5%) | 35 (6.5%) |
Health Insurance Coverage by Household Income in Sebastopol
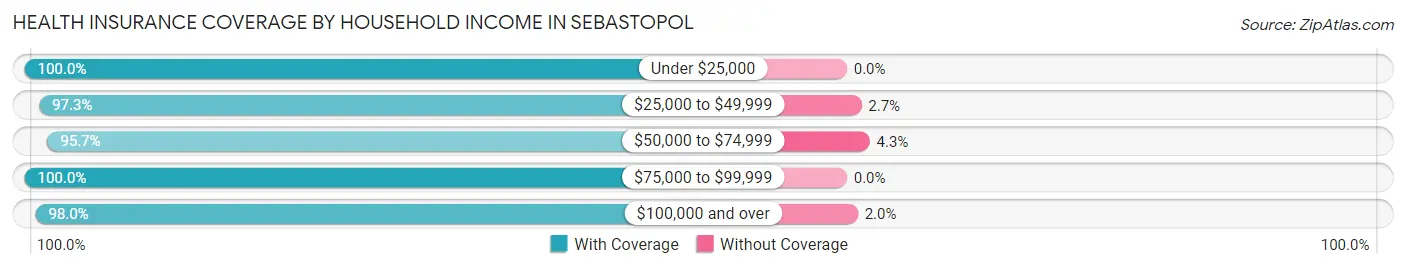
| Household Income | With Coverage | Without Coverage |
| Under $25,000 | 514 (100.0%) | 0 (0.0%) |
| $25,000 to $49,999 | 859 (97.3%) | 24 (2.7%) |
| $50,000 to $74,999 | 606 (95.7%) | 27 (4.3%) |
| $75,000 to $99,999 | 928 (100.0%) | 0 (0.0%) |
| $100,000 and over | 4,318 (98.0%) | 90 (2.0%) |
Public vs Private Health Insurance Coverage by Age in Sebastopol
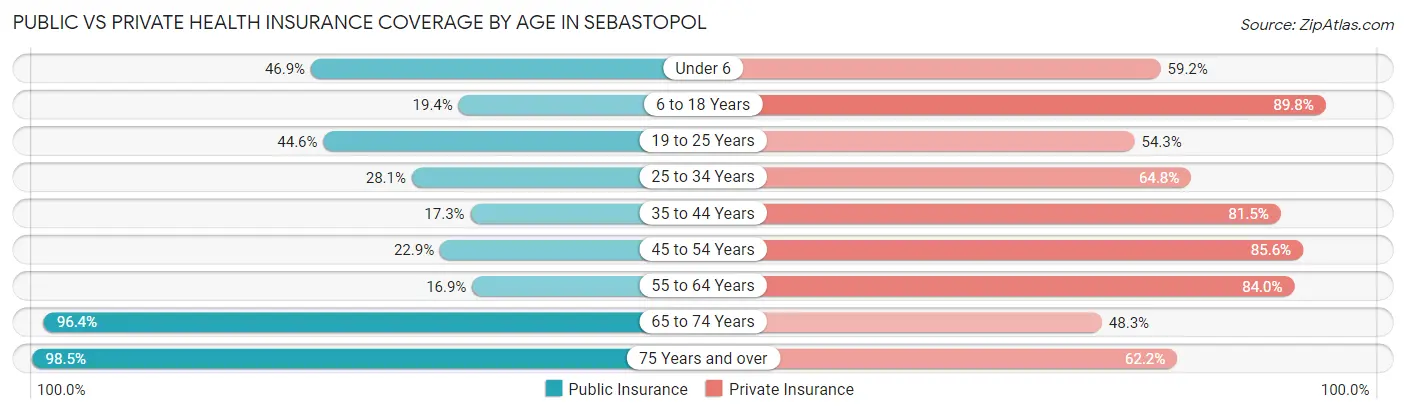
| Age Bracket | Public Insurance | Private Insurance |
| Under 6 | 171 (46.9%) | 216 (59.2%) |
| 6 to 18 Years | 196 (19.4%) | 905 (89.8%) |
| 19 to 25 Years | 241 (44.6%) | 294 (54.3%) |
| 25 to 34 Years | 220 (28.1%) | 507 (64.8%) |
| 35 to 44 Years | 119 (17.2%) | 562 (81.5%) |
| 45 to 54 Years | 243 (22.9%) | 908 (85.6%) |
| 55 to 64 Years | 187 (16.9%) | 928 (84.0%) |
| 65 to 74 Years | 1,318 (96.4%) | 660 (48.3%) |
| 75 Years and over | 459 (98.5%) | 290 (62.2%) |
| Total | 3,154 (42.7%) | 5,270 (71.4%) |
Disability Status by Sex by Age in Sebastopol
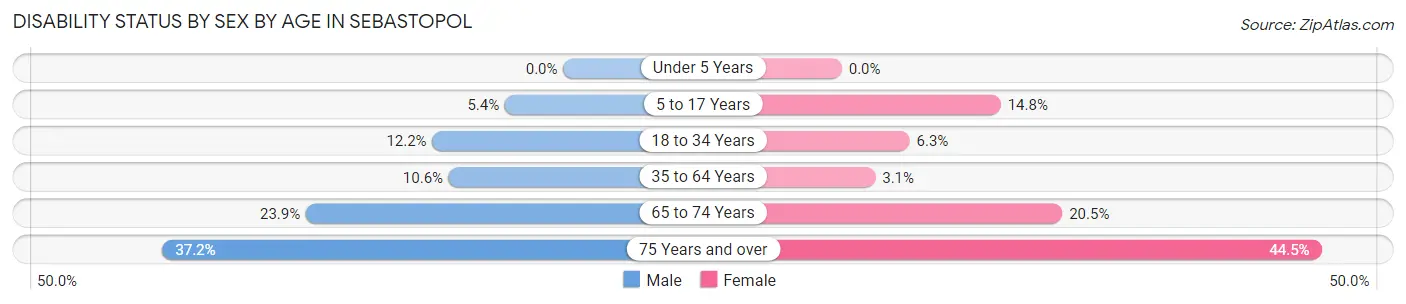
| Age Bracket | Male | Female |
| Under 5 Years | 0 (0.0%) | 0 (0.0%) |
| 5 to 17 Years | 20 (5.4%) | 86 (14.7%) |
| 18 to 34 Years | 100 (12.1%) | 39 (6.3%) |
| 35 to 64 Years | 136 (10.6%) | 49 (3.1%) |
| 65 to 74 Years | 149 (23.9%) | 152 (20.5%) |
| 75 Years and over | 48 (37.2%) | 150 (44.5%) |
Disability Class by Sex by Age in Sebastopol
Disability Class: Hearing Difficulty
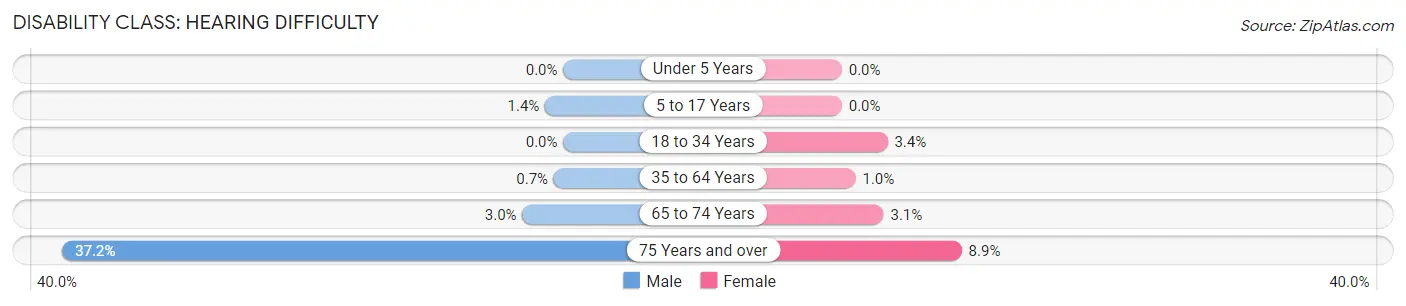
| Age Bracket | Male | Female |
| Under 5 Years | 0 (0.0%) | 0 (0.0%) |
| 5 to 17 Years | 5 (1.3%) | 0 (0.0%) |
| 18 to 34 Years | 0 (0.0%) | 21 (3.4%) |
| 35 to 64 Years | 9 (0.7%) | 16 (1.0%) |
| 65 to 74 Years | 19 (3.0%) | 23 (3.1%) |
| 75 Years and over | 48 (37.2%) | 30 (8.9%) |
Disability Class: Vision Difficulty
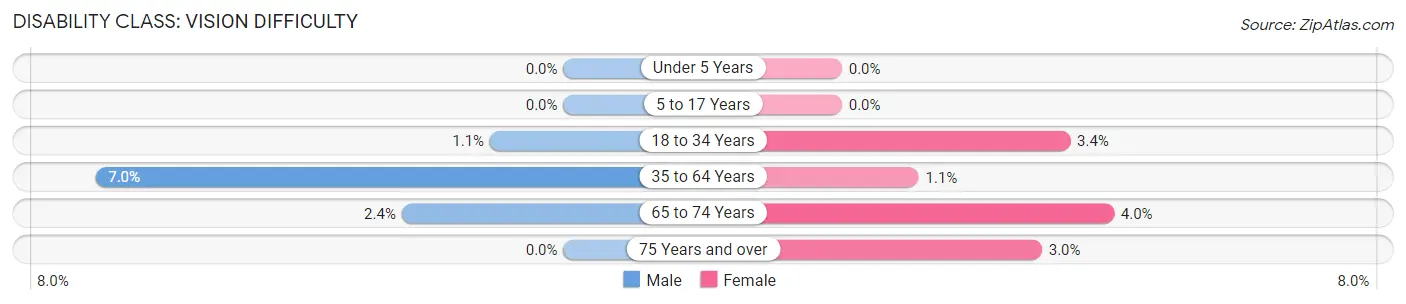
| Age Bracket | Male | Female |
| Under 5 Years | 0 (0.0%) | 0 (0.0%) |
| 5 to 17 Years | 0 (0.0%) | 0 (0.0%) |
| 18 to 34 Years | 9 (1.1%) | 21 (3.4%) |
| 35 to 64 Years | 89 (7.0%) | 18 (1.1%) |
| 65 to 74 Years | 15 (2.4%) | 30 (4.0%) |
| 75 Years and over | 0 (0.0%) | 10 (3.0%) |
Disability Class: Cognitive Difficulty
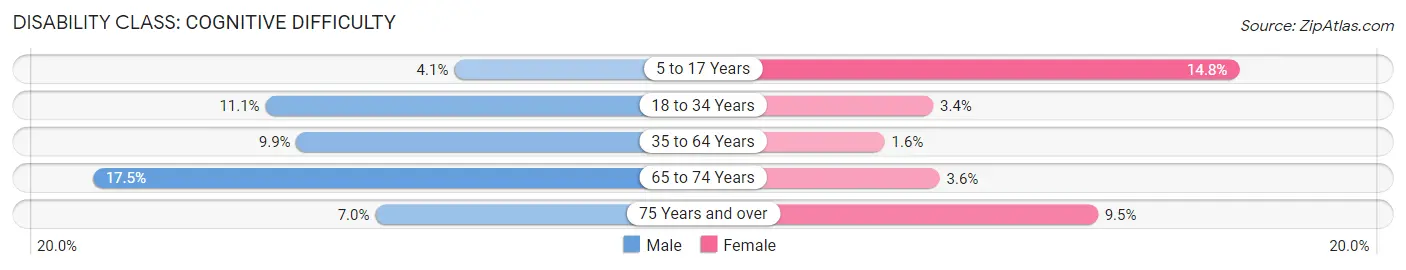
| Age Bracket | Male | Female |
| 5 to 17 Years | 15 (4.1%) | 86 (14.7%) |
| 18 to 34 Years | 91 (11.1%) | 21 (3.4%) |
| 35 to 64 Years | 127 (9.9%) | 25 (1.6%) |
| 65 to 74 Years | 109 (17.5%) | 27 (3.6%) |
| 75 Years and over | 9 (7.0%) | 32 (9.5%) |
Disability Class: Ambulatory Difficulty
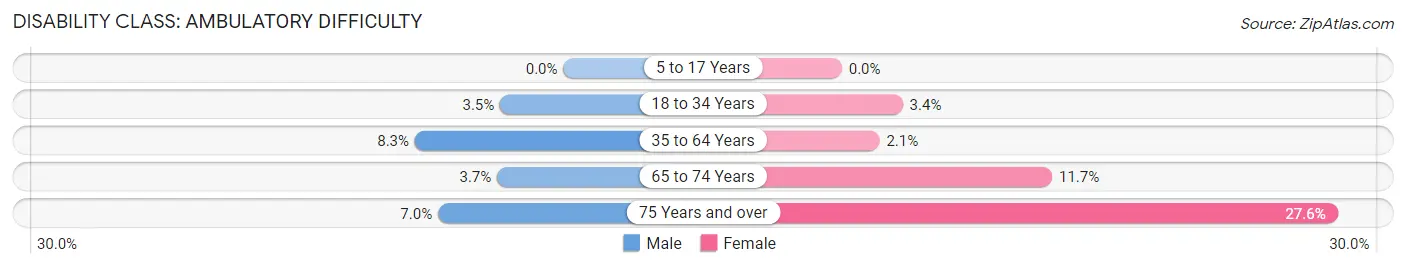
| Age Bracket | Male | Female |
| 5 to 17 Years | 0 (0.0%) | 0 (0.0%) |
| 18 to 34 Years | 29 (3.5%) | 21 (3.4%) |
| 35 to 64 Years | 106 (8.3%) | 33 (2.1%) |
| 65 to 74 Years | 23 (3.7%) | 87 (11.7%) |
| 75 Years and over | 9 (7.0%) | 93 (27.6%) |
Disability Class: Self-Care Difficulty
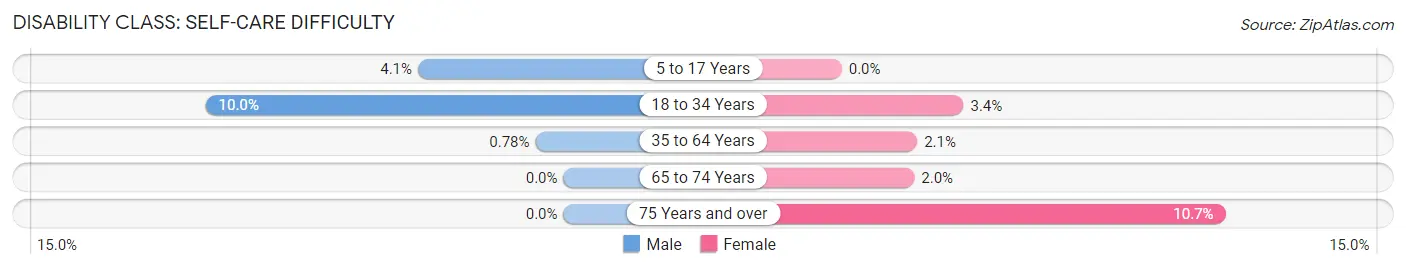
| Age Bracket | Male | Female |
| 5 to 17 Years | 15 (4.1%) | 0 (0.0%) |
| 18 to 34 Years | 82 (10.0%) | 21 (3.4%) |
| 35 to 64 Years | 10 (0.8%) | 33 (2.1%) |
| 65 to 74 Years | 0 (0.0%) | 15 (2.0%) |
| 75 Years and over | 0 (0.0%) | 36 (10.7%) |
Technology Access in Sebastopol
Computing Device Access in Sebastopol
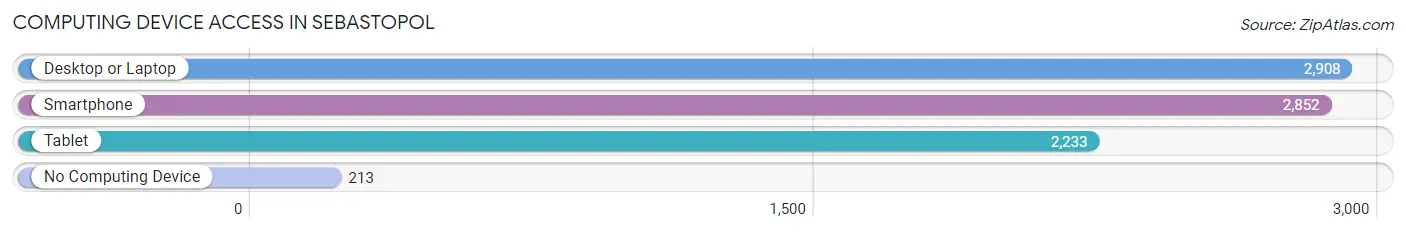
| Device Type | # Households | % Households |
| Desktop or Laptop | 2,908 | 89.3% |
| Smartphone | 2,852 | 87.5% |
| Tablet | 2,233 | 68.5% |
| No Computing Device | 213 | 6.5% |
| Total | 3,258 | 100.0% |
Internet Access in Sebastopol
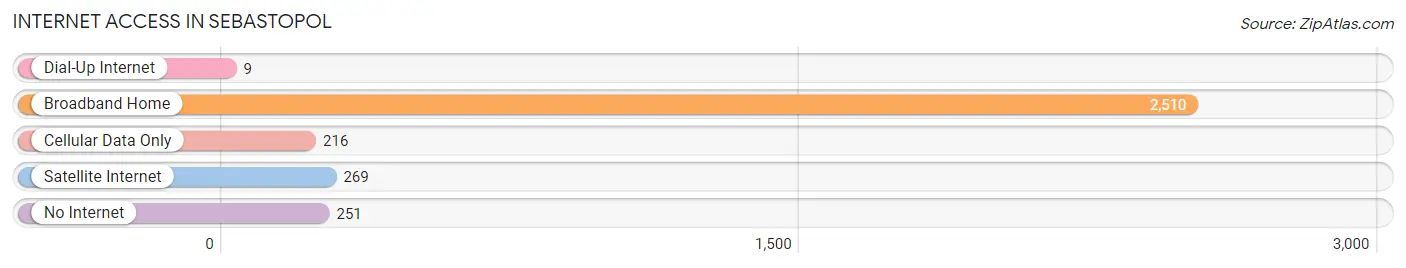
| Internet Type | # Households | % Households |
| Dial-Up Internet | 9 | 0.3% |
| Broadband Home | 2,510 | 77.0% |
| Cellular Data Only | 216 | 6.6% |
| Satellite Internet | 269 | 8.3% |
| No Internet | 251 | 7.7% |
| Total | 3,258 | 100.0% |
Sebastopol Summary
Sebastopol is a city located in Sonoma County, California, United States. It is situated about 50 miles north of San Francisco and is part of the North Bay region of the San Francisco Bay Area. The population was 7,379 at the 2010 census. It is known for its liberal politics and small-town charm.
History
The area around Sebastopol was originally inhabited by the Coast Miwok Native American tribe. The first European settlers arrived in the area in the 1850s, and the town was officially founded in 1857. It was named after the Russian city of Sebastopol, which was the site of a major battle during the Crimean War.
The town grew slowly but steadily over the years, and by the early 1900s it had become a popular tourist destination. It was known for its apple orchards, which were a major source of income for the town. The apple industry declined in the mid-20th century, but the town remains a popular destination for tourists and wine enthusiasts.
Geography
Sebastopol is located in the western part of Sonoma County, about 50 miles north of San Francisco. It is situated in the Russian River Valley, and is surrounded by rolling hills and vineyards. The city covers an area of 4.3 square miles, and has a population density of 1,717 people per square mile.
The climate in Sebastopol is mild and temperate, with warm summers and cool winters. The average annual temperature is 57 degrees Fahrenheit, and the average annual precipitation is 28 inches.
Economy
Sebastopol’s economy is largely based on tourism and agriculture. The city is home to several wineries, and is a popular destination for wine enthusiasts. It is also known for its apple orchards, which are a major source of income for the town. Other industries in the area include retail, healthcare, and manufacturing.
Demographics
As of the 2010 census, the population of Sebastopol was 7,379. The racial makeup of the city was 79.2% White, 0.7% African American, 0.7% Native American, 8.2% Asian, 0.2% Pacific Islander, 8.2% from other races, and 2.7% from two or more races. Hispanic or Latino of any race were 16.3% of the population.
The median household income in Sebastopol was $60,945, and the median family income was $71,817. The per capita income was $31,945. About 11.2% of the population was below the poverty line.
Sebastopol is a small city with a unique history and culture. It is known for its liberal politics and small-town charm, and is a popular destination for tourists and wine enthusiasts. The city’s economy is largely based on tourism and agriculture, and it is home to several wineries and apple orchards. The population of Sebastopol is diverse, with a mix of different racial and ethnic backgrounds.
Common Questions
What is Per Capita Income in Sebastopol?
Per Capita income in Sebastopol is $49,297.
What is the Median Family Income in Sebastopol?
Median Family Income in Sebastopol is $130,865.
What is the Median Household income in Sebastopol?
Median Household Income in Sebastopol is $98,185.
What is Income or Wage Gap in Sebastopol?
Income or Wage Gap in Sebastopol is 18.0%.
Women in Sebastopol earn 82.0 cents for every dollar earned by a man.
What is Inequality or Gini Index in Sebastopol?
Inequality or Gini Index in Sebastopol is 0.43.
What is the Total Population of Sebastopol?
Total Population of Sebastopol is 7,503.
What is the Total Male Population of Sebastopol?
Total Male Population of Sebastopol is 3,436.
What is the Total Female Population of Sebastopol?
Total Female Population of Sebastopol is 4,067.
What is the Ratio of Males per 100 Females in Sebastopol?
There are 84.48 Males per 100 Females in Sebastopol.
What is the Ratio of Females per 100 Males in Sebastopol?
There are 118.36 Females per 100 Males in Sebastopol.
What is the Median Population Age in Sebastopol?
Median Population Age in Sebastopol is 48.8 Years.
What is the Average Family Size in Sebastopol
Average Family Size in Sebastopol is 2.9 People.
What is the Average Household Size in Sebastopol
Average Household Size in Sebastopol is 2.3 People.
How Large is the Labor Force in Sebastopol?
There are 4,000 People in the Labor Forcein in Sebastopol.
What is the Percentage of People in the Labor Force in Sebastopol?
62.9% of People are in the Labor Force in Sebastopol.
What is the Unemployment Rate in Sebastopol?
Unemployment Rate in Sebastopol is 5.5%.