Scotia, CA Map & Demographics
Scotia Map
Scotia Overview
$24,710
PER CAPITA INCOME
$60,795
AVG FAMILY INCOME
$61,250
AVG HOUSEHOLD INCOME
55.4%
WAGE / INCOME GAP [ % ]
44.6¢/ $1
WAGE / INCOME GAP [ $ ]
0.34
INEQUALITY / GINI INDEX
510
TOTAL POPULATION
232
MALE POPULATION
278
FEMALE POPULATION
83.45
MALES / 100 FEMALES
119.83
FEMALES / 100 MALES
31.9
MEDIAN AGE
3.4
AVG FAMILY SIZE
3.2
AVG HOUSEHOLD SIZE
226
LABOR FORCE [ PEOPLE ]
60.4%
PERCENT IN LABOR FORCE
13.3%
UNEMPLOYMENT RATE
Scotia Zip Codes
Scotia Area Codes
Income in Scotia
Income Overview in Scotia
Per Capita Income in Scotia is $24,710, while median incomes of families and households are $60,795 and $61,250 respectively.
| Characteristic | Number | Measure |
| Per Capita Income | 510 | $24,710 |
| Median Family Income | 121 | $60,795 |
| Mean Family Income | 121 | $78,363 |
| Median Household Income | 161 | $61,250 |
| Mean Household Income | 161 | $79,055 |
| Income Deficit | 121 | $0 |
| Wage / Income Gap (%) | 510 | 55.41% |
| Wage / Income Gap ($) | 510 | 44.59¢ per $1 |
| Gini / Inequality Index | 510 | 0.34 |
Earnings by Sex in Scotia
Average Earnings in Scotia are $38,403, $54,464 for men and $24,286 for women, a difference of 55.4%.
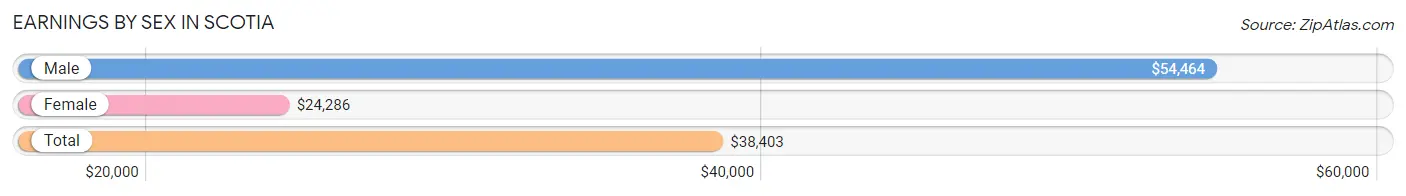
| Sex | Number | Average Earnings |
| Male | 123 (52.3%) | $54,464 |
| Female | 112 (47.7%) | $24,286 |
| Total | 235 (100.0%) | $38,403 |
Earnings by Sex by Income Bracket in Scotia
The most common earnings brackets in Scotia are $75,000 to $99,999 for men (37 | 30.1%) and $7,500 to $9,999 for women (22 | 19.6%).
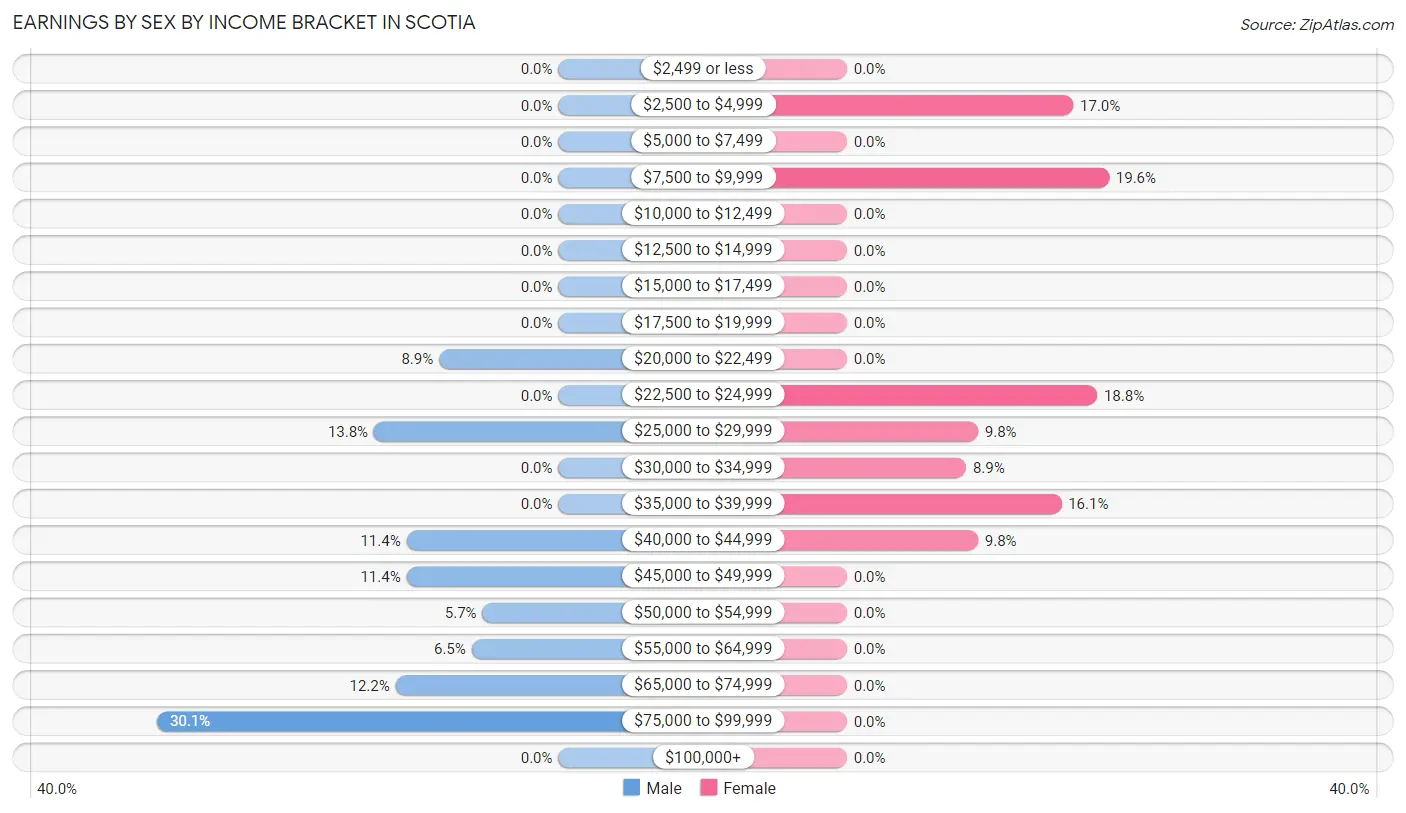
| Income | Male | Female |
| $2,499 or less | 0 (0.0%) | 0 (0.0%) |
| $2,500 to $4,999 | 0 (0.0%) | 19 (17.0%) |
| $5,000 to $7,499 | 0 (0.0%) | 0 (0.0%) |
| $7,500 to $9,999 | 0 (0.0%) | 22 (19.6%) |
| $10,000 to $12,499 | 0 (0.0%) | 0 (0.0%) |
| $12,500 to $14,999 | 0 (0.0%) | 0 (0.0%) |
| $15,000 to $17,499 | 0 (0.0%) | 0 (0.0%) |
| $17,500 to $19,999 | 0 (0.0%) | 0 (0.0%) |
| $20,000 to $22,499 | 11 (8.9%) | 0 (0.0%) |
| $22,500 to $24,999 | 0 (0.0%) | 21 (18.8%) |
| $25,000 to $29,999 | 17 (13.8%) | 11 (9.8%) |
| $30,000 to $34,999 | 0 (0.0%) | 10 (8.9%) |
| $35,000 to $39,999 | 0 (0.0%) | 18 (16.1%) |
| $40,000 to $44,999 | 14 (11.4%) | 11 (9.8%) |
| $45,000 to $49,999 | 14 (11.4%) | 0 (0.0%) |
| $50,000 to $54,999 | 7 (5.7%) | 0 (0.0%) |
| $55,000 to $64,999 | 8 (6.5%) | 0 (0.0%) |
| $65,000 to $74,999 | 15 (12.2%) | 0 (0.0%) |
| $75,000 to $99,999 | 37 (30.1%) | 0 (0.0%) |
| $100,000+ | 0 (0.0%) | 0 (0.0%) |
| Total | 123 (100.0%) | 112 (100.0%) |
Earnings by Sex by Educational Attainment in Scotia
Average earnings in Scotia are $62,188 for men and $23,810 for women, a difference of 61.7%. Men with an educational attainment of college or associate's degree enjoy the highest average annual earnings of $85,043, while those with high school diploma education earn the least with $67,917. Women with an educational attainment of college or associate's degree earn the most with the average annual earnings of $23,654, while those with college or associate's degree education have the smallest earnings of $23,654.
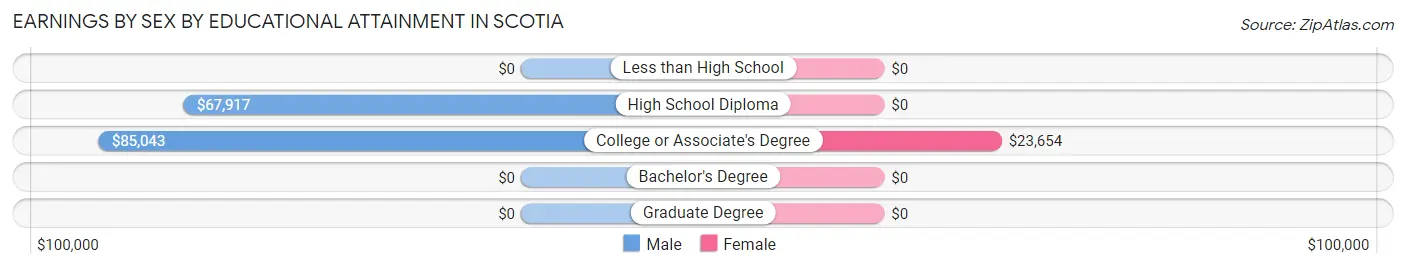
| Educational Attainment | Male Income | Female Income |
| Less than High School | - | - |
| High School Diploma | $67,917 | $0 |
| College or Associate's Degree | $85,043 | $23,654 |
| Bachelor's Degree | - | - |
| Graduate Degree | - | - |
| Total | $62,188 | $23,810 |
Family Income in Scotia
Family Income Brackets in Scotia
According to the Scotia family income data, there are 24 families falling into the $35,000 to $49,999 income range, which is the most common income bracket and makes up 19.8% of all families.
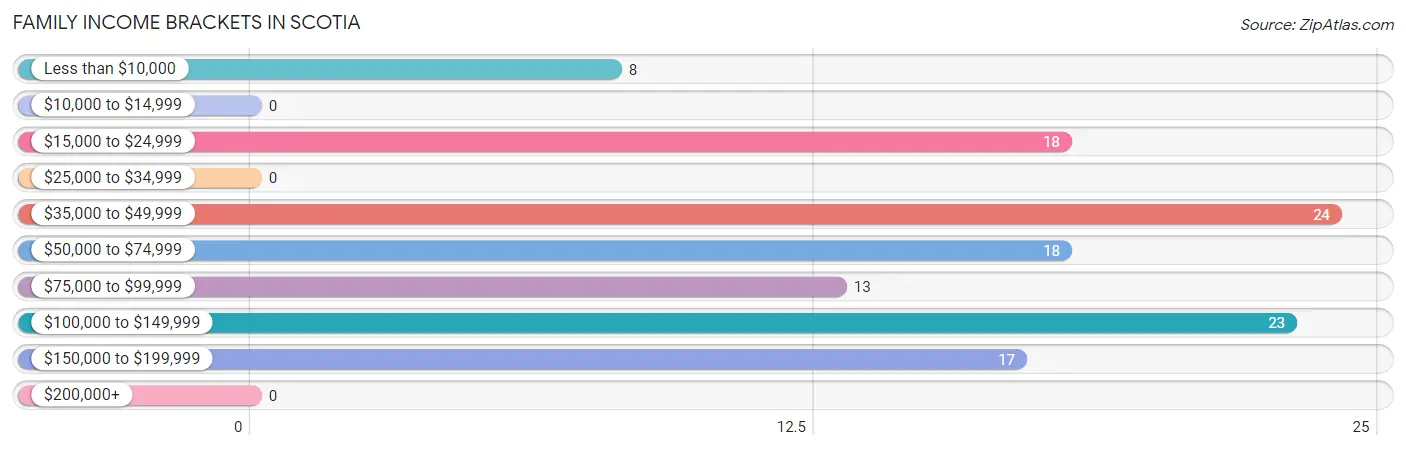
| Income Bracket | # Families | % Families |
| Less than $10,000 | 8 | 6.6% |
| $10,000 to $14,999 | 0 | 0.0% |
| $15,000 to $24,999 | 18 | 14.9% |
| $25,000 to $34,999 | 0 | 0.0% |
| $35,000 to $49,999 | 24 | 19.8% |
| $50,000 to $74,999 | 18 | 14.9% |
| $75,000 to $99,999 | 13 | 10.7% |
| $100,000 to $149,999 | 23 | 19.0% |
| $150,000 to $199,999 | 17 | 14.0% |
| $200,000+ | 0 | 0.0% |
Family Income by Famaliy Size in Scotia
| Income Bracket | # Families | Median Income |
| 2-Person Families | 37 (30.6%) | $0 |
| 3-Person Families | 28 (23.1%) | $0 |
| 4-Person Families | 43 (35.5%) | $0 |
| 5-Person Families | 0 (0.0%) | $0 |
| 6-Person Families | 13 (10.7%) | $0 |
| 7+ Person Families | 0 (0.0%) | $0 |
| Total | 121 (100.0%) | $60,795 |
Family Income by Number of Earners in Scotia
| Number of Earners | # Families | Median Income |
| No Earners | 12 (9.9%) | $0 |
| 1 Earner | 61 (50.4%) | $0 |
| 2 Earners | 48 (39.7%) | $0 |
| 3+ Earners | 0 (0.0%) | $0 |
| Total | 121 (100.0%) | $60,795 |
Household Income in Scotia
Household Income Brackets in Scotia
With 50 households falling in the category, the $35,000 to $49,999 income range is the most frequent in Scotia, accounting for 31.1% of all households.
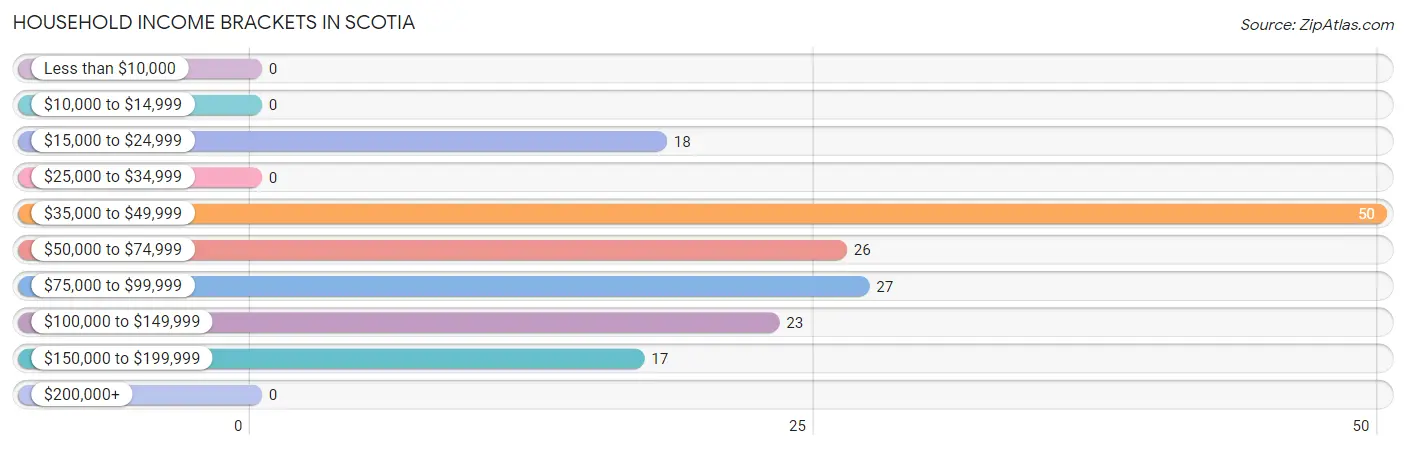
| Income Bracket | # Households | % Households |
| Less than $10,000 | 0 | 0.0% |
| $10,000 to $14,999 | 0 | 0.0% |
| $15,000 to $24,999 | 18 | 11.2% |
| $25,000 to $34,999 | 0 | 0.0% |
| $35,000 to $49,999 | 50 | 31.1% |
| $50,000 to $74,999 | 26 | 16.1% |
| $75,000 to $99,999 | 27 | 16.8% |
| $100,000 to $149,999 | 23 | 14.3% |
| $150,000 to $199,999 | 17 | 10.6% |
| $200,000+ | 0 | 0.0% |
Household Income by Householder Age in Scotia
The median household income in Scotia is $61,250, with the highest median household income of $71,094 found in the 25 to 44 years age bracket for the primary householder. A total of 109 households (67.7%) fall into this category. Meanwhile, the 15 to 24 years age bracket for the primary householder has the lowest median household income of $0, with 17 households (10.6%) in this group.
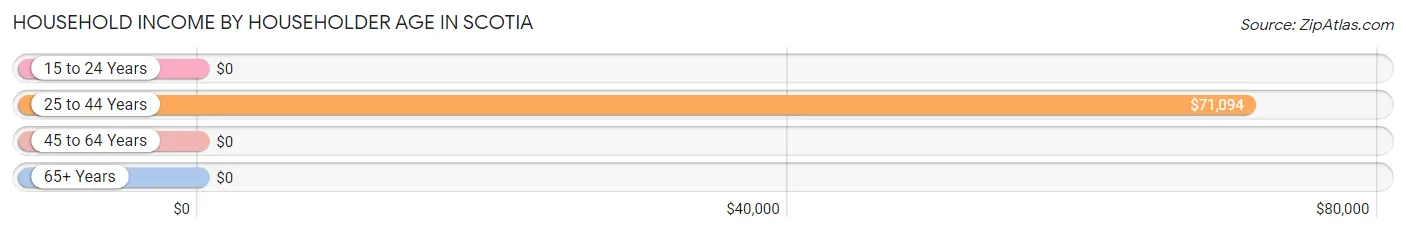
| Income Bracket | # Households | Median Income |
| 15 to 24 Years | 17 (10.6%) | $0 |
| 25 to 44 Years | 109 (67.7%) | $71,094 |
| 45 to 64 Years | 23 (14.3%) | $0 |
| 65+ Years | 12 (7.4%) | $0 |
| Total | 161 (100.0%) | $61,250 |
Poverty in Scotia
Income Below Poverty by Sex and Age in Scotia
With 12.5% poverty level for males and 18.3% for females among the residents of Scotia, under 5 year old males and 16 and 17 year old females are the most vulnerable to poverty, with 18 males (72.0%) and 10 females (100.0%) in their respective age groups living below the poverty level.
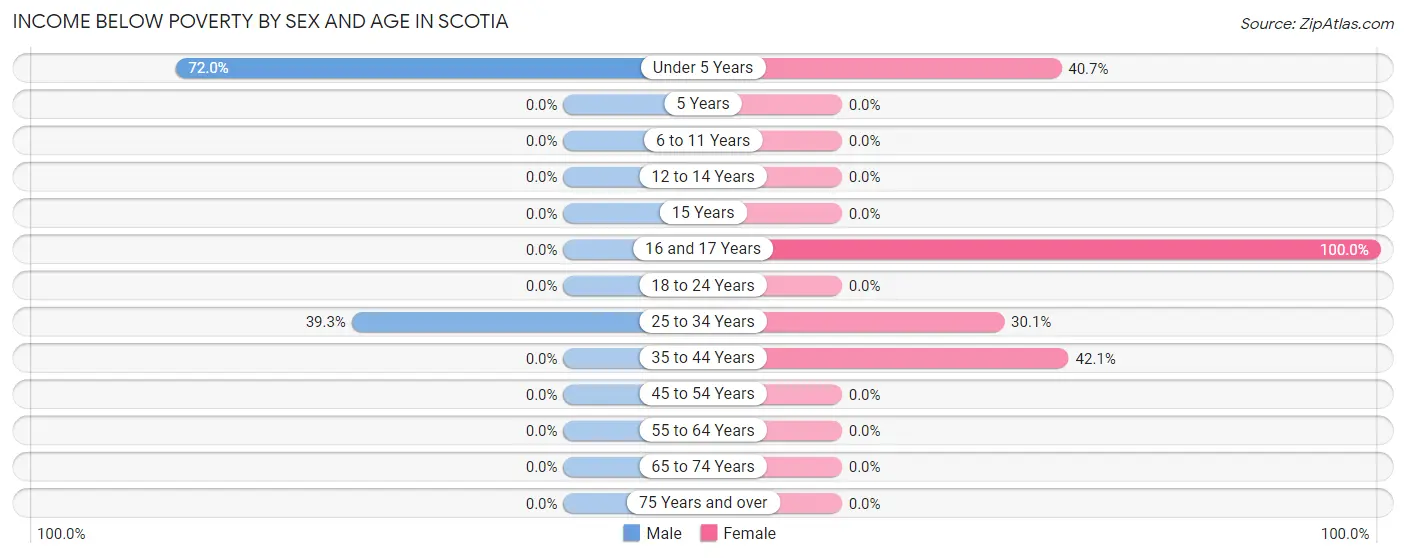
| Age Bracket | Male | Female |
| Under 5 Years | 18 (72.0%) | 11 (40.7%) |
| 5 Years | 0 (0.0%) | 0 (0.0%) |
| 6 to 11 Years | 0 (0.0%) | 0 (0.0%) |
| 12 to 14 Years | 0 (0.0%) | 0 (0.0%) |
| 15 Years | 0 (0.0%) | 0 (0.0%) |
| 16 and 17 Years | 0 (0.0%) | 10 (100.0%) |
| 18 to 24 Years | 0 (0.0%) | 0 (0.0%) |
| 25 to 34 Years | 11 (39.3%) | 22 (30.1%) |
| 35 to 44 Years | 0 (0.0%) | 8 (42.1%) |
| 45 to 54 Years | 0 (0.0%) | 0 (0.0%) |
| 55 to 64 Years | 0 (0.0%) | 0 (0.0%) |
| 65 to 74 Years | 0 (0.0%) | 0 (0.0%) |
| 75 Years and over | 0 (0.0%) | 0 (0.0%) |
| Total | 29 (12.5%) | 51 (18.3%) |
Income Above Poverty by Sex and Age in Scotia
According to the poverty statistics in Scotia, males aged 5 years and females aged 5 years are the age groups that are most secure financially, with 100.0% of males and 100.0% of females in these age groups living above the poverty line.
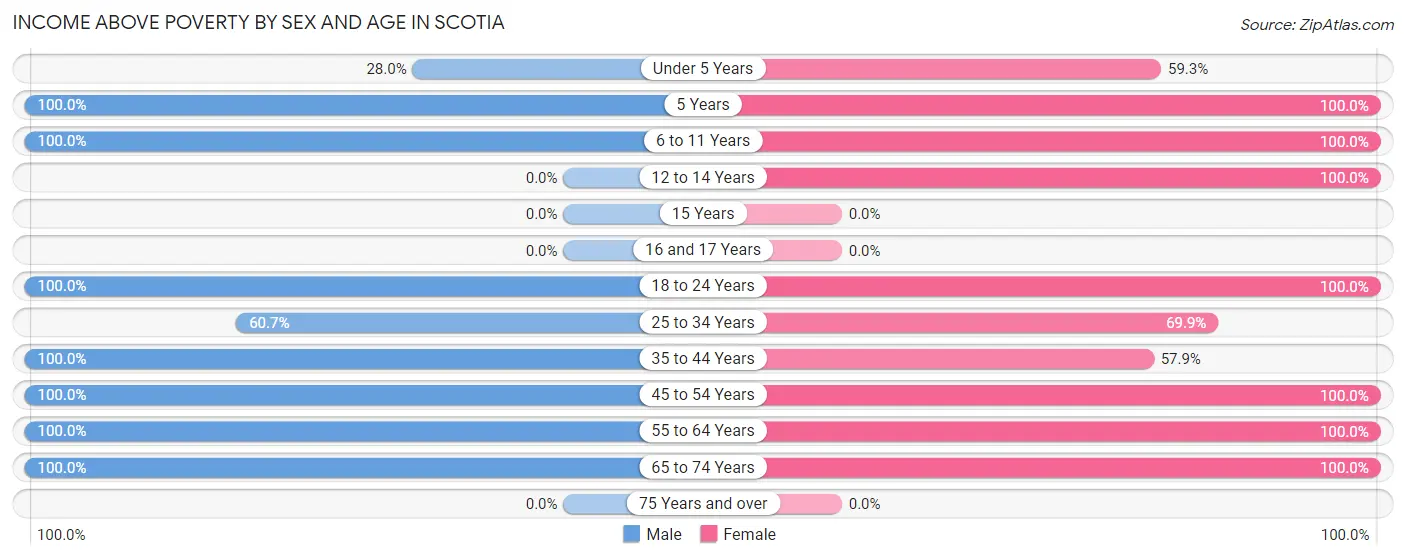
| Age Bracket | Male | Female |
| Under 5 Years | 7 (28.0%) | 16 (59.3%) |
| 5 Years | 7 (100.0%) | 9 (100.0%) |
| 6 to 11 Years | 8 (100.0%) | 28 (100.0%) |
| 12 to 14 Years | 0 (0.0%) | 32 (100.0%) |
| 15 Years | 0 (0.0%) | 0 (0.0%) |
| 16 and 17 Years | 0 (0.0%) | 0 (0.0%) |
| 18 to 24 Years | 17 (100.0%) | 18 (100.0%) |
| 25 to 34 Years | 17 (60.7%) | 51 (69.9%) |
| 35 to 44 Years | 79 (100.0%) | 11 (57.9%) |
| 45 to 54 Years | 19 (100.0%) | 25 (100.0%) |
| 55 to 64 Years | 24 (100.0%) | 24 (100.0%) |
| 65 to 74 Years | 25 (100.0%) | 13 (100.0%) |
| 75 Years and over | 0 (0.0%) | 0 (0.0%) |
| Total | 203 (87.5%) | 227 (81.7%) |
Income Below Poverty Among Married-Couple Families in Scotia
The poverty statistics for married-couple families in Scotia show that 14.9% or 10 of the total 67 families live below the poverty line. Families with 1 or 2 children have the highest poverty rate of 58.8%, comprising of 10 families. On the other hand, families with no children have the lowest poverty rate of 0.0%, which includes 0 families.
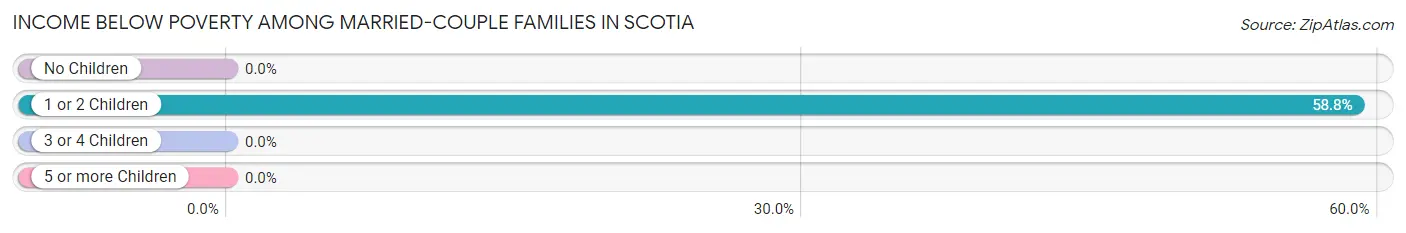
| Children | Above Poverty | Below Poverty |
| No Children | 37 (100.0%) | 0 (0.0%) |
| 1 or 2 Children | 7 (41.2%) | 10 (58.8%) |
| 3 or 4 Children | 13 (100.0%) | 0 (0.0%) |
| 5 or more Children | 0 (0.0%) | 0 (0.0%) |
| Total | 57 (85.1%) | 10 (14.9%) |
Income Below Poverty Among Single-Parent Households in Scotia
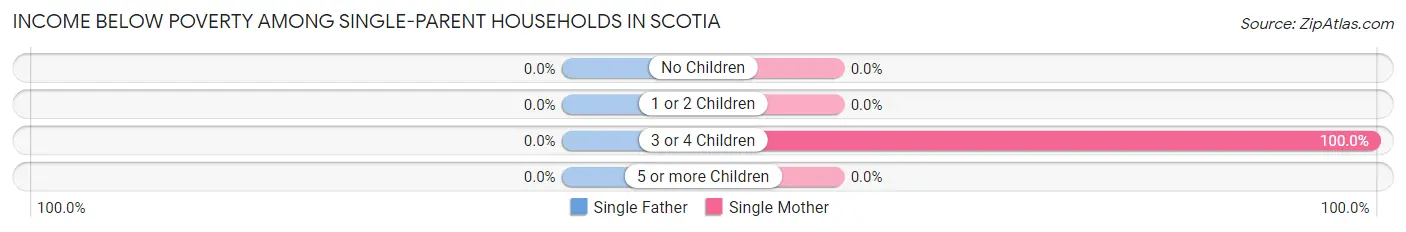
| Children | Single Father | Single Mother |
| No Children | 0 (0.0%) | 0 (0.0%) |
| 1 or 2 Children | 0 (0.0%) | 0 (0.0%) |
| 3 or 4 Children | 0 (0.0%) | 8 (100.0%) |
| 5 or more Children | 0 (0.0%) | 0 (0.0%) |
| Total | 0 (0.0%) | 8 (29.6%) |
Income Below Poverty Among Married-Couple vs Single-Parent Households in Scotia
The poverty data for Scotia shows that 10 of the married-couple family households (14.9%) and 8 of the single-parent households (14.8%) are living below the poverty level. Within the married-couple family households, those with 1 or 2 children have the highest poverty rate, with 10 households (58.8%) falling below the poverty line. Among the single-parent households, those with 3 or 4 children have the highest poverty rate, with 8 household (100.0%) living below poverty.
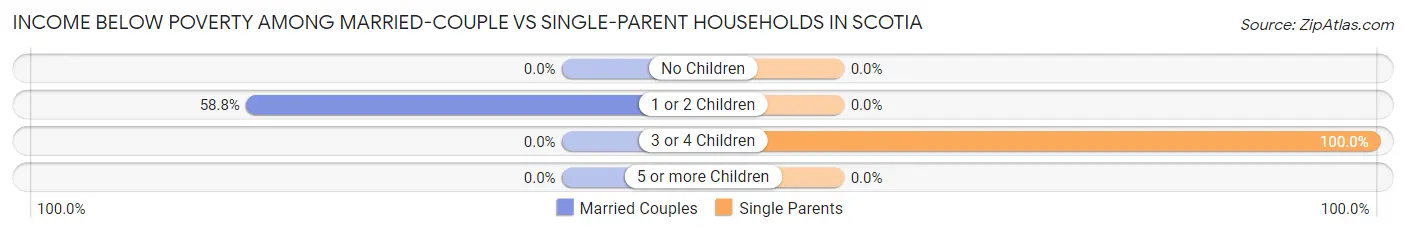
| Children | Married-Couple Families | Single-Parent Households |
| No Children | 0 (0.0%) | 0 (0.0%) |
| 1 or 2 Children | 10 (58.8%) | 0 (0.0%) |
| 3 or 4 Children | 0 (0.0%) | 8 (100.0%) |
| 5 or more Children | 0 (0.0%) | 0 (0.0%) |
| Total | 10 (14.9%) | 8 (14.8%) |
Race in Scotia
The most populous races in Scotia are White / Caucasian (340 | 66.7%), Two or more Races (128 | 25.1%), and Hispanic or Latino (31 | 6.1%).
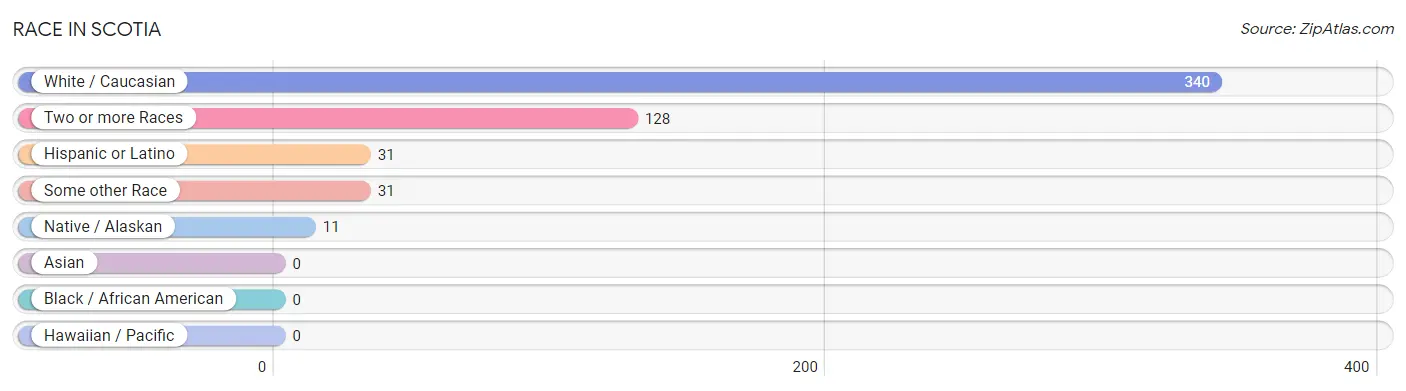
| Race | # Population | % Population |
| Asian | 0 | 0.0% |
| Black / African American | 0 | 0.0% |
| Hawaiian / Pacific | 0 | 0.0% |
| Hispanic or Latino | 31 | 6.1% |
| Native / Alaskan | 11 | 2.2% |
| White / Caucasian | 340 | 66.7% |
| Two or more Races | 128 | 25.1% |
| Some other Race | 31 | 6.1% |
| Total | 510 | 100.0% |
Ancestry in Scotia
The most populous ancestries reported in Scotia are German (119 | 23.3%), Cherokee (91 | 17.8%), Irish (70 | 13.7%), English (69 | 13.5%), and Bhutanese (52 | 10.2%), together accounting for 78.6% of all Scotia residents.
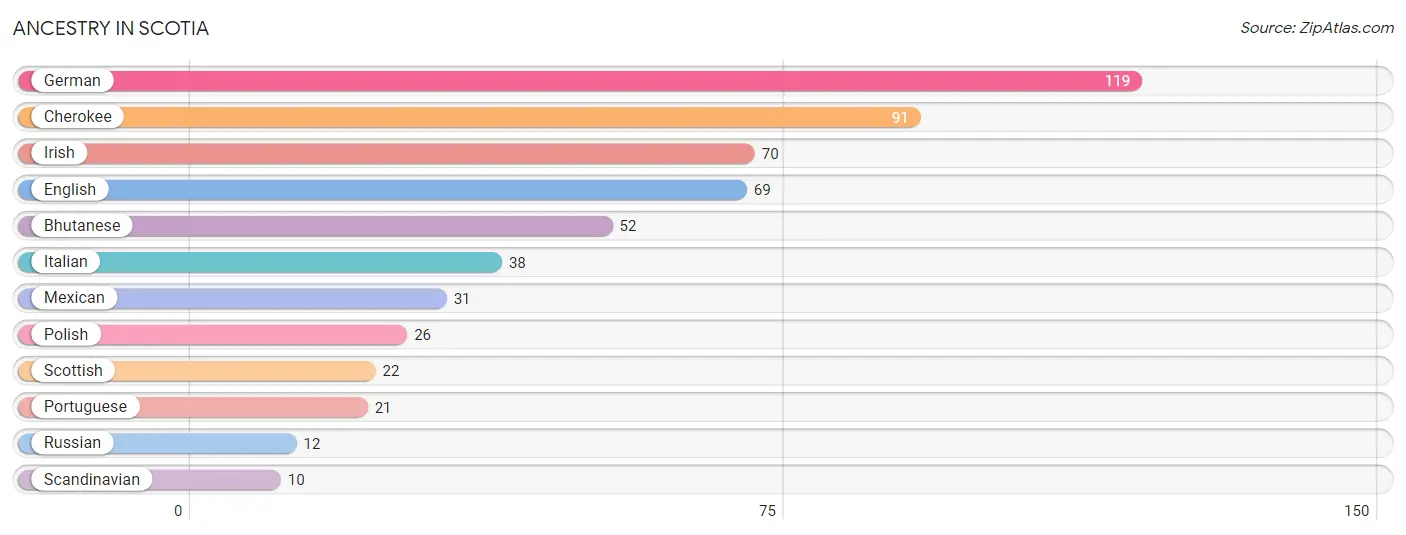
| Ancestry | # Population | % Population |
| Bhutanese | 52 | 10.2% |
| Cherokee | 91 | 17.8% |
| English | 69 | 13.5% |
| German | 119 | 23.3% |
| Irish | 70 | 13.7% |
| Italian | 38 | 7.4% |
| Mexican | 31 | 6.1% |
| Polish | 26 | 5.1% |
| Portuguese | 21 | 4.1% |
| Russian | 12 | 2.4% |
| Scandinavian | 10 | 2.0% |
| Scottish | 22 | 4.3% | View All 12 Rows |
Immigrants in Scotia
The most numerous immigrant groups reported in Scotia came from Central America (21 | 4.1%), Latin America (21 | 4.1%), and Mexico (21 | 4.1%), together accounting for 12.4% of all Scotia residents.
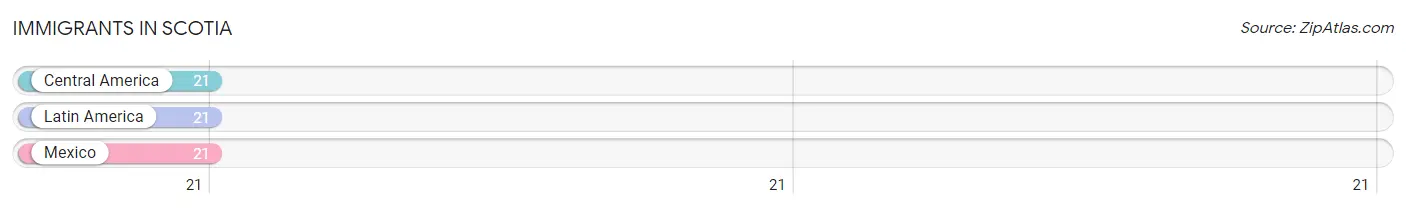
| Immigration Origin | # Population | % Population |
| Central America | 21 | 4.1% |
| Latin America | 21 | 4.1% |
| Mexico | 21 | 4.1% | View All 3 Rows |
Sex and Age in Scotia
Sex and Age in Scotia
The most populous age groups in Scotia are 35 to 39 Years (50 | 21.5%) for men and 30 to 34 Years (63 | 22.7%) for women.
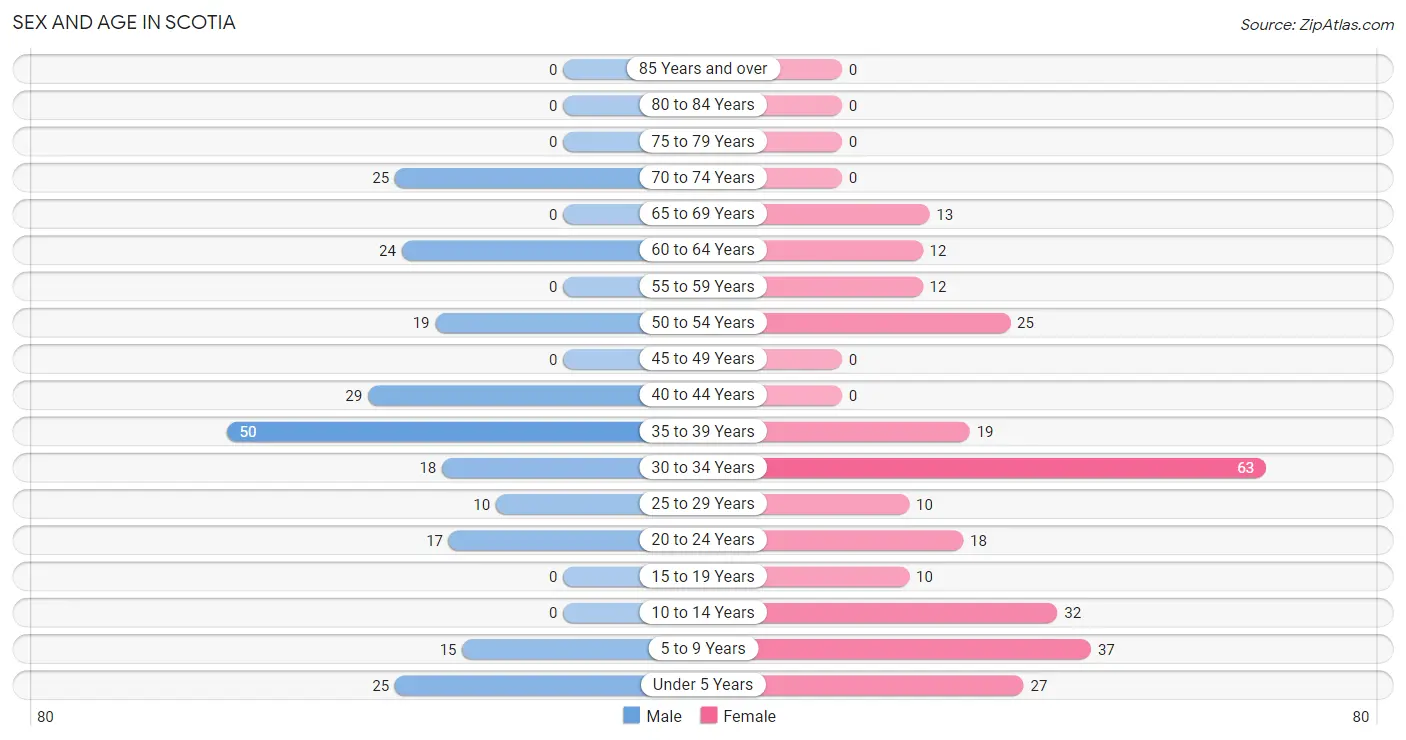
| Age Bracket | Male | Female |
| Under 5 Years | 25 (10.8%) | 27 (9.7%) |
| 5 to 9 Years | 15 (6.5%) | 37 (13.3%) |
| 10 to 14 Years | 0 (0.0%) | 32 (11.5%) |
| 15 to 19 Years | 0 (0.0%) | 10 (3.6%) |
| 20 to 24 Years | 17 (7.3%) | 18 (6.5%) |
| 25 to 29 Years | 10 (4.3%) | 10 (3.6%) |
| 30 to 34 Years | 18 (7.8%) | 63 (22.7%) |
| 35 to 39 Years | 50 (21.5%) | 19 (6.8%) |
| 40 to 44 Years | 29 (12.5%) | 0 (0.0%) |
| 45 to 49 Years | 0 (0.0%) | 0 (0.0%) |
| 50 to 54 Years | 19 (8.2%) | 25 (9.0%) |
| 55 to 59 Years | 0 (0.0%) | 12 (4.3%) |
| 60 to 64 Years | 24 (10.3%) | 12 (4.3%) |
| 65 to 69 Years | 0 (0.0%) | 13 (4.7%) |
| 70 to 74 Years | 25 (10.8%) | 0 (0.0%) |
| 75 to 79 Years | 0 (0.0%) | 0 (0.0%) |
| 80 to 84 Years | 0 (0.0%) | 0 (0.0%) |
| 85 Years and over | 0 (0.0%) | 0 (0.0%) |
| Total | 232 (100.0%) | 278 (100.0%) |
Families and Households in Scotia
Median Family Size in Scotia
The median family size in Scotia is 3.41 persons per family, with single female/mother families (27 | 22.3%) accounting for the largest median family size of 3.74 persons per family. On the other hand, married-couple families (67 | 55.4%) represent the smallest median family size with 3.19 persons per family.
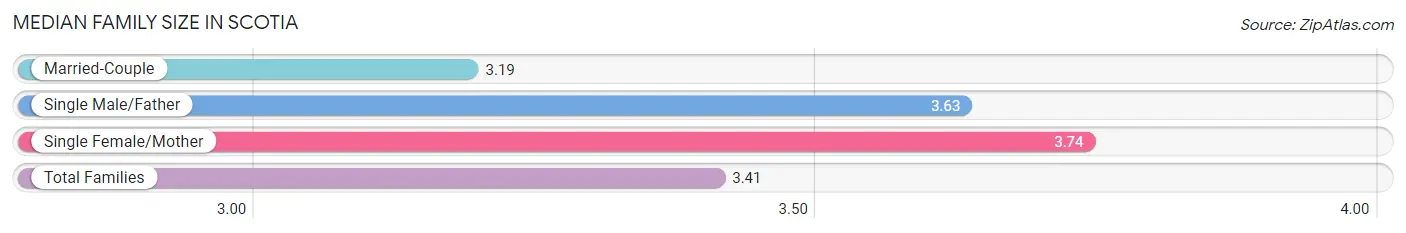
| Family Type | # Families | Family Size |
| Married-Couple | 67 (55.4%) | 3.19 |
| Single Male/Father | 27 (22.3%) | 3.63 |
| Single Female/Mother | 27 (22.3%) | 3.74 |
| Total Families | 121 (100.0%) | 3.41 |
Median Household Size in Scotia
The median household size in Scotia is 3.17 persons per household, with single male/father households (27 | 16.8%) accounting for the largest median household size of 4.3 persons per household. non-family households (40 | 24.8%) represent the smallest median household size with 1.78 persons per household.
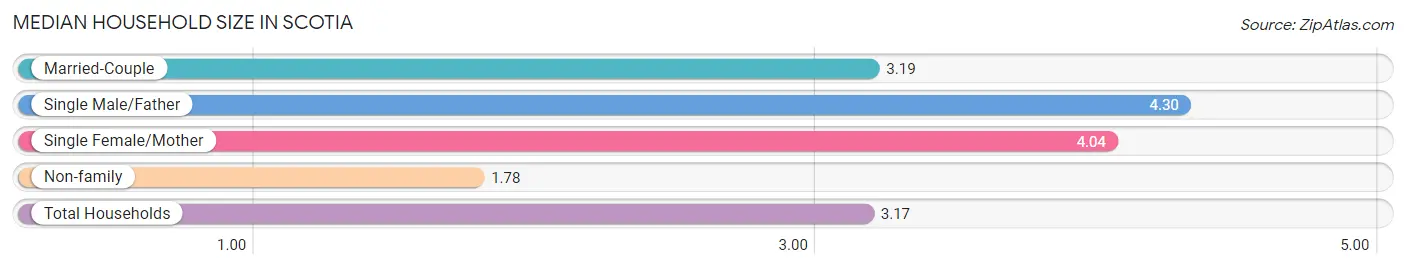
| Household Type | # Households | Household Size |
| Married-Couple | 67 (41.6%) | 3.19 |
| Single Male/Father | 27 (16.8%) | 4.30 |
| Single Female/Mother | 27 (16.8%) | 4.04 |
| Non-family | 40 (24.8%) | 1.78 |
| Total Households | 161 (100.0%) | 3.17 |
Household Size by Marriage Status in Scotia
Out of a total of 161 households in Scotia, 121 (75.2%) are family households, while 40 (24.8%) are nonfamily households. The most numerous type of family households are 4-person households, comprising 45, and the most common type of nonfamily households are 2-person households, comprising 26.
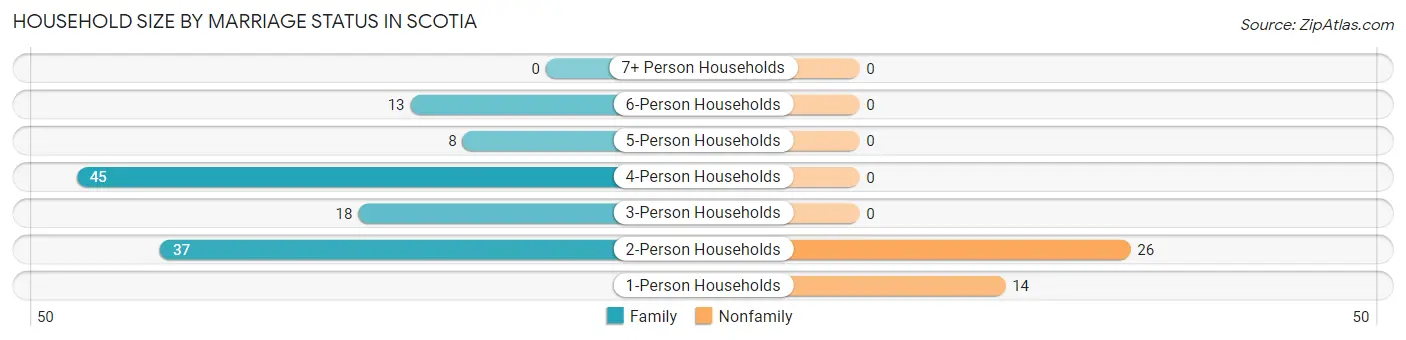
| Household Size | Family Households | Nonfamily Households |
| 1-Person Households | - | 14 (8.7%) |
| 2-Person Households | 37 (23.0%) | 26 (16.2%) |
| 3-Person Households | 18 (11.2%) | 0 (0.0%) |
| 4-Person Households | 45 (28.0%) | 0 (0.0%) |
| 5-Person Households | 8 (5.0%) | 0 (0.0%) |
| 6-Person Households | 13 (8.1%) | 0 (0.0%) |
| 7+ Person Households | 0 (0.0%) | 0 (0.0%) |
| Total | 121 (75.2%) | 40 (24.8%) |
Female Fertility in Scotia
Fertility by Age in Scotia
Average fertility rate in Scotia is 67.0 births per 1,000 women. Women in the age bracket of 35 to 50 years have the highest fertility rate with 421.0 births per 1,000 women. Women in the age bracket of 35 to 50 years acount for 100.0% of all women with births.
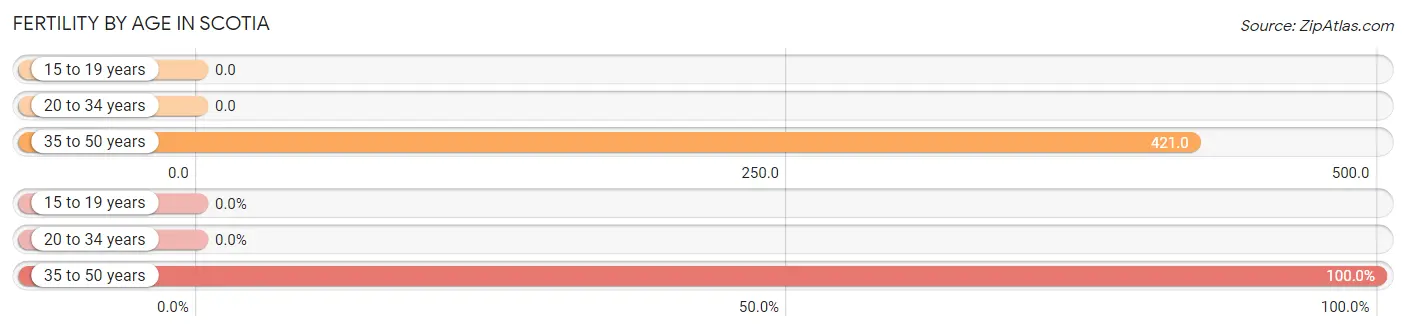
| Age Bracket | Women with Births | Births / 1,000 Women |
| 15 to 19 years | 0 (0.0%) | 0.0 |
| 20 to 34 years | 0 (0.0%) | 0.0 |
| 35 to 50 years | 8 (100.0%) | 421.0 |
| Total | 8 (100.0%) | 67.0 |
Fertility by Age by Marriage Status in Scotia
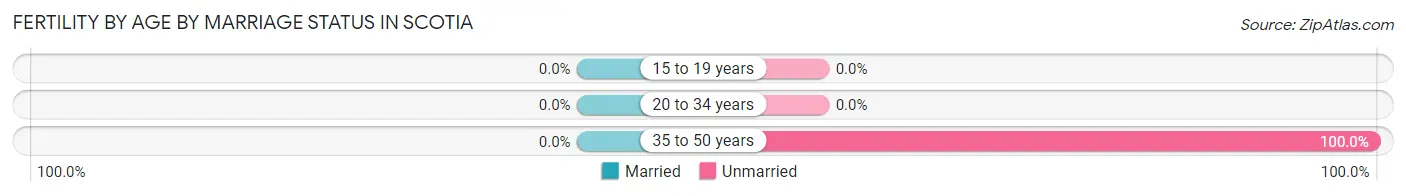
| Age Bracket | Married | Unmarried |
| 15 to 19 years | 0 (0.0%) | 0 (0.0%) |
| 20 to 34 years | 0 (0.0%) | 0 (0.0%) |
| 35 to 50 years | 0 (0.0%) | 8 (100.0%) |
| Total | 0 (0.0%) | 8 (100.0%) |
Fertility by Education in Scotia
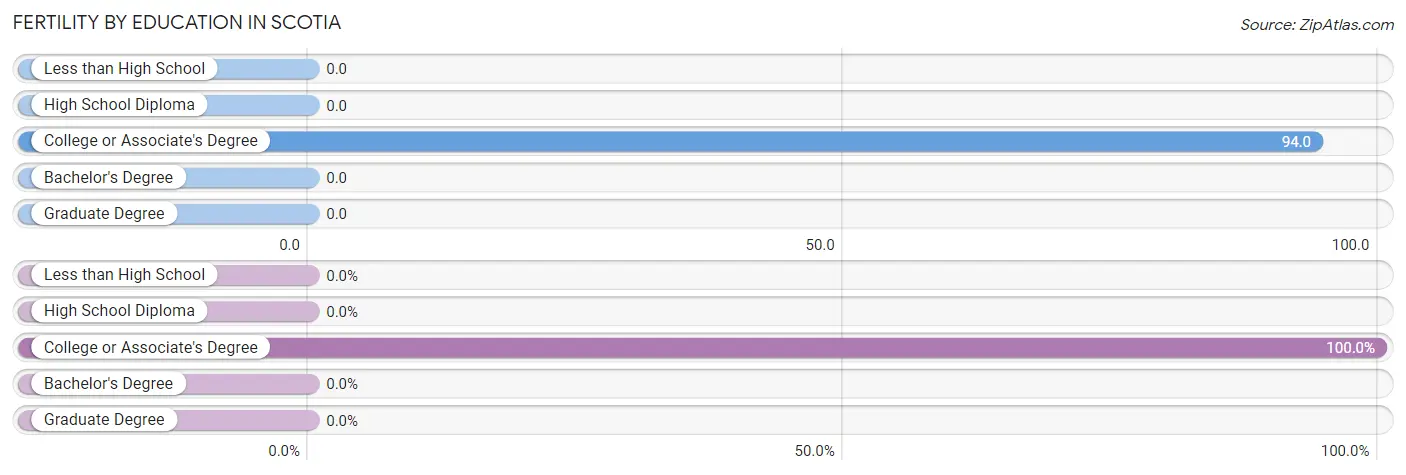
| Educational Attainment | Women with Births | Births / 1,000 Women |
| Less than High School | 0 (0.0%) | 0.0 |
| High School Diploma | 0 (0.0%) | 0.0 |
| College or Associate's Degree | 8 (100.0%) | 94.0 |
| Bachelor's Degree | 0 (0.0%) | 0.0 |
| Graduate Degree | 0 (0.0%) | 0.0 |
| Total | 8 (100.0%) | 67.0 |
Fertility by Education by Marriage Status in Scotia
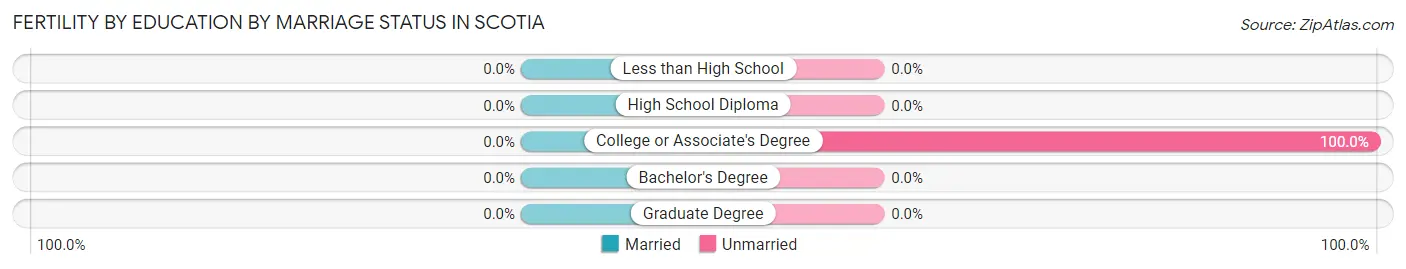
| Educational Attainment | Married | Unmarried |
| Less than High School | 0 (0.0%) | 0 (0.0%) |
| High School Diploma | 0 (0.0%) | 0 (0.0%) |
| College or Associate's Degree | 0 (0.0%) | 8 (100.0%) |
| Bachelor's Degree | 0 (0.0%) | 0 (0.0%) |
| Graduate Degree | 0 (0.0%) | 0 (0.0%) |
| Total | 0 (0.0%) | 8 (100.0%) |
Employment Characteristics in Scotia
Employment by Class of Employer in Scotia
Among the 196 employed individuals in Scotia, private company employees (144 | 73.5%), local government employees (29 | 14.8%), and state government employees (13 | 6.6%) make up the most common classes of employment.
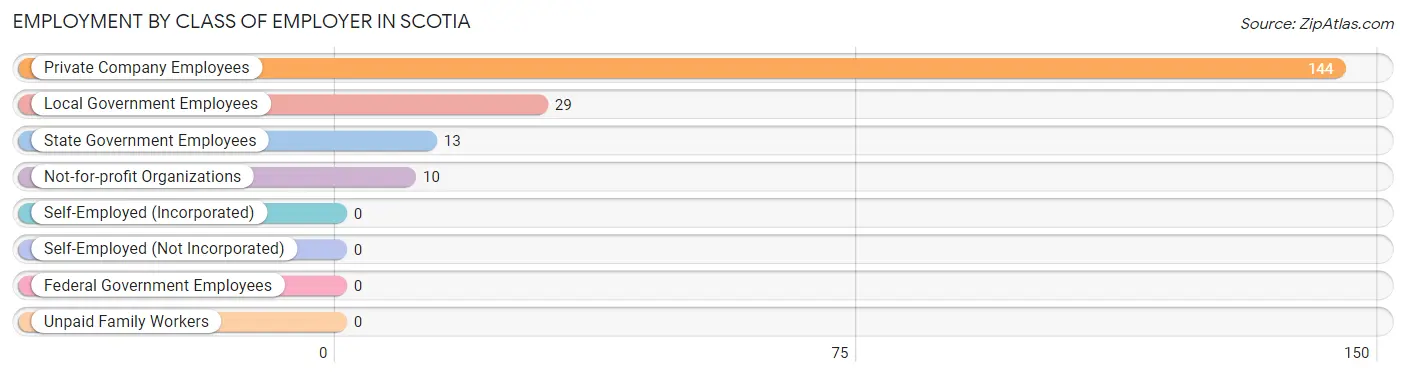
| Employer Class | # Employees | % Employees |
| Private Company Employees | 144 | 73.5% |
| Self-Employed (Incorporated) | 0 | 0.0% |
| Self-Employed (Not Incorporated) | 0 | 0.0% |
| Not-for-profit Organizations | 10 | 5.1% |
| Local Government Employees | 29 | 14.8% |
| State Government Employees | 13 | 6.6% |
| Federal Government Employees | 0 | 0.0% |
| Unpaid Family Workers | 0 | 0.0% |
| Total | 196 | 100.0% |
Employment Status by Age in Scotia
According to the labor force statistics for Scotia, out of the total population over 16 years of age (374), 60.4% or 226 individuals are in the labor force, with 13.3% or 30 of them unemployed. The age group with the highest labor force participation rate is 16 to 19 years, with 100.0% or 10 individuals in the labor force. Within the labor force, the 25 to 29 years age range has the highest percentage of unemployed individuals, with 50.0% or 10 of them being unemployed.
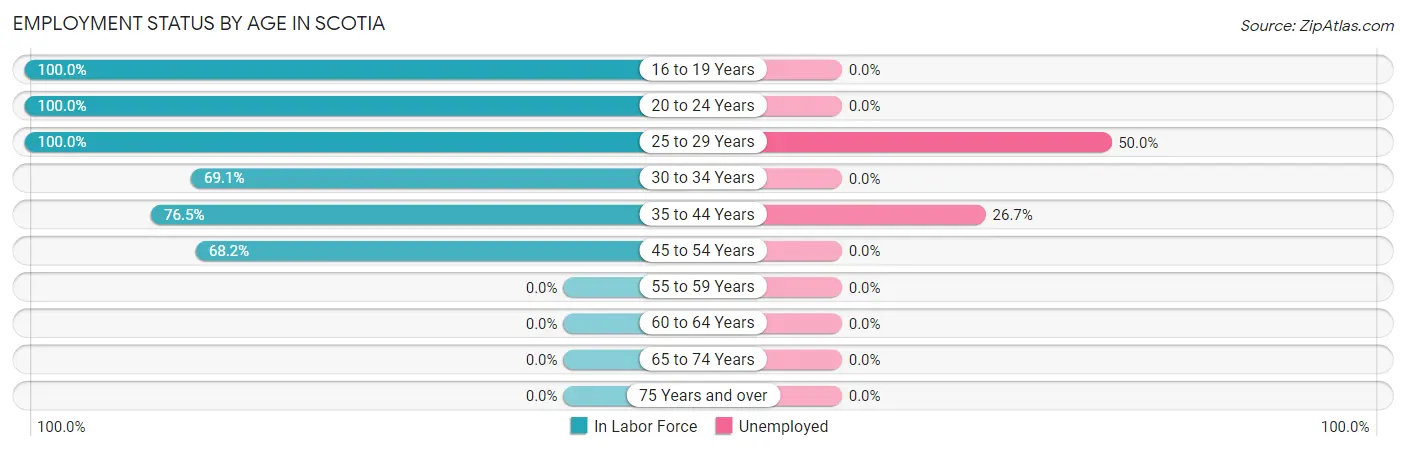
| Age Bracket | In Labor Force | Unemployed |
| 16 to 19 Years | 10 (100.0%) | 0 (0.0%) |
| 20 to 24 Years | 35 (100.0%) | 0 (0.0%) |
| 25 to 29 Years | 20 (100.0%) | 10 (50.0%) |
| 30 to 34 Years | 56 (69.1%) | 0 (0.0%) |
| 35 to 44 Years | 75 (76.5%) | 20 (26.7%) |
| 45 to 54 Years | 30 (68.2%) | 0 (0.0%) |
| 55 to 59 Years | 0 (0.0%) | 0 (0.0%) |
| 60 to 64 Years | 0 (0.0%) | 0 (0.0%) |
| 65 to 74 Years | 0 (0.0%) | 0 (0.0%) |
| 75 Years and over | 0 (0.0%) | 0 (0.0%) |
| Total | 226 (60.4%) | 30 (13.3%) |
Employment Status by Educational Attainment in Scotia
According to labor force statistics for Scotia, 62.2% of individuals (181) out of the total population between 25 and 64 years of age (291) are in the labor force, with 16.6% or 30 of them being unemployed. The group with the highest labor force participation rate are those with the educational attainment of less than high school, with 100.0% or 8 individuals in the labor force. Within the labor force, individuals with bachelor's degree or higher education have the highest percentage of unemployment, with 48.8% or 20 of them being unemployed.
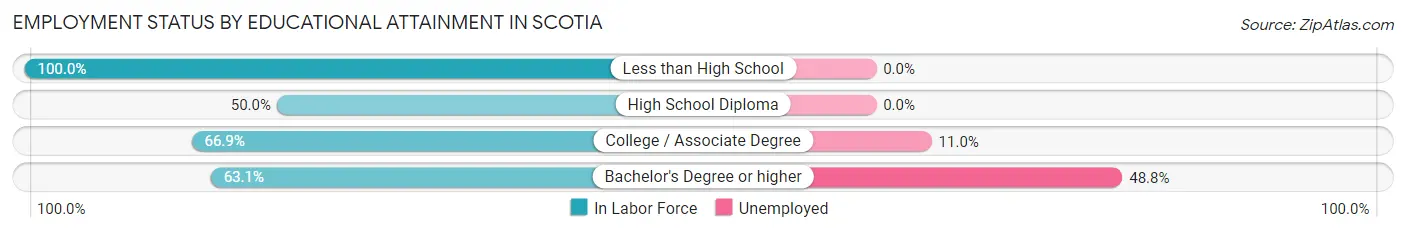
| Educational Attainment | In Labor Force | Unemployed |
| Less than High School | 8 (100.0%) | 0 (0.0%) |
| High School Diploma | 41 (50.0%) | 0 (0.0%) |
| College / Associate Degree | 91 (66.9%) | 15 (11.0%) |
| Bachelor's Degree or higher | 41 (63.1%) | 32 (48.8%) |
| Total | 181 (62.2%) | 48 (16.6%) |
Employment Occupations by Sex in Scotia
Management, Business, Science and Arts Occupations
The most common Management, Business, Science and Arts occupations in Scotia are Community & Social Service (21 | 10.7%), Education, Arts & Media (21 | 10.7%), Health Diagnosing & Treating (10 | 5.1%), Health Technologists (10 | 5.1%), and Management (8 | 4.1%).
Management, Business, Science and Arts Occupations by Sex
Within the Management, Business, Science and Arts occupations in Scotia, the most male-oriented occupations are Management (100.0%), Health Diagnosing & Treating (100.0%), and Health Technologists (100.0%), while the most female-oriented occupations are Community & Social Service (100.0%), and Education, Arts & Media (100.0%).
| Occupation | Male | Female |
| Management | 8 (100.0%) | 0 (0.0%) |
| Business & Financial | 0 (0.0%) | 0 (0.0%) |
| Computers, Engineering & Science | 0 (0.0%) | 0 (0.0%) |
| Computers & Mathematics | 0 (0.0%) | 0 (0.0%) |
| Architecture & Engineering | 0 (0.0%) | 0 (0.0%) |
| Life, Physical & Social Science | 0 (0.0%) | 0 (0.0%) |
| Community & Social Service | 0 (0.0%) | 21 (100.0%) |
| Education, Arts & Media | 0 (0.0%) | 21 (100.0%) |
| Legal Services & Support | 0 (0.0%) | 0 (0.0%) |
| Education Instruction & Library | 0 (0.0%) | 0 (0.0%) |
| Arts, Media & Entertainment | 0 (0.0%) | 0 (0.0%) |
| Health Diagnosing & Treating | 10 (100.0%) | 0 (0.0%) |
| Health Technologists | 10 (100.0%) | 0 (0.0%) |
| Total (Category) | 18 (46.2%) | 21 (53.8%) |
| Total (Overall) | 108 (55.1%) | 88 (44.9%) |
Services Occupations
The most common Services occupations in Scotia are Healthcare Support (42 | 21.4%), Food Preparation & Serving (21 | 10.7%), and Cleaning & Maintenance (8 | 4.1%).
Services Occupations by Sex
| Occupation | Male | Female |
| Healthcare Support | 0 (0.0%) | 42 (100.0%) |
| Security & Protection | 0 (0.0%) | 0 (0.0%) |
| Firefighting & Prevention | 0 (0.0%) | 0 (0.0%) |
| Law Enforcement | 0 (0.0%) | 0 (0.0%) |
| Food Preparation & Serving | 11 (52.4%) | 10 (47.6%) |
| Cleaning & Maintenance | 0 (0.0%) | 8 (100.0%) |
| Personal Care & Service | 0 (0.0%) | 0 (0.0%) |
| Total (Category) | 11 (15.5%) | 60 (84.5%) |
| Total (Overall) | 108 (55.1%) | 88 (44.9%) |
Sales and Office Occupations
The most common Sales and Office occupations in Scotia are , and Sales & Related (24 | 12.2%).
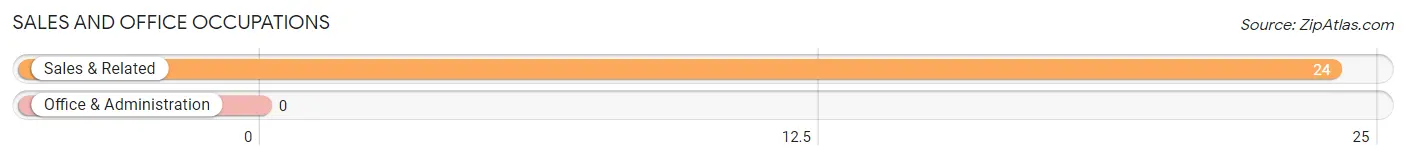
Sales and Office Occupations by Sex

| Occupation | Male | Female |
| Sales & Related | 17 (70.8%) | 7 (29.2%) |
| Office & Administration | 0 (0.0%) | 0 (0.0%) |
| Total (Category) | 17 (70.8%) | 7 (29.2%) |
| Total (Overall) | 108 (55.1%) | 88 (44.9%) |
Natural Resources, Construction and Maintenance Occupations
The most common Natural Resources, Construction and Maintenance occupations in Scotia are Construction & Extraction (19 | 9.7%), and Farming, Fishing & Forestry (7 | 3.6%).
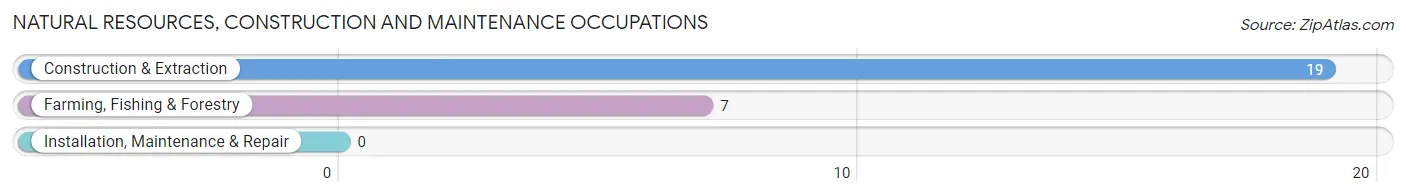
Natural Resources, Construction and Maintenance Occupations by Sex
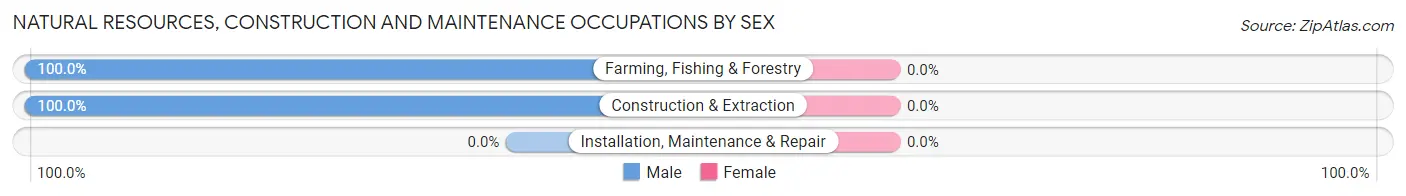
| Occupation | Male | Female |
| Farming, Fishing & Forestry | 7 (100.0%) | 0 (0.0%) |
| Construction & Extraction | 19 (100.0%) | 0 (0.0%) |
| Installation, Maintenance & Repair | 0 (0.0%) | 0 (0.0%) |
| Total (Category) | 26 (100.0%) | 0 (0.0%) |
| Total (Overall) | 108 (55.1%) | 88 (44.9%) |
Production, Transportation and Moving Occupations
The most common Production, Transportation and Moving occupations in Scotia are Production (22 | 11.2%), and Transportation (14 | 7.1%).
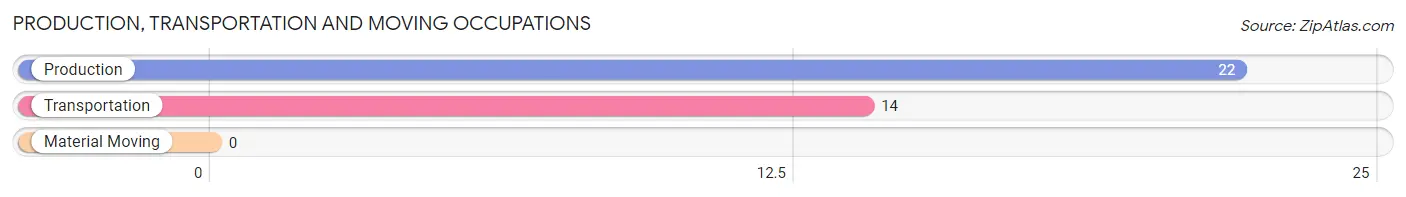
Production, Transportation and Moving Occupations by Sex
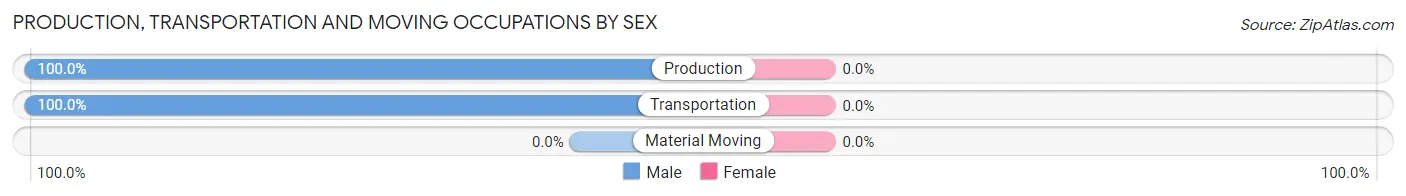
| Occupation | Male | Female |
| Production | 22 (100.0%) | 0 (0.0%) |
| Transportation | 14 (100.0%) | 0 (0.0%) |
| Material Moving | 0 (0.0%) | 0 (0.0%) |
| Total (Category) | 36 (100.0%) | 0 (0.0%) |
| Total (Overall) | 108 (55.1%) | 88 (44.9%) |
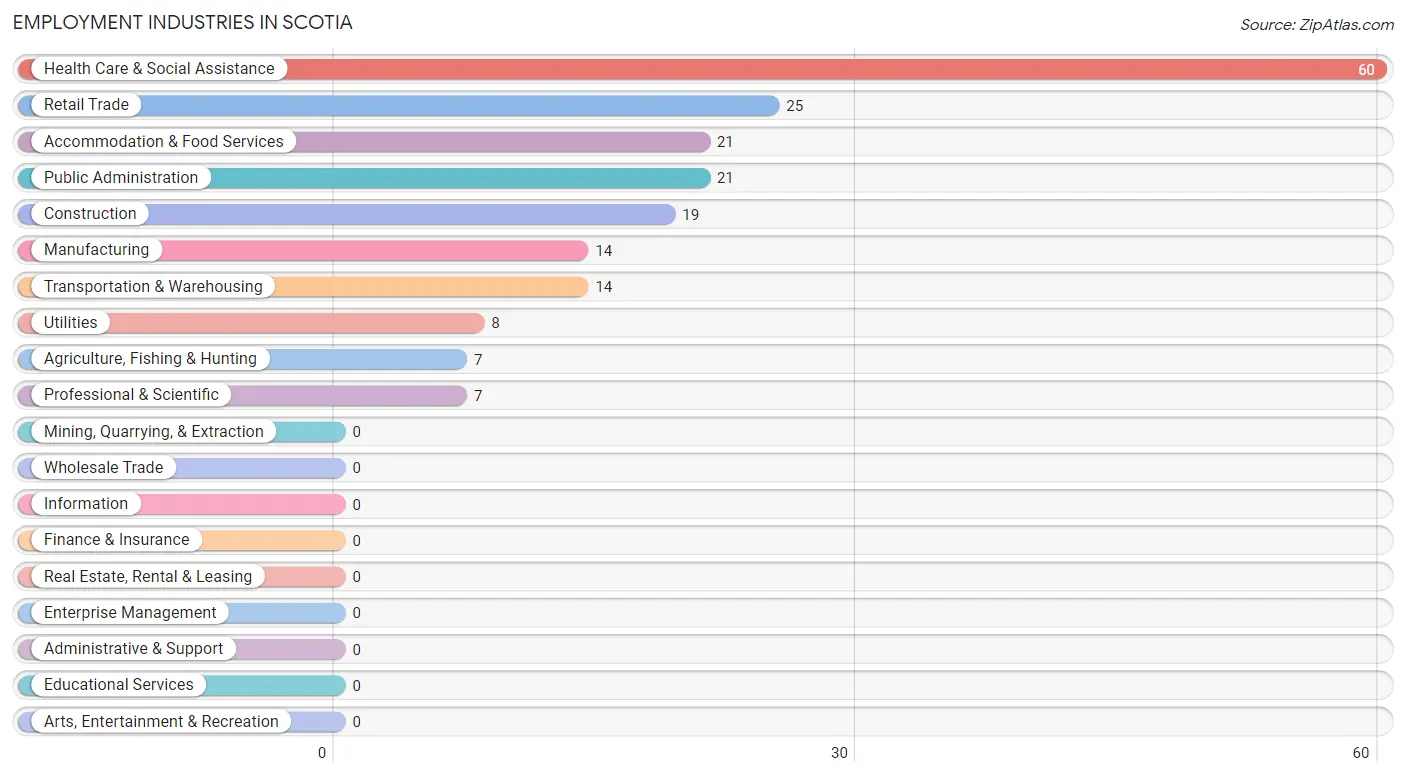
Employment Industries by Sex in Scotia
Employment Industries in Scotia
The major employment industries in Scotia include Health Care & Social Assistance (60 | 30.6%), Retail Trade (25 | 12.8%), Accommodation & Food Services (21 | 10.7%), Public Administration (21 | 10.7%), and Construction (19 | 9.7%).
Employment Industries by Sex in Scotia
The Scotia industries that see more men than women are Agriculture, Fishing & Hunting (100.0%), Construction (100.0%), and Manufacturing (100.0%), whereas the industries that tend to have a higher number of women are Professional & Scientific (100.0%), Public Administration (100.0%), and Health Care & Social Assistance (83.3%).
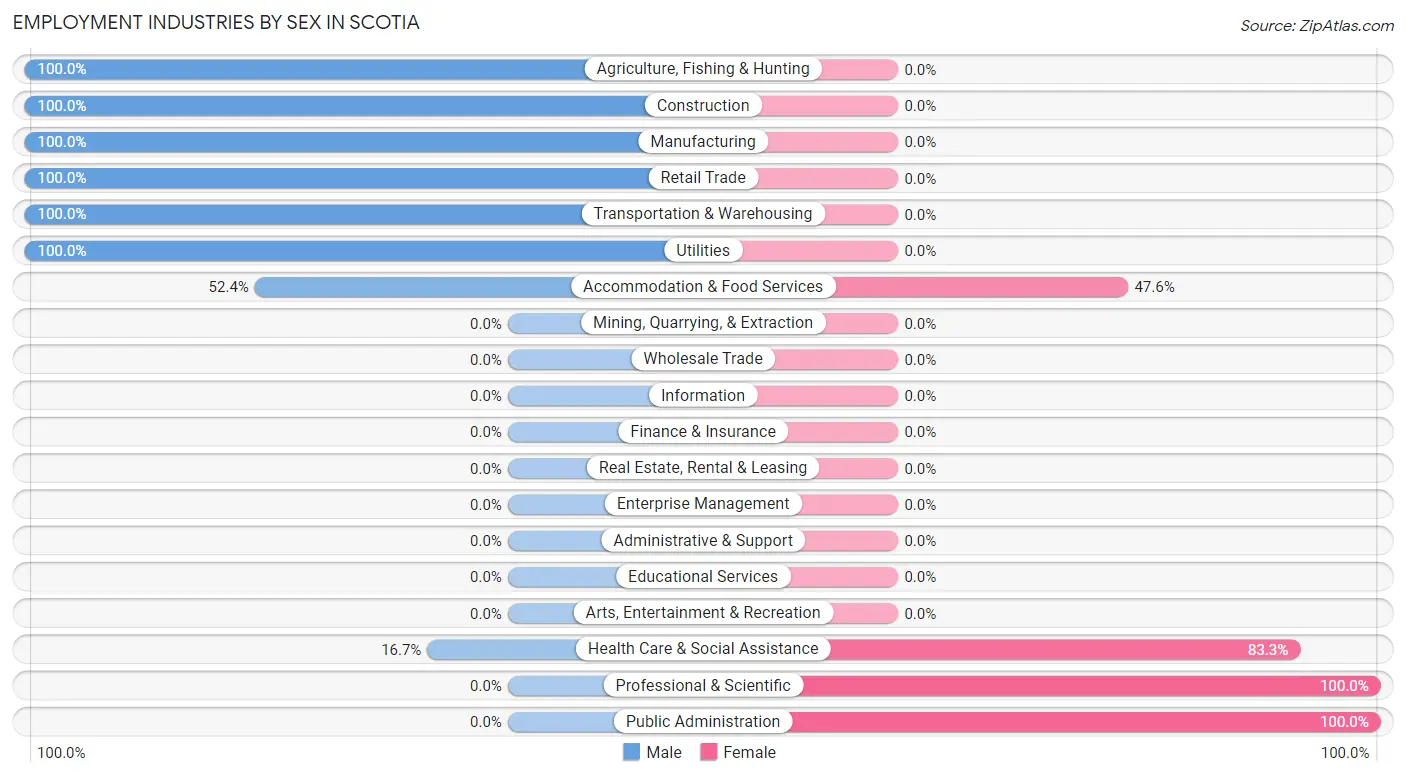
| Industry | Male | Female |
| Agriculture, Fishing & Hunting | 7 (100.0%) | 0 (0.0%) |
| Mining, Quarrying, & Extraction | 0 (0.0%) | 0 (0.0%) |
| Construction | 19 (100.0%) | 0 (0.0%) |
| Manufacturing | 14 (100.0%) | 0 (0.0%) |
| Wholesale Trade | 0 (0.0%) | 0 (0.0%) |
| Retail Trade | 25 (100.0%) | 0 (0.0%) |
| Transportation & Warehousing | 14 (100.0%) | 0 (0.0%) |
| Utilities | 8 (100.0%) | 0 (0.0%) |
| Information | 0 (0.0%) | 0 (0.0%) |
| Finance & Insurance | 0 (0.0%) | 0 (0.0%) |
| Real Estate, Rental & Leasing | 0 (0.0%) | 0 (0.0%) |
| Professional & Scientific | 0 (0.0%) | 7 (100.0%) |
| Enterprise Management | 0 (0.0%) | 0 (0.0%) |
| Administrative & Support | 0 (0.0%) | 0 (0.0%) |
| Educational Services | 0 (0.0%) | 0 (0.0%) |
| Health Care & Social Assistance | 10 (16.7%) | 50 (83.3%) |
| Arts, Entertainment & Recreation | 0 (0.0%) | 0 (0.0%) |
| Accommodation & Food Services | 11 (52.4%) | 10 (47.6%) |
| Public Administration | 0 (0.0%) | 21 (100.0%) |
| Total | 108 (55.1%) | 88 (44.9%) |
Education in Scotia
School Enrollment in Scotia
The most common levels of schooling among the 118 students in Scotia are elementary school (36 | 30.5%), middle school (32 | 27.1%), and kindergarten (16 | 13.6%).
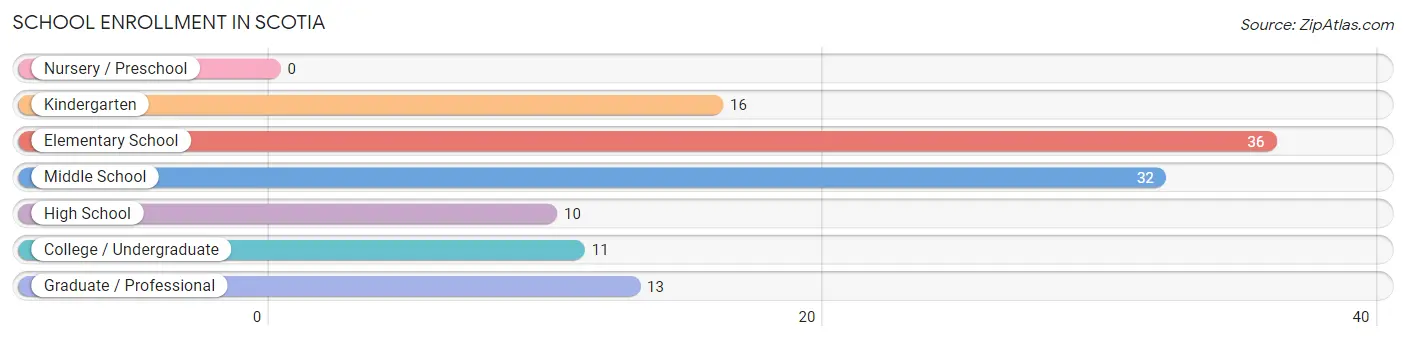
| School Level | # Students | % Students |
| Nursery / Preschool | 0 | 0.0% |
| Kindergarten | 16 | 13.6% |
| Elementary School | 36 | 30.5% |
| Middle School | 32 | 27.1% |
| High School | 10 | 8.5% |
| College / Undergraduate | 11 | 9.3% |
| Graduate / Professional | 13 | 11.0% |
| Total | 118 | 100.0% |
School Enrollment by Age by Funding Source in Scotia
Out of a total of 118 students who are enrolled in schools in Scotia, 13 (11.0%) attend a private institution, while the remaining 105 (89.0%) are enrolled in public schools. The age group of 35 years and over has the highest likelihood of being enrolled in private schools, with 13 (54.2% in the age bracket) enrolled. Conversely, the age group of 5 to 9 year old has the lowest likelihood of being enrolled in a private school, with 52 (100.0% in the age bracket) attending a public institution.
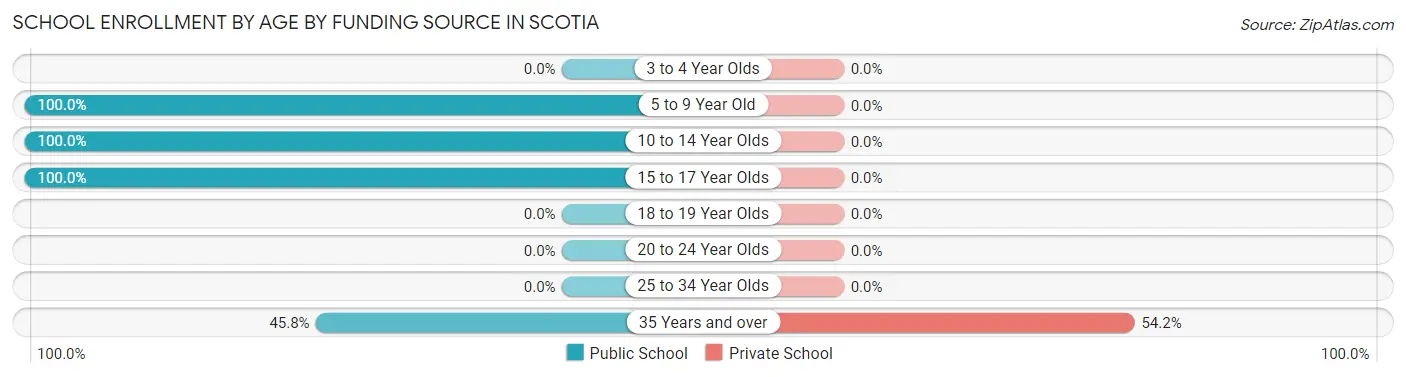
| Age Bracket | Public School | Private School |
| 3 to 4 Year Olds | 0 (0.0%) | 0 (0.0%) |
| 5 to 9 Year Old | 52 (100.0%) | 0 (0.0%) |
| 10 to 14 Year Olds | 32 (100.0%) | 0 (0.0%) |
| 15 to 17 Year Olds | 10 (100.0%) | 0 (0.0%) |
| 18 to 19 Year Olds | 0 (0.0%) | 0 (0.0%) |
| 20 to 24 Year Olds | 0 (0.0%) | 0 (0.0%) |
| 25 to 34 Year Olds | 0 (0.0%) | 0 (0.0%) |
| 35 Years and over | 11 (45.8%) | 13 (54.2%) |
| Total | 105 (89.0%) | 13 (11.0%) |
Educational Attainment by Field of Study in Scotia
Liberal arts & history (23 | 29.5%), engineering (20 | 25.6%), visual & performing arts (13 | 16.7%), science & technology (12 | 15.4%), and arts & humanities (10 | 12.8%) are the most common fields of study among 78 individuals in Scotia who have obtained a bachelor's degree or higher.
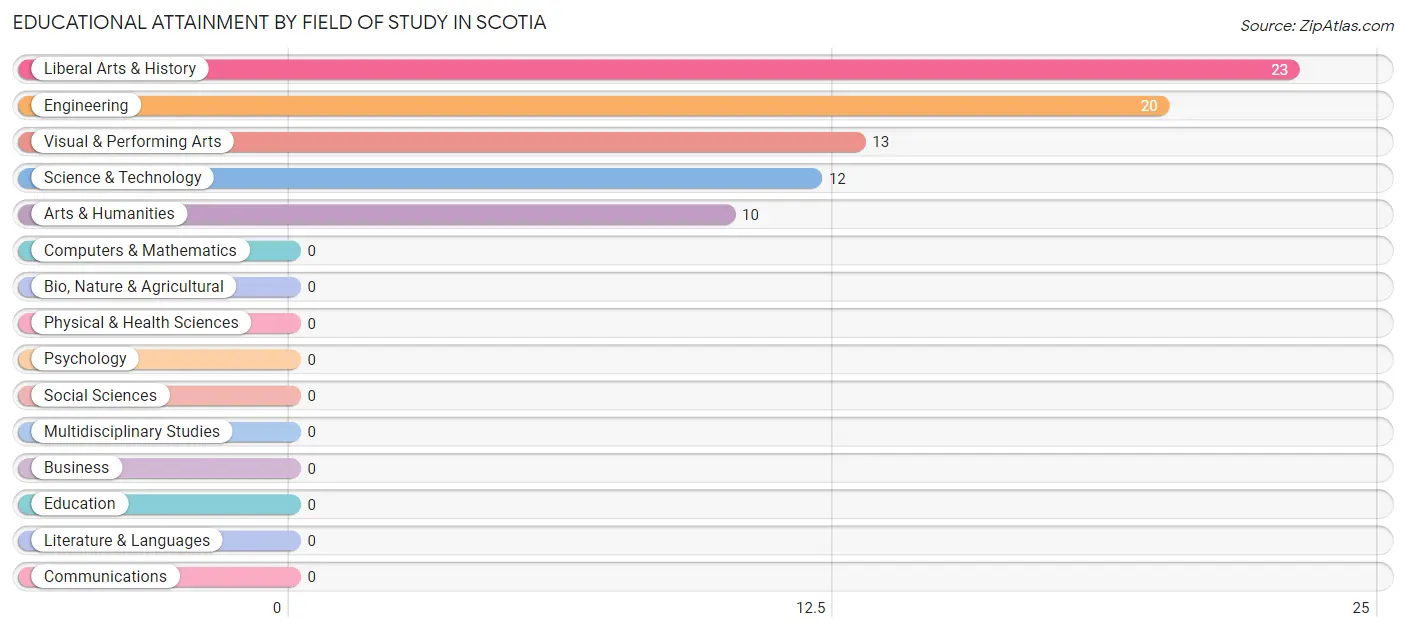
| Field of Study | # Graduates | % Graduates |
| Computers & Mathematics | 0 | 0.0% |
| Bio, Nature & Agricultural | 0 | 0.0% |
| Physical & Health Sciences | 0 | 0.0% |
| Psychology | 0 | 0.0% |
| Social Sciences | 0 | 0.0% |
| Engineering | 20 | 25.6% |
| Multidisciplinary Studies | 0 | 0.0% |
| Science & Technology | 12 | 15.4% |
| Business | 0 | 0.0% |
| Education | 0 | 0.0% |
| Literature & Languages | 0 | 0.0% |
| Liberal Arts & History | 23 | 29.5% |
| Visual & Performing Arts | 13 | 16.7% |
| Communications | 0 | 0.0% |
| Arts & Humanities | 10 | 12.8% |
| Total | 78 | 100.0% |
Transportation & Commute in Scotia
Vehicle Availability by Sex in Scotia
The most prevalent vehicle ownership categories in Scotia are males with 2 vehicles (65, accounting for 60.2%) and females with 2 vehicles (62, making up 73.9%).
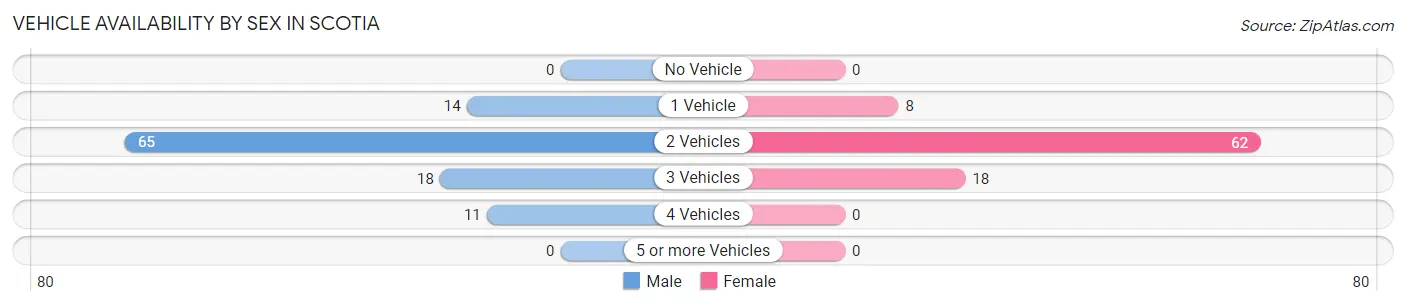
| Vehicles Available | Male | Female |
| No Vehicle | 0 (0.0%) | 0 (0.0%) |
| 1 Vehicle | 14 (13.0%) | 8 (9.1%) |
| 2 Vehicles | 65 (60.2%) | 62 (70.5%) |
| 3 Vehicles | 18 (16.7%) | 18 (20.4%) |
| 4 Vehicles | 11 (10.2%) | 0 (0.0%) |
| 5 or more Vehicles | 0 (0.0%) | 0 (0.0%) |
| Total | 108 (100.0%) | 88 (100.0%) |
Commute Time in Scotia
The most frequently occuring commute durations in Scotia are 10 to 14 minutes (54 commuters, 27.6%), 45 to 59 minutes (50 commuters, 25.5%), and 30 to 34 minutes (34 commuters, 17.3%).
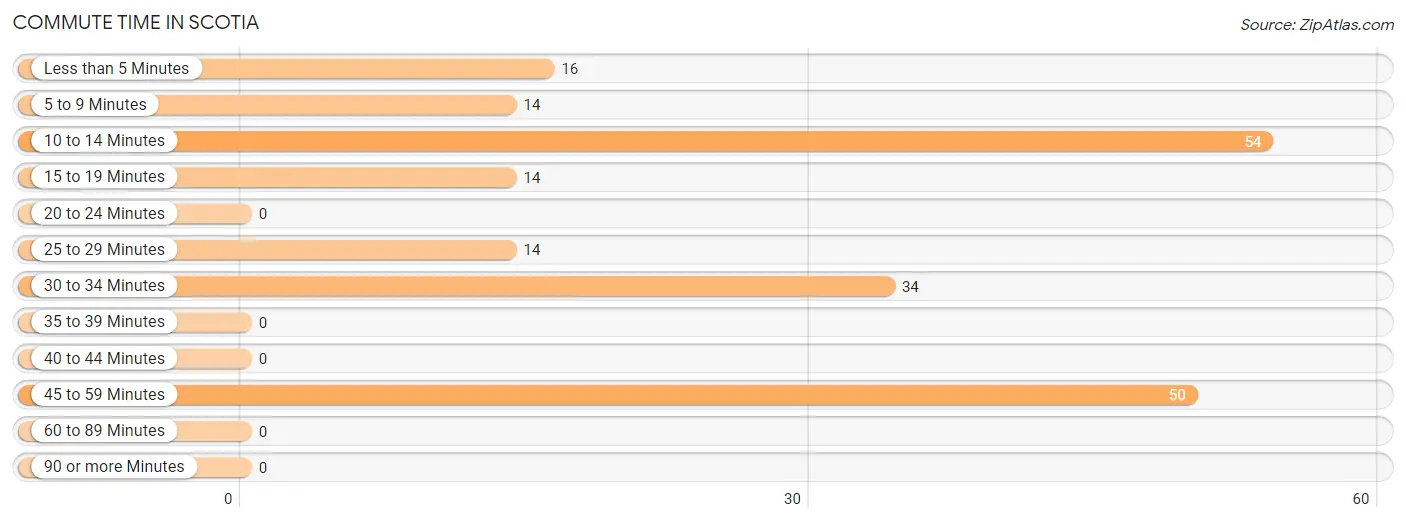
| Commute Time | # Commuters | % Commuters |
| Less than 5 Minutes | 16 | 8.2% |
| 5 to 9 Minutes | 14 | 7.1% |
| 10 to 14 Minutes | 54 | 27.6% |
| 15 to 19 Minutes | 14 | 7.1% |
| 20 to 24 Minutes | 0 | 0.0% |
| 25 to 29 Minutes | 14 | 7.1% |
| 30 to 34 Minutes | 34 | 17.3% |
| 35 to 39 Minutes | 0 | 0.0% |
| 40 to 44 Minutes | 0 | 0.0% |
| 45 to 59 Minutes | 50 | 25.5% |
| 60 to 89 Minutes | 0 | 0.0% |
| 90 or more Minutes | 0 | 0.0% |
Commute Time by Sex in Scotia
The most common commute times in Scotia are 10 to 14 minutes (44 commuters, 40.7%) for males and 45 to 59 minutes (50 commuters, 56.8%) for females.
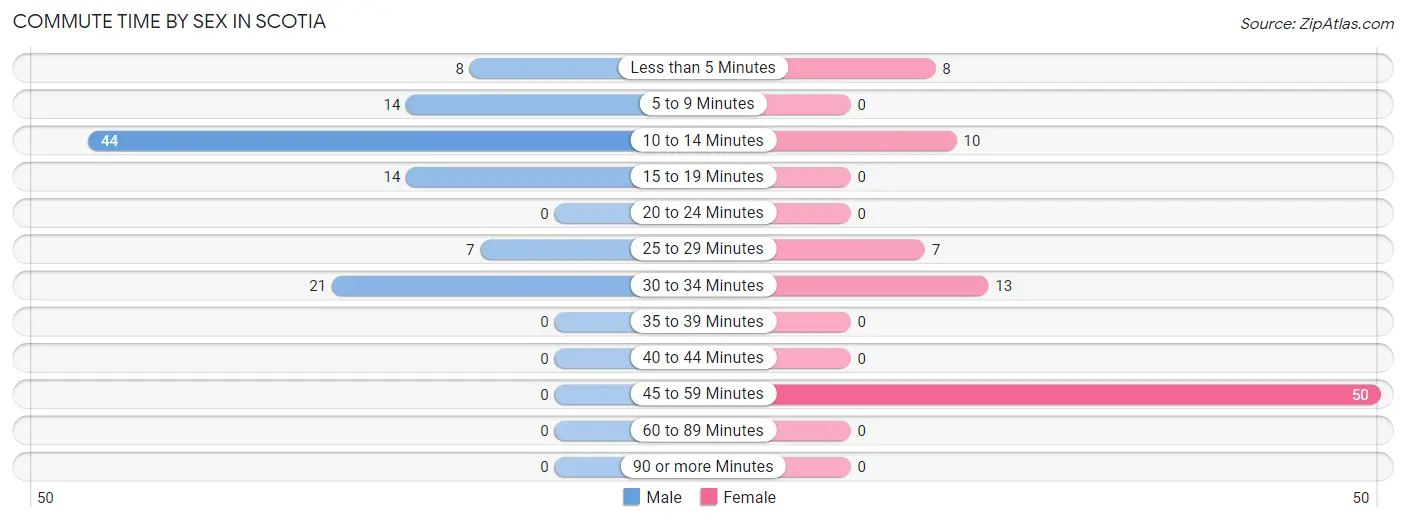
| Commute Time | Male | Female |
| Less than 5 Minutes | 8 (7.4%) | 8 (9.1%) |
| 5 to 9 Minutes | 14 (13.0%) | 0 (0.0%) |
| 10 to 14 Minutes | 44 (40.7%) | 10 (11.4%) |
| 15 to 19 Minutes | 14 (13.0%) | 0 (0.0%) |
| 20 to 24 Minutes | 0 (0.0%) | 0 (0.0%) |
| 25 to 29 Minutes | 7 (6.5%) | 7 (8.0%) |
| 30 to 34 Minutes | 21 (19.4%) | 13 (14.8%) |
| 35 to 39 Minutes | 0 (0.0%) | 0 (0.0%) |
| 40 to 44 Minutes | 0 (0.0%) | 0 (0.0%) |
| 45 to 59 Minutes | 0 (0.0%) | 50 (56.8%) |
| 60 to 89 Minutes | 0 (0.0%) | 0 (0.0%) |
| 90 or more Minutes | 0 (0.0%) | 0 (0.0%) |
Time of Departure to Work by Sex in Scotia
The most frequent times of departure to work in Scotia are 5:30 AM to 5:59 AM (52, 48.1%) for males and 7:00 AM to 7:29 AM (29, 33.0%) for females.
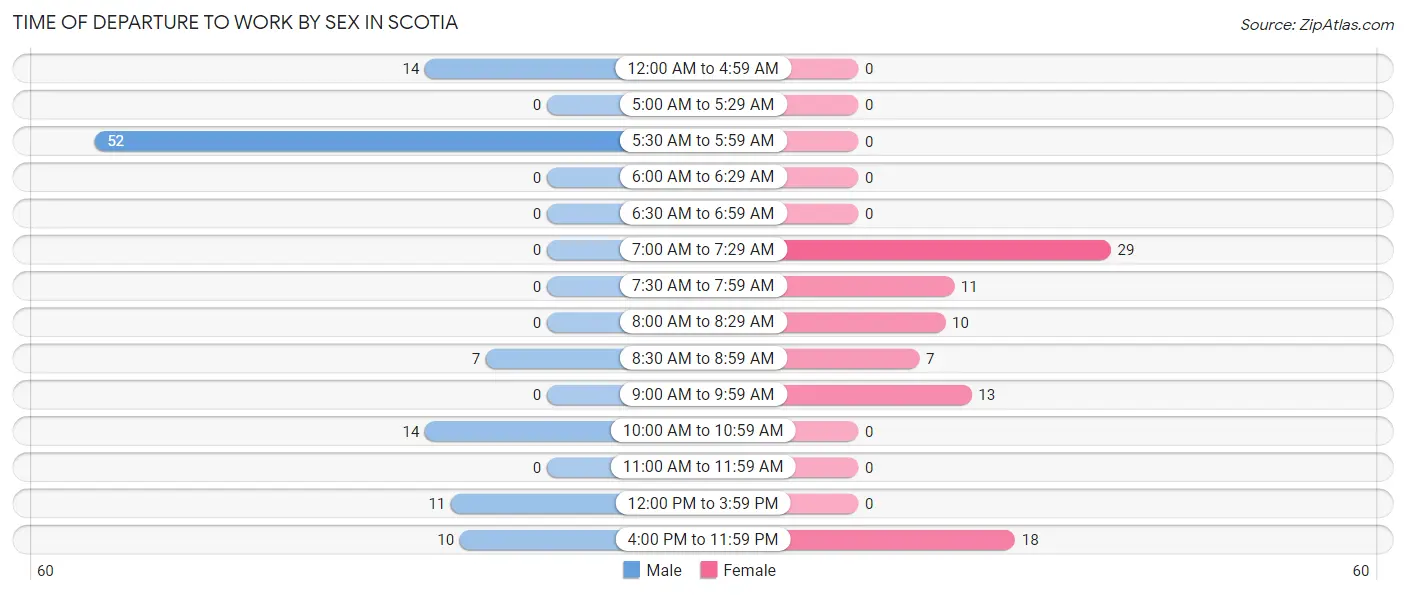
| Time of Departure | Male | Female |
| 12:00 AM to 4:59 AM | 14 (13.0%) | 0 (0.0%) |
| 5:00 AM to 5:29 AM | 0 (0.0%) | 0 (0.0%) |
| 5:30 AM to 5:59 AM | 52 (48.1%) | 0 (0.0%) |
| 6:00 AM to 6:29 AM | 0 (0.0%) | 0 (0.0%) |
| 6:30 AM to 6:59 AM | 0 (0.0%) | 0 (0.0%) |
| 7:00 AM to 7:29 AM | 0 (0.0%) | 29 (33.0%) |
| 7:30 AM to 7:59 AM | 0 (0.0%) | 11 (12.5%) |
| 8:00 AM to 8:29 AM | 0 (0.0%) | 10 (11.4%) |
| 8:30 AM to 8:59 AM | 7 (6.5%) | 7 (8.0%) |
| 9:00 AM to 9:59 AM | 0 (0.0%) | 13 (14.8%) |
| 10:00 AM to 10:59 AM | 14 (13.0%) | 0 (0.0%) |
| 11:00 AM to 11:59 AM | 0 (0.0%) | 0 (0.0%) |
| 12:00 PM to 3:59 PM | 11 (10.2%) | 0 (0.0%) |
| 4:00 PM to 11:59 PM | 10 (9.3%) | 18 (20.4%) |
| Total | 108 (100.0%) | 88 (100.0%) |
Housing Occupancy in Scotia
Occupancy by Ownership in Scotia
Of the total 161 dwellings in Scotia, owner-occupied units account for 46 (28.6%), while renter-occupied units make up 115 (71.4%).
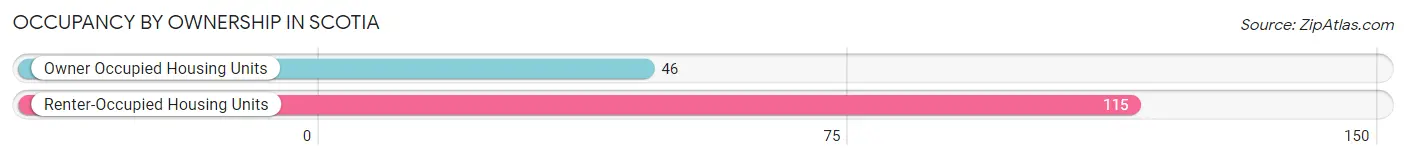
| Occupancy | # Housing Units | % Housing Units |
| Owner Occupied Housing Units | 46 | 28.6% |
| Renter-Occupied Housing Units | 115 | 71.4% |
| Total Occupied Housing Units | 161 | 100.0% |
Occupancy by Household Size in Scotia
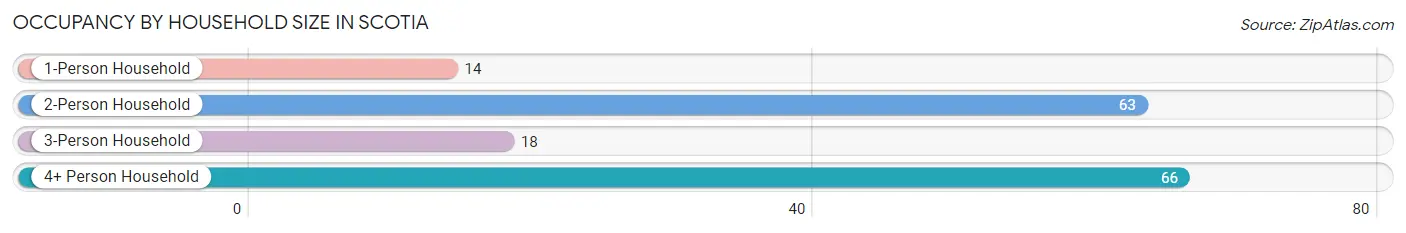
| Household Size | # Housing Units | % Housing Units |
| 1-Person Household | 14 | 8.7% |
| 2-Person Household | 63 | 39.1% |
| 3-Person Household | 18 | 11.2% |
| 4+ Person Household | 66 | 41.0% |
| Total Housing Units | 161 | 100.0% |
Occupancy by Ownership by Household Size in Scotia
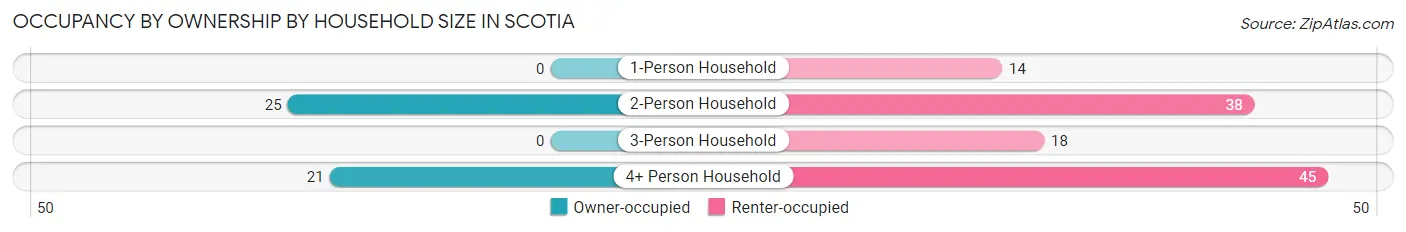
| Household Size | Owner-occupied | Renter-occupied |
| 1-Person Household | 0 (0.0%) | 14 (100.0%) |
| 2-Person Household | 25 (39.7%) | 38 (60.3%) |
| 3-Person Household | 0 (0.0%) | 18 (100.0%) |
| 4+ Person Household | 21 (31.8%) | 45 (68.2%) |
| Total Housing Units | 46 (28.6%) | 115 (71.4%) |
Occupancy by Educational Attainment in Scotia
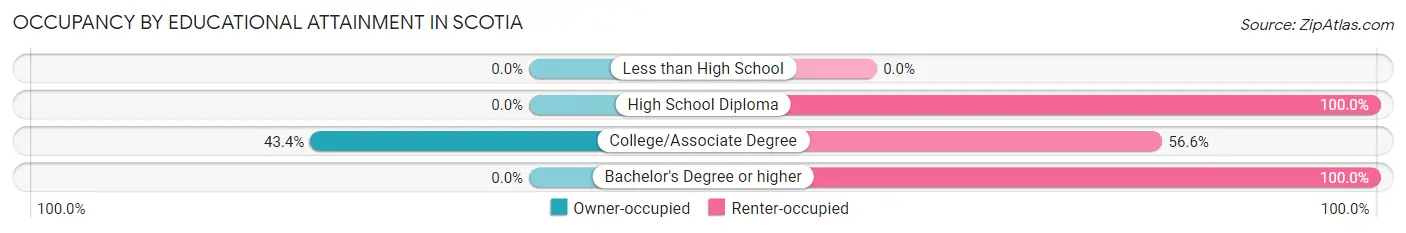
| Household Size | Owner-occupied | Renter-occupied |
| Less than High School | 0 (0.0%) | 0 (0.0%) |
| High School Diploma | 0 (0.0%) | 32 (100.0%) |
| College/Associate Degree | 46 (43.4%) | 60 (56.6%) |
| Bachelor's Degree or higher | 0 (0.0%) | 23 (100.0%) |
Occupancy by Age of Householder in Scotia
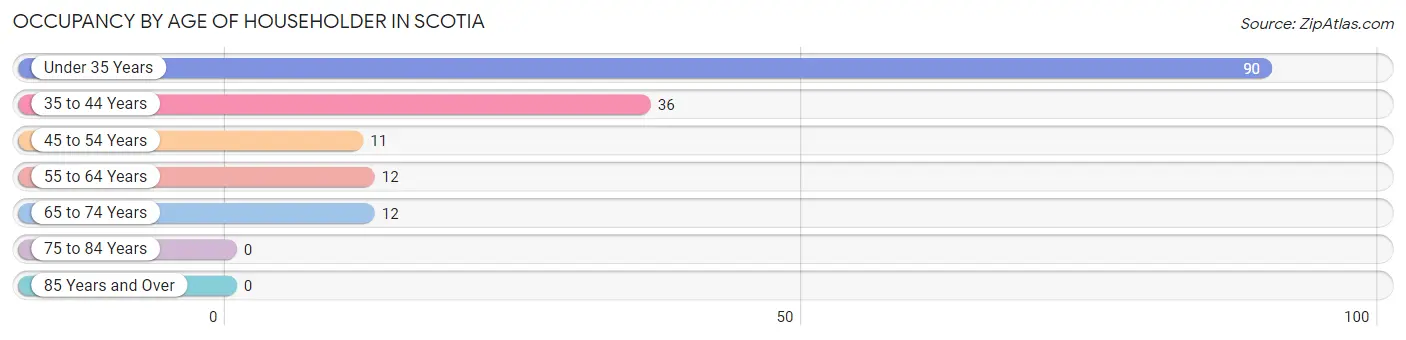
| Age Bracket | # Households | % Households |
| Under 35 Years | 90 | 55.9% |
| 35 to 44 Years | 36 | 22.4% |
| 45 to 54 Years | 11 | 6.8% |
| 55 to 64 Years | 12 | 7.4% |
| 65 to 74 Years | 12 | 7.4% |
| 75 to 84 Years | 0 | 0.0% |
| 85 Years and Over | 0 | 0.0% |
| Total | 161 | 100.0% |
Housing Finances in Scotia
Median Income by Occupancy in Scotia
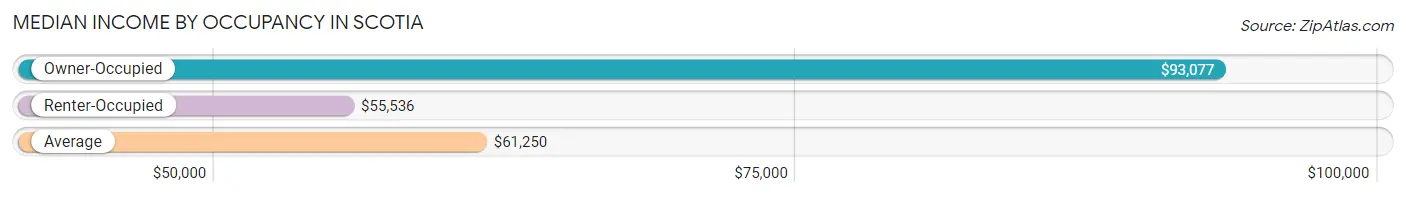
| Occupancy Type | # Households | Median Income |
| Owner-Occupied | 46 (28.6%) | $93,077 |
| Renter-Occupied | 115 (71.4%) | $55,536 |
| Average | 161 (100.0%) | $61,250 |
Occupancy by Householder Income Bracket in Scotia
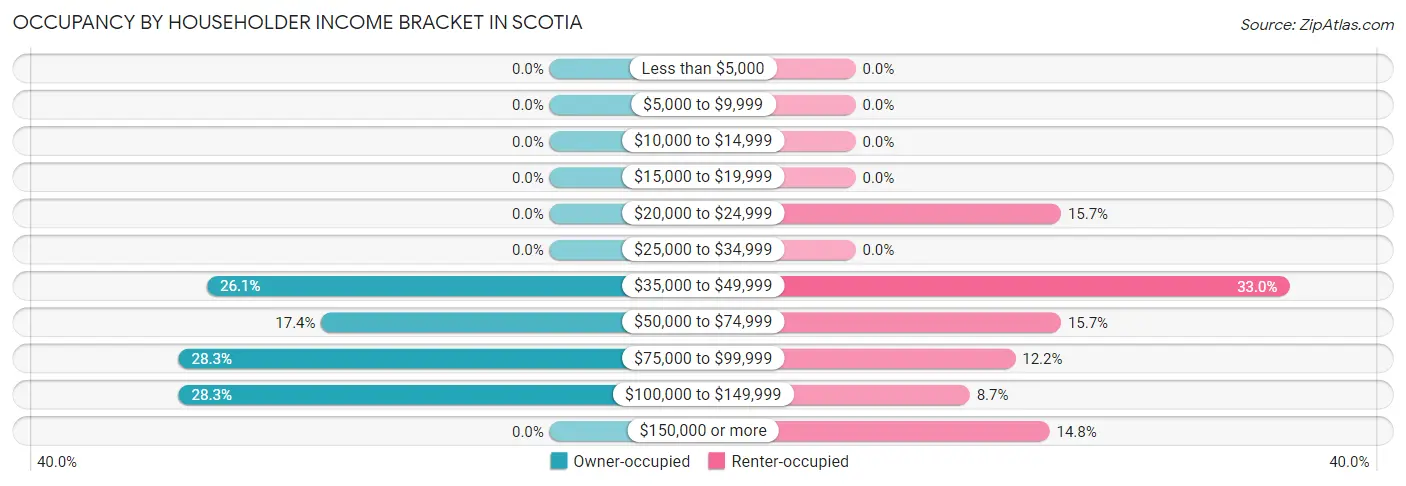
| Income Bracket | Owner-occupied | Renter-occupied |
| Less than $5,000 | 0 (0.0%) | 0 (0.0%) |
| $5,000 to $9,999 | 0 (0.0%) | 0 (0.0%) |
| $10,000 to $14,999 | 0 (0.0%) | 0 (0.0%) |
| $15,000 to $19,999 | 0 (0.0%) | 0 (0.0%) |
| $20,000 to $24,999 | 0 (0.0%) | 18 (15.7%) |
| $25,000 to $34,999 | 0 (0.0%) | 0 (0.0%) |
| $35,000 to $49,999 | 12 (26.1%) | 38 (33.0%) |
| $50,000 to $74,999 | 8 (17.4%) | 18 (15.7%) |
| $75,000 to $99,999 | 13 (28.3%) | 14 (12.2%) |
| $100,000 to $149,999 | 13 (28.3%) | 10 (8.7%) |
| $150,000 or more | 0 (0.0%) | 17 (14.8%) |
| Total | 46 (100.0%) | 115 (100.0%) |
Monthly Housing Cost Tiers in Scotia
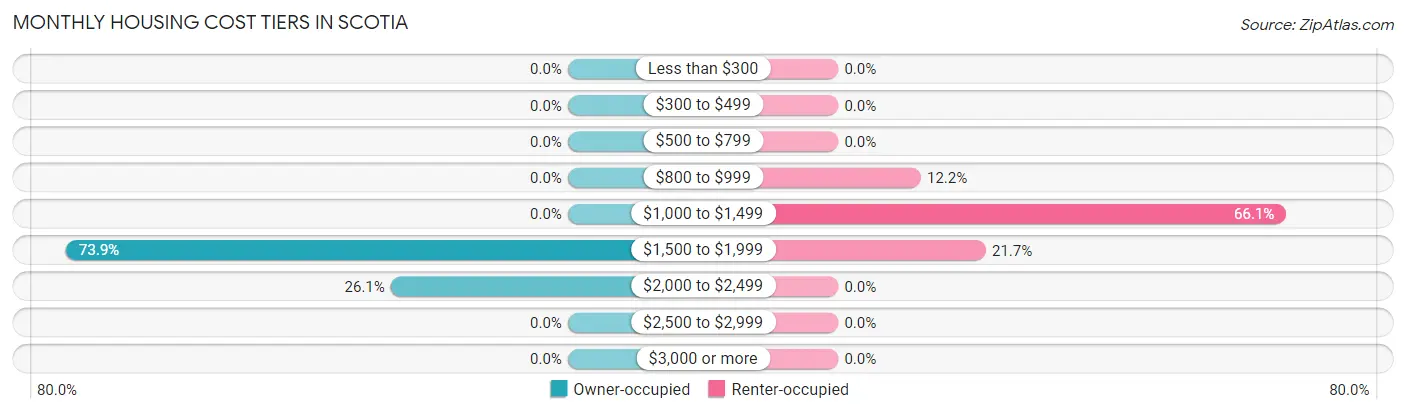
| Monthly Cost | Owner-occupied | Renter-occupied |
| Less than $300 | 0 (0.0%) | 0 (0.0%) |
| $300 to $499 | 0 (0.0%) | 0 (0.0%) |
| $500 to $799 | 0 (0.0%) | 0 (0.0%) |
| $800 to $999 | 0 (0.0%) | 14 (12.2%) |
| $1,000 to $1,499 | 0 (0.0%) | 76 (66.1%) |
| $1,500 to $1,999 | 34 (73.9%) | 25 (21.7%) |
| $2,000 to $2,499 | 12 (26.1%) | 0 (0.0%) |
| $2,500 to $2,999 | 0 (0.0%) | 0 (0.0%) |
| $3,000 or more | 0 (0.0%) | 0 (0.0%) |
| Total | 46 (100.0%) | 115 (100.0%) |
Physical Housing Characteristics in Scotia
Housing Structures in Scotia
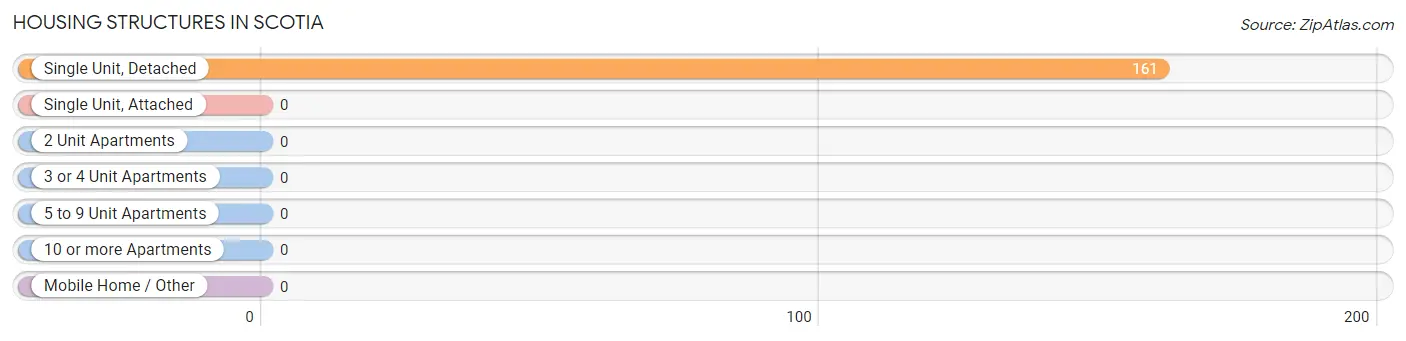
| Structure Type | # Housing Units | % Housing Units |
| Single Unit, Detached | 161 | 100.0% |
| Single Unit, Attached | 0 | 0.0% |
| 2 Unit Apartments | 0 | 0.0% |
| 3 or 4 Unit Apartments | 0 | 0.0% |
| 5 to 9 Unit Apartments | 0 | 0.0% |
| 10 or more Apartments | 0 | 0.0% |
| Mobile Home / Other | 0 | 0.0% |
| Total | 161 | 100.0% |
Housing Structures by Occupancy in Scotia
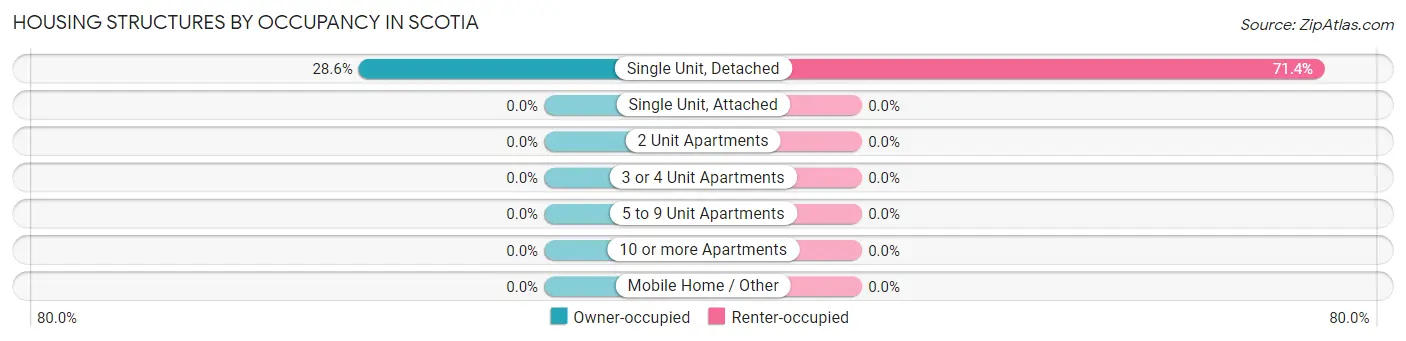
| Structure Type | Owner-occupied | Renter-occupied |
| Single Unit, Detached | 46 (28.6%) | 115 (71.4%) |
| Single Unit, Attached | 0 (0.0%) | 0 (0.0%) |
| 2 Unit Apartments | 0 (0.0%) | 0 (0.0%) |
| 3 or 4 Unit Apartments | 0 (0.0%) | 0 (0.0%) |
| 5 to 9 Unit Apartments | 0 (0.0%) | 0 (0.0%) |
| 10 or more Apartments | 0 (0.0%) | 0 (0.0%) |
| Mobile Home / Other | 0 (0.0%) | 0 (0.0%) |
| Total | 46 (28.6%) | 115 (71.4%) |
Housing Structures by Number of Rooms in Scotia
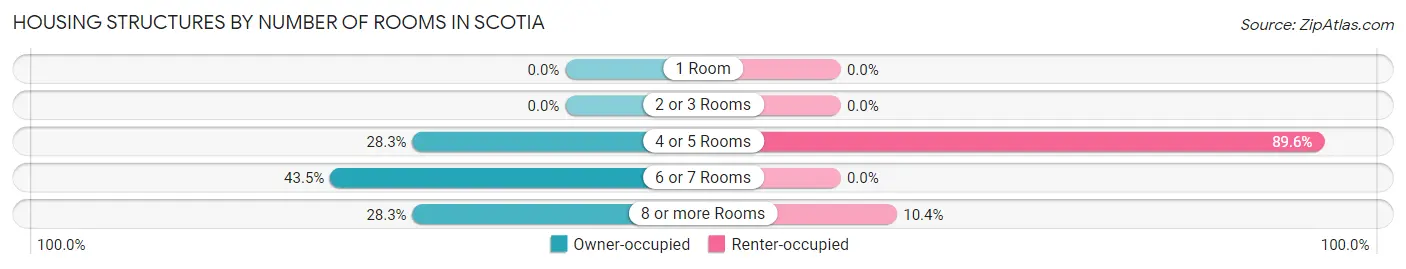
| Number of Rooms | Owner-occupied | Renter-occupied |
| 1 Room | 0 (0.0%) | 0 (0.0%) |
| 2 or 3 Rooms | 0 (0.0%) | 0 (0.0%) |
| 4 or 5 Rooms | 13 (28.3%) | 103 (89.6%) |
| 6 or 7 Rooms | 20 (43.5%) | 0 (0.0%) |
| 8 or more Rooms | 13 (28.3%) | 12 (10.4%) |
| Total | 46 (100.0%) | 115 (100.0%) |
Housing Structure by Heating Type in Scotia
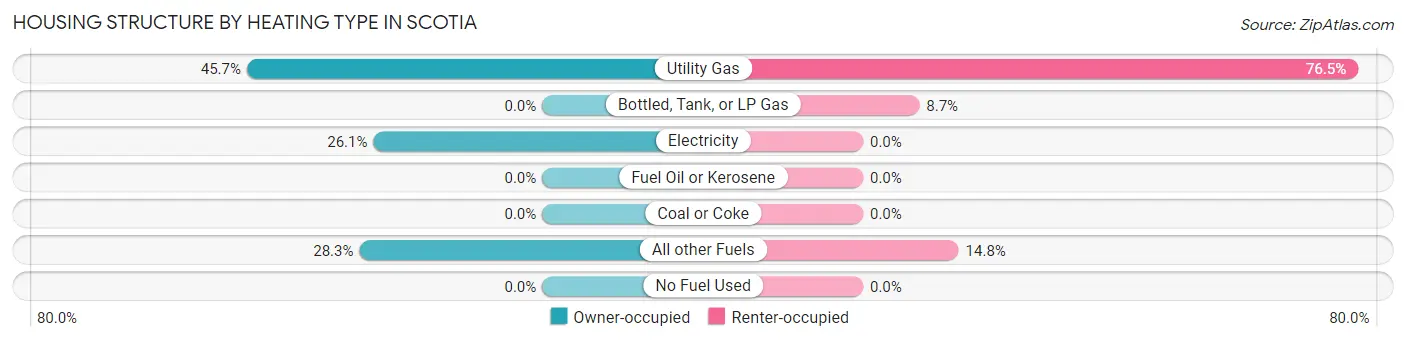
| Heating Type | Owner-occupied | Renter-occupied |
| Utility Gas | 21 (45.7%) | 88 (76.5%) |
| Bottled, Tank, or LP Gas | 0 (0.0%) | 10 (8.7%) |
| Electricity | 12 (26.1%) | 0 (0.0%) |
| Fuel Oil or Kerosene | 0 (0.0%) | 0 (0.0%) |
| Coal or Coke | 0 (0.0%) | 0 (0.0%) |
| All other Fuels | 13 (28.3%) | 17 (14.8%) |
| No Fuel Used | 0 (0.0%) | 0 (0.0%) |
| Total | 46 (100.0%) | 115 (100.0%) |
Household Vehicle Usage in Scotia
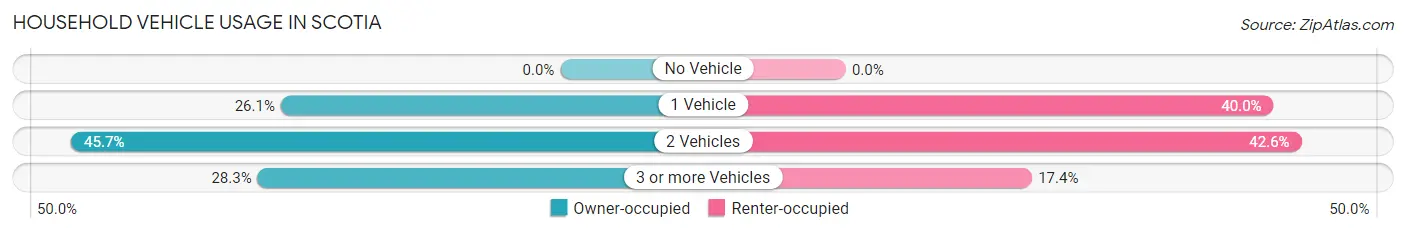
| Vehicles per Household | Owner-occupied | Renter-occupied |
| No Vehicle | 0 (0.0%) | 0 (0.0%) |
| 1 Vehicle | 12 (26.1%) | 46 (40.0%) |
| 2 Vehicles | 21 (45.7%) | 49 (42.6%) |
| 3 or more Vehicles | 13 (28.3%) | 20 (17.4%) |
| Total | 46 (100.0%) | 115 (100.0%) |
Real Estate & Mortgages in Scotia
Real Estate and Mortgage Overview in Scotia
| Characteristic | Without Mortgage | With Mortgage |
| Housing Units | 0 | 46 |
| Median Property Value | - | - |
| Median Household Income | - | - |
| Monthly Housing Costs | - | - |
| Real Estate Taxes | - | - |
Property Value by Mortgage Status in Scotia
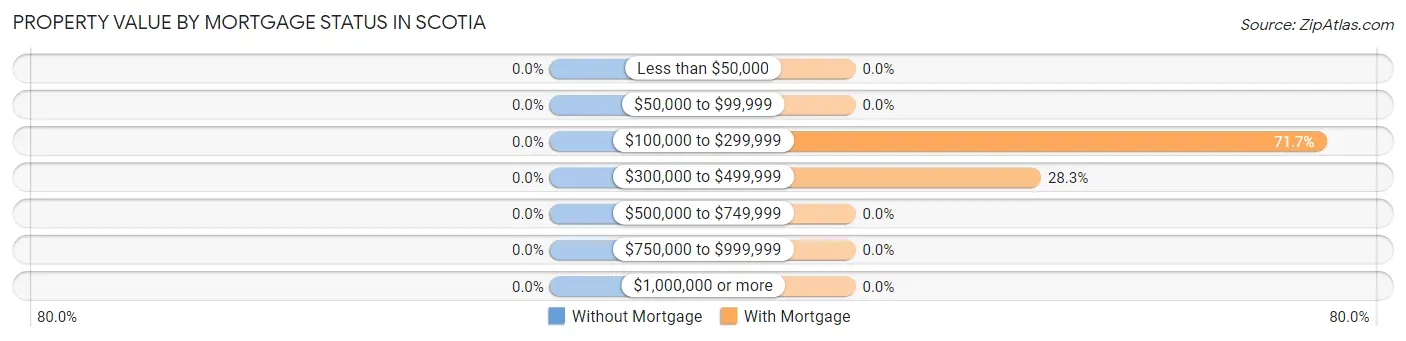
| Property Value | Without Mortgage | With Mortgage |
| Less than $50,000 | 0 (0.0%) | 0 (0.0%) |
| $50,000 to $99,999 | 0 (0.0%) | 0 (0.0%) |
| $100,000 to $299,999 | 0 (0.0%) | 33 (71.7%) |
| $300,000 to $499,999 | 0 (0.0%) | 13 (28.3%) |
| $500,000 to $749,999 | 0 (0.0%) | 0 (0.0%) |
| $750,000 to $999,999 | 0 (0.0%) | 0 (0.0%) |
| $1,000,000 or more | 0 (0.0%) | 0 (0.0%) |
| Total | 0 (0.0%) | 46 (100.0%) |
Household Income by Mortgage Status in Scotia
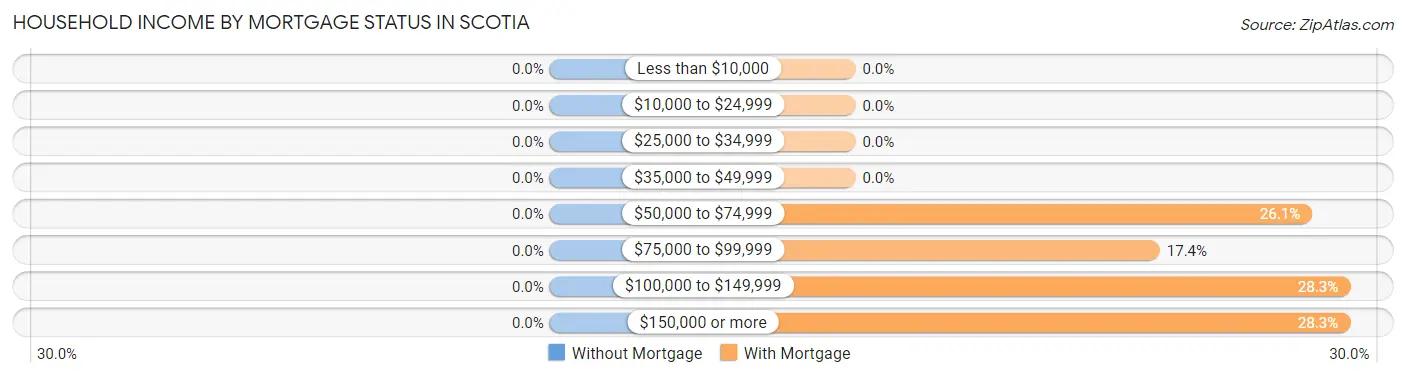
| Household Income | Without Mortgage | With Mortgage |
| Less than $10,000 | 0 (0.0%) | 0 (0.0%) |
| $10,000 to $24,999 | 0 (0.0%) | 0 (0.0%) |
| $25,000 to $34,999 | 0 (0.0%) | 0 (0.0%) |
| $35,000 to $49,999 | 0 (0.0%) | 0 (0.0%) |
| $50,000 to $74,999 | 0 (0.0%) | 12 (26.1%) |
| $75,000 to $99,999 | 0 (0.0%) | 8 (17.4%) |
| $100,000 to $149,999 | 0 (0.0%) | 13 (28.3%) |
| $150,000 or more | 0 (0.0%) | 13 (28.3%) |
| Total | 0 (0.0%) | 46 (100.0%) |
Property Value to Household Income Ratio in Scotia
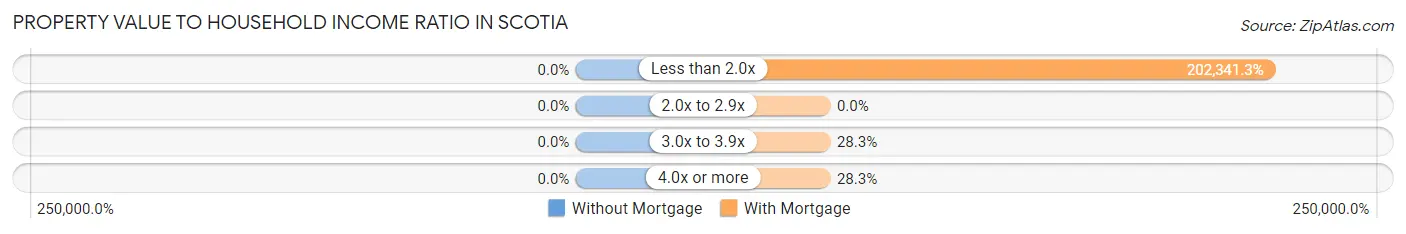
| Value-to-Income Ratio | Without Mortgage | With Mortgage |
| Less than 2.0x | 0 (0.0%) | 93,077 (202,341.3%) |
| 2.0x to 2.9x | 0 (0.0%) | 0 (0.0%) |
| 3.0x to 3.9x | 0 (0.0%) | 13 (28.3%) |
| 4.0x or more | 0 (0.0%) | 13 (28.3%) |
| Total | 0 (0.0%) | 46 (100.0%) |
Real Estate Taxes by Mortgage Status in Scotia
| Property Taxes | Without Mortgage | With Mortgage |
| Less than $800 | 0 (0.0%) | 0 (0.0%) |
| $800 to $1,499 | 0 (0.0%) | 0 (0.0%) |
| $800 to $1,499 | 0 (0.0%) | 0 (0.0%) |
| Total | 0 (0.0%) | 46 (100.0%) |
Health & Disability in Scotia
Health Insurance Coverage by Age in Scotia
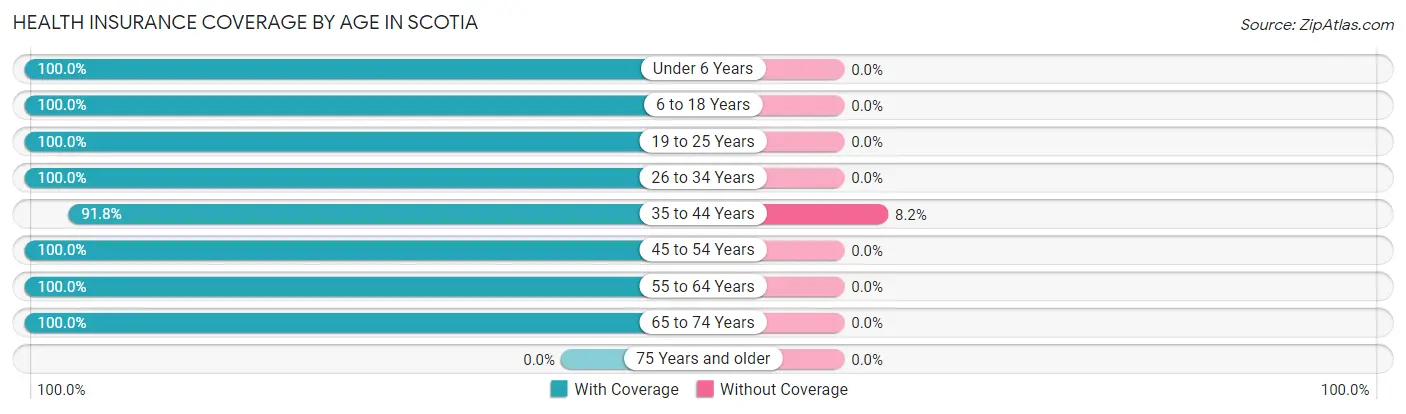
| Age Bracket | With Coverage | Without Coverage |
| Under 6 Years | 68 (100.0%) | 0 (0.0%) |
| 6 to 18 Years | 78 (100.0%) | 0 (0.0%) |
| 19 to 25 Years | 35 (100.0%) | 0 (0.0%) |
| 26 to 34 Years | 101 (100.0%) | 0 (0.0%) |
| 35 to 44 Years | 90 (91.8%) | 8 (8.2%) |
| 45 to 54 Years | 44 (100.0%) | 0 (0.0%) |
| 55 to 64 Years | 48 (100.0%) | 0 (0.0%) |
| 65 to 74 Years | 38 (100.0%) | 0 (0.0%) |
| 75 Years and older | 0 (0.0%) | 0 (0.0%) |
| Total | 502 (98.4%) | 8 (1.6%) |
Health Insurance Coverage by Citizenship Status in Scotia

| Citizenship Status | With Coverage | Without Coverage |
| Native Born | 68 (100.0%) | 0 (0.0%) |
| Foreign Born, Citizen | 78 (100.0%) | 0 (0.0%) |
| Foreign Born, not a Citizen | 35 (100.0%) | 0 (0.0%) |
Health Insurance Coverage by Household Income in Scotia
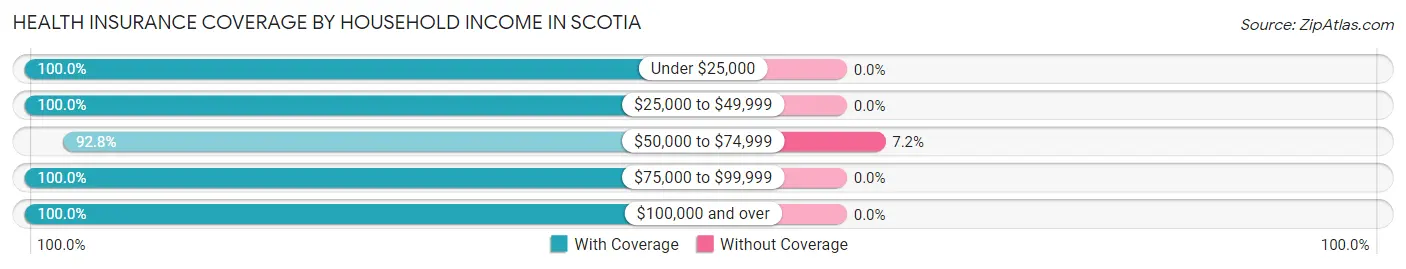
| Household Income | With Coverage | Without Coverage |
| Under $25,000 | 57 (100.0%) | 0 (0.0%) |
| $25,000 to $49,999 | 94 (100.0%) | 0 (0.0%) |
| $50,000 to $74,999 | 103 (92.8%) | 8 (7.2%) |
| $75,000 to $99,999 | 53 (100.0%) | 0 (0.0%) |
| $100,000 and over | 195 (100.0%) | 0 (0.0%) |
Public vs Private Health Insurance Coverage by Age in Scotia
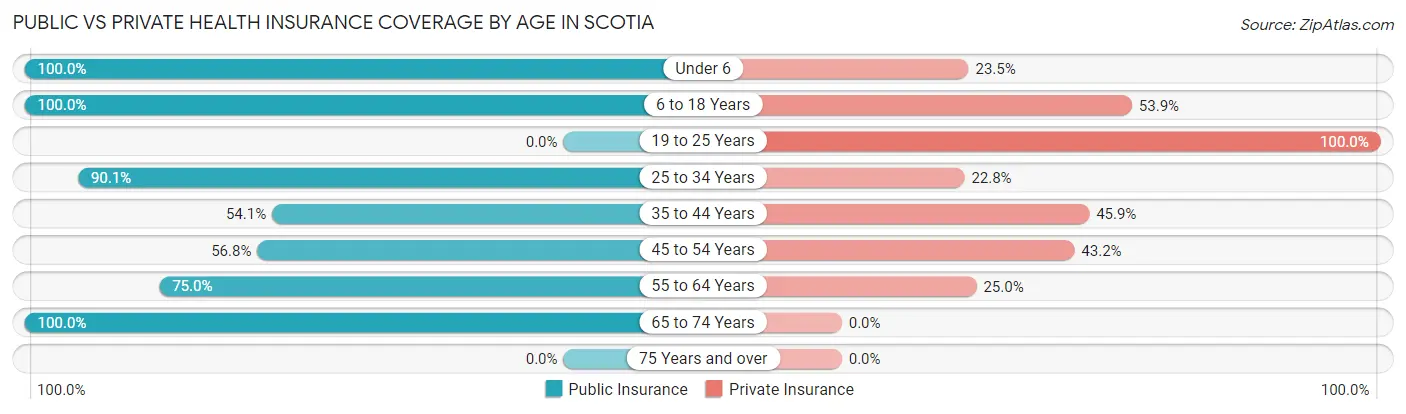
| Age Bracket | Public Insurance | Private Insurance |
| Under 6 | 68 (100.0%) | 16 (23.5%) |
| 6 to 18 Years | 78 (100.0%) | 42 (53.8%) |
| 19 to 25 Years | 0 (0.0%) | 35 (100.0%) |
| 25 to 34 Years | 91 (90.1%) | 23 (22.8%) |
| 35 to 44 Years | 53 (54.1%) | 45 (45.9%) |
| 45 to 54 Years | 25 (56.8%) | 19 (43.2%) |
| 55 to 64 Years | 36 (75.0%) | 12 (25.0%) |
| 65 to 74 Years | 38 (100.0%) | 0 (0.0%) |
| 75 Years and over | 0 (0.0%) | 0 (0.0%) |
| Total | 389 (76.3%) | 192 (37.7%) |
Disability Status by Sex by Age in Scotia
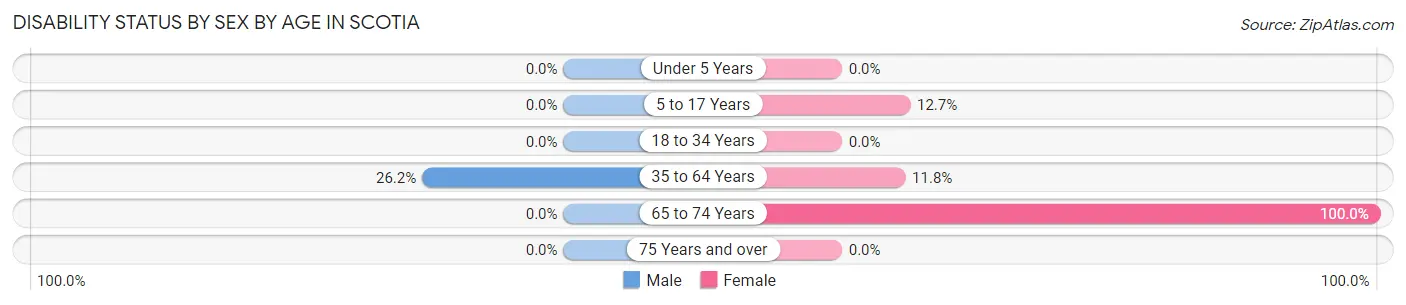
| Age Bracket | Male | Female |
| Under 5 Years | 0 (0.0%) | 0 (0.0%) |
| 5 to 17 Years | 0 (0.0%) | 10 (12.7%) |
| 18 to 34 Years | 0 (0.0%) | 0 (0.0%) |
| 35 to 64 Years | 32 (26.2%) | 8 (11.8%) |
| 65 to 74 Years | 0 (0.0%) | 13 (100.0%) |
| 75 Years and over | 0 (0.0%) | 0 (0.0%) |
Disability Class by Sex by Age in Scotia
Disability Class: Hearing Difficulty
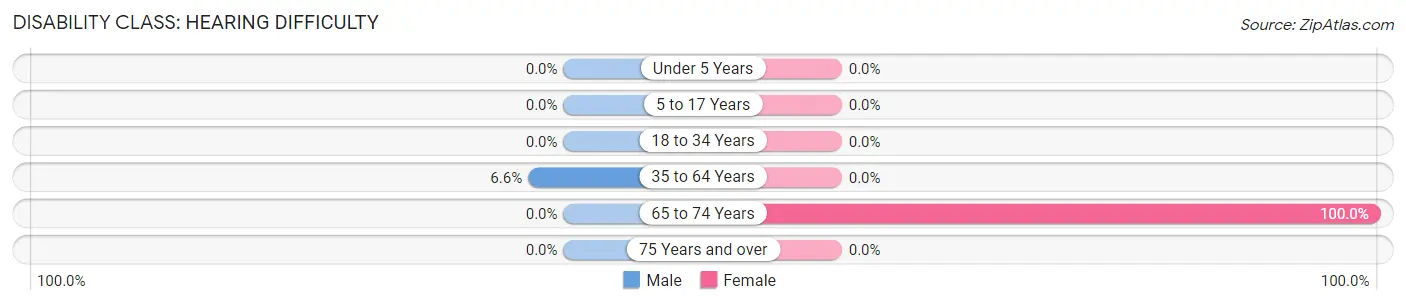
| Age Bracket | Male | Female |
| Under 5 Years | 0 (0.0%) | 0 (0.0%) |
| 5 to 17 Years | 0 (0.0%) | 0 (0.0%) |
| 18 to 34 Years | 0 (0.0%) | 0 (0.0%) |
| 35 to 64 Years | 8 (6.6%) | 0 (0.0%) |
| 65 to 74 Years | 0 (0.0%) | 13 (100.0%) |
| 75 Years and over | 0 (0.0%) | 0 (0.0%) |
Disability Class: Vision Difficulty
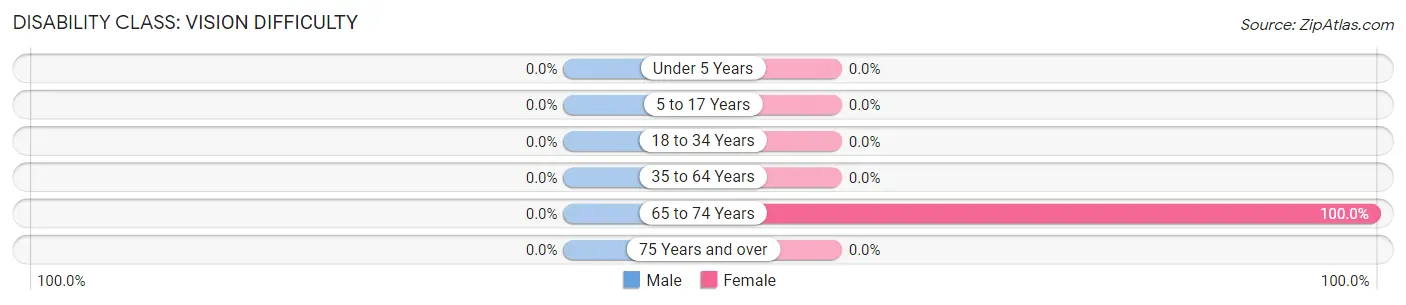
| Age Bracket | Male | Female |
| Under 5 Years | 0 (0.0%) | 0 (0.0%) |
| 5 to 17 Years | 0 (0.0%) | 0 (0.0%) |
| 18 to 34 Years | 0 (0.0%) | 0 (0.0%) |
| 35 to 64 Years | 0 (0.0%) | 0 (0.0%) |
| 65 to 74 Years | 0 (0.0%) | 13 (100.0%) |
| 75 Years and over | 0 (0.0%) | 0 (0.0%) |
Disability Class: Cognitive Difficulty
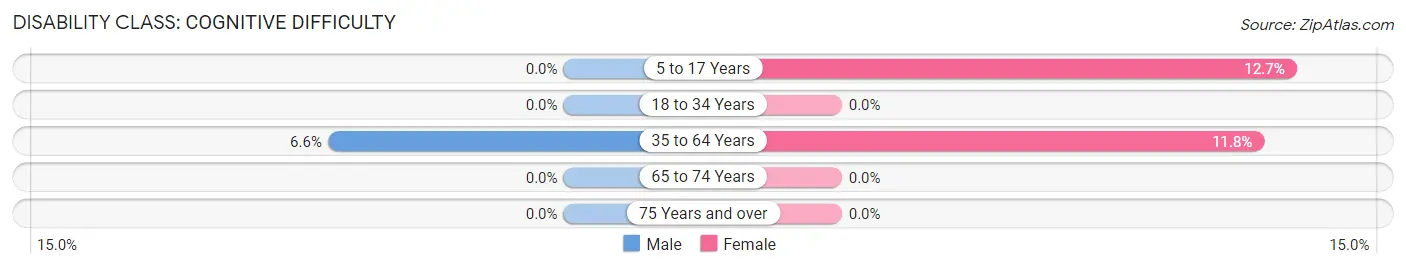
| Age Bracket | Male | Female |
| 5 to 17 Years | 0 (0.0%) | 10 (12.7%) |
| 18 to 34 Years | 0 (0.0%) | 0 (0.0%) |
| 35 to 64 Years | 8 (6.6%) | 8 (11.8%) |
| 65 to 74 Years | 0 (0.0%) | 0 (0.0%) |
| 75 Years and over | 0 (0.0%) | 0 (0.0%) |
Disability Class: Ambulatory Difficulty
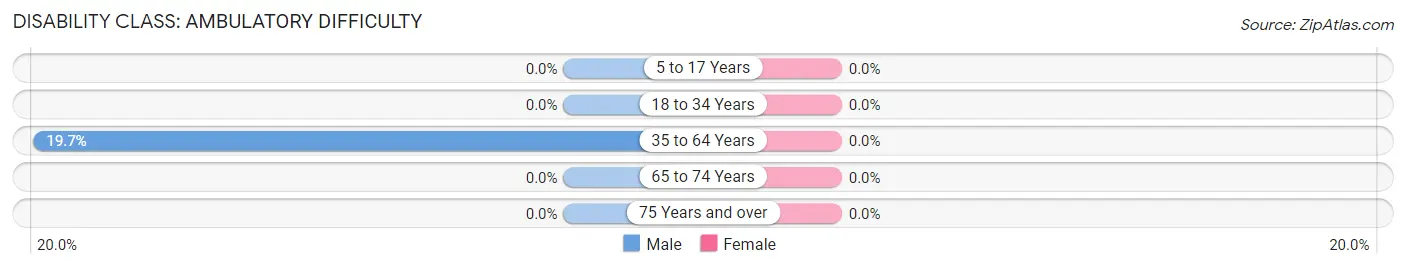
| Age Bracket | Male | Female |
| 5 to 17 Years | 0 (0.0%) | 0 (0.0%) |
| 18 to 34 Years | 0 (0.0%) | 0 (0.0%) |
| 35 to 64 Years | 24 (19.7%) | 0 (0.0%) |
| 65 to 74 Years | 0 (0.0%) | 0 (0.0%) |
| 75 Years and over | 0 (0.0%) | 0 (0.0%) |
Disability Class: Self-Care Difficulty
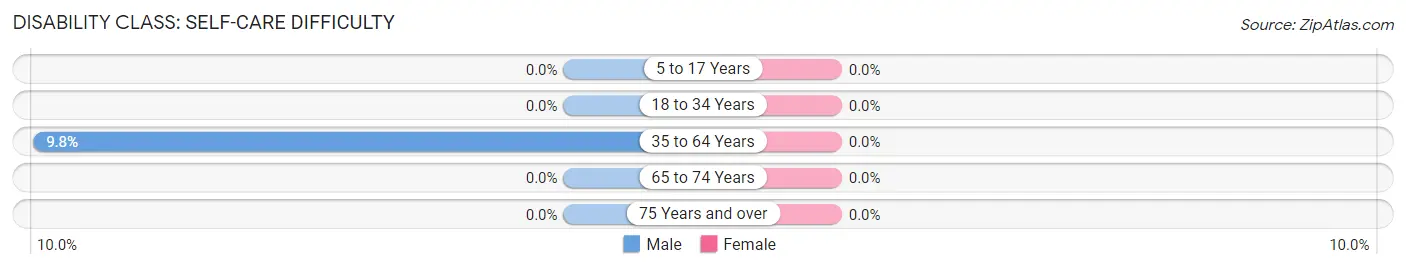
| Age Bracket | Male | Female |
| 5 to 17 Years | 0 (0.0%) | 0 (0.0%) |
| 18 to 34 Years | 0 (0.0%) | 0 (0.0%) |
| 35 to 64 Years | 12 (9.8%) | 0 (0.0%) |
| 65 to 74 Years | 0 (0.0%) | 0 (0.0%) |
| 75 Years and over | 0 (0.0%) | 0 (0.0%) |
Technology Access in Scotia
Computing Device Access in Scotia
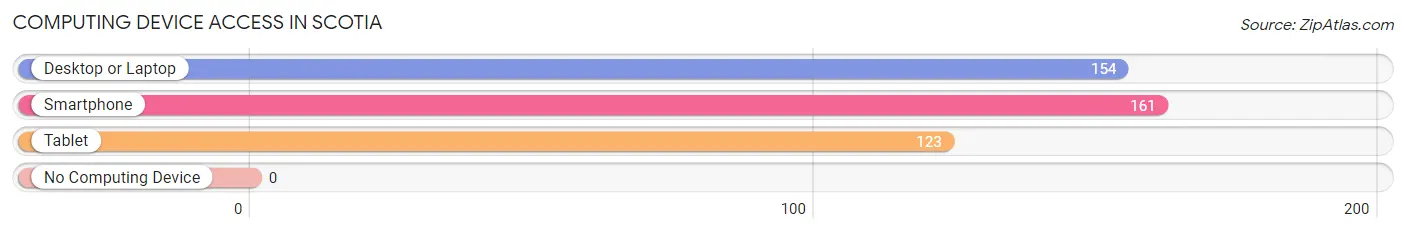
| Device Type | # Households | % Households |
| Desktop or Laptop | 154 | 95.7% |
| Smartphone | 161 | 100.0% |
| Tablet | 123 | 76.4% |
| No Computing Device | 0 | 0.0% |
| Total | 161 | 100.0% |
Internet Access in Scotia
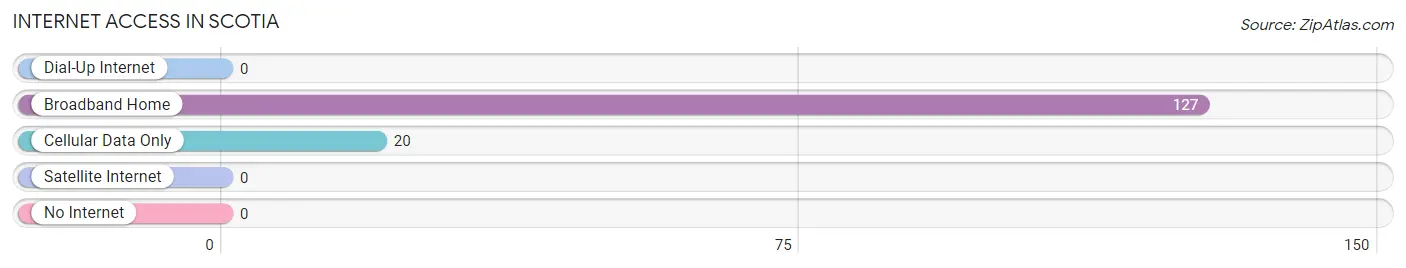
| Internet Type | # Households | % Households |
| Dial-Up Internet | 0 | 0.0% |
| Broadband Home | 127 | 78.9% |
| Cellular Data Only | 20 | 12.4% |
| Satellite Internet | 0 | 0.0% |
| No Internet | 0 | 0.0% |
| Total | 161 | 100.0% |
Scotia Summary
Scotia, California is a small town located in Humboldt County, California. It is situated on the banks of the Eel River, approximately 10 miles south of the county seat of Eureka. The town was founded in 1854 by a group of settlers from Scotland, and was named after the country of their origin. Scotia is known for its rich history, beautiful geography, and vibrant economy.
History
Scotia was founded in 1854 by a group of settlers from Scotland. The settlers were led by John and William Anderson, who had previously lived in the area. The town was named after the country of their origin, and the settlers quickly established a thriving lumber industry. The lumber industry was the main source of income for the town, and it was also the main source of employment. The lumber industry was so successful that it allowed the town to become a major shipping port for the region.
In the late 1800s, Scotia was a bustling town with a population of over 1,000 people. The town had a variety of businesses, including a hotel, a bank, a post office, and a variety of stores. The town also had a school, a library, and a church.
In the early 1900s, the lumber industry began to decline, and the town's population began to decline as well. By the 1950s, the population had dropped to just over 500 people. The town was still a major shipping port, but the decline in the lumber industry had a major impact on the town's economy.
Geography
Scotia is located in Humboldt County, California, on the banks of the Eel River. The town is situated in a valley surrounded by mountains, and is approximately 10 miles south of the county seat of Eureka. The town is located in a temperate climate, with mild winters and warm summers.
The town is surrounded by lush forests, and is home to a variety of wildlife, including deer, elk, and black bears. The nearby Eel River is a popular destination for fishing, swimming, and rafting. The nearby Redwood National Park is also a popular destination for visitors, and is home to some of the world's tallest trees.
Economy
The economy of Scotia is largely based on the lumber industry. The town is home to several lumber mills, and the lumber industry is still the main source of employment for the town. The lumber industry is also the main source of income for the town, and it is estimated that the lumber industry accounts for over 50% of the town's total income.
The town is also home to a variety of other businesses, including restaurants, retail stores, and a variety of services. The town is also home to a number of tourist attractions, including the nearby Redwood National Park.
Demographics
As of the 2010 census, the population of Scotia was 1,093. The town is predominantly white, with over 90% of the population being white. The town also has a small Hispanic population, with approximately 5% of the population being Hispanic. The median household income in Scotia is $41,250, and the median home value is $179,000.
Conclusion
Scotia, California is a small town with a rich history, beautiful geography, and vibrant economy. The town was founded in 1854 by a group of settlers from Scotland, and was named after the country of their origin. The town is home to a variety of businesses, including a lumber industry, restaurants, retail stores, and a variety of services. The town is also home to a number of tourist attractions, including the nearby Redwood National Park. The population of Scotia is predominantly white, with over 90% of the population being white. The median household income in Scotia is $41,250, and the median home value is $179,000.
Common Questions
What is Per Capita Income in Scotia?
Per Capita income in Scotia is $24,710.
What is the Median Family Income in Scotia?
Median Family Income in Scotia is $60,795.
What is the Median Household income in Scotia?
Median Household Income in Scotia is $61,250.
What is Income or Wage Gap in Scotia?
Income or Wage Gap in Scotia is 55.4%.
Women in Scotia earn 44.6 cents for every dollar earned by a man.
What is Inequality or Gini Index in Scotia?
Inequality or Gini Index in Scotia is 0.34.
What is the Total Population of Scotia?
Total Population of Scotia is 510.
What is the Total Male Population of Scotia?
Total Male Population of Scotia is 232.
What is the Total Female Population of Scotia?
Total Female Population of Scotia is 278.
What is the Ratio of Males per 100 Females in Scotia?
There are 83.45 Males per 100 Females in Scotia.
What is the Ratio of Females per 100 Males in Scotia?
There are 119.83 Females per 100 Males in Scotia.
What is the Median Population Age in Scotia?
Median Population Age in Scotia is 31.9 Years.
What is the Average Family Size in Scotia
Average Family Size in Scotia is 3.4 People.
What is the Average Household Size in Scotia
Average Household Size in Scotia is 3.2 People.
How Large is the Labor Force in Scotia?
There are 226 People in the Labor Forcein in Scotia.
What is the Percentage of People in the Labor Force in Scotia?
60.4% of People are in the Labor Force in Scotia.
What is the Unemployment Rate in Scotia?
Unemployment Rate in Scotia is 13.3%.