Zip Codes with the Highest Percentage of Population Employed in Transportation & Warehousing in San Francisco, CA
RELATED REPORTS & OPTIONS
Transportation & Warehousing
San Francisco
Compare Zip Codes
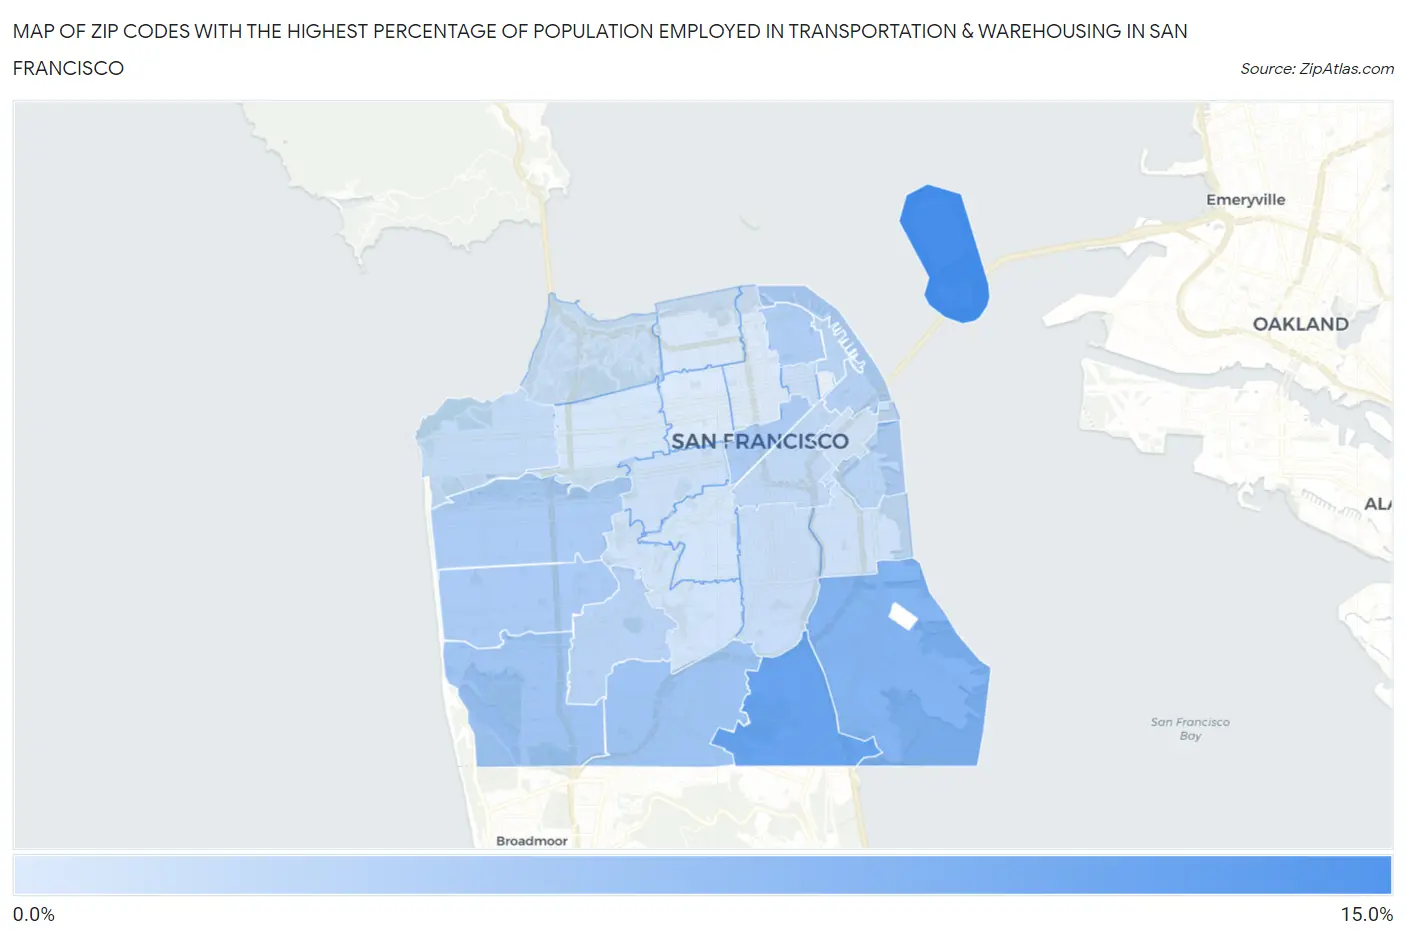
Map of Zip Codes with the Highest Percentage of Population Employed in Transportation & Warehousing in San Francisco
0.0%
15.0%
Zip Codes with the Highest Percentage of Population Employed in Transportation & Warehousing in San Francisco, CA
| Zip Code | % Employed | vs State | vs National | |
| 1. | 94130 | 12.4% | 5.1%(+7.26)#66 | 4.9%(+7.45)#1,713 |
| 2. | 94134 | 9.9% | 5.1%(+4.75)#118 | 4.9%(+4.93)#2,964 |
| 3. | 94124 | 8.0% | 5.1%(+2.88)#209 | 4.9%(+3.07)#4,879 |
| 4. | 94112 | 6.2% | 5.1%(+1.05)#402 | 4.9%(+1.23)#8,343 |
| 5. | 94132 | 6.0% | 5.1%(+0.855)#426 | 4.9%(+1.04)#8,812 |
| 6. | 94116 | 5.3% | 5.1%(+0.121)#521 | 4.9%(+0.305)#11,066 |
| 7. | 94102 | 5.2% | 5.1%(+0.040)#531 | 4.9%(+0.224)#11,352 |
| 8. | 94122 | 5.1% | 5.1%(-0.004)#540 | 4.9%(+0.180)#11,524 |
| 9. | 94133 | 5.0% | 5.1%(-0.083)#550 | 4.9%(+0.102)#11,790 |
| 10. | 94105 | 4.6% | 5.1%(-0.544)#625 | 4.9%(-0.360)#13,456 |
| 11. | 94127 | 4.5% | 5.1%(-0.678)#662 | 4.9%(-0.494)#13,956 |
| 12. | 94158 | 4.2% | 5.1%(-0.956)#716 | 4.9%(-0.771)#15,127 |
| 13. | 94111 | 4.2% | 5.1%(-0.973)#718 | 4.9%(-0.789)#15,225 |
| 14. | 94103 | 3.7% | 5.1%(-1.44)#820 | 4.9%(-1.25)#17,256 |
| 15. | 94121 | 3.6% | 5.1%(-1.55)#841 | 4.9%(-1.37)#17,745 |
| 16. | 94110 | 3.2% | 5.1%(-1.92)#929 | 4.9%(-1.74)#19,337 |
| 17. | 94108 | 3.2% | 5.1%(-1.95)#938 | 4.9%(-1.77)#19,473 |
| 18. | 94129 | 3.0% | 5.1%(-2.11)#977 | 4.9%(-1.93)#20,163 |
| 19. | 94117 | 3.0% | 5.1%(-2.16)#986 | 4.9%(-1.98)#20,352 |
| 20. | 94107 | 2.8% | 5.1%(-2.31)#1,043 | 4.9%(-2.13)#21,042 |
| 21. | 94131 | 2.7% | 5.1%(-2.42)#1,070 | 4.9%(-2.23)#21,504 |
| 22. | 94114 | 2.4% | 5.1%(-2.70)#1,135 | 4.9%(-2.51)#22,687 |
| 23. | 94118 | 2.3% | 5.1%(-2.85)#1,173 | 4.9%(-2.66)#23,246 |
| 24. | 94123 | 2.2% | 5.1%(-2.89)#1,190 | 4.9%(-2.71)#23,413 |
| 25. | 94109 | 2.0% | 5.1%(-3.09)#1,238 | 4.9%(-2.90)#24,130 |
| 26. | 94115 | 1.9% | 5.1%(-3.25)#1,275 | 4.9%(-3.06)#24,665 |
1
Common Questions
What are the Top 10 Zip Codes with the Highest Percentage of Population Employed in Transportation & Warehousing in San Francisco, CA?
Top 10 Zip Codes with the Highest Percentage of Population Employed in Transportation & Warehousing in San Francisco, CA are:
What zip code has the Highest Percentage of Population Employed in Transportation & Warehousing in San Francisco, CA?
94130 has the Highest Percentage of Population Employed in Transportation & Warehousing in San Francisco, CA with 12.4%.
What is the Percentage of Population Employed in Transportation & Warehousing in San Francisco, CA?
Percentage of Population Employed in Transportation & Warehousing in San Francisco is 4.2%.
What is the Percentage of Population Employed in Transportation & Warehousing in California?
Percentage of Population Employed in Transportation & Warehousing in California is 5.1%.
What is the Percentage of Population Employed in Transportation & Warehousing in the United States?
Percentage of Population Employed in Transportation & Warehousing in the United States is 4.9%.